world drug report 2010 summary
TRANSCRIPT
8/23/2019 World Drug Report 2010 Summary
http://slidepdf.com/reader/full/world-drug-report-2010-summary 1/19
WORLD
DRUG REPORT
2010

8/23/2019 World Drug Report 2010 Summary
http://slidepdf.com/reader/full/world-drug-report-2010-summary 2/19
8/23/2019 World Drug Report 2010 Summary
http://slidepdf.com/reader/full/world-drug-report-2010-summary 3/19
EXECUTIVE SUMMARY
11
In 1998, a special session of the UN General Assembly decided to work towards the “elimination or significantreduction” of illicit drug production and abuse by 2008,and adopted a series of sectoral plans to reach that objec-tive.1 Gathered at the end of the 10-year period, MemberStates were not satisfied with the results and declaredthat they were still “gravely concerned about the grow-
ing threat posed by the world drug problem.”2
he deci-sion was taken to continue the effort over the following decade.
Can overall drug supply and demand be “eliminated orsignificantly reduced” by 2019, as called for by theMember States? At the national level, one can hope thatmany countries will be able to significantly improvetheir drug control situation within a decade. Will theselocal successes translate into an overall improvement atthe global level?
A clear lesson from the history of drug control is that the
mere sum of uncoordinated national and sectoral efforts,even successful ones, cannot result in a global success. Another lesson is that countries with limited meanscannot resist, and counter the impact of, powerful trans-national trafficking flows on their own.
o achieve the 2019 objectives, the international com-munity needs to interweave drug supply and demandreduction interventions and integrate national efforts inthe framework of renewed international strategies on thescale of the drug markets. o do so, it is urgent toimprove our understanding of how illicit transnationaldrug economies operate. his World Drug Report is a
contribution toward this objective.
his year’s World Drug Report opens with an analyticaldiscussion of three key transnational drug markets: themarkets for heroin, cocaine and amphetamine-typestimulants (AS). Cannabis is not covered here becauseit is increasingly produced within the country of con-sumption and often dealt informally through social
1 United Nations General Assembly Special Session on the World Drug Problem (UNGASS), New York, 8-10 June, 1998 (A/S-20/4, chapterV, section A).
2 High-level Segment to the 2009 United Nations Commission on
Narcotic Drugs, Political Declaration and Plan of Action on Inter-national Cooperation towards an Integrated and Balanced Strategy to Counter the World Drug Problem, March 2009 (E/2009/28 - E/CN.7/2009/12).
channels. hough cannabis is the world’s most popularillicit drug, it is less subject to a transnational marketanalysis than the other three drug classes.
he market discussion is followed by a presentation of statistical trends for all four major drug classes, includ-ing cannabis. he latest information on drug produc-tion, seizures and consumption is presented and the
limitations of this knowledge are clearly articulated. While also drawing on other sources where relevant, thestatistics presented were mainly gathered through the
Annual Reports Questionnaire and the illicit crop sur-veys that UNODC produces in cooperation withMember States.
Finally, there is a chapter on a topic of growing concernfor the international community: the relationshipbetween drug trafficking and instability. his chapterfocuses on the impact that the drug trade has on levelsof violence and corruption in transit countries, particu-larly in Latin America, the Caribbean and West Africa.
his executive summary does not parallel the report,however. For the purpose of clarity, a global overview of changes in the world drug markets is presented first.his is followed by an integrated discussion of the worlddrug markets, including both the market analysis andthe trend data. In closing, the discussion on the impactof drug trafficking on transit countries is summarized.
Global developments in illicit drugproduction, trafficking and consumption
Productionhere have been a number of encouraging develop-ments in global cocaine and heroin markets recently:
Te global area under opium poppy cultivation de-s
clined to 181,400 hectares (ha) in 2009 (15%) or by 23% since 2007.
In line with declines in the area under cultivation,s
global opium production fell from 8,890 metric tons(mt) in 2007 to 7,754 mt in 2009 (-13%), and poten-tial heroin production declined from 757 mt in 2007to 657 mt in 2009.
Te global area under coca cultivation declined tos
158,800 ha in 2009 (5%), by 13% since 2007 or by 28% since 2000.
8/23/2019 World Drug Report 2010 Summary
http://slidepdf.com/reader/full/world-drug-report-2010-summary 4/19
12
World Drug Report 2010
Te estimated global cocaine production fell froms
1,024 mt in 2007 to 865 mt in 2008 (-16%). Globalfresh coca leaf production fell by 4% in 2009 (by 14% between 2007 and 2009).
he recent successes, however, must be considered in thecontext of the long-term challenge. Since 1998, the yearof the last UN General Assembly Special Session(UNGASS) devoted to the drug problem, global poten-tial opium production has increased by 78%, from 4,346mt to 7,754 mt in 2009. Fortunately, these productionincreases do not correspond to consumption increases,as it appears that large amounts of opium have beenstockpiled in recent years. his means, however, thateven if production were completely eliminated today,existing stocks could supply users for at least two years.
he increase in global potential cocaine production over
the 1998-2008 period seems to have been more moder-ate (5%), from 825 mt to 865 mt, although there remainuncertainties around coca yields and production effi-ciency. Nonetheless, available data are sufficiently robustto state that global cocaine production has declinedsignificantly in recent years (2004-2009).
In contrast to heroin and cocaine, only very broad pro-duction estimates can be given for cannabis and amphet-amine-type stimulants (AS). Due to the decentralizationof production, it is difficult to track global trends ineither of these markets. Between 13,000 and 66,100 mt
of herbal cannabis were produced in 2008, as were2,200 to 9,900 mt of cannabis resin. Manufacture of theamphetamines-group of AS (amphetamine, metham-phetamine, methcathinone and related substances) wasin the range of 161 to 588 mt in 2008. Manufacture of drugs marketed as ‘ecstasy’ ranged from 55 to 133 mt.
Trafficking
Most of the long-distance trafficking involves cocaineand heroin, although some cannabis resin and ecstasy are also smuggled between regions. Much of the canna-bis herb, methamphetamine and amphetamine con-
sumed in the world is produced locally.
Global cocaine seizures have stabilized over the last few years. Seizures have declined in North America andEurope, but have risen in South and Central America.rafficking through West Africa, which increased rap-idly between 2004 and 2007, appears to have declinedin 2008 and 2009, but this situation may change andneeds to be monitored carefully.
Opiate seizures continue to increase. his applies toboth opium and heroin seizures. Morphine3 seizures, incontrast, declined in 2008. he largest seizures continue
3 Morphine represents an intermediate step in the processing of opiumto heroin, and is rarely consumed as a drug in its own right.
to be reported from the countries neighbouring Afghani-stan, notably the Islamic Republic of Iran and Paki-stan.
racking global AS seizures is more complicated,
because there are several products involved that appealto different markets, including amphetamine, metham-phetamine and ‘ecstasy’. After tripling in the early yearsof this decade, AS seizures have remained stable since2006. Ecstasy seizures showed a marked decline in 2008compared to a year earlier. Global seizures of ampheta-mine and methamphetamine remained largely stable atvery high levels in 2008.
Global cannabis herb seizures increased over the 2006-2008 period (+23%), especially in South America,reaching levels last reported in 2004. Global cannabisresin seizures increased markedly over the 2006-2008
period (+62%) and clearly exceeded the previous peak of 2004. Large increases in cannabis resin seizures in 2008
were reported from the Near and Middle East region, as well as from Europe and Africa.
Consumption
Globally, UNODC estimates that between 155 and 250million people (3.5 to 5.7% of the population aged15-64) used illicit substances at least once in 2008. Glo-bally, cannabis users comprise the largest number of illicit drug users (129 - 190 million people). Ampheta-
mine-group substances rank as the second most com-monly used drug, followed by cocaine and opiates.
At the core of drug consumption lie the ‘problem drug users’: those who inject drugs and/or are considereddependent, facing serious social and health consequencesas a result. Based on the global estimates of the numberof cannabis, opiate, cocaine and AS users, it is esti-mated that there were between 16 and 38 million prob-lem drug users in the world in 2008. his represents10% to 15% of all people who used drugs that year. Itcan be estimated that in 2008, globally, between 12%and 30% of problem drug users had received treatment
in the past year, which means that between 11 and 33.5million problem drug users did not receive treatmentthat year.
he lack of data in many countries still limits the under-standing of the drug use problem in many countries,particularly in Africa, some parts of Asia and the PacificIslands. he broad range of the estimates reflects theuncertainties in the available global data.
Data on the delivery of treatment services for problemdrug users can provide valuable information on varia-tions in drug use problems across regions. he share of
treatment services delivered to users of different drugsvaries markedly in different regions of the world. InEurope and Asia, most of the treatment demand is for

8/23/2019 World Drug Report 2010 Summary
http://slidepdf.com/reader/full/world-drug-report-2010-summary 5/19
13
Executive Summary
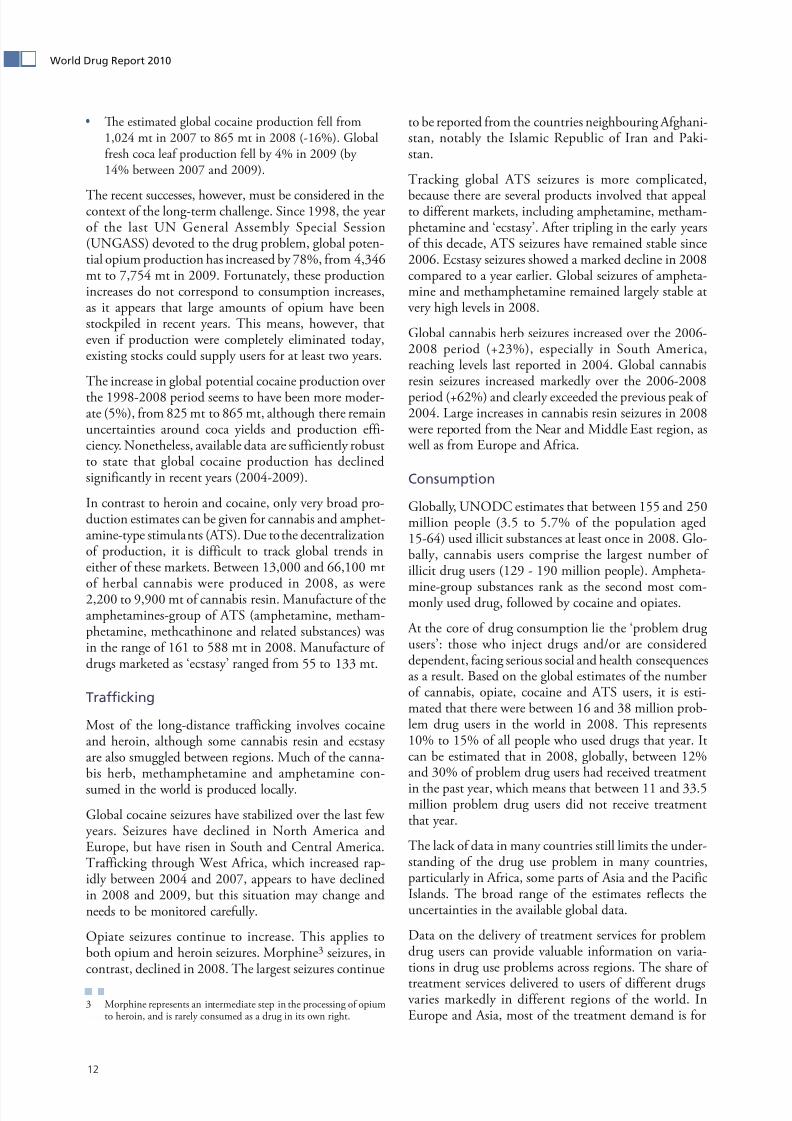
opiates. In the Americas, it is cocaine, and in Africa andOceania, it is cannabis. hese ratios have changed overtime. As compared to a decade ago, treatments relatedto cannabis have increased in Europe, South America and Oceania, suggesting that an increased proportion of cannabis use can become problematic. Over the sameperiod of time, cocaine treatment demand has beendeclining in the Americas, especially in North America,
while it has increased in Europe. he relative impor-
tance of opiates for drug treatment, on the other hand,has declined in Europe, Asia and (in particular) Ocea-nia, while it rose in Africa. AS are commanding a growing share of treatment services globally.
Estimates of the sizes of the user populations in variousparts of the world are derived from household and schoolsurveys and indirect methods. Unfortunately, popula-tion-based surveys are conducted very irregularly inmost countries, so there remain significant gaps in theknowledge of the extent of drug use in some parts of the
world.
Cannabis remains the most widely consumed drug worldwide. Global annual cannabis use prevalence isestimated between 2.9% and 4.3% of the populationaged 15-64. he highest is in Oceania (9.3% to 14.8%),followed by the Americas (6.3% to 6.6%). here are anestimated 15 – 19.3 million annual cocaine users (annualprevalence of 0.3% to 0.4%) in the world. North Amer-ica (2%), Oceania (1.4% to 1.7%) and West Europe(1.5%) are the regions with the highest prevalence rates.Between 12.8 and 21.8 million people (0.3% to 0.5%of the world population aged 15-64) used opiates in2008. More than half of the world’s opiate users are in
Asia. UNODC estimates that between 13.7 and 52.9
million people aged 15 to 64 had used an amphetamine-type substance in the past year (0.3% to 1.2% of the
population), including 10.5 to 25.8 million ecstasy users(0.2% to 0.6% of the population). Oceania, East andSouth-East Asia, North America, and West and CentralEurope are the regions with the highest prevalence ratesof AS use.
In addition to the drugs mentioned above, the misuse of prescription drugs, such as synthetic opioids, benzodiaz-epines or synthetic prescription stimulants, is a growing health problem in a number of developed and develop-ing countries.
Illicit drug use at the global level, 2008
Number of people who inject drugs
aged 15-64 years : 11-21 million persons
Number of "problem drug users"aged 15-64 years : 16-38 million persons
Number of people who have used drugsat least once in the past year aged15-64 years : 155-250 million persons
Total number of people aged 15-64 yearsin 2008: 4,396 million persons
8/23/2019 World Drug Report 2010 Summary
http://slidepdf.com/reader/full/world-drug-report-2010-summary 6/19
14
World Drug Report 2010
M a i n
p r o b l e m d
r u g s a s r e fl e c t e d i n t r e
a t m e n t d e m a n d ,
b y r e g i o n ,
f r o m t h
e l a t e 1 9 9 0 s t o 2 0 0 8 ( o r l a t e s t y e a r a v a i l a b l e )
4 9 %
L a t e 1 9 9 0 s
2 0 0 8
L a t e 1 9 9 0 s
2 0 0 8
L a t e 1
9 9 0 s
2 0 0 8
L a t e 1
9 9 0 s
2 0 0 8 *
L a t e 1 9 9 0 s
2 0 0 8
L a t e 1 9 9 0 s
2 0 0 8
6 5 %
3 1 %
4 2 %
7 2 %
7 3 %
6 2 %
6 1 %
6 3 %
5 7 %
4 7 %
6 6 %
S o u r c e s : U N O D C , A n n u a l R e p o r t s Q u e s t i o n n a i r e D a t a / D E L T A a n d N a t i o n a l G o v e r n m e n t R e p o r t s
N o t e s : P e r c e n t a g e s a r e u n w e i g h t e d m e a n s o f t r e a t m e n t d e m a n d f r o m r e p o r t i n g c o u n t r i e s . N u m b e r o f c o u n t r i e s r e p o r t i n g d a t a f o r 2 0 0 8 : E u r o p e ( 4 5 ) ; A f r i c a ( 2 6 ) ; N o r t h A m e r i c a ( 3 ) ; S o u t h A m e r i c a ( 2 4 ) ; A s i a ( 4 2 ) ; O c e a n i a ( 2 ) .
D a t a g e n e r a l l y a c c o u n t f o r p r i m a r y d r u g u s e . P o l y d r u g u s e m a
y i n c r e a s e t o t a l s b e y o n d 1 0 0 % . * T r e a t m e n t d a t a d a t i n g b a c k m o r e t h a n 1 0 y e a r s w e r e r e m o v e d f r o m t h e 2 0 0 8 e s t i m a t e s a n d t h e r e f o r e c a u t i o n
s h o u l d b e t a k e n c o m p a r i n g t h e d a t a f r o m 2 0 0 8 w i t h p r e v i o u s y e a r s .
T h e b o u n d a r i e s a n d n a m e s s h o w n a n d t h e d e s i g n a t i o n s u s e d
o n t h i s m a p d o n o t i m p l y o f f i c i a l e n d o r s e m e n t o r a c c e p t a n c e b y t h e U n i t e d N a t i o n s .
O p i a t e s
C a n n a b i s
C o c a i n e - t y p e
A m p h e t a m i n e t y p e
O t h e r s
S o u t h A m e r i c a
N o r t h A m e r i c a
E
u r o p e
A s i a
O c e a n i a
A f r i c a

8/23/2019 World Drug Report 2010 Summary
http://slidepdf.com/reader/full/world-drug-report-2010-summary 7/19

8/23/2019 World Drug Report 2010 Summary
http://slidepdf.com/reader/full/world-drug-report-2010-summary 8/19
16
World Drug Report 2010
The main drug markets
he global illicit opiate and cocaine markets representtwo of the biggest transnational drugs and crime threatsof our time. hey appear at the same time as persistent
problems from a previous era of drug control, prioritiesfor interventions due to the severity of their impacts onaffected societies and good candidates for a global solu-tion within a reasonable time frame. Since they are bothsourced from relatively concentrated production areas,most of their components are directly or indirectly linked to one another.
In addition, AS have gained a large share of the globaldrug market over the last two decades and have come torepresent a major and evolving threat for present andfuture drug control efforts. Since 1990, there has been a spread in AS manufacture with more than a third of
Member States having reported AS-related manufac-ture activity to date. Moreover, the global number of
AS users is likely to exceed the number of opiate andcocaine users combined.
Cocaine
he global area under coca cultivation decreased by 5%last year, from 167,600 ha in 2008 to 158,800 ha in2009. his change is mainly due to a significant decreasein Colombia, not offset by increases in Peru and thePlurinational State of Bolivia. he global area undercoca cultivation declined by 28% over the 2000-2009
period. In 2009, Colombia represented about 43% of global cultivation, with Peru contributing 38% and thePlurinational State of Bolivia 19%.
he areas where cocaine is produced, trafficked andconsumed have varied substantially over time.
While Colombian traffickers have produced most of s
the world’s cocaine in recent years, between 2000 and
2009, the area under coca cultivation in Colombia decreased by 58%, mainly due to eradication. At thesame time, coca cultivation increased by 38% in Peruand more than doubled in the Plurinational State of Bolivia (up 112%), while traffickers in both countriesincreased their own capacity to produce cocaine.
Demand for cocaine in the United States has been ins
long-term decline: in 1982, an estimated 10.5 millionpeople had used cocaine in the previous year; in 2008,the figure was 5.3 million, about half as many. In thelast decade, however, the number of cocaine users inEurope doubled, from 2 million in 1998, to 4.1 mil-
lion in the EU-EFA countries in 2008. By 2008, theEuropean market (US$34 billion) was almost as valu-able as the North American market (US$37 billion).Te value of the global cocaine market is estimated ataround US$88 billion (estimates range from US$80to US$100 billion).
Tese shifts, combined with interdiction efforts, haves
also affected trafficking patterns. As the ColombianGovernment has taken greater control of its territory,traffickers are making more use of transit countries inthe region, including the Bolivarian Republic of Vene-
zuela and Ecuador. Mexican drug cartels emerged overthe last 10 to 15 years as the primary organizers forshipments of cocaine into the United States, largely replacing the previously dominant Colombian groups.In response to Mexican enforcement efforts, Central American countries are increasingly being used astransit countries. West Africa started to be used as a way station to Europe around 2004. Te situationremains fluid, and the impact on transit countries canbe devastating.
In 2008, the potential production of pure cocaineamounted to some 865 mt. his is considerably less
than four years previously, when almost 1,050 mt weregenerated. Most of these drugs are destined for consum-ers in North America (6.2 million users in 2008) andEurope (4 to 5 million users). hese two regions, with70% of the demand and 85% of the total value, play themain role in shaping the evolution of the global cocainemarket. Another 2.7 million users are found in South
America, Central America and the Caribbean.
The largest cocaine market: North America
North America is the largest regional cocaine market, with close to 40% of the global cocaine-using popula-
tion. In 2008, it appears that 196 mt of pure cocaine were required to satisfy North American demand. o getthis amount to the consumer (accounting for seizures,
Global coca bush cultivation (ha), 1990-2009
Source: UNODC
158,800
167,600
211,700221,300
68,000
99,000
163,300
40,100
59,90043,400
121,300
30,900
14,600
50,300
0
50,000
100,000
150,000
200,000
250,000
1 9 9 0
1 9 9 1
1 9 9 2
1 9 9 3
1 9 9 4
1 9 9 5
1 9 9 6
1 9 9 7
1 9 9 8
1 9 9 9
2 0 0 0
2 0 0 1
2 0 0 2
2 0 0 3
2 0 0 4
2 0 0 5
2 0 0 6
2 0 0 7
2 0 0 8
2 0 0 9
H e c t a r e s
Total ColombiaPeru Bolivia

8/23/2019 World Drug Report 2010 Summary
http://slidepdf.com/reader/full/world-drug-report-2010-summary 9/19

8/23/2019 World Drug Report 2010 Summary
http://slidepdf.com/reader/full/world-drug-report-2010-summary 10/19
18
World Drug Report 2010
As a whole, the retail value of the United States cocainemarket declined by about two thirds in the 1990s, andby about another quarter in the last decade. About 70%of the profits made off the cocaine trade in the UnitedStates accrue between mid-level dealers and the con-sumer. Farmers and traffickers in Colombia keep lessthan 3% of the retail sales value of the cocaine they produce.
The second largest cocaine market: Europe
he world’s second largest flow of cocaine is directed
towards Europe, and this flow has been growing rapidly.he largest national cocaine market within Europe is theUnited Kingdom, followed by Spain, Italy, Germany
and France. Cocaine use prevalence levels are higher inthe United Kingdom and Spain than in the UnitedStates.
Recent data suggest that the rapid growth of the Euro-pean cocaine market is beginning to level off in some of the biggest national markets such as Italy, Spain andGermany. Consumption is still growing in the UnitedKingdom and in some of the smaller European markets,however. In 2008, an estimated 124 mt of cocaine wereconsumed in Europe. o supply this demand, an esti-mated 212 mt departed South America toward Europe,
about one quarter of total production. A greater share of this quantity comes from Peru and the PlurinationalState of Bolivia than in the case of the United States.
Average of all cocaine purchase prices in the United States, January 2006-September 2009
Source: US Drug Enforcement Agency
Distribution of gross profits (in %) of the US$35billion US cocaine market, 2008
Source: UNODC
National share of the cocaine user populationin Europe in 2007/2008
Sources: UNODC ARQ; Government reports; UNODC, 2009World Drug Report ; EMCDDA, Statistical Bulletin 2009
50
100
150
200
P r i c e s i n U S $ p e r g r a m
-
25
50
75
P u r i t y i n %
Purity adjusted prices 95.1 95.4 95.1 90.6 99.5 119.4 130.9 115.7 123.2 125.1 184.3 199.5 174.4 173.2 174.0
Unadjusted pr ices 65.2 65.7 64.8 63.2 67.0 70.9 74.8 70.9 71.1 71.9 85.7 89.2 83.9 84.2 80.4Purity (in %) 68.6 68.9 68.1 69.8 67.4 59.4 57.2 61.3 57.7 57.5 46.5 44.7 48.1 48.6 46.2
1 Qtr 2 Qtr 3 Qtr 4 Qtr 1 Qtr 2 Qtr 3 Qtr 4 Qtr 1 Qtr 2 Qtr 3 Qtr 4 Qtr 1 Qtr 2 Qtr 3 Qtr
2006 2007 2008 2009
Farmers in the Andean
countries,1.5%
(US$0.5 bn)
Traffickers in the
Andean countries,1%
(US$0.4 bn)
International traffickers,
Colombia to the
US,13%
(US$4.6 bn)
US-wholesalers to US-
mid-level dealers,15%
(US$5.3 bn)
US-mid-level dealers to
US-consumers, 70%
(US$24.2 bn)
EFTA countries, 2%
Other European
countries, 8%
UK, 23%
Spain, 21%
Italy, 19%
Germany, 9%
France, 5%
Other EU countries,13%
8/23/2019 World Drug Report 2010 Summary
http://slidepdf.com/reader/full/world-drug-report-2010-summary 11/19
19
Executive Summary
he primary countries of entry to the European marketare Spain and the Netherlands. Most of the trafficking ismaritime. Significant transit routes flow from formercolonies or overseas territories of the European nationsto their counterparts on the continent. Flows through
West Africa appear to have declined since 2007, butcould resume in the near future.
While the volumes are lower, the value of the Europeancocaine market (US$34 billion) is almost as high as inthe case of the North American market (US$37 billion),because purity-adjusted cocaine retail prices are higher
in Europe. European street prices in 2008 are about half what they were in 1990, but purity has declined and thedollar has weakened against the euro. In dollar terms,
the purity-adjusted price of cocaine in Europe hasincreased since 2002.
As in the North American market, only a fraction of theretail value goes to those who produce the drug. heintercontinental traffickers receive a larger share than inthe North American case, but more than half of theretail value still accrues to wholesalers and retailers
within Europe.
Heroin
Heroin is the most widely consumed illicit opiate in the
world. It is derived from opium, which itself can have anillicit use. Of the opium that is not converted intoheroin, two thirds is consumed in just five countries: the
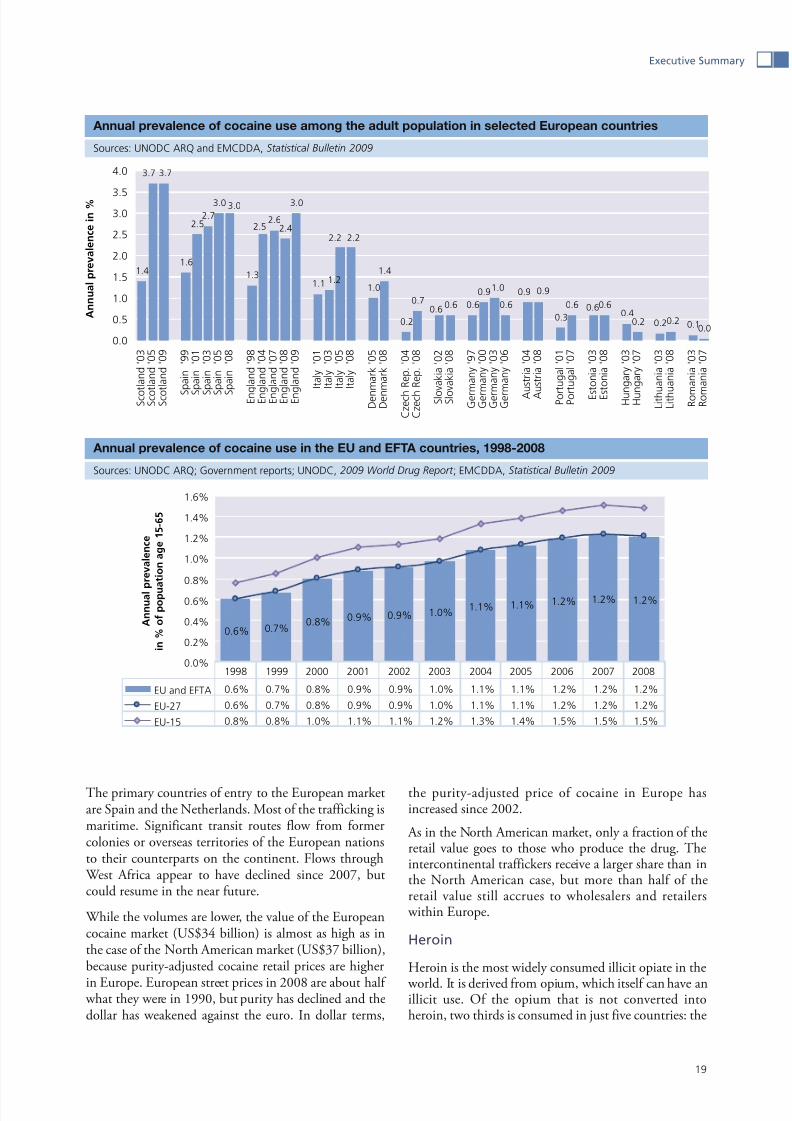
Annual prevalence of cocaine use among the adult population in selected European countries
Sources: UNODC ARQ and EMCDDA, Statistical Bulletin 2009
Annual prevalence of cocaine use in the EU and EFTA countries, 1998-2008
Sources: UNODC ARQ; Government reports; UNODC, 2009 World Drug Report ; EMCDDA, Statistical Bulletin 2009
1.41.6
2.52.7
3.0
1.3
2.62.4
1.1 1.0
1.4
0.2
0.7 0.6
0.9
0.6
0.3
0.6 0.60.4
0.2 0.2 0.10.0
2.22.22.5
0.2
0.6
0.9 0.91.0
3.0
1.2
3.0
3.73.7
0.60.6
0.0
0.5
1.0
1.5
2.0
2.5
3.03.5
4.0
S c o
t l a n d ' 0 3
S c o
t l a n d ' 0 5
S c o
t l a n d ' 0 9
S
p a i n
' 9 9
S
p a i n
' 0 1
S
p a i n
' 0 3
S
p a i n
' 0 5
S
p a i n
' 0 8
E n g l a n d ' 9 8
E n g l a n d ' 0 4
E n g l a n d ' 0 7
E n g l a n d ' 0 8
E n g l a n d ' 0 9
I t a l y
' 0 1
I t a l y
' 0 3
I t a l y
' 0 5
I t a l y
' 0 8
D e n
m a r k ' 0 5
D e n
m a r k ' 0 8
C z e c h
R e p .
' 0 4
C z e c h
R e p .
' 0 8
S l o
v a k i a ' 0 2
S l o
v a k i a ' 0 8
G e r m a n y ' 9 7
G e r m a n y ' 0 0
G e r m a n y ' 0 3
G e r m a n y ' 0 6
A u s t r i a ' 0 4
A u s t r i a ' 0 8
P o r
t u g a l ' 0 1
P o r
t u g a l ' 0 7
E s
t o n i a ' 0 3
E s
t o n i a ' 0 8
H u n g a r y ' 0 3
H u n g a r y ' 0 7
L i t h u a n i a ' 0 3
L i t h u a n i a ' 0 8
R o m
a n i a ' 0 3
R o m
a n i a ' 0 7
A n n u a l p r e v a l e n c e i n %
0.6% 0.7%0.8% 0.9% 0.9% 1.0%
1.1% 1.1% 1.2% 1.2% 1.2%
0.0%
0.2%
0.4%
0.6%
0.8%
1.0%
1.2%
1.4%
1.6%
A n n u a l p r e v a l e n c e
i n % o
f p o p u a t i o n a g e 1 5 - 6 5
EU and EFTA 0.6% 0.7% 0.8% 0.9% 0.9% 1.0% 1.1% 1.1% 1.2% 1.2% 1.2%
EU-27 0.6% 0.7% 0.8% 0.9% 0.9% 1.0% 1.1% 1.1% 1.2% 1.2% 1.2%
EU-15 0.8% 0.8% 1.0% 1.1% 1.1% 1.2% 1.3% 1.4% 1.5% 1.5% 1.5%
1998 1999 2000 2001 2002 2003 2004 2005 2006 2007 2008

8/23/2019 World Drug Report 2010 Summary
http://slidepdf.com/reader/full/world-drug-report-2010-summary 12/19
20
World Drug Report 2010
Islamic Republic of Iran (42%), Afghanistan (7%), Paki-stan (7%), India (6%) and the Russian Federation (5%).Other opiates are also abused, including various poppy straw concoctions and prescription opiods, but heroinremains the most problematic opiate internationally.
With the exception of 2001, when there was hardly any
opium poppy cultivation in Afghanistan, global opiumproduction expanded remarkably in the first decade of the twenty-first century until 2007, apparently with nocommensurate expansion in demand. Opium produc-tion subsequently declined over the 2007-2009 period(from 8,890 to 7,754 mt), though remaining signifi-cantly above estimated global demand (some 5,000 mtfor consumption and seizures). he declining farm-gateprice of opium in Afghanistan in recent years has beenmore pronounced than the decline in heroin prices. hismay reflect a number of factors, including rising pricesfor heroin precursors (particularly acetic anhydride) in
that country and a build-up of stocks of opium notprocessed into heroin.
Although Afghanistan is the source of most of the world’sillicit opiates (6,900 mt of opium or 89% of the worldtotal in 2009), significant quantities are also producedin Myanmar (330 mt) and Latin America (notably inMexico and Colombia). Since 2003, Mexico has beenthe world’s third largest source of opium, and the quan-tities produced in 2008 (325 mt) came close to thequantities produced in Myanmar in 2009.
here are indications that the downward trend in global
opium production over the 2007-2009 period will con-tinue in 2010. Early indications for 2010 (as revealed inUNODC’s Afghanistan Opium Winter Rapid Assessment )
suggested that the area under opium cultivation in Afghanistan could remain basically stable, but yields willlikely decline due to a blight.
Both opium and heroin seizures continued to increase in2008. Morphine seizures, however, continued the declin-ing trend started in 2007. Although heroin seizures have
followed a generally increasing trend since 2002, they have been outpaced by the growth in global opium sei-zures, possibly reflecting difficulties faced by Afghanlaboratory operators to obtain sufficient precursorchemicals to transform the large quantities of harvestedopium into heroin. Most of the opium seizures continueto be made in the Islamic Republic of Iran, neighbour-ing Afghanistan. he global rise in opium seizures thuslargely reflected the growing opium seizures made by theauthorities in the Islamic Republic of Iran.
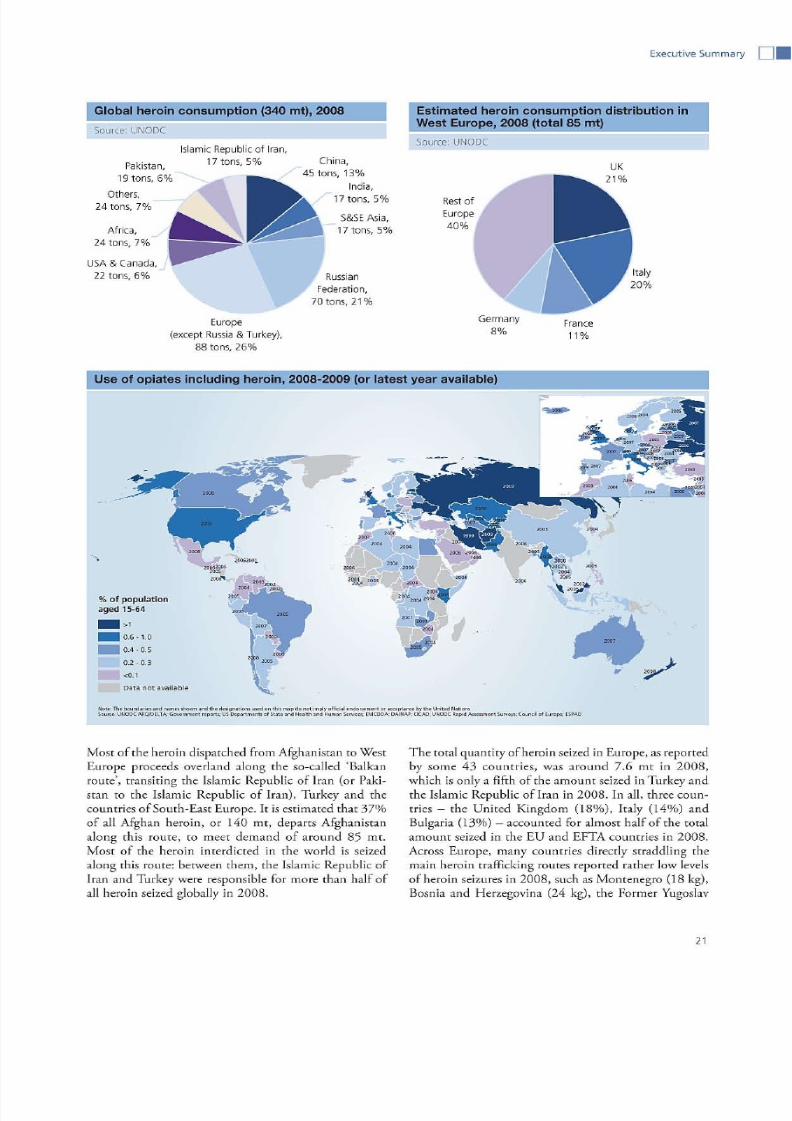
he world’s two largest markets for Afghan opiates arethe Russian Federation and West Europe, which together
consume almost half the heroin produced in the world. About 340 mt of heroin is estimated to have been con-sumed globally in 2008. o meet this demand, account-ing for seizures, some 430 mt would have had to beproduced. UNODC estimates suggest that about 380mt were produced out of Afghan opium that year, sup-plying the bulk of global demand.
The largest heroin market: West Europe
he world’s largest heroin market is West Europe, andabout half of this market is contained in just three coun-tries: the United Kingdom, Italy and France. Heroin use
appears to be decreasing in most West European coun-tries, although the harms associated with heroin use seemto be increasing, as reflected in heroin-induced deaths.
Global potential opium production (mt),1995-2009
Note: The 2009 estimate for ‘rest of the world’ is provisional as limitedinformation was available for some countries and regions.
Source: UNODC
Global opiate seizures in heroin equivalents,1990-2008
Source: UNODC ARQ/DELTA
0
1,000
2,000
3,000
4,000
5,000
6,000
7,000
8,000
9,000
95 96 97 98 99 00 01 02 03 04 05 06 07 08 09
M e t r i c t o n s
Afghanistan Myanmar
Lao People's Democratic Republic Rest of the World
-
20,000
40,000
60,000
80,000
100,000
120,000
140,000
160,000
1
9 9 0
1
9 9 2
1
9 9 4
1
9 9 6
1
9 9 8
2
0 0 0
2
0 0 2
2
0 0 4
2
0 0 6
2
0 0 8
Opium (in heroin equivalents)MorphineHeroin
8/23/2019 World Drug Report 2010 Summary
http://slidepdf.com/reader/full/world-drug-report-2010-summary 13/19
8/23/2019 World Drug Report 2010 Summary
http://slidepdf.com/reader/full/world-drug-report-2010-summary 14/19
22
World Drug Report 2010
Republic of Macedonia (26 kg), Hungary (28 kg), Alba-nia (75 kg), Austria (104 kg), Slovenia (136 kg), Croatia (153 kg) and Serbia (207 kg).
Wholesale prices of heroin (not adjusted for purity)increase along the trafficking route from South-West
Asia to Europe. In 2008, wholesale prices ranged fromless than US$3,000 per kg in Afghanistan to US$10,300-US$11,800 per kg in urkey and an average of US$44,300 per kg in West and Central Europe.
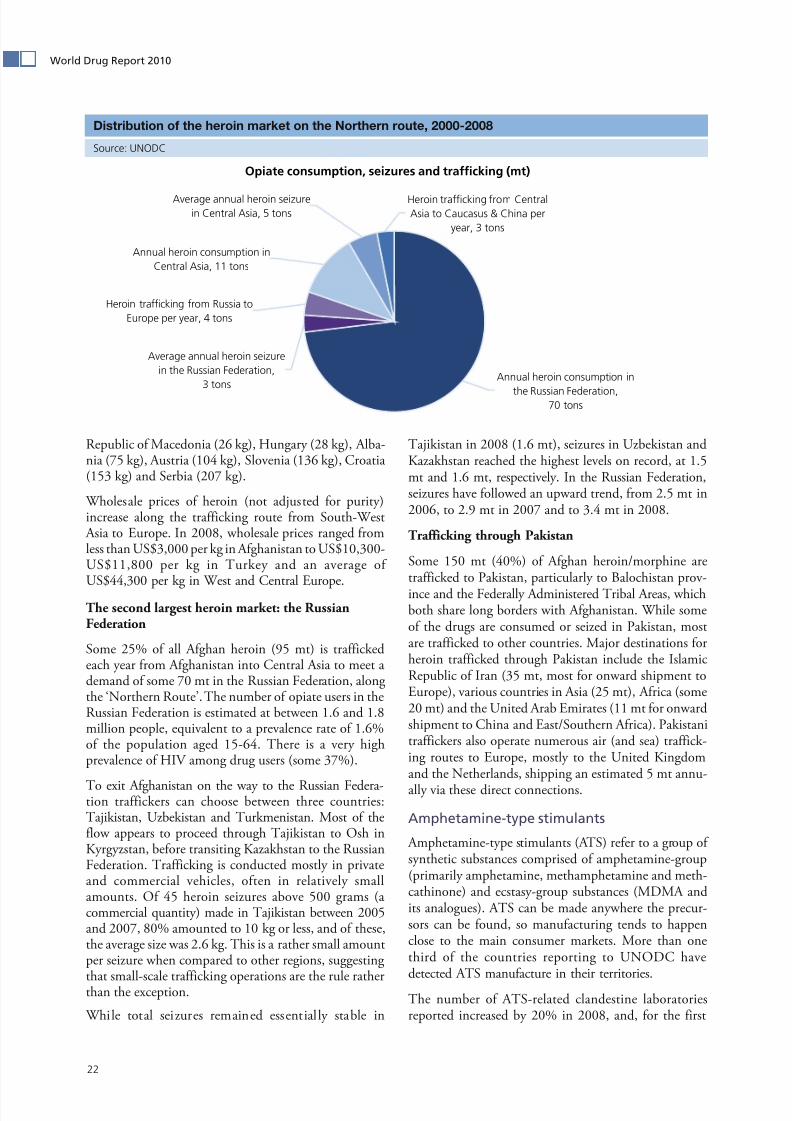
The second largest heroin market: the RussianFederation
Some 25% of all Afghan heroin (95 mt) is traffickedeach year from Afghanistan into Central Asia to meet a demand of some 70 mt in the Russian Federation, along the ‘Northern Route’. he number of opiate users in theRussian Federation is estimated at between 1.6 and 1.8million people, equivalent to a prevalence rate of 1.6%of the population aged 15-64. here is a very highprevalence of HIV among drug users (some 37%).
o exit Afghanistan on the way to the Russian Federa-tion traffickers can choose between three countries:ajikistan, Uzbekistan and urkmenistan. Most of theflow appears to proceed through ajikistan to Osh inKyrgyzstan, before transiting Kazakhstan to the RussianFederation. rafficking is conducted mostly in privateand commercial vehicles, often in relatively smallamounts. Of 45 heroin seizures above 500 grams (a commercial quantity) made in ajikistan between 2005and 2007, 80% amounted to 10 kg or less, and of these,the average size was 2.6 kg. his is a rather small amountper seizure when compared to other regions, suggesting
that small-scale trafficking operations are the rule ratherthan the exception.
While total seizures remained essential ly stable in
ajikistan in 2008 (1.6 mt), seizures in Uzbekistan andKazakhstan reached the highest levels on record, at 1.5mt and 1.6 mt, respectively. In the Russian Federation,seizures have followed an upward trend, from 2.5 mt in2006, to 2.9 mt in 2007 and to 3.4 mt in 2008.
Trafficking through Pakistan
Some 150 mt (40%) of Afghan heroin/morphine aretrafficked to Pakistan, particularly to Balochistan prov-
ince and the Federally Administered ribal Areas, whichboth share long borders with Afghanistan. While someof the drugs are consumed or seized in Pakistan, mostare trafficked to other countries. Major destinations forheroin trafficked through Pakistan include the IslamicRepublic of Iran (35 mt, most for onward shipment toEurope), various countries in Asia (25 mt), Africa (some20 mt) and the United Arab Emirates (11 mt for onwardshipment to China and East/Southern Africa). Pakistanitraffickers also operate numerous air (and sea) traffick-ing routes to Europe, mostly to the United Kingdomand the Netherlands, shipping an estimated 5 mt annu-
ally via these direct connections.
Amphetamine-type stimulants
Amphetamine-type stimulants (AS) refer to a group of synthetic substances comprised of amphetamine-group(primarily amphetamine, methamphetamine and meth-cathinone) and ecstasy-group substances (MDMA andits analogues). AS can be made anywhere the precur-sors can be found, so manufacturing tends to happenclose to the main consumer markets. More than onethird of the countries reporting to UNODC havedetected AS manufacture in their territories.
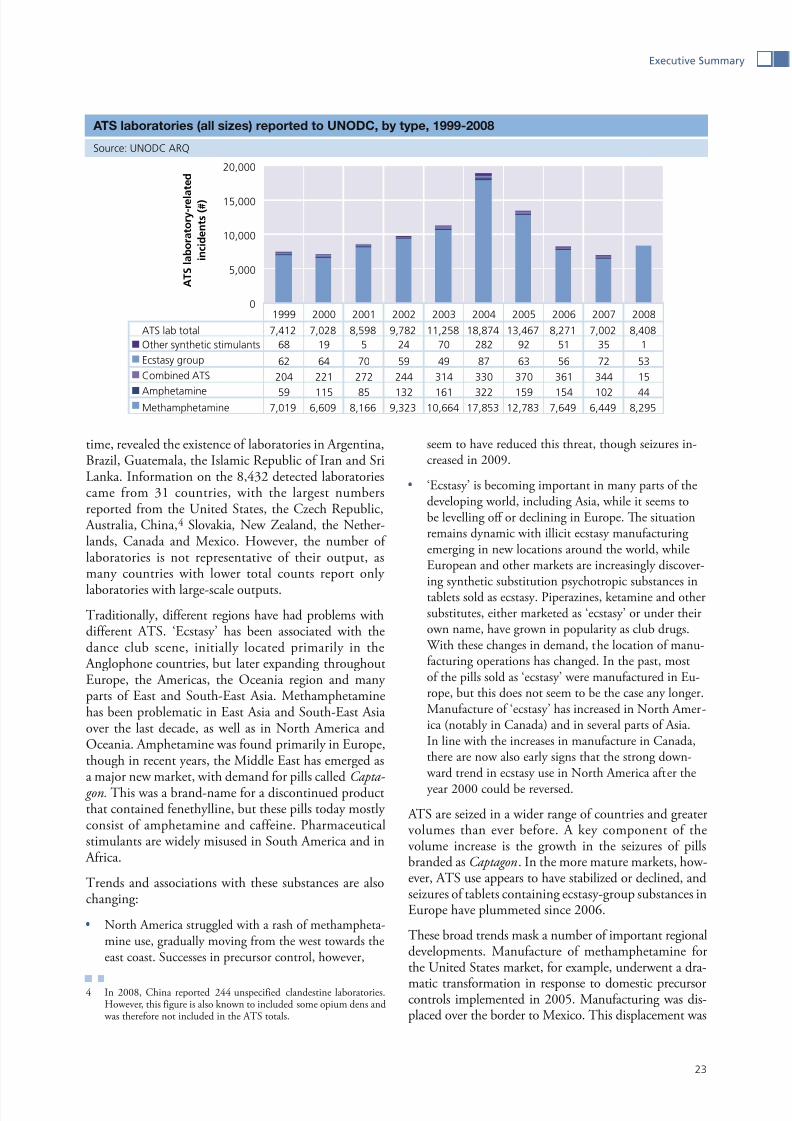
he number of AS-related clandestine laboratoriesreported increased by 20% in 2008, and, for the first
Distribution of the heroin market on the Northern route, 2000-2008
Source: UNODC
Opiate consumption, seizures and trafficking (mt)
Heroin trafficking from Russia to
Europe per year, 4 tons
Annual heroin consumption in
Central Asia, 11 tons
Average annual heroin seizure
in the Russian Federation,
3 tons
Average annual heroin seizurein Central Asia, 5 tons
Heroin trafficking from CentralAsia to Caucasus & China per
year, 3 tons
Annual heroin consumption in
the Russian Federation,70 tons
8/23/2019 World Drug Report 2010 Summary
http://slidepdf.com/reader/full/world-drug-report-2010-summary 15/19
23
Executive Summary
time, revealed the existence of laboratories in Argentina,Brazil, Guatemala, the Islamic Republic of Iran and SriLanka. Information on the 8,432 detected laboratoriescame from 31 countries, with the largest numbersreported from the United States, the Czech Republic,
Australia, China,4 Slovakia, New Zealand, the Nether-lands, Canada and Mexico. However, the number of laboratories is not representative of their output, asmany countries with lower total counts report only
laboratories with large-scale outputs.
raditionally, different regions have had problems withdifferent AS. ‘Ecstasy’ has been associated with thedance club scene, initially located primarily in the
Anglophone countries, but later expanding throughoutEurope, the Americas, the Oceania region and many parts of East and South-East Asia. Methamphetaminehas been problematic in East Asia and South-East Asia over the last decade, as well as in North America andOceania. Amphetamine was found primarily in Europe,though in recent years, the Middle East has emerged asa major new market, with demand for pills called Capta-
gon. his was a brand-name for a discontinued productthat contained fenethylline, but these pills today mostly consist of amphetamine and caffeine. Pharmaceuticalstimulants are widely misused in South America and in
Africa.
rends and associations with these substances are alsochanging:
North America struggled with a rash of methampheta-s
mine use, gradually moving from the west towards theeast coast. Successes in precursor control, however,
4 In 2008, China reported 244 unspecified clandestine laboratories.However, this figure is also known to included some opium dens and was therefore not included in the AS totals.
seem to have reduced this threat, though seizures in-creased in 2009.
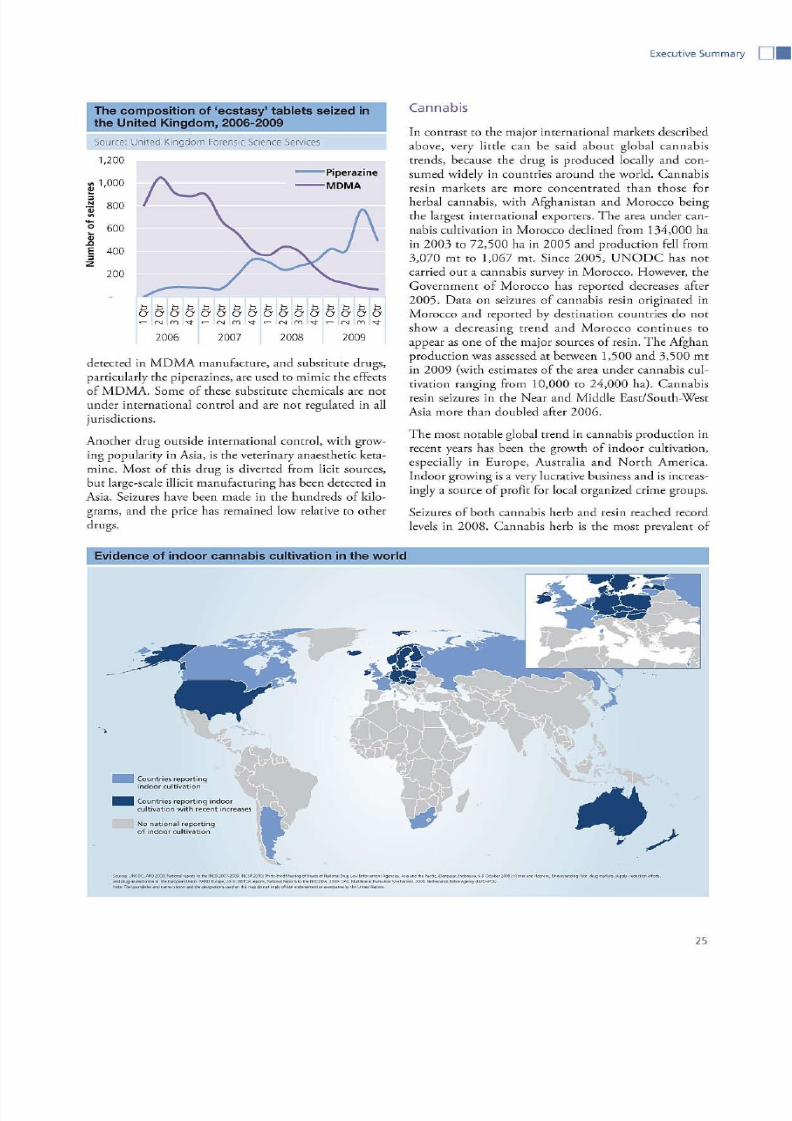
‘Ecstasy’ is becoming important in many parts of thes
developing world, including Asia, while it seems tobe levelling off or declining in Europe. Te situationremains dynamic with illicit ecstasy manufacturing emerging in new locations around the world, whileEuropean and other markets are increasingly discover-ing synthetic substitution psychotropic substances intablets sold as ecstasy. Piperazines, ketamine and othersubstitutes, either marketed as ‘ecstasy’ or under theirown name, have grown in popularity as club drugs. With these changes in demand, the location of manu-facturing operations has changed. In the past, mostof the pills sold as ‘ecstasy’ were manufactured in Eu-rope, but this does not seem to be the case any longer.Manufacture of ‘ecstasy’ has increased in North Amer-ica (notably in Canada) and in several parts of Asia.In line with the increases in manufacture in Canada,there are now also early signs that the strong down- ward trend in ecstasy use in North America after the
year 2000 could be reversed.
AS are seized in a wider range of countries and greatervolumes than ever before. A key component of thevolume increase is the growth in the seizures of pillsbranded as Captagon. In the more mature markets, how-ever, AS use appears to have stabilized or declined, andseizures of tablets containing ecstasy-group substances inEurope have plummeted since 2006.
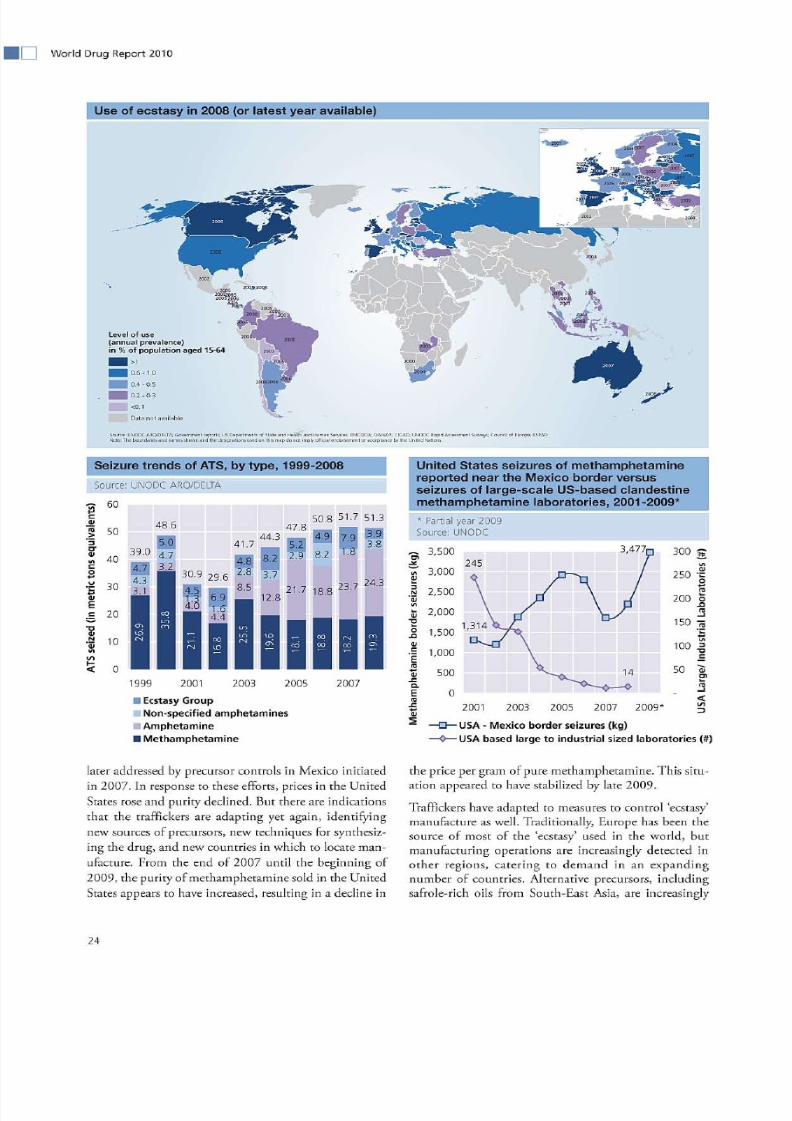
hese broad trends mask a number of important regionaldevelopments. Manufacture of methamphetamine forthe United States market, for example, underwent a dra-
matic transformation in response to domestic precursorcontrols implemented in 2005. Manufacturing was dis-placed over the border to Mexico. his displacement was
ATS laboratories (all sizes) reported to UNODC, by type, 1999-2008
Source: UNODC ARQ
0
5,000
10,000
15,000
20,000
A T S l a b o r a t o r y - r e l a t e d
i n c i d e n t s ( # )
ATS lab total 7,412 7,028 8,598 9,782 11,258 18,874 13,467 8,271 7,002 8,408
Other synthetic stimulants 68 19 5 24 70 282 92 51 35 1
Ecstasy group 62 64 70 59 49 87 63 56 72 53
Combined ATS 204 221 272 244 314 330 370 361 344 15
Amphetamine 59 115 85 132 161 322 159 154 102 44Methamphetamine 7,019 6,609 8,166 9,323 10,664 17,853 12,783 7,649 6,449 8,295
1999 2000 2001 2002 2003 2004 2005 2006 2007 2008
8/23/2019 World Drug Report 2010 Summary
http://slidepdf.com/reader/full/world-drug-report-2010-summary 16/19
8/23/2019 World Drug Report 2010 Summary
http://slidepdf.com/reader/full/world-drug-report-2010-summary 17/19

8/23/2019 World Drug Report 2010 Summary
http://slidepdf.com/reader/full/world-drug-report-2010-summary 18/19
26
World Drug Report 2010
the two, with total seizures reaching 6,587 mt, whereasthe resin seizure total was 1,637 mt in 2008. Cannabisherb seizures appear to be growing most strongly inSouth America; in particular in the Plurinational Stateof Bolivia. For resin, the growth is strongest in South-
West Asia. he year 2008 saw what may be the singlelargest drug seizure in history: 236.8 mt of cannabisresin seized by the Afghan authorities in Kandahar prov-ince in June.
Prices of cannabis herb vary noticeably across differentcountries and regions, even when adjusted for purchas-ing power parity. Some regions revealed intra-regionalconsistency, although comparisons across countriesshould be considered with caution since prices may relate to different product types. Very high retail prices
were reported by Japan, Singapore and two territories inEastern Asia (Hong Kong and Macao, China). he high
price in Japan may be due to the fact that cannabis herbis mainly imported, which is contrary to the prevalentpattern in most other countries. Cannabis herb prices inEurope were also relatively high. he lower end of thescale was occupied mainly by countries in Africa, South
America and East, South-East and South Asia.
Cannabis remains the most widely used illicit substancein the world. Globally, the number of people who hadused cannabis at least once in 2008 is estimated between129 and 191 million, or 2.9% to 4.3% of the worldpopulation aged 15 to 64. Cannabis use appears to be inlong-term decline in some of its highest value markets,
including North America and parts of West Europe.Increasing use has been reported in South America,although annual prevalence rates remain far lower than
in North America. Although there is a lack of scientifi-cally valid data on cannabis use for both Africa and Asia,national experts in both continents perceive an increas-ing trend.
Drug trafficking and instabilityin transit countries
here are two ways that drug trafficking can pose a threatto political stability. he first involves countries whereinsurgents and illegal armed groups draw funds fromtaxing, or even managing, drug production and traffick-ing. he second concerns countries that do not face sucha situation, but where the drug traffickers become power-ful enough to take on the state through violent confron-tation or high-level corruption. his chapter focuses onthe second category, and discusses the impact of cocaine
trafficking on transit countries.Between 2006 and 2008, over half the maritime ship-ments of cocaine to Europe detected came from theBolivarian Republic of Venezuela. Ecuador has also beenaffected by an increase in transit trafficking, and bothcountries are experiencing increasing problems withviolence.
he decline of the US cocaine market and the rise of theEuropean one have also contributed to violence in theCaribbean. In some cases, this is due to new cocaineflows, in others, to the loss of cocaine trafficking as a revenue source for local criminals. It appears that any dramatic changes in trafficking can have a destabilizing effect, resulting in violence.
he region worst affected at present is the Northernriangle of Central America: Guatemala, Honduras and
El Salvador. Here, intense drug-related violence hasposed a serious challenge to governance. While all thesecountries have had problems with violence in the past,
Global cannabis herb seizures (mt), 1999-2008
Source: UNODC ARQ
0
1,000
2,000
3,000
4,000
5,000
6,000
7,000
1 9 9 9
2 0 0 0
2 0 0 1
2 0 0 2
2 0 0 3
2 0 0 4
2 0 0 5
2 0 0 6
2 0 0 7
2 0 0 8
North America South AmericaAfrica Rest of the world
Mexico United States
Departure locations of identified drugtrafficking shipments by sea from South America to Europe, 2006-2008
Source: Maritime Analysis Operation Centre
Venezuela
51%
Caribbean
11%
Colombia
5%
West Africa
11%
Other
12%
Brazil
10%
m t

8/23/2019 World Drug Report 2010 Summary
http://slidepdf.com/reader/full/world-drug-report-2010-summary 19/19
Executive Summary
the murder rate is highest not in the largest urban areasbut in those parts of the country particularly affected by the drug trade, including some ports and border areas.
Much has been made of drug-related violence in Mexico,but murder rates are considerably lower and the Govern-ment is far stronger in Mexico. he crackdown on theMexican cartels has inflamed violence, as it did inColombia, but this phase may be necessary to dismantle
organized crime groups that have begun to challenge thestate. It appears to have disrupted the cocaine supply tothe United States, but more importantly, it has uprooted
widespread corruption and reasserted Government con-trol over the entire territory of the country. Since muchof the drug violence in Central America is tied to thesesame cartels, progress in Mexico should also aid thecountries to the south.
On the other side of the Atlantic, large-scale cocainetrafficking has been a problem in West Africa sincearound 2004. While data on violence are sparse in West
Africa, it is unlikely that the flow of drug money will
precipitate the kind of feuds that have been recently seenin Latin America, because the traffickers have been ableto co-opt top figures in some authoritarian societies.
he best known example is Guinea-Bissau, where theprime minister was recently detained and threatened by soldiers so that the chief of staff of the military could beremoved. he man who engineered this ‘coup’ hasassumed the role of deputy chief. He has also been
widely accused of involvement in drug trafficking. Whilethe flow of cocaine through this region declined sharply after political turmoil in Guinea-Bissau and Guinea in2008/2009, these recent developments suggest it may resume in the near future.
Measures must be taken to assure that transnational
organized crime does not contribute to instability,including, when relevant, building crime preventioninto international efforts to foster peace and the rule of law. Since most transnational trafficking flows are inter-continental, however, planning of integrated drug con-trol strategies at the global level is required to addressthem, and the United Nations can help to coordinatethis endeavour.
Murders and cocaine seizures in Trinidadand Tobago, 1992-2005
Source: UNODC International Homicide Statistics and DELTA
Murder rate trends in Central America(per 100,000 inhabitants), 2003-2008
Source: UNODC International Homicide Statistics
0
5
10
15
20
25
30
35
40
1
9 9 2
1
9 9 3
1
9 9 4
1
9 9 5
1
9 9 6
1
9 9 7
1
9 9 8
1
9 9 9
2
0 0 0
2
0 0 1
2
0 0 2
2
0 0 3
2
0 0 4
2
0 0 5
P e r 1 0 0 , 0 0 0
-
200
400
600
800
1,000
1,200
1,400
1,600
1,800
2,000
K i l o g r a m s
Murder rate Cocaine seized
51
5962 64
5752
3135
4245 45
49
34
26
35
43
50
61
12 11 11 11 10 12
0
10
20
30
40
50
60
70
2003 2004 2005 2006 2007 2008
M u r d e r s p e r 1 0 0 , 0
0 0
El Salvador GuatemalaHonduras Mexico