world food · demographic and macroeconomic development is exerting on food systems. hunger...
TRANSCRIPT
Good decisions are based on accurate information. Since its foundation, FAO is at the forefront of providing internationally comparable, sound and timely data on world agriculture and food security. This pocketbook offers easy access to the most important FAOSTAT data, at a glance.
To access and download complete data and documentation, check the FAOSTAT website, available in Arabic, Chinese, English, French, Russian and Spanish.
www.fao.org/faostat/
| W
ORLD
FO
OD
AND A
GRIC
ULTU
RE
| STA
TIS
TIC
AL P
OC
KETB
OO
K | 2
018
FAO
STA
TIS
TIC
S
WORLD FOOD AND AGRICULTURE
2017
STATISTICAL POCKETBOOK
2018
FAOSTATISTICS
CA1796EN/2/02.19
ISBN 978-92-5-131012-0
9 7 8 9 2 5 1 3 1 0 1 2 0

World Food and Agriculture
Statistical Pocketbook
2018
Food and Agriculture Organization of the United Nations
Rome, 2018

Recommended citation: FAO. 2018. WORLD FOOD AND AGRICULTURE – STATISTICAL
POCKETBOOK 2018. Rome. 254 pp. Licence: CC BY-NC-SA 3.0 IGO.
The designations employed and the presentation of material in this information product
do not imply the expression of any opinion whatsoever on the part of the Food and
Agriculture Organization of the United Nations (FAO) concerning the legal or
development status of any country, territory, city or area or of its authorities, or
concerning the delimitation of its frontiers or boundaries. The mention of specific
companies or products of manufacturers, whether or not these have been patented,
does not imply that these have been endorsed or recommended by FAO in preference to
others of a similar nature that are not mentioned.
The views expressed in this information product are those of the author(s) and do not
necessarily reflect the views or policies of FAO.
ISBN 978-92-5-131012-0 © FAO, 2018
Some rights reserved. This work is made available under the Creative Commons
Attribution-NonCommercial-ShareAlike 3.0 IGO licence (CC BY-NC-SA 3.0 IGO;
https://creativecommons.org/licenses/by-nc-sa/3.0/igo/legalcode/legalcode).
Under the terms of this licence, this work may be copied, redistributed and adapted for
non-commercial purposes, provided that the work is appropriately cited. In any use of
this work, there should be no suggestion that FAO endorses any specific organization,
products or services. The use of the FAO logo is not permitted. If the work is adapted,
then it must be licensed under the same or equivalent Creative Commons licence. If a
translation of this work is created, it must include the following disclaimer along with
the required citation: This translation was not created by the Food and Agriculture
Organization of the United Nations (FAO). FAO is not responsible for the content or
accuracy of this translation. The original English edition shall be the authoritative
edition.
Disputes arising under the licence that cannot be settled amicably will be resolved by
mediation and arbitration as described in Article 8 of the licence except as otherwise
provided herein. The applicable mediation rules will be the mediation rules of the
World Intellectual Property Organization http://www.wipo.int/amc/en/mediation/rules
and any arbitration will be conducted in accordance with the Arbitration Rules of the
United Nations Commission on International Trade Law (UNCITRAL).
Third-party materials. Users wishing to reuse material from this work that is attributed
to a third party, such as tables, figures or images, are responsible for determining
whether permission is needed for that reuse and for obtaining permission from the
copyright holder. The risk of claims resulting from infringement of any third-party-
owned component in the work rests solely with the user.
Sales, rights and licensing. FAO information products are available on the FAO website
(www.fao.org/publications) and can be purchased through [email protected].
Requests for commercial use should be submitted via www.fao.org/contact-us/licence-
request. Queries regarding rights and licensing should be submitted to
Foreword
The implementation of the 2030 Agenda for Sustainable Development is just at the
outset. Pursuing the broad and ambitious Sustainable Development Goals (SDGs) poses
major challenges at all levels, from subnational to regional and international, and calls
for timely decisions on effective policy actions in a rapidly evolving world of scarce
resources.
In this context, the ability to design sound policies and monitor their outcomes is a key
requirement. Measuring progress towards international goals and their national and sub-
national specifications is of paramount importance. Statistics is the main tool for taking
stock and building upon the many small efforts that are carried out to pursue the main
objectives, such as reducing hunger and malnutrition, tackling rural poverty, promoting
sustainable agricultural development, hence contributing to addressing climate change,
promoting inclusive food systems, and improving resilience to extreme conditions.
FAO’s strategic framework, being aligned with the SDGs, makes the Organization ready and able to support countries in strengthening their statistical capacities, which are an
essential prerequisite for pursuing and monitoring the objectives of the 2030 Agenda.
The role of FAO as "custodian" for 21 of the 230 indicators of the SDG Monitoring
Framework testifies to the centrality of the Organization in this process.
This publication presents, at a glance, selected key indicators on agriculture and food
security, and is meant as an easy-access quick reference. The content is in two sections,
one thematic and one country-specific; and is organized along four main themes.
The setting provides information on resources employed in agriculture, including the use
of land, labour, capital and inputs. Data in this section highlight the pressure that
demographic and macroeconomic development is exerting on food systems.
Hunger dimensions describe the state of food insecurity and malnutrition in the world,
starting from the SDG2 indicators for which FAO holds responsibility, which are the
prevalence of undernourishment and the access to food measured through the Food
Insecurity Experience Scale (FIES).
Food supply offers detailed information on the nature and quantity of world agricultural
production and trade, while at the same time considering different utilizations, such as
food, feedstuffs and others.
Environment highlights the crucial issue of sustainability, by considering the interactions
of agriculture with the ecosystem in the evolving context of climate variability and
change.
On all these matters, FAO is committed to supporting national, regional and international
partners in improving the availability of high-quality and timely data, in view of
promoting sustainable agricultural development and SDG 2, Zero Hunger.
Pietro Gennari José Rosero Moncayo
Chief Statistician Director, Statistics Division

How to use this pocketbook
The structure
This publication presents selected key indicators related to agriculture and food security
that the international community, governments, the private sector and civil society can
use to assess current trends and prioritize their actions. It is divided into two sections,
one thematic and one country-specific. It presents a variety of dimensions of agriculture
and food security along four main focus areas:
The setting, including land, labour, capital and inputs.
Hunger dimensions, highlighting food availability, access, stability and utilization.
Food supply looks at agricultural production, trade and utilization.
Environment examines land, water, forestry and emissions.
This publication includes data from FAOSTAT and other FAO sources, as well as other
partner organizations from the international community. The source for all indicators, as
well as more information about each of them, is included in the Definitions section at
the end (page 236).
Country definitions and classification
The country classification adopted in this publication is based on the United Nations M49
classification (http://unstats.un.org/unsd/methods/m49/m49.htm). The country names
have been abbreviated. The official FAO names can be found at
http://termportal.fao.org/faonocs/appl/.
Aggregations
Regional and subregional aggregates are based on the country groupings defined in the
United Nations M49 classification. A small subset of indicators is based on the
aggregation rules defined in The State of Food Security and Nutrition in the World 2018
report (http://www.fao.org/3/I9553EN/i9553en.pdf) and are used in the Hunger
dimensions section.
Two types of aggregations are used: sum and weighted mean. A sufficiency condition is
imposed when computing the aggregation – the aggregation is computed only when
sufficient countries have reported data, and the current threshold is set at 50 percent of
the variable and the weighting variable, if present.
Data presentation conventions
The cut-off date for the data in this publication is 26 September 2018.
The asterisk (*) in charts and maps indicates the most recent year available in the
specified time interval. In the country profiles, when the country data have not been
reported for the reference year, data in italics indicate that the value for the most recent
year of complete information is shown. Exceptions are population data, for which the
latest information available refers to the year 2017; and regional aggregates of
prevalence of undernourishment and prevalence of severe food insecurity, which show
2017 data.
In the tables, n.a. means not applicable or, for an aggregate, not analytically meaningful.
A 0 or 0.0 means zero or a number that is small enough to round to zero at the displayed
number of decimal places.
The ~ in the maps refers to the range specified in the class intervals.
In addition:
• <2.5 proportion less than 2.5 percent
• <0.1 less than 100 000 people

Contents
The setting 2
Population 2
Economy 4
Labour 6
Fertilizers and pesticides 8
Investments 10
Prices 12
Hunger dimensions 14
Hunger and food insecurity 14
Food availability 16
Food access 18
Stability 20
Food utilization 22
Food supply 24
Dietary energy supply 24
Crop production 26
Crop utilization 28
Livestock 30
Fisheries and aquaculture 32
Agricultural trade 34
Environment 36
Land 36
Water 38
Forestry 40
Greenhouse gas emissions 42
Country profiles 46
Definitions 236
2
The setting
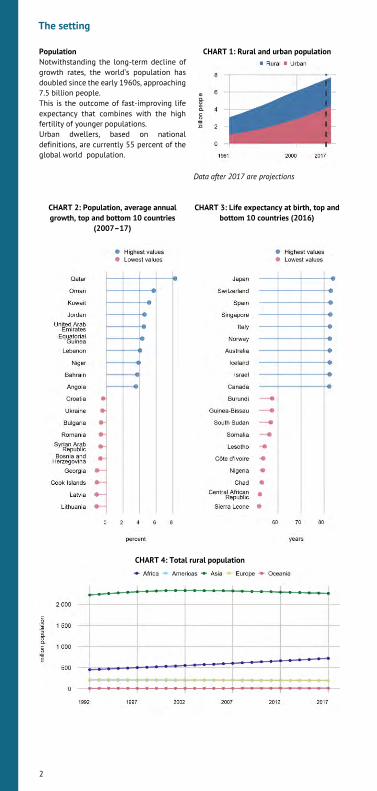
Population
Notwithstanding the long-term decline of
growth rates, the world’s population has doubled since the early 1960s, approaching
7.5 billion people.
This is the outcome of fast-improving life
expectancy that combines with the high
fertility of younger populations.
Urban dwellers, based on national
definitions, are currently 55 percent of the
global world population.
CHART 1: Rural and urban population
Data after 2017 are projections
CHART 2: Population, average annual
growth, top and bottom 10 countries
(2007–17)
CHART 3: Life expectancy at birth, top and
bottom 10 countries (2016)
CHART 4: Total rural population

3
FIGURE 1: Rural population, share of total population (2017)

4
Economy
The data reconfirm the hypothesis that with
the development of a country, the share of
agriculture in GDP goes down, which
usually is accompanied by migration of the
labour force from agriculture to non-
agricultural sectors. In order to keep
agriculture playing its vital role as provider
of food, fibre and fodder, it is important to
increase per worker productivity of the
agricultural sector, which can come
through greater investments in agriculture
and use of improved technologies.
CHART 5: Value added in agriculture,
forestry and fishing, industry and services,
share of GDP (2017)
CHART 6: Agriculture, value added per
worker, top 20 countries with the highest
values (2007–17*)
CHART 7: Value added in agriculture, 10
countries with highest and lowest average
annual growth rate (2006–16)
CHART 8: Value added in agriculture, forestry and fishing as share of GDP (2010 prices)

5
FIGURE 2: Value added in agriculture, share of GDP (2011–16*)

6
Labour
Shares of agricultural employment in total
employment decline as income grows. But
the ability of agriculture – and the related
activities along the food production chains
– to demand employment translates in key
income opportunities for poor and
vulnerable population groups. Collecting
high-quality data on those who work in
agriculture is particularly important and
challenging. Much labour in agriculture is
informal, characterized by high levels of
pluri-activity and seasonality. It can be self-
employed or unpaid, and/or supplied by
family members. As a large share of the
working poor are involved in agriculture,
developments in this sector have a major
impact on welfare.
CHART 9: Labour force participation rate
by gender, aged 15+ (2017)
CHART 10: Female employment in
agriculture in top 20 countries, share of
female employment (2007–17*)
CHART 11: Male employment in
agriculture in top 20 countries, share of
male employment (2007–17*)
CHART 12: Female employment in agriculture, share of female employment

7
FIGURE 3: Employment in agriculture, share of total employment (2011–17*)
8
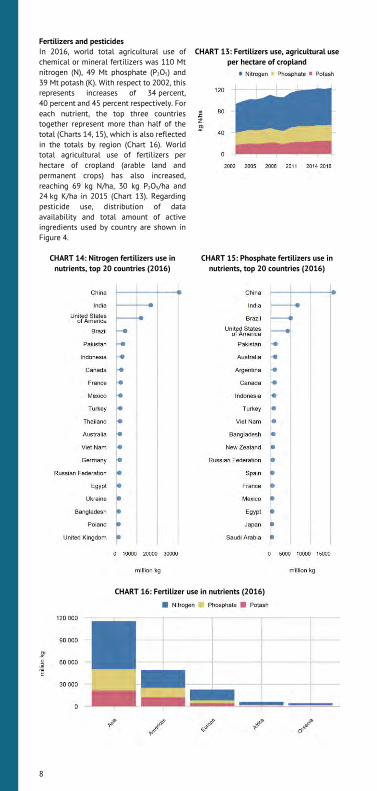
Fertilizers and pesticides
In 2016, world total agricultural use of
chemical or mineral fertilizers was 110 Mt
nitrogen (N), 49 Mt phosphate (P2O5) and
39 Mt potash (K). With respect to 2002, this
represents increases of 34 percent,
40 percent and 45 percent respectively. For
each nutrient, the top three countries
together represent more than half of the
total (Charts 14, 15), which is also reflected
in the totals by region (Chart 16). World
total agricultural use of fertilizers per
hectare of cropland (arable land and
permanent crops) has also increased,
reaching 69 kg N/ha, 30 kg P2O5/ha and
24 kg K/ha in 2015 (Chart 13). Regarding
pesticide use, distribution of data
availability and total amount of active
ingredients used by country are shown in
Figure 4.
CHART 13: Fertilizers use, agricultural use
per hectare of cropland
CHART 14: Nitrogen fertilizers use in
nutrients, top 20 countries (2016)
CHART 15: Phosphate fertilizers use in
nutrients, top 20 countries (2016)
CHART 16: Fertilizer use in nutrients (2016)

9
FIGURE 4: Pesticide use (2016)

10
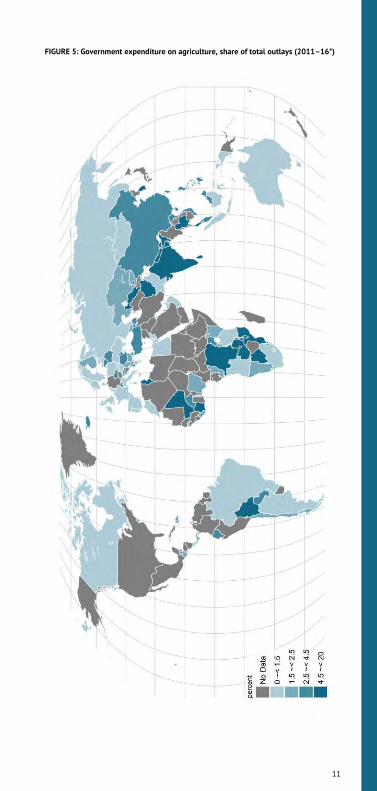
Investments
In the coming decades, increased
investment in agriculture is going to be
crucial for meeting the challenge of
adequately feeding the 821 million
chronically undernourished people counted
today. In FAOSTAT, investment flows are
recorded by government expenditure in
agriculture, development cooperation
flows to agriculture, foreign direct
investment and credit to agriculture.
Although total development flows are
increasing in the long run, the share of
crops, livestock, fisheries, aquaculture and
forestry as a whole is declining. In most
regions, except Europe, the share of
agriculture in total credit is also declining.
CHART 17: Aid commitment flows to
agriculture, forestry and fishing, share of
total aid
CHART 18: Total credit to agriculture,
forestry and fishing, top 20 countries
(2016)
CHART 19: Government expenditure on
agriculture, forestry and fishing,
10 countries with highest and lowest
average AOI (2010–16)
CHART 20: Aid commitment flows to agriculture, forestry and fishing, top 10 countries
(2016)
11
FIGURE 5: Government expenditure on agriculture, share of total outlays (2011–16*)

12
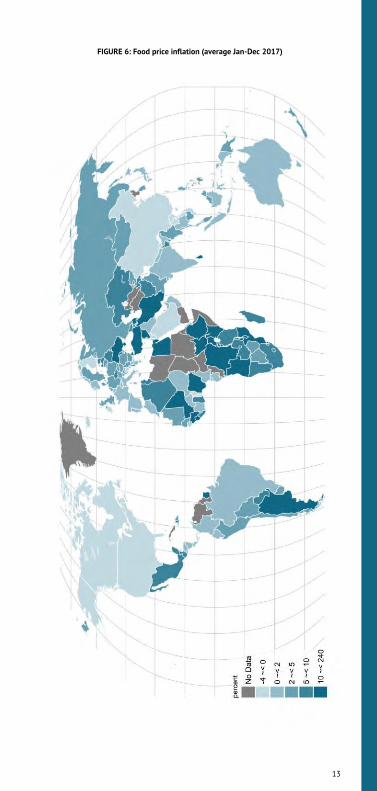
Prices
Prices are the main determinants of
resource allocation for production. Factors
that can drive food consumer prices are
affected most by natural calamities or
political instability, which reduce the
production or disrupt the supply chain.
Most countries with high inflation in recent
times were noted to be facing similar
situations. The volatility of international
markets is usually not fully transmitted to
domestic consumer markets due to national
policies protecting them.
CHART 21: Inflation rate in prices
CHART 22: Top 20 countries with the
highest inflation rate
(average Jan-Dec 2017)
CHART 23: Top 20 countries with the
lowest inflation rate
(average Jan–Dec 2017)
CHART 24: Inflation in food consumer prices
13
FIGURE 6: Food price inflation (average Jan-Dec 2017)

14
Hunger dimensions
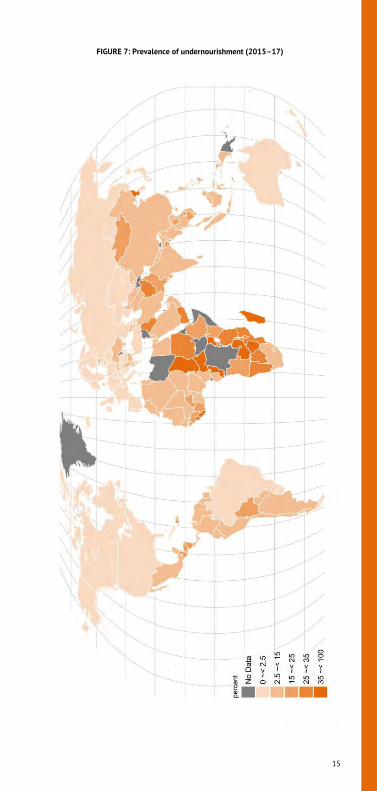
Hunger and food insecurity
Hunger is traditionally measured by the
prevalence of undernourishment, which is
the inability to acquire enough food to
meet dietary energy requirements. New
evidence continues to point to a rise in
world hunger in recent years after a
prolonged decline. In 2017, an estimated
821 million people – approximately one in
every nine people – in the world still lack
sufficient food to lead an active and healthy
life. Complementary statistics based on the
Food Insecurity Experience Scale (FIES)
show that close to 10 percent of the world
population was exposed to severe food
insecurity, corresponding to about
770 million people.
TABLE 1: Prevalence of undernourishment
(percent of population)
2007 2017
World 13.1 10.9
TABLE 2: Prevalence of severe food
insecurity (percent of population)
2016 2017
World 8.9 10.2
CHART 25: Top 20 countries with the
highest number of undernourished
(2015–17)
CHART 26: Top 19 subregions with the
highest number of severely food insecure
people (2016)
CHART 27: Number of undernourished
15
FIGURE 7: Prevalence of undernourishment (2015–17)

16
Food availability
Availability is an important dimension of
food security. Supplying enough food to the
reference population is a necessary, but
insufficient, condition for ensuring
adequate access for individuals. In most
countries and regions, high food
availability is associated with relatively low
prevalence of undernourishment and low
prevalence of severe food insecurity.
Conflicts and climate change have a
cumulative effect on food production.
Political conflicts and climate-related
disasters in some countries have
undermined the food availability in recent
years, leading to the rise in global hunger.
CHART 28: Average dietary energy supply
adequacy
CHART 29: Average share of energy supply
derived from cereals, roots and tubers, top
20 countries (2011–13)
CHART 30: Average protein supply, top 20
countries (2011–13)
CHART 31: Average supply of protein of animal origin

17
FIGURE 8: Average value of food production (2014–16)
18
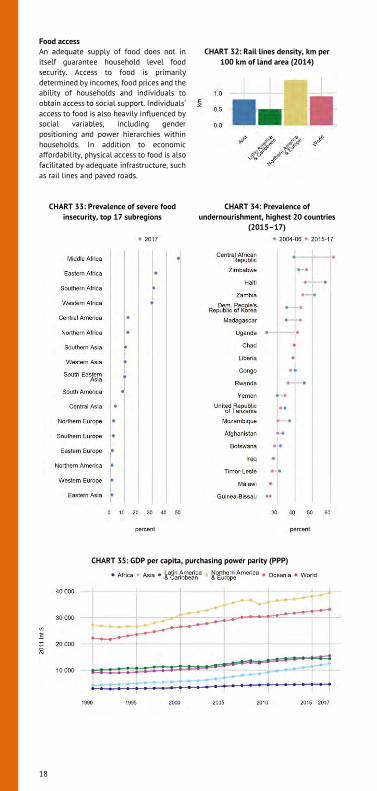
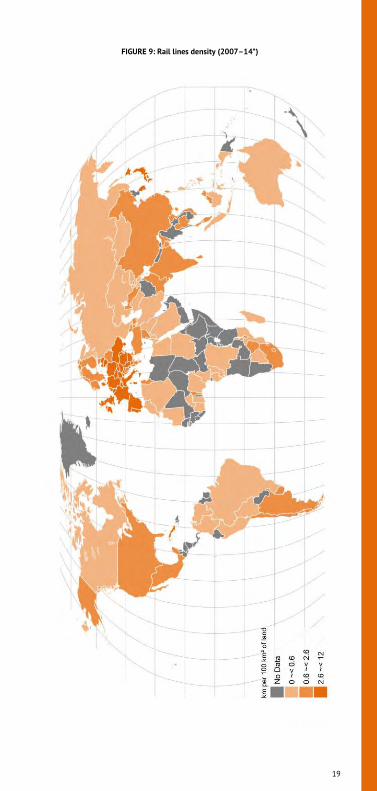
Food access
An adequate supply of food does not in
itself guarantee household level food
security. Access to food is primarily
determined by incomes, food prices and the
ability of households and individuals to
obtain access to social support. Individuals’ access to food is also heavily influenced by
social variables, including gender
positioning and power hierarchies within
households. In addition to economic
affordability, physical access to food is also
facilitated by adequate infrastructure, such
as rail lines and paved roads.
CHART 32: Rail lines density, km per
100 km of land area (2014)
CHART 33: Prevalence of severe food
insecurity, top 17 subregions
CHART 34: Prevalence of
undernourishment, highest 20 countries
(2015–17)
CHART 35: GDP per capita, purchasing power parity (PPP)
19
FIGURE 9: Rail lines density (2007–14*)

20
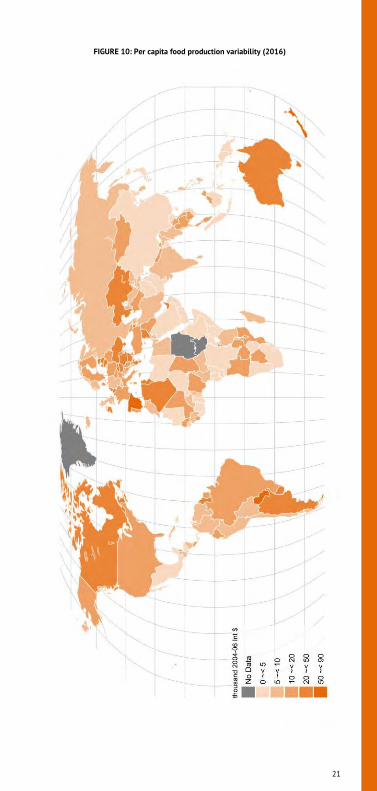
Stability
Over the last ten years, food and
agricultural markets have entered an
unexpectedly turbulent phase, character-
ized by large supply shortfalls and price
swings. Meanwhile the number of conflicts
is also on the rise. Exacerbated by climate-
related shocks, conflicts seriously affect
food security and are a cause of much of the
recent increase in food insecurity. The
poorer the household, the stronger the
impact of external shocks, as poor
households spend a proportionally higher
share of their incomes on food.
CHART 36: Per capita food production
variability
CHART 37: Per capita food supply
variability, top 20 countries (2013)
CHART 38: Cereal import dependency
ratio, top 20 countries (2011–13)
CHART 39: Value of food imports as a share of total merchandise exports
21
FIGURE 10: Per capita food production variability (2016)
22
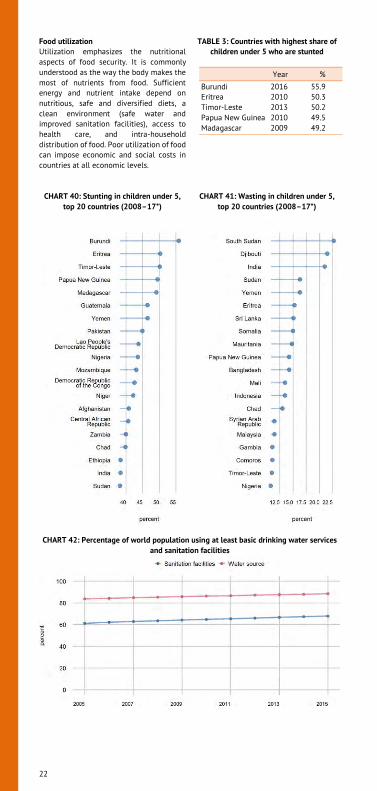
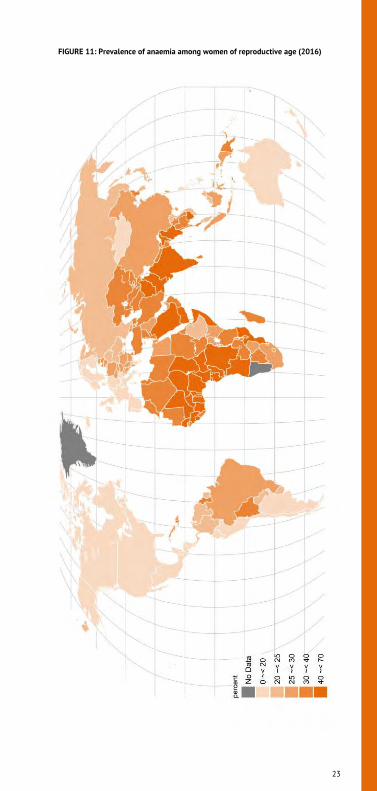
Food utilization
Utilization emphasizes the nutritional
aspects of food security. It is commonly
understood as the way the body makes the
most of nutrients from food. Sufficient
energy and nutrient intake depend on
nutritious, safe and diversified diets, a
clean environment (safe water and
improved sanitation facilities), access to
health care, and intra-household
distribution of food. Poor utilization of food
can impose economic and social costs in
countries at all economic levels.
TABLE 3: Countries with highest share of
children under 5 who are stunted
Year %
Burundi 2016 55.9
Eritrea 2010 50.3
Timor-Leste 2013 50.2
Papua New Guinea 2010 49.5
Madagascar 2009 49.2
CHART 40: Stunting in children under 5,
top 20 countries (2008–17*)
CHART 41: Wasting in children under 5,
top 20 countries (2008–17*)
CHART 42: Percentage of world population using at least basic drinking water services
and sanitation facilities
23
FIGURE 11: Prevalence of anaemia among women of reproductive age (2016)

24
Food supply
Dietary energy supply
The dietary energy supply is an indicator
calculated at the national level that serves
as an estimate of the amount of calories
from food available for human
consumption. It does not yield any
information on the affordability, access, or
consumption of dietary energy by different
population groups. It can be useful for
determining if a country’s food supply contains enough dietary energy to meet
population needs, and whether measures
need to be taken to improve the amount of
dietary energy available for the population.
The overall average dietary energy supply
has increased from 2 716 kcal/cap/day in
1999–2001 to 2 904 kcal/cap/day in
2015-17.
CHART 43: Share of dietary energy supply,
kcal/cap/day (2013)
CHART 44: Average dietary energy supply,
top 20 countries (2015–17)
CHART 45: Average dietary energy supply
adequacy, top 20 countries (2015–17)
CHART 46: Average dietary energy supply by region

25
FIGURE 12: Average dietary energy supply adequacy (2015–17)
26
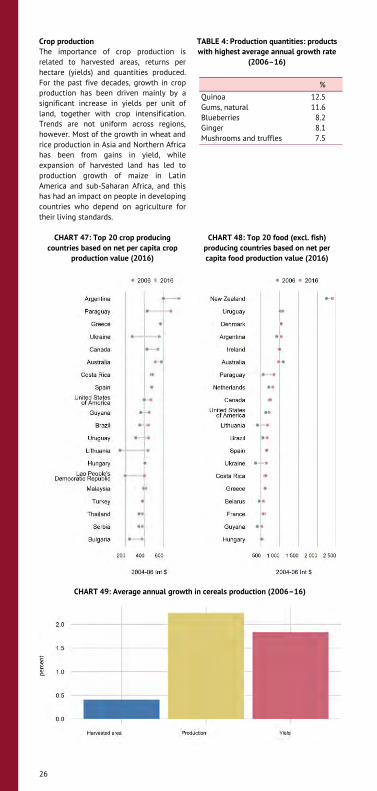
Crop production
The importance of crop production is
related to harvested areas, returns per
hectare (yields) and quantities produced.
For the past five decades, growth in crop
production has been driven mainly by a
significant increase in yields per unit of
land, together with crop intensification.
Trends are not uniform across regions,
however. Most of the growth in wheat and
rice production in Asia and Northern Africa
has been from gains in yield, while
expansion of harvested land has led to
production growth of maize in Latin
America and sub-Saharan Africa, and this
has had an impact on people in developing
countries who depend on agriculture for
their living standards.
TABLE 4: Production quantities: products
with highest average annual growth rate
(2006–16)
%
Quinoa 12.5
Gums, natural 11.6
Blueberries 8.2
Ginger 8.1
Mushrooms and truffles 7.5
CHART 47: Top 20 crop producing
countries based on net per capita crop
production value (2016)
CHART 48: Top 20 food (excl. fish)
producing countries based on net per
capita food production value (2016)
CHART 49: Average annual growth in cereals production (2006–16)

27
FIGURE 13: Crops, net per capita production index (2016)
28
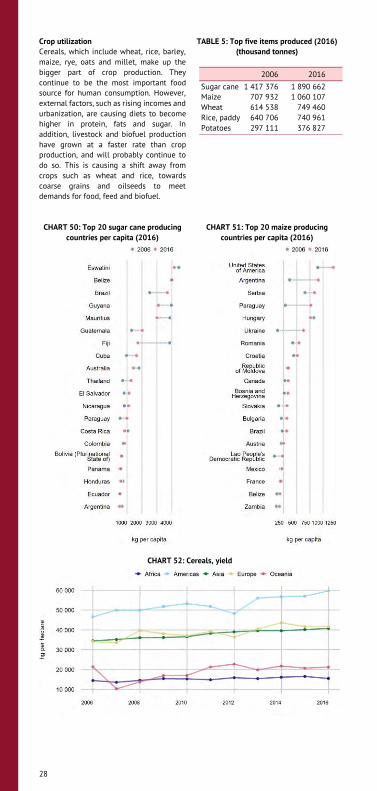
Crop utilization
Cereals, which include wheat, rice, barley,
maize, rye, oats and millet, make up the
bigger part of crop production. They
continue to be the most important food
source for human consumption. However,
external factors, such as rising incomes and
urbanization, are causing diets to become
higher in protein, fats and sugar. In
addition, livestock and biofuel production
have grown at a faster rate than crop
production, and will probably continue to
do so. This is causing a shift away from
crops such as wheat and rice, towards
coarse grains and oilseeds to meet
demands for food, feed and biofuel.
TABLE 5: Top five items produced (2016)
(thousand tonnes)
2006 2016
Sugar cane 1 417 376 1 890 662
Maize 707 932 1 060 107
Wheat 614 538 749 460
Rice, paddy 640 706 740 961
Potatoes 297 111 376 827
CHART 50: Top 20 sugar cane producing
countries per capita (2016)
CHART 51: Top 20 maize producing
countries per capita (2016)
CHART 52: Cereals, yield
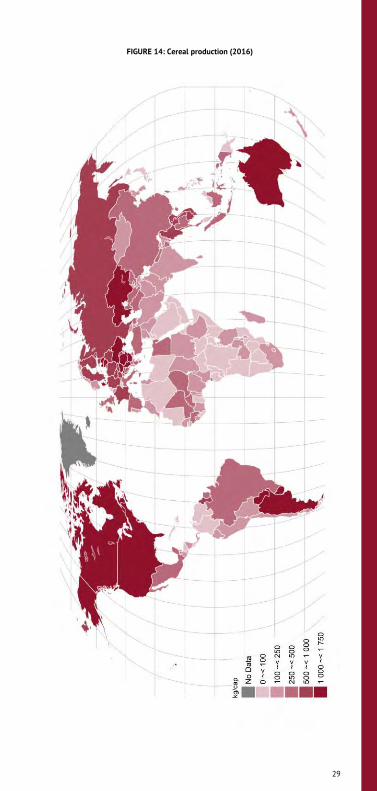
29
FIGURE 14: Cereal production (2016)
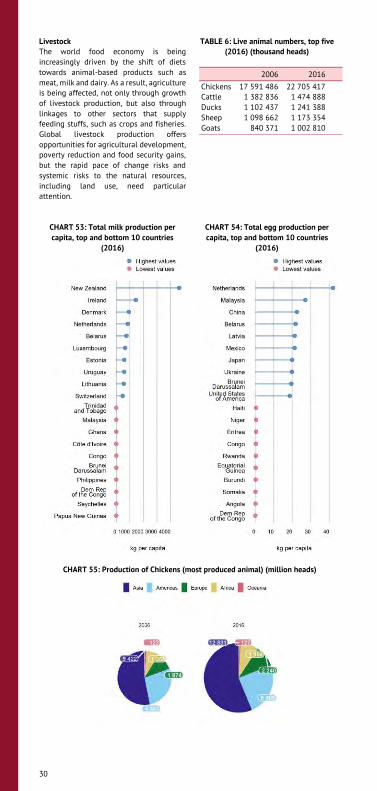
30
Livestock
The world food economy is being
increasingly driven by the shift of diets
towards animal-based products such as
meat, milk and dairy. As a result, agriculture
is being affected, not only through growth
of livestock production, but also through
linkages to other sectors that supply
feeding stuffs, such as crops and fisheries.
Global livestock production offers
opportunities for agricultural development,
poverty reduction and food security gains,
but the rapid pace of change risks and
systemic risks to the natural resources,
including land use, need particular
attention.
TABLE 6: Live animal numbers, top five
(2016) (thousand heads)
2006 2016
Chickens 17 591 486 22 705 417
Cattle 1 382 836 1 474 888
Ducks 1 102 437 1 241 388
Sheep 1 098 662 1 173 354
Goats 840 371 1 002 810
CHART 53: Total milk production per
capita, top and bottom 10 countries
(2016)
CHART 54: Total egg production per
capita, top and bottom 10 countries
(2016)
CHART 55: Production of Chickens (most produced animal) (million heads)

31
FIGURE 15: Cattle and buffaloes per hectare of agricultural area (2016)
32
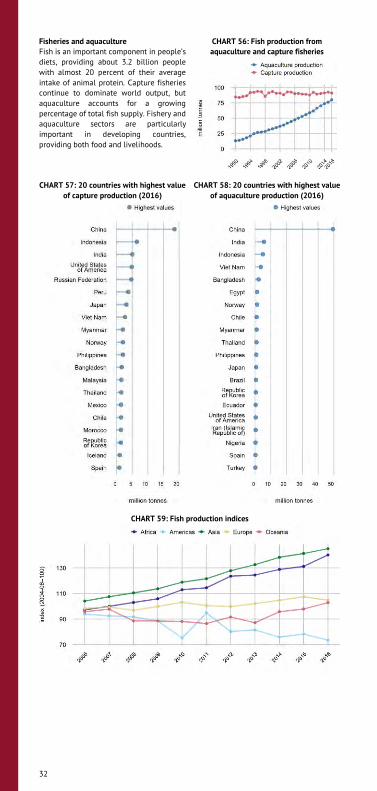
Fisheries and aquaculture
Fish is an important component in people’s diets, providing about 3.2 billion people
with almost 20 percent of their average
intake of animal protein. Capture fisheries
continue to dominate world output, but
aquaculture accounts for a growing
percentage of total fish supply. Fishery and
aquaculture sectors are particularly
important in developing countries,
providing both food and livelihoods.
CHART 56: Fish production from
aquaculture and capture fisheries
CHART 57: 20 countries with highest value
of capture production (2016)
CHART 58: 20 countries with highest value
of aquaculture production (2016)
CHART 59: Fish production indices

33
FIGURE 16: Net trade of fish (2016)
34
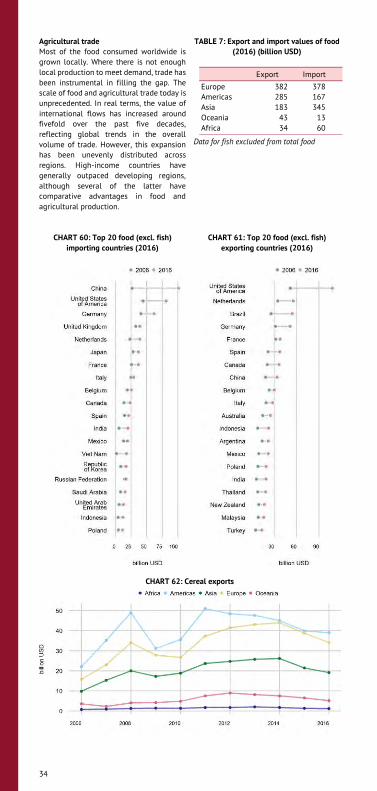
Agricultural trade
Most of the food consumed worldwide is
grown locally. Where there is not enough
local production to meet demand, trade has
been instrumental in filling the gap. The
scale of food and agricultural trade today is
unprecedented. In real terms, the value of
international flows has increased around
fivefold over the past five decades,
reflecting global trends in the overall
volume of trade. However, this expansion
has been unevenly distributed across
regions. High-income countries have
generally outpaced developing regions,
although several of the latter have
comparative advantages in food and
agricultural production.
TABLE 7: Export and import values of food
(2016) (billion USD)
Export Import
Europe 382 378
Americas 285 167
Asia 183 345
Oceania 43 13
Africa 34 60
Data for fish excluded from total food
CHART 60: Top 20 food (excl. fish)
importing countries (2016)
CHART 61: Top 20 food (excl. fish)
exporting countries (2016)
CHART 62: Cereal exports
35
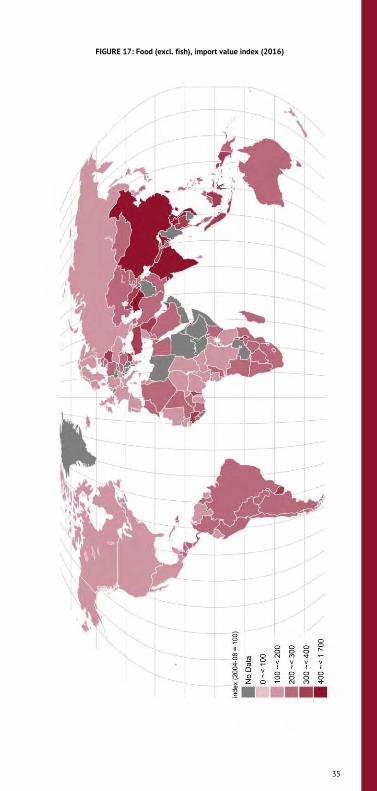
FIGURE 17: Food (excl. fish), import value index (2016)
36
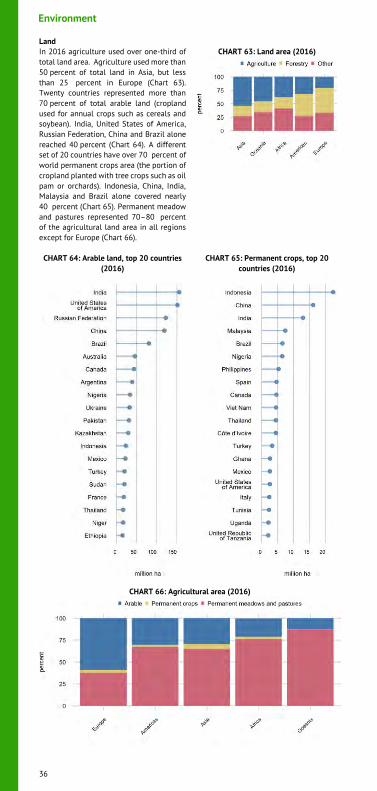
Environment
Land
In 2016 agriculture used over one-third of
total land area. Agriculture used more than
50 percent of total land in Asia, but less
than 25 percent in Europe (Chart 63).
Twenty countries represented more than
70 percent of total arable land (cropland
used for annual crops such as cereals and
soybean). India, United States of America,
Russian Federation, China and Brazil alone
reached 40 percent (Chart 64). A different
set of 20 countries have over 70 percent of
world permanent crops area (the portion of
cropland planted with tree crops such as oil
pam or orchards). Indonesia, China, India,
Malaysia and Brazil alone covered nearly
40 percent (Chart 65). Permanent meadow
and pastures represented 70–80 percent
of the agricultural land area in all regions
except for Europe (Chart 66).
CHART 63: Land area (2016)
CHART 64: Arable land, top 20 countries
(2016)
CHART 65: Permanent crops, top 20
countries (2016)
CHART 66: Agricultural area (2016)

37
FIGURE 18: Cropland per capita (2016)

38
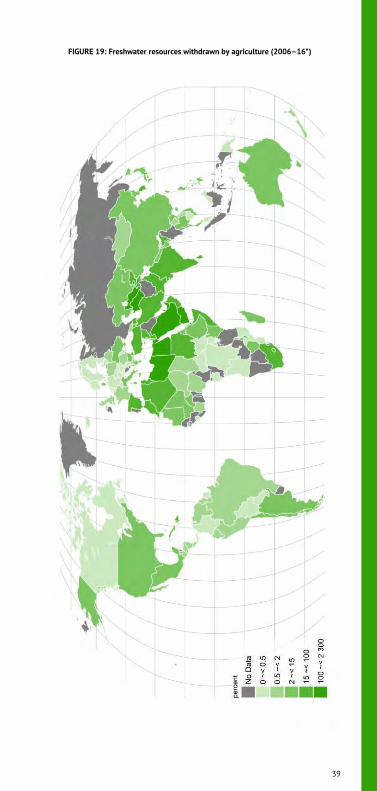
Water
Global demand for water has risen sharply
over the last century. Total annual water
withdrawal from agriculture, municipalities
and industries rose from less than 580 km3
in 1900 to more than 3 900 km3, according
to the latest available data. Agriculture
accounts for approximately 70 percent of
total freshwater withdrawal in the world,
mostly through irrigation. This has been
crucial for gains in food production because
irrigation reduces drought risk and
encourages crop diversification, thus also
enhancing rural incomes. While irrigated
agriculture represents about 20 percent of
the cultivated land, it contributes to
40 percent of global food production.
CHART 67: Countries with the lowest
renewable water resources per capita
CHART 68: Freshwater withdrawal by
industrial sector, share of total, top 20
countries (2005–15)
CHART 69: Freshwater withdrawal by
agricultural sector, share of total, top 20
countries (2006–16)
CHART 70: Countries with the highest renewable water resources per capita
39
FIGURE 19: Freshwater resources withdrawn by agriculture (2006–16*)
40
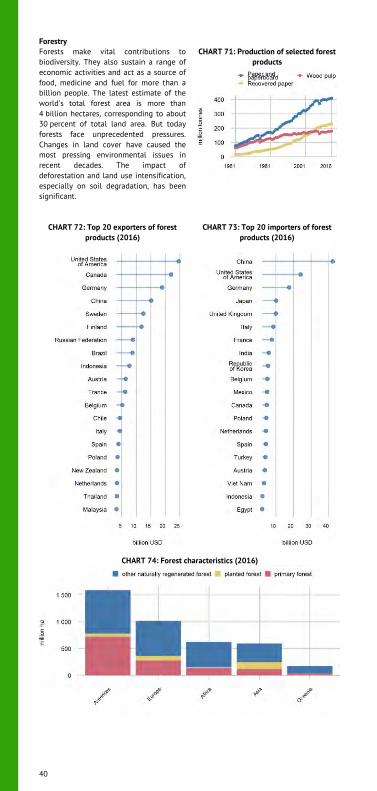
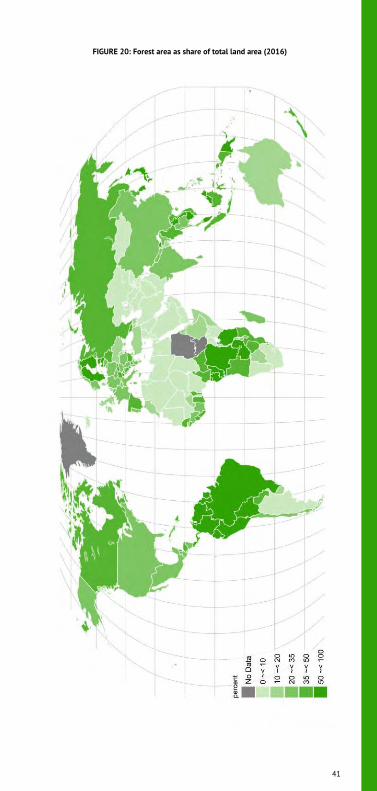
Forestry
Forests make vital contributions to
biodiversity. They also sustain a range of
economic activities and act as a source of
food, medicine and fuel for more than a
billion people. The latest estimate of the
world’s total forest area is more than 4 billion hectares, corresponding to about
30 percent of total land area. But today
forests face unprecedented pressures.
Changes in land cover have caused the
most pressing environmental issues in
recent decades. The impact of
deforestation and land use intensification,
especially on soil degradation, has been
significant.
CHART 71: Production of selected forest
products
CHART 72: Top 20 exporters of forest
products (2016)
CHART 73: Top 20 importers of forest
products (2016)
CHART 74: Forest characteristics (2016)
41
FIGURE 20: Forest area as share of total land area (2016)
42
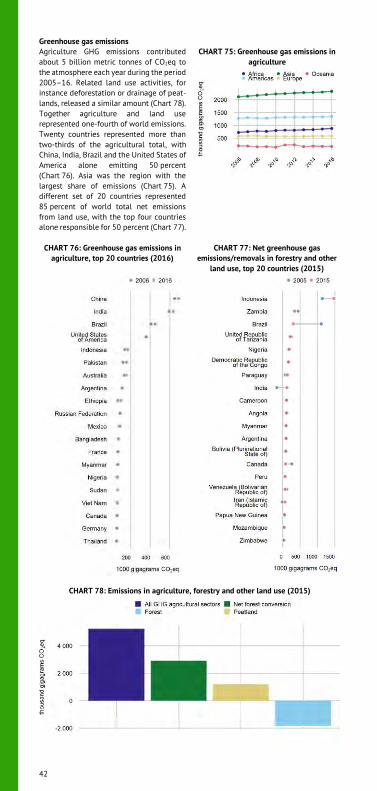
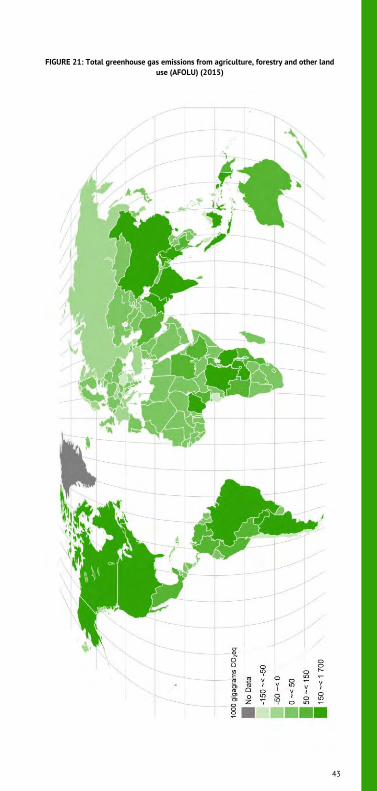
Greenhouse gas emissions
Agriculture GHG emissions contributed
about 5 billion metric tonnes of CO2eq to
the atmosphere each year during the period
2005–16. Related land use activities, for
instance deforestation or drainage of peat-
lands, released a similar amount (Chart 78).
Together agriculture and land use
represented one-fourth of world emissions.
Twenty countries represented more than
two-thirds of the agricultural total, with
China, India, Brazil and the United States of
America alone emitting 50 percent
(Chart 76). Asia was the region with the
largest share of emissions (Chart 75). A
different set of 20 countries represented
85 percent of world total net emissions
from land use, with the top four countries
alone responsible for 50 percent (Chart 77).
CHART 75: Greenhouse gas emissions in
agriculture
CHART 76: Greenhouse gas emissions in
agriculture, top 20 countries (2016)
CHART 77: Net greenhouse gas
emissions/removals in forestry and other
land use, top 20 countries (2015)
CHART 78: Emissions in agriculture, forestry and other land use (2015)
43
FIGURE 21: Total greenhouse gas emissions from agriculture, forestry and other land
use (AFOLU) (2015)


46
World
1995 2005 2016
The setting Population, total (mill.) 5 751.5 6 542.2 7 550.3
Rural population, total (mill.) 3 173.8 3 315.1 3 373.5
Govt. expenditure on agric. (% total outlays) Area harvested, crops (mill. ha) 1 168.9 1 254.3 1 384.8
Cropping intensity ratio 0.8 0.8 0.9
Total renew. water resources per cap. (m³) 6 900 5 740
Land area equipped for irrigation (1 000 ha) 271 826 310 118 334 272
Agric. area actually irrigated (% agric. area) Employment in agriculture (%) 41.3 35.2 26.7
Employment in agriculture, female (%) 42.7 37.1 27.5
Fertilizers use, nitrogen (1 000 t nutrients) 89 805.8 110 182.4
Fertilizers use, phosphate (1 000 t nutrients) 38 763.4 48 578.4
Fertilizers use, potash (1 000 t nutrients) 29 584.2 38 743.7
Agric. value added per worker (constant USD) 1 631 2 243 3 542
Hunger dimensions Average dietary energy supply (kcal/cap/day) 2 753 2 904
Average dietary energy supply adequacy (%) 115 120
Dietary energy supply, cereals/roots/tubers (%) 52 50
Prevalence of undernourishment (%) 14.5 10.9
Prevalence of severe food insecurity (%) 10.2
GDP per capita (USD, PPP) 8 125 11 698 15 080
Cereal import dependency ratio (%) -0.6 -1.0
Stunting, children under 5 (%) 29.3 22.7
Wasting, children under 5 (%) 7.5
Safely managed drinking water (% pop. using) 66.1 71.2
Food supply Food production value, net (2004–06 mill. I$) 1 394 325 1 803 254 2 323 632
Agriculture, value added (% GDP) 4 3 4
Food (excl. fish) exports (mill. USD) 297 998 453 509 926 686
Food (excl. fish) imports (mill. USD) 310 744 473 971 962 538
Production indices (2004–06 = 100) Food 77 100 129
Crops 76 100 132
Cereals 84 100 125
Vegetable oils 63 99 150
Roots and tubers 84 101 121
Fruit and vegetables 69 100 137
Sugar 89 97 134
Livestock 81 100 120
Milk 81 100 123
Meat 81 100 117
Fish 86 100 125
Net trade (mill. USD) Cereals and preparations Fruit and vegetables Meat and meat preparations Dairy products (milk equivalent) Fish Environment Forest area (% total land area) 31 31 31
Agricultural area (% total land area) 38 38 37
Freshwater withdrawal (% internal renewable) 9.0 Terrestrial protected areas (% total land area) 14
Organic area (ha) Wood pellet production (1 000 t) 29 668
Emissions in agriculture (CO2 eq. Gg) 4 600 615 4 838 132 5 294 156
Net emissions in land use (CO2 eq. Gg) 3 866 670 4 241 261 3 065 446
47
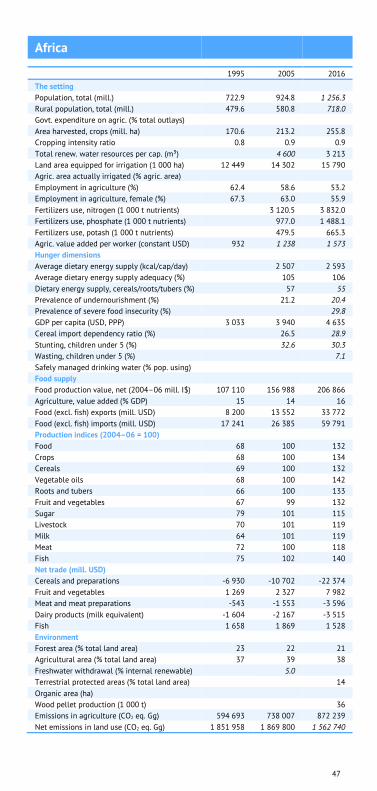
Africa
1995 2005 2016
The setting Population, total (mill.) 722.9 924.8 1 256.3
Rural population, total (mill.) 479.6 580.8 718.0
Govt. expenditure on agric. (% total outlays) Area harvested, crops (mill. ha) 170.6 213.2 255.8
Cropping intensity ratio 0.8 0.9 0.9
Total renew. water resources per cap. (m³) 4 600 3 213
Land area equipped for irrigation (1 000 ha) 12 449 14 302 15 790
Agric. area actually irrigated (% agric. area) Employment in agriculture (%) 62.4 58.6 53.2
Employment in agriculture, female (%) 67.3 63.0 55.9
Fertilizers use, nitrogen (1 000 t nutrients) 3 120.5 3 832.0
Fertilizers use, phosphate (1 000 t nutrients) 977.0 1 488.1
Fertilizers use, potash (1 000 t nutrients) 479.5 665.3
Agric. value added per worker (constant USD) 932 1 238 1 573
Hunger dimensions Average dietary energy supply (kcal/cap/day) 2 507 2 593
Average dietary energy supply adequacy (%) 105 106
Dietary energy supply, cereals/roots/tubers (%) 57 55
Prevalence of undernourishment (%) 21.2 20.4
Prevalence of severe food insecurity (%) 29.8
GDP per capita (USD, PPP) 3 033 3 940 4 635
Cereal import dependency ratio (%) 26.5 28.9
Stunting, children under 5 (%) 32.6 30.3
Wasting, children under 5 (%) 7.1
Safely managed drinking water (% pop. using) Food supply Food production value, net (2004–06 mill. I$) 107 110 156 988 206 866
Agriculture, value added (% GDP) 15 14 16
Food (excl. fish) exports (mill. USD) 8 200 13 552 33 772
Food (excl. fish) imports (mill. USD) 17 241 26 385 59 791
Production indices (2004–06 = 100) Food 68 100 132
Crops 68 100 134
Cereals 69 100 132
Vegetable oils 68 100 142
Roots and tubers 66 100 133
Fruit and vegetables 67 99 132
Sugar 79 101 115
Livestock 70 101 119
Milk 64 101 119
Meat 72 100 118
Fish 75 102 140
Net trade (mill. USD) Cereals and preparations -6 930 -10 702 -22 374
Fruit and vegetables 1 269 2 327 7 982
Meat and meat preparations -543 -1 553 -3 596
Dairy products (milk equivalent) -1 604 -2 167 -3 515
Fish 1 658 1 869 1 528
Environment Forest area (% total land area) 23 22 21
Agricultural area (% total land area) 37 39 38
Freshwater withdrawal (% internal renewable) 5.0 Terrestrial protected areas (% total land area) 14
Organic area (ha) Wood pellet production (1 000 t) 36
Emissions in agriculture (CO2 eq. Gg) 594 693 738 007 872 239
Net emissions in land use (CO2 eq. Gg) 1 851 958 1 869 800 1 562 740
48
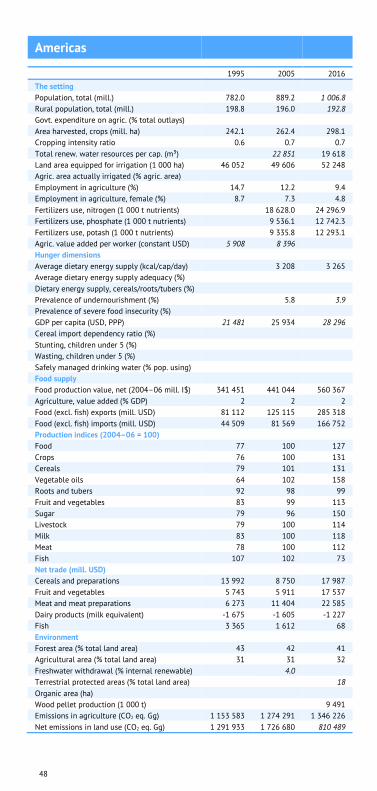
Americas
1995 2005 2016
The setting Population, total (mill.) 782.0 889.2 1 006.8
Rural population, total (mill.) 198.8 196.0 192.8
Govt. expenditure on agric. (% total outlays) Area harvested, crops (mill. ha) 242.1 262.4 298.1
Cropping intensity ratio 0.6 0.7 0.7
Total renew. water resources per cap. (m³) 22 851 19 618
Land area equipped for irrigation (1 000 ha) 46 052 49 606 52 248
Agric. area actually irrigated (% agric. area) Employment in agriculture (%) 14.7 12.2 9.4
Employment in agriculture, female (%) 8.7 7.3 4.8
Fertilizers use, nitrogen (1 000 t nutrients) 18 628.0 24 296.9
Fertilizers use, phosphate (1 000 t nutrients) 9 536.1 12 742.3
Fertilizers use, potash (1 000 t nutrients) 9 335.8 12 293.1
Agric. value added per worker (constant USD) 5 908 8 396 Hunger dimensions Average dietary energy supply (kcal/cap/day) 3 208 3 265
Average dietary energy supply adequacy (%) Dietary energy supply, cereals/roots/tubers (%) Prevalence of undernourishment (%) 5.8 3.9
Prevalence of severe food insecurity (%) GDP per capita (USD, PPP) 21 481 25 934 28 296
Cereal import dependency ratio (%) Stunting, children under 5 (%) Wasting, children under 5 (%) Safely managed drinking water (% pop. using) Food supply Food production value, net (2004–06 mill. I$) 341 451 441 044 560 367
Agriculture, value added (% GDP) 2 2 2
Food (excl. fish) exports (mill. USD) 81 112 125 115 285 318
Food (excl. fish) imports (mill. USD) 44 509 81 569 166 752
Production indices (2004–06 = 100) Food 77 100 127
Crops 76 100 131
Cereals 79 101 131
Vegetable oils 64 102 158
Roots and tubers 92 98 99
Fruit and vegetables 83 99 113
Sugar 79 96 150
Livestock 79 100 114
Milk 83 100 118
Meat 78 100 112
Fish 107 102 73
Net trade (mill. USD) Cereals and preparations 13 992 8 750 17 987
Fruit and vegetables 5 743 5 911 17 537
Meat and meat preparations 6 273 11 404 22 585
Dairy products (milk equivalent) -1 675 -1 605 -1 227
Fish 3 365 1 612 68
Environment Forest area (% total land area) 43 42 41
Agricultural area (% total land area) 31 31 32
Freshwater withdrawal (% internal renewable) 4.0 Terrestrial protected areas (% total land area) 18
Organic area (ha) Wood pellet production (1 000 t) 9 491
Emissions in agriculture (CO2 eq. Gg) 1 153 583 1 274 291 1 346 226
Net emissions in land use (CO2 eq. Gg) 1 291 933 1 726 680 810 489
49
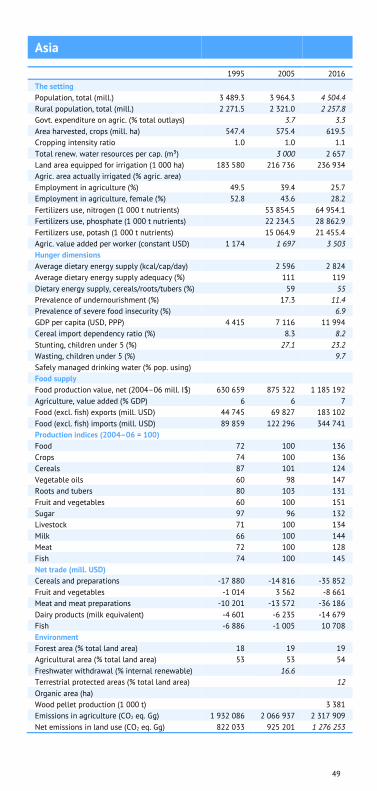
Asia
1995 2005 2016
The setting Population, total (mill.) 3 489.3 3 964.3 4 504.4
Rural population, total (mill.) 2 271.5 2 321.0 2 257.8
Govt. expenditure on agric. (% total outlays) 3.7 3.3
Area harvested, crops (mill. ha) 547.4 575.4 619.5
Cropping intensity ratio 1.0 1.0 1.1
Total renew. water resources per cap. (m³) 3 000 2 657
Land area equipped for irrigation (1 000 ha) 183 580 216 736 236 934
Agric. area actually irrigated (% agric. area) Employment in agriculture (%) 49.5 39.4 25.7
Employment in agriculture, female (%) 52.8 43.6 28.2
Fertilizers use, nitrogen (1 000 t nutrients) 53 854.5 64 954.1
Fertilizers use, phosphate (1 000 t nutrients) 22 234.5 28 862.9
Fertilizers use, potash (1 000 t nutrients) 15 064.9 21 455.4
Agric. value added per worker (constant USD) 1 174 1 697 3 503
Hunger dimensions Average dietary energy supply (kcal/cap/day) 2 596 2 824
Average dietary energy supply adequacy (%) 111 119
Dietary energy supply, cereals/roots/tubers (%) 59 55
Prevalence of undernourishment (%) 17.3 11.4
Prevalence of severe food insecurity (%) 6.9
GDP per capita (USD, PPP) 4 415 7 116 11 994
Cereal import dependency ratio (%) 8.3 8.2
Stunting, children under 5 (%) 27.1 23.2
Wasting, children under 5 (%) 9.7
Safely managed drinking water (% pop. using) Food supply Food production value, net (2004–06 mill. I$) 630 659 875 322 1 185 192
Agriculture, value added (% GDP) 6 6 7
Food (excl. fish) exports (mill. USD) 44 745 69 827 183 102
Food (excl. fish) imports (mill. USD) 89 859 122 296 344 741
Production indices (2004–06 = 100) Food 72 100 136
Crops 74 100 136
Cereals 87 101 124
Vegetable oils 60 98 147
Roots and tubers 80 103 131
Fruit and vegetables 60 100 151
Sugar 97 96 132
Livestock 71 100 134
Milk 66 100 144
Meat 72 100 128
Fish 74 100 145
Net trade (mill. USD) Cereals and preparations -17 880 -14 816 -35 852
Fruit and vegetables -1 014 3 562 -8 661
Meat and meat preparations -10 201 -13 572 -36 186
Dairy products (milk equivalent) -4 601 -6 235 -14 679
Fish -6 886 -1 005 10 708
Environment Forest area (% total land area) 18 19 19
Agricultural area (% total land area) 53 53 54
Freshwater withdrawal (% internal renewable) 16.6 Terrestrial protected areas (% total land area) 12
Organic area (ha) Wood pellet production (1 000 t) 3 381
Emissions in agriculture (CO2 eq. Gg) 1 932 086 2 066 937 2 317 909
Net emissions in land use (CO2 eq. Gg) 822 033 925 201 1 276 253
50
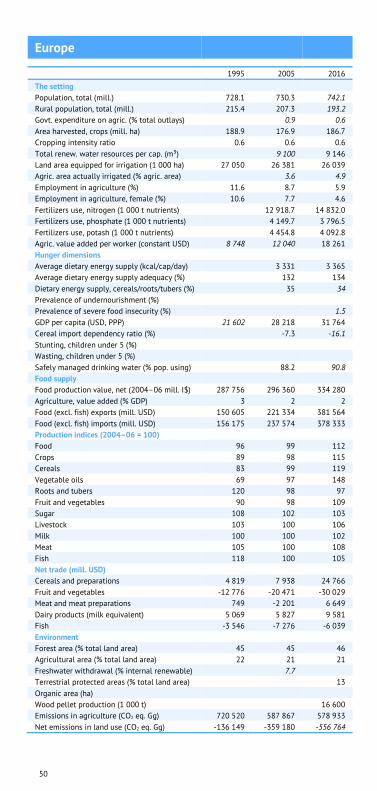
Europe
1995 2005 2016
The setting Population, total (mill.) 728.1 730.3 742.1
Rural population, total (mill.) 215.4 207.3 193.2
Govt. expenditure on agric. (% total outlays) 0.9 0.6
Area harvested, crops (mill. ha) 188.9 176.9 186.7
Cropping intensity ratio 0.6 0.6 0.6
Total renew. water resources per cap. (m³) 9 100 9 146
Land area equipped for irrigation (1 000 ha) 27 050 26 381 26 039
Agric. area actually irrigated (% agric. area) 3.6 4.9
Employment in agriculture (%) 11.6 8.7 5.9
Employment in agriculture, female (%) 10.6 7.7 4.6
Fertilizers use, nitrogen (1 000 t nutrients) 12 918.7 14 832.0
Fertilizers use, phosphate (1 000 t nutrients) 4 149.7 3 796.5
Fertilizers use, potash (1 000 t nutrients) 4 454.8 4 092.8
Agric. value added per worker (constant USD) 8 748 12 040 18 261
Hunger dimensions Average dietary energy supply (kcal/cap/day) 3 331 3 365
Average dietary energy supply adequacy (%) 132 134
Dietary energy supply, cereals/roots/tubers (%) 35 34
Prevalence of undernourishment (%) Prevalence of severe food insecurity (%) 1.5
GDP per capita (USD, PPP) 21 602 28 218 31 764
Cereal import dependency ratio (%) -7.3 -16.1
Stunting, children under 5 (%) Wasting, children under 5 (%) Safely managed drinking water (% pop. using) 88.2 90.8
Food supply Food production value, net (2004–06 mill. I$) 287 756 296 360 334 280
Agriculture, value added (% GDP) 3 2 2
Food (excl. fish) exports (mill. USD) 150 605 221 334 381 564
Food (excl. fish) imports (mill. USD) 156 175 237 574 378 333
Production indices (2004–06 = 100) Food 96 99 112
Crops 89 98 115
Cereals 83 99 119
Vegetable oils 69 97 148
Roots and tubers 120 98 97
Fruit and vegetables 90 98 109
Sugar 108 102 103
Livestock 103 100 106
Milk 100 100 102
Meat 105 100 108
Fish 118 100 105
Net trade (mill. USD) Cereals and preparations 4 819 7 938 24 766
Fruit and vegetables -12 776 -20 471 -30 029
Meat and meat preparations 749 -2 201 6 649
Dairy products (milk equivalent) 5 069 5 827 9 581
Fish -3 546 -7 276 -6 039
Environment Forest area (% total land area) 45 45 46
Agricultural area (% total land area) 22 21 21
Freshwater withdrawal (% internal renewable) 7.7 Terrestrial protected areas (% total land area) 13
Organic area (ha) Wood pellet production (1 000 t) 16 600
Emissions in agriculture (CO2 eq. Gg) 720 520 587 867 578 933
Net emissions in land use (CO2 eq. Gg) -136 149 -359 180 -556 764

51
Oceania
1995 2005 2016
The setting Population, total (mill.) 29.2 33.6 40.7
Rural population, total (mill.) 8.6 9.9 11.8
Govt. expenditure on agric. (% total outlays) Area harvested, crops (mill. ha) 19.8 26.4 24.7
Cropping intensity ratio 0.5 0.5 0.5
Total renew. water resources per cap. (m³) 28 924
Land area equipped for irrigation (1 000 ha) 2 695 3 093 3 261
Agric. area actually irrigated (% agric. area) Employment in agriculture (%) Employment in agriculture, female (%) Fertilizers use, nitrogen (1 000 t nutrients) 1 284.2 2 267.4
Fertilizers use, phosphate (1 000 t nutrients) 1 866.0 1 688.6
Fertilizers use, potash (1 000 t nutrients) 249.2 237.1
Agric. value added per worker (constant USD) Hunger dimensions Average dietary energy supply (kcal/cap/day) 2 933 3 002
Average dietary energy supply adequacy (%) 119 122
Dietary energy supply, cereals/roots/tubers (%) 21 21
Prevalence of undernourishment (%) 5.5 7.0
Prevalence of severe food insecurity (%) GDP per capita (USD, PPP) 28 837 32 698
Cereal import dependency ratio (%) -143.7 -182.1
Stunting, children under 5 (%) Wasting, children under 5 (%) Safely managed drinking water (% pop. using) Food supply Food production value, net (2004–06 mill. I$) 27 576 33 911 38 032
Agriculture, value added (% GDP) 4 3 3
Food (excl. fish) exports (mill. USD) 13 336 23 681 42 929
Food (excl. fish) imports (mill. USD) 2 961 6 148 12 921
Production indices (2004–06 = 100) Food 80 98 110
Crops 75 97 110
Cereals 72 88 90
Vegetable oils 59 98 161
Roots and tubers 82 100 107
Fruit and vegetables 73 101 107
Sugar 97 101 89
Livestock 86 100 108
Milk 71 99 117
Meat 89 101 106
Fish 70 104 103
Net trade (mill. USD) Cereals and preparations 1 498 2 771 4 825
Fruit and vegetables 837 778 2 812
Meat and meat preparations 4 138 7 926 11 330
Dairy products (milk equivalent) 2 544 5 014 8 456
Fish 1 293 1 164 1 227
Environment Forest area (% total land area) 21 21 20
Agricultural area (% total land area) 57 54 45
Freshwater withdrawal (% internal renewable) Terrestrial protected areas (% total land area) 17
Organic area (ha) Wood pellet production (1 000 t) 160
Emissions in agriculture (CO2 eq. Gg) 199 733 171 029 178 849
Net emissions in land use (CO2 eq. Gg) 36 896 78 761 -27 272
52
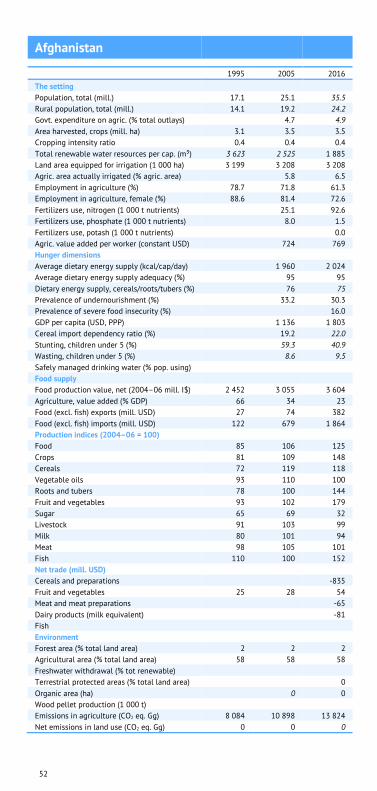
Afghanistan
1995 2005 2016
The setting Population, total (mill.) 17.1 25.1 35.5
Rural population, total (mill.) 14.1 19.2 24.2
Govt. expenditure on agric. (% total outlays) 4.7 4.9
Area harvested, crops (mill. ha) 3.1 3.5 3.5
Cropping intensity ratio 0.4 0.4 0.4
Total renewable water resources per cap. (m³) 3 623 2 525 1 885
Land area equipped for irrigation (1 000 ha) 3 199 3 208 3 208
Agric. area actually irrigated (% agric. area) 5.8 6.5
Employment in agriculture (%) 78.7 71.8 61.3
Employment in agriculture, female (%) 88.6 81.4 72.6
Fertilizers use, nitrogen (1 000 t nutrients) 25.1 92.6
Fertilizers use, phosphate (1 000 t nutrients) 8.0 1.5
Fertilizers use, potash (1 000 t nutrients) 0.0
Agric. value added per worker (constant USD) 724 769
Hunger dimensions Average dietary energy supply (kcal/cap/day) 1 960 2 024
Average dietary energy supply adequacy (%) 95 95
Dietary energy supply, cereals/roots/tubers (%) 76 75
Prevalence of undernourishment (%) 33.2 30.3
Prevalence of severe food insecurity (%) 16.0
GDP per capita (USD, PPP) 1 136 1 803
Cereal import dependency ratio (%) 19.2 22.0
Stunting, children under 5 (%) 59.3 40.9
Wasting, children under 5 (%) 8.6 9.5
Safely managed drinking water (% pop. using) Food supply Food production value, net (2004–06 mill. I$) 2 452 3 055 3 604
Agriculture, value added (% GDP) 66 34 23
Food (excl. fish) exports (mill. USD) 27 74 382
Food (excl. fish) imports (mill. USD) 122 679 1 864
Production indices (2004–06 = 100) Food 85 106 125
Crops 81 109 148
Cereals 72 119 118
Vegetable oils 93 110 100
Roots and tubers 78 100 144
Fruit and vegetables 93 102 179
Sugar 65 69 32
Livestock 91 103 99
Milk 80 101 94
Meat 98 105 101
Fish 110 100 152
Net trade (mill. USD) Cereals and preparations -835
Fruit and vegetables 25 28 54
Meat and meat preparations -65
Dairy products (milk equivalent) -81
Fish Environment Forest area (% total land area) 2 2 2
Agricultural area (% total land area) 58 58 58
Freshwater withdrawal (% tot renewable) Terrestrial protected areas (% total land area) 0
Organic area (ha) 0 0
Wood pellet production (1 000 t) Emissions in agriculture (CO2 eq. Gg) 8 084 10 898 13 824
Net emissions in land use (CO2 eq. Gg) 0 0 0

53
Albania
1995 2005 2016
The setting Population, total (mill.) 3.1 3.1 2.9
Rural population, total (mill.) 2.1 1.7 1.3
Govt. expenditure on agric. (% total outlays) 2.7 2.7
Area harvested, crops (mill. ha) 0.4 0.3 0.3
Cropping intensity ratio 0.5 0.4 0.4
Total renewable water resources per cap. (m³) 9 767 10 030 10 320
Land area equipped for irrigation (1 000 ha) 340 362 354
Agric. area actually irrigated (% agric. area) 18.1 19.6
Employment in agriculture (%) 70.3 54.0 40.7
Employment in agriculture, female (%) 79.2 67.4 47.3
Fertilizers use, nitrogen (1 000 t nutrients) 36.9 42.9
Fertilizers use, phosphate (1 000 t nutrients) 23.0 34.5
Fertilizers use, potash (1 000 t nutrients) 0.1 0.8
Agric. value added per worker (constant USD) 2 013 3 015 5 442
Hunger dimensions Average dietary energy supply (kcal/cap/day) 2 840 3 223
Average dietary energy supply adequacy (%) 116 129
Dietary energy supply, cereals/roots/tubers (%) 43 38
Prevalence of undernourishment (%) 10.9 5.5
Prevalence of severe food insecurity (%) 10.5
GDP per capita (USD, PPP) 7 733 11 356
Cereal import dependency ratio (%) 50.9 40.2
Stunting, children under 5 (%) 27.0 Wasting, children under 5 (%) 7.3 Safely managed drinking water (% pop. using) 52.5 68.9
Food supply Food production value, net (2004–06 mill. I$) 791 906 1 397
Agriculture, value added (% GDP) 57 19 20
Food (excl. fish) exports (mill. USD) 1 5 84
Food (excl. fish) imports (mill. USD) 140 346 481
Production indices (2004–06 = 100) Food 85 98 151
Crops 81 97 182
Cereals 127 101 138
Vegetable oils 89 71 225
Roots and tubers 71 103 174
Fruit and vegetables 70 99 191
Sugar 155 92 80
Livestock 89 99 113
Milk 92 100 106
Meat 91 96 114
Fish 25 96 131
Net trade (mill. USD) Cereals and preparations -27 -107 -165
Fruit and vegetables -18 -80 -16
Meat and meat preparations -22 -44 -46
Dairy products (milk equivalent) -8 -12 -23
Fish 0 3 9
Environment Forest area (% total land area) 28 29 28
Agricultural area (% total land area) 41 39 43
Freshwater withdrawal (% tot renewable) 4.3 Terrestrial protected areas (% total land area) 17
Organic area (ha) 1 1
Wood pellet production (1 000 t) 5
Emissions in agriculture (CO2 eq. Gg) 3 901 3 277 2 867
Net emissions in land use (CO2 eq. Gg) 145 890 -325

54
Algeria
1995 2005 2016
The setting Population, total (mill.) 28.9 33.3 41.3
Rural population, total (mill.) 12.9 12.3 11.8
Govt. expenditure on agric. (% total outlays) 4.2 Area harvested, crops (mill. ha) 3.7 3.8 3.8
Cropping intensity ratio 0.5 0.5 0.4
Total renewable water resources per cap. (m³) 391 341 287
Land area equipped for irrigation (1 000 ha) 558 980 1 360
Agric. area actually irrigated (% agric. area) 2.0 2.8
Employment in agriculture (%) 22.5 20.0 12.7
Employment in agriculture, female (%) 12.1 14.2 9.6
Fertilizers use, nitrogen (1 000 t nutrients) 4.1 97.1
Fertilizers use, phosphate (1 000 t nutrients) 32.5 44.4
Fertilizers use, potash (1 000 t nutrients) 19.2 23.7
Agric. value added per worker (constant USD) 4 995 5 935 14 369
Hunger dimensions Average dietary energy supply (kcal/cap/day) 2 998 3 272
Average dietary energy supply adequacy (%) 128 143
Dietary energy supply, cereals/roots/tubers (%) 59 55
Prevalence of undernourishment (%) 8.8 4.7
Prevalence of severe food insecurity (%) GDP per capita (USD, PPP) 12 323 13 921
Cereal import dependency ratio (%) 70.5 72.2
Stunting, children under 5 (%) 15.9 Wasting, children under 5 (%) 4.0 Safely managed drinking water (% pop. using) Food supply Food production value, net (2004–06 mill. I$) 3 636 5 857 8 995
Agriculture, value added (% GDP) 10 8 12
Food (excl. fish) exports (mill. USD) 92 86 373
Food (excl. fish) imports (mill. USD) 2 778 3 455 7 388
Production indices (2004–06 = 100) Food 61 99 152
Crops 55 98 154
Cereals 52 91 89
Vegetable oils 41 91 194
Roots and tubers 56 104 233
Fruit and vegetables 57 100 155
Sugar Livestock 72 100 147
Milk 48 99 164
Meat 88 100 127
Fish 82 98 75
Net trade (mill. USD) Cereals and preparations -1 245 -1 442 -3 021
Fruit and vegetables -131 -266 -797
Meat and meat preparations -63 -221 -240
Dairy products (milk equivalent) -475 -734 -976
Fish -28 -10 -103
Environment Forest area (% total land area) 1 1 1
Agricultural area (% total land area) 17 17 17
Freshwater withdrawal (% tot renewable) Terrestrial protected areas (% total land area) 8
Organic area (ha) 1 1
Wood pellet production (1 000 t) Emissions in agriculture (CO2 eq. Gg) 7 071 8 235 11 762
Net emissions in land use (CO2 eq. Gg) 972 581 -340

55
Angola
1995 2005 2016
The setting Population, total (mill.) 14.3 19.6 29.8
Rural population, total (mill.) 8.6 10.6 13.2
Govt. expenditure on agric. (% total outlays) 1.7 0.8
Area harvested, crops (mill. ha) 1.8 3.4 4.7
Cropping intensity ratio 0.5 0.9 0.9
Total renewable water resources per cap. (m³) 10 752 7 736 5 150
Land area equipped for irrigation (1 000 ha) 80 86 86
Agric. area actually irrigated (% agric. area) Employment in agriculture (%) 42.0 37.5 49.2
Employment in agriculture, female (%) 51.5 45.4 56.2
Fertilizers use, nitrogen (1 000 t nutrients) 3.7 25.4
Fertilizers use, phosphate (1 000 t nutrients) 1.5 5.4
Fertilizers use, potash (1 000 t nutrients) 2.3 8.3
Agric. value added per worker (constant USD) Hunger dimensions Average dietary energy supply (kcal/cap/day) 1 757 2 259
Average dietary energy supply adequacy (%) 84 108
Dietary energy supply, cereals/roots/tubers (%) 63 58
Prevalence of undernourishment (%) 54.8 23.9
Prevalence of severe food insecurity (%) GDP per capita (USD, PPP) 3 988 5 973
Cereal import dependency ratio (%) 61.8 64.1
Stunting, children under 5 (%) 29.2 37.6
Wasting, children under 5 (%) 8.2 4.9
Safely managed drinking water (% pop. using) Food supply Food production value, net (2004–06 mill. I$) 958 2 120 4 018
Agriculture, value added (% GDP) 7 5 8
Food (excl. fish) exports (mill. USD) 0 3 20
Food (excl. fish) imports (mill. USD) 314 934 2 047
Production indices (2004–06 = 100) Food 46 102 193
Crops 39 102 209
Cereals 39 115 202
Vegetable oils 67 104 155
Roots and tubers 29 100 129
Fruit and vegetables 47 99 380
Sugar 87 91 147
Livestock 71 103 139
Milk 76 104 111
Meat 65 102 153
Fish 55 91 219
Net trade (mill. USD) Cereals and preparations -89 -308 -683
Fruit and vegetables -24 -90 -150
Meat and meat preparations -55 -225 -505
Dairy products (milk equivalent) -33 -17 -154
Fish -4 -17 -166
Environment Forest area (% total land area) 48 47 46
Agricultural area (% total land area) 46 46 47
Freshwater withdrawal (% tot renewable) 0.5 Terrestrial protected areas (% total land area) 7
Organic area (ha) 0
Wood pellet production (1 000 t) Emissions in agriculture (CO2 eq. Gg) 26 418 30 754 31 143
Net emissions in land use (CO2 eq. Gg) 108 083 122 026 107 837

56
Antigua and Barbuda
1995 2005 2016
The setting Population, total (mill.) 0.1 0.1 0.1
Rural population, total (mill.) 0.0 0.1 0.1
Govt. expenditure on agric. (% total outlays) Area harvested, crops (mill. ha) 0.0 0.0 0.0
Cropping intensity ratio 0.4 0.5 0.5
Total renewable water resources per cap. (m³) 720 616 515
Land area equipped for irrigation (1 000 ha) 0 0 0
Agric. area actually irrigated (% agric. area) Employment in agriculture (%) Employment in agriculture, female (%) Fertilizers use, nitrogen (1 000 t nutrients) 0.0 0.0
Fertilizers use, phosphate (1 000 t nutrients) 0.0 0.0
Fertilizers use, potash (1 000 t nutrients) 0.0 0.0
Agric. value added per worker (constant USD) Hunger dimensions Average dietary energy supply (kcal/cap/day) 2 256 2 317
Average dietary energy supply adequacy (%) 94 95
Dietary energy supply, cereals/roots/tubers (%) 28 28
Prevalence of undernourishment (%) Prevalence of severe food insecurity (%) GDP per capita (USD, PPP) 20 290 21 013
Cereal import dependency ratio (%) 100.0 100.0
Stunting, children under 5 (%) Wasting, children under 5 (%) Safely managed drinking water (% pop. using) Food supply Food production value, net (2004–06 mill. I$) 9 9 7
Agriculture, value added (% GDP) 2 2 2
Food (excl. fish) exports (mill. USD) 0 0 0
Food (excl. fish) imports (mill. USD) 24 65 77
Production indices (2004–06 = 100) Food 92 95 70
Crops 102 89 112
Cereals 72 99 122
Vegetable oils 92 100 121
Roots and tubers 60 100 151
Fruit and vegetables 103 89 111
Sugar Livestock 84 101 33
Milk 85 100 37
Meat 84 102 23
Fish 56 104 107
Net trade (mill. USD) Cereals and preparations -5 -11 -13
Fruit and vegetables -3 -15 -17
Meat and meat preparations -8 -16 -18
Dairy products (milk equivalent) -3 -9 -8
Fish -1 -5 -6
Environment Forest area (% total land area) 23 22 22
Agricultural area (% total land area) 20 20 20
Freshwater withdrawal (% tot renewable) 9.8 Terrestrial protected areas (% total land area) 19
Organic area (ha) Wood pellet production (1 000 t) Emissions in agriculture (CO2 eq. Gg) 40 41 19
Net emissions in land use (CO2 eq. Gg) -18 -4 7

57
Argentina
1995 2005 2016
The setting Population, total (mill.) 35.0 39.1 44.3
Rural population, total (mill.) 4.1 3.8 3.4
Govt. expenditure on agric. (% total outlays) 0.4 0.4
Area harvested, crops (mill. ha) 20.5 28.4 36.8
Cropping intensity ratio 0.7 0.8 0.9
Total renewable water resources per cap. (m³) 24 452 21 921 19 983
Land area equipped for irrigation (1 000 ha) 1 550 1 820 2 360
Agric. area actually irrigated (% agric. area) 1.0 Employment in agriculture (%) 0.6 1.3 0.6
Employment in agriculture, female (%) 0.4 0.7 0.2
Fertilizers use, nitrogen (1 000 t nutrients) 640.4 905.7
Fertilizers use, phosphate (1 000 t nutrients) 513.2 1 024.9
Fertilizers use, potash (1 000 t nutrients) 43.9 42.6
Agric. value added per worker (constant USD) 271 610 138 113 305 181
Hunger dimensions Average dietary energy supply (kcal/cap/day) 3 083 3 250
Average dietary energy supply adequacy (%) 128 135
Dietary energy supply, cereals/roots/tubers (%) 36 35
Prevalence of undernourishment (%) 4.7 3.8
Prevalence of severe food insecurity (%) 8.7
GDP per capita (USD, PPP) 15 519 18 585
Cereal import dependency ratio (%) -172.4 -225.3
Stunting, children under 5 (%) 8.2 Wasting, children under 5 (%) 1.2 Safely managed drinking water (% pop. using) 98.0 98.5
Food supply Food production value, net (2004–06 mill. I$) 26 160 36 932 45 670
Agriculture, value added (% GDP) 5 8 6
Food (excl. fish) exports (mill. USD) 7 854 13 099 22 215
Food (excl. fish) imports (mill. USD) 775 586 1 495
Production indices (2004–06 = 100) Food 74 104 129
Crops 66 106 145
Cereals 73 115 183
Vegetable oils 59 105 149
Roots and tubers 122 95 92
Fruit and vegetables 90 102 90
Sugar 74 102 92
Livestock 91 102 107
Milk 92 104 104
Meat 91 102 107
Fish 115 92 75
Net trade (mill. USD) Cereals and preparations 1 929 3 075 7 652
Fruit and vegetables 785 1 428 2 400
Meat and meat preparations 1 104 1 597 1 439
Dairy products (milk equivalent) 213 584 619
Fish 837 742 1 517
Environment Forest area (% total land area) 12 11 10
Agricultural area (% total land area) 47 50 54
Freshwater withdrawal (% tot renewable) 3.3 Terrestrial protected areas (% total land area) 9
Organic area (ha) 2 682 2 844
Wood pellet production (1 000 t) 6
Emissions in agriculture (CO2 eq. Gg) 105 893 116 989 112 151
Net emissions in land use (CO2 eq. Gg) 70 359 91 645 100 293

58
Armenia
1995 2005 2016
The setting Population, total (mill.) 3.2 3.0 2.9
Rural population, total (mill.) 1.1 1.1 1.1
Govt. expenditure on agric. (% total outlays) 3.3
Area harvested, crops (mill. ha) 0.2 0.3 0.3
Cropping intensity ratio 0.5 0.6 0.7
Total renewable water resources per cap. (m³) 2 476 2 600 2 656
Land area equipped for irrigation (1 000 ha) 280 274 274
Agric. area actually irrigated (% agric. area) 9.6 9.2
Employment in agriculture (%) 51.7 40.6 34.1
Employment in agriculture, female (%) 54.6 47.1 38.3
Fertilizers use, nitrogen (1 000 t nutrients) 10.3 48.1
Fertilizers use, phosphate (1 000 t nutrients) 0.0 0.4
Fertilizers use, potash (1 000 t nutrients) 0.0 0.8
Agric. value added per worker (constant USD) 1 422 3 470 6 161
Hunger dimensions Average dietary energy supply (kcal/cap/day) 2 659 2 928
Average dietary energy supply adequacy (%) 109 120
Dietary energy supply, cereals/roots/tubers (%) 51 40
Prevalence of undernourishment (%) 7.8 4.3
Prevalence of severe food insecurity (%) 3.8
GDP per capita (USD, PPP) 5 357 8 190
Cereal import dependency ratio (%) 55.2 60.1
Stunting, children under 5 (%) 18.2 9.4
Wasting, children under 5 (%) 5.5 4.2
Safely managed drinking water (% pop. using) 43.9 60.6
Food supply Food production value, net (2004–06 mill. I$) 518 946 1 181
Agriculture, value added (% GDP) 38 18 16
Food (excl. fish) exports (mill. USD) 2 14 109
Food (excl. fish) imports (mill. USD) 204 198 390
Production indices (2004–06 = 100) Food 59 108 135
Crops 59 113 125
Cereals 67 115 180
Vegetable oils 101 55 427
Roots and tubers 76 101 100
Fruit and vegetables 56 115 122
Sugar 6 120 503
Livestock 57 100 144
Milk 32 103 156
Meat 84 96 142
Fish 170 87 1 763
Net trade (mill. USD) Cereals and preparations -66 -68 -103
Fruit and vegetables -9 -11 25
Meat and meat preparations -12 -27 -38
Dairy products (milk equivalent) -40 -10 -20
Fish -1 -1 7
Environment Forest area (% total land area) 12 12 12
Agricultural area (% total land area) 44 56 59
Freshwater withdrawal (% tot renewable) 37.7 36.8 42.1
Terrestrial protected areas (% total land area) 23
Organic area (ha) 0 1
Wood pellet production (1 000 t) 0
Emissions in agriculture (CO2 eq. Gg) 1 013 1 147 1 454
Net emissions in land use (CO2 eq. Gg) 129 118 -146

59
Australia
1995 2005 2016
The setting Population, total (mill.) 18.1 20.2 24.5
Rural population, total (mill.) 2.5 2.5 2.5
Govt. expenditure on agric. (% total outlays) 0.8 0.5
Area harvested, crops (mill. ha) 18.2 24.6 22.7
Cropping intensity ratio 0.5 0.5 0.5
Total renewable water resources per cap. (m³) 26 576 23 455 20 393
Land area equipped for irrigation (1 000 ha) 2 400 2 545 2 546
Agric. area actually irrigated (% agric. area) 0.5 0.6
Employment in agriculture (%) 4.9 3.6 2.6
Employment in agriculture, female (%) 3.6 2.5 1.7
Fertilizers use, nitrogen (1 000 t nutrients) 952.3 1 807.7
Fertilizers use, phosphate (1 000 t nutrients) 1 041.6 1 143.5
Fertilizers use, potash (1 000 t nutrients) 222.0 184.8
Agric. value added per worker (constant USD) 32 999 63 929 79 293
Hunger dimensions Average dietary energy supply (kcal/cap/day) 3 103 3 287
Average dietary energy supply adequacy (%) 124 132
Dietary energy supply, cereals/roots/tubers (%) 24 25
Prevalence of undernourishment (%) <2.5 <2.5
Prevalence of severe food insecurity (%) 3.2
GDP per capita (USD, PPP) 38 928 44 494
Cereal import dependency ratio (%) -164.8 -214.8
Stunting, children under 5 (%) 2.0 Wasting, children under 5 (%) 0.0 Safely managed drinking water (% pop. using) Food supply Food production value, net (2004–06 mill. I$) 17 957 21 791 23 469
Agriculture, value added (% GDP) 3 3 2
Food (excl. fish) exports (mill. USD) 8 223 13 861 25 107
Food (excl. fish) imports (mill. USD) 1 548 3 713 8 239
Production indices (2004–06 = 100) Food 81 98 106
Crops 73 96 107
Cereals 71 88 89
Vegetable oils 47 103 178
Roots and tubers 85 100 91
Fruit and vegetables 63 103 97
Sugar 94 101 92
Livestock 92 101 102
Milk 84 100 76
Meat 88 102 112
Fish 85 105 101
Net trade (mill. USD) Cereals and preparations 1 742 2 994 4 966
Fruit and vegetables 258 48 1 176
Meat and meat preparations 2 685 4 946 7 679
Dairy products (milk equivalent) 902 1 541 945
Fish 428 111 -433
Environment Forest area (% total land area) 17 17 16
Agricultural area (% total land area) 60 58 48
Freshwater withdrawal (% tot renewable) 4.5 3.8 3.4
Terrestrial protected areas (% total land area) 17
Organic area (ha) 11 716 27 145
Wood pellet production (1 000 t) 110
Emissions in agriculture (CO2 eq. Gg) 153 097 124 514 132 543
Net emissions in land use (CO2 eq. Gg) 1 237 44 741 -66 377

60
Austria
1995 2005 2016
The setting Population, total (mill.) 8.0 8.3 8.7
Rural population, total (mill.) 2.7 2.8 2.9
Govt. expenditure on agric. (% total outlays) Area harvested, crops (mill. ha) 1.1 1.1 1.1
Cropping intensity ratio 0.8 0.8 0.8
Total renewable water resources per cap. (m³) 9 694 9 360 8 919
Land area equipped for irrigation (1 000 ha) 96 120 100
Agric. area actually irrigated (% agric. area) 1.4 1.4
Employment in agriculture (%) 7.3 5.3 4.3
Employment in agriculture, female (%) 8.2 5.3 3.9
Fertilizers use, nitrogen (1 000 t nutrients) 101.8 116.6
Fertilizers use, phosphate (1 000 t nutrients) 38.6 39.8
Fertilizers use, potash (1 000 t nutrients) 47.0 34.3
Agric. value added per worker (constant USD) 16 608 24 256 28 957
Hunger dimensions Average dietary energy supply (kcal/cap/day) 3 655 3 768
Average dietary energy supply adequacy (%) 144 148
Dietary energy supply, cereals/roots/tubers (%) 27 26
Prevalence of undernourishment (%) <2.5 <2.5
Prevalence of severe food insecurity (%) 1.2
GDP per capita (USD, PPP) 41 283 44 464
Cereal import dependency ratio (%) -4.6 10.5
Stunting, children under 5 (%) Wasting, children under 5 (%) Safely managed drinking water (% pop. using) 98.1 98.7
Food supply Food production value, net (2004–06 mill. I$) 3 846 4 040 4 096
Agriculture, value added (% GDP) 2 1 1
Food (excl. fish) exports (mill. USD) 1 716 5 051 7 872
Food (excl. fish) imports (mill. USD) 2 923 5 952 9 351
Production indices (2004–06 = 100) Food 95 100 101
Crops 90 99 91
Cereals 89 100 118
Vegetable oils 143 94 124
Roots and tubers 102 109 110
Fruit and vegetables 84 94 55
Sugar 102 109 125
Livestock 97 101 108
Milk 100 99 123
Meat 95 102 100
Fish 120 101 138
Net trade (mill. USD) Cereals and preparations -85 -47 -18
Fruit and vegetables -818 -969 -1 482
Meat and meat preparations -22 192 334
Dairy products (milk equivalent) 46 418 404
Fish -170 -256 -487
Environment Forest area (% total land area) 46 47 47
Agricultural area (% total land area) 36 35 32
Freshwater withdrawal (% tot renewable) 4.7 4.7 Terrestrial protected areas (% total land area) 28
Organic area (ha) 480 571
Wood pellet production (1 000 t) 1 071
Emissions in agriculture (CO2 eq. Gg) 7 866 6 875 6 783
Net emissions in land use (CO2 eq. Gg) -11 858 -7 092 -4 892

61
Azerbaijan
1995 2005 2016
The setting Population, total (mill.) 7.8 8.5 9.8
Rural population, total (mill.) 3.7 4.1 4.4
Govt. expenditure on agric. (% total outlays) 2.5 2.7
Area harvested, crops (mill. ha) 1.1 1.2 1.4
Cropping intensity ratio 0.5 0.6 0.6
Total renewable water resources per cap. (m³) 4 378 3 958 3 566
Land area equipped for irrigation (1 000 ha) 1 454 1 433 1 439
Agric. area actually irrigated (% agric. area) 30.1 29.8
Employment in agriculture (%) 44.9 40.5 36.3
Employment in agriculture, female (%) 45.2 44.6 42.1
Fertilizers use, nitrogen (1 000 t nutrients) 17.6 26.4
Fertilizers use, phosphate (1 000 t nutrients) 3.2 0.5
Fertilizers use, potash (1 000 t nutrients) 3.8 1.3
Agric. value added per worker (constant USD) 1 064 1 768 2 139
Hunger dimensions Average dietary energy supply (kcal/cap/day) 2 829 3 131
Average dietary energy supply adequacy (%) 117 130
Dietary energy supply, cereals/roots/tubers (%) 66 62
Prevalence of undernourishment (%) 5.5 <2.5
Prevalence of severe food insecurity (%) GDP per capita (USD, PPP) 8 052 16 001
Cereal import dependency ratio (%) 38.2 38.4
Stunting, children under 5 (%) 26.8 18.0
Wasting, children under 5 (%) 6.8 3.1
Safely managed drinking water (% pop. using) 56.8 71.5
Food supply Food production value, net (2004–06 mill. I$) 991 1 848 2 649
Agriculture, value added (% GDP) 25 9 6
Food (excl. fish) exports (mill. USD) 14 234 375
Food (excl. fish) imports (mill. USD) 253 328 871
Production indices (2004–06 = 100) Food 55 103 148
Crops 58 107 122
Cereals 42 100 143
Vegetable oils 91 116 78
Roots and tubers 17 109 88
Fruit and vegetables 56 103 135
Sugar 32 42 360
Livestock 62 101 182
Milk 73 101 177
Meat 50 100 189
Fish 140 120 17
Net trade (mill. USD) Cereals and preparations -43 -157 -402
Fruit and vegetables -1 166 242
Meat and meat preparations -35 -24 -44
Dairy products (milk equivalent) -40 -15 -81
Fish 0 2 -23
Environment Forest area (% total land area) 10 11 14
Agricultural area (% total land area) 54 58 58
Freshwater withdrawal (% tot renewable) 36.1 35.2 Terrestrial protected areas (% total land area) 10
Organic area (ha) 20 38
Wood pellet production (1 000 t) 0
Emissions in agriculture (CO2 eq. Gg) 3 783 5 398 6 505
Net emissions in land use (CO2 eq. Gg) -1 146 -946 -8 472
62
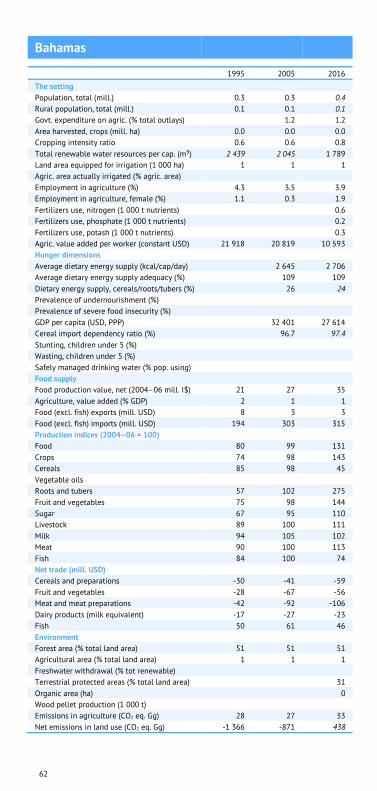
Bahamas
1995 2005 2016
The setting Population, total (mill.) 0.3 0.3 0.4
Rural population, total (mill.) 0.1 0.1 0.1
Govt. expenditure on agric. (% total outlays) 1.2 1.2
Area harvested, crops (mill. ha) 0.0 0.0 0.0
Cropping intensity ratio 0.6 0.6 0.8
Total renewable water resources per cap. (m³) 2 439 2 045 1 789
Land area equipped for irrigation (1 000 ha) 1 1 1
Agric. area actually irrigated (% agric. area) Employment in agriculture (%) 4.3 3.5 3.9
Employment in agriculture, female (%) 1.1 0.3 1.9
Fertilizers use, nitrogen (1 000 t nutrients) 0.6
Fertilizers use, phosphate (1 000 t nutrients) 0.2
Fertilizers use, potash (1 000 t nutrients) 0.3
Agric. value added per worker (constant USD) 21 918 20 819 10 593
Hunger dimensions Average dietary energy supply (kcal/cap/day) 2 645 2 706
Average dietary energy supply adequacy (%) 109 109
Dietary energy supply, cereals/roots/tubers (%) 26 24
Prevalence of undernourishment (%) Prevalence of severe food insecurity (%) GDP per capita (USD, PPP) 32 401 27 614
Cereal import dependency ratio (%) 96.7 97.4
Stunting, children under 5 (%) Wasting, children under 5 (%) Safely managed drinking water (% pop. using) Food supply Food production value, net (2004–06 mill. I$) 21 27 35
Agriculture, value added (% GDP) 2 1 1
Food (excl. fish) exports (mill. USD) 8 3 3
Food (excl. fish) imports (mill. USD) 194 303 315
Production indices (2004–06 = 100) Food 80 99 131
Crops 74 98 143
Cereals 85 98 45
Vegetable oils Roots and tubers 57 102 275
Fruit and vegetables 75 98 144
Sugar 67 95 110
Livestock 89 100 111
Milk 94 105 102
Meat 90 100 113
Fish 84 100 74
Net trade (mill. USD) Cereals and preparations -30 -41 -59
Fruit and vegetables -28 -67 -56
Meat and meat preparations -42 -92 -106
Dairy products (milk equivalent) -17 -27 -23
Fish 50 61 46
Environment Forest area (% total land area) 51 51 51
Agricultural area (% total land area) 1 1 1
Freshwater withdrawal (% tot renewable) Terrestrial protected areas (% total land area) 31
Organic area (ha) 0
Wood pellet production (1 000 t) Emissions in agriculture (CO2 eq. Gg) 28 27 33
Net emissions in land use (CO2 eq. Gg) -1 366 -871 438

63
Bahrain
1995 2005 2016
The setting Population, total (mill.) 0.6 0.9 1.5
Rural population, total (mill.) 0.1 0.1 0.2
Govt. expenditure on agric. (% total outlays) 0.4 Area harvested, crops (mill. ha) 0.0 0.0 0.0
Cropping intensity ratio 0.5 0.6 1.2
Total renewable water resources per cap. (m³) 194 113 81
Land area equipped for irrigation (1 000 ha) 4 4 4
Agric. area actually irrigated (% agric. area) Employment in agriculture (%) 1.9 1.3 1.0
Employment in agriculture, female (%) 0.2 0.1 0.0
Fertilizers use, nitrogen (1 000 t nutrients) 4.2 0.6
Fertilizers use, phosphate (1 000 t nutrients) 0.0 0.2
Fertilizers use, potash (1 000 t nutrients) 0.2 1.4
Agric. value added per worker (constant USD) 11 648 11 842
Hunger dimensions Average dietary energy supply (kcal/cap/day) Average dietary energy supply adequacy (%) Dietary energy supply, cereals/roots/tubers (%) Prevalence of undernourishment (%) Prevalence of severe food insecurity (%) GDP per capita (USD, PPP) 43 202 43 643
Cereal import dependency ratio (%) Stunting, children under 5 (%) Wasting, children under 5 (%) Safely managed drinking water (% pop. using) 98.7 98.7
Food supply Food production value, net (2004–06 mill. I$) 25 19 42
Agriculture, value added (% GDP) 1 0 0
Food (excl. fish) exports (mill. USD) 101 29 261
Food (excl. fish) imports (mill. USD) 276 496 1 386
Production indices (2004–06 = 100) Food 121 92 201
Crops 110 86 104
Cereals Vegetable oils Roots and tubers 308 28 189
Fruit and vegetables 113 86 105
Sugar Livestock 139 101 360
Milk 125 116 104
Meat 165 82 1 007
Fish 67 85 107
Net trade (mill. USD) Cereals and preparations -43 -77 -198
Fruit and vegetables -68 -109 -349
Meat and meat preparations -39 -72 -259
Dairy products (milk equivalent) -41 -78 -190
Fish 0 2 -17
Environment Forest area (% total land area) 0 1 1
Agricultural area (% total land area) 13 12 11
Freshwater withdrawal (% tot renewable) 205.8 Terrestrial protected areas (% total land area) 7
Organic area (ha) Wood pellet production (1 000 t) Emissions in agriculture (CO2 eq. Gg) 29 58 35
Net emissions in land use (CO2 eq. Gg) -3 -3 -5
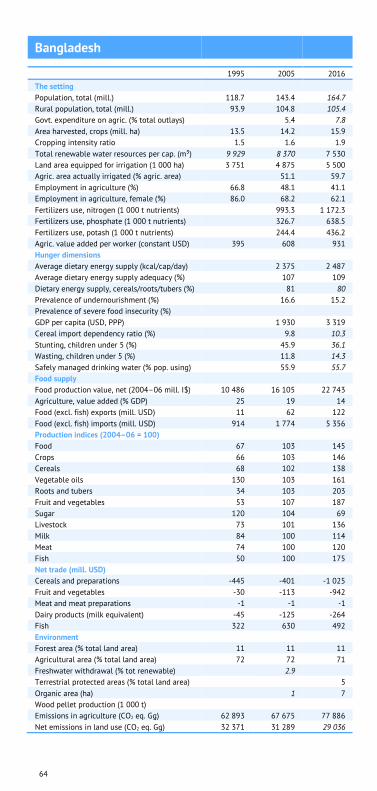
64
Bangladesh
1995 2005 2016
The setting Population, total (mill.) 118.7 143.4 164.7
Rural population, total (mill.) 93.9 104.8 105.4
Govt. expenditure on agric. (% total outlays) 5.4 7.8
Area harvested, crops (mill. ha) 13.5 14.2 15.9
Cropping intensity ratio 1.5 1.6 1.9
Total renewable water resources per cap. (m³) 9 929 8 370 7 530
Land area equipped for irrigation (1 000 ha) 3 751 4 875 5 500
Agric. area actually irrigated (% agric. area) 51.1 59.7
Employment in agriculture (%) 66.8 48.1 41.1
Employment in agriculture, female (%) 86.0 68.2 62.1
Fertilizers use, nitrogen (1 000 t nutrients) 993.3 1 172.3
Fertilizers use, phosphate (1 000 t nutrients) 326.7 638.5
Fertilizers use, potash (1 000 t nutrients) 244.4 436.2
Agric. value added per worker (constant USD) 395 608 931
Hunger dimensions Average dietary energy supply (kcal/cap/day) 2 375 2 487
Average dietary energy supply adequacy (%) 107 109
Dietary energy supply, cereals/roots/tubers (%) 81 80
Prevalence of undernourishment (%) 16.6 15.2
Prevalence of severe food insecurity (%) GDP per capita (USD, PPP) 1 930 3 319
Cereal import dependency ratio (%) 9.8 10.3
Stunting, children under 5 (%) 45.9 36.1
Wasting, children under 5 (%) 11.8 14.3
Safely managed drinking water (% pop. using) 55.9 55.7
Food supply Food production value, net (2004–06 mill. I$) 10 486 16 105 22 743
Agriculture, value added (% GDP) 25 19 14
Food (excl. fish) exports (mill. USD) 11 62 122
Food (excl. fish) imports (mill. USD) 914 1 774 5 356
Production indices (2004–06 = 100) Food 67 103 145
Crops 66 103 146
Cereals 68 102 138
Vegetable oils 130 103 161
Roots and tubers 34 103 203
Fruit and vegetables 53 107 187
Sugar 120 104 69
Livestock 73 101 136
Milk 84 100 114
Meat 74 100 120
Fish 50 100 175
Net trade (mill. USD) Cereals and preparations -445 -401 -1 025
Fruit and vegetables -30 -113 -942
Meat and meat preparations -1 -1 -1
Dairy products (milk equivalent) -45 -125 -264
Fish 322 630 492
Environment Forest area (% total land area) 11 11 11
Agricultural area (% total land area) 72 72 71
Freshwater withdrawal (% tot renewable) 2.9 Terrestrial protected areas (% total land area) 5
Organic area (ha) 1 7
Wood pellet production (1 000 t) Emissions in agriculture (CO2 eq. Gg) 62 893 67 675 77 886
Net emissions in land use (CO2 eq. Gg) 32 371 31 289 29 036

65
Barbados
1995 2005 2016
The setting Population, total (mill.) 0.3 0.3 0.3
Rural population, total (mill.) 0.2 0.2 0.2
Govt. expenditure on agric. (% total outlays) 2.2 Area harvested, crops (mill. ha) 0.0 0.0 0.0
Cropping intensity ratio 0.8 0.7 0.6
Total renewable water resources per cap. (m³) 300 290 281
Land area equipped for irrigation (1 000 ha) 5 5 5
Agric. area actually irrigated (% agric. area) Employment in agriculture (%) 4.6 2.4 2.9
Employment in agriculture, female (%) 3.6 0.3 1.8
Fertilizers use, nitrogen (1 000 t nutrients) 1.2 0.3
Fertilizers use, phosphate (1 000 t nutrients) 0.1 0.3
Fertilizers use, potash (1 000 t nutrients) 0.1 0.2
Agric. value added per worker (constant USD) 12 267 19 290 13 489
Hunger dimensions Average dietary energy supply (kcal/cap/day) 2 832 2 979
Average dietary energy supply adequacy (%) 115 121
Dietary energy supply, cereals/roots/tubers (%) 32 32
Prevalence of undernourishment (%) 5.9 3.7
Prevalence of severe food insecurity (%) GDP per capita (USD, PPP) 16 152 16 741
Cereal import dependency ratio (%) 100.0 100.0
Stunting, children under 5 (%) Wasting, children under 5 (%) Safely managed drinking water (% pop. using) Food supply Food production value, net (2004–06 mill. I$) 47 51 41
Agriculture, value added (% GDP) 3 2 1
Food (excl. fish) exports (mill. USD) 53 46 38
Food (excl. fish) imports (mill. USD) 109 171 250
Production indices (2004–06 = 100) Food 97 106 85
Crops 109 110 46
Cereals 425 100 37
Vegetable oils 131 100 111
Roots and tubers 283 103 87
Fruit and vegetables 137 98 86
Sugar 93 115 22
Livestock 90 103 111
Milk 128 102 74
Meat 88 105 105
Fish 170 104 83
Net trade (mill. USD) Cereals and preparations -20 -29 -39
Fruit and vegetables -18 -36 -50
Meat and meat preparations -15 -19 -30
Dairy products (milk equivalent) -10 -17 -22
Fish -7 -16 -23
Environment Forest area (% total land area) 15 15 15
Agricultural area (% total land area) 44 37 23
Freshwater withdrawal (% tot renewable) 101.2 87.5 Terrestrial protected areas (% total land area) 1
Organic area (ha) Wood pellet production (1 000 t) Emissions in agriculture (CO2 eq. Gg) 93 59 53
Net emissions in land use (CO2 eq. Gg) -18 -12 4

66
Belarus
1995 2005 2016
The setting Population, total (mill.) 10.1 9.6 9.5
Rural population, total (mill.) 3.3 2.7 2.1
Govt. expenditure on agric. (% total outlays) 14.3 4.3
Area harvested, crops (mill. ha) 3.9 3.3 3.2
Cropping intensity ratio 0.6 0.6 0.6
Total renewable water resources per cap. (m³) 5 738 6 059 6 108
Land area equipped for irrigation (1 000 ha) 131 115 31
Agric. area actually irrigated (% agric. area) 1.3 0.4
Employment in agriculture (%) 23.7 13.9 9.7
Employment in agriculture, female (%) 18.7 10.2 6.6
Fertilizers use, nitrogen (1 000 t nutrients) 406.0 348.5
Fertilizers use, phosphate (1 000 t nutrients) 129.5 76.3
Fertilizers use, potash (1 000 t nutrients) 393.9 408.6
Agric. value added per worker (constant USD) 2 973 6 022 11 631
Hunger dimensions Average dietary energy supply (kcal/cap/day) 2 990 3 236
Average dietary energy supply adequacy (%) 119 131
Dietary energy supply, cereals/roots/tubers (%) 43 36
Prevalence of undernourishment (%) 3.0 <2.5
Prevalence of severe food insecurity (%) GDP per capita (USD, PPP) 11 213 16 773
Cereal import dependency ratio (%) 10.9 1.9
Stunting, children under 5 (%) 4.5 Wasting, children under 5 (%) 2.2 Safely managed drinking water (% pop. using) 82.0 94.4
Food supply Food production value, net (2004–06 mill. I$) 3 598 3 925 5 418
Agriculture, value added (% GDP) 15 8 7
Food (excl. fish) exports (mill. USD) 210 1 167 3 673
Food (excl. fish) imports (mill. USD) 449 903 2 857
Production indices (2004–06 = 100) Food 89 97 134
Crops 76 94 100
Cereals 76 100 127
Vegetable oils 33 107 143
Roots and tubers 97 92 64
Fruit and vegetables 54 92 118
Sugar 35 91 127
Livestock 94 101 148
Milk 81 103 140
Meat 105 101 161
Fish 93 94 178
Net trade (mill. USD) Cereals and preparations -86 -132 -69
Fruit and vegetables -59 -148 -1 200
Meat and meat preparations 30 170 717
Dairy products (milk equivalent) 63 465 1 736
Fish -31 -142 -104
Environment Forest area (% total land area) 40 42 43
Agricultural area (% total land area) 46 44 42
Freshwater withdrawal (% tot renewable) 3.4 2.9 2.6
Terrestrial protected areas (% total land area) 10
Organic area (ha) Wood pellet production (1 000 t) 148
Emissions in agriculture (CO2 eq. Gg) 21 284 18 892 19 703
Net emissions in land use (CO2 eq. Gg) -9 955 -18 240 -557
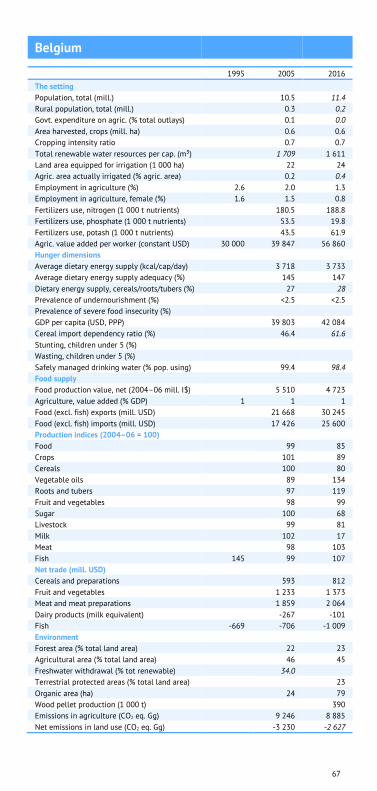
67
Belgium
1995 2005 2016
The setting Population, total (mill.) 10.5 11.4
Rural population, total (mill.) 0.3 0.2
Govt. expenditure on agric. (% total outlays) 0.1 0.0
Area harvested, crops (mill. ha) 0.6 0.6
Cropping intensity ratio 0.7 0.7
Total renewable water resources per cap. (m³) 1 709 1 611
Land area equipped for irrigation (1 000 ha) 22 24
Agric. area actually irrigated (% agric. area) 0.2 0.4
Employment in agriculture (%) 2.6 2.0 1.3
Employment in agriculture, female (%) 1.6 1.5 0.8
Fertilizers use, nitrogen (1 000 t nutrients) 180.5 188.8
Fertilizers use, phosphate (1 000 t nutrients) 53.5 19.8
Fertilizers use, potash (1 000 t nutrients) 43.5 61.9
Agric. value added per worker (constant USD) 30 000 39 847 56 860
Hunger dimensions Average dietary energy supply (kcal/cap/day) 3 718 3 733
Average dietary energy supply adequacy (%) 145 147
Dietary energy supply, cereals/roots/tubers (%) 27 28
Prevalence of undernourishment (%) <2.5 <2.5
Prevalence of severe food insecurity (%) GDP per capita (USD, PPP) 39 803 42 084
Cereal import dependency ratio (%) 46.4 61.6
Stunting, children under 5 (%) Wasting, children under 5 (%) Safely managed drinking water (% pop. using) 99.4 98.4
Food supply Food production value, net (2004–06 mill. I$) 5 510 4 723
Agriculture, value added (% GDP) 1 1 1
Food (excl. fish) exports (mill. USD) 21 668 30 245
Food (excl. fish) imports (mill. USD) 17 426 25 600
Production indices (2004–06 = 100) Food 99 85
Crops 101 89
Cereals 100 80
Vegetable oils 89 134
Roots and tubers 97 119
Fruit and vegetables 98 99
Sugar 100 68
Livestock 99 81
Milk 102 17
Meat 98 103
Fish 145 99 107
Net trade (mill. USD) Cereals and preparations 593 812
Fruit and vegetables 1 233 1 373
Meat and meat preparations 1 859 2 064
Dairy products (milk equivalent) -267 -101
Fish -669 -706 -1 009
Environment Forest area (% total land area) 22 23
Agricultural area (% total land area) 46 45
Freshwater withdrawal (% tot renewable) 34.0 Terrestrial protected areas (% total land area) 23
Organic area (ha) 24 79
Wood pellet production (1 000 t) 390
Emissions in agriculture (CO2 eq. Gg) 9 246 8 885
Net emissions in land use (CO2 eq. Gg) -3 230 -2 627

68
Belize
1995 2005 2016
The setting Population, total (mill.) 0.2 0.3 0.4
Rural population, total (mill.) 0.1 0.1 0.2
Govt. expenditure on agric. (% total outlays) Area harvested, crops (mill. ha) 0.1 0.1 0.1
Cropping intensity ratio 0.8 0.8 0.9
Total renewable water resources per cap. (m³) 98 060 72 822 59 217
Land area equipped for irrigation (1 000 ha) 3 4 4
Agric. area actually irrigated (% agric. area) Employment in agriculture (%) 27.2 19.6 15.0
Employment in agriculture, female (%) 5.8 3.3 3.1
Fertilizers use, nitrogen (1 000 t nutrients) 4.1 16.8
Fertilizers use, phosphate (1 000 t nutrients) 1.5 12.7
Fertilizers use, potash (1 000 t nutrients) 0.0 6.8
Agric. value added per worker (constant USD) 4 781 9 351 5 345
Hunger dimensions Average dietary energy supply (kcal/cap/day) 2 798 2 762
Average dietary energy supply adequacy (%) 128 122
Dietary energy supply, cereals/roots/tubers (%) 39 38
Prevalence of undernourishment (%) 4.6 6.5
Prevalence of severe food insecurity (%) GDP per capita (USD, PPP) 7 873 7 919
Cereal import dependency ratio (%) 32.5 10.4
Stunting, children under 5 (%) 22.2 15.0
Wasting, children under 5 (%) 1.9 1.8
Safely managed drinking water (% pop. using) Food supply Food production value, net (2004–06 mill. I$) 111 168 156
Agriculture, value added (% GDP) 17 13 9
Food (excl. fish) exports (mill. USD) 107 134 125
Food (excl. fish) imports (mill. USD) 37 49 95
Production indices (2004–06 = 100) Food 67 101 94
Crops 70 102 92
Cereals 72 123 148
Vegetable oils 210 122 708
Roots and tubers 124 97 68
Fruit and vegetables 60 106 66
Sugar 95 86 134
Livestock 56 98 118
Milk 38 109 158
Meat 54 98 112
Fish 8 87 72
Net trade (mill. USD) Cereals and preparations -8 -13 -20
Fruit and vegetables 51 91 53
Meat and meat preparations -4 -4 -11
Dairy products (milk equivalent) -9 -12 -16
Fish 15 40 21
Environment Forest area (% total land area) 67 62 60
Agricultural area (% total land area) 6 7 7
Freshwater withdrawal (% tot renewable) Terrestrial protected areas (% total land area) 38
Organic area (ha) 2 0
Wood pellet production (1 000 t) Emissions in agriculture (CO2 eq. Gg) 184 238 416
Net emissions in land use (CO2 eq. Gg) 5 258 7 052 2 778

69
Benin
1995 2005 2016
The setting Population, total (mill.) 5.9 8.0 11.2
Rural population, total (mill.) 3.8 4.9 6.3
Govt. expenditure on agric. (% total outlays) Area harvested, crops (mill. ha) 1.7 2.3 3.3
Cropping intensity ratio 0.9 0.8 1.0
Total renewable water resources per cap. (m³) 4 149 3 031 2 427
Land area equipped for irrigation (1 000 ha) 10 18 23
Agric. area actually irrigated (% agric. area) 0.3 Employment in agriculture (%) 52.3 47.5 41.3
Employment in agriculture, female (%) 43.8 39.5 33.7
Fertilizers use, nitrogen (1 000 t nutrients) 0.4 18.2
Fertilizers use, phosphate (1 000 t nutrients) 0.4 10.8
Fertilizers use, potash (1 000 t nutrients) 0.4 10.8
Agric. value added per worker (constant USD) 688 904 1 068
Hunger dimensions Average dietary energy supply (kcal/cap/day) 2 449 2 699
Average dietary energy supply adequacy (%) 113 123
Dietary energy supply, cereals/roots/tubers (%) 73 71
Prevalence of undernourishment (%) 15.4 10.4
Prevalence of severe food insecurity (%) GDP per capita (USD, PPP) 1 736 2 010
Cereal import dependency ratio (%) 31.9 41.6
Stunting, children under 5 (%) 44.7 34.0
Wasting, children under 5 (%) 8.4 4.5
Safely managed drinking water (% pop. using) Food supply Food production value, net (2004–06 mill. I$) 893 1 475 2 290
Agriculture, value added (% GDP) 21 25 21
Food (excl. fish) exports (mill. USD) 26 67 103
Food (excl. fish) imports (mill. USD) 140 236 1 154
Production indices (2004–06 = 100) Food 63 104 162
Crops 67 104 158
Cereals 63 104 175
Vegetable oils 67 105 139
Roots and tubers 54 102 159
Fruit and vegetables 70 108 170
Sugar 24 97 18
Livestock 74 101 136
Milk 73 100 129
Meat 77 100 137
Fish 117 84 139
Net trade (mill. USD) Cereals and preparations -79 -106 -816
Fruit and vegetables -1 7 36
Meat and meat preparations -14 -49 -170
Dairy products (milk equivalent) -8 -16 -10
Fish -8 -15 -75
Environment Forest area (% total land area) 48 43 38
Agricultural area (% total land area) 22 31 33
Freshwater withdrawal (% tot renewable) Terrestrial protected areas (% total land area) 29
Organic area (ha) 0 6
Wood pellet production (1 000 t) Emissions in agriculture (CO2 eq. Gg) 3 628 5 403 5 694
Net emissions in land use (CO2 eq. Gg) 15 212 10 984 10 841

70
Bhutan
1995 2005 2016
The setting Population, total (mill.) 0.5 0.7 0.8
Rural population, total (mill.) 0.4 0.4 0.5
Govt. expenditure on agric. (% total outlays) 11.0 12.6
Area harvested, crops (mill. ha) 0.2 0.1 0.1
Cropping intensity ratio 0.9 0.7 1.0
Total renewable water resources per cap. (m³) 155 500 114 453 97 773
Land area equipped for irrigation (1 000 ha) 27 27 33
Agric. area actually irrigated (% agric. area) Employment in agriculture (%) 83.1 70.3 56.8
Employment in agriculture, female (%) 91.8 80.3 65.4
Fertilizers use, nitrogen (1 000 t nutrients) 0.9 0.8
Fertilizers use, phosphate (1 000 t nutrients) 0.2 0.3
Fertilizers use, potash (1 000 t nutrients) 0.2 0.2
Agric. value added per worker (constant USD) 1 261 1 201 1 483
Hunger dimensions Average dietary energy supply (kcal/cap/day) Average dietary energy supply adequacy (%) Dietary energy supply, cereals/roots/tubers (%) Prevalence of undernourishment (%) Prevalence of severe food insecurity (%) GDP per capita (USD, PPP) 4 522 8 253
Cereal import dependency ratio (%) Stunting, children under 5 (%) 34.9 Wasting, children under 5 (%) 4.7 Safely managed drinking water (% pop. using) 30.1 34.2
Food supply Food production value, net (2004–06 mill. I$) 166 214 207
Agriculture, value added (% GDP) 32 22 17
Food (excl. fish) exports (mill. USD) 13 2 20
Food (excl. fish) imports (mill. USD) 17 15 72
Production indices (2004–06 = 100) Food 82 106 102
Crops 67 107 109
Cereals 82 108 101
Vegetable oils 44 132 22
Roots and tubers 70 98 107
Fruit and vegetables 49 106 88
Sugar 100 99 113
Livestock 102 103 93
Milk 104 105 85
Meat 96 98 102
Fish 162 100 242
Net trade (mill. USD) Cereals and preparations -9 -8 -18
Fruit and vegetables 8 0 9
Meat and meat preparations 0 0 -9
Dairy products (milk equivalent) -1 -2 -16
Fish 0 -2 -5
Environment Forest area (% total land area) 64 70 72
Agricultural area (% total land area) 14 16 14
Freshwater withdrawal (% tot renewable) 0.4 Terrestrial protected areas (% total land area) 48
Organic area (ha) 0 7
Wood pellet production (1 000 t) Emissions in agriculture (CO2 eq. Gg) 573 563 452
Net emissions in land use (CO2 eq. Gg) -4 087 -4 397 -3 791

71
Bolivia (Plurinational State of)
1995 2005 2016
The setting Population, total (mill.) 7.6 9.1 11.1
Rural population, total (mill.) 3.1 3.3 3.5
Govt. expenditure on agric. (% total outlays) 9.1 6.1
Area harvested, crops (mill. ha) 1.8 2.7 3.7
Cropping intensity ratio 0.6 0.7 0.8
Total renewable water resources per cap. (m³) 72 926 60 799 52 719
Land area equipped for irrigation (1 000 ha) 204 256 300
Agric. area actually irrigated (% agric. area) 0.7 Employment in agriculture (%) 39.4 35.2 27.4
Employment in agriculture, female (%) 39.3 36.0 27.9
Fertilizers use, nitrogen (1 000 t nutrients) 12.2 20.0
Fertilizers use, phosphate (1 000 t nutrients) 7.8 10.7
Fertilizers use, potash (1 000 t nutrients) 4.7 3.3
Agric. value added per worker (constant USD) 1 161 1 337 1 953
Hunger dimensions Average dietary energy supply (kcal/cap/day) 2 106 2 355
Average dietary energy supply adequacy (%) 96 105
Dietary energy supply, cereals/roots/tubers (%) 51 51
Prevalence of undernourishment (%) 30.3 19.8
Prevalence of severe food insecurity (%) GDP per capita (USD, PPP) 4 695 6 708
Cereal import dependency ratio (%) 20.8 15.5
Stunting, children under 5 (%) 32.5 16.1
Wasting, children under 5 (%) 1.7 2.0
Safely managed drinking water (% pop. using) Food supply Food production value, net (2004–06 mill. I$) 1 857 2 615 3 838
Agriculture, value added (% GDP) 15 12 11
Food (excl. fish) exports (mill. USD) 162 340 837
Food (excl. fish) imports (mill. USD) 153 213 595
Production indices (2004–06 = 100) Food 71 100 146
Crops 72 101 154
Cereals 67 106 161
Vegetable oils 53 102 179
Roots and tubers 81 101 116
Fruit and vegetables 103 101 141
Sugar 76 91 123
Livestock 69 98 135
Milk 71 107 174
Meat 66 96 131
Fish 94 101 148
Net trade (mill. USD) Cereals and preparations -98 -88 -162
Fruit and vegetables 23 85 207
Meat and meat preparations 3 1 0
Dairy products (milk equivalent) -11 -13 5
Fish -1 -3 -19
Environment Forest area (% total land area) 57 54 50
Agricultural area (% total land area) 34 34 35
Freshwater withdrawal (% tot renewable) Terrestrial protected areas (% total land area) 31
Organic area (ha) 36 114
Wood pellet production (1 000 t) Emissions in agriculture (CO2 eq. Gg) 15 459 20 351 23 897
Net emissions in land use (CO2 eq. Gg) 83 418 85 686 89 914

72
Bosnia and Herzegovina
1995 2005 2016
The setting Population, total (mill.) 3.8 3.8 3.5
Rural population, total (mill.) 2.1 2.4 2.3
Govt. expenditure on agric. (% total outlays) Area harvested, crops (mill. ha) 0.4 0.6 0.6
Cropping intensity ratio 0.4 0.5 0.6
Total renewable water resources per cap. (m³) 9 923 9 766 10 663
Land area equipped for irrigation (1 000 ha) 2 3 3
Agric. area actually irrigated (% agric. area) Employment in agriculture (%) 48.1 24.5 19.2
Employment in agriculture, female (%) 56.1 28.9 18.6
Fertilizers use, nitrogen (1 000 t nutrients) 24.6 111.1
Fertilizers use, phosphate (1 000 t nutrients) 0.2 11.6
Fertilizers use, potash (1 000 t nutrients) 0.4 12.6
Agric. value added per worker (constant USD) 4 591 6 037
Hunger dimensions Average dietary energy supply (kcal/cap/day) 3 048 3 221
Average dietary energy supply adequacy (%) 121 128
Dietary energy supply, cereals/roots/tubers (%) 52 49
Prevalence of undernourishment (%) 3.2 <2.5
Prevalence of severe food insecurity (%) 1.5
GDP per capita (USD, PPP) 8 312 11 338
Cereal import dependency ratio (%) 35.1 37.0
Stunting, children under 5 (%) 11.8 Wasting, children under 5 (%) 4.0 Safely managed drinking water (% pop. using) 87.7 88.6
Food supply Food production value, net (2004–06 mill. I$) 556 787 1 009
Agriculture, value added (% GDP) 18 8 6
Food (excl. fish) exports (mill. USD) 2 114 423
Food (excl. fish) imports (mill. USD) 245 890 1 190
Production indices (2004–06 = 100) Food 69 98 125
Crops 61 96 118
Cereals 49 98 122
Vegetable oils 65 103 215
Roots and tubers 86 105 98
Fruit and vegetables 55 93 126
Sugar 120 000 100 3 307
Livestock 68 101 120
Milk 57 101 107
Meat 114 101 163
Fish 3 101 66
Net trade (mill. USD) Cereals and preparations -52 -177 -183
Fruit and vegetables -29 -109 -84
Meat and meat preparations -69 -92 -119
Dairy products (milk equivalent) -25 -59 -42
Fish -3 -27 -27
Environment Forest area (% total land area) 43 43 43
Agricultural area (% total land area) 42 42 43
Freshwater withdrawal (% tot renewable) 0.9 0.9
Terrestrial protected areas (% total land area) 1
Organic area (ha) 0 1
Wood pellet production (1 000 t) 270
Emissions in agriculture (CO2 eq. Gg) 1 705 2 241 2 737
Net emissions in land use (CO2 eq. Gg) -7 864 136 175

73
Botswana
1995 2005 2016
The setting Population, total (mill.) 1.6 1.9 2.3
Rural population, total (mill.) 0.8 0.8 0.9
Govt. expenditure on agric. (% total outlays) 3.1 5.1
Area harvested, crops (mill. ha) 0.2 0.1 0.1
Cropping intensity ratio 0.5 0.5 0.5
Total renewable water resources per cap. (m³) 7 436 6 342 5 439
Land area equipped for irrigation (1 000 ha) 1 2 3
Agric. area actually irrigated (% agric. area) 0.0 0.0
Employment in agriculture (%) 16.2 27.0 26.0
Employment in agriculture, female (%) 10.9 19.4 20.8
Fertilizers use, nitrogen (1 000 t nutrients) 21.2
Fertilizers use, phosphate (1 000 t nutrients) 1.1
Fertilizers use, potash (1 000 t nutrients) 1.0
Agric. value added per worker (constant USD) 3 607 1 351 1 248
Hunger dimensions Average dietary energy supply (kcal/cap/day) 2 179 2 302
Average dietary energy supply adequacy (%) 93 98
Dietary energy supply, cereals/roots/tubers (%) 50 48
Prevalence of undernourishment (%) 31.9 28.5
Prevalence of severe food insecurity (%) 39.8
GDP per capita (USD, PPP) 11 583 15 727
Cereal import dependency ratio (%) 69.8 100.0
Stunting, children under 5 (%) 31.4 Wasting, children under 5 (%) 7.2 Safely managed drinking water (% pop. using) Food supply Food production value, net (2004–06 mill. I$) 341 318 376
Agriculture, value added (% GDP) 5 2 2
Food (excl. fish) exports (mill. USD) 113 48 117
Food (excl. fish) imports (mill. USD) 304 221 526
Production indices (2004–06 = 100) Food 109 101 120
Crops 94 102 126
Cereals 172 100 127
Vegetable oils 37 114 59
Roots and tubers 83 100 110
Fruit and vegetables 86 101 154
Sugar Livestock 110 101 119
Milk 102 102 92
Meat 119 101 145
Fish 160 106 43
Net trade (mill. USD) Cereals and preparations -75 -59 -158
Fruit and vegetables -58 -57 -111
Meat and meat preparations 80 38 86
Dairy products (milk equivalent) -43 -42 -47
Fish -6 -8 -11
Environment Forest area (% total land area) 23 21 19
Agricultural area (% total land area) 46 46 46
Freshwater withdrawal (% tot renewable) 1.2 Terrestrial protected areas (% total land area) 29
Organic area (ha) Wood pellet production (1 000 t) Emissions in agriculture (CO2 eq. Gg) 8 652 4 754 7 870
Net emissions in land use (CO2 eq. Gg) 45 194 48 564 34 814

74
Brazil
1995 2005 2016
The setting Population, total (mill.) 162.3 186.9 209.3
Rural population, total (mill.) 36.2 32.0 28.6
Govt. expenditure on agric. (% total outlays) 0.8
Area harvested, crops (mill. ha) 51.7 63.6 76.2
Cropping intensity ratio 0.8 0.8 0.9
Total renewable water resources per cap. (m³) 51 503 44 853 41 642
Land area equipped for irrigation (1 000 ha) 2 656 4 600 5 400
Agric. area actually irrigated (% agric. area) 1.6 Employment in agriculture (%) 26.1 20.5 10.2
Employment in agriculture, female (%) 22.0 15.9 4.8
Fertilizers use, nitrogen (1 000 t nutrients) 2 072.2 4 366.3
Fertilizers use, phosphate (1 000 t nutrients) 2 871.9 4 974.6
Fertilizers use, potash (1 000 t nutrients) 3 361.7 5 728.4
Agric. value added per worker (constant USD) 3 077 4 583 11 034
Hunger dimensions Average dietary energy supply (kcal/cap/day) 3 085 3 184
Average dietary energy supply adequacy (%) 128 130
Dietary energy supply, cereals/roots/tubers (%) 36 33
Prevalence of undernourishment (%) 4.6 <2.5
Prevalence of severe food insecurity (%) GDP per capita (USD, PPP) 12 299 14 077
Cereal import dependency ratio (%) 5.7 -15.3
Stunting, children under 5 (%) 7.1 Wasting, children under 5 (%) 1.6 Safely managed drinking water (% pop. using) Food supply Food production value, net (2004–06 mill. I$) 67 815 101 556 139 465
Agriculture, value added (% GDP) 5 5 4
Food (excl. fish) exports (mill. USD) 7 001 22 159 54 249
Food (excl. fish) imports (mill. USD) 4 782 2 511 7 974
Production indices (2004–06 = 100) Food 66 99 137
Crops 70 98 143
Cereals 84 95 132
Vegetable oils 50 101 185
Roots and tubers 98 101 90
Fruit and vegetables 85 98 106
Sugar 69 96 175
Livestock 62 101 127
Milk 68 101 133
Meat 60 101 125
Fish 64 98 125
Net trade (mill. USD) Cereals and preparations -1 868 -856 1 197
Fruit and vegetables 486 1 358 916
Meat and meat preparations 1 064 7 979 13 634
Dairy products (milk equivalent) -637 9 -485
Fish -237 99 -940
Environment Forest area (% total land area) 64 61 59
Agricultural area (% total land area) 31 33 34
Freshwater withdrawal (% tot renewable) 0.7 0.7 Terrestrial protected areas (% total land area) 29
Organic area (ha) 842 750
Wood pellet production (1 000 t) 135
Emissions in agriculture (CO2 eq. Gg) 332 392 416 335 450 668
Net emissions in land use (CO2 eq. Gg) 891 380 1 112 116 308 686

75
Brunei Darussalam
1995 2005 2016
The setting Population, total (mill.) 0.3 0.4 0.4
Rural population, total (mill.) 0.1 0.1 0.1
Govt. expenditure on agric. (% total outlays) Area harvested, crops (mill. ha) 0.0 0.0 0.0
Cropping intensity ratio 2.0 2.4 1.1
Total renewable water resources per cap. (m³) 27 437 22 697 20 085
Land area equipped for irrigation (1 000 ha) 1 1 1
Agric. area actually irrigated (% agric. area) 0.9 Employment in agriculture (%) 1.7 1.0 0.6
Employment in agriculture, female (%) 0.8 0.3 0.5
Fertilizers use, nitrogen (1 000 t nutrients) 0.3 0.2
Fertilizers use, phosphate (1 000 t nutrients) 0.1 0.2
Fertilizers use, potash (1 000 t nutrients) 0.2 0.2
Agric. value added per worker (constant USD) 27 035 67 530 94 886
Hunger dimensions Average dietary energy supply (kcal/cap/day) 2 981 2 987
Average dietary energy supply adequacy (%) 126 124
Dietary energy supply, cereals/roots/tubers (%) 47 45
Prevalence of undernourishment (%) <2.5 2.6
Prevalence of severe food insecurity (%) GDP per capita (USD, PPP) 82 967 71 789
Cereal import dependency ratio (%) 98.1 100.0
Stunting, children under 5 (%) Wasting, children under 5 (%) Safely managed drinking water (% pop. using) Food supply Food production value, net (2004–06 mill. I$) 13 22 49
Agriculture, value added (% GDP) 1 1 1
Food (excl. fish) exports (mill. USD) 7 0 1
Food (excl. fish) imports (mill. USD) 155 179 324
Production indices (2004–06 = 100) Food 46 75 169
Crops 72 99 97
Cereals 65 111 217
Vegetable oils 48 120 136
Roots and tubers 63 101 136
Fruit and vegetables 74 98 88
Sugar Livestock 40 69 187
Milk 77 102 64
Meat 32 62 201
Fish 169 111 500
Net trade (mill. USD) Cereals and preparations -35 -59 -124
Fruit and vegetables -32 -31 -48
Meat and meat preparations -38 -11 -37
Dairy products (milk equivalent) -11 -20 -21
Fish -8 -14 -37
Environment Forest area (% total land area) 77 74 72
Agricultural area (% total land area) 2 2 3
Freshwater withdrawal (% tot renewable) 1.1 Terrestrial protected areas (% total land area) 47
Organic area (ha) Wood pellet production (1 000 t) 0
Emissions in agriculture (CO2 eq. Gg) 69 110 146
Net emissions in land use (CO2 eq. Gg) 2 161 2 086 471

76
Bulgaria
1995 2005 2016
The setting Population, total (mill.) 8.4 7.7 7.1
Rural population, total (mill.) 2.7 2.3 1.8
Govt. expenditure on agric. (% total outlays) 3.0 2.1
Area harvested, crops (mill. ha) 3.3 2.7 3.1
Cropping intensity ratio 0.8 0.8 0.8
Total renewable water resources per cap. (m³) 2 598 2 814 2 987
Land area equipped for irrigation (1 000 ha) 789 112 115
Agric. area actually irrigated (% agric. area) 1.0 2.0
Employment in agriculture (%) 14.9 8.9 6.8
Employment in agriculture, female (%) 12.4 6.8 4.2
Fertilizers use, nitrogen (1 000 t nutrients) 189.9 324.9
Fertilizers use, phosphate (1 000 t nutrients) 39.3 82.6
Fertilizers use, potash (1 000 t nutrients) 6.3 31.4
Agric. value added per worker (constant USD) 6 700 9 770 10 199
Hunger dimensions Average dietary energy supply (kcal/cap/day) 2 749 2 926
Average dietary energy supply adequacy (%) 109 117
Dietary energy supply, cereals/roots/tubers (%) 40 41
Prevalence of undernourishment (%) 6.5 3.0
Prevalence of severe food insecurity (%) GDP per capita (USD, PPP) 12 420 17 795
Cereal import dependency ratio (%) -34.3 -126.7
Stunting, children under 5 (%) 8.8 Wasting, children under 5 (%) 3.2 Safely managed drinking water (% pop. using) 97.1 96.6
Food supply Food production value, net (2004–06 mill. I$) 3 480 2 252 3 343
Agriculture, value added (% GDP) 12 7 4
Food (excl. fish) exports (mill. USD) 591 957 3 468
Food (excl. fish) imports (mill. USD) 304 640 2 113
Production indices (2004–06 = 100) Food 135 87 130
Crops 124 86 128
Cereals 103 94 143
Vegetable oils 73 87 217
Roots and tubers 144 83 26
Fruit and vegetables 244 76 91
Sugar 607 95 Livestock 152 99 84
Milk 107 98 69
Meat 215 100 100
Fish 126 85 243
Net trade (mill. USD) Cereals and preparations 146 242 1 149
Fruit and vegetables 76 22 -102
Meat and meat preparations 30 8 -163
Dairy products (milk equivalent) 15 21 -86
Fish 10 -18 -36
Environment Forest area (% total land area) 30 34 35
Agricultural area (% total land area) 56 48 46
Freshwater withdrawal (% tot renewable) 29.1 26.4
Terrestrial protected areas (% total land area) 35
Organic area (ha) 2 161
Wood pellet production (1 000 t) 149
Emissions in agriculture (CO2 eq. Gg) 4 967 4 668 4 918
Net emissions in land use (CO2 eq. Gg) -11 191 -13 722 -9 875

77
Burkina Faso
1995 2005 2016
The setting Population, total (mill.) 10.1 13.4 19.2
Rural population, total (mill.) 8.6 10.5 13.0
Govt. expenditure on agric. (% total outlays) 0.1 Area harvested, crops (mill. ha) 3.8 5.3 7.1
Cropping intensity ratio 1.1 1.1 1.2
Total renewable water resources per cap. (m³) 1 266 946 724
Land area equipped for irrigation (1 000 ha) 25 37 55
Agric. area actually irrigated (% agric. area) Employment in agriculture (%) 88.6 82.0 28.9
Employment in agriculture, female (%) 90.3 84.2 20.4
Fertilizers use, nitrogen (1 000 t nutrients) 35.4 67.6
Fertilizers use, phosphate (1 000 t nutrients) 22.1 30.4
Fertilizers use, potash (1 000 t nutrients) 17.1 32.6
Agric. value added per worker (constant USD) 381 574 1 890
Hunger dimensions Average dietary energy supply (kcal/cap/day) 2 510 2 689
Average dietary energy supply adequacy (%) 116 122
Dietary energy supply, cereals/roots/tubers (%) 65 65
Prevalence of undernourishment (%) 24.9 21.3
Prevalence of severe food insecurity (%) 23.8
GDP per capita (USD, PPP) 1 266 1 642
Cereal import dependency ratio (%) 7.4 12.6
Stunting, children under 5 (%) 42.4 27.3
Wasting, children under 5 (%) 24.4 7.6
Safely managed drinking water (% pop. using) Food supply Food production value, net (2004–06 mill. I$) 1 157 1 828 2 243
Agriculture, value added (% GDP) 31 35 28
Food (excl. fish) exports (mill. USD) 36 60 317
Food (excl. fish) imports (mill. USD) 141 187 353
Production indices (2004–06 = 100) Food 66 104 127
Crops 57 106 145
Cereals 69 107 140
Vegetable oils 58 104 247
Roots and tubers 110 64 101
Fruit and vegetables 97 100 118
Sugar 89 100 108
Livestock 65 101 84
Milk 68 100 116
Meat 64 101 76
Fish 86 98 242
Net trade (mill. USD) Cereals and preparations -72 -94 -201
Fruit and vegetables -15 -8 122
Meat and meat preparations -1 0 0
Dairy products (milk equivalent) -27 -12 -18
Fish -4 -4 -12
Environment Forest area (% total land area) 24 22 19
Agricultural area (% total land area) 35 40 44
Freshwater withdrawal (% tot renewable) 2.8 6.1 Terrestrial protected areas (% total land area) 15
Organic area (ha) 0 27
Wood pellet production (1 000 t) Emissions in agriculture (CO2 eq. Gg) 11 101 17 297 21 113
Net emissions in land use (CO2 eq. Gg) 11 418 9 918 9 288

78
Burundi
1995 2005 2016
The setting Population, total (mill.) 6.0 7.4 10.9
Rural population, total (mill.) 5.8 7.0 10.0
Govt. expenditure on agric. (% total outlays) 2.8
Area harvested, crops (mill. ha) 1.1 1.2 1.3
Cropping intensity ratio 0.9 0.9 0.8
Total renewable water resources per cap. (m³) 1 953 1 473 1 192
Land area equipped for irrigation (1 000 ha) 18 23 23
Agric. area actually irrigated (% agric. area) Employment in agriculture (%) 92.3 91.8 91.4
Employment in agriculture, female (%) 96.8 96.6 96.4
Fertilizers use, nitrogen (1 000 t nutrients) 1.1 4.5
Fertilizers use, phosphate (1 000 t nutrients) 2.3 1.2
Fertilizers use, potash (1 000 t nutrients) 0.0 0.8
Agric. value added per worker (constant USD) 349 258 197
Hunger dimensions Average dietary energy supply (kcal/cap/day) Average dietary energy supply adequacy (%) Dietary energy supply, cereals/roots/tubers (%) Prevalence of undernourishment (%) Prevalence of severe food insecurity (%) GDP per capita (USD, PPP) 724 721
Cereal import dependency ratio (%) Stunting, children under 5 (%) 57.7 55.9
Wasting, children under 5 (%) 9.0 5.1
Safely managed drinking water (% pop. using) Food supply Food production value, net (2004–06 mill. I$) 902 953 1 138
Agriculture, value added (% GDP) 42 41 36
Food (excl. fish) exports (mill. USD) 1 1 3
Food (excl. fish) imports (mill. USD) 50 37 43
Production indices (2004–06 = 100) Food 95 100 120
Crops 83 91 105
Cereals 80 101 158
Vegetable oils 69 95 241
Roots and tubers 88 102 225
Fruit and vegetables 87 100 73
Sugar 109 103 179
Livestock 88 101 141
Milk 127 95 265
Meat 77 102 106
Fish 157 100 172
Net trade (mill. USD) Cereals and preparations -23 -21 -23
Fruit and vegetables -15 -8 1
Meat and meat preparations 0 0 -3
Dairy products (milk equivalent) -1 0
Fish 0 0 -2
Environment Forest area (% total land area) 9 7 11
Agricultural area (% total land area) 79 71 79
Freshwater withdrawal (% tot renewable) Terrestrial protected areas (% total land area) 8
Organic area (ha) 0 0
Wood pellet production (1 000 t) Emissions in agriculture (CO2 eq. Gg) 1 211 1 280 1 832
Net emissions in land use (CO2 eq. Gg) 8 356 4 895 2 400

79
Cabo Verde
1995 2005 2016
The setting Population, total (mill.) 0.4 0.5 0.5
Rural population, total (mill.) 0.2 0.2 0.2
Govt. expenditure on agric. (% total outlays) 4.9 4.4
Area harvested, crops (mill. ha) 0.1 0.1 0.1
Cropping intensity ratio 1.6 1.0 1.4
Total renewable water resources per cap. (m³) 732 623 556
Land area equipped for irrigation (1 000 ha) 3 4 4
Agric. area actually irrigated (% agric. area) Employment in agriculture (%) 78.8 73.2 67.9
Employment in agriculture, female (%) 86.3 81.3 76.1
Fertilizers use, nitrogen (1 000 t nutrients) Fertilizers use, phosphate (1 000 t nutrients) Fertilizers use, potash (1 000 t nutrients) Agric. value added per worker (constant USD) 632 829 1 219
Hunger dimensions Average dietary energy supply (kcal/cap/day) 2 518 2 690
Average dietary energy supply adequacy (%) 110 113
Dietary energy supply, cereals/roots/tubers (%) 49 48
Prevalence of undernourishment (%) 14.0 12.3
Prevalence of severe food insecurity (%) GDP per capita (USD, PPP) 4 644 6 065
Cereal import dependency ratio (%) 78.0 88.9
Stunting, children under 5 (%) Wasting, children under 5 (%) Safely managed drinking water (% pop. using) Food supply Food production value, net (2004–06 mill. I$) 29 42 40
Agriculture, value added (% GDP) 16 11 8
Food (excl. fish) exports (mill. USD) 0 0 0
Food (excl. fish) imports (mill. USD) 69 112 171
Production indices (2004–06 = 100) Food 70 100 96
Crops 51 98 109
Cereals 122 55 85
Vegetable oils 86 100 101
Roots and tubers 58 101 54
Fruit and vegetables 51 100 108
Sugar 51 100 104
Livestock 93 101 82
Milk 50 103 93
Meat 103 100 72
Fish 48 125 113
Net trade (mill. USD) Cereals and preparations -18 -31 -39
Fruit and vegetables -13 -19 -30
Meat and meat preparations -3 -14 -24
Dairy products (milk equivalent) -9 -19 -31
Fish 1 10 44
Environment Forest area (% total land area) 17 21 23
Agricultural area (% total land area) 17 19 20
Freshwater withdrawal (% tot renewable) Terrestrial protected areas (% total land area) 3
Organic area (ha) 1
Wood pellet production (1 000 t) Emissions in agriculture (CO2 eq. Gg) 127 130 117
Net emissions in land use (CO2 eq. Gg) -403 0 -169

80
Cambodia
1995 2005 2016
The setting Population, total (mill.) 10.7 13.3 16.0
Rural population, total (mill.) 8.9 10.8 12.8
Govt. expenditure on agric. (% total outlays) Area harvested, crops (mill. ha) 2.3 3.0 3.8
Cropping intensity ratio 0.6 0.8 1.0
Total renewable water resources per cap. (m³) 41 988 34 678 30 205
Land area equipped for irrigation (1 000 ha) 270 350 354
Agric. area actually irrigated (% agric. area) Employment in agriculture (%) 80.2 70.8 27.4
Employment in agriculture, female (%) 83.2 72.2 26.9
Fertilizers use, nitrogen (1 000 t nutrients) 11.1 55.9
Fertilizers use, phosphate (1 000 t nutrients) 17.4 5.9
Fertilizers use, potash (1 000 t nutrients) 1.6 4.3
Agric. value added per worker (constant USD) 549 628 1 697
Hunger dimensions Average dietary energy supply (kcal/cap/day) 2 327 2 451
Average dietary energy supply adequacy (%) 105 108
Dietary energy supply, cereals/roots/tubers (%) 72 71
Prevalence of undernourishment (%) 20.0 18.5
Prevalence of severe food insecurity (%) 14.4
GDP per capita (USD, PPP) 1 969 3 465
Cereal import dependency ratio (%) 1.8 -1.3
Stunting, children under 5 (%) 43.7 32.4
Wasting, children under 5 (%) 8.3 9.6
Safely managed drinking water (% pop. using) 19.2 24.1
Food supply Food production value, net (2004–06 mill. I$) 1 503 2 515 4 534
Agriculture, value added (% GDP) 49 31 25
Food (excl. fish) exports (mill. USD) 1 12 382
Food (excl. fish) imports (mill. USD) 108 198 312
Production indices (2004–06 = 100) Food 62 104 188
Crops 61 105 211
Cereals 62 108 179
Vegetable oils 14 141 131
Roots and tubers 13 55 935
Fruit and vegetables 86 99 116
Sugar 161 90 481
Livestock 71 101 89
Milk 88 100 96
Meat 69 101 88
Fish 27 98 192
Net trade (mill. USD) Cereals and preparations -33 -40 164
Fruit and vegetables -2 -16 -1
Meat and meat preparations 0 -1 -7
Dairy products (milk equivalent) -15 -20 -26
Fish 8 38 41
Environment Forest area (% total land area) 69 61 53
Agricultural area (% total land area) 26 30 31
Freshwater withdrawal (% tot renewable) 0.5 Terrestrial protected areas (% total land area) 26
Organic area (ha) 1 10
Wood pellet production (1 000 t) Emissions in agriculture (CO2 eq. Gg) 14 541 16 792 18 662
Net emissions in land use (CO2 eq. Gg) 27 453 31 466 23 452

81
Cameroon
1995 2005 2016
The setting Population, total (mill.) 13.5 17.4 24.1
Rural population, total (mill.) 8.0 9.3 10.9
Govt. expenditure on agric. (% total outlays) Area harvested, crops (mill. ha) 3.7 4.3 7.1
Cropping intensity ratio 0.5 0.6 0.9
Total renewable water resources per cap. (m³) 19 245 14 839 12 078
Land area equipped for irrigation (1 000 ha) 24 27 29
Agric. area actually irrigated (% agric. area) Employment in agriculture (%) 68.7 64.9 62.0
Employment in agriculture, female (%) 72.2 68.3 65.3
Fertilizers use, nitrogen (1 000 t nutrients) 22.8 33.1
Fertilizers use, phosphate (1 000 t nutrients) 6.2 7.8
Fertilizers use, potash (1 000 t nutrients) 18.7 19.1
Agric. value added per worker (constant USD) 610 696 826
Hunger dimensions Average dietary energy supply (kcal/cap/day) 2 305 2 792
Average dietary energy supply adequacy (%) 105 126
Dietary energy supply, cereals/roots/tubers (%) 54 54
Prevalence of undernourishment (%) 20.3 7.3
Prevalence of severe food insecurity (%) 35.5
GDP per capita (USD, PPP) 2 829 3 347
Cereal import dependency ratio (%) 30.9 30.9
Stunting, children under 5 (%) 36.4 31.7
Wasting, children under 5 (%) 7.3 5.2
Safely managed drinking water (% pop. using) Food supply Food production value, net (2004–06 mill. I$) 2 238 3 339 5 952
Agriculture, value added (% GDP) 16 14 15
Food (excl. fish) exports (mill. USD) 258 346 837
Food (excl. fish) imports (mill. USD) 144 431 759
Production indices (2004–06 = 100) Food 68 102 182
Crops 68 104 186
Cereals 63 100 223
Vegetable oils 55 104 167
Roots and tubers 63 103 186
Fruit and vegetables 68 105 201
Sugar 100 108 96
Livestock 77 99 125
Milk 91 99 106
Meat 74 100 128
Fish 69 104 172
Net trade (mill. USD) Cereals and preparations -90 -279 -498
Fruit and vegetables 73 61 244
Meat and meat preparations -2 -17 -7
Dairy products (milk equivalent) -11 -26 -49
Fish -25 -64 -288
Environment Forest area (% total land area) 49 44 39
Agricultural area (% total land area) 19 19 21
Freshwater withdrawal (% tot renewable) 0.1 Terrestrial protected areas (% total land area) 11
Organic area (ha) 1 0
Wood pellet production (1 000 t) Emissions in agriculture (CO2 eq. Gg) 10 254 13 447 12 705
Net emissions in land use (CO2 eq. Gg) 113 162 113 361 112 096

82
Canada
1995 2005 2016
The setting Population, total (mill.) 29.3 32.3 36.6
Rural population, total (mill.) 6.5 6.4 6.5
Govt. expenditure on agric. (% total outlays) 1.0
Area harvested, crops (mill. ha) 27.4 26.1 29.5
Cropping intensity ratio 0.5 0.5 0.6
Total renewable water resources per cap. (m³) 97 151 87 987 79 967
Land area equipped for irrigation (1 000 ha) 1 085 1 218 1 180
Agric. area actually irrigated (% agric. area) 1.3 1.4
Employment in agriculture (%) 4.1 2.7 1.9
Employment in agriculture, female (%) 2.4 1.6 1.1
Fertilizers use, nitrogen (1 000 t nutrients) 1 776.7 2 472.0
Fertilizers use, phosphate (1 000 t nutrients) 693.1 970.0
Fertilizers use, potash (1 000 t nutrients) 328.6 393.0
Agric. value added per worker (constant USD) 48 988 73 169
Hunger dimensions Average dietary energy supply (kcal/cap/day) 3 490 3 499
Average dietary energy supply adequacy (%) 139 140
Dietary energy supply, cereals/roots/tubers (%) 28 28
Prevalence of undernourishment (%) <2.5 <2.5
Prevalence of severe food insecurity (%) GDP per capita (USD, PPP) 40 471 43 238
Cereal import dependency ratio (%) -62.2 -76.7
Stunting, children under 5 (%) Wasting, children under 5 (%) Safely managed drinking water (% pop. using) Food supply Food production value, net (2004–06 mill. I$) 18 408 23 815 27 582
Agriculture, value added (% GDP) 3 2 2
Food (excl. fish) exports (mill. USD) 10 212 18 173 36 707
Food (excl. fish) imports (mill. USD) 6 355 11 946 23 762
Production indices (2004–06 = 100) Food 79 102 118
Crops 88 103 141
Cereals 97 102 113
Vegetable oils 79 108 194
Roots and tubers 77 90 89
Fruit and vegetables 95 97 131
Sugar 139 82 71
Livestock 75 102 83
Milk 100 99 95
Meat 68 103 79
Fish 72 99 83
Net trade (mill. USD) Cereals and preparations 3 410 3 140 6 008
Fruit and vegetables -1 725 -2 051 -2 796
Meat and meat preparations 440 2 787 2 130
Dairy products (milk equivalent) 15 -207 -299
Fish 1 280 1 936 2 200
Environment Forest area (% total land area) 38 38 38
Agricultural area (% total land area) 7 7 7
Freshwater withdrawal (% tot renewable) 1.5 1.4 Terrestrial protected areas (% total land area) 10
Organic area (ha) 579 1 099
Wood pellet production (1 000 t) 2 889
Emissions in agriculture (CO2 eq. Gg) 53 446 58 898 63 157
Net emissions in land use (CO2 eq. Gg) 81 610 267 395 87 424

83
Central African Republic
1995 2005 2016
The setting Population, total (mill.) 3.4 4.1 4.7
Rural population, total (mill.) 2.1 2.5 3.0
Govt. expenditure on agric. (% total outlays) 1.3 Area harvested, crops (mill. ha) 0.7 0.9 1.0
Cropping intensity ratio 0.4 0.4 0.5
Total renewable water resources per cap. (m³) 40 309 33 555 30 688
Land area equipped for irrigation (1 000 ha) 1 1 1
Agric. area actually irrigated (% agric. area) Employment in agriculture (%) 85.0 86.4 85.6
Employment in agriculture, female (%) 90.3 91.5 90.5
Fertilizers use, nitrogen (1 000 t nutrients) 0.2
Fertilizers use, phosphate (1 000 t nutrients) 0.0
Fertilizers use, potash (1 000 t nutrients) 0.4
Agric. value added per worker (constant USD) 593 658 411
Hunger dimensions Average dietary energy supply (kcal/cap/day) 2 015 1 720
Average dietary energy supply adequacy (%) 93 79
Dietary energy supply, cereals/roots/tubers (%) 54 57
Prevalence of undernourishment (%) 39.5 61.8
Prevalence of severe food insecurity (%) GDP per capita (USD, PPP) 810 643
Cereal import dependency ratio (%) 18.5 18.7
Stunting, children under 5 (%) 45.1 Wasting, children under 5 (%) 12.2 Safely managed drinking water (% pop. using) Food supply Food production value, net (2004–06 mill. I$) 581 794 939
Agriculture, value added (% GDP) 37 43 31
Food (excl. fish) exports (mill. USD) 10 15 48
Food (excl. fish) imports (mill. USD) 32 26 46
Production indices (2004–06 = 100) Food 74 101 120
Crops 86 100 116
Cereals 47 106 59
Vegetable oils 75 96 79
Roots and tubers 87 101 128
Fruit and vegetables 89 100 126
Sugar 81 99 112
Livestock 68 103 128
Milk 85 100 120
Meat 64 100 125
Fish 56 100 116
Net trade (mill. USD) Cereals and preparations -15 -12 -9
Fruit and vegetables -2 -1 25
Meat and meat preparations 0 0 -7
Dairy products (milk equivalent) -1 -1 -3
Fish 0 -1 -4
Environment Forest area (% total land area) 36 36 36
Agricultural area (% total land area) 8 8 8
Freshwater withdrawal (% tot renewable) 0.1 Terrestrial protected areas (% total land area) 18
Organic area (ha) Wood pellet production (1 000 t) Emissions in agriculture (CO2 eq. Gg) 17 505 20 287 20 149
Net emissions in land use (CO2 eq. Gg) 15 412 14 582 13 433
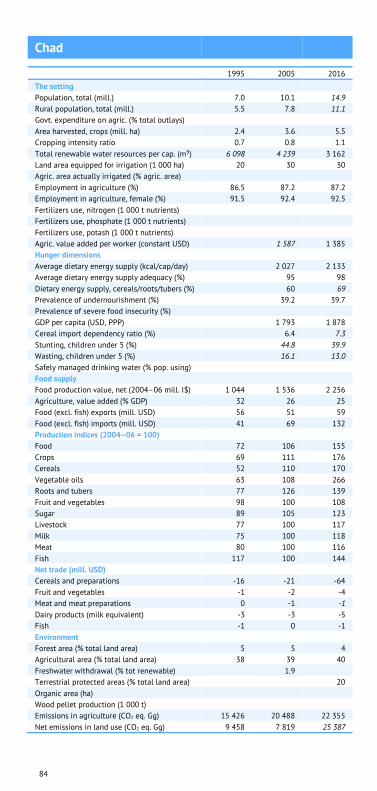
84
Chad
1995 2005 2016
The setting Population, total (mill.) 7.0 10.1 14.9
Rural population, total (mill.) 5.5 7.8 11.1
Govt. expenditure on agric. (% total outlays) Area harvested, crops (mill. ha) 2.4 3.6 5.5
Cropping intensity ratio 0.7 0.8 1.1
Total renewable water resources per cap. (m³) 6 098 4 239 3 162
Land area equipped for irrigation (1 000 ha) 20 30 30
Agric. area actually irrigated (% agric. area) Employment in agriculture (%) 86.5 87.2 87.2
Employment in agriculture, female (%) 91.5 92.4 92.5
Fertilizers use, nitrogen (1 000 t nutrients) Fertilizers use, phosphate (1 000 t nutrients) Fertilizers use, potash (1 000 t nutrients) Agric. value added per worker (constant USD) 1 587 1 385
Hunger dimensions Average dietary energy supply (kcal/cap/day) 2 027 2 133
Average dietary energy supply adequacy (%) 95 98
Dietary energy supply, cereals/roots/tubers (%) 60 69
Prevalence of undernourishment (%) 39.2 39.7
Prevalence of severe food insecurity (%) GDP per capita (USD, PPP) 1 793 1 878
Cereal import dependency ratio (%) 6.4 7.3
Stunting, children under 5 (%) 44.8 39.9
Wasting, children under 5 (%) 16.1 13.0
Safely managed drinking water (% pop. using) Food supply Food production value, net (2004–06 mill. I$) 1 044 1 536 2 256
Agriculture, value added (% GDP) 32 26 25
Food (excl. fish) exports (mill. USD) 56 51 59
Food (excl. fish) imports (mill. USD) 41 69 132
Production indices (2004–06 = 100) Food 72 106 155
Crops 69 111 176
Cereals 52 110 170
Vegetable oils 63 108 266
Roots and tubers 77 126 139
Fruit and vegetables 98 100 108
Sugar 89 105 123
Livestock 77 100 117
Milk 75 100 118
Meat 80 100 116
Fish 117 100 144
Net trade (mill. USD) Cereals and preparations -16 -21 -64
Fruit and vegetables -1 -2 -4
Meat and meat preparations 0 -1 -1
Dairy products (milk equivalent) -3 -3 -5
Fish -1 0 -1
Environment Forest area (% total land area) 5 5 4
Agricultural area (% total land area) 38 39 40
Freshwater withdrawal (% tot renewable) 1.9 Terrestrial protected areas (% total land area) 20
Organic area (ha) Wood pellet production (1 000 t) Emissions in agriculture (CO2 eq. Gg) 15 426 20 488 22 355
Net emissions in land use (CO2 eq. Gg) 9 458 7 819 25 387

85
Chile
1995 2005 2016
The setting Population, total (mill.) 14.3 16.1 18.1
Rural population, total (mill.) 2.2 2.1 1.8
Govt. expenditure on agric. (% total outlays) 1.9 1.6
Area harvested, crops (mill. ha) 1.2 1.3 1.3
Cropping intensity ratio 0.5 0.7 0.7
Total renewable water resources per cap. (m³) 63 252 56 071 51 542
Land area equipped for irrigation (1 000 ha) 1 100 1 100 1 110
Agric. area actually irrigated (% agric. area) 6.9 Employment in agriculture (%) 15.7 13.2 9.5
Employment in agriculture, female (%) 5.3 5.8 4.9
Fertilizers use, nitrogen (1 000 t nutrients) 240.7 263.7
Fertilizers use, phosphate (1 000 t nutrients) 124.6 79.1
Fertilizers use, potash (1 000 t nutrients) 265.1 30.3
Agric. value added per worker (constant USD) 4 912 8 491 11 633
Hunger dimensions Average dietary energy supply (kcal/cap/day) 2 928 3 032
Average dietary energy supply adequacy (%) 121 125
Dietary energy supply, cereals/roots/tubers (%) 45 43
Prevalence of undernourishment (%) 3.9 3.3
Prevalence of severe food insecurity (%) 4.4
GDP per capita (USD, PPP) 17 008 22 614
Cereal import dependency ratio (%) 31.6 39.8
Stunting, children under 5 (%) 2.2 1.8
Wasting, children under 5 (%) 0.5 0.3
Safely managed drinking water (% pop. using) 94.6 98.2
Food supply Food production value, net (2004–06 mill. I$) 5 460 7 137 8 226
Agriculture, value added (% GDP) 5 4 4
Food (excl. fish) exports (mill. USD) 1 790 3 479 8 522
Food (excl. fish) imports (mill. USD) 759 1 447 4 022
Production indices (2004–06 = 100) Food 76 100 115
Crops 78 101 116
Cereals 73 104 101
Vegetable oils 57 105 461
Roots and tubers 69 90 97
Fruit and vegetables 78 101 114
Sugar 159 110 70
Livestock 73 98 111
Milk 81 99 88
Meat 70 97 115
Fish 146 97 49
Net trade (mill. USD) Cereals and preparations -151 -128 -446
Fruit and vegetables 1 296 2 263 6 094
Meat and meat preparations -99 197 -308
Dairy products (milk equivalent) -29 35 -86
Fish 1 658 2 877 4 813
Environment Forest area (% total land area) 21 22 24
Agricultural area (% total land area) 21 21 21
Freshwater withdrawal (% tot renewable) 2.2 3.8 Terrestrial protected areas (% total land area) 18
Organic area (ha) 23 16
Wood pellet production (1 000 t) 30
Emissions in agriculture (CO2 eq. Gg) 10 816 11 771 13 895
Net emissions in land use (CO2 eq. Gg) -12 482 -6 889 -105 088

86
China
1995 2005 2016
The setting Population, total (mill.) 1 267.7 1 351.5 1 441.1
Rural population, total (mill.) 861.1 764.0 601.3
Govt. expenditure on agric. (% total outlays) 2.7 2.9
Area harvested, crops (mill. ha) 155.0 162.4 180.6
Cropping intensity ratio 1.2 1.3 1.3
Total renewable water resources per cap. (m³) 2 226 2 104 1 979
Land area equipped for irrigation (1 000 ha) 51 376 62 276 73 003
Agric. area actually irrigated (% agric. area) Employment in agriculture (%) 48.7 35.3 18.1
Employment in agriculture, female (%) 51.0 38.9 21.1
Fertilizers use, nitrogen (1 000 t nutrients) 26 781.3 30 624.2
Fertilizers use, phosphate (1 000 t nutrients) 11 882.8 15 785.2
Fertilizers use, potash (1 000 t nutrients) 9 309.3 13 847.7
Agric. value added per worker (constant USD) 1 018 1 787 5 326
Hunger dimensions Average dietary energy supply (kcal/cap/day) 2 876 3 211
Average dietary energy supply adequacy (%) 117 131
Dietary energy supply, cereals/roots/tubers (%) 56 51
Prevalence of undernourishment (%) 15.2 8.7
Prevalence of severe food insecurity (%) GDP per capita (USD, PPP) 5 922 14 644
Cereal import dependency ratio (%) 1.6 3.4
Stunting, children under 5 (%) 9.4 8.1
Wasting, children under 5 (%) 1.9
Safely managed drinking water (% pop. using) Food supply Food production value, net (2004–06 mill. I$) 263 033 402 564 555 458
Agriculture, value added (% GDP) 20 12 9
Food (excl. fish) exports (mill. USD) 8 127 13 858 34 110
Food (excl. fish) imports (mill. USD) 15 500 23 984 101 514
Production indices (2004–06 = 100) Food 66 100 138
Crops 68 100 144
Cereals 98 100 130
Vegetable oils 78 102 113
Roots and tubers 90 108 120
Fruit and vegetables 46 100 162
Sugar 87 97 132
Livestock 66 100 130
Milk 31 101 132
Meat 67 100 128
Fish 68 100 154
Net trade (mill. USD) Cereals and preparations -5 145 -1 547 -11 464
Fruit and vegetables 1 718 4 197 7 595
Meat and meat preparations 1 148 -730 -14 855
Dairy products (milk equivalent) -709 -932 -5 571
Fish 1 753 3 857 7 711
Environment Forest area (% total land area) 18 20 22
Agricultural area (% total land area) 56 55 56
Freshwater withdrawal (% tot renewable) 18.5 20.1 20.9
Terrestrial protected areas (% total land area) 17
Organic area (ha) 2 301 2 288
Wood pellet production (1 000 t) 485
Emissions in agriculture (CO2 eq. Gg) 630 283 648 140 691 230
Net emissions in land use (CO2 eq. Gg) -320 985 -339 340 -311 371

87
Colombia
1995 2005 2016
The setting Population, total (mill.) 37.4 43.3 49.1
Rural population, total (mill.) 10.8 11.4 11.7
Govt. expenditure on agric. (% total outlays) Area harvested, crops (mill. ha) 4.1 4.0 4.3
Cropping intensity ratio 0.9 1.1 1.2
Total renewable water resources per cap. (m³) 61 069 53 183 48 506
Land area equipped for irrigation (1 000 ha) 900 900 1 090
Agric. area actually irrigated (% agric. area) 1.5
Employment in agriculture (%) 24.6 20.7 16.1
Employment in agriculture, female (%) 6.5 7.0 6.8
Fertilizers use, nitrogen (1 000 t nutrients) 481.6 564.9
Fertilizers use, phosphate (1 000 t nutrients) 198.4 207.4
Fertilizers use, potash (1 000 t nutrients) 221.8 341.3
Agric. value added per worker (constant USD) 5 236 4 841 5 802
Hunger dimensions Average dietary energy supply (kcal/cap/day) 2 760 2 977
Average dietary energy supply adequacy (%) 119 127
Dietary energy supply, cereals/roots/tubers (%) 35 34
Prevalence of undernourishment (%) 9.7 6.5
Prevalence of severe food insecurity (%) GDP per capita (USD, PPP) 9 264 13 135
Cereal import dependency ratio (%) 55.4 63.8
Stunting, children under 5 (%) 16.2 Wasting, children under 5 (%) 1.5 Safely managed drinking water (% pop. using) 69.2 71.1
Food supply Food production value, net (2004–06 mill. I$) 9 076 11 411 13 476
Agriculture, value added (% GDP) 9 8 7
Food (excl. fish) exports (mill. USD) 836 1 708 2 455
Food (excl. fish) imports (mill. USD) 1 002 1 353 4 117
Production indices (2004–06 = 100) Food 79 99 117
Crops 83 99 115
Cereals 82 100 98
Vegetable oils 59 100 162
Roots and tubers 119 94 120
Fruit and vegetables 67 99 125
Sugar 82 102 94
Livestock 80 98 116
Milk 78 97 82
Meat 82 99 130
Fish 95 103 104
Net trade (mill. USD) Cereals and preparations -474 -596 -1 629
Fruit and vegetables 325 425 587
Meat and meat preparations -23 -5 -189
Dairy products (milk equivalent) -16 49 -135
Fish 131 50 -261
Environment Forest area (% total land area) 57 54 53
Agricultural area (% total land area) 40 38 40
Freshwater withdrawal (% tot renewable) 0.4 0.5 Terrestrial protected areas (% total land area) 14
Organic area (ha) 46 32
Wood pellet production (1 000 t) Emissions in agriculture (CO2 eq. Gg) 53 452 55 826 50 978
Net emissions in land use (CO2 eq. Gg) 148 876 170 197 18 233

88
Comoros
1995 2005 2016
The setting Population, total (mill.) 0.5 0.6 0.8
Rural population, total (mill.) 0.3 0.4 0.6
Govt. expenditure on agric. (% total outlays) Area harvested, crops (mill. ha) 0.1 0.1 0.1
Cropping intensity ratio 0.8 0.8 1.0
Total renewable water resources per cap. (m³) 2 369 1 848 1 508
Land area equipped for irrigation (1 000 ha) 0 0 0
Agric. area actually irrigated (% agric. area) Employment in agriculture (%) 57.1 55.8 55.2
Employment in agriculture, female (%) 65.1 63.3 61.9
Fertilizers use, nitrogen (1 000 t nutrients) Fertilizers use, phosphate (1 000 t nutrients) Fertilizers use, potash (1 000 t nutrients) Agric. value added per worker (constant USD) 2 191 2 442 2 377
Hunger dimensions Average dietary energy supply (kcal/cap/day) 2 391 2 325
Average dietary energy supply adequacy (%) 110 105
Dietary energy supply, cereals/roots/tubers (%) Prevalence of undernourishment (%) Prevalence of severe food insecurity (%) GDP per capita (USD, PPP) 1 472 1 411
Cereal import dependency ratio (%) Stunting, children under 5 (%) Wasting, children under 5 (%) Safely managed drinking water (% pop. using) Food supply Food production value, net (2004–06 mill. I$) 59 63 71
Agriculture, value added (% GDP) 30 36 42
Food (excl. fish) exports (mill. USD) 7 13 46
Food (excl. fish) imports (mill. USD) 27 38 103
Production indices (2004–06 = 100) Food 89 96 109
Crops 88 96 109
Cereals 90 95 181
Vegetable oils 88 101 125
Roots and tubers 84 100 113
Fruit and vegetables 87 99 72
Sugar Livestock 99 100 109
Milk 98 100 108
Meat 101 99 112
Fish 122 100 153
Net trade (mill. USD) Cereals and preparations -16 -16 -37
Fruit and vegetables -1 -2 -36
Meat and meat preparations -4 -11 -19
Dairy products (milk equivalent) -1 -2 -2
Fish 0 -1 -3
Environment Forest area (% total land area) 25 23 20
Agricultural area (% total land area) 66 71 71
Freshwater withdrawal (% tot renewable) Terrestrial protected areas (% total land area) 10
Organic area (ha) 1 3
Wood pellet production (1 000 t) Emissions in agriculture (CO2 eq. Gg) 178 183 261
Net emissions in land use (CO2 eq. Gg) 57 91 68

89
Congo
1995 2005 2016
The setting Population, total (mill.) 2.8 3.7 5.3
Rural population, total (mill.) 1.2 1.4 1.7
Govt. expenditure on agric. (% total outlays) 1.4 Area harvested, crops (mill. ha) 0.2 0.3 0.4
Cropping intensity ratio 0.4 0.5 0.6
Total renewable water resources per cap. (m³) 289 492 223 897 162 315
Land area equipped for irrigation (1 000 ha) 2 2 2
Agric. area actually irrigated (% agric. area) Employment in agriculture (%) 40.3 40.0 36.7
Employment in agriculture, female (%) 41.4 41.5 37.7
Fertilizers use, nitrogen (1 000 t nutrients) 0.0 0.3
Fertilizers use, phosphate (1 000 t nutrients) 0.0 0.1
Fertilizers use, potash (1 000 t nutrients) 0.5 0.7
Agric. value added per worker (constant USD) 793 801 1 005
Hunger dimensions Average dietary energy supply (kcal/cap/day) 2 047 2 078
Average dietary energy supply adequacy (%) 93 94
Dietary energy supply, cereals/roots/tubers (%) 59 60
Prevalence of undernourishment (%) 40.2 37.5
Prevalence of severe food insecurity (%) GDP per capita (USD, PPP) 4 743 5 251
Cereal import dependency ratio (%) 89.5 91.7
Stunting, children under 5 (%) 31.2 21.2
Wasting, children under 5 (%) 8.0 8.2
Safely managed drinking water (% pop. using) 31.6 37.0
Food supply Food production value, net (2004–06 mill. I$) 236 325 447
Agriculture, value added (% GDP) 10 5 9
Food (excl. fish) exports (mill. USD) 9 29 14
Food (excl. fish) imports (mill. USD) 97 148 553
Production indices (2004–06 = 100) Food 73 100 138
Crops 77 100 126
Cereals 50 101 133
Vegetable oils 89 95 89
Roots and tubers 77 100 136
Fruit and vegetables 73 100 122
Sugar 69 104 116
Livestock 57 101 177
Milk 80 108 156
Meat 57 101 178
Fish 81 96 153
Net trade (mill. USD) Cereals and preparations -36 -72 -200
Fruit and vegetables -4 -8 -28
Meat and meat preparations -30 -21 -177
Dairy products (milk equivalent) -13 -14 -25
Fish -17 -10 -70
Environment Forest area (% total land area) 66 66 65
Agricultural area (% total land area) 31 31 31
Freshwater withdrawal (% tot renewable) 0.0 Terrestrial protected areas (% total land area) 41
Organic area (ha) Wood pellet production (1 000 t) Emissions in agriculture (CO2 eq. Gg) 1 069 1 273 1 553
Net emissions in land use (CO2 eq. Gg) 13 864 14 310 13 303

90
Cook Islands
1995 2005 2016
The setting Population, total (mill.) 0.0 0.0 0.0
Rural population, total (mill.) 0.0 0.0 0.0
Govt. expenditure on agric. (% total outlays) Area harvested, crops (mill. ha) 0.0 0.0 0.0
Cropping intensity ratio 0.6 0.5 1.1
Total renewable water resources per cap. (m³) Land area equipped for irrigation (1 000 ha) Agric. area actually irrigated (% agric. area) Employment in agriculture (%) Employment in agriculture, female (%) Fertilizers use, nitrogen (1 000 t nutrients) 0.0 0.0
Fertilizers use, phosphate (1 000 t nutrients) 0.0 0.0
Fertilizers use, potash (1 000 t nutrients) 0.0 0.0
Agric. value added per worker (constant USD) Hunger dimensions Average dietary energy supply (kcal/cap/day) Average dietary energy supply adequacy (%) Dietary energy supply, cereals/roots/tubers (%) Prevalence of undernourishment (%) Prevalence of severe food insecurity (%) GDP per capita (USD, PPP) Cereal import dependency ratio (%) Stunting, children under 5 (%) Wasting, children under 5 (%) Safely managed drinking water (% pop. using) Food supply Food production value, net (2004–06 mill. I$) 4 2 2
Agriculture, value added (% GDP) 8 7 8
Food (excl. fish) exports (mill. USD) 0 2 0
Food (excl. fish) imports (mill. USD) 8 16 24
Production indices (2004–06 = 100) Food 155 100 91
Crops 189 100 83
Cereals Vegetable oils 189 87 86
Roots and tubers 154 102 60
Fruit and vegetables 203 102 95
Sugar Livestock 93 99 107
Milk Meat 89 99 103
Fish 27 100 56
Net trade (mill. USD) Cereals and preparations -3
Fruit and vegetables 0 -1 -3
Meat and meat preparations -8
Dairy products (milk equivalent) -3
Fish 0 1 3
Environment Forest area (% total land area) 61 63 63
Agricultural area (% total land area) 21 11 6
Freshwater withdrawal (% tot renewable) Terrestrial protected areas (% total land area) Organic area (ha) 0
Wood pellet production (1 000 t) Emissions in agriculture (CO2 eq. Gg) 15 14 14
Net emissions in land use (CO2 eq. Gg) -50 -10 0
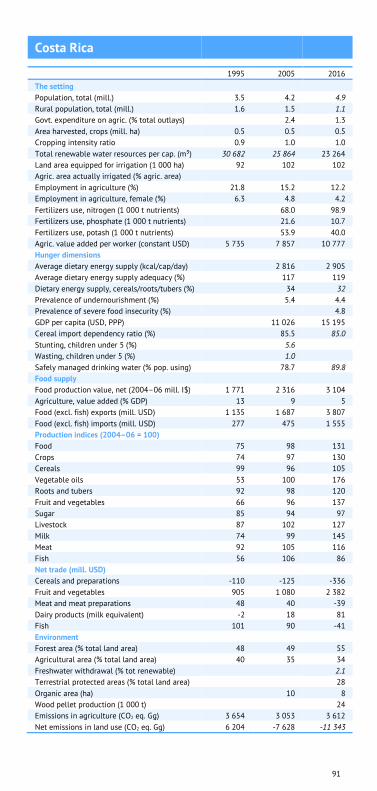
91
Costa Rica
1995 2005 2016
The setting Population, total (mill.) 3.5 4.2 4.9
Rural population, total (mill.) 1.6 1.5 1.1
Govt. expenditure on agric. (% total outlays) 2.4 1.3
Area harvested, crops (mill. ha) 0.5 0.5 0.5
Cropping intensity ratio 0.9 1.0 1.0
Total renewable water resources per cap. (m³) 30 682 25 864 23 264
Land area equipped for irrigation (1 000 ha) 92 102 102
Agric. area actually irrigated (% agric. area) Employment in agriculture (%) 21.8 15.2 12.2
Employment in agriculture, female (%) 6.3 4.8 4.2
Fertilizers use, nitrogen (1 000 t nutrients) 68.0 98.9
Fertilizers use, phosphate (1 000 t nutrients) 21.6 10.7
Fertilizers use, potash (1 000 t nutrients) 53.9 40.0
Agric. value added per worker (constant USD) 5 735 7 857 10 777
Hunger dimensions Average dietary energy supply (kcal/cap/day) 2 816 2 905
Average dietary energy supply adequacy (%) 117 119
Dietary energy supply, cereals/roots/tubers (%) 34 32
Prevalence of undernourishment (%) 5.4 4.4
Prevalence of severe food insecurity (%) 4.8
GDP per capita (USD, PPP) 11 026 15 195
Cereal import dependency ratio (%) 85.5 85.0
Stunting, children under 5 (%) 5.6 Wasting, children under 5 (%) 1.0 Safely managed drinking water (% pop. using) 78.7 89.8
Food supply Food production value, net (2004–06 mill. I$) 1 771 2 316 3 104
Agriculture, value added (% GDP) 13 9 5
Food (excl. fish) exports (mill. USD) 1 135 1 687 3 807
Food (excl. fish) imports (mill. USD) 277 475 1 555
Production indices (2004–06 = 100) Food 75 98 131
Crops 74 97 130
Cereals 99 96 105
Vegetable oils 53 100 176
Roots and tubers 92 98 120
Fruit and vegetables 66 96 137
Sugar 85 94 97
Livestock 87 102 127
Milk 74 99 145
Meat 92 105 116
Fish 56 106 86
Net trade (mill. USD) Cereals and preparations -110 -125 -336
Fruit and vegetables 905 1 080 2 382
Meat and meat preparations 48 40 -39
Dairy products (milk equivalent) -2 18 81
Fish 101 90 -41
Environment Forest area (% total land area) 48 49 55
Agricultural area (% total land area) 40 35 34
Freshwater withdrawal (% tot renewable) 2.1
Terrestrial protected areas (% total land area) 28
Organic area (ha) 10 8
Wood pellet production (1 000 t) 24
Emissions in agriculture (CO2 eq. Gg) 3 654 3 053 3 612
Net emissions in land use (CO2 eq. Gg) 6 204 -7 628 -11 343

92
Côte d'Ivoire
1995 2005 2016
The setting Population, total (mill.) 14.5 18.3 24.3
Rural population, total (mill.) 8.4 9.2 9.9
Govt. expenditure on agric. (% total outlays) 5.1
Area harvested, crops (mill. ha) 6.3 6.8 10.3
Cropping intensity ratio 0.9 1.0 1.4
Total renewable water resources per cap. (m³) 5 501 4 461 3 551
Land area equipped for irrigation (1 000 ha) 73 73 73
Agric. area actually irrigated (% agric. area) Employment in agriculture (%) 51.7 50.5 48.9
Employment in agriculture, female (%) 47.1 46.2 41.1
Fertilizers use, nitrogen (1 000 t nutrients) 16.2 56.7
Fertilizers use, phosphate (1 000 t nutrients) 10.7 43.8
Fertilizers use, potash (1 000 t nutrients) 22.9 49.3
Agric. value added per worker (constant USD) 2 008 2 109
Hunger dimensions Average dietary energy supply (kcal/cap/day) 2 627 2 625
Average dietary energy supply adequacy (%) 120 119
Dietary energy supply, cereals/roots/tubers (%) 65 66
Prevalence of undernourishment (%) 20.0 20.7
Prevalence of severe food insecurity (%) GDP per capita (USD, PPP) 2 682 3 425
Cereal import dependency ratio (%) 51.7 53.5
Stunting, children under 5 (%) 40.1 21.6
Wasting, children under 5 (%) 8.4 6.0
Safely managed drinking water (% pop. using) 39.7 45.8
Food supply Food production value, net (2004–06 mill. I$) 3 743 4 693 6 220
Agriculture, value added (% GDP) 24 23 19
Food (excl. fish) exports (mill. USD) 1 509 2 452 5 803
Food (excl. fish) imports (mill. USD) 398 609 1 331
Production indices (2004–06 = 100) Food 78 98 130
Crops 77 100 128
Cereals 94 101 204
Vegetable oils 96 91 138
Roots and tubers 70 99 120
Fruit and vegetables 90 100 100
Sugar 81 100 136
Livestock 80 100 133
Milk 77 100 103
Meat 83 100 134
Fish 137 85 140
Net trade (mill. USD) Cereals and preparations -192 -335 -778
Fruit and vegetables 147 212 591
Meat and meat preparations -9 -46 -73
Dairy products (milk equivalent) -43 -45 -70
Fish 72 -102 -271
Environment Forest area (% total land area) 32 33 33
Agricultural area (% total land area) 62 64 65
Freshwater withdrawal (% tot renewable) 1.5 1.8 Terrestrial protected areas (% total land area) 23
Organic area (ha) 13 42
Wood pellet production (1 000 t) Emissions in agriculture (CO2 eq. Gg) 4 899 5 465 5 716
Net emissions in land use (CO2 eq. Gg) -5 699 -9 032 5 589
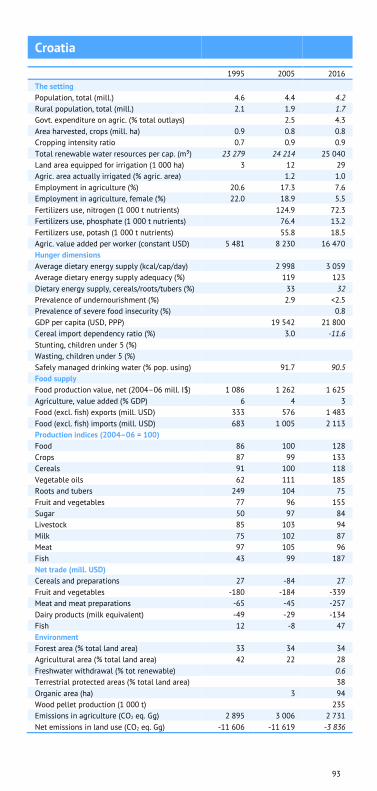
93
Croatia
1995 2005 2016
The setting Population, total (mill.) 4.6 4.4 4.2
Rural population, total (mill.) 2.1 1.9 1.7
Govt. expenditure on agric. (% total outlays) 2.5 4.3
Area harvested, crops (mill. ha) 0.9 0.8 0.8
Cropping intensity ratio 0.7 0.9 0.9
Total renewable water resources per cap. (m³) 23 279 24 214 25 040
Land area equipped for irrigation (1 000 ha) 3 12 29
Agric. area actually irrigated (% agric. area) 1.2 1.0
Employment in agriculture (%) 20.6 17.3 7.6
Employment in agriculture, female (%) 22.0 18.9 5.5
Fertilizers use, nitrogen (1 000 t nutrients) 124.9 72.3
Fertilizers use, phosphate (1 000 t nutrients) 76.4 13.2
Fertilizers use, potash (1 000 t nutrients) 55.8 18.5
Agric. value added per worker (constant USD) 5 481 8 230 16 470
Hunger dimensions Average dietary energy supply (kcal/cap/day) 2 998 3 059
Average dietary energy supply adequacy (%) 119 123
Dietary energy supply, cereals/roots/tubers (%) 33 32
Prevalence of undernourishment (%) 2.9 <2.5
Prevalence of severe food insecurity (%) 0.8
GDP per capita (USD, PPP) 19 542 21 800
Cereal import dependency ratio (%) 3.0 -11.6
Stunting, children under 5 (%) Wasting, children under 5 (%) Safely managed drinking water (% pop. using) 91.7 90.5
Food supply Food production value, net (2004–06 mill. I$) 1 086 1 262 1 625
Agriculture, value added (% GDP) 6 4 3
Food (excl. fish) exports (mill. USD) 333 576 1 483
Food (excl. fish) imports (mill. USD) 683 1 005 2 113
Production indices (2004–06 = 100) Food 86 100 128
Crops 87 99 133
Cereals 91 100 118
Vegetable oils 62 111 185
Roots and tubers 249 104 75
Fruit and vegetables 77 96 155
Sugar 50 97 84
Livestock 85 103 94
Milk 75 102 87
Meat 97 105 96
Fish 43 99 187
Net trade (mill. USD) Cereals and preparations 27 -84 27
Fruit and vegetables -180 -184 -339
Meat and meat preparations -65 -45 -257
Dairy products (milk equivalent) -49 -29 -134
Fish 12 -8 47
Environment Forest area (% total land area) 33 34 34
Agricultural area (% total land area) 42 22 28
Freshwater withdrawal (% tot renewable) 0.6
Terrestrial protected areas (% total land area) 38
Organic area (ha) 3 94
Wood pellet production (1 000 t) 235
Emissions in agriculture (CO2 eq. Gg) 2 895 3 006 2 731
Net emissions in land use (CO2 eq. Gg) -11 606 -11 619 -3 836

94
Cuba
1995 2005 2016
The setting Population, total (mill.) 10.9 11.3 11.5
Rural population, total (mill.) 2.8 2.7 2.5
Govt. expenditure on agric. (% total outlays) Area harvested, crops (mill. ha) 2.2 1.8 1.5
Cropping intensity ratio 0.5 0.4 0.4
Total renewable water resources per cap. (m³) 3 465 3 378 3 322
Land area equipped for irrigation (1 000 ha) 877 710 560
Agric. area actually irrigated (% agric. area) Employment in agriculture (%) 25.1 20.2 18.3
Employment in agriculture, female (%) 12.8 9.4 7.8
Fertilizers use, nitrogen (1 000 t nutrients) 30.7 78.5
Fertilizers use, phosphate (1 000 t nutrients) 13.8 31.1
Fertilizers use, potash (1 000 t nutrients) 37.7 38.2
Agric. value added per worker (constant USD) 1 984 2 327 2 858
Hunger dimensions Average dietary energy supply (kcal/cap/day) 3 287 3 594
Average dietary energy supply adequacy (%) 134 147
Dietary energy supply, cereals/roots/tubers (%) 47 45
Prevalence of undernourishment (%) <2.5 <2.5
Prevalence of severe food insecurity (%) GDP per capita (USD, PPP) Cereal import dependency ratio (%) 73.3 72.2
Stunting, children under 5 (%) Wasting, children under 5 (%) Safely managed drinking water (% pop. using) Food supply Food production value, net (2004–06 mill. I$) 2 405 2 554 2 998
Agriculture, value added (% GDP) 7 5 4
Food (excl. fish) exports (mill. USD) 764 196 396
Food (excl. fish) imports (mill. USD) 612 1 295 1 789
Production indices (2004–06 = 100) Food 88 94 110
Crops 72 97 93
Cereals 72 90 118
Vegetable oils 62 100 57
Roots and tubers 33 106 95
Fruit and vegetables 31 103 80
Sugar 217 75 122
Livestock 118 96 145
Milk 149 83 144
Meat 117 100 150
Fish 186 92 96
Net trade (mill. USD) Cereals and preparations -545 -745
Fruit and vegetables -32 -97 -156
Meat and meat preparations -40 -172 -392
Dairy products (milk equivalent) -97 -180 -160
Fish 99 23 27
Environment Forest area (% total land area) 21 25 31
Agricultural area (% total land area) 62 62 60
Freshwater withdrawal (% tot renewable) 13.7 13.0 18.3
Terrestrial protected areas (% total land area) 17
Organic area (ha) 15 1
Wood pellet production (1 000 t) Emissions in agriculture (CO2 eq. Gg) 10 953 8 927 10 142
Net emissions in land use (CO2 eq. Gg) -34 737 -32 592 -13 946

95
Cyprus
1995 2005 2016
The setting Population, total (mill.) 0.9 1.0 1.2
Rural population, total (mill.) 0.3 0.3 0.4
Govt. expenditure on agric. (% total outlays) 3.8 2.1
Area harvested, crops (mill. ha) 0.1 0.1 0.1
Cropping intensity ratio 0.8 0.7 0.5
Total renewable water resources per cap. (m³) 876 734 667
Land area equipped for irrigation (1 000 ha) 40 45 46
Agric. area actually irrigated (% agric. area) 21.0 22.3
Employment in agriculture (%) 5.3 4.7 3.6
Employment in agriculture, female (%) 4.8 3.4 1.6
Fertilizers use, nitrogen (1 000 t nutrients) 7.2 8.0
Fertilizers use, phosphate (1 000 t nutrients) 4.9 5.4
Fertilizers use, potash (1 000 t nutrients) 1.3 3.3
Agric. value added per worker (constant USD) 35 709 30 592 21 655
Hunger dimensions Average dietary energy supply (kcal/cap/day) 2 675 2 749
Average dietary energy supply adequacy (%) 106 108
Dietary energy supply, cereals/roots/tubers (%) 23 28
Prevalence of undernourishment (%) 5.7 4.6
Prevalence of severe food insecurity (%) GDP per capita (USD, PPP) 33 663 31 442
Cereal import dependency ratio (%) 100.0 100.0
Stunting, children under 5 (%) Wasting, children under 5 (%) Safely managed drinking water (% pop. using) 96.5 99.6
Food supply Food production value, net (2004–06 mill. I$) 432 386 310
Agriculture, value added (% GDP) 5 3 2
Food (excl. fish) exports (mill. USD) 212 160 296
Food (excl. fish) imports (mill. USD) 272 456 702
Production indices (2004–06 = 100) Food 110 99 79
Crops 138 95 64
Cereals 192 83 69
Vegetable oils 66 80 63
Roots and tubers 173 113 56
Fruit and vegetables 133 94 66
Sugar Livestock 91 101 89
Milk 91 97 103
Meat 90 103 84
Fish 17 108 14
Net trade (mill. USD) Cereals and preparations -97 -149 -194
Fruit and vegetables 141 28 -19
Meat and meat preparations -19 -36 -96
Dairy products (milk equivalent) -10 -12 77
Fish -35 -24 -63
Environment Forest area (% total land area) 18 19 19
Agricultural area (% total land area) 15 18 12
Freshwater withdrawal (% tot renewable) 26.7 21.0 28.4
Terrestrial protected areas (% total land area) 19
Organic area (ha) 2 5 550
Wood pellet production (1 000 t) 0
Emissions in agriculture (CO2 eq. Gg) 422 405 376
Net emissions in land use (CO2 eq. Gg) -66 -114 -304
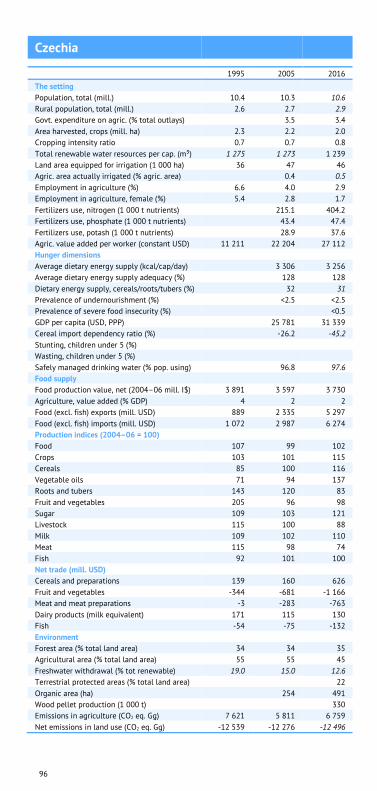
96
Czechia
1995 2005 2016
The setting Population, total (mill.) 10.4 10.3 10.6
Rural population, total (mill.) 2.6 2.7 2.9
Govt. expenditure on agric. (% total outlays) 3.5 3.4
Area harvested, crops (mill. ha) 2.3 2.2 2.0
Cropping intensity ratio 0.7 0.7 0.8
Total renewable water resources per cap. (m³) 1 275 1 273 1 239
Land area equipped for irrigation (1 000 ha) 36 47 46
Agric. area actually irrigated (% agric. area) 0.4 0.5
Employment in agriculture (%) 6.6 4.0 2.9
Employment in agriculture, female (%) 5.4 2.8 1.7
Fertilizers use, nitrogen (1 000 t nutrients) 215.1 404.2
Fertilizers use, phosphate (1 000 t nutrients) 43.4 47.4
Fertilizers use, potash (1 000 t nutrients) 28.9 37.6
Agric. value added per worker (constant USD) 11 211 22 204 27 112
Hunger dimensions Average dietary energy supply (kcal/cap/day) 3 306 3 256
Average dietary energy supply adequacy (%) 128 128
Dietary energy supply, cereals/roots/tubers (%) 32 31
Prevalence of undernourishment (%) <2.5 <2.5
Prevalence of severe food insecurity (%) <0.5
GDP per capita (USD, PPP) 25 781 31 339
Cereal import dependency ratio (%) -26.2 -45.2
Stunting, children under 5 (%) Wasting, children under 5 (%) Safely managed drinking water (% pop. using) 96.8 97.6
Food supply Food production value, net (2004–06 mill. I$) 3 891 3 597 3 730
Agriculture, value added (% GDP) 4 2 2
Food (excl. fish) exports (mill. USD) 889 2 335 5 297
Food (excl. fish) imports (mill. USD) 1 072 2 987 6 274
Production indices (2004–06 = 100) Food 107 99 102
Crops 103 101 115
Cereals 85 100 116
Vegetable oils 71 94 137
Roots and tubers 143 120 83
Fruit and vegetables 205 96 98
Sugar 109 103 121
Livestock 115 100 88
Milk 109 102 110
Meat 115 98 74
Fish 92 101 100
Net trade (mill. USD) Cereals and preparations 139 160 626
Fruit and vegetables -344 -681 -1 166
Meat and meat preparations -3 -283 -763
Dairy products (milk equivalent) 171 115 130
Fish -54 -75 -132
Environment Forest area (% total land area) 34 34 35
Agricultural area (% total land area) 55 55 45
Freshwater withdrawal (% tot renewable) 19.0 15.0 12.6
Terrestrial protected areas (% total land area) 22
Organic area (ha) 254 491
Wood pellet production (1 000 t) 330
Emissions in agriculture (CO2 eq. Gg) 7 621 5 811 6 759
Net emissions in land use (CO2 eq. Gg) -12 539 -12 276 -12 496
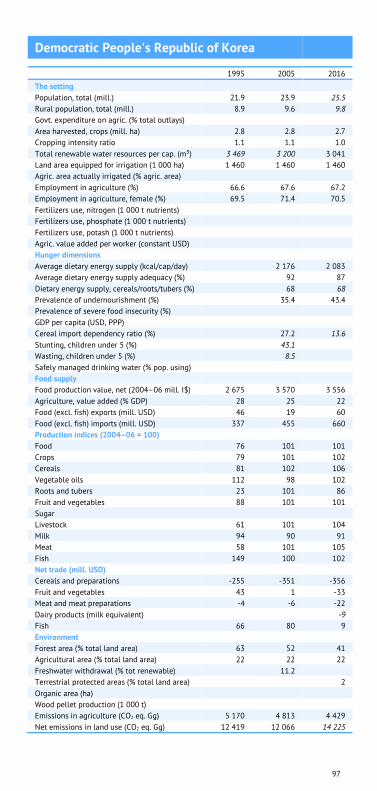
97
Democratic People's Republic of Korea
1995 2005 2016
The setting Population, total (mill.) 21.9 23.9 25.5
Rural population, total (mill.) 8.9 9.6 9.8
Govt. expenditure on agric. (% total outlays) Area harvested, crops (mill. ha) 2.8 2.8 2.7
Cropping intensity ratio 1.1 1.1 1.0
Total renewable water resources per cap. (m³) 3 469 3 200 3 041
Land area equipped for irrigation (1 000 ha) 1 460 1 460 1 460
Agric. area actually irrigated (% agric. area) Employment in agriculture (%) 66.6 67.6 67.2
Employment in agriculture, female (%) 69.5 71.4 70.5
Fertilizers use, nitrogen (1 000 t nutrients) Fertilizers use, phosphate (1 000 t nutrients) Fertilizers use, potash (1 000 t nutrients) Agric. value added per worker (constant USD) Hunger dimensions Average dietary energy supply (kcal/cap/day) 2 176 2 083
Average dietary energy supply adequacy (%) 92 87
Dietary energy supply, cereals/roots/tubers (%) 68 68
Prevalence of undernourishment (%) 35.4 43.4
Prevalence of severe food insecurity (%) GDP per capita (USD, PPP) Cereal import dependency ratio (%) 27.2 13.6
Stunting, children under 5 (%) 43.1 Wasting, children under 5 (%) 8.5 Safely managed drinking water (% pop. using) Food supply Food production value, net (2004–06 mill. I$) 2 675 3 570 3 556
Agriculture, value added (% GDP) 28 25 22
Food (excl. fish) exports (mill. USD) 46 19 60
Food (excl. fish) imports (mill. USD) 337 455 660
Production indices (2004–06 = 100) Food 76 101 101
Crops 79 101 102
Cereals 81 102 106
Vegetable oils 112 98 102
Roots and tubers 23 101 86
Fruit and vegetables 88 101 101
Sugar Livestock 61 101 104
Milk 94 90 91
Meat 58 101 105
Fish 149 100 102
Net trade (mill. USD) Cereals and preparations -255 -351 -356
Fruit and vegetables 43 1 -33
Meat and meat preparations -4 -6 -22
Dairy products (milk equivalent) -9
Fish 66 80 9
Environment Forest area (% total land area) 63 52 41
Agricultural area (% total land area) 22 22 22
Freshwater withdrawal (% tot renewable) 11.2 Terrestrial protected areas (% total land area) 2
Organic area (ha) Wood pellet production (1 000 t) Emissions in agriculture (CO2 eq. Gg) 5 170 4 813 4 429
Net emissions in land use (CO2 eq. Gg) 12 419 12 066 14 225
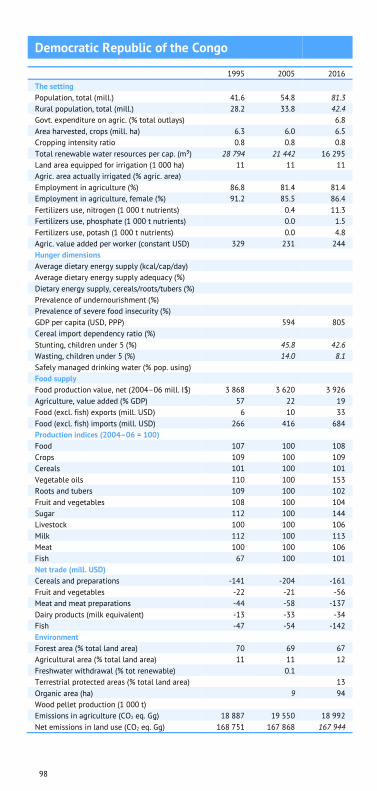
98
Democratic Republic of the Congo
1995 2005 2016
The setting Population, total (mill.) 41.6 54.8 81.3
Rural population, total (mill.) 28.2 33.8 42.4
Govt. expenditure on agric. (% total outlays) 6.8
Area harvested, crops (mill. ha) 6.3 6.0 6.5
Cropping intensity ratio 0.8 0.8 0.8
Total renewable water resources per cap. (m³) 28 794 21 442 16 295
Land area equipped for irrigation (1 000 ha) 11 11 11
Agric. area actually irrigated (% agric. area) Employment in agriculture (%) 86.8 81.4 81.4
Employment in agriculture, female (%) 91.2 85.5 86.4
Fertilizers use, nitrogen (1 000 t nutrients) 0.4 11.3
Fertilizers use, phosphate (1 000 t nutrients) 0.0 1.5
Fertilizers use, potash (1 000 t nutrients) 0.0 4.8
Agric. value added per worker (constant USD) 329 231 244
Hunger dimensions Average dietary energy supply (kcal/cap/day) Average dietary energy supply adequacy (%) Dietary energy supply, cereals/roots/tubers (%) Prevalence of undernourishment (%) Prevalence of severe food insecurity (%) GDP per capita (USD, PPP) 594 805
Cereal import dependency ratio (%) Stunting, children under 5 (%) 45.8 42.6
Wasting, children under 5 (%) 14.0 8.1
Safely managed drinking water (% pop. using) Food supply Food production value, net (2004–06 mill. I$) 3 868 3 620 3 926
Agriculture, value added (% GDP) 57 22 19
Food (excl. fish) exports (mill. USD) 6 10 33
Food (excl. fish) imports (mill. USD) 266 416 684
Production indices (2004–06 = 100) Food 107 100 108
Crops 109 100 109
Cereals 101 100 101
Vegetable oils 110 100 153
Roots and tubers 109 100 102
Fruit and vegetables 108 100 104
Sugar 112 100 144
Livestock 100 100 106
Milk 112 100 113
Meat 100 100 106
Fish 67 100 101
Net trade (mill. USD) Cereals and preparations -141 -204 -161
Fruit and vegetables -22 -21 -56
Meat and meat preparations -44 -58 -137
Dairy products (milk equivalent) -13 -33 -34
Fish -47 -54 -142
Environment Forest area (% total land area) 70 69 67
Agricultural area (% total land area) 11 11 12
Freshwater withdrawal (% tot renewable) 0.1 Terrestrial protected areas (% total land area) 13
Organic area (ha) 9 94
Wood pellet production (1 000 t) Emissions in agriculture (CO2 eq. Gg) 18 887 19 550 18 992
Net emissions in land use (CO2 eq. Gg) 168 751 167 868 167 944
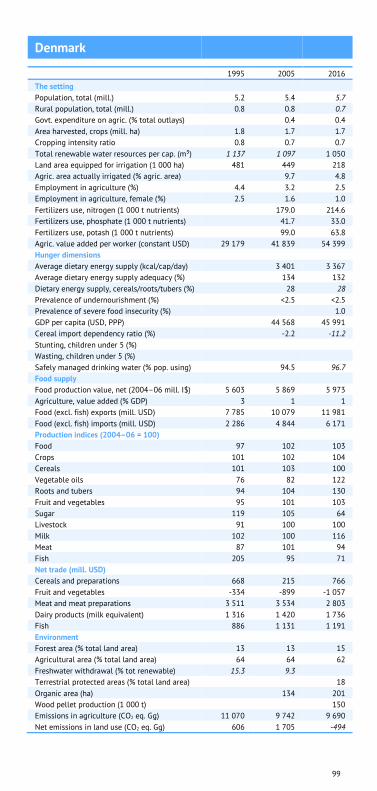
99
Denmark
1995 2005 2016
The setting Population, total (mill.) 5.2 5.4 5.7
Rural population, total (mill.) 0.8 0.8 0.7
Govt. expenditure on agric. (% total outlays) 0.4 0.4
Area harvested, crops (mill. ha) 1.8 1.7 1.7
Cropping intensity ratio 0.8 0.7 0.7
Total renewable water resources per cap. (m³) 1 137 1 097 1 050
Land area equipped for irrigation (1 000 ha) 481 449 218
Agric. area actually irrigated (% agric. area) 9.7 4.8
Employment in agriculture (%) 4.4 3.2 2.5
Employment in agriculture, female (%) 2.5 1.6 1.0
Fertilizers use, nitrogen (1 000 t nutrients) 179.0 214.6
Fertilizers use, phosphate (1 000 t nutrients) 41.7 33.0
Fertilizers use, potash (1 000 t nutrients) 99.0 63.8
Agric. value added per worker (constant USD) 29 179 41 839 54 399
Hunger dimensions Average dietary energy supply (kcal/cap/day) 3 401 3 367
Average dietary energy supply adequacy (%) 134 132
Dietary energy supply, cereals/roots/tubers (%) 28 28
Prevalence of undernourishment (%) <2.5 <2.5
Prevalence of severe food insecurity (%) 1.0
GDP per capita (USD, PPP) 44 568 45 991
Cereal import dependency ratio (%) -2.2 -11.2
Stunting, children under 5 (%) Wasting, children under 5 (%) Safely managed drinking water (% pop. using) 94.5 96.7
Food supply Food production value, net (2004–06 mill. I$) 5 603 5 869 5 973
Agriculture, value added (% GDP) 3 1 1
Food (excl. fish) exports (mill. USD) 7 785 10 079 11 981
Food (excl. fish) imports (mill. USD) 2 286 4 844 6 171
Production indices (2004–06 = 100) Food 97 102 103
Crops 101 102 104
Cereals 101 103 100
Vegetable oils 76 82 122
Roots and tubers 94 104 130
Fruit and vegetables 95 101 103
Sugar 119 105 64
Livestock 91 100 100
Milk 102 100 116
Meat 87 101 94
Fish 205 95 71
Net trade (mill. USD) Cereals and preparations 668 215 766
Fruit and vegetables -334 -899 -1 057
Meat and meat preparations 3 511 3 534 2 803
Dairy products (milk equivalent) 1 316 1 420 1 736
Fish 886 1 131 1 191
Environment Forest area (% total land area) 13 13 15
Agricultural area (% total land area) 64 64 62
Freshwater withdrawal (% tot renewable) 15.3 9.3 Terrestrial protected areas (% total land area) 18
Organic area (ha) 134 201
Wood pellet production (1 000 t) 150
Emissions in agriculture (CO2 eq. Gg) 11 070 9 742 9 690
Net emissions in land use (CO2 eq. Gg) 606 1 705 -494

100
Djibouti
1995 2005 2016
The setting Population, total (mill.) 0.6 0.8 1.0
Rural population, total (mill.) 0.2 0.2 0.2
Govt. expenditure on agric. (% total outlays) Area harvested, crops (mill. ha) 0.0 0.0 0.0
Cropping intensity ratio 11.7 12.0 5.9
Total renewable water resources per cap. (m³) 438 375 318
Land area equipped for irrigation (1 000 ha) 1 1 1
Agric. area actually irrigated (% agric. area) Employment in agriculture (%) 33.5 36.1 30.5
Employment in agriculture, female (%) 29.8 32.5 28.2
Fertilizers use, nitrogen (1 000 t nutrients) Fertilizers use, phosphate (1 000 t nutrients) Fertilizers use, potash (1 000 t nutrients) Agric. value added per worker (constant USD) Hunger dimensions Average dietary energy supply (kcal/cap/day) 2 239 2 575
Average dietary energy supply adequacy (%) 97 108
Dietary energy supply, cereals/roots/tubers (%) 55 56
Prevalence of undernourishment (%) 32.2 19.7
Prevalence of severe food insecurity (%) GDP per capita (USD, PPP) Cereal import dependency ratio (%) 100.0 100.0
Stunting, children under 5 (%) 32.6 Wasting, children under 5 (%) 26.0 Safely managed drinking water (% pop. using) Food supply Food production value, net (2004–06 mill. I$) 42 52 73
Agriculture, value added (% GDP) 3 3 3
Food (excl. fish) exports (mill. USD) 4 15 63
Food (excl. fish) imports (mill. USD) 74 143 860
Production indices (2004–06 = 100) Food 76 95 133
Crops 85 102 129
Cereals 104 93 143
Vegetable oils Roots and tubers Fruit and vegetables 82 101 128
Sugar 100 100 102
Livestock 74 94 134
Milk 89 103 104
Meat 73 93 137
Fish 26 116 164
Net trade (mill. USD) Cereals and preparations -33 -53 -232
Fruit and vegetables -4 -11 -48
Meat and meat preparations -5 -9 -5
Dairy products (milk equivalent) -9 -14 -24
Fish -1 -1 -7
Environment Forest area (% total land area) 0 0 0
Agricultural area (% total land area) 63 73 73
Freshwater withdrawal (% tot renewable) Terrestrial protected areas (% total land area) 2
Organic area (ha) Wood pellet production (1 000 t) Emissions in agriculture (CO2 eq. Gg) 574 650 651
Net emissions in land use (CO2 eq. Gg) 0 0 0

101
Dominica
1995 2005 2016
The setting Population, total (mill.) 0.1 0.1 0.1
Rural population, total (mill.) 0.0 0.0 0.0
Govt. expenditure on agric. (% total outlays) Area harvested, crops (mill. ha) 0.0 0.0 0.0
Cropping intensity ratio 1.2 0.9 0.9
Total renewable water resources per cap. (m³) 2 826 2 825 2 719
Land area equipped for irrigation (1 000 ha) 0
Agric. area actually irrigated (% agric. area) Employment in agriculture (%) Employment in agriculture, female (%) Fertilizers use, nitrogen (1 000 t nutrients) 0.4 0.1
Fertilizers use, phosphate (1 000 t nutrients) 0.5 0.2
Fertilizers use, potash (1 000 t nutrients) 0.2 0.2
Agric. value added per worker (constant USD) Hunger dimensions Average dietary energy supply (kcal/cap/day) 2 933 2 985
Average dietary energy supply adequacy (%) 120 122
Dietary energy supply, cereals/roots/tubers (%) 33 36
Prevalence of undernourishment (%) 5.7 5.2
Prevalence of severe food insecurity (%) GDP per capita (USD, PPP) 8 844 10 151
Cereal import dependency ratio (%) 100.0 100.0
Stunting, children under 5 (%) Wasting, children under 5 (%) Safely managed drinking water (% pop. using) Food supply Food production value, net (2004–06 mill. I$) 28 25 28
Agriculture, value added (% GDP) 13 11 15
Food (excl. fish) exports (mill. USD) 24 13 5
Food (excl. fish) imports (mill. USD) 21 24 28
Production indices (2004–06 = 100) Food 114 100 110
Crops 115 99 115
Cereals 89 100 99
Vegetable oils 129 97 76
Roots and tubers 84 102 120
Fruit and vegetables 131 97 117
Sugar 105 100 110
Livestock 94 100 104
Milk 93 102 106
Meat 95 99 102
Fish 141 88 114
Net trade (mill. USD) Cereals and preparations -5 -5 -4
Fruit and vegetables 20 10 -2
Meat and meat preparations -6 -6 -9
Dairy products (milk equivalent) -4 -4 -7
Fish -3 -2 -2
Environment Forest area (% total land area) 65 61 57
Agricultural area (% total land area) 23 29 33
Freshwater withdrawal (% tot renewable) 8.3 8.3 Terrestrial protected areas (% total land area) 22
Organic area (ha) 0
Wood pellet production (1 000 t) Emissions in agriculture (CO2 eq. Gg) 38 34 34
Net emissions in land use (CO2 eq. Gg) -43 12 116

102
Dominican Republic
1995 2005 2016
The setting Population, total (mill.) 7.9 9.2 10.8
Rural population, total (mill.) 3.4 3.0 2.1
Govt. expenditure on agric. (% total outlays) 5.7 1.8
Area harvested, crops (mill. ha) 1.0 0.8 0.9
Cropping intensity ratio 0.7 0.7 0.8
Total renewable water resources per cap. (m³) 2 879 2 473 2 207
Land area equipped for irrigation (1 000 ha) 259 290 307
Agric. area actually irrigated (% agric. area) 9.9 Employment in agriculture (%) 20.8 15.3 12.7
Employment in agriculture, female (%) 3.9 3.1 2.0
Fertilizers use, nitrogen (1 000 t nutrients) 36.8 41.5
Fertilizers use, phosphate (1 000 t nutrients) 3.4 19.7
Fertilizers use, potash (1 000 t nutrients) 7.5 9.4
Agric. value added per worker (constant USD) 2 987 4 380 6 946
Hunger dimensions Average dietary energy supply (kcal/cap/day) 2 304 2 697
Average dietary energy supply adequacy (%) 99 114
Dietary energy supply, cereals/roots/tubers (%) 30 32
Prevalence of undernourishment (%) 24.4 10.4
Prevalence of severe food insecurity (%) GDP per capita (USD, PPP) 9 012 14 120
Cereal import dependency ratio (%) 77.7 74.7
Stunting, children under 5 (%) 10.5 7.1
Wasting, children under 5 (%) 1.9 2.4
Safely managed drinking water (% pop. using) Food supply Food production value, net (2004–06 mill. I$) 1 617 2 088 3 135
Agriculture, value added (% GDP) 10 7 6
Food (excl. fish) exports (mill. USD) 274 302 1 166
Food (excl. fish) imports (mill. USD) 406 603 1 775
Production indices (2004–06 = 100) Food 76 98 148
Crops 83 95 171
Cereals 79 100 134
Vegetable oils 92 98 182
Roots and tubers 107 87 127
Fruit and vegetables 65 95 208
Sugar 107 96 93
Livestock 71 103 110
Milk 83 103 121
Meat 69 103 107
Fish 142 86 120
Net trade (mill. USD) Cereals and preparations -172 -269 -493
Fruit and vegetables 39 33 380
Meat and meat preparations 2 -9 -207
Dairy products (milk equivalent) -75 -23 -197
Fish -36 -64 -158
Environment Forest area (% total land area) 27 34 42
Agricultural area (% total land area) 53 50 49
Freshwater withdrawal (% tot renewable) 23.2 Terrestrial protected areas (% total land area) 23
Organic area (ha) 72 205
Wood pellet production (1 000 t) Emissions in agriculture (CO2 eq. Gg) 5 702 6 316 7 985
Net emissions in land use (CO2 eq. Gg) -9 988 -8 477 -8 702

103
Ecuador
1995 2005 2016
The setting Population, total (mill.) 11.4 13.7 16.6
Rural population, total (mill.) 4.8 5.3 6.0
Govt. expenditure on agric. (% total outlays) 0.7 2.5
Area harvested, crops (mill. ha) 2.6 2.4 2.3
Cropping intensity ratio 0.9 1.0 1.0
Total renewable water resources per cap. (m³) 37 099 31 144 27 000
Land area equipped for irrigation (1 000 ha) 850 1 055 1 500
Agric. area actually irrigated (% agric. area) 10.0 16.1
Employment in agriculture (%) 35.4 29.1 26.9
Employment in agriculture, female (%) 28.6 21.5 23.8
Fertilizers use, nitrogen (1 000 t nutrients) 116.3 196.4
Fertilizers use, phosphate (1 000 t nutrients) 38.6 41.0
Fertilizers use, potash (1 000 t nutrients) 40.6 99.7
Agric. value added per worker (constant USD) 2 602 3 508 4 258
Hunger dimensions Average dietary energy supply (kcal/cap/day) 2 336 2 614
Average dietary energy supply adequacy (%) 104 115
Dietary energy supply, cereals/roots/tubers (%) 38 45
Prevalence of undernourishment (%) 17.0 7.8
Prevalence of severe food insecurity (%) 7.1
GDP per capita (USD, PPP) 8 608 10 424
Cereal import dependency ratio (%) 33.7 31.6
Stunting, children under 5 (%) 25.9 23.9
Wasting, children under 5 (%) 2.1 1.6
Safely managed drinking water (% pop. using) 69.1 74.4
Food supply Food production value, net (2004–06 mill. I$) 3 803 4 988 5 803
Agriculture, value added (% GDP) 22 9 9
Food (excl. fish) exports (mill. USD) 1 101 1 648 4 409
Food (excl. fish) imports (mill. USD) 256 550 986
Production indices (2004–06 = 100) Food 75 98 114
Crops 85 100 110
Cereals 79 95 109
Vegetable oils 65 102 119
Roots and tubers 120 94 120
Fruit and vegetables 84 100 106
Sugar 60 103 130
Livestock 65 96 124
Milk 75 96 111
Meat 60 96 130
Fish 108 106 205
Net trade (mill. USD) Cereals and preparations -94 -194 -374
Fruit and vegetables 870 1 239 3 095
Meat and meat preparations 0 -13 -9
Dairy products (milk equivalent) -3 -6 -2
Fish 889 995 3 842
Environment Forest area (% total land area) 51 54 50
Agricultural area (% total land area) 29 30 22
Freshwater withdrawal (% tot renewable) 2.2 Terrestrial protected areas (% total land area) 20
Organic area (ha) 49 40
Wood pellet production (1 000 t) Emissions in agriculture (CO2 eq. Gg) 12 803 12 856 11 615
Net emissions in land use (CO2 eq. Gg) 42 451 33 904 33 899
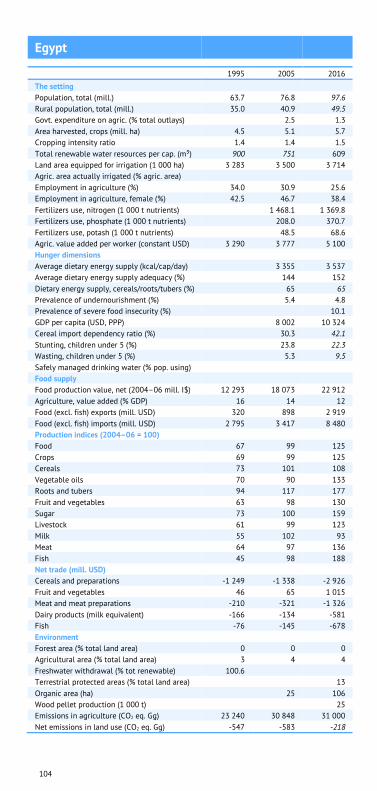
104
Egypt
1995 2005 2016
The setting Population, total (mill.) 63.7 76.8 97.6
Rural population, total (mill.) 35.0 40.9 49.5
Govt. expenditure on agric. (% total outlays) 2.5 1.3
Area harvested, crops (mill. ha) 4.5 5.1 5.7
Cropping intensity ratio 1.4 1.4 1.5
Total renewable water resources per cap. (m³) 900 751 609
Land area equipped for irrigation (1 000 ha) 3 283 3 500 3 714
Agric. area actually irrigated (% agric. area) Employment in agriculture (%) 34.0 30.9 25.6
Employment in agriculture, female (%) 42.5 46.7 38.4
Fertilizers use, nitrogen (1 000 t nutrients) 1 468.1 1 369.8
Fertilizers use, phosphate (1 000 t nutrients) 208.0 370.7
Fertilizers use, potash (1 000 t nutrients) 48.5 68.6
Agric. value added per worker (constant USD) 3 290 3 777 5 100
Hunger dimensions Average dietary energy supply (kcal/cap/day) 3 355 3 537
Average dietary energy supply adequacy (%) 144 152
Dietary energy supply, cereals/roots/tubers (%) 65 65
Prevalence of undernourishment (%) 5.4 4.8
Prevalence of severe food insecurity (%) 10.1
GDP per capita (USD, PPP) 8 002 10 324
Cereal import dependency ratio (%) 30.3 42.1
Stunting, children under 5 (%) 23.8 22.3
Wasting, children under 5 (%) 5.3 9.5
Safely managed drinking water (% pop. using) Food supply Food production value, net (2004–06 mill. I$) 12 293 18 073 22 912
Agriculture, value added (% GDP) 16 14 12
Food (excl. fish) exports (mill. USD) 320 898 2 919
Food (excl. fish) imports (mill. USD) 2 795 3 417 8 480
Production indices (2004–06 = 100) Food 67 99 125
Crops 69 99 125
Cereals 73 101 108
Vegetable oils 70 90 133
Roots and tubers 94 117 177
Fruit and vegetables 63 98 130
Sugar 73 100 159
Livestock 61 99 123
Milk 55 102 93
Meat 64 97 136
Fish 45 98 188
Net trade (mill. USD) Cereals and preparations -1 249 -1 338 -2 926
Fruit and vegetables 46 65 1 015
Meat and meat preparations -210 -321 -1 326
Dairy products (milk equivalent) -166 -134 -581
Fish -76 -145 -678
Environment Forest area (% total land area) 0 0 0
Agricultural area (% total land area) 3 4 4
Freshwater withdrawal (% tot renewable) 100.6 Terrestrial protected areas (% total land area) 13
Organic area (ha) 25 106
Wood pellet production (1 000 t) 25
Emissions in agriculture (CO2 eq. Gg) 23 240 30 848 31 000
Net emissions in land use (CO2 eq. Gg) -547 -583 -218

105
El Salvador
1995 2005 2016
The setting Population, total (mill.) 5.6 6.0 6.4
Rural population, total (mill.) 2.6 2.3 2.1
Govt. expenditure on agric. (% total outlays) 1.0 1.2
Area harvested, crops (mill. ha) 0.8 0.7 0.8
Cropping intensity ratio 0.9 0.8 0.8
Total renewable water resources per cap. (m³) 4 615 4 389 4 140
Land area equipped for irrigation (1 000 ha) 43 45 45
Agric. area actually irrigated (% agric. area) 1.9 1.4
Employment in agriculture (%) 27.0 20.0 18.7
Employment in agriculture, female (%) 7.6 4.7 4.0
Fertilizers use, nitrogen (1 000 t nutrients) 68.3 66.7
Fertilizers use, phosphate (1 000 t nutrients) 22.1 17.3
Fertilizers use, potash (1 000 t nutrients) 1.4 13.6
Agric. value added per worker (constant USD) 2 915 2 652 2 540
Hunger dimensions Average dietary energy supply (kcal/cap/day) 2 572 2 635
Average dietary energy supply adequacy (%) 116 116
Dietary energy supply, cereals/roots/tubers (%) 48 48
Prevalence of undernourishment (%) 10.5 10.3
Prevalence of severe food insecurity (%) 11.7
GDP per capita (USD, PPP) 5 937 7 164
Cereal import dependency ratio (%) 45.6 39.4
Stunting, children under 5 (%) 24.6 13.6
Wasting, children under 5 (%) 1.3 2.1
Safely managed drinking water (% pop. using) Food supply Food production value, net (2004–06 mill. I$) 703 835 1 010
Agriculture, value added (% GDP) 13 10 10
Food (excl. fish) exports (mill. USD) 136 292 626
Food (excl. fish) imports (mill. USD) 327 725 1 430
Production indices (2004–06 = 100) Food 83 99 120
Crops 101 98 111
Cereals 104 101 120
Vegetable oils 160 101 117
Roots and tubers 123 101 113
Fruit and vegetables 94 104 91
Sugar 73 91 149
Livestock 70 101 112
Milk 68 105 130
Meat 68 100 104
Fish 35 97 139
Net trade (mill. USD) Cereals and preparations -67 -84 -231
Fruit and vegetables -25 -111 -135
Meat and meat preparations -17 -71 -160
Dairy products (milk equivalent) -54 -87 -153
Fish 23 30 58
Environment Forest area (% total land area) 17 15 13
Agricultural area (% total land area) 70 76 76
Freshwater withdrawal (% tot renewable) 2.8 8.1 Terrestrial protected areas (% total land area) 9
Organic area (ha) 5 1
Wood pellet production (1 000 t) Emissions in agriculture (CO2 eq. Gg) 2 504 2 971 2 383
Net emissions in land use (CO2 eq. Gg) 872 875 733
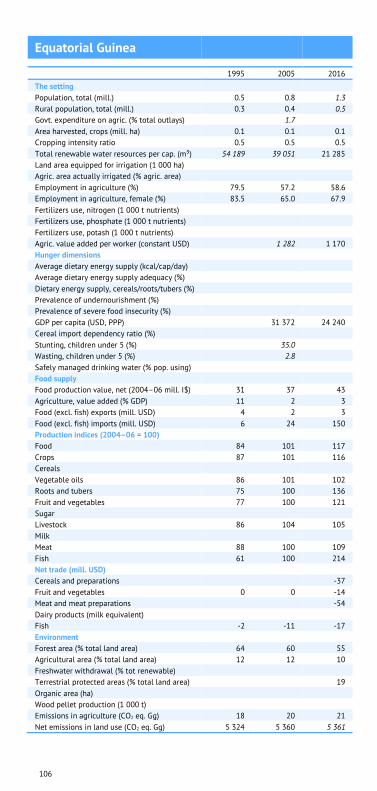
106
Equatorial Guinea
1995 2005 2016
The setting Population, total (mill.) 0.5 0.8 1.3
Rural population, total (mill.) 0.3 0.4 0.5
Govt. expenditure on agric. (% total outlays) 1.7 Area harvested, crops (mill. ha) 0.1 0.1 0.1
Cropping intensity ratio 0.5 0.5 0.5
Total renewable water resources per cap. (m³) 54 189 39 051 21 285
Land area equipped for irrigation (1 000 ha) Agric. area actually irrigated (% agric. area) Employment in agriculture (%) 79.5 57.2 58.6
Employment in agriculture, female (%) 83.5 65.0 67.9
Fertilizers use, nitrogen (1 000 t nutrients) Fertilizers use, phosphate (1 000 t nutrients) Fertilizers use, potash (1 000 t nutrients) Agric. value added per worker (constant USD) 1 282 1 170
Hunger dimensions Average dietary energy supply (kcal/cap/day) Average dietary energy supply adequacy (%) Dietary energy supply, cereals/roots/tubers (%) Prevalence of undernourishment (%) Prevalence of severe food insecurity (%) GDP per capita (USD, PPP) 31 372 24 240
Cereal import dependency ratio (%) Stunting, children under 5 (%) 35.0 Wasting, children under 5 (%) 2.8 Safely managed drinking water (% pop. using) Food supply Food production value, net (2004–06 mill. I$) 31 37 43
Agriculture, value added (% GDP) 11 2 3
Food (excl. fish) exports (mill. USD) 4 2 3
Food (excl. fish) imports (mill. USD) 6 24 150
Production indices (2004–06 = 100) Food 84 101 117
Crops 87 101 116
Cereals Vegetable oils 86 101 102
Roots and tubers 75 100 136
Fruit and vegetables 77 100 121
Sugar Livestock 86 104 105
Milk Meat 88 100 109
Fish 61 100 214
Net trade (mill. USD) Cereals and preparations -37
Fruit and vegetables 0 0 -14
Meat and meat preparations -54
Dairy products (milk equivalent) Fish -2 -11 -17
Environment Forest area (% total land area) 64 60 55
Agricultural area (% total land area) 12 12 10
Freshwater withdrawal (% tot renewable) Terrestrial protected areas (% total land area) 19
Organic area (ha) Wood pellet production (1 000 t) Emissions in agriculture (CO2 eq. Gg) 18 20 21
Net emissions in land use (CO2 eq. Gg) 5 324 5 360 5 361
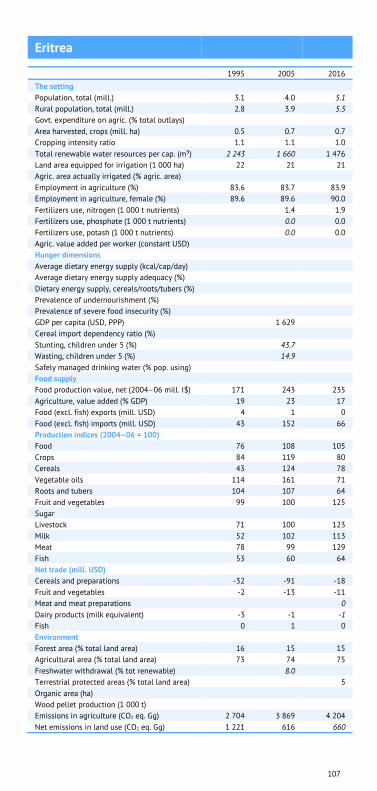
107
Eritrea
1995 2005 2016
The setting Population, total (mill.) 3.1 4.0 5.1
Rural population, total (mill.) 2.8 3.9 5.5
Govt. expenditure on agric. (% total outlays) Area harvested, crops (mill. ha) 0.5 0.7 0.7
Cropping intensity ratio 1.1 1.1 1.0
Total renewable water resources per cap. (m³) 2 243 1 660 1 476
Land area equipped for irrigation (1 000 ha) 22 21 21
Agric. area actually irrigated (% agric. area) Employment in agriculture (%) 83.6 83.7 83.9
Employment in agriculture, female (%) 89.6 89.6 90.0
Fertilizers use, nitrogen (1 000 t nutrients) 1.4 1.9
Fertilizers use, phosphate (1 000 t nutrients) 0.0 0.0
Fertilizers use, potash (1 000 t nutrients) 0.0 0.0
Agric. value added per worker (constant USD) Hunger dimensions Average dietary energy supply (kcal/cap/day) Average dietary energy supply adequacy (%) Dietary energy supply, cereals/roots/tubers (%) Prevalence of undernourishment (%) Prevalence of severe food insecurity (%) GDP per capita (USD, PPP) 1 629 Cereal import dependency ratio (%) Stunting, children under 5 (%) 43.7 Wasting, children under 5 (%) 14.9 Safely managed drinking water (% pop. using) Food supply Food production value, net (2004–06 mill. I$) 171 243 235
Agriculture, value added (% GDP) 19 23 17
Food (excl. fish) exports (mill. USD) 4 1 0
Food (excl. fish) imports (mill. USD) 43 152 66
Production indices (2004–06 = 100) Food 76 108 105
Crops 84 119 80
Cereals 43 124 78
Vegetable oils 114 161 71
Roots and tubers 104 107 64
Fruit and vegetables 99 100 125
Sugar Livestock 71 100 123
Milk 52 102 113
Meat 78 99 129
Fish 53 60 64
Net trade (mill. USD) Cereals and preparations -32 -91 -18
Fruit and vegetables -2 -13 -11
Meat and meat preparations 0
Dairy products (milk equivalent) -3 -1 -1
Fish 0 1 0
Environment Forest area (% total land area) 16 15 15
Agricultural area (% total land area) 73 74 75
Freshwater withdrawal (% tot renewable) 8.0 Terrestrial protected areas (% total land area) 5
Organic area (ha) Wood pellet production (1 000 t) Emissions in agriculture (CO2 eq. Gg) 2 704 3 869 4 204
Net emissions in land use (CO2 eq. Gg) 1 221 616 660

108
Estonia
1995 2005 2016
The setting Population, total (mill.) 1.4 1.4 1.3
Rural population, total (mill.) 0.4 0.4 0.4
Govt. expenditure on agric. (% total outlays) 1.7 1.2
Area harvested, crops (mill. ha) 0.4 0.4 0.5
Cropping intensity ratio 0.4 0.6 0.7
Total renewable water resources per cap. (m³) 9 085 9 531 9 760
Land area equipped for irrigation (1 000 ha) 2 1 3
Agric. area actually irrigated (% agric. area) 0.1 0.2
Employment in agriculture (%) 10.2 5.2 3.9
Employment in agriculture, female (%) 7.7 3.2 2.0
Fertilizers use, nitrogen (1 000 t nutrients) 20.1 45.9
Fertilizers use, phosphate (1 000 t nutrients) 6.3 12.6
Fertilizers use, potash (1 000 t nutrients) 9.7 19.9
Agric. value added per worker (constant USD) 4 729 13 404 24 137
Hunger dimensions Average dietary energy supply (kcal/cap/day) 3 150 3 253
Average dietary energy supply adequacy (%) 122 128
Dietary energy supply, cereals/roots/tubers (%) 33 37
Prevalence of undernourishment (%) 4.2 2.8
Prevalence of severe food insecurity (%) <0.5
GDP per capita (USD, PPP) 22 807 28 110
Cereal import dependency ratio (%) 4.6 -38.8
Stunting, children under 5 (%) Wasting, children under 5 (%) Safely managed drinking water (% pop. using) 94.4 81.7
Food supply Food production value, net (2004–06 mill. I$) 440 406 518
Agriculture, value added (% GDP) 5 3 2
Food (excl. fish) exports (mill. USD) 160 355 764
Food (excl. fish) imports (mill. USD) 234 506 836
Production indices (2004–06 = 100) Food 110 102 129
Crops 108 117 148
Cereals 70 117 152
Vegetable oils 9 106 130
Roots and tubers 282 126 54
Fruit and vegetables 151 120 92
Sugar Livestock 113 97 126
Milk 117 99 123
Meat 105 94 132
Fish 145 108 83
Net trade (mill. USD) Cereals and preparations -32 -29 82
Fruit and vegetables -32 -91 -164
Meat and meat preparations -3 -30 -50
Dairy products (milk equivalent) 58 84 90
Fish 90 54 25
Environment Forest area (% total land area) 52 53 51
Agricultural area (% total land area) 23 21 23
Freshwater withdrawal (% tot renewable) 10.6 14.3 13.4
Terrestrial protected areas (% total land area) 20
Organic area (ha) 58 181
Wood pellet production (1 000 t) 1 212
Emissions in agriculture (CO2 eq. Gg) 3 014 2 490 2 637
Net emissions in land use (CO2 eq. Gg) -498 6 818 4 400

109
Eswatini
1995 2005 2016
The setting Population, total (mill.) 1.0 1.1 1.4
Rural population, total (mill.) 0.7 0.9 1.0
Govt. expenditure on agric. (% total outlays) 6.3 Area harvested, crops (mill. ha) 0.2 0.2 0.2
Cropping intensity ratio 0.8 0.8 1.0
Total renewable water resources per cap. (m³) 4 479 3 974 3 358
Land area equipped for irrigation (1 000 ha) 49 50 50
Agric. area actually irrigated (% agric. area) 3.7 Employment in agriculture (%) 70.0 69.1 68.4
Employment in agriculture, female (%) 79.6 78.8 77.8
Fertilizers use, nitrogen (1 000 t nutrients) Fertilizers use, phosphate (1 000 t nutrients) Fertilizers use, potash (1 000 t nutrients) Agric. value added per worker (constant USD) 2 120 2 578 2 240
Hunger dimensions Average dietary energy supply (kcal/cap/day) 2 388 2 341
Average dietary energy supply adequacy (%) 107 103
Dietary energy supply, cereals/roots/tubers (%) 54 58
Prevalence of undernourishment (%) 17.0 20.7
Prevalence of severe food insecurity (%) GDP per capita (USD, PPP) 6 746 7 724
Cereal import dependency ratio (%) 68.0 68.8
Stunting, children under 5 (%) 29.5 25.5
Wasting, children under 5 (%) 2.9 2.0
Safely managed drinking water (% pop. using) Food supply Food production value, net (2004–06 mill. I$) 226 282 312
Agriculture, value added (% GDP) 8 11 10
Food (excl. fish) exports (mill. USD) 273 225 375
Food (excl. fish) imports (mill. USD) 74 220 218
Production indices (2004–06 = 100) Food 83 103 114
Crops 79 103 113
Cereals 218 107 122
Vegetable oils 142 104 46
Roots and tubers 89 102 135
Fruit and vegetables 73 95 118
Sugar 69 104 112
Livestock 100 102 115
Milk 94 101 102
Meat 103 103 119
Fish 230 100 275
Net trade (mill. USD) Cereals and preparations -19 -61 -83
Fruit and vegetables 18 -8 3
Meat and meat preparations -6 -18 -13
Dairy products (milk equivalent) -9 -20 -17
Fish 0 -8 -7
Environment Forest area (% total land area) 29 31 34
Agricultural area (% total land area) 71 71 71
Freshwater withdrawal (% tot renewable) Terrestrial protected areas (% total land area) 4
Organic area (ha) 0 0
Wood pellet production (1 000 t) Emissions in agriculture (CO2 eq. Gg) 977 931 910
Net emissions in land use (CO2 eq. Gg) 233 259 286

110
Ethiopia
1995 2005 2016
The setting Population, total (mill.) 57.3 76.7 105.0
Rural population, total (mill.) 49.1 64.2 82.7
Govt. expenditure on agric. (% total outlays) 15.9 Area harvested, crops (mill. ha) 9.4 13.5 15.5
Cropping intensity ratio 0.9 1.0 1.0
Total renewable water resources per cap. (m³) 2 004 1 508 1 191
Land area equipped for irrigation (1 000 ha) 290 445 800
Agric. area actually irrigated (% agric. area) 0.4 Employment in agriculture (%) 89.4 80.2 69.0
Employment in agriculture, female (%) 87.1 75.4 60.3
Fertilizers use, nitrogen (1 000 t nutrients) 80.5 154.9
Fertilizers use, phosphate (1 000 t nutrients) 59.3 63.0
Fertilizers use, potash (1 000 t nutrients) 0.0 0.3
Agric. value added per worker (constant USD) 281 321 538
Hunger dimensions Average dietary energy supply (kcal/cap/day) 1 943 2 330
Average dietary energy supply adequacy (%) 91 105
Dietary energy supply, cereals/roots/tubers (%) 79 76
Prevalence of undernourishment (%) 39.7 21.4
Prevalence of severe food insecurity (%) GDP per capita (USD, PPP) 732 1 608
Cereal import dependency ratio (%) 6.1 7.0
Stunting, children under 5 (%) 50.7 38.4
Wasting, children under 5 (%) 12.3 9.9
Safely managed drinking water (% pop. using) 6.1 10.5
Food supply Food production value, net (2004–06 mill. I$) 4 023 7 177 11 319
Agriculture, value added (% GDP) 52 42 34
Food (excl. fish) exports (mill. USD) 37 326 1 704
Food (excl. fish) imports (mill. USD) 209 438 1 877
Production indices (2004–06 = 100) Food 58 103 162
Crops 61 105 188
Cereals 55 110 218
Vegetable oils 37 114 218
Roots and tubers 70 99 131
Fruit and vegetables 48 107 136
Sugar 46 101 54
Livestock 57 97 120
Milk 37 93 136
Meat 66 99 112
Fish 65 97 465
Net trade (mill. USD) Cereals and preparations -154 -257 -772
Fruit and vegetables 13 10 743
Meat and meat preparations 1 18 100
Dairy products (milk equivalent) -2 -6 -13
Fish 0 -1 -3
Environment Forest area (% total land area) 14 13 13
Agricultural area (% total land area) 31 34 36
Freshwater withdrawal (% tot renewable) 6.4 8.6
Terrestrial protected areas (% total land area) 18
Organic area (ha) 113 186
Wood pellet production (1 000 t) Emissions in agriculture (CO2 eq. Gg) 48 746 66 460 100 585
Net emissions in land use (CO2 eq. Gg) 34 146 34 108 17 720

111
Fiji
1995 2005 2016
The setting Population, total (mill.) 0.8 0.8 0.9
Rural population, total (mill.) 0.4 0.4 0.4
Govt. expenditure on agric. (% total outlays) 3.1 2.9
Area harvested, crops (mill. ha) 0.2 0.1 0.1
Cropping intensity ratio 0.6 0.6 0.6
Total renewable water resources per cap. (m³) 36 007 34 204 31 766
Land area equipped for irrigation (1 000 ha) 3 4 4
Agric. area actually irrigated (% agric. area) Employment in agriculture (%) 50.6 44.2 39.2
Employment in agriculture, female (%) 50.9 44.1 38.5
Fertilizers use, nitrogen (1 000 t nutrients) 6.6 4.2
Fertilizers use, phosphate (1 000 t nutrients) 0.0 2.1
Fertilizers use, potash (1 000 t nutrients) 0.0 1.2
Agric. value added per worker (constant USD) 2 450 2 469 2 428
Hunger dimensions Average dietary energy supply (kcal/cap/day) 2 930 2 937
Average dietary energy supply adequacy (%) 124 124
Dietary energy supply, cereals/roots/tubers (%) 47 46
Prevalence of undernourishment (%) 4.3 4.4
Prevalence of severe food insecurity (%) GDP per capita (USD, PPP) 7 427 8 447
Cereal import dependency ratio (%) 89.2 99.8
Stunting, children under 5 (%) 7.5 Wasting, children under 5 (%) 6.3 Safely managed drinking water (% pop. using) Food supply Food production value, net (2004–06 mill. I$) 244 226 190
Agriculture, value added (% GDP) 17 12 11
Food (excl. fish) exports (mill. USD) 239 198 148
Food (excl. fish) imports (mill. USD) 106 175 291
Production indices (2004–06 = 100) Food 107 99 83
Crops 111 98 72
Cereals 133 109 36
Vegetable oils 109 105 116
Roots and tubers 29 110 100
Fruit and vegetables 69 93 101
Sugar 137 94 52
Livestock 95 100 110
Milk 120 104 105
Meat 87 97 104
Fish 63 97 94
Net trade (mill. USD) Cereals and preparations -27 -25 -35
Fruit and vegetables -11 -17 -48
Meat and meat preparations -15 -25 -30
Dairy products (milk equivalent) -13 -22 -40
Fish 14 14 53
Environment Forest area (% total land area) 53 55 56
Agricultural area (% total land area) 24 23 23
Freshwater withdrawal (% tot renewable) 0.3 Terrestrial protected areas (% total land area) 5
Organic area (ha) 0 13
Wood pellet production (1 000 t) Emissions in agriculture (CO2 eq. Gg) 1 011 904 889
Net emissions in land use (CO2 eq. Gg) -1 674 -2 045 -2 992

112
Finland
1995 2005 2016
The setting Population, total (mill.) 5.1 5.3 5.5
Rural population, total (mill.) 1.0 0.9 0.9
Govt. expenditure on agric. (% total outlays) 2.9 1.8
Area harvested, crops (mill. ha) 1.2 1.3 1.1
Cropping intensity ratio 0.5 0.6 0.5
Total renewable water resources per cap. (m³) 21 397 20 798 19 989
Land area equipped for irrigation (1 000 ha) 88 80 55
Agric. area actually irrigated (% agric. area) 0.4
Employment in agriculture (%) 7.8 4.8 3.9
Employment in agriculture, female (%) 5.3 2.9 2.1
Fertilizers use, nitrogen (1 000 t nutrients) 192.5 138.1
Fertilizers use, phosphate (1 000 t nutrients) 29.8 9.8
Fertilizers use, potash (1 000 t nutrients) 77.9 32.9
Agric. value added per worker (constant USD) 32 825 44 019 69 759
Hunger dimensions Average dietary energy supply (kcal/cap/day) 3 209 3 368
Average dietary energy supply adequacy (%) 125 132
Dietary energy supply, cereals/roots/tubers (%) 32 31
Prevalence of undernourishment (%) <2.5 <2.5
Prevalence of severe food insecurity (%) 2.2
GDP per capita (USD, PPP) 39 116 39 659
Cereal import dependency ratio (%) -11.5 -19.7
Stunting, children under 5 (%) Wasting, children under 5 (%) Safely managed drinking water (% pop. using) 95.3 96.9
Food supply Food production value, net (2004–06 mill. I$) 1 832 1 967 1 877
Agriculture, value added (% GDP) 4 2 2
Food (excl. fish) exports (mill. USD) 726 947 1 084
Food (excl. fish) imports (mill. USD) 1 108 1 938 3 196
Production indices (2004–06 = 100) Food 95 102 97
Crops 94 107 93
Cereals 85 106 94
Vegetable oils 117 96 85
Roots and tubers 118 117 89
Fruit and vegetables 99 105 118
Sugar 104 111 41
Livestock 95 100 100
Milk 101 100 99
Meat 86 99 99
Fish 121 96 136
Net trade (mill. USD) Cereals and preparations 2 -125 -181
Fruit and vegetables -358 -622 -1 015
Meat and meat preparations -46 -51 -215
Dairy products (milk equivalent) 136 210 18
Fish -91 -198 -380
Environment Forest area (% total land area) 73 73 73
Agricultural area (% total land area) 7 7 7
Freshwater withdrawal (% tot renewable) 2.4 6.0 Terrestrial protected areas (% total land area) 15
Organic area (ha) 147 238
Wood pellet production (1 000 t) 271
Emissions in agriculture (CO2 eq. Gg) 6 399 5 998 5 472
Net emissions in land use (CO2 eq. Gg) -24 554 -15 823 5 734

113
The former Yugoslav Republic of Macedonia
1995 2005 2016
The setting Population, total (mill.) 2.0 2.1 2.1
Rural population, total (mill.) 0.8 0.9 0.9
Govt. expenditure on agric. (% total outlays) Area harvested, crops (mill. ha) 0.4 0.4 0.3
Cropping intensity ratio 0.6 0.7 0.7
Total renewable water resources per cap. (m³) 3 250 3 120 3 075
Land area equipped for irrigation (1 000 ha) 61 128 128
Agric. area actually irrigated (% agric. area) 6.5 5.8
Employment in agriculture (%) 21.7 19.5 16.6
Employment in agriculture, female (%) 21.3 19.6 15.8
Fertilizers use, nitrogen (1 000 t nutrients) 18.1 22.5
Fertilizers use, phosphate (1 000 t nutrients) 5.4 5.9
Fertilizers use, potash (1 000 t nutrients) 4.3 4.5
Agric. value added per worker (constant USD) 6 613 8 070 7 885
Hunger dimensions Average dietary energy supply (kcal/cap/day) 2 826 2 957
Average dietary energy supply adequacy (%) 113 118
Dietary energy supply, cereals/roots/tubers (%) 38 37
Prevalence of undernourishment (%) 6.1 4.1
Prevalence of severe food insecurity (%) 3.3
GDP per capita (USD, PPP) 9 386 13 121
Cereal import dependency ratio (%) 22.2 28.1
Stunting, children under 5 (%) 11.5 Wasting, children under 5 (%) 3.4 Safely managed drinking water (% pop. using) 91.1 83.5
Food supply Food production value, net (2004–06 mill. I$) 560 636 805
Agriculture, value added (% GDP) 11 10 9
Food (excl. fish) exports (mill. USD) 131 163 364
Food (excl. fish) imports (mill. USD) 250 330 605
Production indices (2004–06 = 100) Food 87 99 125
Crops 85 100 124
Cereals 111 100 102
Vegetable oils 87 98 97
Roots and tubers 78 97 105
Fruit and vegetables 82 99 136
Sugar 121 128 8
Livestock 94 97 113
Milk 67 95 148
Meat 122 101 82
Fish 103 111 128
Net trade (mill. USD) Cereals and preparations -20 -39 -21
Fruit and vegetables 17 43 97
Meat and meat preparations -55 -67 -106
Dairy products (milk equivalent) -16 -16 -36
Fish -8 -12 -20
Environment Forest area (% total land area) 37 38 40
Agricultural area (% total land area) 51 48 50
Freshwater withdrawal (% tot renewable) 24.3 8.6 Terrestrial protected areas (% total land area) 10
Organic area (ha) 0 3
Wood pellet production (1 000 t) 0
Emissions in agriculture (CO2 eq. Gg) 1 750 1 275 1 249
Net emissions in land use (CO2 eq. Gg) -727 1 247 8
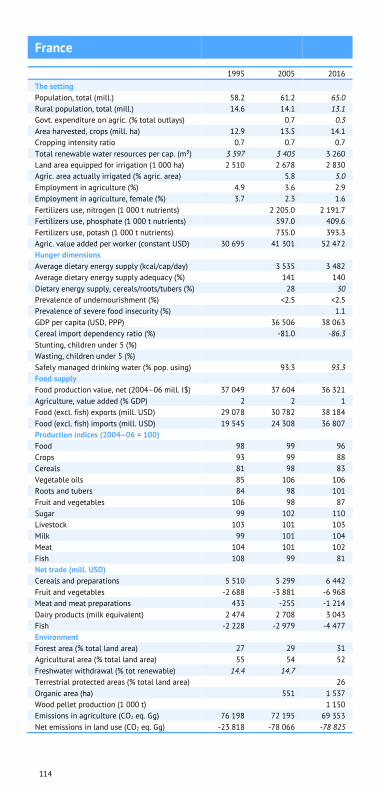
114
France
1995 2005 2016
The setting Population, total (mill.) 58.2 61.2 65.0
Rural population, total (mill.) 14.6 14.1 13.1
Govt. expenditure on agric. (% total outlays) 0.7 0.3
Area harvested, crops (mill. ha) 12.9 13.5 14.1
Cropping intensity ratio 0.7 0.7 0.7
Total renewable water resources per cap. (m³) 3 597 3 405 3 260
Land area equipped for irrigation (1 000 ha) 2 510 2 678 2 830
Agric. area actually irrigated (% agric. area) 5.8 5.0
Employment in agriculture (%) 4.9 3.6 2.9
Employment in agriculture, female (%) 3.7 2.3 1.6
Fertilizers use, nitrogen (1 000 t nutrients) 2 205.0 2 191.7
Fertilizers use, phosphate (1 000 t nutrients) 597.0 409.6
Fertilizers use, potash (1 000 t nutrients) 735.0 393.3
Agric. value added per worker (constant USD) 30 695 41 301 52 472
Hunger dimensions Average dietary energy supply (kcal/cap/day) 3 535 3 482
Average dietary energy supply adequacy (%) 141 140
Dietary energy supply, cereals/roots/tubers (%) 28 30
Prevalence of undernourishment (%) <2.5 <2.5
Prevalence of severe food insecurity (%) 1.1
GDP per capita (USD, PPP) 36 506 38 063
Cereal import dependency ratio (%) -81.0 -86.3
Stunting, children under 5 (%) Wasting, children under 5 (%) Safely managed drinking water (% pop. using) 93.3 93.3
Food supply Food production value, net (2004–06 mill. I$) 37 049 37 604 36 321
Agriculture, value added (% GDP) 2 2 1
Food (excl. fish) exports (mill. USD) 29 078 30 782 38 184
Food (excl. fish) imports (mill. USD) 19 545 24 308 36 807
Production indices (2004–06 = 100) Food 98 99 96
Crops 93 99 88
Cereals 81 98 83
Vegetable oils 85 106 106
Roots and tubers 84 98 101
Fruit and vegetables 106 98 87
Sugar 99 102 110
Livestock 103 101 103
Milk 99 101 104
Meat 104 101 102
Fish 108 99 81
Net trade (mill. USD) Cereals and preparations 5 510 5 299 6 442
Fruit and vegetables -2 688 -3 881 -6 968
Meat and meat preparations 433 -255 -1 214
Dairy products (milk equivalent) 2 474 2 708 3 043
Fish -2 228 -2 979 -4 477
Environment Forest area (% total land area) 27 29 31
Agricultural area (% total land area) 55 54 52
Freshwater withdrawal (% tot renewable) 14.4 14.7 Terrestrial protected areas (% total land area) 26
Organic area (ha) 551 1 537
Wood pellet production (1 000 t) 1 150
Emissions in agriculture (CO2 eq. Gg) 76 198 72 195 69 353
Net emissions in land use (CO2 eq. Gg) -23 818 -78 066 -78 825

115
Gabon
1995 2005 2016
The setting Population, total (mill.) 1.1 1.4 2.0
Rural population, total (mill.) 0.3 0.2 0.2
Govt. expenditure on agric. (% total outlays) Area harvested, crops (mill. ha) 0.2 0.2 0.3
Cropping intensity ratio 0.4 0.4 0.5
Total renewable water resources per cap. (m³) 145 105 115 198 83 847
Land area equipped for irrigation (1 000 ha) 4 4 4
Agric. area actually irrigated (% agric. area) Employment in agriculture (%) 43.5 43.3 41.3
Employment in agriculture, female (%) 62.2 62.6 60.9
Fertilizers use, nitrogen (1 000 t nutrients) 0.6 3.4
Fertilizers use, phosphate (1 000 t nutrients) 0.3 2.3
Fertilizers use, potash (1 000 t nutrients) 1.9 3.0
Agric. value added per worker (constant USD) 4 673 3 966 3 874
Hunger dimensions Average dietary energy supply (kcal/cap/day) 2 703 2 830
Average dietary energy supply adequacy (%) 120 124
Dietary energy supply, cereals/roots/tubers (%) 50 51
Prevalence of undernourishment (%) 10.9 9.4
Prevalence of severe food insecurity (%) GDP per capita (USD, PPP) 16 804 16 757
Cereal import dependency ratio (%) 78.2 87.3
Stunting, children under 5 (%) Wasting, children under 5 (%) Safely managed drinking water (% pop. using) Food supply Food production value, net (2004–06 mill. I$) 191 223 265
Agriculture, value added (% GDP) 7 5 4
Food (excl. fish) exports (mill. USD) 3 9 2
Food (excl. fish) imports (mill. USD) 135 224 424
Production indices (2004–06 = 100) Food 86 100 119
Crops 84 100 127
Cereals 88 106 137
Vegetable oils 98 99 74
Roots and tubers 84 100 133
Fruit and vegetables 88 100 109
Sugar 97 102 140
Livestock 85 101 114
Milk 106 100 107
Meat 84 101 115
Fish 92 100 71
Net trade (mill. USD) Cereals and preparations -47 -67 -131
Fruit and vegetables -11 -16 -40
Meat and meat preparations -45 -69 -137
Dairy products (milk equivalent) -14 -25 -36
Fish 1 13 -55
Environment Forest area (% total land area) 85 85 90
Agricultural area (% total land area) 20 20 20
Freshwater withdrawal (% tot renewable) 0.1 Terrestrial protected areas (% total land area) 20
Organic area (ha) Wood pellet production (1 000 t) Emissions in agriculture (CO2 eq. Gg) 337 335 420
Net emissions in land use (CO2 eq. Gg) 454 447 -94 129

116
Gambia
1995 2005 2016
The setting Population, total (mill.) 1.1 1.4 2.1
Rural population, total (mill.) 0.6 0.7 0.8
Govt. expenditure on agric. (% total outlays) Area harvested, crops (mill. ha) 0.2 0.3 0.4
Cropping intensity ratio 1.1 1.0 1.0
Total renewable water resources per cap. (m³) 7 098 5 208 3 924
Land area equipped for irrigation (1 000 ha) 2 2 5
Agric. area actually irrigated (% agric. area) Employment in agriculture (%) 35.2 34.2 27.2
Employment in agriculture, female (%) 45.3 42.6 33.7
Fertilizers use, nitrogen (1 000 t nutrients) 1.7 0.3
Fertilizers use, phosphate (1 000 t nutrients) 0.8 0.1
Fertilizers use, potash (1 000 t nutrients) 0.8 0.1
Agric. value added per worker (constant USD) 1 237 1 491 1 173
Hunger dimensions Average dietary energy supply (kcal/cap/day) 2 434 2 656
Average dietary energy supply adequacy (%) 112 120
Dietary energy supply, cereals/roots/tubers (%) 55 62
Prevalence of undernourishment (%) 15.1 9.6
Prevalence of severe food insecurity (%) 25.9
GDP per capita (USD, PPP) 1 533 1 555
Cereal import dependency ratio (%) 39.4 37.7
Stunting, children under 5 (%) 27.6 25.0
Wasting, children under 5 (%) 7.4 11.1
Safely managed drinking water (% pop. using) Food supply Food production value, net (2004–06 mill. I$) 91 128 146
Agriculture, value added (% GDP) 21 27 19
Food (excl. fish) exports (mill. USD) 12 17 41
Food (excl. fish) imports (mill. USD) 73 130 117
Production indices (2004–06 = 100) Food 66 94 107
Crops 60 92 105
Cereals 47 93 114
Vegetable oils 67 90 93
Roots and tubers 80 100 142
Fruit and vegetables 71 100 133
Sugar Livestock 82 100 107
Milk 85 100 109
Meat 79 100 103
Fish 67 100 166
Net trade (mill. USD) Cereals and preparations -34 -43 -51
Fruit and vegetables -5 -14 -7
Meat and meat preparations 0 -8 -7
Dairy products (milk equivalent) -9 2
Fish 4 0 2
Environment Forest area (% total land area) 45 47 48
Agricultural area (% total land area) 55 52 60
Freshwater withdrawal (% tot renewable) Terrestrial protected areas (% total land area) 4
Organic area (ha) 0 Wood pellet production (1 000 t) Emissions in agriculture (CO2 eq. Gg) 758 914 1 278
Net emissions in land use (CO2 eq. Gg) -291 -332 -217

117
Georgia
1995 2005 2016
The setting Population, total (mill.) 5.0 4.5 3.9
Rural population, total (mill.) 2.3 2.1 2.0
Govt. expenditure on agric. (% total outlays) 2.0 2.4
Area harvested, crops (mill. ha) 0.6 0.7 0.3
Cropping intensity ratio 0.5 1.2 0.8
Total renewable water resources per cap. (m³) 12 869 14 439 16 133
Land area equipped for irrigation (1 000 ha) 469 433 433
Agric. area actually irrigated (% agric. area) 4.0 Employment in agriculture (%) 56.5 54.3 41.2
Employment in agriculture, female (%) 58.5 57.2 41.8
Fertilizers use, nitrogen (1 000 t nutrients) 24.1 51.0
Fertilizers use, phosphate (1 000 t nutrients) 0.7 5.4
Fertilizers use, potash (1 000 t nutrients) 0.2 2.4
Agric. value added per worker (constant USD) 960 1 356
Hunger dimensions Average dietary energy supply (kcal/cap/day) 2 916 2 848
Average dietary energy supply adequacy (%) 116 115
Dietary energy supply, cereals/roots/tubers (%) 56 57
Prevalence of undernourishment (%) 7.2 7.4
Prevalence of severe food insecurity (%) 8.9
GDP per capita (USD, PPP) 4 902 9 277
Cereal import dependency ratio (%) 76.6 58.9
Stunting, children under 5 (%) 14.7 Wasting, children under 5 (%) 3.0 Safely managed drinking water (% pop. using) 76.0 73.0
Food supply Food production value, net (2004–06 mill. I$) 1 022 1 054 626
Agriculture, value added (% GDP) 42 15 8
Food (excl. fish) exports (mill. USD) 22 133 328
Food (excl. fish) imports (mill. USD) 327 429 746
Production indices (2004–06 = 100) Food 117 120 71
Crops 152 132 78
Cereals 91 124 80
Vegetable oils 1 115 9
Roots and tubers 121 128 92
Fruit and vegetables 179 135 73
Sugar Livestock 90 109 69
Milk 67 107 73
Meat 116 110 56
Fish 30 82 250
Net trade (mill. USD) Cereals and preparations -209 -180 -170
Fruit and vegetables -20 65 115
Meat and meat preparations -15 -28 -92
Dairy products (milk equivalent) 5 -20 -49
Fish -1 -10 -9
Environment Forest area (% total land area) 40 40 41
Agricultural area (% total land area) 44 36 34
Freshwater withdrawal (% tot renewable) 2.9 Terrestrial protected areas (% total land area) 8
Organic area (ha) 0 2
Wood pellet production (1 000 t) Emissions in agriculture (CO2 eq. Gg) 2 007 2 445 2 241
Net emissions in land use (CO2 eq. Gg) -4 029 -3 523 5

118
Germany
1995 2005 2016
The setting Population, total (mill.) 81.2 81.7 82.1
Rural population, total (mill.) 22.2 22.3 20.0
Govt. expenditure on agric. (% total outlays) Area harvested, crops (mill. ha) 8.9 9.4 8.7
Cropping intensity ratio 0.7 0.8 0.7
Total renewable water resources per cap. (m³) 1 878 1 905 1 880
Land area equipped for irrigation (1 000 ha) 485 510 676
Agric. area actually irrigated (% agric. area) 1.4 2.7
Employment in agriculture (%) 3.2 2.4 1.3
Employment in agriculture, female (%) 3.0 1.7 0.9
Fertilizers use, nitrogen (1 000 t nutrients) 1 785.0 1 658.8
Fertilizers use, phosphate (1 000 t nutrients) 273.9 231.1
Fertilizers use, potash (1 000 t nutrients) 426.1 430.1
Agric. value added per worker (constant USD) 18 535 24 519 38 593
Hunger dimensions Average dietary energy supply (kcal/cap/day) 3 442 3 499
Average dietary energy supply adequacy (%) 134 137
Dietary energy supply, cereals/roots/tubers (%) 28 28
Prevalence of undernourishment (%) <2.5 <2.5
Prevalence of severe food insecurity (%) 0.8
GDP per capita (USD, PPP) 37 704 44 432
Cereal import dependency ratio (%) -14.6 -8.6
Stunting, children under 5 (%) 1.3 Wasting, children under 5 (%) 1.0 Safely managed drinking water (% pop. using) 99.3 99.2
Food supply Food production value, net (2004–06 mill. I$) 28 371 30 730 33 311
Agriculture, value added (% GDP) 1 1 1
Food (excl. fish) exports (mill. USD) 16 966 28 351 51 616
Food (excl. fish) imports (mill. USD) 29 324 36 977 62 049
Production indices (2004–06 = 100) Food 92 100 108
Crops 85 99 99
Cereals 83 99 98
Vegetable oils 62 97 87
Roots and tubers 83 101 94
Fruit and vegetables 96 100 107
Sugar 107 104 105
Livestock 95 100 113
Milk 100 101 117
Meat 91 100 110
Fish 94 101 97
Net trade (mill. USD) Cereals and preparations 924 2 106 3 237
Fruit and vegetables -9 815 -10 018 -14 612
Meat and meat preparations -3 118 33 2 483
Dairy products (milk equivalent) 1 353 1 758 1 968
Fish -1 580 -1 733 -2 664
Environment Forest area (% total land area) 32 33 33
Agricultural area (% total land area) 50 49 48
Freshwater withdrawal (% tot renewable) 29.4 21.0 Terrestrial protected areas (% total land area) 38
Organic area (ha) 807 1 136
Wood pellet production (1 000 t) 1 932
Emissions in agriculture (CO2 eq. Gg) 66 934 60 342 58 978
Net emissions in land use (CO2 eq. Gg) -50 557 -18 300 -37 353

119
Ghana
1995 2005 2016
The setting Population, total (mill.) 16.8 21.5 28.8
Rural population, total (mill.) 10.0 11.3 12.5
Govt. expenditure on agric. (% total outlays) 1.0 Area harvested, crops (mill. ha) 4.3 6.5 6.9
Cropping intensity ratio 0.9 1.0 0.9
Total renewable water resources per cap. (m³) 3 199 2 495 1 992
Land area equipped for irrigation (1 000 ha) 6 33 36
Agric. area actually irrigated (% agric. area) 0.1 0.2
Employment in agriculture (%) 53.9 49.0 41.2
Employment in agriculture, female (%) 51.1 45.8 37.4
Fertilizers use, nitrogen (1 000 t nutrients) 11.1 63.1
Fertilizers use, phosphate (1 000 t nutrients) 6.3 15.2
Fertilizers use, potash (1 000 t nutrients) 6.6 19.8
Agric. value added per worker (constant USD) 1 751 2 036
Hunger dimensions Average dietary energy supply (kcal/cap/day) 2 754 3 048
Average dietary energy supply adequacy (%) 124 135
Dietary energy supply, cereals/roots/tubers (%) 64 63
Prevalence of undernourishment (%) 9.3 6.1
Prevalence of severe food insecurity (%) 7.9
GDP per capita (USD, PPP) 2 539 3 983
Cereal import dependency ratio (%) 38.6 28.6
Stunting, children under 5 (%) 28.1 18.8
Wasting, children under 5 (%) 6.1 4.7
Safely managed drinking water (% pop. using) 19.0 26.9
Food supply Food production value, net (2004–06 mill. I$) 3 314 5 223 8 021
Agriculture, value added (% GDP) 31 30 18
Food (excl. fish) exports (mill. USD) 375 1 098 3 130
Food (excl. fish) imports (mill. USD) 188 885 1 219
Production indices (2004–06 = 100) Food 63 100 153
Crops 63 100 154
Cereals 94 104 159
Vegetable oils 64 97 107
Roots and tubers 64 98 168
Fruit and vegetables 68 103 165
Sugar 79 100 109
Livestock 79 100 135
Milk 77 103 114
Meat 81 100 133
Fish 89 94 95
Net trade (mill. USD) Cereals and preparations -68 -327 -501
Fruit and vegetables 2 19 914
Meat and meat preparations -15 -107 -144
Dairy products (milk equivalent) -10 -107 -63
Fish 14 -93 -260
Environment Forest area (% total land area) 39 40 41
Agricultural area (% total land area) 58 66 69
Freshwater withdrawal (% tot renewable) Terrestrial protected areas (% total land area) 15
Organic area (ha) 17 21
Wood pellet production (1 000 t) Emissions in agriculture (CO2 eq. Gg) 6 987 9 494 9 922
Net emissions in land use (CO2 eq. Gg) 20 713 37 652 8 360

120
Greece
1995 2005 2016
The setting Population, total (mill.) 10.8 11.3 11.2
Rural population, total (mill.) 3.0 2.8 2.4
Govt. expenditure on agric. (% total outlays) 0.1 0.4
Area harvested, crops (mill. ha) 3.1 3.0 2.9
Cropping intensity ratio 0.8 0.8 0.9
Total renewable water resources per cap. (m³) 6 335 6 145 6 116
Land area equipped for irrigation (1 000 ha) 1 235 1 594 1 530
Agric. area actually irrigated (% agric. area) 16.6 19.7
Employment in agriculture (%) 20.4 12.2 12.4
Employment in agriculture, female (%) 23.9 13.5 11.7
Fertilizers use, nitrogen (1 000 t nutrients) 203.8 167.5
Fertilizers use, phosphate (1 000 t nutrients) 124.5 51.9
Fertilizers use, potash (1 000 t nutrients) 49.1 43.9
Agric. value added per worker (constant USD) 11 983 18 856 18 026
Hunger dimensions Average dietary energy supply (kcal/cap/day) 3 599 3 400
Average dietary energy supply adequacy (%) 141 135
Dietary energy supply, cereals/roots/tubers (%) 30 31
Prevalence of undernourishment (%) <2.5 <2.5
Prevalence of severe food insecurity (%) 3.1
GDP per capita (USD, PPP) 29 559 24 212
Cereal import dependency ratio (%) 23.0 18.2
Stunting, children under 5 (%) Wasting, children under 5 (%) Safely managed drinking water (% pop. using) 98.7 98.9
Food supply Food production value, net (2004–06 mill. I$) 7 473 7 528 6 906
Agriculture, value added (% GDP) 7 4 3
Food (excl. fish) exports (mill. USD) 2 260 2 590 4 638
Food (excl. fish) imports (mill. USD) 2 978 4 300 4 890
Production indices (2004–06 = 100) Food 103 104 95
Crops 103 105 93
Cereals 100 103 89
Vegetable oils 92 109 103
Roots and tubers 115 98 64
Fruit and vegetables 106 100 101
Sugar 113 113 17
Livestock 100 102 92
Milk 96 100 92
Meat 103 103 91
Fish 92 99 100
Net trade (mill. USD) Cereals and preparations -280 -353 -266
Fruit and vegetables 833 574 1 370
Meat and meat preparations -859 -1 125 -1 135
Dairy products (milk equivalent) -482 -528 -154
Fish -61 -93 107
Environment Forest area (% total land area) 27 29 32
Agricultural area (% total land area) 71 62 48
Freshwater withdrawal (% tot renewable) 12.7 14.0 Terrestrial protected areas (% total land area) 35
Organic area (ha) 289 343
Wood pellet production (1 000 t) 0
Emissions in agriculture (CO2 eq. Gg) 8 745 7 981 7 313
Net emissions in land use (CO2 eq. Gg) -645 -687 -646

121
Grenada
1995 2005 2016
The setting Population, total (mill.) 0.1 0.1 0.1
Rural population, total (mill.) 0.1 0.1 0.1
Govt. expenditure on agric. (% total outlays) 2.3
Area harvested, crops (mill. ha) 0.0 0.0 0.0
Cropping intensity ratio 1.5 1.1 2.0
Total renewable water resources per cap. (m³) 1 978 1 931 1 864
Land area equipped for irrigation (1 000 ha) 0 1 2
Agric. area actually irrigated (% agric. area) 2.9 Employment in agriculture (%) Employment in agriculture, female (%) Fertilizers use, nitrogen (1 000 t nutrients) Fertilizers use, phosphate (1 000 t nutrients) Fertilizers use, potash (1 000 t nutrients) Agric. value added per worker (constant USD) Hunger dimensions Average dietary energy supply (kcal/cap/day) 2 383 2 421
Average dietary energy supply adequacy (%) 99 100
Dietary energy supply, cereals/roots/tubers (%) 23 28
Prevalence of undernourishment (%) Prevalence of severe food insecurity (%) GDP per capita (USD, PPP) 11 894 13 167
Cereal import dependency ratio (%) 86.4 100.0
Stunting, children under 5 (%) Wasting, children under 5 (%) Safely managed drinking water (% pop. using) Food supply Food production value, net (2004–06 mill. I$) 19 11 18
Agriculture, value added (% GDP) 9 3 6
Food (excl. fish) exports (mill. USD) 12 12 13
Food (excl. fish) imports (mill. USD) 33 47 49
Production indices (2004–06 = 100) Food 139 79 128
Crops 151 74 133
Cereals 114 102 112
Vegetable oils 113 99 97
Roots and tubers 112 100 100
Fruit and vegetables 131 90 105
Sugar 94 98 105
Livestock 90 93 108
Milk 100 100 108
Meat 85 93 104
Fish 72 98 122
Net trade (mill. USD) Cereals and preparations -6 -6 -8
Fruit and vegetables 0 -6 -3
Meat and meat preparations -11 -12 -14
Dairy products (milk equivalent) -8 -8
Fish 2 1 5
Environment Forest area (% total land area) 50 50 50
Agricultural area (% total land area) 32 21 24
Freshwater withdrawal (% tot renewable) 5.0 7.1
Terrestrial protected areas (% total land area) 9
Organic area (ha) 0
Wood pellet production (1 000 t) Emissions in agriculture (CO2 eq. Gg) 14 14 14
Net emissions in land use (CO2 eq. Gg) 0 351 0
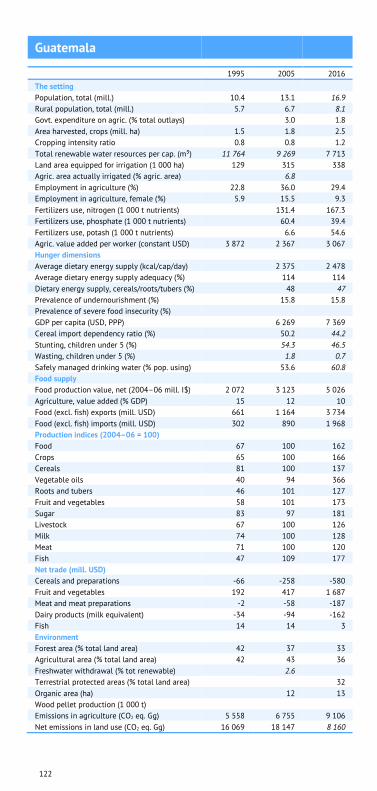
122
Guatemala
1995 2005 2016
The setting Population, total (mill.) 10.4 13.1 16.9
Rural population, total (mill.) 5.7 6.7 8.1
Govt. expenditure on agric. (% total outlays) 3.0 1.8
Area harvested, crops (mill. ha) 1.5 1.8 2.5
Cropping intensity ratio 0.8 0.8 1.2
Total renewable water resources per cap. (m³) 11 764 9 269 7 713
Land area equipped for irrigation (1 000 ha) 129 315 338
Agric. area actually irrigated (% agric. area) 6.8 Employment in agriculture (%) 22.8 36.0 29.4
Employment in agriculture, female (%) 5.9 15.5 9.3
Fertilizers use, nitrogen (1 000 t nutrients) 131.4 167.3
Fertilizers use, phosphate (1 000 t nutrients) 60.4 39.4
Fertilizers use, potash (1 000 t nutrients) 6.6 54.6
Agric. value added per worker (constant USD) 3 872 2 367 3 067
Hunger dimensions Average dietary energy supply (kcal/cap/day) 2 375 2 478
Average dietary energy supply adequacy (%) 114 114
Dietary energy supply, cereals/roots/tubers (%) 48 47
Prevalence of undernourishment (%) 15.8 15.8
Prevalence of severe food insecurity (%) GDP per capita (USD, PPP) 6 269 7 369
Cereal import dependency ratio (%) 50.2 44.2
Stunting, children under 5 (%) 54.3 46.5
Wasting, children under 5 (%) 1.8 0.7
Safely managed drinking water (% pop. using) 53.6 60.8
Food supply Food production value, net (2004–06 mill. I$) 2 072 3 123 5 026
Agriculture, value added (% GDP) 15 12 10
Food (excl. fish) exports (mill. USD) 661 1 164 3 734
Food (excl. fish) imports (mill. USD) 302 890 1 968
Production indices (2004–06 = 100) Food 67 100 162
Crops 65 100 166
Cereals 81 100 137
Vegetable oils 40 94 366
Roots and tubers 46 101 127
Fruit and vegetables 58 101 173
Sugar 83 97 181
Livestock 67 100 126
Milk 74 100 128
Meat 71 100 120
Fish 47 109 177
Net trade (mill. USD) Cereals and preparations -66 -258 -580
Fruit and vegetables 192 417 1 687
Meat and meat preparations -2 -58 -187
Dairy products (milk equivalent) -34 -94 -162
Fish 14 14 3
Environment Forest area (% total land area) 42 37 33
Agricultural area (% total land area) 42 43 36
Freshwater withdrawal (% tot renewable) 2.6 Terrestrial protected areas (% total land area) 32
Organic area (ha) 12 13
Wood pellet production (1 000 t) Emissions in agriculture (CO2 eq. Gg) 5 558 6 755 9 106
Net emissions in land use (CO2 eq. Gg) 16 069 18 147 8 160
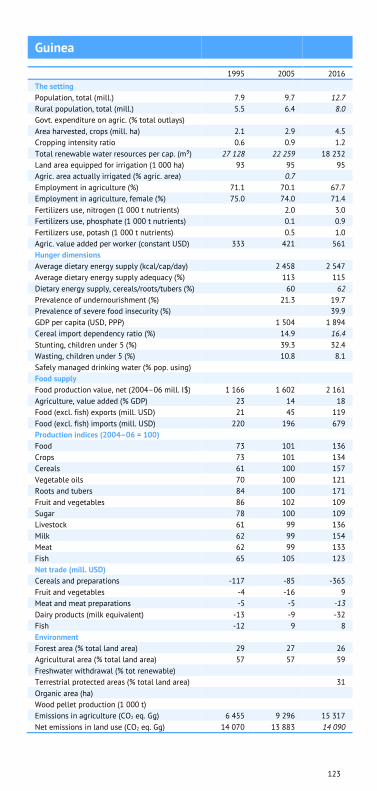
123
Guinea
1995 2005 2016
The setting Population, total (mill.) 7.9 9.7 12.7
Rural population, total (mill.) 5.5 6.4 8.0
Govt. expenditure on agric. (% total outlays) Area harvested, crops (mill. ha) 2.1 2.9 4.5
Cropping intensity ratio 0.6 0.9 1.2
Total renewable water resources per cap. (m³) 27 128 22 259 18 232
Land area equipped for irrigation (1 000 ha) 93 95 95
Agric. area actually irrigated (% agric. area) 0.7 Employment in agriculture (%) 71.1 70.1 67.7
Employment in agriculture, female (%) 75.0 74.0 71.4
Fertilizers use, nitrogen (1 000 t nutrients) 2.0 3.0
Fertilizers use, phosphate (1 000 t nutrients) 0.1 0.9
Fertilizers use, potash (1 000 t nutrients) 0.5 1.0
Agric. value added per worker (constant USD) 333 421 561
Hunger dimensions Average dietary energy supply (kcal/cap/day) 2 458 2 547
Average dietary energy supply adequacy (%) 113 115
Dietary energy supply, cereals/roots/tubers (%) 60 62
Prevalence of undernourishment (%) 21.3 19.7
Prevalence of severe food insecurity (%) 39.9
GDP per capita (USD, PPP) 1 504 1 894
Cereal import dependency ratio (%) 14.9 16.4
Stunting, children under 5 (%) 39.3 32.4
Wasting, children under 5 (%) 10.8 8.1
Safely managed drinking water (% pop. using) Food supply Food production value, net (2004–06 mill. I$) 1 166 1 602 2 161
Agriculture, value added (% GDP) 23 14 18
Food (excl. fish) exports (mill. USD) 21 45 119
Food (excl. fish) imports (mill. USD) 220 196 679
Production indices (2004–06 = 100) Food 73 101 136
Crops 73 101 134
Cereals 61 100 157
Vegetable oils 70 100 121
Roots and tubers 84 100 171
Fruit and vegetables 86 102 109
Sugar 78 100 109
Livestock 61 99 136
Milk 62 99 154
Meat 62 99 133
Fish 65 105 123
Net trade (mill. USD) Cereals and preparations -117 -85 -365
Fruit and vegetables -4 -16 9
Meat and meat preparations -5 -5 -13
Dairy products (milk equivalent) -13 -9 -32
Fish -12 9 8
Environment Forest area (% total land area) 29 27 26
Agricultural area (% total land area) 57 57 59
Freshwater withdrawal (% tot renewable) Terrestrial protected areas (% total land area) 31
Organic area (ha) Wood pellet production (1 000 t) Emissions in agriculture (CO2 eq. Gg) 6 455 9 296 15 317
Net emissions in land use (CO2 eq. Gg) 14 070 13 883 14 090

124
Guinea-Bissau
1995 2005 2016
The setting Population, total (mill.) 1.1 1.4 1.9
Rural population, total (mill.) 0.8 0.8 0.9
Govt. expenditure on agric. (% total outlays) 4.6
Area harvested, crops (mill. ha) 0.3 0.4 0.6
Cropping intensity ratio 0.8 0.8 1.0
Total renewable water resources per cap. (m³) 25 446 20 563 17 294
Land area equipped for irrigation (1 000 ha) 20 25 25
Agric. area actually irrigated (% agric. area) Employment in agriculture (%) 85.5 84.6 83.6
Employment in agriculture, female (%) 91.1 90.5 89.6
Fertilizers use, nitrogen (1 000 t nutrients) Fertilizers use, phosphate (1 000 t nutrients) Fertilizers use, potash (1 000 t nutrients) Agric. value added per worker (constant USD) 796 742
Hunger dimensions Average dietary energy supply (kcal/cap/day) 2 261 2 255
Average dietary energy supply adequacy (%) 104 102
Dietary energy supply, cereals/roots/tubers (%) 66 63
Prevalence of undernourishment (%) 24.4 26.0
Prevalence of severe food insecurity (%) GDP per capita (USD, PPP) 1 338 1 499
Cereal import dependency ratio (%) 39.6 34.0
Stunting, children under 5 (%) 47.7 27.6
Wasting, children under 5 (%) 8.9 6.0
Safely managed drinking water (% pop. using) Food supply Food production value, net (2004–06 mill. I$) 193 270 387
Agriculture, value added (% GDP) 52 44 43
Food (excl. fish) exports (mill. USD) 20 86 222
Food (excl. fish) imports (mill. USD) 28 44 121
Production indices (2004–06 = 100) Food 71 100 143
Crops 67 101 148
Cereals 109 104 131
Vegetable oils 81 104 148
Roots and tubers 72 100 130
Fruit and vegetables 85 100 132
Sugar 100 100 125
Livestock 83 100 130
Milk 86 100 130
Meat 80 100 131
Fish 92 101 97
Net trade (mill. USD) Cereals and preparations -19 -28 -49
Fruit and vegetables 19 84 213
Meat and meat preparations -1 -1 -2
Dairy products (milk equivalent) -2 -1 -14
Fish 2 4 4
Environment Forest area (% total land area) 77 74 70
Agricultural area (% total land area) 53 57 58
Freshwater withdrawal (% tot renewable) 0.6 Terrestrial protected areas (% total land area) 17
Organic area (ha) 6 1
Wood pellet production (1 000 t) Emissions in agriculture (CO2 eq. Gg) 1 109 1 146 1 663
Net emissions in land use (CO2 eq. Gg) 1 524 2 204 1 475

125
Guyana
1995 2005 2016
The setting Population, total (mill.) 0.8 0.8 0.8
Rural population, total (mill.) 0.5 0.5 0.6
Govt. expenditure on agric. (% total outlays) Area harvested, crops (mill. ha) 0.2 0.2 0.3
Cropping intensity ratio 0.4 0.4 0.6
Total renewable water resources per cap. (m³) 369 310 363 466 350 445
Land area equipped for irrigation (1 000 ha) 150 147 143
Agric. area actually irrigated (% agric. area) 7.6 Employment in agriculture (%) 32.8 23.5 14.3
Employment in agriculture, female (%) 20.4 7.8 4.3
Fertilizers use, nitrogen (1 000 t nutrients) 6.2 11.1
Fertilizers use, phosphate (1 000 t nutrients) 1.6 6.5
Fertilizers use, potash (1 000 t nutrients) 1.5 1.1
Agric. value added per worker (constant USD) 4 639 7 220 9 908
Hunger dimensions Average dietary energy supply (kcal/cap/day) 2 678 2 813
Average dietary energy supply adequacy (%) 118 121
Dietary energy supply, cereals/roots/tubers (%) 50 48
Prevalence of undernourishment (%) 9.4 7.5
Prevalence of severe food insecurity (%) GDP per capita (USD, PPP) 4 699 7 266
Cereal import dependency ratio (%) -64.8 -10.7
Stunting, children under 5 (%) 18.2 12.0
Wasting, children under 5 (%) 8.3 6.4
Safely managed drinking water (% pop. using) Food supply Food production value, net (2004–06 mill. I$) 309 293 408
Agriculture, value added (% GDP) 34 24 13
Food (excl. fish) exports (mill. USD) 196 164 284
Food (excl. fish) imports (mill. USD) 50 98 190
Production indices (2004–06 = 100) Food 99 94 131
Crops 107 93 126
Cereals 114 91 112
Vegetable oils 96 91 175
Roots and tubers 103 97 78
Fruit and vegetables 117 106 418
Sugar 99 93 74
Livestock 60 101 144
Milk 58 100 251
Meat 58 101 126
Fish 87 98 77
Net trade (mill. USD) Cereals and preparations 58 21 103
Fruit and vegetables -4 -7 -21
Meat and meat preparations -8 -2 -7
Dairy products (milk equivalent) -13 -31 -26
Fish 10 63 96
Environment Forest area (% total land area) 85 84 84
Agricultural area (% total land area) 9 9 9
Freshwater withdrawal (% tot renewable) 0.5 Terrestrial protected areas (% total land area) 9
Organic area (ha) 0 Wood pellet production (1 000 t) Emissions in agriculture (CO2 eq. Gg) 1 709 1 473 1 826
Net emissions in land use (CO2 eq. Gg) 10 272 13 654 17 575

126
Haiti
1995 2005 2016
The setting Population, total (mill.) 7.8 9.3 11.0
Rural population, total (mill.) 5.3 5.2 4.3
Govt. expenditure on agric. (% total outlays) Area harvested, crops (mill. ha) 1.1 1.2 1.7
Cropping intensity ratio 1.0 1.0 1.3
Total renewable water resources per cap. (m³) 1 730 1 468 1 293
Land area equipped for irrigation (1 000 ha) 93 96 97
Agric. area actually irrigated (% agric. area) 4.3
Employment in agriculture (%) 52.7 49.7 41.5
Employment in agriculture, female (%) 36.7 34.3 27.2
Fertilizers use, nitrogen (1 000 t nutrients) Fertilizers use, phosphate (1 000 t nutrients) Fertilizers use, potash (1 000 t nutrients) Agric. value added per worker (constant USD) 1 254 1 073 951
Hunger dimensions Average dietary energy supply (kcal/cap/day) 1 905 2 222
Average dietary energy supply adequacy (%) 84 96
Dietary energy supply, cereals/roots/tubers (%) 54 51
Prevalence of undernourishment (%) 57.1 45.8
Prevalence of severe food insecurity (%) GDP per capita (USD, PPP) 1 562 1 654
Cereal import dependency ratio (%) 65.2 54.0
Stunting, children under 5 (%) 29.7 Wasting, children under 5 (%) 10.3 Safely managed drinking water (% pop. using) Food supply Food production value, net (2004–06 mill. I$) 770 925 1 433
Agriculture, value added (% GDP) 24 22 18
Food (excl. fish) exports (mill. USD) 10 12 25
Food (excl. fish) imports (mill. USD) 353 419 939
Production indices (2004–06 = 100) Food 84 101 157
Crops 90 102 172
Cereals 100 100 138
Vegetable oils 99 103 138
Roots and tubers 94 104 188
Fruit and vegetables 87 102 167
Sugar 113 99 139
Livestock 66 101 104
Milk 82 100 109
Meat 63 101 104
Fish 50 100 161
Net trade (mill. USD) Cereals and preparations -136 -186 -359
Fruit and vegetables -19 -21 -55
Meat and meat preparations -9 -30 -107
Dairy products (milk equivalent) -24 -29 -84
Fish -2 -6 -25
Environment Forest area (% total land area) 4 4 3
Agricultural area (% total land area) 58 61 67
Freshwater withdrawal (% tot renewable) 9.2 Terrestrial protected areas (% total land area) 0
Organic area (ha) 6
Wood pellet production (1 000 t) Emissions in agriculture (CO2 eq. Gg) 3 187 3 851 3 993
Net emissions in land use (CO2 eq. Gg) 143 154 138

127
Honduras
1995 2005 2016
The setting Population, total (mill.) 5.7 7.4 9.3
Rural population, total (mill.) 3.2 3.6 3.9
Govt. expenditure on agric. (% total outlays) Area harvested, crops (mill. ha) 0.9 1.0 1.3
Cropping intensity ratio 0.5 0.7 0.9
Total renewable water resources per cap. (m³) 15 738 12 918 10 113
Land area equipped for irrigation (1 000 ha) 73 83 90
Agric. area actually irrigated (% agric. area) 2.6 Employment in agriculture (%) 37.3 39.3 28.5
Employment in agriculture, female (%) 7.1 12.9 8.3
Fertilizers use, nitrogen (1 000 t nutrients) 75.4 96.1
Fertilizers use, phosphate (1 000 t nutrients) 14.7 34.8
Fertilizers use, potash (1 000 t nutrients) 78.8 36.7
Agric. value added per worker (constant USD) 1 710 1 614 2 165
Hunger dimensions Average dietary energy supply (kcal/cap/day) 2 500 2 644
Average dietary energy supply adequacy (%) 115 116
Dietary energy supply, cereals/roots/tubers (%) 46 46
Prevalence of undernourishment (%) 17.0 15.3
Prevalence of severe food insecurity (%) GDP per capita (USD, PPP) 3 697 4 407
Cereal import dependency ratio (%) 57.3 56.1
Stunting, children under 5 (%) 29.9 Wasting, children under 5 (%) 1.4 Safely managed drinking water (% pop. using) Food supply Food production value, net (2004–06 mill. I$) 1 068 1 485 1 750
Agriculture, value added (% GDP) 19 12 12
Food (excl. fish) exports (mill. USD) 192 420 1 061
Food (excl. fish) imports (mill. USD) 166 537 1 152
Production indices (2004–06 = 100) Food 73 101 120
Crops 74 104 132
Cereals 138 99 137
Vegetable oils 35 107 204
Roots and tubers 60 101 127
Fruit and vegetables 82 107 107
Sugar 55 101 96
Livestock 69 100 110
Milk 65 96 99
Meat 71 104 114
Fish 51 109 99
Net trade (mill. USD) Cereals and preparations -66 -216 -386
Fruit and vegetables 146 196 340
Meat and meat preparations 8 -30 -112
Dairy products (milk equivalent) -17 -21 -14
Fish 144 174 395
Environment Forest area (% total land area) 65 52 40
Agricultural area (% total land area) 31 28 29
Freshwater withdrawal (% tot renewable) 1.7 Terrestrial protected areas (% total land area) 28
Organic area (ha) 2 29
Wood pellet production (1 000 t) 9
Emissions in agriculture (CO2 eq. Gg) 4 586 5 499 5 849
Net emissions in land use (CO2 eq. Gg) 40 676 29 381 28 116

128
Hungary
1995 2005 2016
The setting Population, total (mill.) 10.3 10.1 9.7
Rural population, total (mill.) 3.6 3.4 2.8
Govt. expenditure on agric. (% total outlays) 2.8 1.2
Area harvested, crops (mill. ha) 4.0 4.0 4.0
Cropping intensity ratio 0.8 0.8 0.9
Total renewable water resources per cap. (m³) 10 086 10 334 10 663
Land area equipped for irrigation (1 000 ha) 210 153 230
Agric. area actually irrigated (% agric. area) 1.3 1.8
Employment in agriculture (%) 8.0 4.9 5.0
Employment in agriculture, female (%) 4.7 2.6 2.8
Fertilizers use, nitrogen (1 000 t nutrients) 260.0 366.0
Fertilizers use, phosphate (1 000 t nutrients) 61.0 91.7
Fertilizers use, potash (1 000 t nutrients) 71.0 96.9
Agric. value added per worker (constant USD) 12 192 25 716 22 573
Hunger dimensions Average dietary energy supply (kcal/cap/day) 3 247 3 037
Average dietary energy supply adequacy (%) 127 120
Dietary energy supply, cereals/roots/tubers (%) 29 30
Prevalence of undernourishment (%) <2.5 <2.5
Prevalence of severe food insecurity (%) 1.0
GDP per capita (USD, PPP) 22 453 25 664
Cereal import dependency ratio (%) -42.4 -77.1
Stunting, children under 5 (%) Wasting, children under 5 (%) Safely managed drinking water (% pop. using) 57.2 81.5
Food supply Food production value, net (2004–06 mill. I$) 5 074 5 517 5 059
Agriculture, value added (% GDP) 7 4 4
Food (excl. fish) exports (mill. USD) 2 385 3 281 6 581
Food (excl. fish) imports (mill. USD) 475 1 860 3 752
Production indices (2004–06 = 100) Food 87 95 87
Crops 79 95 90
Cereals 70 102 89
Vegetable oils 60 95 146
Roots and tubers 170 98 59
Fruit and vegetables 86 83 85
Sugar 133 111 21
Livestock 112 98 82
Milk 101 102 67
Meat 117 96 86
Fish 79 101 101
Net trade (mill. USD) Cereals and preparations 542 423 948
Fruit and vegetables 392 70 14
Meat and meat preparations 606 529 759
Dairy products (milk equivalent) 25 -53 -64
Fish -37 -52 -77
Environment Forest area (% total land area) 21 22 23
Agricultural area (% total land area) 69 65 58
Freshwater withdrawal (% tot renewable) 5.8 5.4 Terrestrial protected areas (% total land area) 23
Organic area (ha) 124 186
Wood pellet production (1 000 t) 2
Emissions in agriculture (CO2 eq. Gg) 6 978 6 983 7 306
Net emissions in land use (CO2 eq. Gg) 3 595 5 280 4 254

129
Iceland
1995 2005 2016
The setting Population, total (mill.) 0.3 0.3 0.3
Rural population, total (mill.) 0.0 0.0 0.0
Govt. expenditure on agric. (% total outlays) 4.0 2.6
Area harvested, crops (mill. ha) 0.0 0.0 0.0
Cropping intensity ratio 0.0 0.0 0.0
Total renewable water resources per cap. (m³) 623 167 556 647 511 318
Land area equipped for irrigation (1 000 ha) Agric. area actually irrigated (% agric. area) Employment in agriculture (%) 9.5 6.5 3.9
Employment in agriculture, female (%) 4.4 3.1 2.2
Fertilizers use, nitrogen (1 000 t nutrients) 9.8 10.8
Fertilizers use, phosphate (1 000 t nutrients) 4.4 6.8
Fertilizers use, potash (1 000 t nutrients) 3.0 4.3
Agric. value added per worker (constant USD) 83 138 89 449 120 752
Hunger dimensions Average dietary energy supply (kcal/cap/day) 3 339 3 452
Average dietary energy supply adequacy (%) 132 136
Dietary energy supply, cereals/roots/tubers (%) 22 22
Prevalence of undernourishment (%) <2.5 <2.5
Prevalence of severe food insecurity (%) 1.6
GDP per capita (USD, PPP) 39 679 45 631
Cereal import dependency ratio (%) Stunting, children under 5 (%) Wasting, children under 5 (%) Safely managed drinking water (% pop. using) 92.7 98.3
Food supply Food production value, net (2004–06 mill. I$) 81 94 117
Agriculture, value added (% GDP) 10 5 5
Food (excl. fish) exports (mill. USD) 11 19 56
Food (excl. fish) imports (mill. USD) 114 223 339
Production indices (2004–06 = 100) Food 85 99 123
Crops 56 101 97
Cereals Vegetable oils Roots and tubers 51 104 74
Fruit and vegetables 62 97 124
Sugar Livestock 87 99 124
Milk 94 98 129
Meat 81 99 121
Fish 102 106 68
Net trade (mill. USD) Cereals and preparations -31 -59 -80
Fruit and vegetables -37 -75 -116
Meat and meat preparations 5 6 10
Dairy products (milk equivalent) 0 -1 5
Fish 1 302 1 696 1 895
Environment Forest area (% total land area) 0 0 1
Agricultural area (% total land area) 19 19 19
Freshwater withdrawal (% tot renewable) 0.1 0.1 0.2
Terrestrial protected areas (% total land area) 17
Organic area (ha) 5 10
Wood pellet production (1 000 t) 0
Emissions in agriculture (CO2 eq. Gg) 453 422 463
Net emissions in land use (CO2 eq. Gg) -19 -51 -180

130
India
1995 2005 2016
The setting Population, total (mill.) 960.5 1 144.1 1 339.2
Rural population, total (mill.) 701.5 797.6 871.7
Govt. expenditure on agric. (% total outlays) 5.0 6.0
Area harvested, crops (mill. ha) 178.3 182.1 194.3
Cropping intensity ratio 1.0 1.1 1.1
Total renewable water resources per cap. (m³) 1 915 1 620 1 443
Land area equipped for irrigation (1 000 ha) 53 053 64 646 70 400
Agric. area actually irrigated (% agric. area) 32.9 36.8
Employment in agriculture (%) 61.2 56.0 43.4
Employment in agriculture, female (%) 74.3 70.7 56.9
Fertilizers use, nitrogen (1 000 t nutrients) 12 723.9 16 735.4
Fertilizers use, phosphate (1 000 t nutrients) 5 210.0 6 705.4
Fertilizers use, potash (1 000 t nutrients) 2 413.5 2 508.3
Agric. value added per worker (constant USD) 832 963 1 621
Hunger dimensions Average dietary energy supply (kcal/cap/day) 2 253 2 492
Average dietary energy supply adequacy (%) 101 108
Dietary energy supply, cereals/roots/tubers (%) 62 57
Prevalence of undernourishment (%) 22.2 14.8
Prevalence of severe food insecurity (%) GDP per capita (USD, PPP) 3 179 6 096
Cereal import dependency ratio (%) -2.3 -8.6
Stunting, children under 5 (%) 47.9 38.4
Wasting, children under 5 (%) 20.0 21.0
Safely managed drinking water (% pop. using) Food supply Food production value, net (2004–06 mill. I$) 138 406 170 813 246 561
Agriculture, value added (% GDP) 25 18 16
Food (excl. fish) exports (mill. USD) 3 129 5 113 19 139
Food (excl. fish) imports (mill. USD) 1 492 3 939 20 067
Production indices (2004–06 = 100) Food 81 100 144
Crops 84 100 143
Cereals 88 102 123
Vegetable oils 90 109 122
Roots and tubers 64 102 142
Fruit and vegetables 75 98 167
Sugar 110 95 139
Livestock 72 100 153
Milk 68 100 164
Meat 84 100 117
Fish 74 101 162
Net trade (mill. USD) Cereals and preparations 1 643 1 736 5 625
Fruit and vegetables 150 132 -3 680
Meat and meat preparations 192 619 3 969
Dairy products (milk equivalent) -11 146 90
Fish 1 027 1 536 5 448
Environment Forest area (% total land area) 22 23 24
Agricultural area (% total land area) 61 61 60
Freshwater withdrawal (% tot renewable) Terrestrial protected areas (% total land area) 6
Organic area (ha) 186 1 490
Wood pellet production (1 000 t) Emissions in agriculture (CO2 eq. Gg) 533 960 579 726 636 071
Net emissions in land use (CO2 eq. Gg) -46 405 -165 144 122 469

131
Indonesia
1995 2005 2016
The setting Population, total (mill.) 197.0 226.7 264.0
Rural population, total (mill.) 124.1 121.4 117.1
Govt. expenditure on agric. (% total outlays) 1.4 1.0
Area harvested, crops (mill. ha) 30.5 34.9 44.2
Cropping intensity ratio 1.0 0.9 1.0
Total renewable water resources per cap. (m³) 9 953 8 691 7 732
Land area equipped for irrigation (1 000 ha) 4 420 6 722 6 722
Agric. area actually irrigated (% agric. area) Employment in agriculture (%) 44.0 44.0 31.8
Employment in agriculture, female (%) 43.9 44.4 30.1
Fertilizers use, nitrogen (1 000 t nutrients) 2 411.9 2 964.0
Fertilizers use, phosphate (1 000 t nutrients) 327.8 838.2
Fertilizers use, potash (1 000 t nutrients) 564.2 1 635.0
Agric. value added per worker (constant USD) 1 927 2 014 3 482
Hunger dimensions Average dietary energy supply (kcal/cap/day) 2 474 2 832
Average dietary energy supply adequacy (%) 109 124
Dietary energy supply, cereals/roots/tubers (%) 69 69
Prevalence of undernourishment (%) 18.5 7.7
Prevalence of severe food insecurity (%) GDP per capita (USD, PPP) 6 825 10 766
Cereal import dependency ratio (%) 11.7 15.4
Stunting, children under 5 (%) 28.6 36.4
Wasting, children under 5 (%) 14.4 13.5
Safely managed drinking water (% pop. using) Food supply Food production value, net (2004–06 mill. I$) 33 623 43 042 63 487
Agriculture, value added (% GDP) 14 12 13
Food (excl. fish) exports (mill. USD) 2 269 6 703 22 586
Food (excl. fish) imports (mill. USD) 3 273 3 503 12 020
Production indices (2004–06 = 100) Food 77 98 145
Crops 75 98 143
Cereals 90 100 146
Vegetable oils 37 91 210
Roots and tubers 83 99 108
Fruit and vegetables 72 98 125
Sugar 102 103 96
Livestock 80 95 145
Milk 92 97 137
Meat 82 95 139
Fish 71 100 194
Net trade (mill. USD) Cereals and preparations -1 870 -878 -2 872
Fruit and vegetables 59 70 -662
Meat and meat preparations -6 -76 -581
Dairy products (milk equivalent) -214 -421 -732
Fish 1 566 1 695 3 503
Environment Forest area (% total land area) 60 54 50
Agricultural area (% total land area) 24 29 31
Freshwater withdrawal (% tot renewable) Terrestrial protected areas (% total land area) 12
Organic area (ha) 18 126
Wood pellet production (1 000 t) 90
Emissions in agriculture (CO2 eq. Gg) 136 567 139 788 169 866
Net emissions in land use (CO2 eq. Gg) 954 712 1 139 055 1 468 854
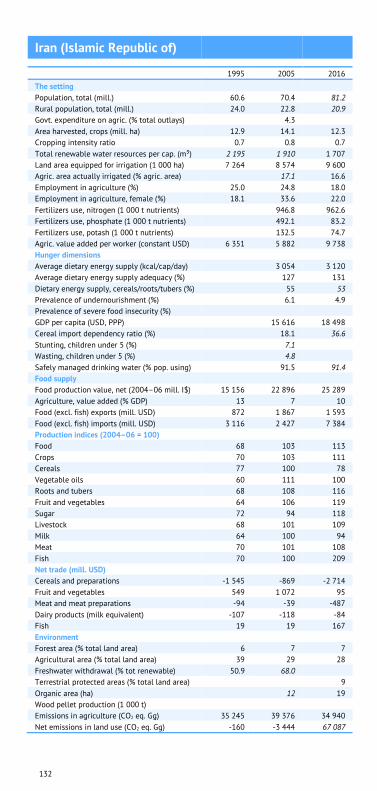
132
Iran (Islamic Republic of)
1995 2005 2016
The setting Population, total (mill.) 60.6 70.4 81.2
Rural population, total (mill.) 24.0 22.8 20.9
Govt. expenditure on agric. (% total outlays) 4.3 Area harvested, crops (mill. ha) 12.9 14.1 12.3
Cropping intensity ratio 0.7 0.8 0.7
Total renewable water resources per cap. (m³) 2 195 1 910 1 707
Land area equipped for irrigation (1 000 ha) 7 264 8 574 9 600
Agric. area actually irrigated (% agric. area) 17.1 16.6
Employment in agriculture (%) 25.0 24.8 18.0
Employment in agriculture, female (%) 18.1 33.6 22.0
Fertilizers use, nitrogen (1 000 t nutrients) 946.8 962.6
Fertilizers use, phosphate (1 000 t nutrients) 492.1 83.2
Fertilizers use, potash (1 000 t nutrients) 132.5 74.7
Agric. value added per worker (constant USD) 6 351 5 882 9 738
Hunger dimensions Average dietary energy supply (kcal/cap/day) 3 054 3 120
Average dietary energy supply adequacy (%) 127 131
Dietary energy supply, cereals/roots/tubers (%) 55 53
Prevalence of undernourishment (%) 6.1 4.9
Prevalence of severe food insecurity (%) GDP per capita (USD, PPP) 15 616 18 498
Cereal import dependency ratio (%) 18.1 36.6
Stunting, children under 5 (%) 7.1 Wasting, children under 5 (%) 4.8 Safely managed drinking water (% pop. using) 91.5 91.4
Food supply Food production value, net (2004–06 mill. I$) 15 156 22 896 25 289
Agriculture, value added (% GDP) 13 7 10
Food (excl. fish) exports (mill. USD) 872 1 867 1 593
Food (excl. fish) imports (mill. USD) 3 116 2 427 7 384
Production indices (2004–06 = 100) Food 68 103 113
Crops 70 103 111
Cereals 77 100 78
Vegetable oils 60 111 100
Roots and tubers 68 108 116
Fruit and vegetables 64 106 119
Sugar 72 94 118
Livestock 68 101 109
Milk 64 100 94
Meat 70 101 108
Fish 70 100 209
Net trade (mill. USD) Cereals and preparations -1 545 -869 -2 714
Fruit and vegetables 549 1 072 95
Meat and meat preparations -94 -39 -487
Dairy products (milk equivalent) -107 -118 -84
Fish 19 19 167
Environment Forest area (% total land area) 6 7 7
Agricultural area (% total land area) 39 29 28
Freshwater withdrawal (% tot renewable) 50.9 68.0 Terrestrial protected areas (% total land area) 9
Organic area (ha) 12 19
Wood pellet production (1 000 t) Emissions in agriculture (CO2 eq. Gg) 35 245 39 376 34 940
Net emissions in land use (CO2 eq. Gg) -160 -3 444 67 087

133
Iraq
1995 2005 2016
The setting Population, total (mill.) 20.2 27.0 38.3
Rural population, total (mill.) 6.4 8.6 11.4
Govt. expenditure on agric. (% total outlays) Area harvested, crops (mill. ha) 3.9 4.6 1.9
Cropping intensity ratio 0.8 0.9 0.4
Total renewable water resources per cap. (m³) 4 176 3 161 2 415
Land area equipped for irrigation (1 000 ha) 3 525 3 525 3 525
Agric. area actually irrigated (% agric. area) Employment in agriculture (%) 28.1 23.0 18.4
Employment in agriculture, female (%) 48.0 47.8 43.7
Fertilizers use, nitrogen (1 000 t nutrients) 153.9 160.9
Fertilizers use, phosphate (1 000 t nutrients) 62.5 16.4
Fertilizers use, potash (1 000 t nutrients) 1.8
Agric. value added per worker (constant USD) 5 471 6 675 3 971
Hunger dimensions Average dietary energy supply (kcal/cap/day) 2 364 2 491
Average dietary energy supply adequacy (%) 107 111
Dietary energy supply, cereals/roots/tubers (%) 62 63
Prevalence of undernourishment (%) 28.2 27.7
Prevalence of severe food insecurity (%) GDP per capita (USD, PPP) 10 896 16 242
Cereal import dependency ratio (%) 58.1 51.8
Stunting, children under 5 (%) 27.5 Wasting, children under 5 (%) 5.8 Safely managed drinking water (% pop. using) Food supply Food production value, net (2004–06 mill. I$) 2 329 2 378 1 553
Agriculture, value added (% GDP) 22 9 4
Food (excl. fish) exports (mill. USD) 7 23 51
Food (excl. fish) imports (mill. USD) 960 2 386 7 176
Production indices (2004–06 = 100) Food 100 102 67
Crops 101 101 64
Cereals 74 102 119
Vegetable oils 97 107 28
Roots and tubers 54 109 17
Fruit and vegetables 113 100 50
Sugar 839 1 745
Livestock 78 109 125
Milk 74 99 95
Meat 85 114 143
Fish 64 91 118
Net trade (mill. USD) Cereals and preparations -254 -1 219 -2 355
Fruit and vegetables -31 -248 -1 050
Meat and meat preparations -7 -42 -977
Dairy products (milk equivalent) -29 -183 -268
Fish 0 -10 -103
Environment Forest area (% total land area) 2 2 2
Agricultural area (% total land area) 21 21 21
Freshwater withdrawal (% tot renewable) 60.5 Terrestrial protected areas (% total land area) 2
Organic area (ha) 0
Wood pellet production (1 000 t) Emissions in agriculture (CO2 eq. Gg) 6 567 5 966 7 956
Net emissions in land use (CO2 eq. Gg) -983 -968 -2 038

134
Ireland
1995 2005 2016
The setting Population, total (mill.) 3.7 4.2 4.8
Rural population, total (mill.) 1.5 1.6 1.7
Govt. expenditure on agric. (% total outlays) 1.9 1.2
Area harvested, crops (mill. ha) 0.4 0.3 0.3
Cropping intensity ratio 0.3 0.3 0.7
Total renewable water resources per cap. (m³) 14 031 11 848 11 003
Land area equipped for irrigation (1 000 ha) Agric. area actually irrigated (% agric. area) Employment in agriculture (%) 12.0 6.0 5.6
Employment in agriculture, female (%) 3.6 1.4 1.4
Fertilizers use, nitrogen (1 000 t nutrients) 345.2 302.4
Fertilizers use, phosphate (1 000 t nutrients) 85.3 113.2
Fertilizers use, potash (1 000 t nutrients) 111.9 141.0
Agric. value added per worker (constant USD) 17 287 22 571 28 288
Hunger dimensions Average dietary energy supply (kcal/cap/day) 3 520 3 600
Average dietary energy supply adequacy (%) 141 146
Dietary energy supply, cereals/roots/tubers (%) 31 34
Prevalence of undernourishment (%) <2.5 <2.5
Prevalence of severe food insecurity (%) 2.7
GDP per capita (USD, PPP) 46 614 63 227
Cereal import dependency ratio (%) 25.4 31.6
Stunting, children under 5 (%) Wasting, children under 5 (%) Safely managed drinking water (% pop. using) 94.3 98.9
Food supply Food production value, net (2004–06 mill. I$) 4 254 4 222 4 714
Agriculture, value added (% GDP) 6 1 1
Food (excl. fish) exports (mill. USD) 7 284 8 071 10 101
Food (excl. fish) imports (mill. USD) 1 860 3 860 6 303
Production indices (2004–06 = 100) Food 99 99 110
Crops 94 97 100
Cereals 81 90 102
Vegetable oils 101 110 263
Roots and tubers 127 91 76
Fruit and vegetables 87 102 113
Sugar 95 85 Livestock 99 98 111
Milk 103 98 132
Meat 97 99 96
Fish 134 106 87
Net trade (mill. USD) Cereals and preparations 207 833 1 306
Fruit and vegetables -284 -515 -1 044
Meat and meat preparations 1 712 2 035 2 916
Dairy products (milk equivalent) 1 385 958 1 261
Fish 251 263 312
Environment Forest area (% total land area) 8 10 11
Agricultural area (% total land area) 64 62 65
Freshwater withdrawal (% tot renewable) 2.3 1.4 Terrestrial protected areas (% total land area) 14
Organic area (ha) 35 77
Wood pellet production (1 000 t) 48
Emissions in agriculture (CO2 eq. Gg) 20 461 21 018 21 667
Net emissions in land use (CO2 eq. Gg) -2 306 -1 811 -380

135
Israel
1995 2005 2016
The setting Population, total (mill.) 5.3 6.6 8.3
Rural population, total (mill.) 0.5 0.6 0.6
Govt. expenditure on agric. (% total outlays) 0.4 0.4
Area harvested, crops (mill. ha) 0.3 0.3 0.3
Cropping intensity ratio 0.7 0.8 0.8
Total renewable water resources per cap. (m³) 316 257 217
Land area equipped for irrigation (1 000 ha) 194 225 225
Agric. area actually irrigated (% agric. area) 35.3 32.8
Employment in agriculture (%) 2.9 2.0 1.1
Employment in agriculture, female (%) 1.2 0.8 0.6
Fertilizers use, nitrogen (1 000 t nutrients) 48.8 46.8
Fertilizers use, phosphate (1 000 t nutrients) 11.8 5.8
Fertilizers use, potash (1 000 t nutrients) 30.4 30.2
Agric. value added per worker (constant USD) 31 743 63 695 84 612
Hunger dimensions Average dietary energy supply (kcal/cap/day) 3 626 3 624
Average dietary energy supply adequacy (%) 157 158
Dietary energy supply, cereals/roots/tubers (%) 35 34
Prevalence of undernourishment (%) <2.5 <2.5
Prevalence of severe food insecurity (%) GDP per capita (USD, PPP) 26 761 32 688
Cereal import dependency ratio (%) 93.5 93.2
Stunting, children under 5 (%) Wasting, children under 5 (%) Safely managed drinking water (% pop. using) 99.4 99.4
Food supply Food production value, net (2004–06 mill. I$) 1 963 2 541 2 786
Agriculture, value added (% GDP) 2 2 1
Food (excl. fish) exports (mill. USD) 988 964 1 588
Food (excl. fish) imports (mill. USD) 1 435 1 829 3 931
Production indices (2004–06 = 100) Food 77 100 110
Crops 91 100 100
Cereals 109 113 111
Vegetable oils 100 75 130
Roots and tubers 47 102 101
Fruit and vegetables 92 101 98
Sugar Livestock 69 100 117
Milk 100 101 127
Meat 53 100 110
Fish 81 102 79
Net trade (mill. USD) Cereals and preparations -468 -515 -972
Fruit and vegetables 515 388 480
Meat and meat preparations -67 -121 -543
Dairy products (milk equivalent) -6 -19 -75
Fish -125 -152 -486
Environment Forest area (% total land area) 7 7 8
Agricultural area (% total land area) 26 24 25
Freshwater withdrawal (% tot renewable) 86.1 79.7 Terrestrial protected areas (% total land area) 20
Organic area (ha) 6 4
Wood pellet production (1 000 t) Emissions in agriculture (CO2 eq. Gg) 1 233 1 257 1 464
Net emissions in land use (CO2 eq. Gg) 110 -73 -73

136
Italy
1995 2005 2016
The setting Population, total (mill.) 57.3 58.8 59.4
Rural population, total (mill.) 18.8 18.9 18.8
Govt. expenditure on agric. (% total outlays) 0.6 0.3
Area harvested, crops (mill. ha) 8.5 7.9 6.8
Cropping intensity ratio 0.8 0.8 0.8
Total renewable water resources per cap. (m³) 3 353 3 235 3 219
Land area equipped for irrigation (1 000 ha) 3 642 3 973 4 005
Agric. area actually irrigated (% agric. area) 17.7 20.5
Employment in agriculture (%) 6.6 4.2 3.9
Employment in agriculture, female (%) 6.4 3.3 2.5
Fertilizers use, nitrogen (1 000 t nutrients) 800.7 585.9
Fertilizers use, phosphate (1 000 t nutrients) 285.3 164.5
Fertilizers use, potash (1 000 t nutrients) 250.3 106.8
Agric. value added per worker (constant USD) 27 020 40 027 44 242
Hunger dimensions Average dietary energy supply (kcal/cap/day) 3 606 3 579
Average dietary energy supply adequacy (%) 142 142
Dietary energy supply, cereals/roots/tubers (%) 33 33
Prevalence of undernourishment (%) <2.5 <2.5
Prevalence of severe food insecurity (%) 1.0
GDP per capita (USD, PPP) 37 604 34 655
Cereal import dependency ratio (%) 21.6 25.3
Stunting, children under 5 (%) Wasting, children under 5 (%) Safely managed drinking water (% pop. using) 89.3 93.7
Food supply Food production value, net (2004–06 mill. I$) 29 164 30 899 28 489
Agriculture, value added (% GDP) 3 2 2
Food (excl. fish) exports (mill. USD) 10 529 17 523 28 227
Food (excl. fish) imports (mill. USD) 15 026 22 547 29 411
Production indices (2004–06 = 100) Food 95 100 93
Crops 91 101 90
Cereals 91 99 88
Vegetable oils 91 97 61
Roots and tubers 116 98 75
Fruit and vegetables 89 101 101
Sugar 144 155 22
Livestock 100 100 93
Milk 96 101 94
Meat 102 100 92
Fish 133 104 77
Net trade (mill. USD) Cereals and preparations 144 593 653
Fruit and vegetables 1 878 1 510 2 697
Meat and meat preparations -2 530 -2 937 -1 859
Dairy products (milk equivalent) -1 990 -1 766 -394
Fish -1 968 -3 626 -5 385
Environment Forest area (% total land area) 27 30 32
Agricultural area (% total land area) 52 50 43
Freshwater withdrawal (% tot renewable) 28.1 Terrestrial protected areas (% total land area) 22
Organic area (ha) 1 067 1 796
Wood pellet production (1 000 t) 400
Emissions in agriculture (CO2 eq. Gg) 34 675 31 343 29 383
Net emissions in land use (CO2 eq. Gg) -34 257 -35 014 -34 256

137
Jamaica
1995 2005 2016
The setting Population, total (mill.) 2.5 2.7 2.9
Rural population, total (mill.) 1.2 1.3 1.3
Govt. expenditure on agric. (% total outlays) 1.2 1.7
Area harvested, crops (mill. ha) 0.2 0.2 0.1
Cropping intensity ratio 0.7 0.6 0.7
Total renewable water resources per cap. (m³) 4 268 4 000 3 755
Land area equipped for irrigation (1 000 ha) 25 28 31
Agric. area actually irrigated (% agric. area) Employment in agriculture (%) 23.2 18.1 18.4
Employment in agriculture, female (%) 11.7 8.4 8.2
Fertilizers use, nitrogen (1 000 t nutrients) 6.4 3.1
Fertilizers use, phosphate (1 000 t nutrients) 4.7 2.5
Fertilizers use, potash (1 000 t nutrients) 3.8 1.2
Agric. value added per worker (constant USD) 3 842 2 886 3 674
Hunger dimensions Average dietary energy supply (kcal/cap/day) 2 793 2 780
Average dietary energy supply adequacy (%) 117 113
Dietary energy supply, cereals/roots/tubers (%) 37 39
Prevalence of undernourishment (%) 7.0 8.9
Prevalence of severe food insecurity (%) GDP per capita (USD, PPP) 8 411 8 180
Cereal import dependency ratio (%) 100.0 97.2
Stunting, children under 5 (%) 5.6 6.2
Wasting, children under 5 (%) 3.3 3.6
Safely managed drinking water (% pop. using) Food supply Food production value, net (2004–06 mill. I$) 555 515 565
Agriculture, value added (% GDP) 9 5 7
Food (excl. fish) exports (mill. USD) 217 159 170
Food (excl. fish) imports (mill. USD) 297 524 675
Production indices (2004–06 = 100) Food 104 96 106
Crops 125 92 107
Cereals 223 106 130
Vegetable oils 66 96 91
Roots and tubers 195 89 133
Fruit and vegetables 120 95 107
Sugar 139 80 84
Livestock 75 102 103
Milk 94 100 111
Meat 67 103 100
Fish 136 90 84
Net trade (mill. USD) Cereals and preparations -112 -160 -206
Fruit and vegetables 66 -36 -31
Meat and meat preparations -44 -65 -66
Dairy products (milk equivalent) -34 -42 -29
Fish -14 -67 -90
Environment Forest area (% total land area) 32 31 31
Agricultural area (% total land area) 46 43 41
Freshwater withdrawal (% tot renewable) 8.6 7.5 Terrestrial protected areas (% total land area) 16
Organic area (ha) 0 0
Wood pellet production (1 000 t) Emissions in agriculture (CO2 eq. Gg) 1 069 949 595
Net emissions in land use (CO2 eq. Gg) 781 826 805

138
Japan
1995 2005 2016
The setting Population, total (mill.) 126.4 128.3 127.5
Rural population, total (mill.) 27.4 17.8 7.2
Govt. expenditure on agric. (% total outlays) Area harvested, crops (mill. ha) 3.6 3.2 2.9
Cropping intensity ratio 0.7 0.7 0.6
Total renewable water resources per cap. (m³) 3 439 3 379 3 366
Land area equipped for irrigation (1 000 ha) 2 745 2 556 2 432
Agric. area actually irrigated (% agric. area) 36.3 35.2
Employment in agriculture (%) 5.7 4.5 3.5
Employment in agriculture, female (%) 6.5 4.6 3.0
Fertilizers use, nitrogen (1 000 t nutrients) 553.5 359.1
Fertilizers use, phosphate (1 000 t nutrients) 611.1 345.2
Fertilizers use, potash (1 000 t nutrients) 352.5 309.0
Agric. value added per worker (constant USD) 19 535 22 495 22 653
Hunger dimensions Average dietary energy supply (kcal/cap/day) 2 816 2 721
Average dietary energy supply adequacy (%) 115 113
Dietary energy supply, cereals/roots/tubers (%) 40 41
Prevalence of undernourishment (%) <2.5 <2.5
Prevalence of severe food insecurity (%) <0.5
GDP per capita (USD, PPP) 35 658 38 283
Cereal import dependency ratio (%) 78.2 75.8
Stunting, children under 5 (%) Wasting, children under 5 (%) Safely managed drinking water (% pop. using) 96.8 97.2
Food supply Food production value, net (2004–06 mill. I$) 19 762 18 201 16 611
Agriculture, value added (% GDP) 2 1 1
Food (excl. fish) exports (mill. USD) 825 1 126 2 575
Food (excl. fish) imports (mill. USD) 27 490 29 633 36 830
Production indices (2004–06 = 100) Food 110 101 92
Crops 116 103 82
Cereals 119 103 74
Vegetable oils 93 108 109
Roots and tubers 119 101 79
Fruit and vegetables 115 102 88
Sugar 97 99 84
Livestock 104 100 101
Milk 101 101 90
Meat 106 99 106
Fish 134 100 76
Net trade (mill. USD) Cereals and preparations -5 191 -5 605 -6 053
Fruit and vegetables -6 181 -6 607 -8 378
Meat and meat preparations -9 666 -9 736 -11 712
Dairy products (milk equivalent) -732 -906 -1 178
Fish -17 140 -13 184 -11 851
Environment Forest area (% total land area) 68 68 68
Agricultural area (% total land area) 15 13 12
Freshwater withdrawal (% tot renewable) 20.7 19.2 Terrestrial protected areas (% total land area) 19
Organic area (ha) 7 10
Wood pellet production (1 000 t) 126
Emissions in agriculture (CO2 eq. Gg) 25 907 22 921 19 570
Net emissions in land use (CO2 eq. Gg) -74 314 -39 109 7 478

139
Jordan
1995 2005 2016
The setting Population, total (mill.) 4.6 5.7 9.7
Rural population, total (mill.) 0.9 1.0 1.3
Govt. expenditure on agric. (% total outlays) 0.8
Area harvested, crops (mill. ha) 0.2 0.2 0.2
Cropping intensity ratio 0.6 0.7 0.6
Total renewable water resources per cap. (m³) 206 163 99
Land area equipped for irrigation (1 000 ha) 73 80 107
Agric. area actually irrigated (% agric. area) 7.9 10.0
Employment in agriculture (%) 5.1 3.9 3.6
Employment in agriculture, female (%) 4.2 1.2 1.2
Fertilizers use, nitrogen (1 000 t nutrients) 21.9 22.0
Fertilizers use, phosphate (1 000 t nutrients) 43.0 0.9
Fertilizers use, potash (1 000 t nutrients) 80.2 3.6
Agric. value added per worker (constant USD) 8 255 10 935 11 480
Hunger dimensions Average dietary energy supply (kcal/cap/day) 2 872 2 570
Average dietary energy supply adequacy (%) 126 112
Dietary energy supply, cereals/roots/tubers (%) 46 46
Prevalence of undernourishment (%) 6.6 13.5
Prevalence of severe food insecurity (%) 13.9
GDP per capita (USD, PPP) 8 800 8 390
Cereal import dependency ratio (%) 96.6 93.6
Stunting, children under 5 (%) 12.0 Wasting, children under 5 (%) 2.5 Safely managed drinking water (% pop. using) 93.9 93.3
Food supply Food production value, net (2004–06 mill. I$) 683 977 1 411
Agriculture, value added (% GDP) 4 3 4
Food (excl. fish) exports (mill. USD) 168 462 1 068
Food (excl. fish) imports (mill. USD) 685 1 148 3 342
Production indices (2004–06 = 100) Food 70 101 146
Crops 68 101 142
Cereals 144 150 155
Vegetable oils 45 81 83
Roots and tubers 56 103 171
Fruit and vegetables 72 105 153
Sugar Livestock 78 101 152
Milk 51 96 112
Meat 83 104 175
Fish 57 103 170
Net trade (mill. USD) Cereals and preparations -193 -369 -1 076
Fruit and vegetables 21 133 59
Meat and meat preparations -41 -82 -291
Dairy products (milk equivalent) -89 -48 -201
Fish -24 -37 -113
Environment Forest area (% total land area) 1 1 1
Agricultural area (% total land area) 13 11 12
Freshwater withdrawal (% tot renewable) 100.0 98.4 117.8
Terrestrial protected areas (% total land area) 2
Organic area (ha) 0 2
Wood pellet production (1 000 t) Emissions in agriculture (CO2 eq. Gg) 882 880 1 325
Net emissions in land use (CO2 eq. Gg) 0 0 0

140
Kazakhstan
1995 2005 2016
The setting Population, total (mill.) 16.0 15.5 18.2
Rural population, total (mill.) 6.9 6.8 8.0
Govt. expenditure on agric. (% total outlays) 3.7 2.4
Area harvested, crops (mill. ha) 17.4 15.1 18.1
Cropping intensity ratio 0.5 0.5 0.6
Total renewable water resources per cap. (m³) 7 009 6 880 6 026
Land area equipped for irrigation (1 000 ha) 3 050 1 971 2 066
Agric. area actually irrigated (% agric. area) Employment in agriculture (%) 39.7 32.4 17.9
Employment in agriculture, female (%) 37.4 31.3 16.9
Fertilizers use, nitrogen (1 000 t nutrients) 20.5 91.5
Fertilizers use, phosphate (1 000 t nutrients) 16.9 33.1
Fertilizers use, potash (1 000 t nutrients) 3.4 2.5
Agric. value added per worker (constant USD) 1 849 2 605 5 498
Hunger dimensions Average dietary energy supply (kcal/cap/day) 3 029 3 225
Average dietary energy supply adequacy (%) 124 138
Dietary energy supply, cereals/roots/tubers (%) 43 33
Prevalence of undernourishment (%) 5.9 <2.5
Prevalence of severe food insecurity (%) 1.4
GDP per capita (USD, PPP) 16 014 23 447
Cereal import dependency ratio (%) -43.7 -79.2
Stunting, children under 5 (%) 17.5 8.0
Wasting, children under 5 (%) 4.9 3.1
Safely managed drinking water (% pop. using) Food supply Food production value, net (2004–06 mill. I$) 4 939 5 735 8 133
Agriculture, value added (% GDP) 12 6 5
Food (excl. fish) exports (mill. USD) 496 560 1 723
Food (excl. fish) imports (mill. USD) 338 960 2 291
Production indices (2004–06 = 100) Food 86 100 141
Crops 53 100 167
Cereals 58 96 153
Vegetable oils 40 104 341
Roots and tubers 65 107 154
Fruit and vegetables 40 105 186
Sugar 106 89 99
Livestock 119 100 119
Milk 88 100 123
Meat 141 99 113
Fish 149 112 128
Net trade (mill. USD) Cereals and preparations 340 284 1 139
Fruit and vegetables -9 -37 -623
Meat and meat preparations 57 -92 -193
Dairy products (milk equivalent) 2 -113 -230
Fish 5 30 -13
Environment Forest area (% total land area) 1 1 1
Agricultural area (% total land area) 80 79 80
Freshwater withdrawal (% tot renewable) 30.7 18.3 Terrestrial protected areas (% total land area) 3
Organic area (ha) 157 303
Wood pellet production (1 000 t) 0
Emissions in agriculture (CO2 eq. Gg) 26 140 20 102 22 319
Net emissions in land use (CO2 eq. Gg) 448 -68 172

141
Kenya
1995 2005 2016
The setting Population, total (mill.) 27.3 36.0 49.7
Rural population, total (mill.) 22.4 28.0 36.1
Govt. expenditure on agric. (% total outlays) 3.9 1.5
Area harvested, crops (mill. ha) 4.5 4.8 5.9
Cropping intensity ratio 0.8 0.8 0.9
Total renewable water resources per cap. (m³) 1 064 824 633
Land area equipped for irrigation (1 000 ha) 70 115 151
Agric. area actually irrigated (% agric. area) Employment in agriculture (%) 45.9 41.4 38.1
Employment in agriculture, female (%) 55.5 50.8 47.3
Fertilizers use, nitrogen (1 000 t nutrients) 72.5 151.8
Fertilizers use, phosphate (1 000 t nutrients) 93.1 61.7
Fertilizers use, potash (1 000 t nutrients) 15.0 7.9
Agric. value added per worker (constant USD) 1 496 1 868 2 013
Hunger dimensions Average dietary energy supply (kcal/cap/day) 2 116 2 217
Average dietary energy supply adequacy (%) 99 101
Dietary energy supply, cereals/roots/tubers (%) 55 57
Prevalence of undernourishment (%) 28.2 24.2
Prevalence of severe food insecurity (%) 35.6
GDP per capita (USD, PPP) 2 224 2 927
Cereal import dependency ratio (%) 21.5 32.7
Stunting, children under 5 (%) 40.9 26.0
Wasting, children under 5 (%) 7.7 4.0
Safely managed drinking water (% pop. using) Food supply Food production value, net (2004–06 mill. I$) 3 832 5 756 6 995
Agriculture, value added (% GDP) 26 21 33
Food (excl. fish) exports (mill. USD) 266 448 612
Food (excl. fish) imports (mill. USD) 334 504 1 339
Production indices (2004–06 = 100) Food 69 103 126
Crops 77 105 129
Cereals 90 100 110
Vegetable oils 86 98 120
Roots and tubers 50 118 74
Fruit and vegetables 62 107 135
Sugar 95 100 148
Livestock 63 101 122
Milk 59 102 129
Meat 64 100 116
Fish 133 102 128
Net trade (mill. USD) Cereals and preparations -72 -189 -681
Fruit and vegetables 119 276 412
Meat and meat preparations 2 5 18
Dairy products (milk equivalent) 2 2 -17
Fish 32 55 -5
Environment Forest area (% total land area) 7 7 8
Agricultural area (% total land area) 48 47 49
Freshwater withdrawal (% tot renewable) 7.6 Terrestrial protected areas (% total land area) 12
Organic area (ha) 2 155
Wood pellet production (1 000 t) Emissions in agriculture (CO2 eq. Gg) 22 731 24 662 42 504
Net emissions in land use (CO2 eq. Gg) 58 774 -47 088 -30 708

142
Kuwait
1995 2005 2016
The setting Population, total (mill.) 1.6 2.3 4.1
Rural population, total (mill.) 0.0 0.0 0.1
Govt. expenditure on agric. (% total outlays) 0.7 0.5
Area harvested, crops (mill. ha) 0.0 0.0 0.0
Cropping intensity ratio 0.6 0.7 0.9
Total renewable water resources per cap. (m³) 12 8 5
Land area equipped for irrigation (1 000 ha) 5 8 18
Agric. area actually irrigated (% agric. area) Employment in agriculture (%) 2.1 2.7 3.5
Employment in agriculture, female (%) 0.0 0.0 0.1
Fertilizers use, nitrogen (1 000 t nutrients) 374.4 0.0
Fertilizers use, phosphate (1 000 t nutrients) 0.0 1.8
Fertilizers use, potash (1 000 t nutrients) 0.0 4.3
Agric. value added per worker (constant USD) 8 005
Hunger dimensions Average dietary energy supply (kcal/cap/day) 3 558 3 472
Average dietary energy supply adequacy (%) 146 141
Dietary energy supply, cereals/roots/tubers (%) 41 43
Prevalence of undernourishment (%) <2.5 <2.5
Prevalence of severe food insecurity (%) GDP per capita (USD, PPP) 93 470 68 862
Cereal import dependency ratio (%) 100.0 97.3
Stunting, children under 5 (%) 4.5 4.9
Wasting, children under 5 (%) 3.3 3.1
Safely managed drinking water (% pop. using) 100.0 100.0
Food supply Food production value, net (2004–06 mill. I$) 98 180 357
Agriculture, value added (% GDP) 0 0 0
Food (excl. fish) exports (mill. USD) 25 46 446
Food (excl. fish) imports (mill. USD) 1 030 1 346 3 861
Production indices (2004–06 = 100) Food 53 97 192
Crops 41 99 186
Cereals 16 87 238
Vegetable oils 4 101 399
Roots and tubers 46 97 236
Fruit and vegetables 41 99 182
Sugar Livestock 62 95 197
Milk 88 106 138
Meat 61 88 183
Fish 155 93 101
Net trade (mill. USD) Cereals and preparations -175 -279 -743
Fruit and vegetables -249 -169 -928
Meat and meat preparations -125 -279 -520
Dairy products (milk equivalent) -133 -151 -389
Fish -17 -38 -207
Environment Forest area (% total land area) 0 0 0
Agricultural area (% total land area) 8 8 8
Freshwater withdrawal (% tot renewable) 1 275.0 2 075.0 Terrestrial protected areas (% total land area) 18
Organic area (ha) 0
Wood pellet production (1 000 t) Emissions in agriculture (CO2 eq. Gg) 206 614 470
Net emissions in land use (CO2 eq. Gg) -31 -33 -15

143
Kyrgyzstan
1995 2005 2016
The setting Population, total (mill.) 4.6 5.1 6.0
Rural population, total (mill.) 2.9 3.3 3.8
Govt. expenditure on agric. (% total outlays) 4.5 Area harvested, crops (mill. ha) 0.8 1.0 0.9
Cropping intensity ratio 0.6 0.7 0.7
Total renewable water resources per cap. (m³) 4 988 4 517 3 966
Land area equipped for irrigation (1 000 ha) 1 077 1 021 1 023
Agric. area actually irrigated (% agric. area) 9.3 9.5
Employment in agriculture (%) 54.0 38.5 26.8
Employment in agriculture, female (%) 53.9 37.3 27.8
Fertilizers use, nitrogen (1 000 t nutrients) 29.6 35.2
Fertilizers use, phosphate (1 000 t nutrients) 2.0 5.1
Fertilizers use, potash (1 000 t nutrients) 0.0 0.2
Agric. value added per worker (constant USD) 491 944 1 507
Hunger dimensions Average dietary energy supply (kcal/cap/day) 2 717 2 793
Average dietary energy supply adequacy (%) 115 120
Dietary energy supply, cereals/roots/tubers (%) 57 53
Prevalence of undernourishment (%) 9.7 6.5
Prevalence of severe food insecurity (%) 4.4
GDP per capita (USD, PPP) 2 370 3 310
Cereal import dependency ratio (%) 14.9 28.3
Stunting, children under 5 (%) 18.1 12.9
Wasting, children under 5 (%) 3.4 2.8
Safely managed drinking water (% pop. using) 48.7 66.3
Food supply Food production value, net (2004–06 mill. I$) 979 1 399 1 680
Agriculture, value added (% GDP) 41 28 13
Food (excl. fish) exports (mill. USD) 53 56 125
Food (excl. fish) imports (mill. USD) 86 140 346
Production indices (2004–06 = 100) Food 69 98 118
Crops 46 96 118
Cereals 54 101 107
Vegetable oils 32 100 51
Roots and tubers 37 89 115
Fruit and vegetables 43 95 141
Sugar 28 75 183
Livestock 88 99 111
Milk 71 100 114
Meat 99 99 107
Fish 905 106 4 661
Net trade (mill. USD) Cereals and preparations -26 -52 -87
Fruit and vegetables 19 8 35
Meat and meat preparations 4 -8 -16
Dairy products (milk equivalent) -5 10 14
Fish -1 -3 -5
Environment Forest area (% total land area) 4 5 3
Agricultural area (% total land area) 54 56 55
Freshwater withdrawal (% tot renewable) 41.5 32.6 Terrestrial protected areas (% total land area) 7
Organic area (ha) 0 8
Wood pellet production (1 000 t) 0
Emissions in agriculture (CO2 eq. Gg) 3 187 3 317 4 748
Net emissions in land use (CO2 eq. Gg) -2 416 -2 420 -835
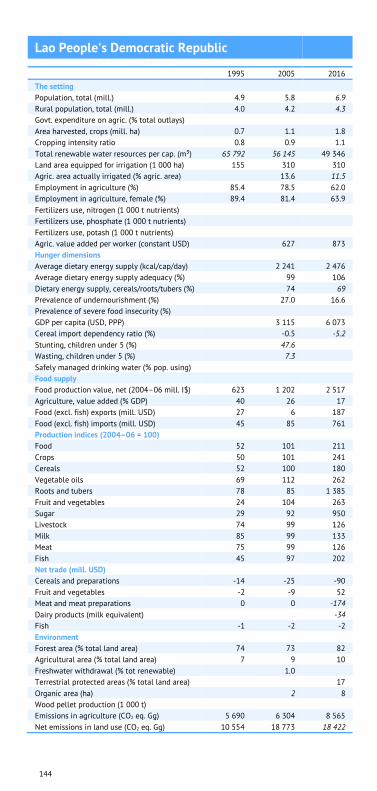
144
Lao People's Democratic Republic
1995 2005 2016
The setting Population, total (mill.) 4.9 5.8 6.9
Rural population, total (mill.) 4.0 4.2 4.3
Govt. expenditure on agric. (% total outlays) Area harvested, crops (mill. ha) 0.7 1.1 1.8
Cropping intensity ratio 0.8 0.9 1.1
Total renewable water resources per cap. (m³) 65 792 56 145 49 346
Land area equipped for irrigation (1 000 ha) 155 310 310
Agric. area actually irrigated (% agric. area) 13.6 11.5
Employment in agriculture (%) 85.4 78.5 62.0
Employment in agriculture, female (%) 89.4 81.4 63.9
Fertilizers use, nitrogen (1 000 t nutrients) Fertilizers use, phosphate (1 000 t nutrients) Fertilizers use, potash (1 000 t nutrients) Agric. value added per worker (constant USD) 627 873
Hunger dimensions Average dietary energy supply (kcal/cap/day) 2 241 2 476
Average dietary energy supply adequacy (%) 99 106
Dietary energy supply, cereals/roots/tubers (%) 74 69
Prevalence of undernourishment (%) 27.0 16.6
Prevalence of severe food insecurity (%) GDP per capita (USD, PPP) 3 115 6 073
Cereal import dependency ratio (%) -0.5 -5.2
Stunting, children under 5 (%) 47.6 Wasting, children under 5 (%) 7.3 Safely managed drinking water (% pop. using) Food supply Food production value, net (2004–06 mill. I$) 623 1 202 2 517
Agriculture, value added (% GDP) 40 26 17
Food (excl. fish) exports (mill. USD) 27 6 187
Food (excl. fish) imports (mill. USD) 45 85 761
Production indices (2004–06 = 100) Food 52 101 211
Crops 50 101 241
Cereals 52 100 180
Vegetable oils 69 112 262
Roots and tubers 78 85 1 385
Fruit and vegetables 24 104 263
Sugar 29 92 950
Livestock 74 99 126
Milk 85 99 133
Meat 75 99 126
Fish 45 97 202
Net trade (mill. USD) Cereals and preparations -14 -25 -90
Fruit and vegetables -2 -9 52
Meat and meat preparations 0 0 -174
Dairy products (milk equivalent) -34
Fish -1 -2 -2
Environment Forest area (% total land area) 74 73 82
Agricultural area (% total land area) 7 9 10
Freshwater withdrawal (% tot renewable) 1.0 Terrestrial protected areas (% total land area) 17
Organic area (ha) 2 8
Wood pellet production (1 000 t) Emissions in agriculture (CO2 eq. Gg) 5 690 6 304 8 565
Net emissions in land use (CO2 eq. Gg) 10 554 18 773 18 422

145
Latvia
1995 2005 2016
The setting Population, total (mill.) 2.5 2.3 1.9
Rural population, total (mill.) 0.8 0.7 0.7
Govt. expenditure on agric. (% total outlays) 3.3 1.4
Area harvested, crops (mill. ha) 0.5 0.6 0.9
Cropping intensity ratio 0.5 0.6 0.7
Total renewable water resources per cap. (m³) 14 349 16 094 17 731
Land area equipped for irrigation (1 000 ha) 1 1 1
Agric. area actually irrigated (% agric. area) 0.0 0.0
Employment in agriculture (%) 18.1 12.1 7.7
Employment in agriculture, female (%) 14.6 8.0 5.1
Fertilizers use, nitrogen (1 000 t nutrients) 40.9 78.3
Fertilizers use, phosphate (1 000 t nutrients) 14.7 25.4
Fertilizers use, potash (1 000 t nutrients) 18.7 30.5
Agric. value added per worker (constant USD) 4 007 7 521 16 501
Hunger dimensions Average dietary energy supply (kcal/cap/day) 3 143 3 174
Average dietary energy supply adequacy (%) 126 129
Dietary energy supply, cereals/roots/tubers (%) 34 36
Prevalence of undernourishment (%) <2.5 <2.5
Prevalence of severe food insecurity (%) 0.7
GDP per capita (USD, PPP) 17 522 23 743
Cereal import dependency ratio (%) -17.6 -94.7
Stunting, children under 5 (%) Wasting, children under 5 (%) Safely managed drinking water (% pop. using) 81.4 81.9
Food supply Food production value, net (2004–06 mill. I$) 707 640 936
Agriculture, value added (% GDP) 8 4 3
Food (excl. fish) exports (mill. USD) 70 311 1 326
Food (excl. fish) imports (mill. USD) 119 593 1 231
Production indices (2004–06 = 100) Food 114 104 152
Crops 82 112 185
Cereals 51 113 259
Vegetable oils 2 118 227
Roots and tubers 120 109 89
Fruit and vegetables 160 112 69
Sugar 50 104 Livestock 137 99 109
Milk 121 101 98
Meat 177 97 123
Fish 107 108 83
Net trade (mill. USD) Cereals and preparations -13 19 325
Fruit and vegetables -19 -135 -148
Meat and meat preparations 0 -89 -80
Dairy products (milk equivalent) 13 40 54
Fish 71 74 24
Environment Forest area (% total land area) 52 53 54
Agricultural area (% total land area) 29 28 31
Freshwater withdrawal (% tot renewable) 1.2 0.6 0.7
Terrestrial protected areas (% total land area) 18
Organic area (ha) 119 259
Wood pellet production (1 000 t) 1 513
Emissions in agriculture (CO2 eq. Gg) 3 216 2 823 3 252
Net emissions in land use (CO2 eq. Gg) -9 737 -1 092 -10 843

146
Lebanon
1995 2005 2016
The setting Population, total (mill.) 3.0 4.0 6.1
Rural population, total (mill.) 0.5 0.5 0.6
Govt. expenditure on agric. (% total outlays) 0.3 0.5
Area harvested, crops (mill. ha) 0.3 0.3 0.3
Cropping intensity ratio 0.9 0.9 1.0
Total renewable water resources per cap. (m³) 1 456 1 102 750
Land area equipped for irrigation (1 000 ha) 94 104 104
Agric. area actually irrigated (% agric. area) Employment in agriculture (%) 3.3 3.4 3.2
Employment in agriculture, female (%) 0.0 0.0 0.0
Fertilizers use, nitrogen (1 000 t nutrients) 14.7 20.8
Fertilizers use, phosphate (1 000 t nutrients) 15.0 15.0
Fertilizers use, potash (1 000 t nutrients) 7.5 7.9
Agric. value added per worker (constant USD) 45 846 33 478 23 681
Hunger dimensions Average dietary energy supply (kcal/cap/day) 3 145 2 765
Average dietary energy supply adequacy (%) 131 114
Dietary energy supply, cereals/roots/tubers (%) 40 39
Prevalence of undernourishment (%) 3.4 10.9
Prevalence of severe food insecurity (%) GDP per capita (USD, PPP) 12 269 13 268
Cereal import dependency ratio (%) 82.5 86.5
Stunting, children under 5 (%) 16.5 Wasting, children under 5 (%) 6.6 Safely managed drinking water (% pop. using) 45.2 47.5
Food supply Food production value, net (2004–06 mill. I$) 1 348 1 172 1 064
Agriculture, value added (% GDP) 5 4 3
Food (excl. fish) exports (mill. USD) 80 205 565
Food (excl. fish) imports (mill. USD) 886 1 095 2 469
Production indices (2004–06 = 100) Food 111 97 88
Crops 130 95 94
Cereals 54 100 104
Vegetable oils 42 56 84
Roots and tubers 73 109 85
Fruit and vegetables 160 100 94
Sugar 375 119 11
Livestock 60 100 75
Milk 89 107 88
Meat 49 97 75
Fish 95 100 115
Net trade (mill. USD) Cereals and preparations -196 -186 -525
Fruit and vegetables -64 -69 -157
Meat and meat preparations -61 -84 -172
Dairy products (milk equivalent) -156 -175 -284
Fish -15 -56 -148
Environment Forest area (% total land area) 13 13 13
Agricultural area (% total land area) 60 64 64
Freshwater withdrawal (% tot renewable) 29.3 24.3 Terrestrial protected areas (% total land area) 3
Organic area (ha) 3 1
Wood pellet production (1 000 t) Emissions in agriculture (CO2 eq. Gg) 556 537 767
Net emissions in land use (CO2 eq. Gg) 0 -49 -4

147
Lesotho
1995 2005 2016
The setting Population, total (mill.) 1.8 1.9 2.2
Rural population, total (mill.) 1.5 1.5 1.5
Govt. expenditure on agric. (% total outlays) 3.5 Area harvested, crops (mill. ha) 0.1 0.2 0.1
Cropping intensity ratio 0.4 0.6 0.3
Total renewable water resources per cap. (m³) 1 677 1 545 1 371
Land area equipped for irrigation (1 000 ha) 3 3 3
Agric. area actually irrigated (% agric. area) 0.0 0.1
Employment in agriculture (%) 58.4 25.8 10.7
Employment in agriculture, female (%) 47.8 13.5 4.6
Fertilizers use, nitrogen (1 000 t nutrients) Fertilizers use, phosphate (1 000 t nutrients) Fertilizers use, potash (1 000 t nutrients) Agric. value added per worker (constant USD) 453 857 2 201
Hunger dimensions Average dietary energy supply (kcal/cap/day) 2 568 2 579
Average dietary energy supply adequacy (%) 116 114
Dietary energy supply, cereals/roots/tubers (%) 81 79
Prevalence of undernourishment (%) 11.7 12.8
Prevalence of severe food insecurity (%) 50.0
GDP per capita (USD, PPP) 1 959 2 736
Cereal import dependency ratio (%) 41.3 74.7
Stunting, children under 5 (%) 45.2 33.2
Wasting, children under 5 (%) 5.6 2.8
Safely managed drinking water (% pop. using) Food supply Food production value, net (2004–06 mill. I$) 132 165 149
Agriculture, value added (% GDP) 9 6 5
Food (excl. fish) exports (mill. USD) 2 1 18
Food (excl. fish) imports (mill. USD) 143 95 303
Production indices (2004–06 = 100) Food 84 105 95
Crops 78 99 85
Cereals 69 99 28
Vegetable oils Roots and tubers 77 100 133
Fruit and vegetables 77 102 90
Sugar Livestock 90 107 99
Milk 81 114 88
Meat 91 102 108
Fish 86 99 2 361
Net trade (mill. USD) Cereals and preparations -71 -31 -110
Fruit and vegetables -26 -24 -39
Meat and meat preparations -10 -12 -54
Dairy products (milk equivalent) -20
Fish 0 -2 -4
Environment Forest area (% total land area) 1 1 2
Agricultural area (% total land area) 77 77 78
Freshwater withdrawal (% tot renewable) Terrestrial protected areas (% total land area) 0
Organic area (ha) 0 1
Wood pellet production (1 000 t) Emissions in agriculture (CO2 eq. Gg) 1 340 1 577 1 269
Net emissions in land use (CO2 eq. Gg) -34 -35 -196

148
Liberia
1995 2005 2016
The setting Population, total (mill.) 2.1 3.3 4.7
Rural population, total (mill.) 1.1 1.8 2.3
Govt. expenditure on agric. (% total outlays) 0.8 Area harvested, crops (mill. ha) 0.2 0.5 0.6
Cropping intensity ratio 0.4 0.8 0.8
Total renewable water resources per cap. (m³) 98 097 65 872 50 284
Land area equipped for irrigation (1 000 ha) 3 3 3
Agric. area actually irrigated (% agric. area) Employment in agriculture (%) 68.8 53.0 44.0
Employment in agriculture, female (%) 71.9 54.8 43.6
Fertilizers use, nitrogen (1 000 t nutrients) Fertilizers use, phosphate (1 000 t nutrients) Fertilizers use, potash (1 000 t nutrients) Agric. value added per worker (constant USD) 828 965
Hunger dimensions Average dietary energy supply (kcal/cap/day) 2 123 2 204
Average dietary energy supply adequacy (%) 98 101
Dietary energy supply, cereals/roots/tubers (%) 64 66
Prevalence of undernourishment (%) 39.4 38.8
Prevalence of severe food insecurity (%) 56.6
GDP per capita (USD, PPP) 598 754
Cereal import dependency ratio (%) 86.0 54.1
Stunting, children under 5 (%) 39.4 32.1
Wasting, children under 5 (%) 7.8 5.6
Safely managed drinking water (% pop. using) Food supply Food production value, net (2004–06 mill. I$) 168 258 347
Agriculture, value added (% GDP) 76 57 79
Food (excl. fish) exports (mill. USD) 2 9 112
Food (excl. fish) imports (mill. USD) 85 158 272
Production indices (2004–06 = 100) Food 66 101 136
Crops 44 103 109
Cereals 39 109 221
Vegetable oils 83 100 105
Roots and tubers 45 100 107
Fruit and vegetables 81 100 123
Sugar 94 100 107
Livestock 81 99 141
Milk 100 100 116
Meat 79 99 144
Fish 76 105 127
Net trade (mill. USD) Cereals and preparations -60 -86 -138
Fruit and vegetables -6 -13 3
Meat and meat preparations -3 -9 -47
Dairy products (milk equivalent) -3 -6 -7
Fish -2 -3 -10
Environment Forest area (% total land area) 50 47 43
Agricultural area (% total land area) 26 27 28
Freshwater withdrawal (% tot renewable) Terrestrial protected areas (% total land area) 2
Organic area (ha) Wood pellet production (1 000 t) Emissions in agriculture (CO2 eq. Gg) 227 271 461
Net emissions in land use (CO2 eq. Gg) 15 041 15 042 1 372

149
Libya
1995 2005 2016
The setting Population, total (mill.) 4.9 5.8 6.4
Rural population, total (mill.) 1.1 1.3 1.4
Govt. expenditure on agric. (% total outlays) Area harvested, crops (mill. ha) 0.5 0.8 0.9
Cropping intensity ratio 0.2 0.4 0.4
Total renewable water resources per cap. (m³) 138 116 111
Land area equipped for irrigation (1 000 ha) 470 425 400
Agric. area actually irrigated (% agric. area) Employment in agriculture (%) 9.1 8.7 16.8
Employment in agriculture, female (%) 7.1 7.1 13.9
Fertilizers use, nitrogen (1 000 t nutrients) 75.6 12.1
Fertilizers use, phosphate (1 000 t nutrients) 36.8 7.4
Fertilizers use, potash (1 000 t nutrients) 5.1 0.6
Agric. value added per worker (constant USD) Hunger dimensions Average dietary energy supply (kcal/cap/day) 3 192 3 329
Average dietary energy supply adequacy (%) 134 140
Dietary energy supply, cereals/roots/tubers (%) Prevalence of undernourishment (%) Prevalence of severe food insecurity (%) GDP per capita (USD, PPP) 26 045 14 299
Cereal import dependency ratio (%) Stunting, children under 5 (%) 21.0 Wasting, children under 5 (%) 6.5 Safely managed drinking water (% pop. using) Food supply Food production value, net (2004–06 mill. I$) 892 985 1 148
Agriculture, value added (% GDP) 7 2 1
Food (excl. fish) exports (mill. USD) 37 1 6
Food (excl. fish) imports (mill. USD) 1 075 1 113 2 452
Production indices (2004–06 = 100) Food 91 101 117
Crops 93 101 115
Cereals 74 107 107
Vegetable oils 90 101 101
Roots and tubers 80 101 139
Fruit and vegetables 93 101 116
Sugar Livestock 88 101 119
Milk 89 96 127
Meat 93 100 122
Fish 91 100 80
Net trade (mill. USD) Cereals and preparations -407 -520 -689
Fruit and vegetables -119 -98 -348
Meat and meat preparations -13 -41 -251
Dairy products (milk equivalent) -100 -136 -429
Fish 18 -6 -152
Environment Forest area (% total land area) 0 0 0
Agricultural area (% total land area) 9 9 9
Freshwater withdrawal (% tot renewable) 657.1 688.9 Terrestrial protected areas (% total land area) 0
Organic area (ha) Wood pellet production (1 000 t) Emissions in agriculture (CO2 eq. Gg) 1 962 2 531 2 625
Net emissions in land use (CO2 eq. Gg) 0 0 0

150
Lithuania
1995 2005 2016
The setting Population, total (mill.) 3.6 3.3 2.9
Rural population, total (mill.) 1.2 1.1 1.0
Govt. expenditure on agric. (% total outlays) 4.2 3.4
Area harvested, crops (mill. ha) 1.3 1.3 1.8
Cropping intensity ratio 0.5 0.6 0.8
Total renewable water resources per cap. (m³) 6 855 7 506 8 424
Land area equipped for irrigation (1 000 ha) 9 4 4
Agric. area actually irrigated (% agric. area) 0.0 0.1
Employment in agriculture (%) 22.2 14.3 8.0
Employment in agriculture, female (%) 19.5 11.5 5.5
Fertilizers use, nitrogen (1 000 t nutrients) 0.0 160.2
Fertilizers use, phosphate (1 000 t nutrients) 121.1 50.9
Fertilizers use, potash (1 000 t nutrients) 64.9 71.4
Agric. value added per worker (constant USD) 3 595 5 637 12 168
Hunger dimensions Average dietary energy supply (kcal/cap/day) 3 430 3 417
Average dietary energy supply adequacy (%) 138 138
Dietary energy supply, cereals/roots/tubers (%) 41 39
Prevalence of undernourishment (%) <2.5 <2.5
Prevalence of severe food insecurity (%) <0.5
GDP per capita (USD, PPP) 18 527 28 034
Cereal import dependency ratio (%) -32.3 -79.9
Stunting, children under 5 (%) Wasting, children under 5 (%) Safely managed drinking water (% pop. using) 75.2 91.7
Food supply Food production value, net (2004–06 mill. I$) 1 256 1 531 1 969
Agriculture, value added (% GDP) 10 4 3
Food (excl. fish) exports (mill. USD) 409 992 2 815
Food (excl. fish) imports (mill. USD) 162 774 1 988
Production indices (2004–06 = 100) Food 87 106 137
Crops 93 114 200
Cereals 64 113 226
Vegetable oils 13 105 212
Roots and tubers 207 118 45
Fruit and vegetables 115 119 95
Sugar 86 99 116
Livestock 88 103 89
Milk 83 102 76
Meat 95 105 102
Fish 38 92 72
Net trade (mill. USD) Cereals and preparations -17 124 659
Fruit and vegetables 24 -118 -160
Meat and meat preparations 25 -20 30
Dairy products (milk equivalent) 163 263 244
Fish 8 11 45
Environment Forest area (% total land area) 32 34 35
Agricultural area (% total land area) 54 45 47
Freshwater withdrawal (% tot renewable) 17.7 9.2 Terrestrial protected areas (% total land area) 17
Organic area (ha) 69 222
Wood pellet production (1 000 t) 246
Emissions in agriculture (CO2 eq. Gg) 5 669 4 395 5 128
Net emissions in land use (CO2 eq. Gg) 2 165 2 576 442
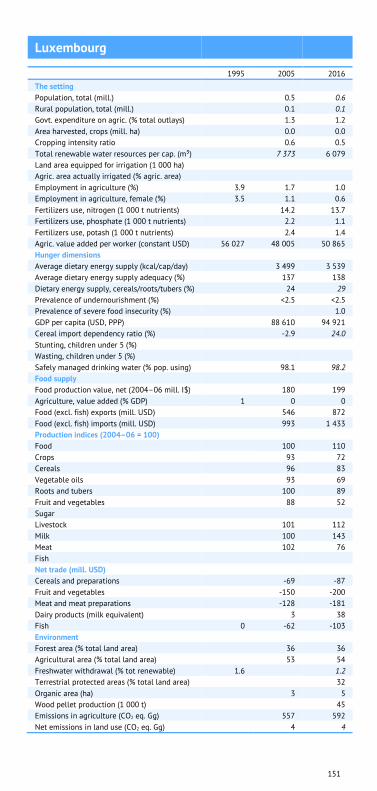
151
Luxembourg
1995 2005 2016
The setting Population, total (mill.) 0.5 0.6
Rural population, total (mill.) 0.1 0.1
Govt. expenditure on agric. (% total outlays) 1.3 1.2
Area harvested, crops (mill. ha) 0.0 0.0
Cropping intensity ratio 0.6 0.5
Total renewable water resources per cap. (m³) 7 373 6 079
Land area equipped for irrigation (1 000 ha) Agric. area actually irrigated (% agric. area) Employment in agriculture (%) 3.9 1.7 1.0
Employment in agriculture, female (%) 3.5 1.1 0.6
Fertilizers use, nitrogen (1 000 t nutrients) 14.2 13.7
Fertilizers use, phosphate (1 000 t nutrients) 2.2 1.1
Fertilizers use, potash (1 000 t nutrients) 2.4 1.4
Agric. value added per worker (constant USD) 56 027 48 005 50 865
Hunger dimensions Average dietary energy supply (kcal/cap/day) 3 499 3 539
Average dietary energy supply adequacy (%) 137 138
Dietary energy supply, cereals/roots/tubers (%) 24 29
Prevalence of undernourishment (%) <2.5 <2.5
Prevalence of severe food insecurity (%) 1.0
GDP per capita (USD, PPP) 88 610 94 921
Cereal import dependency ratio (%) -2.9 24.0
Stunting, children under 5 (%) Wasting, children under 5 (%) Safely managed drinking water (% pop. using) 98.1 98.2
Food supply Food production value, net (2004–06 mill. I$) 180 199
Agriculture, value added (% GDP) 1 0 0
Food (excl. fish) exports (mill. USD) 546 872
Food (excl. fish) imports (mill. USD) 993 1 433
Production indices (2004–06 = 100) Food 100 110
Crops 93 72
Cereals 96 83
Vegetable oils 93 69
Roots and tubers 100 89
Fruit and vegetables 88 52
Sugar Livestock 101 112
Milk 100 143
Meat 102 76
Fish Net trade (mill. USD) Cereals and preparations -69 -87
Fruit and vegetables -150 -200
Meat and meat preparations -128 -181
Dairy products (milk equivalent) 3 38
Fish 0 -62 -103
Environment Forest area (% total land area) 36 36
Agricultural area (% total land area) 53 54
Freshwater withdrawal (% tot renewable) 1.6 1.2
Terrestrial protected areas (% total land area) 32
Organic area (ha) 3 5
Wood pellet production (1 000 t) 45
Emissions in agriculture (CO2 eq. Gg) 557 592
Net emissions in land use (CO2 eq. Gg) 4 4

152
Madagascar
1995 2005 2016
The setting Population, total (mill.) 13.5 18.3 25.6
Rural population, total (mill.) 10.0 13.0 16.3
Govt. expenditure on agric. (% total outlays) 9.5 Area harvested, crops (mill. ha) 2.7 2.9 2.5
Cropping intensity ratio 0.8 0.8 0.6
Total renewable water resources per cap. (m³) 23 519 17 397 13 537
Land area equipped for irrigation (1 000 ha) 1 087 1 086 1 086
Agric. area actually irrigated (% agric. area) 2.2 Employment in agriculture (%) 78.2 82.0 74.3
Employment in agriculture, female (%) 79.8 82.5 72.0
Fertilizers use, nitrogen (1 000 t nutrients) 7.3 9.5
Fertilizers use, phosphate (1 000 t nutrients) 4.6 4.3
Fertilizers use, potash (1 000 t nutrients) 4.5 4.3
Agric. value added per worker (constant USD) 346 284 244
Hunger dimensions Average dietary energy supply (kcal/cap/day) 2 042 1 907
Average dietary energy supply adequacy (%) 97 89
Dietary energy supply, cereals/roots/tubers (%) 78 79
Prevalence of undernourishment (%) 35.0 43.1
Prevalence of severe food insecurity (%) GDP per capita (USD, PPP) 1 390 1 397
Cereal import dependency ratio (%) 11.6 13.2
Stunting, children under 5 (%) 52.8 Wasting, children under 5 (%) 15.2 Safely managed drinking water (% pop. using) Food supply Food production value, net (2004–06 mill. I$) 2 382 2 803 3 307
Agriculture, value added (% GDP) 36 30 32
Food (excl. fish) exports (mill. USD) 99 103 706
Food (excl. fish) imports (mill. USD) 74 216 388
Production indices (2004–06 = 100) Food 87 103 121
Crops 81 103 117
Cereals 72 103 115
Vegetable oils 89 99 136
Roots and tubers 86 110 107
Fruit and vegetables 85 100 127
Sugar 86 100 123
Livestock 106 104 124
Milk 101 101 107
Meat 109 105 130
Fish 84 99 105
Net trade (mill. USD) Cereals and preparations -39 -130 -188
Fruit and vegetables 29 23 69
Meat and meat preparations 9 -1 2
Dairy products (milk equivalent) -5 -9 -19
Fish 83 120 117
Environment Forest area (% total land area) 23 22 21
Agricultural area (% total land area) 63 70 71
Freshwater withdrawal (% tot renewable) 4.0 Terrestrial protected areas (% total land area) 5
Organic area (ha) 2 60
Wood pellet production (1 000 t) Emissions in agriculture (CO2 eq. Gg) 21 452 21 794 20 489
Net emissions in land use (CO2 eq. Gg) 39 807 26 719 21 743

153
Malawi
1995 2005 2016
The setting Population, total (mill.) 9.9 13.0 18.6
Rural population, total (mill.) 8.6 11.0 15.3
Govt. expenditure on agric. (% total outlays) 10.9 15.0
Area harvested, crops (mill. ha) 2.4 3.4 4.0
Cropping intensity ratio 1.0 1.0 1.0
Total renewable water resources per cap. (m³) 1 684 1 280 955
Land area equipped for irrigation (1 000 ha) 36 71 74
Agric. area actually irrigated (% agric. area) 0.6 Employment in agriculture (%) 84.1 85.0 84.7
Employment in agriculture, female (%) 88.4 89.4 89.7
Fertilizers use, nitrogen (1 000 t nutrients) 66.2 71.2
Fertilizers use, phosphate (1 000 t nutrients) 19.7 5.3
Fertilizers use, potash (1 000 t nutrients) 11.7 5.6
Agric. value added per worker (constant USD) 352 417 375
Hunger dimensions Average dietary energy supply (kcal/cap/day) 2 210 2 246
Average dietary energy supply adequacy (%) 105 104
Dietary energy supply, cereals/roots/tubers (%) 73 70
Prevalence of undernourishment (%) 26.1 26.3
Prevalence of severe food insecurity (%) 52.4
GDP per capita (USD, PPP) 840 1 084
Cereal import dependency ratio (%) 6.9 1.2
Stunting, children under 5 (%) 53.2 37.1
Wasting, children under 5 (%) 4.2 2.7
Safely managed drinking water (% pop. using) Food supply Food production value, net (2004–06 mill. I$) 824 1 372 2 353
Agriculture, value added (% GDP) 30 33 23
Food (excl. fish) exports (mill. USD) 39 65 154
Food (excl. fish) imports (mill. USD) 94 90 356
Production indices (2004–06 = 100) Food 52 86 147
Crops 58 84 138
Cereals 91 67 131
Vegetable oils 29 84 197
Roots and tubers 16 79 121
Fruit and vegetables 59 100 132
Sugar 82 104 126
Livestock 70 96 244
Milk 69 107 211
Meat 69 94 266
Fish 84 94 251
Net trade (mill. USD) Cereals and preparations -65 -45 -259
Fruit and vegetables 8 10 48
Meat and meat preparations -1 0 -1
Dairy products (milk equivalent) -3 -14 -7
Fish 0 0 -2
Environment Forest area (% total land area) 40 36 33
Agricultural area (% total land area) 45 55 61
Freshwater withdrawal (% tot renewable) 5.4 7.9 Terrestrial protected areas (% total land area) 17
Organic area (ha) 0 12
Wood pellet production (1 000 t) Emissions in agriculture (CO2 eq. Gg) 2 044 2 806 5 681
Net emissions in land use (CO2 eq. Gg) 6 693 7 698 4 414

154
Malaysia
1995 2005 2016
The setting Population, total (mill.) 20.5 25.7 31.6
Rural population, total (mill.) 9.2 8.6 7.6
Govt. expenditure on agric. (% total outlays) 3.4 2.9
Area harvested, crops (mill. ha) 5.7 6.6 7.3
Cropping intensity ratio 0.9 1.0 0.9
Total renewable water resources per cap. (m³) 26 596 21 698 18 597
Land area equipped for irrigation (1 000 ha) 363 375 442
Agric. area actually irrigated (% agric. area) 5.1
Employment in agriculture (%) 20.0 14.6 11.4
Employment in agriculture, female (%) 17.0 10.1 6.8
Fertilizers use, nitrogen (1 000 t nutrients) 634.7 280.6
Fertilizers use, phosphate (1 000 t nutrients) 78.3 288.4
Fertilizers use, potash (1 000 t nutrients) 682.5 951.0
Agric. value added per worker (constant USD) 11 199 14 632 16 735
Hunger dimensions Average dietary energy supply (kcal/cap/day) 2 810 2 964
Average dietary energy supply adequacy (%) 121 125
Dietary energy supply, cereals/roots/tubers (%) 47 44
Prevalence of undernourishment (%) 3.9 2.9
Prevalence of severe food insecurity (%) GDP per capita (USD, PPP) 18 577 25 669
Cereal import dependency ratio (%) 86.3 72.6
Stunting, children under 5 (%) 17.2 20.7
Wasting, children under 5 (%) 11.5
Safely managed drinking water (% pop. using) 93.2 92.1
Food supply Food production value, net (2004–06 mill. I$) 7 427 11 127 14 568
Agriculture, value added (% GDP) 13 8 9
Food (excl. fish) exports (mill. USD) 6 015 7 648 16 150
Food (excl. fish) imports (mill. USD) 2 821 4 456 10 700
Production indices (2004–06 = 100) Food 67 100 131
Crops 66 100 118
Cereals 94 103 100
Vegetable oils 53 100 131
Roots and tubers 275 101 105
Fruit and vegetables 93 100 136
Sugar 331 103 1
Livestock 87 100 145
Milk 91 100 102
Meat 89 100 136
Fish 86 96 123
Net trade (mill. USD) Cereals and preparations -711 -823 -883
Fruit and vegetables -260 -357 -1 482
Meat and meat preparations -125 -255 -681
Dairy products (milk equivalent) -303 -333 -419
Fish 11 112 -224
Environment Forest area (% total land area) 67 64 68
Agricultural area (% total land area) 21 22 26
Freshwater withdrawal (% tot renewable) 0.9 1.9 Terrestrial protected areas (% total land area) 19
Organic area (ha) 1 1
Wood pellet production (1 000 t) 310
Emissions in agriculture (CO2 eq. Gg) 11 540 14 095 12 533
Net emissions in land use (CO2 eq. Gg) 126 794 153 534 -138 287
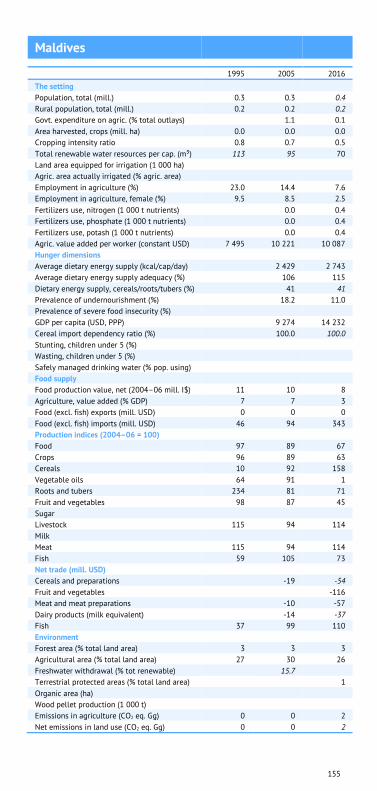
155
Maldives
1995 2005 2016
The setting Population, total (mill.) 0.3 0.3 0.4
Rural population, total (mill.) 0.2 0.2 0.2
Govt. expenditure on agric. (% total outlays) 1.1 0.1
Area harvested, crops (mill. ha) 0.0 0.0 0.0
Cropping intensity ratio 0.8 0.7 0.5
Total renewable water resources per cap. (m³) 113 95 70
Land area equipped for irrigation (1 000 ha) Agric. area actually irrigated (% agric. area) Employment in agriculture (%) 23.0 14.4 7.6
Employment in agriculture, female (%) 9.5 8.5 2.5
Fertilizers use, nitrogen (1 000 t nutrients) 0.0 0.4
Fertilizers use, phosphate (1 000 t nutrients) 0.0 0.4
Fertilizers use, potash (1 000 t nutrients) 0.0 0.4
Agric. value added per worker (constant USD) 7 495 10 221 10 087
Hunger dimensions Average dietary energy supply (kcal/cap/day) 2 429 2 743
Average dietary energy supply adequacy (%) 106 115
Dietary energy supply, cereals/roots/tubers (%) 41 41
Prevalence of undernourishment (%) 18.2 11.0
Prevalence of severe food insecurity (%) GDP per capita (USD, PPP) 9 274 14 232
Cereal import dependency ratio (%) 100.0 100.0
Stunting, children under 5 (%) Wasting, children under 5 (%) Safely managed drinking water (% pop. using) Food supply Food production value, net (2004–06 mill. I$) 11 10 8
Agriculture, value added (% GDP) 7 7 3
Food (excl. fish) exports (mill. USD) 0 0 0
Food (excl. fish) imports (mill. USD) 46 94 343
Production indices (2004–06 = 100) Food 97 89 67
Crops 96 89 63
Cereals 10 92 158
Vegetable oils 64 91 1
Roots and tubers 234 81 71
Fruit and vegetables 98 87 45
Sugar Livestock 115 94 114
Milk Meat 115 94 114
Fish 59 105 73
Net trade (mill. USD) Cereals and preparations -19 -54
Fruit and vegetables -116
Meat and meat preparations -10 -57
Dairy products (milk equivalent) -14 -37
Fish 37 99 110
Environment Forest area (% total land area) 3 3 3
Agricultural area (% total land area) 27 30 26
Freshwater withdrawal (% tot renewable) 15.7 Terrestrial protected areas (% total land area) 1
Organic area (ha) Wood pellet production (1 000 t) Emissions in agriculture (CO2 eq. Gg) 0 0 2
Net emissions in land use (CO2 eq. Gg) 0 0 2

156
Mali
1995 2005 2016
The setting Population, total (mill.) 9.6 12.8 18.5
Rural population, total (mill.) 6.7 8.1 10.1
Govt. expenditure on agric. (% total outlays) 17.7 Area harvested, crops (mill. ha) 3.6 4.5 7.5
Cropping intensity ratio 1.1 0.8 1.1
Total renewable water resources per cap. (m³) 11 802 8 722 6 669
Land area equipped for irrigation (1 000 ha) 85 291 380
Agric. area actually irrigated (% agric. area) Employment in agriculture (%) 50.1 44.8 61.6
Employment in agriculture, female (%) 38.0 33.2 61.3
Fertilizers use, nitrogen (1 000 t nutrients) 59.3 167.4
Fertilizers use, phosphate (1 000 t nutrients) 16.1 76.1
Fertilizers use, potash (1 000 t nutrients) 12.5 40.2
Agric. value added per worker (constant USD) 1 454 1 743 1 213
Hunger dimensions Average dietary energy supply (kcal/cap/day) 2 594 2 956
Average dietary energy supply adequacy (%) 124 142
Dietary energy supply, cereals/roots/tubers (%) 67 67
Prevalence of undernourishment (%) 11.1 6.0
Prevalence of severe food insecurity (%) GDP per capita (USD, PPP) 1 761 1 971
Cereal import dependency ratio (%) 9.6 7.8
Stunting, children under 5 (%) 38.5 30.4
Wasting, children under 5 (%) 15.3 13.5
Safely managed drinking water (% pop. using) Food supply Food production value, net (2004–06 mill. I$) 1 803 2 691 4 626
Agriculture, value added (% GDP) 37 31 37
Food (excl. fish) exports (mill. USD) 113 53 175
Food (excl. fish) imports (mill. USD) 81 209 459
Production indices (2004–06 = 100) Food 69 102 176
Crops 76 103 193
Cereals 64 103 270
Vegetable oils 71 113 164
Roots and tubers 30 102 297
Fruit and vegetables 80 100 154
Sugar 87 102 111
Livestock 61 102 135
Milk 48 105 105
Meat 67 99 151
Fish 132 100 106
Net trade (mill. USD) Cereals and preparations -25 -106 -207
Fruit and vegetables -11 -5 -22
Meat and meat preparations 0 0 -3
Dairy products (milk equivalent) -16 -17 -29
Fish -1 -5 -30
Environment Forest area (% total land area) 5 5 4
Agricultural area (% total land area) 29 33 34
Freshwater withdrawal (% tot renewable) 4.3 Terrestrial protected areas (% total land area) 8
Organic area (ha) 15 12
Wood pellet production (1 000 t) Emissions in agriculture (CO2 eq. Gg) 15 334 22 303 31 056
Net emissions in land use (CO2 eq. Gg) 7 964 8 152 7 425
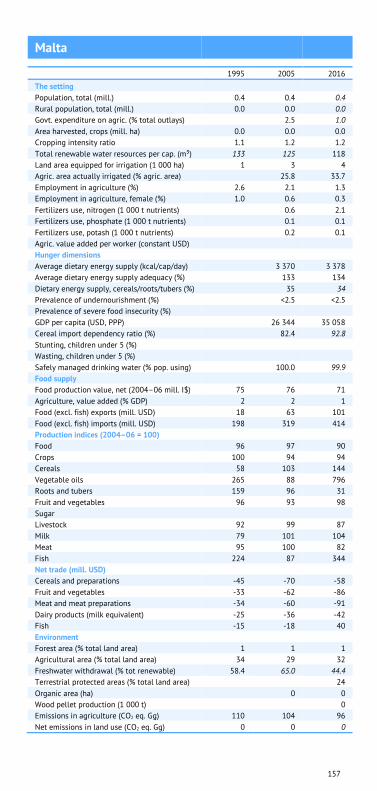
157
Malta
1995 2005 2016
The setting Population, total (mill.) 0.4 0.4 0.4
Rural population, total (mill.) 0.0 0.0 0.0
Govt. expenditure on agric. (% total outlays) 2.5 1.0
Area harvested, crops (mill. ha) 0.0 0.0 0.0
Cropping intensity ratio 1.1 1.2 1.2
Total renewable water resources per cap. (m³) 133 125 118
Land area equipped for irrigation (1 000 ha) 1 3 4
Agric. area actually irrigated (% agric. area) 25.8 33.7
Employment in agriculture (%) 2.6 2.1 1.3
Employment in agriculture, female (%) 1.0 0.6 0.3
Fertilizers use, nitrogen (1 000 t nutrients) 0.6 2.1
Fertilizers use, phosphate (1 000 t nutrients) 0.1 0.1
Fertilizers use, potash (1 000 t nutrients) 0.2 0.1
Agric. value added per worker (constant USD) Hunger dimensions Average dietary energy supply (kcal/cap/day) 3 370 3 378
Average dietary energy supply adequacy (%) 133 134
Dietary energy supply, cereals/roots/tubers (%) 35 34
Prevalence of undernourishment (%) <2.5 <2.5
Prevalence of severe food insecurity (%) GDP per capita (USD, PPP) 26 344 35 058
Cereal import dependency ratio (%) 82.4 92.8
Stunting, children under 5 (%) Wasting, children under 5 (%) Safely managed drinking water (% pop. using) 100.0 99.9
Food supply Food production value, net (2004–06 mill. I$) 75 76 71
Agriculture, value added (% GDP) 2 2 1
Food (excl. fish) exports (mill. USD) 18 63 101
Food (excl. fish) imports (mill. USD) 198 319 414
Production indices (2004–06 = 100) Food 96 97 90
Crops 100 94 94
Cereals 58 103 144
Vegetable oils 265 88 796
Roots and tubers 159 96 31
Fruit and vegetables 96 93 98
Sugar Livestock 92 99 87
Milk 79 101 104
Meat 95 100 82
Fish 224 87 344
Net trade (mill. USD) Cereals and preparations -45 -70 -58
Fruit and vegetables -33 -62 -86
Meat and meat preparations -34 -60 -91
Dairy products (milk equivalent) -25 -36 -42
Fish -15 -18 40
Environment Forest area (% total land area) 1 1 1
Agricultural area (% total land area) 34 29 32
Freshwater withdrawal (% tot renewable) 58.4 65.0 44.4
Terrestrial protected areas (% total land area) 24
Organic area (ha) 0 0
Wood pellet production (1 000 t) 0
Emissions in agriculture (CO2 eq. Gg) 110 104 96
Net emissions in land use (CO2 eq. Gg) 0 0 0

158
Mauritania
1995 2005 2016
The setting Population, total (mill.) 2.3 3.1 4.4
Rural population, total (mill.) 1.3 1.5 1.7
Govt. expenditure on agric. (% total outlays) Area harvested, crops (mill. ha) 0.4 0.3 0.4
Cropping intensity ratio 0.8 0.8 0.9
Total renewable water resources per cap. (m³) 4 604 3 425 2 651
Land area equipped for irrigation (1 000 ha) 45 45 45
Agric. area actually irrigated (% agric. area) 0.1 Employment in agriculture (%) 80.5 77.9 76.1
Employment in agriculture, female (%) 88.6 85.5 84.4
Fertilizers use, nitrogen (1 000 t nutrients) Fertilizers use, phosphate (1 000 t nutrients) Fertilizers use, potash (1 000 t nutrients) Agric. value added per worker (constant USD) 1 488 1 093 1 170
Hunger dimensions Average dietary energy supply (kcal/cap/day) 2 610 2 814
Average dietary energy supply adequacy (%) 118 126
Dietary energy supply, cereals/roots/tubers (%) 51 51
Prevalence of undernourishment (%) 12.1 11.3
Prevalence of severe food insecurity (%) GDP per capita (USD, PPP) 2 986 3 572
Cereal import dependency ratio (%) 64.4 87.1
Stunting, children under 5 (%) 28.9 27.9
Wasting, children under 5 (%) 13.4 14.8
Safely managed drinking water (% pop. using) Food supply Food production value, net (2004–06 mill. I$) 425 531 636
Agriculture, value added (% GDP) 42 28 22
Food (excl. fish) exports (mill. USD) 48 15 19
Food (excl. fish) imports (mill. USD) 115 151 345
Production indices (2004–06 = 100) Food 80 100 120
Crops 108 105 173
Cereals 126 108 234
Vegetable oils 154 102 101
Roots and tubers 80 99 108
Fruit and vegetables 116 100 103
Sugar Livestock 77 100 113
Milk 83 100 112
Meat 71 99 114
Fish 23 123 247
Net trade (mill. USD) Cereals and preparations -53 -63 -128
Fruit and vegetables -5 -16 -35
Meat and meat preparations 0 -5 -18
Dairy products (milk equivalent) -15 -73
Fish 159 124 598
Environment Forest area (% total land area) 0 0 0
Agricultural area (% total land area) 39 38 39
Freshwater withdrawal (% tot renewable) 11.8 Terrestrial protected areas (% total land area) 1
Organic area (ha) Wood pellet production (1 000 t) Emissions in agriculture (CO2 eq. Gg) 5 107 7 169 8 096
Net emissions in land use (CO2 eq. Gg) 1 100 1 100 -1 518

159
Mauritius
1995 2005 2016
The setting Population, total (mill.) 1.1 1.2 1.3
Rural population, total (mill.) 0.6 0.7 0.8
Govt. expenditure on agric. (% total outlays) 3.9 2.2
Area harvested, crops (mill. ha) 0.1 0.1 0.1
Cropping intensity ratio 0.9 0.9 0.8
Total renewable water resources per cap. (m³) 2 384 2 231 2 180
Land area equipped for irrigation (1 000 ha) 18 21 17
Agric. area actually irrigated (% agric. area) 21.9 19.5
Employment in agriculture (%) 14.5 10.0 7.2
Employment in agriculture, female (%) 12.6 8.9 6.0
Fertilizers use, nitrogen (1 000 t nutrients) 9.9 8.1
Fertilizers use, phosphate (1 000 t nutrients) 5.8 3.4
Fertilizers use, potash (1 000 t nutrients) 14.2 6.2
Agric. value added per worker (constant USD) 4 448 5 835 10 173
Hunger dimensions Average dietary energy supply (kcal/cap/day) 3 018 3 043
Average dietary energy supply adequacy (%) 126 125
Dietary energy supply, cereals/roots/tubers (%) 46 46
Prevalence of undernourishment (%) 5.2 5.8
Prevalence of severe food insecurity (%) 5.9
GDP per capita (USD, PPP) 12 442 19 568
Cereal import dependency ratio (%) 96.2 93.9
Stunting, children under 5 (%) Wasting, children under 5 (%) Safely managed drinking water (% pop. using) Food supply Food production value, net (2004–06 mill. I$) 235 251 234
Agriculture, value added (% GDP) 8 5 3
Food (excl. fish) exports (mill. USD) 402 371 323
Food (excl. fish) imports (mill. USD) 245 335 655
Production indices (2004–06 = 100) Food 92 99 92
Crops 105 99 80
Cereals 67 111 237
Vegetable oils 220 68 51
Roots and tubers 132 111 152
Fruit and vegetables 99 93 98
Sugar 103 100 76
Livestock 60 97 129
Milk 188 100 100
Meat 62 97 139
Fish 167 104 193
Net trade (mill. USD) Cereals and preparations -62 -90 -131
Fruit and vegetables -30 -45 -92
Meat and meat preparations -17 -34 -70
Dairy products (milk equivalent) -49 -60 -99
Fish -2 18 100
Environment Forest area (% total land area) 20 19 19
Agricultural area (% total land area) 51 47 42
Freshwater withdrawal (% tot renewable) 22.4 26.4 Terrestrial protected areas (% total land area) 5
Organic area (ha) 0
Wood pellet production (1 000 t) 0
Emissions in agriculture (CO2 eq. Gg) 172 139 136
Net emissions in land use (CO2 eq. Gg) -26 183 -15

160
Mexico
1995 2005 2016
The setting Population, total (mill.) 94.0 108.5 129.2
Rural population, total (mill.) 25.4 26.2 25.9
Govt. expenditure on agric. (% total outlays) Area harvested, crops (mill. ha) 16.7 14.9 16.7
Cropping intensity ratio 0.7 0.6 0.7
Total renewable water resources per cap. (m³) 4 717 4 083 3 622
Land area equipped for irrigation (1 000 ha) 6 194 6 300 6 500
Agric. area actually irrigated (% agric. area) 5.1 5.5
Employment in agriculture (%) 23.9 14.8 12.9
Employment in agriculture, female (%) 10.2 4.7 3.4
Fertilizers use, nitrogen (1 000 t nutrients) 1 219.5 2 003.8
Fertilizers use, phosphate (1 000 t nutrients) 438.2 371.5
Fertilizers use, potash (1 000 t nutrients) 187.1 196.9
Agric. value added per worker (constant USD) 3 273 4 793 5 533
Hunger dimensions Average dietary energy supply (kcal/cap/day) 3 083 3 143
Average dietary energy supply adequacy (%) 132 132
Dietary energy supply, cereals/roots/tubers (%) 44 44
Prevalence of undernourishment (%) 5.5 3.8
Prevalence of severe food insecurity (%) 8.9
GDP per capita (USD, PPP) 15 792 17 207
Cereal import dependency ratio (%) 35.8 30.5
Stunting, children under 5 (%) 15.5 12.4
Wasting, children under 5 (%) 2.0 1.0
Safely managed drinking water (% pop. using) 40.1 42.6
Food supply Food production value, net (2004–06 mill. I$) 23 922 30 029 38 641
Agriculture, value added (% GDP) 4 3 3
Food (excl. fish) exports (mill. USD) 3 948 7 573 22 107
Food (excl. fish) imports (mill. USD) 4 088 11 232 19 349
Production indices (2004–06 = 100) Food 78 98 127
Crops 80 97 135
Cereals 86 93 123
Vegetable oils 88 94 173
Roots and tubers 77 105 122
Fruit and vegetables 70 99 147
Sugar 88 103 112
Livestock 76 99 116
Milk 75 99 116
Meat 79 100 113
Fish 94 100 120
Net trade (mill. USD) Cereals and preparations -978 -2 341 -2 581
Fruit and vegetables 2 314 3 867 11 460
Meat and meat preparations -442 -2 121 -2 159
Dairy products (milk equivalent) -416 -1 000 -1 301
Fish 618 261 208
Environment Forest area (% total land area) 35 35 34
Agricultural area (% total land area) 55 55 55
Freshwater withdrawal (% tot renewable) 17.0 18.6
Terrestrial protected areas (% total land area) 14
Organic area (ha) 308 674
Wood pellet production (1 000 t) 4
Emissions in agriculture (CO2 eq. Gg) 78 502 79 825 89 728
Net emissions in land use (CO2 eq. Gg) 19 372 19 999 8 705

161
Mongolia
1995 2005 2016
The setting Population, total (mill.) 2.3 2.5 3.1
Rural population, total (mill.) 1.0 0.9 0.8
Govt. expenditure on agric. (% total outlays) 3.7 1.2
Area harvested, crops (mill. ha) 0.4 0.2 0.4
Cropping intensity ratio 0.3 0.3 0.7
Total renewable water resources per cap. (m³) 14 897 13 421 11 495
Land area equipped for irrigation (1 000 ha) 84 84 84
Agric. area actually irrigated (% agric. area) Employment in agriculture (%) 54.6 45.7 30.4
Employment in agriculture, female (%) 53.3 44.3 27.9
Fertilizers use, nitrogen (1 000 t nutrients) 3.7 21.9
Fertilizers use, phosphate (1 000 t nutrients) 0.0 0.5
Fertilizers use, potash (1 000 t nutrients) 0.0 0.2
Agric. value added per worker (constant USD) 1 875 1 628 4 538
Hunger dimensions Average dietary energy supply (kcal/cap/day) 2 257 2 453
Average dietary energy supply adequacy (%) 95 106
Dietary energy supply, cereals/roots/tubers (%) 49 47
Prevalence of undernourishment (%) 31.0 18.7
Prevalence of severe food insecurity (%) 2.8
GDP per capita (USD, PPP) 6 047 11 361
Cereal import dependency ratio (%) 68.0 22.5
Stunting, children under 5 (%) 27.5 10.8
Wasting, children under 5 (%) 2.7 1.0
Safely managed drinking water (% pop. using) Food supply Food production value, net (2004–06 mill. I$) 667 591 968
Agriculture, value added (% GDP) 30 16 12
Food (excl. fish) exports (mill. USD) 10 11 74
Food (excl. fish) imports (mill. USD) 40 128 387
Production indices (2004–06 = 100) Food 110 98 160
Crops 88 80 258
Cereals 222 57 491
Vegetable oils 100 98
Roots and tubers 51 91 191
Fruit and vegetables 42 101 175
Sugar Livestock 116 99 150
Milk 76 94 199
Meat 122 100 139
Fish 48 110 5
Net trade (mill. USD) Cereals and preparations -20 -51 -105
Fruit and vegetables -6 -17 -25
Meat and meat preparations 3 8 -1
Dairy products (milk equivalent) -6 -4 -12
Fish 0 0 -3
Environment Forest area (% total land area) 8 7 8
Agricultural area (% total land area) 76 73 71
Freshwater withdrawal (% tot renewable) 1.2 1.6 Terrestrial protected areas (% total land area) 17
Organic area (ha) 13
Wood pellet production (1 000 t) Emissions in agriculture (CO2 eq. Gg) 15 071 13 770 24 493
Net emissions in land use (CO2 eq. Gg) 27 325 23 874 26 597

162
Montenegro
1995 2005 2016
The setting Population, total (mill.) 0.6
Rural population, total (mill.) 0.2
Govt. expenditure on agric. (% total outlays) 0.6
Area harvested, crops (mill. ha) 0.0
Cropping intensity ratio 0.9
Total renewable water resources per cap. (m³) Land area equipped for irrigation (1 000 ha) 2
Agric. area actually irrigated (% agric. area) Employment in agriculture (%) 14.0 8.6 7.6
Employment in agriculture, female (%) 10.8 8.9 8.3
Fertilizers use, nitrogen (1 000 t nutrients) 1.3
Fertilizers use, phosphate (1 000 t nutrients) 0.6
Fertilizers use, potash (1 000 t nutrients) 0.6
Agric. value added per worker (constant USD) 20 516 24 232
Hunger dimensions Average dietary energy supply (kcal/cap/day) 3 491
Average dietary energy supply adequacy (%) 132 141
Dietary energy supply, cereals/roots/tubers (%) 36 34
Prevalence of undernourishment (%) <2.5
Prevalence of severe food insecurity (%) 2.3
GDP per capita (USD, PPP) 11 761 15 737
Cereal import dependency ratio (%) 91.4
Stunting, children under 5 (%) 7.9 9.4
Wasting, children under 5 (%) 4.2 2.8
Safely managed drinking water (% pop. using) 89.7
Food supply Food production value, net (2004–06 mill. I$) 95
Agriculture, value added (% GDP) 11 9 7
Food (excl. fish) exports (mill. USD) 30
Food (excl. fish) imports (mill. USD) 404
Production indices (2004–06 = 100) Food 63
Crops 54
Cereals 48
Vegetable oils 100
Roots and tubers 23
Fruit and vegetables 64
Sugar Livestock 71
Milk 80
Meat 40
Fish 134
Net trade (mill. USD) Cereals and preparations -59
Fruit and vegetables -61
Meat and meat preparations -93
Dairy products (milk equivalent) -46
Fish 0 0 -18
Environment Forest area (% total land area) 61
Agricultural area (% total land area) 19
Freshwater withdrawal (% tot renewable) Terrestrial protected areas (% total land area) 4
Organic area (ha) 4
Wood pellet production (1 000 t) 85
Emissions in agriculture (CO2 eq. Gg) 402
Net emissions in land use (CO2 eq. Gg) 82

163
Morocco
1995 2005 2016
The setting Population, total (mill.) 27.1 30.5 35.7
Rural population, total (mill.) 13.0 13.5 13.5
Govt. expenditure on agric. (% total outlays) 0.4 Area harvested, crops (mill. ha) 5.5 7.4 6.1
Cropping intensity ratio 0.6 0.8 0.6
Total renewable water resources per cap. (m³) 1 038 935 822
Land area equipped for irrigation (1 000 ha) 1 255 1 490 1 530
Agric. area actually irrigated (% agric. area) 4.3 Employment in agriculture (%) 42.0 45.5 37.7
Employment in agriculture, female (%) 43.2 61.5 57.2
Fertilizers use, nitrogen (1 000 t nutrients) 337.4 243.2
Fertilizers use, phosphate (1 000 t nutrients) 114.4 223.9
Fertilizers use, potash (1 000 t nutrients) 66.3 110.9
Agric. value added per worker (constant USD) 1 677 1 929 3 150
Hunger dimensions Average dietary energy supply (kcal/cap/day) 3 247 3 470
Average dietary energy supply adequacy (%) 138 147
Dietary energy supply, cereals/roots/tubers (%) 63 60
Prevalence of undernourishment (%) 5.7 3.9
Prevalence of severe food insecurity (%) GDP per capita (USD, PPP) 5 362 7 286
Cereal import dependency ratio (%) 39.1 42.1
Stunting, children under 5 (%) 23.1 Wasting, children under 5 (%) 10.8 Safely managed drinking water (% pop. using) 59.4 68.8
Food supply Food production value, net (2004–06 mill. I$) 3 727 6 270 7 972
Agriculture, value added (% GDP) 14 12 12
Food (excl. fish) exports (mill. USD) 661 1 167 2 479
Food (excl. fish) imports (mill. USD) 1 324 1 774 3 861
Production indices (2004–06 = 100) Food 55 93 118
Crops 49 89 110
Cereals 18 56 47
Vegetable oils 66 117 214
Roots and tubers 55 98 116
Fruit and vegetables 51 94 109
Sugar 95 106 123
Livestock 72 101 148
Milk 62 98 173
Meat 73 102 149
Fish 90 109 154
Net trade (mill. USD) Cereals and preparations -622 -846 -1 961
Fruit and vegetables 481 795 1 529
Meat and meat preparations -20 -6 -41
Dairy products (milk equivalent) -92 -59 -94
Fish 779 1 025 1 958
Environment Forest area (% total land area) 11 12 13
Agricultural area (% total land area) 69 67 69
Freshwater withdrawal (% tot renewable) 38.8 51.1 Terrestrial protected areas (% total land area) 31
Organic area (ha) 1 10
Wood pellet production (1 000 t) Emissions in agriculture (CO2 eq. Gg) 9 461 12 511 13 686
Net emissions in land use (CO2 eq. Gg) -8 799 -9 531 -1 465

164
Mozambique
1995 2005 2016
The setting Population, total (mill.) 15.8 20.9 29.7
Rural population, total (mill.) 11.6 14.7 19.1
Govt. expenditure on agric. (% total outlays) 4.6 8.0
Area harvested, crops (mill. ha) 3.9 6.4 5.5
Cropping intensity ratio 1.0 1.2 0.9
Total renewable water resources per cap. (m³) 12 867 9 709 7 530
Land area equipped for irrigation (1 000 ha) 107 118 118
Agric. area actually irrigated (% agric. area) Employment in agriculture (%) 85.0 79.3 73.3
Employment in agriculture, female (%) 92.8 89.4 84.8
Fertilizers use, nitrogen (1 000 t nutrients) 6.4 13.4
Fertilizers use, phosphate (1 000 t nutrients) 0.4 6.6
Fertilizers use, potash (1 000 t nutrients) 0.3 1.0
Agric. value added per worker (constant USD) 222 325 481
Hunger dimensions Average dietary energy supply (kcal/cap/day) 2 070 2 252
Average dietary energy supply adequacy (%) 98 106
Dietary energy supply, cereals/roots/tubers (%) 73 71
Prevalence of undernourishment (%) 37.0 30.5
Prevalence of severe food insecurity (%) GDP per capita (USD, PPP) 742 1 127
Cereal import dependency ratio (%) 42.2 30.0
Stunting, children under 5 (%) 47.0 Wasting, children under 5 (%) 5.4 Safely managed drinking water (% pop. using) Food supply Food production value, net (2004–06 mill. I$) 1 422 1 819 2 838
Agriculture, value added (% GDP) 33 23 23
Food (excl. fish) exports (mill. USD) 36 81 399
Food (excl. fish) imports (mill. USD) 217 397 1 148
Production indices (2004–06 = 100) Food 75 96 150
Crops 63 93 154
Cereals 84 80 120
Vegetable oils 83 105 153
Roots and tubers 70 85 162
Fruit and vegetables 73 99 244
Sugar 15 109 134
Livestock 93 106 134
Milk 85 102 141
Meat 101 109 122
Fish 30 94 333
Net trade (mill. USD) Cereals and preparations -126 -218 -485
Fruit and vegetables -3 16 114
Meat and meat preparations -4 -21 -49
Dairy products (milk equivalent) -18 -9 -35
Fish 63 51 -17
Environment Forest area (% total land area) 54 51 48
Agricultural area (% total land area) 61 63 64
Freshwater withdrawal (% tot renewable) 0.7
Terrestrial protected areas (% total land area) 22
Organic area (ha) 1 7
Wood pellet production (1 000 t) Emissions in agriculture (CO2 eq. Gg) 14 742 16 463 16 522
Net emissions in land use (CO2 eq. Gg) 36 788 37 836 39 199

165
Myanmar
1995 2005 2016
The setting Population, total (mill.) 43.2 48.5 53.4
Rural population, total (mill.) 33.8 35.7 35.6
Govt. expenditure on agric. (% total outlays) Area harvested, crops (mill. ha) 10.9 15.8 17.1
Cropping intensity ratio 1.1 1.4 1.4
Total renewable water resources per cap. (m³) 25 449 23 038 22 086
Land area equipped for irrigation (1 000 ha) 1 555 2 136 2 295
Agric. area actually irrigated (% agric. area) Employment in agriculture (%) 77.6 69.5 51.3
Employment in agriculture, female (%) 76.7 69.2 49.8
Fertilizers use, nitrogen (1 000 t nutrients) 53.8 138.8
Fertilizers use, phosphate (1 000 t nutrients) 8.1 31.4
Fertilizers use, potash (1 000 t nutrients) 3.8 24.8
Agric. value added per worker (constant USD) 913 1 585
Hunger dimensions Average dietary energy supply (kcal/cap/day) 2 146 2 711
Average dietary energy supply adequacy (%) 95 118
Dietary energy supply, cereals/roots/tubers (%) 60 52
Prevalence of undernourishment (%) 32.0 10.5
Prevalence of severe food insecurity (%) GDP per capita (USD, PPP) 2 275 5 305
Cereal import dependency ratio (%) -1.5 -2.0
Stunting, children under 5 (%) 40.6 29.2
Wasting, children under 5 (%) 10.7 7.0
Safely managed drinking water (% pop. using) Food supply Food production value, net (2004–06 mill. I$) 7 238 12 334 17 083
Agriculture, value added (% GDP) 60 47 25
Food (excl. fish) exports (mill. USD) 371 382 2 328
Food (excl. fish) imports (mill. USD) 283 343 3 069
Production indices (2004–06 = 100) Food 58 98 136
Crops 57 99 124
Cereals 64 100 96
Vegetable oils 53 93 149
Roots and tubers 38 99 137
Fruit and vegetables 59 100 126
Sugar 43 95 141
Livestock 33 101 208
Milk 56 99 239
Meat 30 101 193
Fish 37 101 140
Net trade (mill. USD) Cereals and preparations 70 26 -283
Fruit and vegetables 242 245 859
Meat and meat preparations 0 0 -13
Dairy products (milk equivalent) -78
Fish 116 457 463
Environment Forest area (% total land area) 57 51 44
Agricultural area (% total land area) 16 17 20
Freshwater withdrawal (% tot renewable) Terrestrial protected areas (% total land area) 7
Organic area (ha) 5
Wood pellet production (1 000 t) Emissions in agriculture (CO2 eq. Gg) 46 173 56 677 69 298
Net emissions in land use (CO2 eq. Gg) 111 000 84 272 104 038

166
Namibia
1995 2005 2016
The setting Population, total (mill.) 1.7 2.0 2.5
Rural population, total (mill.) 1.2 1.3 1.3
Govt. expenditure on agric. (% total outlays) 5.1 2.0
Area harvested, crops (mill. ha) 0.4 0.3 0.4
Cropping intensity ratio 0.4 0.4 0.5
Total renewable water resources per cap. (m³) 22 702 19 160 16 095
Land area equipped for irrigation (1 000 ha) 7 8 8
Agric. area actually irrigated (% agric. area) Employment in agriculture (%) 42.3 26.8 20.1
Employment in agriculture, female (%) 44.3 20.6 18.1
Fertilizers use, nitrogen (1 000 t nutrients) 1.0 19.6
Fertilizers use, phosphate (1 000 t nutrients) 0.3 0.9
Fertilizers use, potash (1 000 t nutrients) 0.3 0.3
Agric. value added per worker (constant USD) 4 229 7 438 6 109
Hunger dimensions Average dietary energy supply (kcal/cap/day) 2 247 2 260
Average dietary energy supply adequacy (%) 99 98
Dietary energy supply, cereals/roots/tubers (%) 58 55
Prevalence of undernourishment (%) 25.1 25.4
Prevalence of severe food insecurity (%) 39.8
GDP per capita (USD, PPP) Cereal import dependency ratio (%) 58.1 69.6
Stunting, children under 5 (%) 29.6 23.1
Wasting, children under 5 (%) 7.1
Safely managed drinking water (% pop. using) Food supply Food production value, net (2004–06 mill. I$) 405 463 412
Agriculture, value added (% GDP) 10 11 6
Food (excl. fish) exports (mill. USD) 215 172 212
Food (excl. fish) imports (mill. USD) 137 202 541
Production indices (2004–06 = 100) Food 91 104 93
Crops 54 95 121
Cereals 45 86 83
Vegetable oils 74 10 23
Roots and tubers 69 101 120
Fruit and vegetables 28 100 170
Sugar Livestock 103 107 84
Milk 79 110 100
Meat 107 106 82
Fish 105 102 93
Net trade (mill. USD) Cereals and preparations -64 -40 -143
Fruit and vegetables -38 -11 -62
Meat and meat preparations 98 6 30
Dairy products (milk equivalent) -13 -11 -38
Fish 330 355 588
Environment Forest area (% total land area) 10 9 8
Agricultural area (% total land area) 47 47 47
Freshwater withdrawal (% tot renewable) 0.7 0.7 Terrestrial protected areas (% total land area) 38
Organic area (ha) 0 30
Wood pellet production (1 000 t) Emissions in agriculture (CO2 eq. Gg) 6 737 7 152 8 117
Net emissions in land use (CO2 eq. Gg) 9 009 9 211 9 188

167
Nepal
1995 2005 2016
The setting Population, total (mill.) 21.4 25.6 29.3
Rural population, total (mill.) 18.3 21.5 23.4
Govt. expenditure on agric. (% total outlays) 8.2 9.5
Area harvested, crops (mill. ha) 4.3 4.7 4.9
Cropping intensity ratio 1.8 1.9 2.1
Total renewable water resources per cap. (m³) 9 386 8 065 7 253
Land area equipped for irrigation (1 000 ha) 1 134 1 193 1 369
Agric. area actually irrigated (% agric. area) 24.5 Employment in agriculture (%) 81.1 76.0 72.3
Employment in agriculture, female (%) 88.8 84.4 83.3
Fertilizers use, nitrogen (1 000 t nutrients) 2.9 105.7
Fertilizers use, phosphate (1 000 t nutrients) 5.0 46.8
Fertilizers use, potash (1 000 t nutrients) 0.3 4.0
Agric. value added per worker (constant USD) 390 476 531
Hunger dimensions Average dietary energy supply (kcal/cap/day) 2 386 2 666
Average dietary energy supply adequacy (%) 112 118
Dietary energy supply, cereals/roots/tubers (%) 73 68
Prevalence of undernourishment (%) 16.0 9.5
Prevalence of severe food insecurity (%) 7.8
GDP per capita (USD, PPP) 1 684 2 298
Cereal import dependency ratio (%) 1.9 7.6
Stunting, children under 5 (%) 49.3 35.8
Wasting, children under 5 (%) 12.7 9.7
Safely managed drinking water (% pop. using) 25.0 26.8
Food supply Food production value, net (2004–06 mill. I$) 3 271 4 289 5 883
Agriculture, value added (% GDP) 37 34 29
Food (excl. fish) exports (mill. USD) 27 90 97
Food (excl. fish) imports (mill. USD) 113 319 1 100
Production indices (2004–06 = 100) Food 77 100 138
Crops 75 100 139
Cereals 80 100 107
Vegetable oils 82 103 129
Roots and tubers 49 97 153
Fruit and vegetables 80 101 189
Sugar 62 100 187
Livestock 78 100 142
Milk 75 100 143
Meat 81 101 138
Fish 50 100 166
Net trade (mill. USD) Cereals and preparations -15 -27 -428
Fruit and vegetables -13 -66 -189
Meat and meat preparations 0 0 -1
Dairy products (milk equivalent) -1 -6 -19
Fish -1 0 -10
Environment Forest area (% total land area) 30 25 25
Agricultural area (% total land area) 29 29 29
Freshwater withdrawal (% tot renewable) 4.5 Terrestrial protected areas (% total land area) 24
Organic area (ha) 1 9
Wood pellet production (1 000 t) Emissions in agriculture (CO2 eq. Gg) 17 187 18 800 22 132
Net emissions in land use (CO2 eq. Gg) 36 216 31 865 6 200

168
Netherlands
1995 2005 2016
The setting Population, total (mill.) 15.5 16.4 17.0
Rural population, total (mill.) 4.2 2.8 1.4
Govt. expenditure on agric. (% total outlays) 0.5 0.4
Area harvested, crops (mill. ha) 0.6 0.6 0.5
Cropping intensity ratio 0.7 0.5 0.5
Total renewable water resources per cap. (m³) 5 820 5 528 5 357
Land area equipped for irrigation (1 000 ha) 329 408 522
Agric. area actually irrigated (% agric. area) 4.8 11.2
Employment in agriculture (%) 3.8 3.3 2.3
Employment in agriculture, female (%) 2.3 2.2 1.4
Fertilizers use, nitrogen (1 000 t nutrients) 279.2 261.1
Fertilizers use, phosphate (1 000 t nutrients) 48.6 9.1
Fertilizers use, potash (1 000 t nutrients) 47.4 26.8
Agric. value added per worker (constant USD) 46 406 48 178 78 714
Hunger dimensions Average dietary energy supply (kcal/cap/day) 3 214 3 228
Average dietary energy supply adequacy (%) 125 125
Dietary energy supply, cereals/roots/tubers (%) 23 27
Prevalence of undernourishment (%) <2.5 <2.5
Prevalence of severe food insecurity (%) GDP per capita (USD, PPP) 43 507 47 270
Cereal import dependency ratio (%) 77.2 84.3
Stunting, children under 5 (%) Wasting, children under 5 (%) Safely managed drinking water (% pop. using) 100.0 100.0
Food supply Food production value, net (2004–06 mill. I$) 12 304 11 590 13 956
Agriculture, value added (% GDP) 3 2 2
Food (excl. fish) exports (mill. USD) 24 093 32 234 55 648
Food (excl. fish) imports (mill. USD) 15 427 21 127 39 360
Production indices (2004–06 = 100) Food 105 99 120
Crops 97 99 107
Cereals 92 99 78
Vegetable oils 124 85 60
Roots and tubers 105 99 96
Fruit and vegetables 93 99 119
Sugar 110 101 94
Livestock 108 100 123
Milk 101 98 135
Meat 115 100 116
Fish 88 105 73
Net trade (mill. USD) Cereals and preparations -279 -149 546
Fruit and vegetables 2 896 3 465 5 543
Meat and meat preparations 3 738 3 441 4 553
Dairy products (milk equivalent) 1 632 2 148 3 846
Fish 255 742 854
Environment Forest area (% total land area) 10 11 11
Agricultural area (% total land area) 58 57 53
Freshwater withdrawal (% tot renewable) 7.2 12.0 Terrestrial protected areas (% total land area) 11
Organic area (ha) 49 52
Wood pellet production (1 000 t) 246
Emissions in agriculture (CO2 eq. Gg) 20 613 17 164 18 675
Net emissions in land use (CO2 eq. Gg) 2 371 2 773 1 160

169
New Zealand
1995 2005 2016
The setting Population, total (mill.) 3.7 4.1 4.7
Rural population, total (mill.) 0.5 0.6 0.6
Govt. expenditure on agric. (% total outlays) 1.4 Area harvested, crops (mill. ha) 0.3 0.3 0.3
Cropping intensity ratio 0.2 0.5 0.4
Total renewable water resources per cap. (m³) 87 154 77 159 70 159
Land area equipped for irrigation (1 000 ha) 285 533 700
Agric. area actually irrigated (% agric. area) 4.3 6.6
Employment in agriculture (%) 9.7 7.2 6.5
Employment in agriculture, female (%) 6.6 5.0 4.4
Fertilizers use, nitrogen (1 000 t nutrients) 309.8 433.0
Fertilizers use, phosphate (1 000 t nutrients) 821.1 540.4
Fertilizers use, potash (1 000 t nutrients) 24.6 39.6
Agric. value added per worker (constant USD) 71 350 98 212 99 611
Hunger dimensions Average dietary energy supply (kcal/cap/day) 3 164 3 046
Average dietary energy supply adequacy (%) 127 123
Dietary energy supply, cereals/roots/tubers (%) 27 28
Prevalence of undernourishment (%) <2.5 <2.5
Prevalence of severe food insecurity (%) 3.2
GDP per capita (USD, PPP) 31 352 35 777
Cereal import dependency ratio (%) 38.2 36.5
Stunting, children under 5 (%) Wasting, children under 5 (%) Safely managed drinking water (% pop. using) 76.7 100.0
Food supply Food production value, net (2004–06 mill. I$) 7 318 9 309 11 201
Agriculture, value added (% GDP) 6 5 5
Food (excl. fish) exports (mill. USD) 4 590 9 283 16 922
Food (excl. fish) imports (mill. USD) 685 1 433 2 767
Production indices (2004–06 = 100) Food 78 99 119
Crops 93 101 121
Cereals 91 108 137
Vegetable oils 107 99 94
Roots and tubers 96 100 106
Fruit and vegetables 92 101 121
Sugar Livestock 78 99 117
Milk 62 98 145
Meat 93 100 85
Fish 100 104 85
Net trade (mill. USD) Cereals and preparations -43 54 402
Fruit and vegetables 644 809 1 818
Meat and meat preparations 1 655 3 229 4 084
Dairy products (milk equivalent) 1 727 3 585 7 685
Fish 756 800 1 046
Environment Forest area (% total land area) 38 39 39
Agricultural area (% total land area) 57 44 40
Freshwater withdrawal (% tot renewable) 1.5 Terrestrial protected areas (% total land area) 33
Organic area (ha) 47 74
Wood pellet production (1 000 t) 50
Emissions in agriculture (CO2 eq. Gg) 39 297 39 090 38 618
Net emissions in land use (CO2 eq. Gg) -21 633 -14 669 -15 398

170
Nicaragua
1995 2005 2016
The setting Population, total (mill.) 4.6 5.4 6.2
Rural population, total (mill.) 2.2 2.4 2.6
Govt. expenditure on agric. (% total outlays) Area harvested, crops (mill. ha) 0.8 1.1 1.1
Cropping intensity ratio 0.4 0.5 0.6
Total renewable water resources per cap. (m³) 34 364 29 790 26 748
Land area equipped for irrigation (1 000 ha) 60 140 199
Agric. area actually irrigated (% agric. area) Employment in agriculture (%) 33.4 28.9 29.7
Employment in agriculture, female (%) 10.1 8.1 8.5
Fertilizers use, nitrogen (1 000 t nutrients) 35.6 53.1
Fertilizers use, phosphate (1 000 t nutrients) 10.9 20.5
Fertilizers use, potash (1 000 t nutrients) 9.7 18.9
Agric. value added per worker (constant USD) 1 923 2 089 1 994
Hunger dimensions Average dietary energy supply (kcal/cap/day) 2 391 2 689
Average dietary energy supply adequacy (%) 106 117
Dietary energy supply, cereals/roots/tubers (%) 53 51
Prevalence of undernourishment (%) 24.4 16.2
Prevalence of severe food insecurity (%) GDP per capita (USD, PPP) 3 772 5 131
Cereal import dependency ratio (%) 29.2 34.6
Stunting, children under 5 (%) 23.0 Wasting, children under 5 (%) 1.5 Safely managed drinking water (% pop. using) 57.0 58.7
Food supply Food production value, net (2004–06 mill. I$) 672 1 172 1 476
Agriculture, value added (% GDP) 20 16 16
Food (excl. fish) exports (mill. USD) 142 408 843
Food (excl. fish) imports (mill. USD) 156 295 676
Production indices (2004–06 = 100) Food 58 102 129
Crops 70 107 138
Cereals 72 108 100
Vegetable oils 48 107 124
Roots and tubers 80 102 107
Fruit and vegetables 101 101 266
Sugar 78 93 166
Livestock 48 100 126
Milk 31 99 94
Meat 53 100 143
Fish 33 105 187
Net trade (mill. USD) Cereals and preparations -57 -124 -273
Fruit and vegetables 14 31 87
Meat and meat preparations 54 117 258
Dairy products (milk equivalent) -9 27 74
Fish 79 102 269
Environment Forest area (% total land area) 35 29 26
Agricultural area (% total land area) 38 44 42
Freshwater withdrawal (% tot renewable) Terrestrial protected areas (% total land area) 37
Organic area (ha) 51 34
Wood pellet production (1 000 t) Emissions in agriculture (CO2 eq. Gg) 5 256 7 107 9 805
Net emissions in land use (CO2 eq. Gg) 28 990 29 163 163

171
Niger
1995 2005 2016
The setting Population, total (mill.) 9.5 13.6 21.5
Rural population, total (mill.) 7.7 11.0 16.8
Govt. expenditure on agric. (% total outlays) Area harvested, crops (mill. ha) 11.1 12.5 17.4
Cropping intensity ratio 0.8 0.9 1.0
Total renewable water resources per cap. (m³) 3 385 2 344 1 647
Land area equipped for irrigation (1 000 ha) 66 74 100
Agric. area actually irrigated (% agric. area) 0.2 Employment in agriculture (%) 75.9 77.6 75.8
Employment in agriculture, female (%) 73.6 74.7 72.0
Fertilizers use, nitrogen (1 000 t nutrients) 2.8 6.4
Fertilizers use, phosphate (1 000 t nutrients) 1.6 0.2
Fertilizers use, potash (1 000 t nutrients) 1.1 0.2
Agric. value added per worker (constant USD) 431 519
Hunger dimensions Average dietary energy supply (kcal/cap/day) 2 446 2 581
Average dietary energy supply adequacy (%) 117 123
Dietary energy supply, cereals/roots/tubers (%) 64 61
Prevalence of undernourishment (%) 15.1 14.4
Prevalence of severe food insecurity (%) 37.2
GDP per capita (USD, PPP) 763 917
Cereal import dependency ratio (%) 9.9 9.2
Stunting, children under 5 (%) 54.8 42.2
Wasting, children under 5 (%) 12.4 10.3
Safely managed drinking water (% pop. using) Food supply Food production value, net (2004–06 mill. I$) 1 167 2 245 3 865
Agriculture, value added (% GDP) 35 42 39
Food (excl. fish) exports (mill. USD) 35 63 343
Food (excl. fish) imports (mill. USD) 83 232 401
Production indices (2004–06 = 100) Food 53 102 176
Crops 52 104 236
Cereals 65 106 165
Vegetable oils 48 112 296
Roots and tubers 70 89 249
Fruit and vegetables 35 100 261
Sugar 46 97 95
Livestock 55 100 104
Milk 66 100 129
Meat 51 100 95
Fish 8 114 80
Net trade (mill. USD) Cereals and preparations -24 -139 -51
Fruit and vegetables 15 12 4
Meat and meat preparations 0 0 -7
Dairy products (milk equivalent) -12 -17 -28
Fish -1 2 -7
Environment Forest area (% total land area) 1 1 1
Agricultural area (% total land area) 28 34 36
Freshwater withdrawal (% tot renewable) 2.9 Terrestrial protected areas (% total land area) 17
Organic area (ha) 0 0
Wood pellet production (1 000 t) Emissions in agriculture (CO2 eq. Gg) 10 972 16 697 25 449
Net emissions in land use (CO2 eq. Gg) 7 077 1 593 1 574
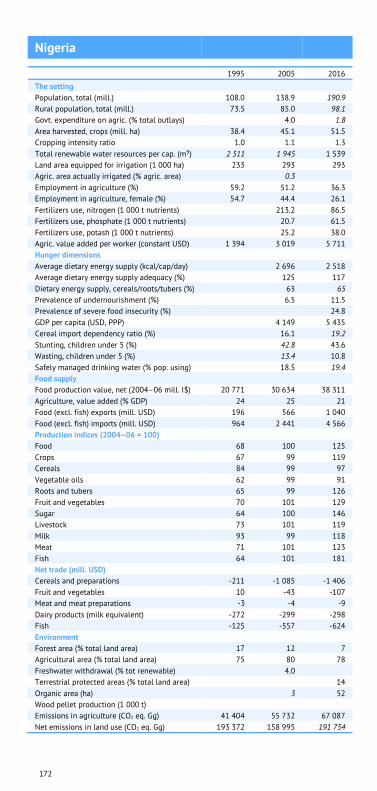
172
Nigeria
1995 2005 2016
The setting Population, total (mill.) 108.0 138.9 190.9
Rural population, total (mill.) 73.5 85.0 98.1
Govt. expenditure on agric. (% total outlays) 4.0 1.8
Area harvested, crops (mill. ha) 38.4 45.1 51.5
Cropping intensity ratio 1.0 1.1 1.3
Total renewable water resources per cap. (m³) 2 511 1 945 1 539
Land area equipped for irrigation (1 000 ha) 233 293 293
Agric. area actually irrigated (% agric. area) 0.3 Employment in agriculture (%) 59.2 51.2 36.3
Employment in agriculture, female (%) 54.7 44.4 26.1
Fertilizers use, nitrogen (1 000 t nutrients) 213.2 86.5
Fertilizers use, phosphate (1 000 t nutrients) 20.7 61.5
Fertilizers use, potash (1 000 t nutrients) 25.2 38.0
Agric. value added per worker (constant USD) 1 394 3 019 5 711
Hunger dimensions Average dietary energy supply (kcal/cap/day) 2 696 2 518
Average dietary energy supply adequacy (%) 125 117
Dietary energy supply, cereals/roots/tubers (%) 63 65
Prevalence of undernourishment (%) 6.5 11.5
Prevalence of severe food insecurity (%) 24.8
GDP per capita (USD, PPP) 4 149 5 435
Cereal import dependency ratio (%) 16.1 19.2
Stunting, children under 5 (%) 42.8 43.6
Wasting, children under 5 (%) 13.4 10.8
Safely managed drinking water (% pop. using) 18.5 19.4
Food supply Food production value, net (2004–06 mill. I$) 20 771 30 634 38 311
Agriculture, value added (% GDP) 24 25 21
Food (excl. fish) exports (mill. USD) 196 566 1 040
Food (excl. fish) imports (mill. USD) 964 2 441 4 566
Production indices (2004–06 = 100) Food 68 100 125
Crops 67 99 119
Cereals 84 99 97
Vegetable oils 62 99 91
Roots and tubers 65 99 126
Fruit and vegetables 70 101 129
Sugar 64 100 146
Livestock 73 101 119
Milk 93 99 118
Meat 71 101 123
Fish 64 101 181
Net trade (mill. USD) Cereals and preparations -211 -1 085 -1 406
Fruit and vegetables 10 -43 -107
Meat and meat preparations -3 -4 -9
Dairy products (milk equivalent) -272 -299 -298
Fish -125 -557 -624
Environment Forest area (% total land area) 17 12 7
Agricultural area (% total land area) 75 80 78
Freshwater withdrawal (% tot renewable) 4.0 Terrestrial protected areas (% total land area) 14
Organic area (ha) 3 52
Wood pellet production (1 000 t) Emissions in agriculture (CO2 eq. Gg) 41 404 55 732 67 087
Net emissions in land use (CO2 eq. Gg) 193 372 158 995 191 754

173
Norway
1995 2005 2016
The setting Population, total (mill.) 4.4 4.6 5.3
Rural population, total (mill.) 1.1 1.0 1.0
Govt. expenditure on agric. (% total outlays) 2.0 1.5
Area harvested, crops (mill. ha) 0.4 0.4 0.3
Cropping intensity ratio 0.4 0.4 0.4
Total renewable water resources per cap. (m³) 89 055 83 316 74 790
Land area equipped for irrigation (1 000 ha) 127 118 82
Agric. area actually irrigated (% agric. area) 4.2 3.3
Employment in agriculture (%) 5.5 3.3 2.1
Employment in agriculture, female (%) 3.3 1.6 1.0
Fertilizers use, nitrogen (1 000 t nutrients) 105.5 102.2
Fertilizers use, phosphate (1 000 t nutrients) 28.6 20.8
Fertilizers use, potash (1 000 t nutrients) 54.5 41.1
Agric. value added per worker (constant USD) 40 467 69 023 127 065
Hunger dimensions Average dietary energy supply (kcal/cap/day) 3 481 3 476
Average dietary energy supply adequacy (%) 137 136
Dietary energy supply, cereals/roots/tubers (%) 31 30
Prevalence of undernourishment (%) <2.5 <2.5
Prevalence of severe food insecurity (%) 1.2
GDP per capita (USD, PPP) 62 865 64 160
Cereal import dependency ratio (%) 27.9 49.9
Stunting, children under 5 (%) Wasting, children under 5 (%) Safely managed drinking water (% pop. using) 95.0 95.0
Food supply Food production value, net (2004–06 mill. I$) 1 215 1 255 1 359
Agriculture, value added (% GDP) 3 1 2
Food (excl. fish) exports (mill. USD) 244 315 483
Food (excl. fish) imports (mill. USD) 1 251 2 213 4 220
Production indices (2004–06 = 100) Food 96 99 107
Crops 98 96 102
Cereals 91 100 98
Vegetable oils 155 102 104
Roots and tubers 110 86 102
Fruit and vegetables 104 97 109
Sugar Livestock 97 100 109
Milk 109 100 101
Meat 88 99 114
Fish 92 100 110
Net trade (mill. USD) Cereals and preparations -169 -360 -627
Fruit and vegetables -451 -809 -1 373
Meat and meat preparations -31 -77 -182
Dairy products (milk equivalent) 60 37 -35
Fish 2 632 4 184 9 528
Environment Forest area (% total land area) 33 33 33
Agricultural area (% total land area) 3 3 3
Freshwater withdrawal (% tot renewable) 0.6 0.8 Terrestrial protected areas (% total land area) 17
Organic area (ha) 43 48
Wood pellet production (1 000 t) 57
Emissions in agriculture (CO2 eq. Gg) 5 168 4 940 4 765
Net emissions in land use (CO2 eq. Gg) -14 244 -21 214 -21 941

174
Oman
1995 2005 2016
The setting Population, total (mill.) 2.2 2.5 4.6
Rural population, total (mill.) 0.6 0.7 0.9
Govt. expenditure on agric. (% total outlays) 0.7 0.6
Area harvested, crops (mill. ha) 0.1 0.1 0.1
Cropping intensity ratio 0.8 0.9 0.6
Total renewable water resources per cap. (m³) 628 540 316
Land area equipped for irrigation (1 000 ha) 61 60 85
Agric. area actually irrigated (% agric. area) 5.9
Employment in agriculture (%) 8.1 6.8 6.3
Employment in agriculture, female (%) 5.0 1.2 0.6
Fertilizers use, nitrogen (1 000 t nutrients) 30.1 9.5
Fertilizers use, phosphate (1 000 t nutrients) 1.5 3.5
Fertilizers use, potash (1 000 t nutrients) 7.3 13.2
Agric. value added per worker (constant USD) 7 678
Hunger dimensions Average dietary energy supply (kcal/cap/day) 2 718 3 126
Average dietary energy supply adequacy (%) 115 125
Dietary energy supply, cereals/roots/tubers (%) 38 38
Prevalence of undernourishment (%) 10.5 5.4
Prevalence of severe food insecurity (%) GDP per capita (USD, PPP) 41 458 39 884
Cereal import dependency ratio (%) 90.2 93.1
Stunting, children under 5 (%) 14.1
Wasting, children under 5 (%) 7.5
Safely managed drinking water (% pop. using) 74.7 88.5
Food supply Food production value, net (2004–06 mill. I$) 237 379 495
Agriculture, value added (% GDP) 3 2 1
Food (excl. fish) exports (mill. USD) 122 344 1 033
Food (excl. fish) imports (mill. USD) 577 902 2 990
Production indices (2004–06 = 100) Food 70 112 146
Crops 80 98 148
Cereals 70 96 64
Vegetable oils Roots and tubers 63 66 148
Fruit and vegetables 80 99 151
Sugar 66 125
Livestock 58 130 137
Milk 76 95 162
Meat 48 148 115
Fish 89 100 178
Net trade (mill. USD) Cereals and preparations -115 -131 -345
Fruit and vegetables -87 -140 -418
Meat and meat preparations -78 -101 -208
Dairy products (milk equivalent) -81 -84 -356
Fish 57 89 100
Environment Forest area (% total land area) 0 0 0
Agricultural area (% total land area) 3 5 5
Freshwater withdrawal (% tot renewable) 84.7 Terrestrial protected areas (% total land area) 3
Organic area (ha) 0 0
Wood pellet production (1 000 t) Emissions in agriculture (CO2 eq. Gg) 740 1 188 1 458
Net emissions in land use (CO2 eq. Gg) -2 -2 -5
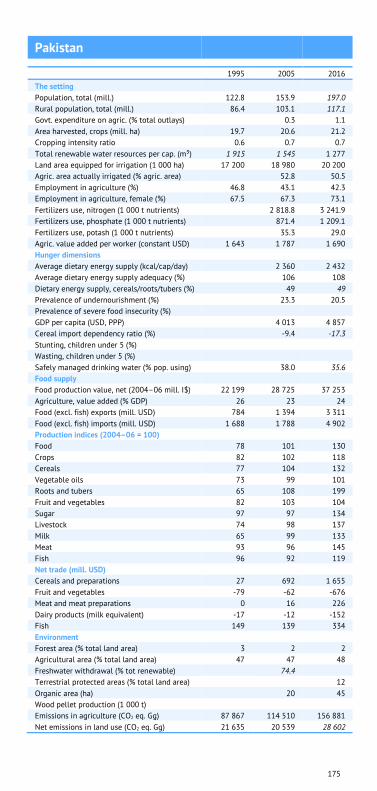
175
Pakistan
1995 2005 2016
The setting Population, total (mill.) 122.8 153.9 197.0
Rural population, total (mill.) 86.4 103.1 117.1
Govt. expenditure on agric. (% total outlays) 0.3 1.1
Area harvested, crops (mill. ha) 19.7 20.6 21.2
Cropping intensity ratio 0.6 0.7 0.7
Total renewable water resources per cap. (m³) 1 915 1 545 1 277
Land area equipped for irrigation (1 000 ha) 17 200 18 980 20 200
Agric. area actually irrigated (% agric. area) 52.8 50.5
Employment in agriculture (%) 46.8 43.1 42.3
Employment in agriculture, female (%) 67.5 67.3 73.1
Fertilizers use, nitrogen (1 000 t nutrients) 2 818.8 3 241.9
Fertilizers use, phosphate (1 000 t nutrients) 871.4 1 209.1
Fertilizers use, potash (1 000 t nutrients) 35.3 29.0
Agric. value added per worker (constant USD) 1 643 1 787 1 690
Hunger dimensions Average dietary energy supply (kcal/cap/day) 2 360 2 432
Average dietary energy supply adequacy (%) 106 108
Dietary energy supply, cereals/roots/tubers (%) 49 49
Prevalence of undernourishment (%) 23.3 20.5
Prevalence of severe food insecurity (%) GDP per capita (USD, PPP) 4 013 4 857
Cereal import dependency ratio (%) -9.4 -17.3
Stunting, children under 5 (%) Wasting, children under 5 (%) Safely managed drinking water (% pop. using) 38.0 35.6
Food supply Food production value, net (2004–06 mill. I$) 22 199 28 725 37 253
Agriculture, value added (% GDP) 26 23 24
Food (excl. fish) exports (mill. USD) 784 1 394 3 311
Food (excl. fish) imports (mill. USD) 1 688 1 788 4 902
Production indices (2004–06 = 100) Food 78 101 130
Crops 82 102 118
Cereals 77 104 132
Vegetable oils 73 99 101
Roots and tubers 65 108 199
Fruit and vegetables 82 103 104
Sugar 97 97 134
Livestock 74 98 137
Milk 65 99 133
Meat 93 96 145
Fish 96 92 119
Net trade (mill. USD) Cereals and preparations 27 692 1 655
Fruit and vegetables -79 -62 -676
Meat and meat preparations 0 16 226
Dairy products (milk equivalent) -17 -12 -152
Fish 149 139 334
Environment Forest area (% total land area) 3 2 2
Agricultural area (% total land area) 47 47 48
Freshwater withdrawal (% tot renewable) 74.4 Terrestrial protected areas (% total land area) 12
Organic area (ha) 20 45
Wood pellet production (1 000 t) Emissions in agriculture (CO2 eq. Gg) 87 867 114 510 156 881
Net emissions in land use (CO2 eq. Gg) 21 635 20 539 28 602

176
Panama
1995 2005 2016
The setting Population, total (mill.) 2.7 3.3 4.1
Rural population, total (mill.) 1.2 1.2 1.3
Govt. expenditure on agric. (% total outlays) 1.7 1.6
Area harvested, crops (mill. ha) 0.3 0.3 0.3
Cropping intensity ratio 0.5 0.4 0.4
Total renewable water resources per cap. (m³) 48 826 40 518 34 530
Land area equipped for irrigation (1 000 ha) 33 34 32
Agric. area actually irrigated (% agric. area) 1.4 1.1
Employment in agriculture (%) 20.8 15.7 15.4
Employment in agriculture, female (%) 3.4 4.3 8.9
Fertilizers use, nitrogen (1 000 t nutrients) 15.6 11.9
Fertilizers use, phosphate (1 000 t nutrients) 1.6 7.6
Fertilizers use, potash (1 000 t nutrients) 1.6 8.2
Agric. value added per worker (constant USD) 3 749 5 765 3 926
Hunger dimensions Average dietary energy supply (kcal/cap/day) 2 311 2 786
Average dietary energy supply adequacy (%) 102 122
Dietary energy supply, cereals/roots/tubers (%) 45 43
Prevalence of undernourishment (%) 22.9 9.2
Prevalence of severe food insecurity (%) GDP per capita (USD, PPP) 11 938 21 473
Cereal import dependency ratio (%) 64.4 67.5
Stunting, children under 5 (%) 22.2 Wasting, children under 5 (%) 1.2 Safely managed drinking water (% pop. using) Food supply Food production value, net (2004–06 mill. I$) 755 801 932
Agriculture, value added (% GDP) 7 7 3
Food (excl. fish) exports (mill. USD) 256 357 264
Food (excl. fish) imports (mill. USD) 210 396 1 255
Production indices (2004–06 = 100) Food 93 99 115
Crops 110 97 88
Cereals 86 100 107
Vegetable oils 5 101 51
Roots and tubers 77 102 64
Fruit and vegetables 131 94 72
Sugar 94 100 135
Livestock 78 101 137
Milk 84 101 115
Meat 79 100 141
Fish 82 106 60
Net trade (mill. USD) Cereals and preparations -78 -141 -384
Fruit and vegetables 165 198 -34
Meat and meat preparations -6 2 -125
Dairy products (milk equivalent) 1 -24 -103
Fish 114 412 104
Environment Forest area (% total land area) 67 64 62
Agricultural area (% total land area) 29 30 30
Freshwater withdrawal (% tot renewable) Terrestrial protected areas (% total land area) 21
Organic area (ha) 5 15
Wood pellet production (1 000 t) Emissions in agriculture (CO2 eq. Gg) 3 021 3 209 3 249
Net emissions in land use (CO2 eq. Gg) 8 928 9 277 8 563

177
Papua New Guinea
1995 2005 2016
The setting Population, total (mill.) 4.9 6.3 8.3
Rural population, total (mill.) 4.1 5.3 6.9
Govt. expenditure on agric. (% total outlays) Area harvested, crops (mill. ha) 0.8 0.9 1.1
Cropping intensity ratio 1.1 1.1 1.1
Total renewable water resources per cap. (m³) 161 199 125 411 99 072
Land area equipped for irrigation (1 000 ha) Agric. area actually irrigated (% agric. area) Employment in agriculture (%) 70.0 52.5 20.7
Employment in agriculture, female (%) 67.2 48.0 15.4
Fertilizers use, nitrogen (1 000 t nutrients) 13.8 20.9
Fertilizers use, phosphate (1 000 t nutrients) 1.6 2.0
Fertilizers use, potash (1 000 t nutrients) 1.7 10.7
Agric. value added per worker (constant USD) 1 930 4 270
Hunger dimensions Average dietary energy supply (kcal/cap/day) 2 291 2 196
Average dietary energy supply adequacy (%) 106 100
Dietary energy supply, cereals/roots/tubers (%) Prevalence of undernourishment (%) Prevalence of severe food insecurity (%) GDP per capita (USD, PPP) 2 696 3 818
Cereal import dependency ratio (%) Stunting, children under 5 (%) 43.9 Wasting, children under 5 (%) 4.4 Safely managed drinking water (% pop. using) Food supply Food production value, net (2004–06 mill. I$) 1 769 2 253 2 811
Agriculture, value added (% GDP) 22 22 19
Food (excl. fish) exports (mill. USD) 205 258 640
Food (excl. fish) imports (mill. USD) 195 198 668
Production indices (2004–06 = 100) Food 77 99 123
Crops 79 100 124
Cereals 67 102 159
Vegetable oils 67 92 150
Roots and tubers 79 100 119
Fruit and vegetables 80 99 121
Sugar 106 98 58
Livestock 76 99 119
Milk 87 100 97
Meat 76 99 120
Fish 16 102 124
Net trade (mill. USD) Cereals and preparations -84 -98 -287
Fruit and vegetables -6 -7 -31
Meat and meat preparations -59 -51 -138
Dairy products (milk equivalent) -15 -12 -21
Fish -10 75 151
Environment Forest area (% total land area) 74 74 74
Agricultural area (% total land area) 2 2 3
Freshwater withdrawal (% tot renewable) 0.0 Terrestrial protected areas (% total land area) 3
Organic area (ha) 3 16
Wood pellet production (1 000 t) Emissions in agriculture (CO2 eq. Gg) 5 347 5 538 5 708
Net emissions in land use (CO2 eq. Gg) 61 922 51 666 55 435

178
Paraguay
1995 2005 2016
The setting Population, total (mill.) 4.8 5.8 6.8
Rural population, total (mill.) 2.3 2.5 2.9
Govt. expenditure on agric. (% total outlays) 2.8
Area harvested, crops (mill. ha) 2.2 3.9 5.8
Cropping intensity ratio 0.8 1.1 1.2
Total renewable water resources per cap. (m³) 77 871 65 002 57 663
Land area equipped for irrigation (1 000 ha) 67 70 140
Agric. area actually irrigated (% agric. area) Employment in agriculture (%) 29.4 32.4 21.3
Employment in agriculture, female (%) 15.1 22.1 14.7
Fertilizers use, nitrogen (1 000 t nutrients) 41.9 120.2
Fertilizers use, phosphate (1 000 t nutrients) 103.9 223.0
Fertilizers use, potash (1 000 t nutrients) 81.8 186.4
Agric. value added per worker (constant USD) 3 861 3 499 8 084
Hunger dimensions Average dietary energy supply (kcal/cap/day) 2 625 2 635
Average dietary energy supply adequacy (%) 114 111
Dietary energy supply, cereals/roots/tubers (%) 43 43
Prevalence of undernourishment (%) 11.9 11.2
Prevalence of severe food insecurity (%) GDP per capita (USD, PPP) 6 120 8 871
Cereal import dependency ratio (%) -125.4 -210.6
Stunting, children under 5 (%) 17.5 5.6
Wasting, children under 5 (%) 1.1 1.0
Safely managed drinking water (% pop. using) Food supply Food production value, net (2004–06 mill. I$) 2 105 3 077 5 735
Agriculture, value added (% GDP) 21 18 17
Food (excl. fish) exports (mill. USD) 353 1 111 4 350
Food (excl. fish) imports (mill. USD) 212 166 451
Production indices (2004–06 = 100) Food 67 99 184
Crops 70 98 181
Cereals 55 86 373
Vegetable oils 61 104 215
Roots and tubers 61 95 62
Fruit and vegetables 85 98 98
Sugar 78 92 204
Livestock 72 98 129
Milk 95 99 128
Meat 72 98 134
Fish 88 100 106
Net trade (mill. USD) Cereals and preparations -1 83 557
Fruit and vegetables -13 -24 -51
Meat and meat preparations 38 254 1 144
Dairy products (milk equivalent) -22 -7 -13
Fish -2 -1 -8
Environment Forest area (% total land area) 51 47 38
Agricultural area (% total land area) 41 50 55
Freshwater withdrawal (% tot renewable) Terrestrial protected areas (% total land area) 7
Organic area (ha) 51 64
Wood pellet production (1 000 t) Emissions in agriculture (CO2 eq. Gg) 18 505 18 998 26 937
Net emissions in land use (CO2 eq. Gg) 72 255 74 260 143 319

179
Peru
1995 2005 2016
The setting Population, total (mill.) 24.0 27.6 32.2
Rural population, total (mill.) 7.0 6.9 6.6
Govt. expenditure on agric. (% total outlays) Area harvested, crops (mill. ha) 2.1 2.8 3.3
Cropping intensity ratio 0.5 0.6 0.7
Total renewable water resources per cap. (m³) 75 724 66 448 59 168
Land area equipped for irrigation (1 000 ha) 1 775 2 250 2 600
Agric. area actually irrigated (% agric. area) Employment in agriculture (%) 36.3 34.8 28.4
Employment in agriculture, female (%) 33.7 32.6 27.4
Fertilizers use, nitrogen (1 000 t nutrients) 180.3 289.3
Fertilizers use, phosphate (1 000 t nutrients) 65.4 87.7
Fertilizers use, potash (1 000 t nutrients) 55.8 71.0
Agric. value added per worker (constant USD) 1 674 1 740 2 478
Hunger dimensions Average dietary energy supply (kcal/cap/day) 2 380 2 682
Average dietary energy supply adequacy (%) 106 117
Dietary energy supply, cereals/roots/tubers (%) 58 56
Prevalence of undernourishment (%) 19.6 8.8
Prevalence of severe food insecurity (%) GDP per capita (USD, PPP) 7 595 12 082
Cereal import dependency ratio (%) 48.0 49.7
Stunting, children under 5 (%) 29.8 13.1
Wasting, children under 5 (%) 1.0 1.0
Safely managed drinking water (% pop. using) 46.8 50.2
Food supply Food production value, net (2004–06 mill. I$) 3 892 6 102 9 271
Agriculture, value added (% GDP) 8 7 7
Food (excl. fish) exports (mill. USD) 211 909 4 334
Food (excl. fish) imports (mill. USD) 1 031 1 110 3 106
Production indices (2004–06 = 100) Food 64 100 152
Crops 63 99 146
Cereals 53 108 139
Vegetable oils 95 103 218
Roots and tubers 76 103 131
Fruit and vegetables 60 96 167
Sugar 97 95 137
Livestock 63 99 159
Milk 70 99 156
Meat 62 100 156
Fish 103 108 45
Net trade (mill. USD) Cereals and preparations -564 -478 -1 157
Fruit and vegetables 97 556 2 995
Meat and meat preparations -31 -27 -113
Dairy products (milk equivalent) -108 -25 -71
Fish 866 1 586 1 924
Environment Forest area (% total land area) 60 59 58
Agricultural area (% total land area) 17 18 19
Freshwater withdrawal (% tot renewable) 1.0 0.7 Terrestrial protected areas (% total land area) 21
Organic area (ha) 122 324
Wood pellet production (1 000 t) Emissions in agriculture (CO2 eq. Gg) 17 431 21 685 23 650
Net emissions in land use (CO2 eq. Gg) 44 981 46 475 72 039

180
Philippines
1995 2005 2016
The setting Population, total (mill.) 69.8 86.3 104.9
Rural population, total (mill.) 36.0 45.8 58.7
Govt. expenditure on agric. (% total outlays) 4.2 4.1
Area harvested, crops (mill. ha) 12.6 13.0 14.5
Cropping intensity ratio 1.3 1.3 1.3
Total renewable water resources per cap. (m³) 6 558 5 384 4 636
Land area equipped for irrigation (1 000 ha) 1 500 1 413 1 856
Agric. area actually irrigated (% agric. area) 8.5 Employment in agriculture (%) 44.1 36.0 27.0
Employment in agriculture, female (%) 31.2 23.7 17.4
Fertilizers use, nitrogen (1 000 t nutrients) 544.1 617.1
Fertilizers use, phosphate (1 000 t nutrients) 137.3 123.7
Fertilizers use, potash (1 000 t nutrients) 80.1 139.3
Agric. value added per worker (constant USD) 1 461 1 898 2 295
Hunger dimensions Average dietary energy supply (kcal/cap/day) 2 483 2 601
Average dietary energy supply adequacy (%) 114 117
Dietary energy supply, cereals/roots/tubers (%) 60 59
Prevalence of undernourishment (%) 16.3 13.7
Prevalence of severe food insecurity (%) 12.9
GDP per capita (USD, PPP) 4 779 7 233
Cereal import dependency ratio (%) 21.7 17.8
Stunting, children under 5 (%) 33.8 33.4
Wasting, children under 5 (%) 6.0 7.1
Safely managed drinking water (% pop. using) Food supply Food production value, net (2004–06 mill. I$) 13 082 17 153 19 624
Agriculture, value added (% GDP) 19 13 10
Food (excl. fish) exports (mill. USD) 1 583 1 963 3 532
Food (excl. fish) imports (mill. USD) 1 791 2 526 6 501
Production indices (2004–06 = 100) Food 76 100 114
Crops 80 100 110
Cereals 71 98 122
Vegetable oils 87 100 104
Roots and tubers 113 100 146
Fruit and vegetables 84 101 104
Sugar 72 94 91
Livestock 64 98 127
Milk 99 101 117
Meat 63 98 128
Fish 80 100 100
Net trade (mill. USD) Cereals and preparations -659 -1 126 -1 823
Fruit and vegetables 459 808 1 086
Meat and meat preparations -79 -154 -887
Dairy products (milk equivalent) -432 -348 -667
Fish 367 253 335
Environment Forest area (% total land area) 23 24 28
Agricultural area (% total land area) 37 38 42
Freshwater withdrawal (% tot renewable) 16.5 Terrestrial protected areas (% total land area) 15
Organic area (ha) 198
Wood pellet production (1 000 t) Emissions in agriculture (CO2 eq. Gg) 42 270 48 465 51 261
Net emissions in land use (CO2 eq. Gg) -2 587 11 398 -60 309

181
Poland
1995 2005 2016
The setting Population, total (mill.) 38.5 38.4 38.2
Rural population, total (mill.) 14.8 14.7 15.1
Govt. expenditure on agric. (% total outlays) 2.4 0.9
Area harvested, crops (mill. ha) 11.9 10.5 9.8
Cropping intensity ratio 0.8 0.8 0.9
Total renewable water resources per cap. (m³) 1 568 1 571 1 583
Land area equipped for irrigation (1 000 ha) 201 124 271
Agric. area actually irrigated (% agric. area) 0.4 0.9
Employment in agriculture (%) 22.6 17.4 10.6
Employment in agriculture, female (%) 22.5 16.6 9.4
Fertilizers use, nitrogen (1 000 t nutrients) 996.5 1 040.5
Fertilizers use, phosphate (1 000 t nutrients) 441.8 323.3
Fertilizers use, potash (1 000 t nutrients) 527.8 503.8
Agric. value added per worker (constant USD) 4 271 4 924 6 429
Hunger dimensions Average dietary energy supply (kcal/cap/day) 3 368 3 451
Average dietary energy supply adequacy (%) 132 137
Dietary energy supply, cereals/roots/tubers (%) 41 40
Prevalence of undernourishment (%) <2.5 <2.5
Prevalence of severe food insecurity (%) 1.1
GDP per capita (USD, PPP) 17 194 26 036
Cereal import dependency ratio (%) 0.2 -4.8
Stunting, children under 5 (%) Wasting, children under 5 (%) Safely managed drinking water (% pop. using) 93.9 93.9
Food supply Food production value, net (2004–06 mill. I$) 14 849 16 143 19 255
Agriculture, value added (% GDP) 5 3 2
Food (excl. fish) exports (mill. USD) 1 966 7 072 19 161
Food (excl. fish) imports (mill. USD) 1 620 3 881 11 495
Production indices (2004–06 = 100) Food 91 99 118
Crops 114 98 119
Cereals 96 103 118
Vegetable oils 89 92 141
Roots and tubers 226 92 85
Fruit and vegetables 83 97 131
Sugar 111 98 113
Livestock 89 99 110
Milk 96 100 112
Meat 87 98 109
Fish 227 96 128
Net trade (mill. USD) Cereals and preparations -230 290 2 225
Fruit and vegetables 320 485 511
Meat and meat preparations 171 895 3 583
Dairy products (milk equivalent) 215 971 765
Fish 77 -81 -270
Environment Forest area (% total land area) 29 30 31
Agricultural area (% total land area) 61 52 47
Freshwater withdrawal (% tot renewable) 21.1 19.9 Terrestrial protected areas (% total land area) 40
Organic area (ha) 166 537
Wood pellet production (1 000 t) 800
Emissions in agriculture (CO2 eq. Gg) 34 656 30 656 30 054
Net emissions in land use (CO2 eq. Gg) -13 705 -24 356 -25 085

182
Portugal
1995 2005 2016
The setting Population, total (mill.) 10.1 10.6 10.3
Rural population, total (mill.) 4.9 4.5 3.8
Govt. expenditure on agric. (% total outlays) 0.9 0.8
Area harvested, crops (mill. ha) 1.8 1.3 1.0
Cropping intensity ratio 0.6 0.6 0.6
Total renewable water resources per cap. (m³) 7 618 7 336 7 463
Land area equipped for irrigation (1 000 ha) 797 617 548
Agric. area actually irrigated (% agric. area) 11.9 13.1
Employment in agriculture (%) 11.5 12.1 6.9
Employment in agriculture, female (%) 12.6 13.1 4.8
Fertilizers use, nitrogen (1 000 t nutrients) 102.7 113.6
Fertilizers use, phosphate (1 000 t nutrients) 77.3 49.6
Fertilizers use, potash (1 000 t nutrients) 84.8 31.9
Agric. value added per worker (constant USD) 9 708 7 550 14 153
Hunger dimensions Average dietary energy supply (kcal/cap/day) 3 529 3 477
Average dietary energy supply adequacy (%) 141 139
Dietary energy supply, cereals/roots/tubers (%) 32 32
Prevalence of undernourishment (%) <2.5 <2.5
Prevalence of severe food insecurity (%) 3.7
GDP per capita (USD, PPP) 26 593 27 124
Cereal import dependency ratio (%) 77.0 72.5
Stunting, children under 5 (%) Wasting, children under 5 (%) Safely managed drinking water (% pop. using) 94.2 95.1
Food supply Food production value, net (2004–06 mill. I$) 3 845 3 900 4 324
Agriculture, value added (% GDP) 5 2 2
Food (excl. fish) exports (mill. USD) 670 1 385 3 769
Food (excl. fish) imports (mill. USD) 2 668 4 531 6 772
Production indices (2004–06 = 100) Food 97 98 109
Crops 103 92 111
Cereals 118 73 102
Vegetable oils 111 71 206
Roots and tubers 227 86 60
Fruit and vegetables 92 98 104
Sugar 12 117 3
Livestock 93 102 104
Milk 88 102 95
Meat 96 103 108
Fish 117 98 84
Net trade (mill. USD) Cereals and preparations -573 -798 -881
Fruit and vegetables -294 -446 -166
Meat and meat preparations -393 -647 -780
Dairy products (milk equivalent) 0 -209 -232
Fish -488 -888 -1 060
Environment Forest area (% total land area) 37 36 35
Agricultural area (% total land area) 43 42 39
Freshwater withdrawal (% tot renewable) 14.4 11.8 Terrestrial protected areas (% total land area) 23
Organic area (ha) 212 245
Wood pellet production (1 000 t) 606
Emissions in agriculture (CO2 eq. Gg) 6 875 6 290 6 487
Net emissions in land use (CO2 eq. Gg) 1 645 6 484 1 880

183
Qatar
1995 2005 2016
The setting Population, total (mill.) 0.5 0.9 2.6
Rural population, total (mill.) 0.0 0.0 0.0
Govt. expenditure on agric. (% total outlays) 1.9 Area harvested, crops (mill. ha) 0.0 0.0 0.0
Cropping intensity ratio 0.4 0.3 0.3
Total renewable water resources per cap. (m³) 110 49 23
Land area equipped for irrigation (1 000 ha) 13 13 13
Agric. area actually irrigated (% agric. area) Employment in agriculture (%) 4.9 3.1 1.2
Employment in agriculture, female (%) 0.0 0.1 0.0
Fertilizers use, nitrogen (1 000 t nutrients) 7.3 96.6
Fertilizers use, phosphate (1 000 t nutrients) 0.0 0.0
Fertilizers use, potash (1 000 t nutrients) 0.0 0.0
Agric. value added per worker (constant USD) 5 148 10 789
Hunger dimensions Average dietary energy supply (kcal/cap/day) Average dietary energy supply adequacy (%) Dietary energy supply, cereals/roots/tubers (%) Prevalence of undernourishment (%) Prevalence of severe food insecurity (%) GDP per capita (USD, PPP) 109 802 118 207
Cereal import dependency ratio (%) Stunting, children under 5 (%) Wasting, children under 5 (%) Safely managed drinking water (% pop. using) Food supply Food production value, net (2004–06 mill. I$) 41 37 65
Agriculture, value added (% GDP) 1 0 0
Food (excl. fish) exports (mill. USD) 15 28 57
Food (excl. fish) imports (mill. USD) 274 556 2 573
Production indices (2004–06 = 100) Food 107 95 170
Crops 101 93 130
Cereals 54 110 20
Vegetable oils Roots and tubers 250 86 315
Fruit and vegetables 104 92 136
Sugar Livestock 110 97 199
Milk 167 88 188
Meat 78 99 225
Fish 31 101 105
Net trade (mill. USD) Cereals and preparations -42 -93 -504
Fruit and vegetables -61 -95 -623
Meat and meat preparations -33 -98 -494
Dairy products (milk equivalent) -46 -87 -323
Fish -4 -9 -101
Environment Forest area (% total land area) 0 0 0
Agricultural area (% total land area) 6 6 6
Freshwater withdrawal (% tot renewable) 277.1 374.1 Terrestrial protected areas (% total land area) 2
Organic area (ha) Wood pellet production (1 000 t) Emissions in agriculture (CO2 eq. Gg) 211 152 981
Net emissions in land use (CO2 eq. Gg) 0 0 0

184
Republic of Korea
1995 2005 2016
The setting Population, total (mill.) 45.3 48.7 51.0
Rural population, total (mill.) 9.7 8.8 8.7
Govt. expenditure on agric. (% total outlays) 4.5 4.5
Area harvested, crops (mill. ha) 2.1 1.9 1.5
Cropping intensity ratio 1.1 1.0 0.9
Total renewable water resources per cap. (m³) 1 539 1 446 1 372
Land area equipped for irrigation (1 000 ha) 907 867 728
Agric. area actually irrigated (% agric. area) 52.1 Employment in agriculture (%) 11.8 7.9 4.9
Employment in agriculture, female (%) 14.0 8.9 4.8
Fertilizers use, nitrogen (1 000 t nutrients) 417.3 238.3
Fertilizers use, phosphate (1 000 t nutrients) 317.3 150.8
Fertilizers use, potash (1 000 t nutrients) 322.4 151.3
Agric. value added per worker (constant USD) 8 036 11 959 18 796
Hunger dimensions Average dietary energy supply (kcal/cap/day) 3 104 3 318
Average dietary energy supply adequacy (%) 127 135
Dietary energy supply, cereals/roots/tubers (%) 45 43
Prevalence of undernourishment (%) <2.5 <2.5
Prevalence of severe food insecurity (%) <0.5
GDP per capita (USD, PPP) 25 517 35 020
Cereal import dependency ratio (%) 74.6 77.3
Stunting, children under 5 (%) 2.5 Wasting, children under 5 (%) 0.9 Safely managed drinking water (% pop. using) 96.8 98.0
Food supply Food production value, net (2004–06 mill. I$) 8 996 9 778 10 065
Agriculture, value added (% GDP) 5 3 2
Food (excl. fish) exports (mill. USD) 1 059 1 349 3 124
Food (excl. fish) imports (mill. USD) 5 005 7 426 17 021
Production indices (2004–06 = 100) Food 92 100 103
Crops 97 100 93
Cereals 99 99 87
Vegetable oils 135 112 81
Roots and tubers 84 120 89
Fruit and vegetables 93 100 96
Sugar Livestock 86 99 118
Milk 90 100 76
Meat 88 99 126
Fish 127 99 90
Net trade (mill. USD) Cereals and preparations -1 836 -2 028 -3 358
Fruit and vegetables -197 -792 -2 772
Meat and meat preparations -657 -1 462 -3 969
Dairy products (milk equivalent) -116 -260 -630
Fish 728 -1 322 -2 946
Environment Forest area (% total land area) 66 65 63
Agricultural area (% total land area) 21 19 17
Freshwater withdrawal (% tot renewable) 36.5 41.7 Terrestrial protected areas (% total land area) 11
Organic area (ha) 6 20
Wood pellet production (1 000 t) 980
Emissions in agriculture (CO2 eq. Gg) 14 567 12 933 12 431
Net emissions in land use (CO2 eq. Gg) -34 461 -43 264 -39 595

185
Republic of Moldova
1995 2005 2016
The setting Population, total (mill.) 4.3 4.2 4.1
Rural population, total (mill.) 2.3 2.1 1.9
Govt. expenditure on agric. (% total outlays) 6.3 4.0
Area harvested, crops (mill. ha) 1.7 1.7 1.7
Cropping intensity ratio 0.8 0.8 0.8
Total renewable water resources per cap. (m³) 2 863 2 972 3 022
Land area equipped for irrigation (1 000 ha) 309 228 228
Agric. area actually irrigated (% agric. area) Employment in agriculture (%) 48.8 40.6 33.7
Employment in agriculture, female (%) 47.7 40.2 30.3
Fertilizers use, nitrogen (1 000 t nutrients) 14.8 32.7
Fertilizers use, phosphate (1 000 t nutrients) 1.3 9.0
Fertilizers use, potash (1 000 t nutrients) 0.4 2.9
Agric. value added per worker (constant USD) 1 182 1 515 2 315
Hunger dimensions Average dietary energy supply (kcal/cap/day) 2 634 2 638
Average dietary energy supply adequacy (%) 104 105
Dietary energy supply, cereals/roots/tubers (%) 53 44
Prevalence of undernourishment (%) Prevalence of severe food insecurity (%) 3.4
GDP per capita (USD, PPP) 3 308 4 963
Cereal import dependency ratio (%) -10.2 -8.9
Stunting, children under 5 (%) 11.3 Wasting, children under 5 (%) 5.8 Safely managed drinking water (% pop. using) 48.1 70.0
Food supply Food production value, net (2004–06 mill. I$) 1 784 1 420 1 390
Agriculture, value added (% GDP) 29 16 12
Food (excl. fish) exports (mill. USD) 311 245 731
Food (excl. fish) imports (mill. USD) 42 161 361
Production indices (2004–06 = 100) Food 125 100 97
Crops 129 100 116
Cereals 99 106 114
Vegetable oils 61 96 194
Roots and tubers 110 106 60
Fruit and vegetables 157 96 118
Sugar 203 97 65
Livestock 140 102 101
Milk 128 108 82
Meat 175 96 115
Fish 24 101 191
Net trade (mill. USD) Cereals and preparations 10 19 108
Fruit and vegetables 112 68 110
Meat and meat preparations 48 -31 -16
Dairy products (milk equivalent) 14 -1 -19
Fish -6 -19 -45
Environment Forest area (% total land area) 10 11 13
Agricultural area (% total land area) 78 76 74
Freshwater withdrawal (% tot renewable) 16.0 8.7 Terrestrial protected areas (% total land area) 4
Organic area (ha) 30
Wood pellet production (1 000 t) 16
Emissions in agriculture (CO2 eq. Gg) 3 203 1 730 1 449
Net emissions in land use (CO2 eq. Gg) -1 234 -868 -1 087

186
Romania
1995 2005 2016
The setting Population, total (mill.) 23.0 21.4 19.7
Rural population, total (mill.) 10.6 10.4 9.7
Govt. expenditure on agric. (% total outlays) 2.9
Area harvested, crops (mill. ha) 8.5 8.0 8.0
Cropping intensity ratio 0.9 0.8 0.9
Total renewable water resources per cap. (m³) 9 367 10 105 10 719
Land area equipped for irrigation (1 000 ha) 3 110 3 176 3 149
Agric. area actually irrigated (% agric. area) 0.3 1.1
Employment in agriculture (%) 40.3 32.3 23.1
Employment in agriculture, female (%) 46.2 33.1 22.6
Fertilizers use, nitrogen (1 000 t nutrients) 299.2 344.3
Fertilizers use, phosphate (1 000 t nutrients) 138.1 126.2
Fertilizers use, potash (1 000 t nutrients) 24.1 43.6
Agric. value added per worker (constant USD) 2 573 3 707 5 153
Hunger dimensions Average dietary energy supply (kcal/cap/day) 3 393 3 358
Average dietary energy supply adequacy (%) 135 135
Dietary energy supply, cereals/roots/tubers (%) 44 45
Prevalence of undernourishment (%) <2.5 <2.5
Prevalence of severe food insecurity (%) 4.1
GDP per capita (USD, PPP) 14 583 21 671
Cereal import dependency ratio (%) -0.8 -35.8
Stunting, children under 5 (%) 12.8 Wasting, children under 5 (%) 3.5 Safely managed drinking water (% pop. using) 96.0 87.8
Food supply Food production value, net (2004–06 mill. I$) 8 202 8 107 9 605
Agriculture, value added (% GDP) 18 8 4
Food (excl. fish) exports (mill. USD) 444 729 5 302
Food (excl. fish) imports (mill. USD) 574 1 700 5 116
Production indices (2004–06 = 100) Food 96 95 113
Crops 91 92 101
Cereals 99 98 110
Vegetable oils 57 92 193
Roots and tubers 65 91 62
Fruit and vegetables 91 86 81
Sugar 312 86 119
Livestock 104 102 85
Milk 85 103 83
Meat 130 104 86
Fish 502 97 184
Net trade (mill. USD) Cereals and preparations 60 -12 1 438
Fruit and vegetables -35 -213 -1 099
Meat and meat preparations -16 -564 -382
Dairy products (milk equivalent) -13 -21 -285
Fish -17 -100 -244
Environment Forest area (% total land area) 28 28 30
Agricultural area (% total land area) 64 62 59
Freshwater withdrawal (% tot renewable) 5.9 3.2 3.0
Terrestrial protected areas (% total land area) 24
Organic area (ha) 93 226
Wood pellet production (1 000 t) 700
Emissions in agriculture (CO2 eq. Gg) 17 537 15 606 14 554
Net emissions in land use (CO2 eq. Gg) 1 699 101 -163 326
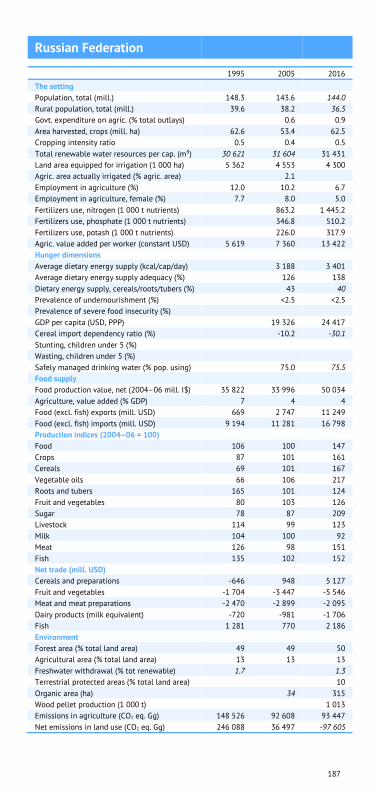
187
Russian Federation
1995 2005 2016
The setting Population, total (mill.) 148.3 143.6 144.0
Rural population, total (mill.) 39.6 38.2 36.5
Govt. expenditure on agric. (% total outlays) 0.6 0.9
Area harvested, crops (mill. ha) 62.6 53.4 62.5
Cropping intensity ratio 0.5 0.4 0.5
Total renewable water resources per cap. (m³) 30 621 31 604 31 431
Land area equipped for irrigation (1 000 ha) 5 362 4 553 4 300
Agric. area actually irrigated (% agric. area) 2.1 Employment in agriculture (%) 12.0 10.2 6.7
Employment in agriculture, female (%) 7.7 8.0 5.0
Fertilizers use, nitrogen (1 000 t nutrients) 863.2 1 445.2
Fertilizers use, phosphate (1 000 t nutrients) 346.8 510.2
Fertilizers use, potash (1 000 t nutrients) 226.0 317.9
Agric. value added per worker (constant USD) 5 619 7 360 13 422
Hunger dimensions Average dietary energy supply (kcal/cap/day) 3 188 3 401
Average dietary energy supply adequacy (%) 126 138
Dietary energy supply, cereals/roots/tubers (%) 43 40
Prevalence of undernourishment (%) <2.5 <2.5
Prevalence of severe food insecurity (%) GDP per capita (USD, PPP) 19 326 24 417
Cereal import dependency ratio (%) -10.2 -30.1
Stunting, children under 5 (%) Wasting, children under 5 (%) Safely managed drinking water (% pop. using) 75.0 75.5
Food supply Food production value, net (2004–06 mill. I$) 35 822 33 996 50 034
Agriculture, value added (% GDP) 7 4 4
Food (excl. fish) exports (mill. USD) 669 2 747 11 249
Food (excl. fish) imports (mill. USD) 9 194 11 281 16 798
Production indices (2004–06 = 100) Food 106 100 147
Crops 87 101 161
Cereals 69 101 167
Vegetable oils 66 106 217
Roots and tubers 165 101 124
Fruit and vegetables 80 103 126
Sugar 78 87 209
Livestock 114 99 123
Milk 104 100 92
Meat 126 98 151
Fish 135 102 152
Net trade (mill. USD) Cereals and preparations -646 948 5 127
Fruit and vegetables -1 704 -3 447 -5 546
Meat and meat preparations -2 470 -2 899 -2 095
Dairy products (milk equivalent) -720 -981 -1 706
Fish 1 281 770 2 186
Environment Forest area (% total land area) 49 49 50
Agricultural area (% total land area) 13 13 13
Freshwater withdrawal (% tot renewable) 1.7 1.3
Terrestrial protected areas (% total land area) 10
Organic area (ha) 34 315
Wood pellet production (1 000 t) 1 013
Emissions in agriculture (CO2 eq. Gg) 148 526 92 608 93 447
Net emissions in land use (CO2 eq. Gg) 246 088 36 497 -97 605

188
Rwanda
1995 2005 2016
The setting Population, total (mill.) 5.9 9.0 12.2
Rural population, total (mill.) 5.1 7.6 9.1
Govt. expenditure on agric. (% total outlays) 3.0
Area harvested, crops (mill. ha) 0.9 1.7 2.1
Cropping intensity ratio 1.0 1.3 1.5
Total renewable water resources per cap. (m³) 2 044 1 403 1 116
Land area equipped for irrigation (1 000 ha) 5 9 10
Agric. area actually irrigated (% agric. area) 0.4 Employment in agriculture (%) 89.6 85.6 66.9
Employment in agriculture, female (%) 94.6 91.9 77.1
Fertilizers use, nitrogen (1 000 t nutrients) 1.2 4.3
Fertilizers use, phosphate (1 000 t nutrients) 1.1 6.9
Fertilizers use, potash (1 000 t nutrients) 1.1 1.3
Agric. value added per worker (constant USD) 216 349 557
Hunger dimensions Average dietary energy supply (kcal/cap/day) 2 017 2 203
Average dietary energy supply adequacy (%) 93 100
Dietary energy supply, cereals/roots/tubers (%) 51 49
Prevalence of undernourishment (%) 45.3 36.1
Prevalence of severe food insecurity (%) GDP per capita (USD, PPP) 1 044 1 790
Cereal import dependency ratio (%) 21.4 32.5
Stunting, children under 5 (%) 51.7 37.9
Wasting, children under 5 (%) 4.8 2.2
Safely managed drinking water (% pop. using) Food supply Food production value, net (2004–06 mill. I$) 889 1 646 2 301
Agriculture, value added (% GDP) 41 38 29
Food (excl. fish) exports (mill. USD) 0 1 50
Food (excl. fish) imports (mill. USD) 83 68 187
Production indices (2004–06 = 100) Food 54 101 141
Crops 56 101 141
Cereals 34 113 197
Vegetable oils 62 102 104
Roots and tubers 24 105 163
Fruit and vegetables 70 101 120
Sugar 17 100 159
Livestock 50 97 137
Milk 57 95 128
Meat 46 98 142
Fish 44 90 350
Net trade (mill. USD) Cereals and preparations -43 -35 -29
Fruit and vegetables -13 -6 -3
Meat and meat preparations 0 0
Dairy products (milk equivalent) -4 -1 -4
Fish 0 0 -21
Environment Forest area (% total land area) 13 16 20
Agricultural area (% total land area) 60 72 73
Freshwater withdrawal (% tot renewable) Terrestrial protected areas (% total land area) 9
Organic area (ha) 0 2
Wood pellet production (1 000 t) Emissions in agriculture (CO2 eq. Gg) 1 126 2 270 3 186
Net emissions in land use (CO2 eq. Gg) 9 637 -9 189 733
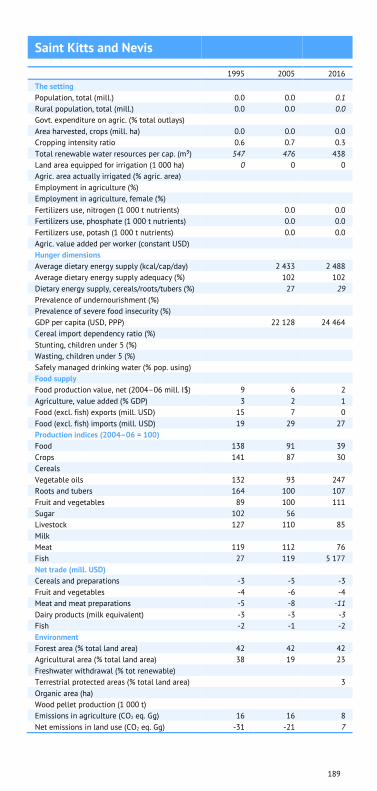
189
Saint Kitts and Nevis
1995 2005 2016
The setting Population, total (mill.) 0.0 0.0 0.1
Rural population, total (mill.) 0.0 0.0 0.0
Govt. expenditure on agric. (% total outlays) Area harvested, crops (mill. ha) 0.0 0.0 0.0
Cropping intensity ratio 0.6 0.7 0.3
Total renewable water resources per cap. (m³) 547 476 438
Land area equipped for irrigation (1 000 ha) 0 0 0
Agric. area actually irrigated (% agric. area) Employment in agriculture (%) Employment in agriculture, female (%) Fertilizers use, nitrogen (1 000 t nutrients) 0.0 0.0
Fertilizers use, phosphate (1 000 t nutrients) 0.0 0.0
Fertilizers use, potash (1 000 t nutrients) 0.0 0.0
Agric. value added per worker (constant USD) Hunger dimensions Average dietary energy supply (kcal/cap/day) 2 433 2 488
Average dietary energy supply adequacy (%) 102 102
Dietary energy supply, cereals/roots/tubers (%) 27 29
Prevalence of undernourishment (%) Prevalence of severe food insecurity (%) GDP per capita (USD, PPP) 22 128 24 464
Cereal import dependency ratio (%) Stunting, children under 5 (%) Wasting, children under 5 (%) Safely managed drinking water (% pop. using) Food supply Food production value, net (2004–06 mill. I$) 9 6 2
Agriculture, value added (% GDP) 3 2 1
Food (excl. fish) exports (mill. USD) 15 7 0
Food (excl. fish) imports (mill. USD) 19 29 27
Production indices (2004–06 = 100) Food 138 91 39
Crops 141 87 30
Cereals Vegetable oils 132 93 247
Roots and tubers 164 100 107
Fruit and vegetables 89 100 111
Sugar 102 56 Livestock 127 110 85
Milk Meat 119 112 76
Fish 27 119 5 177
Net trade (mill. USD) Cereals and preparations -3 -5 -3
Fruit and vegetables -4 -6 -4
Meat and meat preparations -5 -8 -11
Dairy products (milk equivalent) -3 -3 -3
Fish -2 -1 -2
Environment Forest area (% total land area) 42 42 42
Agricultural area (% total land area) 38 19 23
Freshwater withdrawal (% tot renewable) Terrestrial protected areas (% total land area) 3
Organic area (ha) Wood pellet production (1 000 t) Emissions in agriculture (CO2 eq. Gg) 16 16 8
Net emissions in land use (CO2 eq. Gg) -31 -21 7
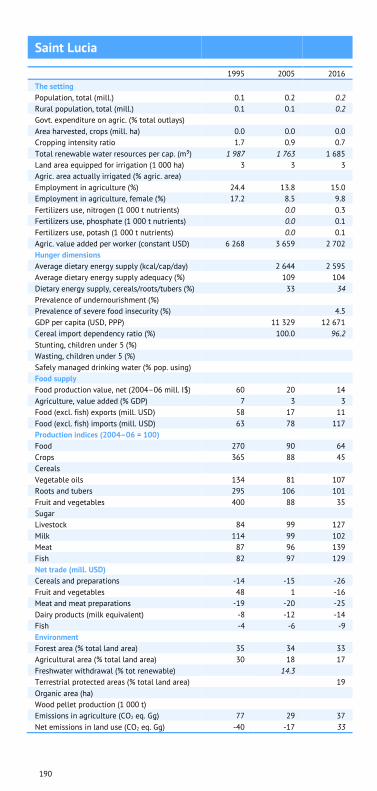
190
Saint Lucia
1995 2005 2016
The setting Population, total (mill.) 0.1 0.2 0.2
Rural population, total (mill.) 0.1 0.1 0.2
Govt. expenditure on agric. (% total outlays) Area harvested, crops (mill. ha) 0.0 0.0 0.0
Cropping intensity ratio 1.7 0.9 0.7
Total renewable water resources per cap. (m³) 1 987 1 763 1 685
Land area equipped for irrigation (1 000 ha) 3 3 3
Agric. area actually irrigated (% agric. area) Employment in agriculture (%) 24.4 13.8 15.0
Employment in agriculture, female (%) 17.2 8.5 9.8
Fertilizers use, nitrogen (1 000 t nutrients) 0.0 0.3
Fertilizers use, phosphate (1 000 t nutrients) 0.0 0.1
Fertilizers use, potash (1 000 t nutrients) 0.0 0.1
Agric. value added per worker (constant USD) 6 268 3 659 2 702
Hunger dimensions Average dietary energy supply (kcal/cap/day) 2 644 2 595
Average dietary energy supply adequacy (%) 109 104
Dietary energy supply, cereals/roots/tubers (%) 33 34
Prevalence of undernourishment (%) Prevalence of severe food insecurity (%) 4.5
GDP per capita (USD, PPP) 11 329 12 671
Cereal import dependency ratio (%) 100.0 96.2
Stunting, children under 5 (%) Wasting, children under 5 (%) Safely managed drinking water (% pop. using) Food supply Food production value, net (2004–06 mill. I$) 60 20 14
Agriculture, value added (% GDP) 7 3 3
Food (excl. fish) exports (mill. USD) 58 17 11
Food (excl. fish) imports (mill. USD) 63 78 117
Production indices (2004–06 = 100) Food 270 90 64
Crops 365 88 45
Cereals Vegetable oils 134 81 107
Roots and tubers 295 106 101
Fruit and vegetables 400 88 35
Sugar Livestock 84 99 127
Milk 114 99 102
Meat 87 96 139
Fish 82 97 129
Net trade (mill. USD) Cereals and preparations -14 -15 -26
Fruit and vegetables 48 1 -16
Meat and meat preparations -19 -20 -25
Dairy products (milk equivalent) -8 -12 -14
Fish -4 -6 -9
Environment Forest area (% total land area) 35 34 33
Agricultural area (% total land area) 30 18 17
Freshwater withdrawal (% tot renewable) 14.3 Terrestrial protected areas (% total land area) 19
Organic area (ha) Wood pellet production (1 000 t) Emissions in agriculture (CO2 eq. Gg) 77 29 37
Net emissions in land use (CO2 eq. Gg) -40 -17 33

191
Saint Vincent and the Grenadines
1995 2005 2016
The setting Population, total (mill.) 0.1 0.1 0.1
Rural population, total (mill.) 0.1 0.1 0.1
Govt. expenditure on agric. (% total outlays) 2.7
Area harvested, crops (mill. ha) 0.0 0.0 0.0
Cropping intensity ratio 1.4 1.8 1.8
Total renewable water resources per cap. (m³) 926 917 912
Land area equipped for irrigation (1 000 ha) 1 1 0
Agric. area actually irrigated (% agric. area) Employment in agriculture (%) 11.0 7.1 6.2
Employment in agriculture, female (%) 2.9 1.5 1.4
Fertilizers use, nitrogen (1 000 t nutrients) Fertilizers use, phosphate (1 000 t nutrients) Fertilizers use, potash (1 000 t nutrients) Agric. value added per worker (constant USD) 11 317 12 941 15 941
Hunger dimensions Average dietary energy supply (kcal/cap/day) 2 764 2 970
Average dietary energy supply adequacy (%) 114 121
Dietary energy supply, cereals/roots/tubers (%) 36 38
Prevalence of undernourishment (%) 9.1 5.7
Prevalence of severe food insecurity (%) GDP per capita (USD, PPP) 9 319 10 583
Cereal import dependency ratio (%) 82.8 94.8
Stunting, children under 5 (%) Wasting, children under 5 (%) Safely managed drinking water (% pop. using) Food supply Food production value, net (2004–06 mill. I$) 27 22 22
Agriculture, value added (% GDP) 10 5 7
Food (excl. fish) exports (mill. USD) 44 26 13
Food (excl. fish) imports (mill. USD) 28 43 51
Production indices (2004–06 = 100) Food 124 102 104
Crops 101 104 111
Cereals 179 84 117
Vegetable oils 138 99 73
Roots and tubers 76 100 100
Fruit and vegetables 104 106 115
Sugar 102 102 91
Livestock 108 102 99
Milk 115 93 88
Meat 114 100 104
Fish 2 76 40
Net trade (mill. USD) Cereals and preparations 5 -3 -7
Fruit and vegetables 28 13 -2
Meat and meat preparations -12 -16
Dairy products (milk equivalent) -3 -5 -5
Fish 0 -1 -2
Environment Forest area (% total land area) 65 67 69
Agricultural area (% total land area) 31 26 26
Freshwater withdrawal (% tot renewable) 10.0 7.9
Terrestrial protected areas (% total land area) 22
Organic area (ha) Wood pellet production (1 000 t) Emissions in agriculture (CO2 eq. Gg) 25 16 14
Net emissions in land use (CO2 eq. Gg) -107 -49 18

192
Samoa
1995 2005 2016
The setting Population, total (mill.) 0.2 0.2 0.2
Rural population, total (mill.) 0.1 0.1 0.2
Govt. expenditure on agric. (% total outlays) 2.4
Area harvested, crops (mill. ha) 0.0 0.0 0.0
Cropping intensity ratio 0.7 1.1 1.6
Total renewable water resources per cap. (m³) Land area equipped for irrigation (1 000 ha) Agric. area actually irrigated (% agric. area) Employment in agriculture (%) 12.0 7.1 5.1
Employment in agriculture, female (%) 9.0 4.8 3.3
Fertilizers use, nitrogen (1 000 t nutrients) 0.0 0.0
Fertilizers use, phosphate (1 000 t nutrients) 0.0 0.0
Fertilizers use, potash (1 000 t nutrients) 0.0 0.0
Agric. value added per worker (constant USD) 24 520 31 531 40 341
Hunger dimensions Average dietary energy supply (kcal/cap/day) 2 879 2 962
Average dietary energy supply adequacy (%) 128 129
Dietary energy supply, cereals/roots/tubers (%) 29 28
Prevalence of undernourishment (%) 3.5 3.1
Prevalence of severe food insecurity (%) GDP per capita (USD, PPP) 5 335 5 914
Cereal import dependency ratio (%) Stunting, children under 5 (%) 4.7
Wasting, children under 5 (%) 3.7
Safely managed drinking water (% pop. using) Food supply Food production value, net (2004–06 mill. I$) 40 49 57
Agriculture, value added (% GDP) 20 12 11
Food (excl. fish) exports (mill. USD) 6 8 8
Food (excl. fish) imports (mill. USD) 23 34 84
Production indices (2004–06 = 100) Food 83 101 118
Crops 82 101 119
Cereals Vegetable oils 99 101 119
Roots and tubers 55 99 183
Fruit and vegetables 70 103 102
Sugar 100 100 99
Livestock 88 100 112
Milk 91 100 133
Meat 85 100 114
Fish 39 93 83
Net trade (mill. USD) Cereals and preparations -6 -7 -16
Fruit and vegetables 1 4 -6
Meat and meat preparations -9 -12 -27
Dairy products (milk equivalent) -3 -5 -13
Fish -3 5 2
Environment Forest area (% total land area) 53 60 60
Agricultural area (% total land area) 18 15 12
Freshwater withdrawal (% tot renewable) Terrestrial protected areas (% total land area) 7
Organic area (ha) 7 63
Wood pellet production (1 000 t) Emissions in agriculture (CO2 eq. Gg) 127 148 176
Net emissions in land use (CO2 eq. Gg) -2 057 -110 2

193
Sao Tome and Principe
1995 2005 2016
The setting Population, total (mill.) 0.1 0.2 0.2
Rural population, total (mill.) 0.1 0.1 0.1
Govt. expenditure on agric. (% total outlays) 6.8 Area harvested, crops (mill. ha) 0.0 0.0 0.0
Cropping intensity ratio 0.9 0.8 0.9
Total renewable water resources per cap. (m³) 16 756 13 616 10 905
Land area equipped for irrigation (1 000 ha) 10 10 10
Agric. area actually irrigated (% agric. area) Employment in agriculture (%) 36.5 27.9 18.4
Employment in agriculture, female (%) 28.6 16.0 10.7
Fertilizers use, nitrogen (1 000 t nutrients) Fertilizers use, phosphate (1 000 t nutrients) Fertilizers use, potash (1 000 t nutrients) Agric. value added per worker (constant USD) 1 620 2 369
Hunger dimensions Average dietary energy supply (kcal/cap/day) 2 538 2 515
Average dietary energy supply adequacy (%) 116 113
Dietary energy supply, cereals/roots/tubers (%) 47 41
Prevalence of undernourishment (%) 9.4 10.2
Prevalence of severe food insecurity (%) GDP per capita (USD, PPP) 2 228 3 004
Cereal import dependency ratio (%) Stunting, children under 5 (%) 28.9 17.2
Wasting, children under 5 (%) 9.6 4.0
Safely managed drinking water (% pop. using) Food supply Food production value, net (2004–06 mill. I$) 17 25 28
Agriculture, value added (% GDP) 26 18 11
Food (excl. fish) exports (mill. USD) 5 4 9
Food (excl. fish) imports (mill. USD) 7 16 33
Production indices (2004–06 = 100) Food 67 101 111
Crops 68 101 111
Cereals 148 102 38
Vegetable oils 39 99 136
Roots and tubers 45 104 17
Fruit and vegetables 55 101 152
Sugar Livestock 68 103 117
Milk 102 116 39
Meat 63 100 136
Fish 102 99 278
Net trade (mill. USD) Cereals and preparations -13
Fruit and vegetables 0 -1 -4
Meat and meat preparations -5
Dairy products (milk equivalent) -3
Fish -1 0 0
Environment Forest area (% total land area) 58 58 56
Agricultural area (% total land area) 47 51 51
Freshwater withdrawal (% tot renewable) 0.3 Terrestrial protected areas (% total land area) 29
Organic area (ha) 3 7
Wood pellet production (1 000 t) Emissions in agriculture (CO2 eq. Gg) 9 12 17
Net emissions in land use (CO2 eq. Gg) 0 0 0
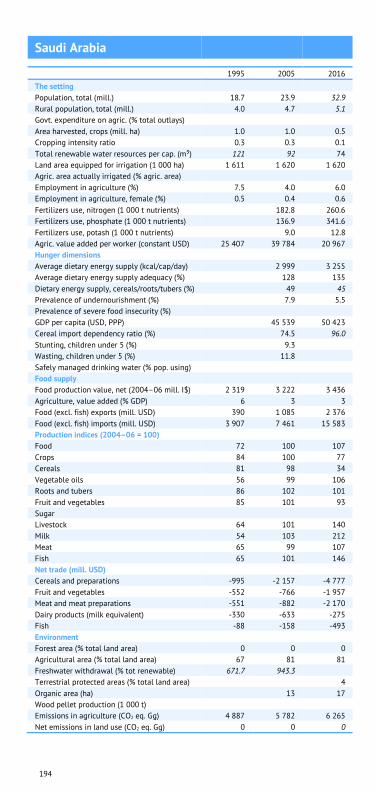
194
Saudi Arabia
1995 2005 2016
The setting Population, total (mill.) 18.7 23.9 32.9
Rural population, total (mill.) 4.0 4.7 5.1
Govt. expenditure on agric. (% total outlays) Area harvested, crops (mill. ha) 1.0 1.0 0.5
Cropping intensity ratio 0.3 0.3 0.1
Total renewable water resources per cap. (m³) 121 92 74
Land area equipped for irrigation (1 000 ha) 1 611 1 620 1 620
Agric. area actually irrigated (% agric. area) Employment in agriculture (%) 7.5 4.0 6.0
Employment in agriculture, female (%) 0.5 0.4 0.6
Fertilizers use, nitrogen (1 000 t nutrients) 182.8 260.6
Fertilizers use, phosphate (1 000 t nutrients) 136.9 341.6
Fertilizers use, potash (1 000 t nutrients) 9.0 12.8
Agric. value added per worker (constant USD) 25 407 39 784 20 967
Hunger dimensions Average dietary energy supply (kcal/cap/day) 2 999 3 255
Average dietary energy supply adequacy (%) 128 135
Dietary energy supply, cereals/roots/tubers (%) 49 45
Prevalence of undernourishment (%) 7.9 5.5
Prevalence of severe food insecurity (%) GDP per capita (USD, PPP) 45 539 50 423
Cereal import dependency ratio (%) 74.5 96.0
Stunting, children under 5 (%) 9.3 Wasting, children under 5 (%) 11.8 Safely managed drinking water (% pop. using) Food supply Food production value, net (2004–06 mill. I$) 2 319 3 222 3 436
Agriculture, value added (% GDP) 6 3 3
Food (excl. fish) exports (mill. USD) 390 1 085 2 376
Food (excl. fish) imports (mill. USD) 3 907 7 461 15 583
Production indices (2004–06 = 100) Food 72 100 107
Crops 84 100 77
Cereals 81 98 34
Vegetable oils 56 99 106
Roots and tubers 86 102 101
Fruit and vegetables 85 101 93
Sugar Livestock 64 101 140
Milk 54 103 212
Meat 65 99 107
Fish 65 101 146
Net trade (mill. USD) Cereals and preparations -995 -2 157 -4 777
Fruit and vegetables -552 -766 -1 957
Meat and meat preparations -551 -882 -2 170
Dairy products (milk equivalent) -330 -633 -275
Fish -88 -158 -493
Environment Forest area (% total land area) 0 0 0
Agricultural area (% total land area) 67 81 81
Freshwater withdrawal (% tot renewable) 671.7 943.3 Terrestrial protected areas (% total land area) 4
Organic area (ha) 13 17
Wood pellet production (1 000 t) Emissions in agriculture (CO2 eq. Gg) 4 887 5 782 6 265
Net emissions in land use (CO2 eq. Gg) 0 0 0

195
Senegal
1995 2005 2016
The setting Population, total (mill.) 8.7 11.3 15.9
Rural population, total (mill.) 5.3 6.6 8.8
Govt. expenditure on agric. (% total outlays) Area harvested, crops (mill. ha) 2.4 2.4 2.7
Cropping intensity ratio 0.8 0.8 0.8
Total renewable water resources per cap. (m³) 4 253 3 276 2 529
Land area equipped for irrigation (1 000 ha) 76 120 120
Agric. area actually irrigated (% agric. area) 0.8 Employment in agriculture (%) 46.8 40.6 53.6
Employment in agriculture, female (%) 49.6 42.1 59.7
Fertilizers use, nitrogen (1 000 t nutrients) 12.2 28.3
Fertilizers use, phosphate (1 000 t nutrients) 11.6 15.7
Fertilizers use, potash (1 000 t nutrients) 7.0 8.6
Agric. value added per worker (constant USD) 1 231 1 335 904
Hunger dimensions Average dietary energy supply (kcal/cap/day) 2 266 2 473
Average dietary energy supply adequacy (%) 101 111
Dietary energy supply, cereals/roots/tubers (%) 63 61
Prevalence of undernourishment (%) 21.6 11.3
Prevalence of severe food insecurity (%) GDP per capita (USD, PPP) 2 108 2 380
Cereal import dependency ratio (%) 54.7 56.2
Stunting, children under 5 (%) 20.1 17.0
Wasting, children under 5 (%) 8.7 7.2
Safely managed drinking water (% pop. using) Food supply Food production value, net (2004–06 mill. I$) 946 1 173 1 570
Agriculture, value added (% GDP) 17 15 15
Food (excl. fish) exports (mill. USD) 63 100 456
Food (excl. fish) imports (mill. USD) 405 799 1 221
Production indices (2004–06 = 100) Food 89 111 148
Crops 93 114 156
Cereals 103 125 202
Vegetable oils 116 121 121
Roots and tubers 26 103 182
Fruit and vegetables 58 94 175
Sugar 107 100 84
Livestock 79 101 125
Milk 92 99 122
Meat 80 101 124
Fish 91 100 119
Net trade (mill. USD) Cereals and preparations -195 -372 -551
Fruit and vegetables -18 -42 -21
Meat and meat preparations -2 -32 -12
Dairy products (milk equivalent) -34 -76 -55
Fish 247 254 355
Environment Forest area (% total land area) 47 45 43
Agricultural area (% total land area) 46 46 46
Freshwater withdrawal (% tot renewable) 5.7 Terrestrial protected areas (% total land area) 25
Organic area (ha) 2 7
Wood pellet production (1 000 t) Emissions in agriculture (CO2 eq. Gg) 8 845 10 280 11 460
Net emissions in land use (CO2 eq. Gg) 7 997 7 215 5 204

196
Serbia
1995 2005 2016
The setting Population, total (mill.) 8.8
Rural population, total (mill.) 4.1
Govt. expenditure on agric. (% total outlays) Area harvested, crops (mill. ha) 2.6
Cropping intensity ratio 0.9
Total renewable water resources per cap. (m³) 18 390
Land area equipped for irrigation (1 000 ha) 75
Agric. area actually irrigated (% agric. area) 1.3
Employment in agriculture (%) 31.3 23.3 18.6
Employment in agriculture, female (%) 32.4 23.3 16.2
Fertilizers use, nitrogen (1 000 t nutrients) 311.3
Fertilizers use, phosphate (1 000 t nutrients) 236.6
Fertilizers use, potash (1 000 t nutrients) 88.1
Agric. value added per worker (constant USD) 3 499 5 436 6 907
Hunger dimensions Average dietary energy supply (kcal/cap/day) 2 728
Average dietary energy supply adequacy (%) 110 110
Dietary energy supply, cereals/roots/tubers (%) 38 41
Prevalence of undernourishment (%) 5.6
Prevalence of severe food insecurity (%) 2.1
GDP per capita (USD, PPP) 10 901 13 721
Cereal import dependency ratio (%) -47.2
Stunting, children under 5 (%) 8.1 6.0
Wasting, children under 5 (%) 4.5 3.9
Safely managed drinking water (% pop. using) 77.8 88.1
Food supply Food production value, net (2004–06 mill. I$) 3 645
Agriculture, value added (% GDP) 20 10 6
Food (excl. fish) exports (mill. USD) 2 375
Food (excl. fish) imports (mill. USD) 837
Production indices (2004–06 = 100) Food 99
Crops 106
Cereals 131
Vegetable oils 158
Roots and tubers 77
Fruit and vegetables 86
Sugar 84
Livestock 101
Milk 93
Meat 104
Fish 117
Net trade (mill. USD) Cereals and preparations 592
Fruit and vegetables 499
Meat and meat preparations -4
Dairy products (milk equivalent) 23
Fish 0 0 -56
Environment Forest area (% total land area) 31
Agricultural area (% total land area) 39
Freshwater withdrawal (% tot renewable) 2.6
Terrestrial protected areas (% total land area) 6
Organic area (ha) 14
Wood pellet production (1 000 t) 244
Emissions in agriculture (CO2 eq. Gg) 5 947
Net emissions in land use (CO2 eq. Gg) -1 293

197
Seychelles
1995 2005 2016
The setting Population, total (mill.) 0.1 0.1 0.1
Rural population, total (mill.) 0.0 0.0 0.0
Govt. expenditure on agric. (% total outlays) 3.7 2.6
Area harvested, crops (mill. ha) 0.0 0.0 0.0
Cropping intensity ratio 1.2 0.8 0.9
Total renewable water resources per cap. (m³) Land area equipped for irrigation (1 000 ha) 0 0
Agric. area actually irrigated (% agric. area) 5.0 Employment in agriculture (%) Employment in agriculture, female (%) Fertilizers use, nitrogen (1 000 t nutrients) 0.0 0.0
Fertilizers use, phosphate (1 000 t nutrients) 0.0 0.0
Fertilizers use, potash (1 000 t nutrients) 0.0 0.0
Agric. value added per worker (constant USD) Hunger dimensions Average dietary energy supply (kcal/cap/day) 2 298 2 362
Average dietary energy supply adequacy (%) 97 99
Dietary energy supply, cereals/roots/tubers (%) Prevalence of undernourishment (%) Prevalence of severe food insecurity (%) 2.4
GDP per capita (USD, PPP) 17 812 25 631
Cereal import dependency ratio (%) Stunting, children under 5 (%) Wasting, children under 5 (%) Safely managed drinking water (% pop. using) Food supply Food production value, net (2004–06 mill. I$) 7 5 5
Agriculture, value added (% GDP) 5 3 2
Food (excl. fish) exports (mill. USD) 1 1 1
Food (excl. fish) imports (mill. USD) 37 67 118
Production indices (2004–06 = 100) Food 157 99 104
Crops 129 96 94
Cereals Vegetable oils 124 86 86
Roots and tubers 88 102 119
Fruit and vegetables 83 97 124
Sugar Livestock 172 100 103
Milk 200 92 2
Meat 171 100 122
Fish 4 108 125
Net trade (mill. USD) Cereals and preparations -10 -13 -17
Fruit and vegetables -8 -14 -27
Meat and meat preparations -3 -7 -18
Dairy products (milk equivalent) -5 -9 -18
Fish 14 221 359
Environment Forest area (% total land area) 88 88 88
Agricultural area (% total land area) 9 9 3
Freshwater withdrawal (% tot renewable) Terrestrial protected areas (% total land area) 42
Organic area (ha) Wood pellet production (1 000 t) Emissions in agriculture (CO2 eq. Gg) 12 7 4
Net emissions in land use (CO2 eq. Gg) 0 0 0

198
Sierra Leone
1995 2005 2016
The setting Population, total (mill.) 4.3 5.7 7.6
Rural population, total (mill.) 2.6 3.2 3.9
Govt. expenditure on agric. (% total outlays) Area harvested, crops (mill. ha) 0.6 1.4 1.8
Cropping intensity ratio 1.0 0.8 1.0
Total renewable water resources per cap. (m³) 41 634 29 679 21 633
Land area equipped for irrigation (1 000 ha) 29 30 30
Agric. area actually irrigated (% agric. area) Employment in agriculture (%) 66.2 65.9 60.6
Employment in agriculture, female (%) 66.4 65.6 59.8
Fertilizers use, nitrogen (1 000 t nutrients) Fertilizers use, phosphate (1 000 t nutrients) Fertilizers use, potash (1 000 t nutrients) Agric. value added per worker (constant USD) 642 761 1 169
Hunger dimensions Average dietary energy supply (kcal/cap/day) 2 089 2 399
Average dietary energy supply adequacy (%) 98 109
Dietary energy supply, cereals/roots/tubers (%) 60 63
Prevalence of undernourishment (%) 37.0 25.5
Prevalence of severe food insecurity (%) 70.6
GDP per capita (USD, PPP) 1 062 1 364
Cereal import dependency ratio (%) 21.9 27.8
Stunting, children under 5 (%) 46.9 37.9
Wasting, children under 5 (%) 10.2 9.4
Safely managed drinking water (% pop. using) Food supply Food production value, net (2004–06 mill. I$) 383 646 1 409
Agriculture, value added (% GDP) 45 49 58
Food (excl. fish) exports (mill. USD) 4 14 49
Food (excl. fish) imports (mill. USD) 133 90 259
Production indices (2004–06 = 100) Food 55 92 201
Crops 52 92 196
Cereals 47 93 203
Vegetable oils 84 96 114
Roots and tubers 19 77 322
Fruit and vegetables 77 100 132
Sugar 30 100 110
Livestock 108 98 214
Milk 133 95 258
Meat 85 99 189
Fish 46 102 145
Net trade (mill. USD) Cereals and preparations -92 -40 -107
Fruit and vegetables -3 -6 -7
Meat and meat preparations -1 -3 -23
Dairy products (milk equivalent) -10
Fish 45 11 9
Environment Forest area (% total land area) 42 39 43
Agricultural area (% total land area) 39 53 55
Freshwater withdrawal (% tot renewable) 0.1 Terrestrial protected areas (% total land area) 9
Organic area (ha) 70
Wood pellet production (1 000 t) Emissions in agriculture (CO2 eq. Gg) 1 480 1 934 3 317
Net emissions in land use (CO2 eq. Gg) 5 863 5 718 5 900

199
Singapore
1995 2005 2016
The setting Population, total (mill.) 3.5 4.5 5.7
Rural population, total (mill.) 0.0 0.0 0.0
Govt. expenditure on agric. (% total outlays) 0.2 0.3
Area harvested, crops (mill. ha) 0.0 0.0 0.0
Cropping intensity ratio 0.4 1.5 2.1
Total renewable water resources per cap. (m³) 164 127 107
Land area equipped for irrigation (1 000 ha) Agric. area actually irrigated (% agric. area) Employment in agriculture (%) 0.2 0.9 0.1
Employment in agriculture, female (%) 0.1 0.6 0.1
Fertilizers use, nitrogen (1 000 t nutrients) 9.1 16.9
Fertilizers use, phosphate (1 000 t nutrients) 0.0 0.0
Fertilizers use, potash (1 000 t nutrients) 0.0 0.0
Agric. value added per worker (constant USD) 32 921 4 420 24 960
Hunger dimensions Average dietary energy supply (kcal/cap/day) Average dietary energy supply adequacy (%) Dietary energy supply, cereals/roots/tubers (%) Prevalence of undernourishment (%) Prevalence of severe food insecurity (%) 0.6
GDP per capita (USD, PPP) 61 974 82 622
Cereal import dependency ratio (%) Stunting, children under 5 (%) Wasting, children under 5 (%) Safely managed drinking water (% pop. using) 100.0 100.0
Food supply Food production value, net (2004–06 mill. I$) 44 24 31
Agriculture, value added (% GDP) 0 0 0
Food (excl. fish) exports (mill. USD) 1 985 1 802 5 042
Food (excl. fish) imports (mill. USD) 3 329 3 280 6 783
Production indices (2004–06 = 100) Food 163 90 115
Crops 32 98 133
Cereals Vegetable oils 201 97 73
Roots and tubers 151 101 140
Fruit and vegetables 32 98 133
Sugar Livestock 184 89 112
Milk Meat 1 264 6 4
Fish 152 87 81
Net trade (mill. USD) Cereals and preparations -167 57 626
Fruit and vegetables -472 -508 -1 260
Meat and meat preparations -241 -423 -853
Dairy products (milk equivalent) -188 -256 -436
Fish 77 -345 -757
Environment Forest area (% total land area) 24 24 23
Agricultural area (% total land area) 2 1 1
Freshwater withdrawal (% tot renewable) Terrestrial protected areas (% total land area) 6
Organic area (ha) Wood pellet production (1 000 t) Emissions in agriculture (CO2 eq. Gg) 81 135 206
Net emissions in land use (CO2 eq. Gg) -18 43 44

200
Slovakia
1995 2005 2016
The setting Population, total (mill.) 5.4 5.4 5.4
Rural population, total (mill.) 2.3 2.4 2.5
Govt. expenditure on agric. (% total outlays) 4.0 1.4
Area harvested, crops (mill. ha) 1.2 1.1 1.1
Cropping intensity ratio 0.7 0.8 0.8
Total renewable water resources per cap. (m³) 9 316 9 292 9 202
Land area equipped for irrigation (1 000 ha) 217 189 64
Agric. area actually irrigated (% agric. area) 1.3 1.2
Employment in agriculture (%) 9.2 4.8 2.9
Employment in agriculture, female (%) 6.4 2.6 1.4
Fertilizers use, nitrogen (1 000 t nutrients) 78.7 126.2
Fertilizers use, phosphate (1 000 t nutrients) 16.9 24.3
Fertilizers use, potash (1 000 t nutrients) 16.5 18.9
Agric. value added per worker (constant USD) 7 705 19 192 50 221
Hunger dimensions Average dietary energy supply (kcal/cap/day) 2 830 3 020
Average dietary energy supply adequacy (%) 110 119
Dietary energy supply, cereals/roots/tubers (%) 37 37
Prevalence of undernourishment (%) 6.2 2.7
Prevalence of severe food insecurity (%) <0.5
GDP per capita (USD, PPP) 20 021 29 212
Cereal import dependency ratio (%) -34.2 -27.7
Stunting, children under 5 (%) Wasting, children under 5 (%) Safely managed drinking water (% pop. using) 93.4 93.4
Food supply Food production value, net (2004–06 mill. I$) 1 662 1 648 1 633
Agriculture, value added (% GDP) 5 3 3
Food (excl. fish) exports (mill. USD) 414 1 208 2 558
Food (excl. fish) imports (mill. USD) 433 1 485 3 338
Production indices (2004–06 = 100) Food 104 103 102
Crops 105 102 119
Cereals 104 105 147
Vegetable oils 52 94 154
Roots and tubers 139 95 55
Fruit and vegetables 129 101 40
Sugar 75 111 96
Livestock 122 101 77
Milk 109 101 87
Meat 131 101 66
Fish 127 94 144
Net trade (mill. USD) Cereals and preparations 124 62 231
Fruit and vegetables -83 -264 -588
Meat and meat preparations -9 -149 -434
Dairy products (milk equivalent) 20 75 -82
Fish -32 -46 -91
Environment Forest area (% total land area) 40 40 40
Agricultural area (% total land area) 51 40 39
Freshwater withdrawal (% tot renewable) 2.6 1.4 1.1
Terrestrial protected areas (% total land area) 37
Organic area (ha) 118 187
Wood pellet production (1 000 t) 82
Emissions in agriculture (CO2 eq. Gg) 3 430 2 429 2 438
Net emissions in land use (CO2 eq. Gg) -9 893 -9 197 -5 089

201
Slovenia
1995 2005 2016
The setting Population, total (mill.) 2.0 2.0 2.1
Rural population, total (mill.) 1.0 1.0 1.1
Govt. expenditure on agric. (% total outlays) 2.2 1.7
Area harvested, crops (mill. ha) 0.2 0.1 0.1
Cropping intensity ratio 0.7 0.7 0.6
Total renewable water resources per cap. (m³) 16 031 15 801 15 338
Land area equipped for irrigation (1 000 ha) 2 5 6
Agric. area actually irrigated (% agric. area) 0.4 0.5
Employment in agriculture (%) 10.4 9.1 5.0
Employment in agriculture, female (%) 10.7 9.1 4.2
Fertilizers use, nitrogen (1 000 t nutrients) 28.9 27.1
Fertilizers use, phosphate (1 000 t nutrients) 13.2 9.2
Fertilizers use, potash (1 000 t nutrients) 16.0 11.4
Agric. value added per worker (constant USD) 8 814 9 872 20 790
Hunger dimensions Average dietary energy supply (kcal/cap/day) 3 116 3 168
Average dietary energy supply adequacy (%) 123 127
Dietary energy supply, cereals/roots/tubers (%) 36 39
Prevalence of undernourishment (%) <2.5 <2.5
Prevalence of severe food insecurity (%) GDP per capita (USD, PPP) 26 956 29 930
Cereal import dependency ratio (%) 46.9 36.9
Stunting, children under 5 (%) Wasting, children under 5 (%) Safely managed drinking water (% pop. using) 82.3 98.0
Food supply Food production value, net (2004–06 mill. I$) 683 713 642
Agriculture, value added (% GDP) 4 2 2
Food (excl. fish) exports (mill. USD) 231 421 1 201
Food (excl. fish) imports (mill. USD) 559 931 1 883
Production indices (2004–06 = 100) Food 94 98 89
Crops 93 100 86
Cereals 93 105 116
Vegetable oils 27 110 169
Roots and tubers 158 107 59
Fruit and vegetables 82 96 77
Sugar 108 106 Livestock 94 98 90
Milk 85 99 102
Meat 100 98 79
Fish 116 101 84
Net trade (mill. USD) Cereals and preparations -93 -114 -149
Fruit and vegetables -102 -210 -272
Meat and meat preparations 4 -29 -105
Dairy products (milk equivalent) 26 25 -5
Fish -22 -39 -73
Environment Forest area (% total land area) 60 62 62
Agricultural area (% total land area) 27 25 31
Freshwater withdrawal (% tot renewable) 2.9 3.6
Terrestrial protected areas (% total land area) 54
Organic area (ha) 23 44
Wood pellet production (1 000 t) 115
Emissions in agriculture (CO2 eq. Gg) 1 770 1 524 1 486
Net emissions in land use (CO2 eq. Gg) -6 831 -10 351 -6 244

202
Solomon Islands
1995 2005 2016
The setting Population, total (mill.) 0.4 0.5 0.6
Rural population, total (mill.) 0.3 0.4 0.5
Govt. expenditure on agric. (% total outlays) 3.7
Area harvested, crops (mill. ha) 0.1 0.1 0.1
Cropping intensity ratio 1.0 1.1 1.1
Total renewable water resources per cap. (m³) 117 663 90 835 74 572
Land area equipped for irrigation (1 000 ha) Agric. area actually irrigated (% agric. area) Employment in agriculture (%) 70.6 71.2 68.7
Employment in agriculture, female (%) 72.7 73.3 70.5
Fertilizers use, nitrogen (1 000 t nutrients) Fertilizers use, phosphate (1 000 t nutrients) Fertilizers use, potash (1 000 t nutrients) Agric. value added per worker (constant USD) Hunger dimensions Average dietary energy supply (kcal/cap/day) 2 429 2 452
Average dietary energy supply adequacy (%) 114 113
Dietary energy supply, cereals/roots/tubers (%) 67 68
Prevalence of undernourishment (%) 11.9 12.3
Prevalence of severe food insecurity (%) GDP per capita (USD, PPP) 1 681 2 179
Cereal import dependency ratio (%) 96.1 93.4
Stunting, children under 5 (%) 32.8 31.6
Wasting, children under 5 (%) 4.3 7.9
Safely managed drinking water (% pop. using) Food supply Food production value, net (2004–06 mill. I$) 80 106 116
Agriculture, value added (% GDP) 42 30 28
Food (excl. fish) exports (mill. USD) 36 27 56
Food (excl. fish) imports (mill. USD) 14 36 91
Production indices (2004–06 = 100) Food 78 103 112
Crops 77 103 113
Cereals 92 102 94
Vegetable oils 84 101 110
Roots and tubers 70 103 123
Fruit and vegetables 69 98 122
Sugar Livestock 88 100 106
Milk 96 99 109
Meat 88 100 104
Fish 183 86 190
Net trade (mill. USD) Cereals and preparations -8 -23 -49
Fruit and vegetables 0 -1 -3
Meat and meat preparations -15
Dairy products (milk equivalent) -3
Fish 43 11 73
Environment Forest area (% total land area) 82 80 78
Agricultural area (% total land area) 3 3 4
Freshwater withdrawal (% tot renewable) Terrestrial protected areas (% total land area) 2
Organic area (ha) 4 6
Wood pellet production (1 000 t) Emissions in agriculture (CO2 eq. Gg) 54 58 65
Net emissions in land use (CO2 eq. Gg) 1 687 1 687 1 980

203
Somalia
1995 2005 2016
The setting Population, total (mill.) 7.7 10.4 14.7
Rural population, total (mill.) 4.4 5.5 7.0
Govt. expenditure on agric. (% total outlays) Area harvested, crops (mill. ha) 0.8 0.8 0.5
Cropping intensity ratio 0.7 0.6 0.5
Total renewable water resources per cap. (m³) 2 203 1 650 1 027
Land area equipped for irrigation (1 000 ha) 200 200 200
Agric. area actually irrigated (% agric. area) Employment in agriculture (%) 86.9 86.7 86.2
Employment in agriculture, female (%) 92.4 92.4 91.9
Fertilizers use, nitrogen (1 000 t nutrients) Fertilizers use, phosphate (1 000 t nutrients) Fertilizers use, potash (1 000 t nutrients) Agric. value added per worker (constant USD) Hunger dimensions Average dietary energy supply (kcal/cap/day) 1 718 1 888
Average dietary energy supply adequacy (%) 80 87
Dietary energy supply, cereals/roots/tubers (%) Prevalence of undernourishment (%) Prevalence of severe food insecurity (%) GDP per capita (USD, PPP) Cereal import dependency ratio (%) Stunting, children under 5 (%) 42.1 Wasting, children under 5 (%) 13.2 Safely managed drinking water (% pop. using) Food supply Food production value, net (2004–06 mill. I$) 1 379 1 615 1 691
Agriculture, value added (% GDP) 62 53 53
Food (excl. fish) exports (mill. USD) 111 110 478
Food (excl. fish) imports (mill. USD) 79 258 1 129
Production indices (2004–06 = 100) Food 88 103 108
Crops 85 102 91
Cereals 84 108 41
Vegetable oils 86 102 97
Roots and tubers 55 101 112
Fruit and vegetables 89 100 107
Sugar 109 82 115
Livestock 88 103 110
Milk 99 104 99
Meat 76 103 124
Fish 114 88 106
Net trade (mill. USD) Cereals and preparations -38 -106 -328
Fruit and vegetables 9 -10 -33
Meat and meat preparations 0 0 -3
Dairy products (milk equivalent) -4 -1 -83
Fish 10 4 -9
Environment Forest area (% total land area) 13 11 10
Agricultural area (% total land area) 70 71 70
Freshwater withdrawal (% tot renewable) 22.4 Terrestrial protected areas (% total land area) 1
Organic area (ha) 0 Wood pellet production (1 000 t) Emissions in agriculture (CO2 eq. Gg) 19 792 22 185 20 199
Net emissions in land use (CO2 eq. Gg) 15 767 17 600 13 201
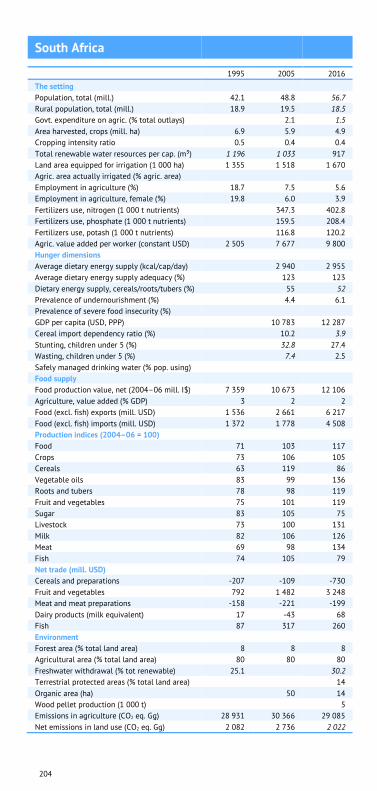
204
South Africa
1995 2005 2016
The setting Population, total (mill.) 42.1 48.8 56.7
Rural population, total (mill.) 18.9 19.5 18.5
Govt. expenditure on agric. (% total outlays) 2.1 1.5
Area harvested, crops (mill. ha) 6.9 5.9 4.9
Cropping intensity ratio 0.5 0.4 0.4
Total renewable water resources per cap. (m³) 1 196 1 033 917
Land area equipped for irrigation (1 000 ha) 1 355 1 518 1 670
Agric. area actually irrigated (% agric. area) Employment in agriculture (%) 18.7 7.5 5.6
Employment in agriculture, female (%) 19.8 6.0 3.9
Fertilizers use, nitrogen (1 000 t nutrients) 347.3 402.8
Fertilizers use, phosphate (1 000 t nutrients) 159.5 208.4
Fertilizers use, potash (1 000 t nutrients) 116.8 120.2
Agric. value added per worker (constant USD) 2 505 7 677 9 800
Hunger dimensions Average dietary energy supply (kcal/cap/day) 2 940 2 955
Average dietary energy supply adequacy (%) 123 123
Dietary energy supply, cereals/roots/tubers (%) 55 52
Prevalence of undernourishment (%) 4.4 6.1
Prevalence of severe food insecurity (%) GDP per capita (USD, PPP) 10 783 12 287
Cereal import dependency ratio (%) 10.2 3.9
Stunting, children under 5 (%) 32.8 27.4
Wasting, children under 5 (%) 7.4 2.5
Safely managed drinking water (% pop. using) Food supply Food production value, net (2004–06 mill. I$) 7 359 10 673 12 106
Agriculture, value added (% GDP) 3 2 2
Food (excl. fish) exports (mill. USD) 1 536 2 661 6 217
Food (excl. fish) imports (mill. USD) 1 372 1 778 4 508
Production indices (2004–06 = 100) Food 71 103 117
Crops 73 106 105
Cereals 63 119 86
Vegetable oils 83 99 136
Roots and tubers 78 98 119
Fruit and vegetables 75 101 119
Sugar 83 105 75
Livestock 73 100 131
Milk 82 106 126
Meat 69 98 134
Fish 74 105 79
Net trade (mill. USD) Cereals and preparations -207 -109 -730
Fruit and vegetables 792 1 482 3 248
Meat and meat preparations -158 -221 -199
Dairy products (milk equivalent) 17 -43 68
Fish 87 317 260
Environment Forest area (% total land area) 8 8 8
Agricultural area (% total land area) 80 80 80
Freshwater withdrawal (% tot renewable) 25.1 30.2
Terrestrial protected areas (% total land area) 14
Organic area (ha) 50 14
Wood pellet production (1 000 t) 5
Emissions in agriculture (CO2 eq. Gg) 28 931 30 366 29 085
Net emissions in land use (CO2 eq. Gg) 2 082 2 736 2 022
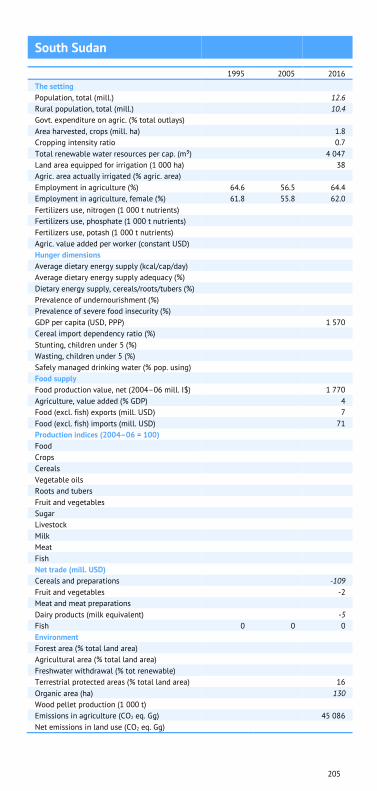
205
South Sudan
1995 2005 2016
The setting Population, total (mill.) 12.6
Rural population, total (mill.) 10.4
Govt. expenditure on agric. (% total outlays) Area harvested, crops (mill. ha) 1.8
Cropping intensity ratio 0.7
Total renewable water resources per cap. (m³) 4 047
Land area equipped for irrigation (1 000 ha) 38
Agric. area actually irrigated (% agric. area) Employment in agriculture (%) 64.6 56.5 64.4
Employment in agriculture, female (%) 61.8 55.8 62.0
Fertilizers use, nitrogen (1 000 t nutrients) Fertilizers use, phosphate (1 000 t nutrients) Fertilizers use, potash (1 000 t nutrients) Agric. value added per worker (constant USD) Hunger dimensions Average dietary energy supply (kcal/cap/day) Average dietary energy supply adequacy (%) Dietary energy supply, cereals/roots/tubers (%) Prevalence of undernourishment (%) Prevalence of severe food insecurity (%) GDP per capita (USD, PPP) 1 570
Cereal import dependency ratio (%) Stunting, children under 5 (%) Wasting, children under 5 (%) Safely managed drinking water (% pop. using) Food supply Food production value, net (2004–06 mill. I$) 1 770
Agriculture, value added (% GDP) 4
Food (excl. fish) exports (mill. USD) 7
Food (excl. fish) imports (mill. USD) 71
Production indices (2004–06 = 100) Food Crops Cereals Vegetable oils Roots and tubers Fruit and vegetables Sugar Livestock Milk Meat Fish Net trade (mill. USD) Cereals and preparations -109
Fruit and vegetables -2
Meat and meat preparations Dairy products (milk equivalent) -5
Fish 0 0 0
Environment Forest area (% total land area) Agricultural area (% total land area) Freshwater withdrawal (% tot renewable) Terrestrial protected areas (% total land area) 16
Organic area (ha) 130
Wood pellet production (1 000 t) Emissions in agriculture (CO2 eq. Gg) 45 086
Net emissions in land use (CO2 eq. Gg)
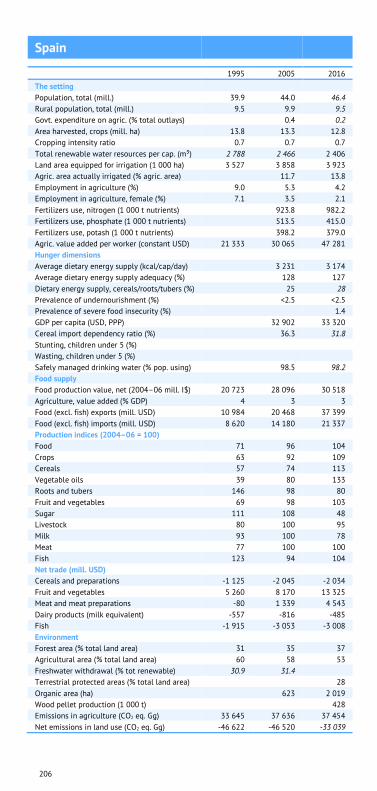
206
Spain
1995 2005 2016
The setting Population, total (mill.) 39.9 44.0 46.4
Rural population, total (mill.) 9.5 9.9 9.5
Govt. expenditure on agric. (% total outlays) 0.4 0.2
Area harvested, crops (mill. ha) 13.8 13.3 12.8
Cropping intensity ratio 0.7 0.7 0.7
Total renewable water resources per cap. (m³) 2 788 2 466 2 406
Land area equipped for irrigation (1 000 ha) 3 527 3 858 3 923
Agric. area actually irrigated (% agric. area) 11.7 13.8
Employment in agriculture (%) 9.0 5.3 4.2
Employment in agriculture, female (%) 7.1 3.5 2.1
Fertilizers use, nitrogen (1 000 t nutrients) 923.8 982.2
Fertilizers use, phosphate (1 000 t nutrients) 513.5 415.0
Fertilizers use, potash (1 000 t nutrients) 398.2 379.0
Agric. value added per worker (constant USD) 21 333 30 065 47 281
Hunger dimensions Average dietary energy supply (kcal/cap/day) 3 231 3 174
Average dietary energy supply adequacy (%) 128 127
Dietary energy supply, cereals/roots/tubers (%) 25 28
Prevalence of undernourishment (%) <2.5 <2.5
Prevalence of severe food insecurity (%) 1.4
GDP per capita (USD, PPP) 32 902 33 320
Cereal import dependency ratio (%) 36.3 31.8
Stunting, children under 5 (%) Wasting, children under 5 (%) Safely managed drinking water (% pop. using) 98.5 98.2
Food supply Food production value, net (2004–06 mill. I$) 20 723 28 096 30 518
Agriculture, value added (% GDP) 4 3 3
Food (excl. fish) exports (mill. USD) 10 984 20 468 37 399
Food (excl. fish) imports (mill. USD) 8 620 14 180 21 337
Production indices (2004–06 = 100) Food 71 96 104
Crops 63 92 109
Cereals 57 74 113
Vegetable oils 39 80 133
Roots and tubers 146 98 80
Fruit and vegetables 69 98 103
Sugar 111 108 48
Livestock 80 100 95
Milk 93 100 78
Meat 77 100 100
Fish 123 94 104
Net trade (mill. USD) Cereals and preparations -1 125 -2 045 -2 034
Fruit and vegetables 5 260 8 170 13 325
Meat and meat preparations -80 1 339 4 543
Dairy products (milk equivalent) -557 -816 -485
Fish -1 915 -3 053 -3 008
Environment Forest area (% total land area) 31 35 37
Agricultural area (% total land area) 60 58 53
Freshwater withdrawal (% tot renewable) 30.9 31.4 Terrestrial protected areas (% total land area) 28
Organic area (ha) 623 2 019
Wood pellet production (1 000 t) 428
Emissions in agriculture (CO2 eq. Gg) 33 645 37 636 37 454
Net emissions in land use (CO2 eq. Gg) -46 622 -46 520 -33 039

207
Sri Lanka
1995 2005 2016
The setting Population, total (mill.) 18.2 19.5 20.9
Rural population, total (mill.) 14.9 16.3 17.9
Govt. expenditure on agric. (% total outlays) 4.0 5.6
Area harvested, crops (mill. ha) 2.2 2.1 2.3
Cropping intensity ratio 1.1 1.0 1.0
Total renewable water resources per cap. (m³) 2 857 2 665 2 539
Land area equipped for irrigation (1 000 ha) 570 570 633
Agric. area actually irrigated (% agric. area) Employment in agriculture (%) 39.6 33.8 27.5
Employment in agriculture, female (%) 42.3 37.8 30.8
Fertilizers use, nitrogen (1 000 t nutrients) 181.6 117.8
Fertilizers use, phosphate (1 000 t nutrients) 36.9 34.9
Fertilizers use, potash (1 000 t nutrients) 62.4 18.8
Agric. value added per worker (constant USD) 1 369 1 445 2 509
Hunger dimensions Average dietary energy supply (kcal/cap/day) 2 358 2 577
Average dietary energy supply adequacy (%) 102 112
Dietary energy supply, cereals/roots/tubers (%) 58 56
Prevalence of undernourishment (%) 18.2 10.9
Prevalence of severe food insecurity (%) GDP per capita (USD, PPP) 6 476 11 446
Cereal import dependency ratio (%) 37.2 26.0
Stunting, children under 5 (%) 17.3 17.3
Wasting, children under 5 (%) 14.7 15.1
Safely managed drinking water (% pop. using) Food supply Food production value, net (2004–06 mill. I$) 1 887 1 990 2 553
Agriculture, value added (% GDP) 12 8 8
Food (excl. fish) exports (mill. USD) 133 253 893
Food (excl. fish) imports (mill. USD) 556 831 1 729
Production indices (2004–06 = 100) Food 97 102 131
Crops 95 102 131
Cereals 91 106 139
Vegetable oils 106 90 147
Roots and tubers 121 100 122
Fruit and vegetables 103 103 127
Sugar 122 95 72
Livestock 102 104 113
Milk 170 100 106
Meat 84 106 107
Fish 85 79 197
Net trade (mill. USD) Cereals and preparations -195 -225 -271
Fruit and vegetables -17 -17 -120
Meat and meat preparations -2 -2 -1
Dairy products (milk equivalent) -83 -132 -247
Fish -2 30 -66
Environment Forest area (% total land area) 36 34 33
Agricultural area (% total land area) 37 40 44
Freshwater withdrawal (% tot renewable) 24.5 Terrestrial protected areas (% total land area) 30
Organic area (ha) 10 96
Wood pellet production (1 000 t) Emissions in agriculture (CO2 eq. Gg) 6 278 5 561 6 149
Net emissions in land use (CO2 eq. Gg) 5 182 6 421 4 459
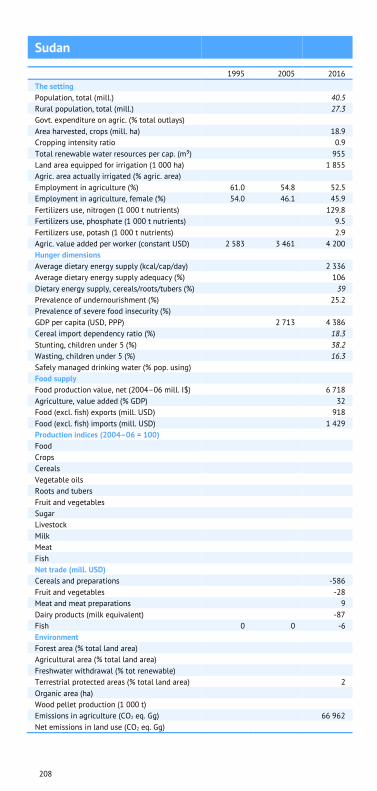
208
Sudan
1995 2005 2016
The setting Population, total (mill.) 40.5
Rural population, total (mill.) 27.3
Govt. expenditure on agric. (% total outlays) Area harvested, crops (mill. ha) 18.9
Cropping intensity ratio 0.9
Total renewable water resources per cap. (m³) 955
Land area equipped for irrigation (1 000 ha) 1 855
Agric. area actually irrigated (% agric. area) Employment in agriculture (%) 61.0 54.8 52.5
Employment in agriculture, female (%) 54.0 46.1 45.9
Fertilizers use, nitrogen (1 000 t nutrients) 129.8
Fertilizers use, phosphate (1 000 t nutrients) 9.5
Fertilizers use, potash (1 000 t nutrients) 2.9
Agric. value added per worker (constant USD) 2 583 3 461 4 200
Hunger dimensions Average dietary energy supply (kcal/cap/day) 2 336
Average dietary energy supply adequacy (%) 106
Dietary energy supply, cereals/roots/tubers (%) 39
Prevalence of undernourishment (%) 25.2
Prevalence of severe food insecurity (%) GDP per capita (USD, PPP) 2 713 4 386
Cereal import dependency ratio (%) 18.3
Stunting, children under 5 (%) 38.2
Wasting, children under 5 (%) 16.3
Safely managed drinking water (% pop. using) Food supply Food production value, net (2004–06 mill. I$) 6 718
Agriculture, value added (% GDP) 32
Food (excl. fish) exports (mill. USD) 918
Food (excl. fish) imports (mill. USD) 1 429
Production indices (2004–06 = 100) Food Crops Cereals Vegetable oils Roots and tubers Fruit and vegetables Sugar Livestock Milk Meat Fish Net trade (mill. USD) Cereals and preparations -586
Fruit and vegetables -28
Meat and meat preparations 9
Dairy products (milk equivalent) -87
Fish 0 0 -6
Environment Forest area (% total land area) Agricultural area (% total land area) Freshwater withdrawal (% tot renewable) Terrestrial protected areas (% total land area) 2
Organic area (ha) Wood pellet production (1 000 t) Emissions in agriculture (CO2 eq. Gg) 66 962
Net emissions in land use (CO2 eq. Gg)

209
Suriname
1995 2005 2016
The setting Population, total (mill.) 0.4 0.5 0.6
Rural population, total (mill.) 0.1 0.2 0.2
Govt. expenditure on agric. (% total outlays) Area harvested, crops (mill. ha) 0.1 0.1 0.1
Cropping intensity ratio 1.1 1.0 1.0
Total renewable water resources per cap. (m³) 214 471 197 605 177 302
Land area equipped for irrigation (1 000 ha) 49 55 60
Agric. area actually irrigated (% agric. area) Employment in agriculture (%) 6.0 7.0 2.6
Employment in agriculture, female (%) 1.8 3.8 1.0
Fertilizers use, nitrogen (1 000 t nutrients) 4.2 12.2
Fertilizers use, phosphate (1 000 t nutrients) 0.3 1.1
Fertilizers use, potash (1 000 t nutrients) 0.7 0.9
Agric. value added per worker (constant USD) 35 902 27 544 93 719
Hunger dimensions Average dietary energy supply (kcal/cap/day) 2 601 2 780
Average dietary energy supply adequacy (%) 111 117
Dietary energy supply, cereals/roots/tubers (%) 43 42
Prevalence of undernourishment (%) 10.9 7.6
Prevalence of severe food insecurity (%) GDP per capita (USD, PPP) 12 168 13 878
Cereal import dependency ratio (%) 21.6 -4.6
Stunting, children under 5 (%) 10.7 Wasting, children under 5 (%) 4.9 Safely managed drinking water (% pop. using) Food supply Food production value, net (2004–06 mill. I$) 104 86 138
Agriculture, value added (% GDP) 30 11 9
Food (excl. fish) exports (mill. USD) 45 27 74
Food (excl. fish) imports (mill. USD) 51 89 162
Production indices (2004–06 = 100) Food 118 98 157
Crops 122 97 153
Cereals 125 94 162
Vegetable oils 283 97 130
Roots and tubers 144 100 150
Fruit and vegetables 109 105 136
Sugar 138 81 145
Livestock 92 102 125
Milk 127 100 64
Meat 76 101 122
Fish 45 94 149
Net trade (mill. USD) Cereals and preparations 24 -7 -12
Fruit and vegetables 7 5 19
Meat and meat preparations -3 -19 -30
Dairy products (milk equivalent) -8 -13
Fish 39 42 91
Environment Forest area (% total land area) 99 99 98
Agricultural area (% total land area) 1 0 1
Freshwater withdrawal (% tot renewable) 0.6 Terrestrial protected areas (% total land area) 15
Organic area (ha) 0
Wood pellet production (1 000 t) Emissions in agriculture (CO2 eq. Gg) 847 649 766
Net emissions in land use (CO2 eq. Gg) 4 523 4 154 4 549

210
Sweden
1995 2005 2016
The setting Population, total (mill.) 8.8 9.0 9.9
Rural population, total (mill.) 1.4 1.4 1.4
Govt. expenditure on agric. (% total outlays) 0.7 0.4
Area harvested, crops (mill. ha) 1.3 1.3 1.2
Cropping intensity ratio 0.5 0.5 0.5
Total renewable water resources per cap. (m³) 19 641 19 010 17 687
Land area equipped for irrigation (1 000 ha) 123 167 155
Agric. area actually irrigated (% agric. area) 1.5 1.7
Employment in agriculture (%) 3.1 2.0 1.9
Employment in agriculture, female (%) 1.5 0.9 1.0
Fertilizers use, nitrogen (1 000 t nutrients) 161.5 186.0
Fertilizers use, phosphate (1 000 t nutrients) 35.3 30.0
Fertilizers use, potash (1 000 t nutrients) 40.0 32.0
Agric. value added per worker (constant USD) 44 798 74 836 82 161
Hunger dimensions Average dietary energy supply (kcal/cap/day) 3 120 3 179
Average dietary energy supply adequacy (%) 122 126
Dietary energy supply, cereals/roots/tubers (%) 28 27
Prevalence of undernourishment (%) <2.5 <2.5
Prevalence of severe food insecurity (%) 1.0
GDP per capita (USD, PPP) 41 227 46 568
Cereal import dependency ratio (%) -22.8 -12.0
Stunting, children under 5 (%) Wasting, children under 5 (%) Safely managed drinking water (% pop. using) 98.0 98.0
Food supply Food production value, net (2004–06 mill. I$) 2 738 2 800 2 787
Agriculture, value added (% GDP) 2 1 1
Food (excl. fish) exports (mill. USD) 1 087 2 505 3 512
Food (excl. fish) imports (mill. USD) 2 451 4 801 8 132
Production indices (2004–06 = 100) Food 98 100 100
Crops 94 103 115
Cereals 93 104 114
Vegetable oils 88 94 125
Roots and tubers 115 106 96
Fruit and vegetables 77 98 113
Sugar 108 104 87
Livestock 103 99 93
Milk 103 100 89
Meat 103 99 92
Fish 152 97 83
Net trade (mill. USD) Cereals and preparations 8 82 137
Fruit and vegetables -976 -1 460 -2 216
Meat and meat preparations -187 -685 -1 178
Dairy products (milk equivalent) 0 -149 -618
Fish -146 -418 -769
Environment Forest area (% total land area) 69 69 69
Agricultural area (% total land area) 8 8 7
Freshwater withdrawal (% tot renewable) 1.6 1.5 Terrestrial protected areas (% total land area) 14
Organic area (ha) 223 553
Wood pellet production (1 000 t) 1 738
Emissions in agriculture (CO2 eq. Gg) 7 625 6 821 6 584
Net emissions in land use (CO2 eq. Gg) -19 887 -51 116 -4 216

211
Switzerland
1995 2005 2016
The setting Population, total (mill.) 7.0 7.4 8.5
Rural population, total (mill.) 1.9 2.0 2.2
Govt. expenditure on agric. (% total outlays) 4.1 3.4
Area harvested, crops (mill. ha) 0.3 0.3 0.2
Cropping intensity ratio 0.7 0.6 0.6
Total renewable water resources per cap. (m³) 7 546 7 077 6 368
Land area equipped for irrigation (1 000 ha) 25 50 63
Agric. area actually irrigated (% agric. area) 2.2
Employment in agriculture (%) 4.5 3.9 3.4
Employment in agriculture, female (%) 3.7 2.8 2.9
Fertilizers use, nitrogen (1 000 t nutrients) 53.3 52.9
Fertilizers use, phosphate (1 000 t nutrients) 15.8 14.6
Fertilizers use, potash (1 000 t nutrients) 23.5 18.0
Agric. value added per worker (constant USD) 24 398 25 761 25 270
Hunger dimensions Average dietary energy supply (kcal/cap/day) 3 410 3 376
Average dietary energy supply adequacy (%) 133 131
Dietary energy supply, cereals/roots/tubers (%) 23 22
Prevalence of undernourishment (%) <2.5 <2.5
Prevalence of severe food insecurity (%) 1.3
GDP per capita (USD, PPP) 52 771 57 422
Cereal import dependency ratio (%) 40.8 54.7
Stunting, children under 5 (%) Wasting, children under 5 (%) Safely managed drinking water (% pop. using) 93.3 95.5
Food supply Food production value, net (2004–06 mill. I$) 2 444 2 389 2 493
Agriculture, value added (% GDP) 1 1 1
Food (excl. fish) exports (mill. USD) 1 668 2 288 3 693
Food (excl. fish) imports (mill. USD) 3 193 4 271 7 025
Production indices (2004–06 = 100) Food 101 99 103
Crops 104 97 92
Cereals 117 100 70
Vegetable oils 69 101 116
Roots and tubers 118 104 80
Fruit and vegetables 105 93 102
Sugar 60 103 93
Livestock 102 99 106
Milk 99 99 104
Meat 104 100 107
Fish 95 102 124
Net trade (mill. USD) Cereals and preparations -170 -156 -330
Fruit and vegetables -1 213 -1 418 -2 386
Meat and meat preparations -404 -531 -773
Dairy products (milk equivalent) 227 199 253
Fish -411 -459 -787
Environment Forest area (% total land area) 30 31 32
Agricultural area (% total land area) 40 39 38
Freshwater withdrawal (% tot renewable) 4.8 4.7 Terrestrial protected areas (% total land area) 10
Organic area (ha) 117 141
Wood pellet production (1 000 t) 183
Emissions in agriculture (CO2 eq. Gg) 5 868 5 241 5 026
Net emissions in land use (CO2 eq. Gg) -1 919 -1 552 -1 552

212
Syrian Arab Republic
1995 2005 2016
The setting Population, total (mill.) 14.3 18.3 18.3
Rural population, total (mill.) 7.2 8.4 9.7
Govt. expenditure on agric. (% total outlays) 5.4 Area harvested, crops (mill. ha) 5.0 4.9 4.1
Cropping intensity ratio 0.9 0.9 0.7
Total renewable water resources per cap. (m³) 1 109 865 912
Land area equipped for irrigation (1 000 ha) 1 089 1 428 1 310
Agric. area actually irrigated (% agric. area) 10.3 9.4
Employment in agriculture (%) 28.4 21.2 22.8
Employment in agriculture, female (%) 60.2 33.2 22.1
Fertilizers use, nitrogen (1 000 t nutrients) 266.4 27.1
Fertilizers use, phosphate (1 000 t nutrients) 121.9 6.5
Fertilizers use, potash (1 000 t nutrients) 8.8 1.5
Agric. value added per worker (constant USD) Hunger dimensions Average dietary energy supply (kcal/cap/day) 3 091 3 090
Average dietary energy supply adequacy (%) 136 134
Dietary energy supply, cereals/roots/tubers (%) Prevalence of undernourishment (%) Prevalence of severe food insecurity (%) GDP per capita (USD, PPP) Cereal import dependency ratio (%) Stunting, children under 5 (%) 28.6 Wasting, children under 5 (%) 10.3 Safely managed drinking water (% pop. using) Food supply Food production value, net (2004–06 mill. I$) 3 845 6 136 5 295
Agriculture, value added (% GDP) 28 20 21
Food (excl. fish) exports (mill. USD) 469 617 348
Food (excl. fish) imports (mill. USD) 580 1 253 1 452
Production indices (2004–06 = 100) Food 62 99 85
Crops 67 100 78
Cereals 98 98 62
Vegetable oils 50 74 83
Roots and tubers 81 105 109
Fruit and vegetables 75 98 94
Sugar 112 88 61
Livestock 57 99 82
Milk 60 101 95
Meat 54 99 78
Fish 68 99 41
Net trade (mill. USD) Cereals and preparations -44 -354 -345
Fruit and vegetables 183 -17 -38
Meat and meat preparations -7 -1 -23
Dairy products (milk equivalent) -25 -65 -59
Fish -62 -23 -36
Environment Forest area (% total land area) 2 3 3
Agricultural area (% total land area) 75 75 76
Freshwater withdrawal (% tot renewable) 85.9 84.2 Terrestrial protected areas (% total land area) 1
Organic area (ha) 26 20
Wood pellet production (1 000 t) Emissions in agriculture (CO2 eq. Gg) 6 010 8 154 6 423
Net emissions in land use (CO2 eq. Gg) -1 533 -1 551 -1 212

213
Tajikistan
1995 2005 2016
The setting Population, total (mill.) 5.8 6.9 8.9
Rural population, total (mill.) 4.1 5.0 6.6
Govt. expenditure on agric. (% total outlays) Area harvested, crops (mill. ha) 0.7 0.9 0.8
Cropping intensity ratio 0.7 1.0 1.0
Total renewable water resources per cap. (m³) 3 690 3 086 2 508
Land area equipped for irrigation (1 000 ha) 719 728 742
Agric. area actually irrigated (% agric. area) 15.1 Employment in agriculture (%) 60.9 56.7 50.7
Employment in agriculture, female (%) 78.5 75.1 68.8
Fertilizers use, nitrogen (1 000 t nutrients) 28.6 56.7
Fertilizers use, phosphate (1 000 t nutrients) 0.0 2.4
Fertilizers use, potash (1 000 t nutrients) 0.0 0.3
Agric. value added per worker (constant USD) 453 621 1 002
Hunger dimensions Average dietary energy supply (kcal/cap/day) 2 034 2 213
Average dietary energy supply adequacy (%) 89 97
Dietary energy supply, cereals/roots/tubers (%) 66 58
Prevalence of undernourishment (%) Prevalence of severe food insecurity (%) 7.8
GDP per capita (USD, PPP) 1 707 2 763
Cereal import dependency ratio (%) 44.2 47.1
Stunting, children under 5 (%) 33.1 Wasting, children under 5 (%) 8.7 Safely managed drinking water (% pop. using) 40.9 47.4
Food supply Food production value, net (2004–06 mill. I$) 638 756 1 214
Agriculture, value added (% GDP) 34 21 21
Food (excl. fish) exports (mill. USD) 21 51 37
Food (excl. fish) imports (mill. USD) 160 238 573
Production indices (2004–06 = 100) Food 82 97 155
Crops 68 98 160
Cereals 25 102 157
Vegetable oils 86 93 93
Roots and tubers 20 101 163
Fruit and vegetables 80 96 234
Sugar Livestock 89 99 128
Milk 98 94 72
Meat 83 104 161
Fish 179 90 722
Net trade (mill. USD) Cereals and preparations -57 -87 -250
Fruit and vegetables 13 37 9
Meat and meat preparations -6 -31
Dairy products (milk equivalent) -2 -15
Fish 0 -1 -2
Environment Forest area (% total land area) 3 3 3
Agricultural area (% total land area) 33 33 34
Freshwater withdrawal (% tot renewable) 52.6 51.1 Terrestrial protected areas (% total land area) 22
Organic area (ha) 0 13
Wood pellet production (1 000 t) Emissions in agriculture (CO2 eq. Gg) 3 114 3 425 5 929
Net emissions in land use (CO2 eq. Gg) 92 0 0
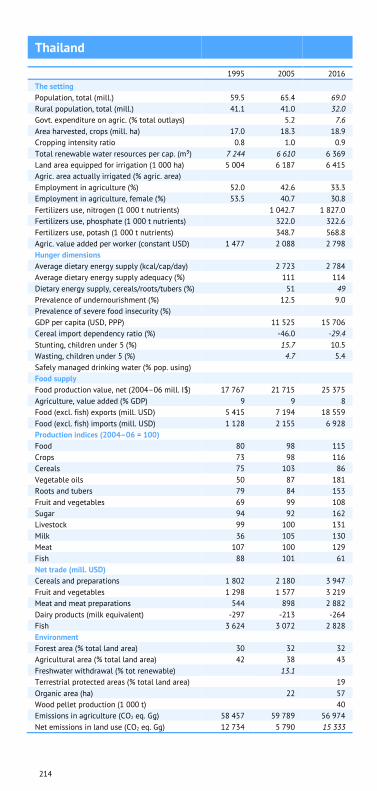
214
Thailand
1995 2005 2016
The setting Population, total (mill.) 59.5 65.4 69.0
Rural population, total (mill.) 41.1 41.0 32.0
Govt. expenditure on agric. (% total outlays) 5.2 7.6
Area harvested, crops (mill. ha) 17.0 18.3 18.9
Cropping intensity ratio 0.8 1.0 0.9
Total renewable water resources per cap. (m³) 7 244 6 610 6 369
Land area equipped for irrigation (1 000 ha) 5 004 6 187 6 415
Agric. area actually irrigated (% agric. area) Employment in agriculture (%) 52.0 42.6 33.3
Employment in agriculture, female (%) 53.5 40.7 30.8
Fertilizers use, nitrogen (1 000 t nutrients) 1 042.7 1 827.0
Fertilizers use, phosphate (1 000 t nutrients) 322.0 322.6
Fertilizers use, potash (1 000 t nutrients) 348.7 568.8
Agric. value added per worker (constant USD) 1 477 2 088 2 798
Hunger dimensions Average dietary energy supply (kcal/cap/day) 2 723 2 784
Average dietary energy supply adequacy (%) 111 114
Dietary energy supply, cereals/roots/tubers (%) 51 49
Prevalence of undernourishment (%) 12.5 9.0
Prevalence of severe food insecurity (%) GDP per capita (USD, PPP) 11 525 15 706
Cereal import dependency ratio (%) -46.0 -29.4
Stunting, children under 5 (%) 15.7 10.5
Wasting, children under 5 (%) 4.7 5.4
Safely managed drinking water (% pop. using) Food supply Food production value, net (2004–06 mill. I$) 17 767 21 715 25 375
Agriculture, value added (% GDP) 9 9 8
Food (excl. fish) exports (mill. USD) 5 415 7 194 18 559
Food (excl. fish) imports (mill. USD) 1 128 2 155 6 928
Production indices (2004–06 = 100) Food 80 98 115
Crops 73 98 116
Cereals 75 103 86
Vegetable oils 50 87 181
Roots and tubers 79 84 153
Fruit and vegetables 69 99 108
Sugar 94 92 162
Livestock 99 100 131
Milk 36 105 130
Meat 107 100 129
Fish 88 101 61
Net trade (mill. USD) Cereals and preparations 1 802 2 180 3 947
Fruit and vegetables 1 298 1 577 3 219
Meat and meat preparations 544 898 2 882
Dairy products (milk equivalent) -297 -213 -264
Fish 3 624 3 072 2 828
Environment Forest area (% total land area) 30 32 32
Agricultural area (% total land area) 42 38 43
Freshwater withdrawal (% tot renewable) 13.1 Terrestrial protected areas (% total land area) 19
Organic area (ha) 22 57
Wood pellet production (1 000 t) 40
Emissions in agriculture (CO2 eq. Gg) 58 457 59 789 56 974
Net emissions in land use (CO2 eq. Gg) 12 734 5 790 15 333

215
Timor-Leste
1995 2005 2016
The setting Population, total (mill.) 0.9 1.0 1.3
Rural population, total (mill.) 0.7 0.7 0.8
Govt. expenditure on agric. (% total outlays) 5.2 2.2
Area harvested, crops (mill. ha) 0.2 0.2 0.2
Cropping intensity ratio 1.1 1.0 0.8
Total renewable water resources per cap. (m³) 9 621 8 046 6 475
Land area equipped for irrigation (1 000 ha) 23 35 35
Agric. area actually irrigated (% agric. area) 7.5 Employment in agriculture (%) 50.9 60.4 24.8
Employment in agriculture, female (%) 53.2 59.8 27.6
Fertilizers use, nitrogen (1 000 t nutrients) Fertilizers use, phosphate (1 000 t nutrients) Fertilizers use, potash (1 000 t nutrients) Agric. value added per worker (constant USD) 1 322 3 047
Hunger dimensions Average dietary energy supply (kcal/cap/day) 2 036 2 131
Average dietary energy supply adequacy (%) 100 102
Dietary energy supply, cereals/roots/tubers (%) 73 67
Prevalence of undernourishment (%) 31.3 27.2
Prevalence of severe food insecurity (%) GDP per capita (USD, PPP) 6 294 7 297
Cereal import dependency ratio (%) 24.9 15.7
Stunting, children under 5 (%) 53.9 50.2
Wasting, children under 5 (%) 24.5 11.0
Safely managed drinking water (% pop. using) Food supply Food production value, net (2004–06 mill. I$) 102 100 118
Agriculture, value added (% GDP) 21 7 7
Food (excl. fish) exports (mill. USD) 0 1 1
Food (excl. fish) imports (mill. USD) 28 30 98
Production indices (2004–06 = 100) Food 102 101 119
Crops 95 102 110
Cereals 101 106 142
Vegetable oils 87 97 97
Roots and tubers 118 96 59
Fruit and vegetables 79 99 147
Sugar Livestock 103 99 114
Milk 124 101 104
Meat 102 100 115
Fish 100 89
Net trade (mill. USD) Cereals and preparations -28
Fruit and vegetables -7 -7 -6
Meat and meat preparations Dairy products (milk equivalent) Fish 0 0 -5
Environment Forest area (% total land area) 61 54 45
Agricultural area (% total land area) 23 26 26
Freshwater withdrawal (% tot renewable) 14.3 Terrestrial protected areas (% total land area) 13
Organic area (ha) 22 28
Wood pellet production (1 000 t) Emissions in agriculture (CO2 eq. Gg) 552 719 896
Net emissions in land use (CO2 eq. Gg) 3 577 6 749 6 102
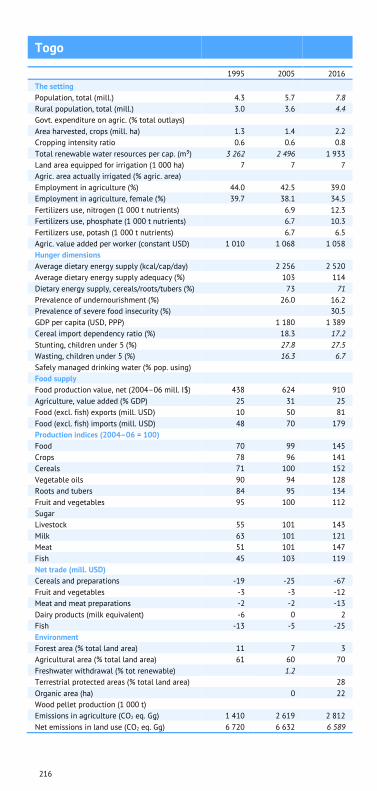
216
Togo
1995 2005 2016
The setting Population, total (mill.) 4.3 5.7 7.8
Rural population, total (mill.) 3.0 3.6 4.4
Govt. expenditure on agric. (% total outlays) Area harvested, crops (mill. ha) 1.3 1.4 2.2
Cropping intensity ratio 0.6 0.6 0.8
Total renewable water resources per cap. (m³) 3 262 2 496 1 933
Land area equipped for irrigation (1 000 ha) 7 7 7
Agric. area actually irrigated (% agric. area) Employment in agriculture (%) 44.0 42.5 39.0
Employment in agriculture, female (%) 39.7 38.1 34.5
Fertilizers use, nitrogen (1 000 t nutrients) 6.9 12.3
Fertilizers use, phosphate (1 000 t nutrients) 6.7 10.3
Fertilizers use, potash (1 000 t nutrients) 6.7 6.5
Agric. value added per worker (constant USD) 1 010 1 068 1 058
Hunger dimensions Average dietary energy supply (kcal/cap/day) 2 256 2 520
Average dietary energy supply adequacy (%) 103 114
Dietary energy supply, cereals/roots/tubers (%) 73 71
Prevalence of undernourishment (%) 26.0 16.2
Prevalence of severe food insecurity (%) 30.5
GDP per capita (USD, PPP) 1 180 1 389
Cereal import dependency ratio (%) 18.3 17.2
Stunting, children under 5 (%) 27.8 27.5
Wasting, children under 5 (%) 16.3 6.7
Safely managed drinking water (% pop. using) Food supply Food production value, net (2004–06 mill. I$) 438 624 910
Agriculture, value added (% GDP) 25 31 25
Food (excl. fish) exports (mill. USD) 10 50 81
Food (excl. fish) imports (mill. USD) 48 70 179
Production indices (2004–06 = 100) Food 70 99 145
Crops 78 96 141
Cereals 71 100 152
Vegetable oils 90 94 128
Roots and tubers 84 95 134
Fruit and vegetables 95 100 112
Sugar Livestock 55 101 143
Milk 63 101 121
Meat 51 101 147
Fish 45 103 119
Net trade (mill. USD) Cereals and preparations -19 -25 -67
Fruit and vegetables -3 -3 -12
Meat and meat preparations -2 -2 -13
Dairy products (milk equivalent) -6 0 2
Fish -13 -5 -25
Environment Forest area (% total land area) 11 7 3
Agricultural area (% total land area) 61 60 70
Freshwater withdrawal (% tot renewable) 1.2 Terrestrial protected areas (% total land area) 28
Organic area (ha) 0 22
Wood pellet production (1 000 t) Emissions in agriculture (CO2 eq. Gg) 1 410 2 619 2 812
Net emissions in land use (CO2 eq. Gg) 6 720 6 632 6 589

217
Tonga
1995 2005 2016
The setting Population, total (mill.) 0.1 0.1 0.1
Rural population, total (mill.) 0.1 0.1 0.1
Govt. expenditure on agric. (% total outlays) Area harvested, crops (mill. ha) 0.0 0.0 0.0
Cropping intensity ratio 0.7 0.8 0.8
Total renewable water resources per cap. (m³) Land area equipped for irrigation (1 000 ha) Agric. area actually irrigated (% agric. area) Employment in agriculture (%) 35.1 31.9 30.0
Employment in agriculture, female (%) 5.1 4.2 3.7
Fertilizers use, nitrogen (1 000 t nutrients) 0.5 0.7
Fertilizers use, phosphate (1 000 t nutrients) 0.8 0.0
Fertilizers use, potash (1 000 t nutrients) 0.1 0.0
Agric. value added per worker (constant USD) 5 458 5 842 5 483
Hunger dimensions Average dietary energy supply (kcal/cap/day) Average dietary energy supply adequacy (%) Dietary energy supply, cereals/roots/tubers (%) Prevalence of undernourishment (%) Prevalence of severe food insecurity (%) GDP per capita (USD, PPP) 4 947 5 327
Cereal import dependency ratio (%) Stunting, children under 5 (%) Wasting, children under 5 (%) Safely managed drinking water (% pop. using) Food supply Food production value, net (2004–06 mill. I$) 22 23 33
Agriculture, value added (% GDP) 20 18 17
Food (excl. fish) exports (mill. USD) 10 5 5
Food (excl. fish) imports (mill. USD) 17 29 45
Production indices (2004–06 = 100) Food 93 97 138
Crops 97 97 142
Cereals Vegetable oils 69 92 216
Roots and tubers 197 100 86
Fruit and vegetables 84 100 101
Sugar Livestock 93 99 107
Milk 48 100 104
Meat 94 99 107
Fish 129 102 78
Net trade (mill. USD) Cereals and preparations -3 -5 -8
Fruit and vegetables 6 3 2
Meat and meat preparations -17 -24
Dairy products (milk equivalent) -5
Fish 1 1 2
Environment Forest area (% total land area) 13 13 13
Agricultural area (% total land area) 46 42 46
Freshwater withdrawal (% tot renewable) Terrestrial protected areas (% total land area) 16
Organic area (ha) 2
Wood pellet production (1 000 t) Emissions in agriculture (CO2 eq. Gg) 62 69 70
Net emissions in land use (CO2 eq. Gg) 0 0 0
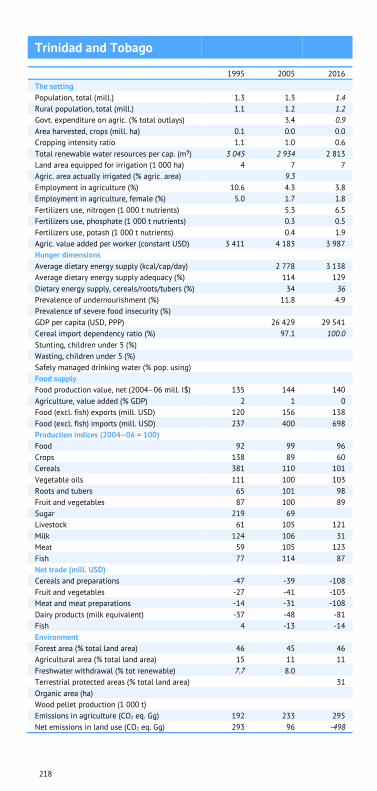
218
Trinidad and Tobago
1995 2005 2016
The setting Population, total (mill.) 1.3 1.3 1.4
Rural population, total (mill.) 1.1 1.2 1.2
Govt. expenditure on agric. (% total outlays) 3.4 0.9
Area harvested, crops (mill. ha) 0.1 0.0 0.0
Cropping intensity ratio 1.1 1.0 0.6
Total renewable water resources per cap. (m³) 3 045 2 934 2 813
Land area equipped for irrigation (1 000 ha) 4 7 7
Agric. area actually irrigated (% agric. area) 9.3 Employment in agriculture (%) 10.6 4.3 3.8
Employment in agriculture, female (%) 5.0 1.7 1.8
Fertilizers use, nitrogen (1 000 t nutrients) 5.3 6.5
Fertilizers use, phosphate (1 000 t nutrients) 0.3 0.5
Fertilizers use, potash (1 000 t nutrients) 0.4 1.9
Agric. value added per worker (constant USD) 3 411 4 183 3 987
Hunger dimensions Average dietary energy supply (kcal/cap/day) 2 778 3 138
Average dietary energy supply adequacy (%) 114 129
Dietary energy supply, cereals/roots/tubers (%) 34 36
Prevalence of undernourishment (%) 11.8 4.9
Prevalence of severe food insecurity (%) GDP per capita (USD, PPP) 26 429 29 541
Cereal import dependency ratio (%) 97.1 100.0
Stunting, children under 5 (%) Wasting, children under 5 (%) Safely managed drinking water (% pop. using) Food supply Food production value, net (2004–06 mill. I$) 135 144 140
Agriculture, value added (% GDP) 2 1 0
Food (excl. fish) exports (mill. USD) 120 156 138
Food (excl. fish) imports (mill. USD) 237 400 698
Production indices (2004–06 = 100) Food 92 99 96
Crops 138 89 60
Cereals 381 110 101
Vegetable oils 111 100 103
Roots and tubers 65 101 98
Fruit and vegetables 87 100 89
Sugar 219 69 Livestock 61 105 121
Milk 124 106 31
Meat 59 105 123
Fish 77 114 87
Net trade (mill. USD) Cereals and preparations -47 -39 -108
Fruit and vegetables -27 -41 -103
Meat and meat preparations -14 -31 -108
Dairy products (milk equivalent) -37 -48 -81
Fish 4 -13 -14
Environment Forest area (% total land area) 46 45 46
Agricultural area (% total land area) 15 11 11
Freshwater withdrawal (% tot renewable) 7.7 8.0 Terrestrial protected areas (% total land area) 31
Organic area (ha) Wood pellet production (1 000 t) Emissions in agriculture (CO2 eq. Gg) 192 233 295
Net emissions in land use (CO2 eq. Gg) 293 96 -498
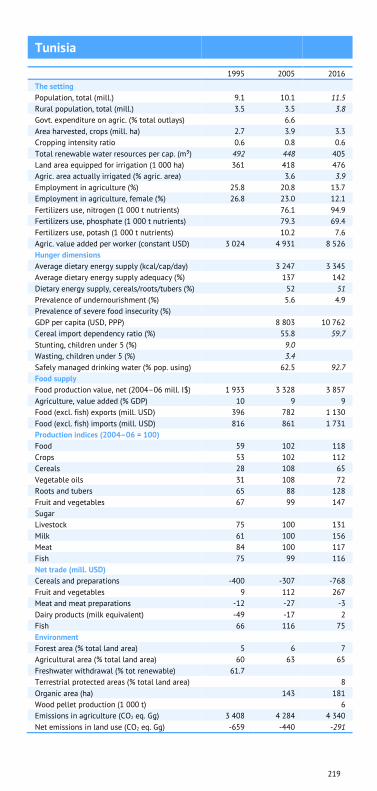
219
Tunisia
1995 2005 2016
The setting Population, total (mill.) 9.1 10.1 11.5
Rural population, total (mill.) 3.5 3.5 3.8
Govt. expenditure on agric. (% total outlays) 6.6 Area harvested, crops (mill. ha) 2.7 3.9 3.3
Cropping intensity ratio 0.6 0.8 0.6
Total renewable water resources per cap. (m³) 492 448 405
Land area equipped for irrigation (1 000 ha) 361 418 476
Agric. area actually irrigated (% agric. area) 3.6 3.9
Employment in agriculture (%) 25.8 20.8 13.7
Employment in agriculture, female (%) 26.8 23.0 12.1
Fertilizers use, nitrogen (1 000 t nutrients) 76.1 94.9
Fertilizers use, phosphate (1 000 t nutrients) 79.3 69.4
Fertilizers use, potash (1 000 t nutrients) 10.2 7.6
Agric. value added per worker (constant USD) 3 024 4 931 8 526
Hunger dimensions Average dietary energy supply (kcal/cap/day) 3 247 3 345
Average dietary energy supply adequacy (%) 137 142
Dietary energy supply, cereals/roots/tubers (%) 52 51
Prevalence of undernourishment (%) 5.6 4.9
Prevalence of severe food insecurity (%) GDP per capita (USD, PPP) 8 803 10 762
Cereal import dependency ratio (%) 55.8 59.7
Stunting, children under 5 (%) 9.0 Wasting, children under 5 (%) 3.4 Safely managed drinking water (% pop. using) 62.5 92.7
Food supply Food production value, net (2004–06 mill. I$) 1 933 3 328 3 857
Agriculture, value added (% GDP) 10 9 9
Food (excl. fish) exports (mill. USD) 396 782 1 130
Food (excl. fish) imports (mill. USD) 816 861 1 731
Production indices (2004–06 = 100) Food 59 102 118
Crops 53 102 112
Cereals 28 108 65
Vegetable oils 31 108 72
Roots and tubers 65 88 128
Fruit and vegetables 67 99 147
Sugar Livestock 75 100 131
Milk 61 100 156
Meat 84 100 117
Fish 75 99 116
Net trade (mill. USD) Cereals and preparations -400 -307 -768
Fruit and vegetables 9 112 267
Meat and meat preparations -12 -27 -3
Dairy products (milk equivalent) -49 -17 2
Fish 66 116 75
Environment Forest area (% total land area) 5 6 7
Agricultural area (% total land area) 60 63 65
Freshwater withdrawal (% tot renewable) 61.7 Terrestrial protected areas (% total land area) 8
Organic area (ha) 143 181
Wood pellet production (1 000 t) 6
Emissions in agriculture (CO2 eq. Gg) 3 408 4 284 4 340
Net emissions in land use (CO2 eq. Gg) -659 -440 -291

220
Turkey
1995 2005 2016
The setting Population, total (mill.) 58.5 67.9 80.7
Rural population, total (mill.) 22.2 21.8 20.1
Govt. expenditure on agric. (% total outlays) 4.1 3.0
Area harvested, crops (mill. ha) 21.0 20.4 17.8
Cropping intensity ratio 0.8 0.8 0.7
Total renewable water resources per cap. (m³) 3 504 3 044 2 661
Land area equipped for irrigation (1 000 ha) 4 186 5 215 5 215
Agric. area actually irrigated (% agric. area) 12.7 13.6
Employment in agriculture (%) 43.4 25.7 19.5
Employment in agriculture, female (%) 70.8 46.2 28.6
Fertilizers use, nitrogen (1 000 t nutrients) 1 372.1 1 896.0
Fertilizers use, phosphate (1 000 t nutrients) 601.6 792.2
Fertilizers use, potash (1 000 t nutrients) 93.8 118.3
Agric. value added per worker (constant USD) 6 058 12 188 15 108
Hunger dimensions Average dietary energy supply (kcal/cap/day) 3 622 3 724
Average dietary energy supply adequacy (%) 155 158
Dietary energy supply, cereals/roots/tubers (%) 51 45
Prevalence of undernourishment (%) <2.5 <2.5
Prevalence of severe food insecurity (%) GDP per capita (USD, PPP) 16 310 23 757
Cereal import dependency ratio (%) -4.8 4.0
Stunting, children under 5 (%) 15.6 9.5
Wasting, children under 5 (%) 1.1 1.7
Safely managed drinking water (% pop. using) Food supply Food production value, net (2004–06 mill. I$) 23 705 29 348 38 811
Agriculture, value added (% GDP) 11 9 6
Food (excl. fish) exports (mill. USD) 3 530 6 612 13 571
Food (excl. fish) imports (mill. USD) 2 031 2 361 7 819
Production indices (2004–06 = 100) Food 82 102 134
Crops 81 102 119
Cereals 78 104 103
Vegetable oils 60 86 130
Roots and tubers 106 92 110
Fruit and vegetables 81 104 127
Sugar 78 106 135
Livestock 87 99 164
Milk 95 99 160
Meat 76 99 174
Fish 106 88 95
Net trade (mill. USD) Cereals and preparations -31 628 1 331
Fruit and vegetables 2 092 4 090 5 637
Meat and meat preparations -60 39 353
Dairy products (milk equivalent) -15 -6 202
Fish 36 142 413
Environment Forest area (% total land area) 13 14 15
Agricultural area (% total land area) 51 54 50
Freshwater withdrawal (% tot renewable) 14.9 18.9 Terrestrial protected areas (% total land area) 0
Organic area (ha) 204 524
Wood pellet production (1 000 t) Emissions in agriculture (CO2 eq. Gg) 38 186 35 135 43 449
Net emissions in land use (CO2 eq. Gg) -21 463 -29 896 -64 854

221
Turkmenistan
1995 2005 2016
The setting Population, total (mill.) 4.2 4.8 5.8
Rural population, total (mill.) 2.3 2.5 2.7
Govt. expenditure on agric. (% total outlays) Area harvested, crops (mill. ha) 1.4 1.7 2.3
Cropping intensity ratio 0.8 0.8 1.2
Total renewable water resources per cap. (m³) 5 713 5 099 4 374
Land area equipped for irrigation (1 000 ha) 1 750 1 990 1 995
Agric. area actually irrigated (% agric. area) Employment in agriculture (%) 19.3 19.1 8.4
Employment in agriculture, female (%) 22.6 23.8 11.2
Fertilizers use, nitrogen (1 000 t nutrients) Fertilizers use, phosphate (1 000 t nutrients) Fertilizers use, potash (1 000 t nutrients) Agric. value added per worker (constant USD) Hunger dimensions Average dietary energy supply (kcal/cap/day) 2 827 2 779
Average dietary energy supply adequacy (%) 122 121
Dietary energy supply, cereals/roots/tubers (%) 61 58
Prevalence of undernourishment (%) 4.8 5.5
Prevalence of severe food insecurity (%) GDP per capita (USD, PPP) 6 495 15 648
Cereal import dependency ratio (%) Stunting, children under 5 (%) 18.9 11.5
Wasting, children under 5 (%) 7.2 4.2
Safely managed drinking water (% pop. using) 73.6 86.1
Food supply Food production value, net (2004–06 mill. I$) 954 1 637 1 819
Agriculture, value added (% GDP) 16 19 13
Food (excl. fish) exports (mill. USD) 2 10 11
Food (excl. fish) imports (mill. USD) 153 77 383
Production indices (2004–06 = 100) Food 59 102 113
Crops 77 104 83
Cereals 33 98 58
Vegetable oils 136 112 65
Roots and tubers 9 102 146
Fruit and vegetables 57 102 131
Sugar 99 105
Livestock 62 100 118
Milk 85 101 43
Meat 50 99 150
Fish 76 100 100
Net trade (mill. USD) Cereals and preparations -176
Fruit and vegetables -13 -10 -27
Meat and meat preparations -25 -40
Dairy products (milk equivalent) -3 -27
Fish 0 -1 -5
Environment Forest area (% total land area) 9 9 9
Agricultural area (% total land area) 76 74 72
Freshwater withdrawal (% tot renewable) 95.7 112.5 Terrestrial protected areas (% total land area) 3
Organic area (ha) Wood pellet production (1 000 t) 0
Emissions in agriculture (CO2 eq. Gg) 4 633 7 542 8 873
Net emissions in land use (CO2 eq. Gg) 0 -293 0

222
Uganda
1995 2005 2016
The setting Population, total (mill.) 20.6 28.5 42.9
Rural population, total (mill.) 18.3 25.0 35.6
Govt. expenditure on agric. (% total outlays) 3.1 4.0
Area harvested, crops (mill. ha) 5.6 7.0 7.0
Cropping intensity ratio 0.8 0.9 0.8
Total renewable water resources per cap. (m³) 2 772 2 004 1 449
Land area equipped for irrigation (1 000 ha) 9 10 11
Agric. area actually irrigated (% agric. area) 0.1
Employment in agriculture (%) 73.9 75.3 70.4
Employment in agriculture, female (%) 81.3 82.1 75.8
Fertilizers use, nitrogen (1 000 t nutrients) 2.6 8.5
Fertilizers use, phosphate (1 000 t nutrients) 2.0 2.4
Fertilizers use, potash (1 000 t nutrients) 1.2 2.2
Agric. value added per worker (constant USD) 664 656 575
Hunger dimensions Average dietary energy supply (kcal/cap/day) 2 317 2 033
Average dietary energy supply adequacy (%) 111 95
Dietary energy supply, cereals/roots/tubers (%) 45 44
Prevalence of undernourishment (%) 24.1 41.4
Prevalence of severe food insecurity (%) GDP per capita (USD, PPP) 1 223 1 687
Cereal import dependency ratio (%) 15.8 8.6
Stunting, children under 5 (%) 38.7 28.9
Wasting, children under 5 (%) 6.3 3.6
Safely managed drinking water (% pop. using) 4.6 6.4
Food supply Food production value, net (2004–06 mill. I$) 3 559 4 863 4 756
Agriculture, value added (% GDP) 37 27 23
Food (excl. fish) exports (mill. USD) 58 78 345
Food (excl. fish) imports (mill. USD) 137 324 423
Production indices (2004–06 = 100) Food 74 101 98
Crops 81 100 82
Cereals 82 103 136
Vegetable oils 48 103 100
Roots and tubers 55 103 58
Fruit and vegetables 95 98 54
Sugar 48 99 156
Livestock 59 101 132
Milk 47 101 132
Meat 64 101 130
Fish 52 107 126
Net trade (mill. USD) Cereals and preparations -23 -144 3
Fruit and vegetables 5 -21 36
Meat and meat preparations 0 0 0
Dairy products (milk equivalent) -3 -2 5
Fish 26 139 120
Environment Forest area (% total land area) 22 17 10
Agricultural area (% total land area) 61 66 72
Freshwater withdrawal (% tot renewable) 1.1 Terrestrial protected areas (% total land area) 16
Organic area (ha) 182 262
Wood pellet production (1 000 t) Emissions in agriculture (CO2 eq. Gg) 11 386 16 699 26 570
Net emissions in land use (CO2 eq. Gg) 20 648 20 771 26 105

223
Ukraine
1995 2005 2016
The setting Population, total (mill.) 50.9 46.9 44.2
Rural population, total (mill.) 16.9 15.2 13.2
Govt. expenditure on agric. (% total outlays) 2.3 0.5
Area harvested, crops (mill. ha) 20.5 22.0 25.6
Cropping intensity ratio 0.6 0.7 0.8
Total renewable water resources per cap. (m³) 3 499 3 790 3 945
Land area equipped for irrigation (1 000 ha) 2 585 2 183 2 166
Agric. area actually irrigated (% agric. area) 1.8 0.8
Employment in agriculture (%) 19.1 19.4 15.0
Employment in agriculture, female (%) 18.1 20.0 13.3
Fertilizers use, nitrogen (1 000 t nutrients) 376.9 1 197.4
Fertilizers use, phosphate (1 000 t nutrients) 101.6 287.0
Fertilizers use, potash (1 000 t nutrients) 79.4 244.5
Agric. value added per worker (constant USD) 1 997 2 327 4 812
Hunger dimensions Average dietary energy supply (kcal/cap/day) 3 216 2 948
Average dietary energy supply adequacy (%) 127 119
Dietary energy supply, cereals/roots/tubers (%) 45 41
Prevalence of undernourishment (%) <2.5 3.3
Prevalence of severe food insecurity (%) GDP per capita (USD, PPP) 7 246 7 668
Cereal import dependency ratio (%) -38.0 -79.5
Stunting, children under 5 (%) Wasting, children under 5 (%) Safely managed drinking water (% pop. using) 70.4 92.2
Food supply Food production value, net (2004–06 mill. I$) 17 706 17 134 28 592
Agriculture, value added (% GDP) 13 9 12
Food (excl. fish) exports (mill. USD) 2 299 3 594 9 838
Food (excl. fish) imports (mill. USD) 602 1 446 2 371
Production indices (2004–06 = 100) Food 105 101 169
Crops 85 100 192
Cereals 84 102 184
Vegetable oils 58 105 331
Roots and tubers 70 97 109
Fruit and vegetables 90 103 232
Sugar 163 85 77
Livestock 131 99 97
Milk 118 101 74
Meat 160 96 122
Fish 162 114 37
Net trade (mill. USD) Cereals and preparations 227 1 390 4 087
Fruit and vegetables 84 -33 -172
Meat and meat preparations 282 -11 25
Dairy products (milk equivalent) 298 505 8
Fish -48 -256 -445
Environment Forest area (% total land area) 16 17 17
Agricultural area (% total land area) 72 71 72
Freshwater withdrawal (% tot renewable) 14.8 8.6 Terrestrial protected areas (% total land area) 4
Organic area (ha) 242 381
Wood pellet production (1 000 t) 390
Emissions in agriculture (CO2 eq. Gg) 60 683 29 629 27 655
Net emissions in land use (CO2 eq. Gg) -46 047 -23 113 -4 645

224
United Arab Emirates
1995 2005 2016
The setting Population, total (mill.) 2.4 4.6 9.4
Rural population, total (mill.) 0.5 0.7 1.4
Govt. expenditure on agric. (% total outlays) 0.0
Area harvested, crops (mill. ha) 0.0 0.2 0.1
Cropping intensity ratio 0.6 0.8 1.3
Total renewable water resources per cap. (m³) 58 25 16
Land area equipped for irrigation (1 000 ha) 68 227 92
Agric. area actually irrigated (% agric. area) 21.6
Employment in agriculture (%) 8.0 4.9 0.2
Employment in agriculture, female (%) 0.1 0.1 0.0
Fertilizers use, nitrogen (1 000 t nutrients) 32.1 15.1
Fertilizers use, phosphate (1 000 t nutrients) 6.2 4.2
Fertilizers use, potash (1 000 t nutrients) 7.1 12.2
Agric. value added per worker (constant USD) 238 446
Hunger dimensions Average dietary energy supply (kcal/cap/day) 3 227 3 409
Average dietary energy supply adequacy (%) 122 126
Dietary energy supply, cereals/roots/tubers (%) 44 43
Prevalence of undernourishment (%) 4.1 2.5
Prevalence of severe food insecurity (%) GDP per capita (USD, PPP) 91 798 67 706
Cereal import dependency ratio (%) 100.0 100.0
Stunting, children under 5 (%) Wasting, children under 5 (%) Safely managed drinking water (% pop. using) Food supply Food production value, net (2004–06 mill. I$) 423 676 657
Agriculture, value added (% GDP) 2 1 1
Food (excl. fish) exports (mill. USD) 497 1 726 4 862
Food (excl. fish) imports (mill. USD) 2 053 3 317 12 730
Production indices (2004–06 = 100) Food 66 105 102
Crops 70 104 83
Cereals 200 99 142
Vegetable oils Roots and tubers 47 100 52
Fruit and vegetables 70 104 83
Sugar Livestock 60 111 150
Milk 57 103 132
Meat 60 114 153
Fish 114 94 80
Net trade (mill. USD) Cereals and preparations -268 -321 -1 659
Fruit and vegetables -474 -212 -2 523
Meat and meat preparations -227 -310 -1 608
Dairy products (milk equivalent) -170 -99 -839
Fish -17 192 -475
Environment Forest area (% total land area) 4 4 5
Agricultural area (% total land area) 5 8 5
Freshwater withdrawal (% tot renewable) 1 149.0 1 867.0 Terrestrial protected areas (% total land area) 13
Organic area (ha) 0 5
Wood pellet production (1 000 t) Emissions in agriculture (CO2 eq. Gg) 780 1 146 1 834
Net emissions in land use (CO2 eq. Gg) -1 192 -51 -213

225
United Kingdom
1995 2005 2016
The setting Population, total (mill.) 58.0 60.3 66.2
Rural population, total (mill.) 12.6 12.1 10.9
Govt. expenditure on agric. (% total outlays) 0.6 0.3
Area harvested, crops (mill. ha) 4.5 4.2 4.3
Cropping intensity ratio 0.7 0.7 0.7
Total renewable water resources per cap. (m³) 2 523 2 404 2 234
Land area equipped for irrigation (1 000 ha) 125 228 99
Agric. area actually irrigated (% agric. area) 1.2 0.3
Employment in agriculture (%) 2.1 1.4 1.1
Employment in agriculture, female (%) 1.2 0.7 0.6
Fertilizers use, nitrogen (1 000 t nutrients) 1 003.0 1 040.0
Fertilizers use, phosphate (1 000 t nutrients) 235.0 198.0
Fertilizers use, potash (1 000 t nutrients) 325.0 286.0
Agric. value added per worker (constant USD) 28 062 44 114 49 139
Hunger dimensions Average dietary energy supply (kcal/cap/day) 3 440 3 424
Average dietary energy supply adequacy (%) 137 138
Dietary energy supply, cereals/roots/tubers (%) 31 31
Prevalence of undernourishment (%) <2.5 <2.5
Prevalence of severe food insecurity (%) 3.4
GDP per capita (USD, PPP) 37 160 39 309
Cereal import dependency ratio (%) -1.6 9.1
Stunting, children under 5 (%) Wasting, children under 5 (%) Safely managed drinking water (% pop. using) 95.7 95.7
Food supply Food production value, net (2004–06 mill. I$) 17 106 15 750 16 363
Agriculture, value added (% GDP) 1 1 1
Food (excl. fish) exports (mill. USD) 8 254 9 432 13 359
Food (excl. fish) imports (mill. USD) 16 647 30 367 39 392
Production indices (2004–06 = 100) Food 109 100 104
Crops 98 101 98
Cereals 101 99 102
Vegetable oils 70 107 98
Roots and tubers 104 99 89
Fruit and vegetables 112 104 117
Sugar 101 104 68
Livestock 111 100 107
Milk 103 100 105
Meat 119 100 107
Fish 120 101 108
Net trade (mill. USD) Cereals and preparations 350 -637 -1 535
Fruit and vegetables -5 002 -9 140 -11 714
Meat and meat preparations -1 291 -5 335 -5 829
Dairy products (milk equivalent) -298 -1 623 -1 445
Fish -715 -1 302 -1 567
Environment Forest area (% total land area) 12 12 13
Agricultural area (% total land area) 72 70 72
Freshwater withdrawal (% tot renewable) 8.2 5.8 Terrestrial protected areas (% total land area) 28
Organic area (ha) 605 491
Wood pellet production (1 000 t) 329
Emissions in agriculture (CO2 eq. Gg) 54 521 46 377 44 503
Net emissions in land use (CO2 eq. Gg) -12 160 -12 183 -12 174

226
United Republic of Tanzania
1995 2005 2016
The setting Population, total (mill.) 30.0 39.4 57.3
Rural population, total (mill.) 23.8 29.2 37.1
Govt. expenditure on agric. (% total outlays) 3.2 1.1
Area harvested, crops (mill. ha) 6.5 11.3 16.7
Cropping intensity ratio 0.7 1.0 1.1
Total renewable water resources per cap. (m³) 3 053 2 319 1 732
Land area equipped for irrigation (1 000 ha) 150 250 364
Agric. area actually irrigated (% agric. area) Employment in agriculture (%) 78.0 74.7 67.2
Employment in agriculture, female (%) 81.3 78.1 70.3
Fertilizers use, nitrogen (1 000 t nutrients) 33.5 107.6
Fertilizers use, phosphate (1 000 t nutrients) 16.8 54.6
Fertilizers use, potash (1 000 t nutrients) 5.5 8.0
Agric. value added per worker (constant USD) 497 604 669
Hunger dimensions Average dietary energy supply (kcal/cap/day) 2 125 2 241
Average dietary energy supply adequacy (%) 101 106
Dietary energy supply, cereals/roots/tubers (%) 59 55
Prevalence of undernourishment (%) 34.4 32.0
Prevalence of severe food insecurity (%) GDP per capita (USD, PPP) 1 820 2 584
Cereal import dependency ratio (%) 12.6 12.2
Stunting, children under 5 (%) 44.4 34.4
Wasting, children under 5 (%) 3.5 4.5
Safely managed drinking water (% pop. using) Food supply Food production value, net (2004–06 mill. I$) 3 941 5 491 9 585
Agriculture, value added (% GDP) 33 28 29
Food (excl. fish) exports (mill. USD) 102 145 819
Food (excl. fish) imports (mill. USD) 140 291 754
Production indices (2004–06 = 100) Food 69 97 169
Crops 63 97 175
Cereals 76 92 184
Vegetable oils 36 107 411
Roots and tubers 95 102 142
Fruit and vegetables 41 87 151
Sugar 57 102 130
Livestock 88 102 133
Milk 50 104 110
Meat 109 102 150
Fish 100 105 105
Net trade (mill. USD) Cereals and preparations -51 -112 -205
Fruit and vegetables 69 56 573
Meat and meat preparations 0 -2 1
Dairy products (milk equivalent) -3 -3 -11
Fish 20 142 115
Environment Forest area (% total land area) 61 56 52
Agricultural area (% total land area) 37 40 45
Freshwater withdrawal (% tot renewable) 5.4 Terrestrial protected areas (% total land area) 38
Organic area (ha) 45 269
Wood pellet production (1 000 t) Emissions in agriculture (CO2 eq. Gg) 33 587 40 849 54 518
Net emissions in land use (CO2 eq. Gg) 235 605 256 508 220 636

227
United States of America
1995 2005 2016
The setting Population, total (mill.) 265.7 295.1 324.5
Rural population, total (mill.) 61.0 59.8 59.6
Govt. expenditure on agric. (% total outlays) Area harvested, crops (mill. ha) 99.3 99.4 103.6
Cropping intensity ratio 0.5 0.6 0.7
Total renewable water resources per cap. (m³) 11 247 10 174 9 526
Land area equipped for irrigation (1 000 ha) 27 051 26 762 26 708
Agric. area actually irrigated (% agric. area) 5.6 Employment in agriculture (%) 2.8 1.6 1.7
Employment in agriculture, female (%) 1.5 0.8 0.9
Fertilizers use, nitrogen (1 000 t nutrients) 11 013.7 12 038.7
Fertilizers use, phosphate (1 000 t nutrients) 4 120.8 4 274.9
Fertilizers use, potash (1 000 t nutrients) 4 448.1 4 789.1
Agric. value added per worker (constant USD) 31 003 70 683 83 736
Hunger dimensions Average dietary energy supply (kcal/cap/day) 3 807 3 757
Average dietary energy supply adequacy (%) 150 147
Dietary energy supply, cereals/roots/tubers (%) 23 24
Prevalence of undernourishment (%) <2.5 <2.5
Prevalence of severe food insecurity (%) 1.1
GDP per capita (USD, PPP) 49 762 53 399
Cereal import dependency ratio (%) -30.6 -19.1
Stunting, children under 5 (%) 3.2 Wasting, children under 5 (%) 0.8 Safely managed drinking water (% pop. using) 99.0 99.0
Food supply Food production value, net (2004–06 mill. I$) 159 335 188 609 232 334
Agriculture, value added (% GDP) 1 1 1
Food (excl. fish) exports (mill. USD) 41 993 47 386 108 092
Food (excl. fish) imports (mill. USD) 19 321 40 496 81 436
Production indices (2004–06 = 100) Food 84 99 122
Crops 80 100 122
Cereals 76 101 130
Vegetable oils 73 101 132
Roots and tubers 100 96 102
Fruit and vegetables 93 99 98
Sugar 89 91 108
Livestock 89 100 110
Milk 88 100 120
Meat 89 100 106
Fish 103 99 98
Net trade (mill. USD) Cereals and preparations 14 235 9 601 13 685
Fruit and vegetables -47 -4 646 -11 383
Meat and meat preparations 4 184 735 7 562
Dairy products (milk equivalent) -93 -420 1 394
Fish -3 758 -8 534 -14 734
Environment Forest area (% total land area) 33 33 34
Agricultural area (% total land area) 46 45 44
Freshwater withdrawal (% tot renewable) 15.6 Terrestrial protected areas (% total land area) 13
Organic area (ha) 1 641 2 031
Wood pellet production (1 000 t) 6 393
Emissions in agriculture (CO2 eq. Gg) 352 348 348 458 359 950
Net emissions in land use (CO2 eq. Gg) -316 310 -334 988 -40 620

228
Uruguay
1995 2005 2016
The setting Population, total (mill.) 3.2 3.3 3.5
Rural population, total (mill.) 0.3 0.2 0.2
Govt. expenditure on agric. (% total outlays) 2.3 Area harvested, crops (mill. ha) 0.8 1.0 2.0
Cropping intensity ratio 0.6 0.7 0.8
Total renewable water resources per cap. (m³) 52 644 51 557 50 000
Land area equipped for irrigation (1 000 ha) 160 218 238
Agric. area actually irrigated (% agric. area) 1.1 1.5
Employment in agriculture (%) 4.8 5.7 8.2
Employment in agriculture, female (%) 1.5 1.9 3.9
Fertilizers use, nitrogen (1 000 t nutrients) 73.9 156.6
Fertilizers use, phosphate (1 000 t nutrients) 119.2 146.0
Fertilizers use, potash (1 000 t nutrients) 2.6 43.7
Agric. value added per worker (constant USD) 38 596 37 188 25 383
Hunger dimensions Average dietary energy supply (kcal/cap/day) 2 821 3 206
Average dietary energy supply adequacy (%) 118 133
Dietary energy supply, cereals/roots/tubers (%) 42 39
Prevalence of undernourishment (%) 4.3 <2.5
Prevalence of severe food insecurity (%) GDP per capita (USD, PPP) 12 976 20 094
Cereal import dependency ratio (%) -94.0 -153.1
Stunting, children under 5 (%) 13.9 Wasting, children under 5 (%) 3.0 Safely managed drinking water (% pop. using) Food supply Food production value, net (2004–06 mill. I$) 2 271 3 256 3 735
Agriculture, value added (% GDP) 7 9 6
Food (excl. fish) exports (mill. USD) 822 1 653 4 194
Food (excl. fish) imports (mill. USD) 208 201 735
Production indices (2004–06 = 100) Food 71 102 117
Crops 64 98 156
Cereals 69 93 133
Vegetable oils 36 103 269
Roots and tubers 77 106 72
Fruit and vegetables 81 103 81
Sugar 129 110 234
Livestock 78 103 101
Milk 77 104 123
Meat 73 104 95
Fish 99 99 40
Net trade (mill. USD) Cereals and preparations 221 279 574
Fruit and vegetables 14 42 -52
Meat and meat preparations 272 817 1 531
Dairy products (milk equivalent) 102 241 539
Fish 88 120 51
Environment Forest area (% total land area) 6 9 11
Agricultural area (% total land area) 85 85 83
Freshwater withdrawal (% tot renewable) Terrestrial protected areas (% total land area) 4
Organic area (ha) 759 1 657
Wood pellet production (1 000 t) 0
Emissions in agriculture (CO2 eq. Gg) 23 232 24 611 24 159
Net emissions in land use (CO2 eq. Gg) -25 529 -13 791 -10 496

229
Uzbekistan
1995 2005 2016
The setting Population, total (mill.) 22.9 26.5 31.9
Rural population, total (mill.) 14.1 16.5 19.3
Govt. expenditure on agric. (% total outlays) 15.6
Area harvested, crops (mill. ha) 3.7 3.6 3.9
Cropping intensity ratio 0.8 0.8 0.8
Total renewable water resources per cap. (m³) 2 082 1 838 1 554
Land area equipped for irrigation (1 000 ha) 4 252 4 198 4 215
Agric. area actually irrigated (% agric. area) Employment in agriculture (%) 37.5 34.7 21.9
Employment in agriculture, female (%) 43.3 39.9 26.2
Fertilizers use, nitrogen (1 000 t nutrients) 540.0 721.3
Fertilizers use, phosphate (1 000 t nutrients) 145.0 225.8
Fertilizers use, potash (1 000 t nutrients) 30.0 76.8
Agric. value added per worker (constant USD) 1 153 1 513 3 439
Hunger dimensions Average dietary energy supply (kcal/cap/day) 2 471 2 730
Average dietary energy supply adequacy (%) 105 115
Dietary energy supply, cereals/roots/tubers (%) 60 55
Prevalence of undernourishment (%) 14.5 7.4
Prevalence of severe food insecurity (%) GDP per capita (USD, PPP) 3 069 6 039
Cereal import dependency ratio (%) 5.8 22.2
Stunting, children under 5 (%) 19.6 Wasting, children under 5 (%) 4.5 Safely managed drinking water (% pop. using) 51.6 Food supply Food production value, net (2004–06 mill. I$) 4 857 6 293 10 095
Agriculture, value added (% GDP) 28 26 17
Food (excl. fish) exports (mill. USD) 108 295 509
Food (excl. fish) imports (mill. USD) 708 327 1 052
Production indices (2004–06 = 100) Food 76 98 157
Crops 80 100 167
Cereals 51 102 123
Vegetable oils 107 103 93
Roots and tubers 44 97 318
Fruit and vegetables 67 94 270
Sugar Livestock 83 100 134
Milk 89 101 91
Meat 80 99 157
Fish 219 106 1 037
Net trade (mill. USD) Cereals and preparations -272 -86 -432
Fruit and vegetables 66 260 447
Meat and meat preparations -256 -20 -17
Dairy products (milk equivalent) -15 -18 -22
Fish 0 -2 -5
Environment Forest area (% total land area) 7 8 8
Agricultural area (% total land area) 65 63 63
Freshwater withdrawal (% tot renewable) 110.0 100.6 Terrestrial protected areas (% total land area) 3
Organic area (ha) 2 0
Wood pellet production (1 000 t) 0
Emissions in agriculture (CO2 eq. Gg) 15 179 14 503 30 559
Net emissions in land use (CO2 eq. Gg) -2 238 -2 567 -16 407

230
Vanuatu
1995 2005 2016
The setting Population, total (mill.) 0.2 0.2 0.3
Rural population, total (mill.) 0.1 0.2 0.2
Govt. expenditure on agric. (% total outlays) 2.7 Area harvested, crops (mill. ha) 0.1 0.1 0.1
Cropping intensity ratio 0.7 0.8 0.8
Total renewable water resources per cap. (m³) 57 143 45 455 36 982
Land area equipped for irrigation (1 000 ha) Agric. area actually irrigated (% agric. area) Employment in agriculture (%) 61.8 64.2 62.6
Employment in agriculture, female (%) 63.5 65.7 64.2
Fertilizers use, nitrogen (1 000 t nutrients) Fertilizers use, phosphate (1 000 t nutrients) Fertilizers use, potash (1 000 t nutrients) Agric. value added per worker (constant USD) 2 417 2 374 2 508
Hunger dimensions Average dietary energy supply (kcal/cap/day) 2 775 2 810
Average dietary energy supply adequacy (%) 128 128
Dietary energy supply, cereals/roots/tubers (%) 50 46
Prevalence of undernourishment (%) 7.0 7.1
Prevalence of severe food insecurity (%) GDP per capita (USD, PPP) 2 610 2 857
Cereal import dependency ratio (%) 97.1 96.1
Stunting, children under 5 (%) 25.9 28.5
Wasting, children under 5 (%) 5.9 4.4
Safely managed drinking water (% pop. using) Food supply Food production value, net (2004–06 mill. I$) 61 60 75
Agriculture, value added (% GDP) 29 22 25
Food (excl. fish) exports (mill. USD) 17 13 19
Food (excl. fish) imports (mill. USD) 13 20 52
Production indices (2004–06 = 100) Food 102 100 124
Crops 99 100 128
Cereals 91 103 121
Vegetable oils 107 100 133
Roots and tubers 73 100 119
Fruit and vegetables 81 101 110
Sugar Livestock 109 102 111
Milk 100 104 111
Meat 110 102 111
Fish 26 104 20
Net trade (mill. USD) Cereals and preparations -5 -11 -24
Fruit and vegetables 0 -2 -4
Meat and meat preparations 2 0 -8
Dairy products (milk equivalent) -1 -1 -4
Fish 58 82 66
Environment Forest area (% total land area) 36 36 36
Agricultural area (% total land area) 14 15 15
Freshwater withdrawal (% tot renewable) Terrestrial protected areas (% total land area) 4
Organic area (ha) 9 12
Wood pellet production (1 000 t) Emissions in agriculture (CO2 eq. Gg) 355 343 429
Net emissions in land use (CO2 eq. Gg) -25 -13 -14
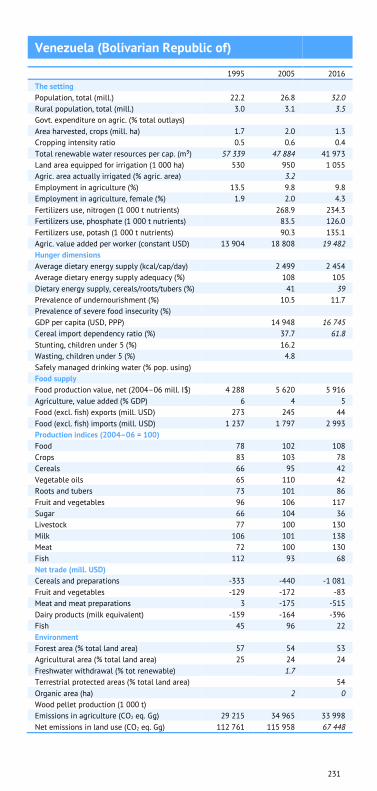
231
Venezuela (Bolivarian Republic of)
1995 2005 2016
The setting Population, total (mill.) 22.2 26.8 32.0
Rural population, total (mill.) 3.0 3.1 3.5
Govt. expenditure on agric. (% total outlays) Area harvested, crops (mill. ha) 1.7 2.0 1.3
Cropping intensity ratio 0.5 0.6 0.4
Total renewable water resources per cap. (m³) 57 339 47 884 41 973
Land area equipped for irrigation (1 000 ha) 530 950 1 055
Agric. area actually irrigated (% agric. area) 3.2 Employment in agriculture (%) 13.5 9.8 9.8
Employment in agriculture, female (%) 1.9 2.0 4.3
Fertilizers use, nitrogen (1 000 t nutrients) 268.9 234.3
Fertilizers use, phosphate (1 000 t nutrients) 83.5 126.0
Fertilizers use, potash (1 000 t nutrients) 90.3 135.1
Agric. value added per worker (constant USD) 13 904 18 808 19 482
Hunger dimensions Average dietary energy supply (kcal/cap/day) 2 499 2 454
Average dietary energy supply adequacy (%) 108 105
Dietary energy supply, cereals/roots/tubers (%) 41 39
Prevalence of undernourishment (%) 10.5 11.7
Prevalence of severe food insecurity (%) GDP per capita (USD, PPP) 14 948 16 745
Cereal import dependency ratio (%) 37.7 61.8
Stunting, children under 5 (%) 16.2 Wasting, children under 5 (%) 4.8 Safely managed drinking water (% pop. using) Food supply Food production value, net (2004–06 mill. I$) 4 288 5 620 5 916
Agriculture, value added (% GDP) 6 4 5
Food (excl. fish) exports (mill. USD) 273 245 44
Food (excl. fish) imports (mill. USD) 1 237 1 797 2 993
Production indices (2004–06 = 100) Food 78 102 108
Crops 83 103 78
Cereals 66 95 42
Vegetable oils 65 110 42
Roots and tubers 73 101 86
Fruit and vegetables 96 106 117
Sugar 66 104 36
Livestock 77 100 130
Milk 106 101 138
Meat 72 100 130
Fish 112 93 68
Net trade (mill. USD) Cereals and preparations -333 -440 -1 081
Fruit and vegetables -129 -172 -83
Meat and meat preparations 3 -175 -515
Dairy products (milk equivalent) -159 -164 -396
Fish 45 96 22
Environment Forest area (% total land area) 57 54 53
Agricultural area (% total land area) 25 24 24
Freshwater withdrawal (% tot renewable) 1.7 Terrestrial protected areas (% total land area) 54
Organic area (ha) 2 0
Wood pellet production (1 000 t) Emissions in agriculture (CO2 eq. Gg) 29 215 34 965 33 998
Net emissions in land use (CO2 eq. Gg) 112 761 115 958 67 448

232
Viet Nam
1995 2005 2016
The setting Population, total (mill.) 75.2 84.3 95.5
Rural population, total (mill.) 59.2 61.8 61.8
Govt. expenditure on agric. (% total outlays) 1.6 3.4
Area harvested, crops (mill. ha) 10.4 12.8 14.3
Cropping intensity ratio 1.5 1.4 1.2
Total renewable water resources per cap. (m³) 11 414 10 308 9 349
Land area equipped for irrigation (1 000 ha) 3 000 4 585 4 600
Agric. area actually irrigated (% agric. area) Employment in agriculture (%) 70.6 54.6 41.9
Employment in agriculture, female (%) 71.1 56.7 43.5
Fertilizers use, nitrogen (1 000 t nutrients) 1 047.2 1 767.9
Fertilizers use, phosphate (1 000 t nutrients) 552.9 783.1
Fertilizers use, potash (1 000 t nutrients) 258.1 456.7
Agric. value added per worker (constant USD) 471 731 1 080
Hunger dimensions Average dietary energy supply (kcal/cap/day) 2 476 2 828
Average dietary energy supply adequacy (%) 108 123
Dietary energy supply, cereals/roots/tubers (%) 64 57
Prevalence of undernourishment (%) 18.2 10.8
Prevalence of severe food insecurity (%) 2.3
GDP per capita (USD, PPP) 3 406 5 838
Cereal import dependency ratio (%) -13.1 -12.6
Stunting, children under 5 (%) 33.2 24.6
Wasting, children under 5 (%) 10.7 6.4
Safely managed drinking water (% pop. using) Food supply Food production value, net (2004–06 mill. I$) 12 721 20 628 28 025
Agriculture, value added (% GDP) 27 19 16
Food (excl. fish) exports (mill. USD) 805 2 402 7 520
Food (excl. fish) imports (mill. USD) 453 1 131 17 503
Production indices (2004–06 = 100) Food 62 100 136
Crops 60 99 135
Cereals 68 100 122
Vegetable oils 78 105 101
Roots and tubers 46 99 148
Fruit and vegetables 66 100 157
Sugar 68 95 103
Livestock 50 101 151
Milk 54 105 365
Meat 49 101 145
Fish 43 100 188
Net trade (mill. USD) Cereals and preparations 393 1 064 -953
Fruit and vegetables 51 589 -2 660
Meat and meat preparations 11 -15 -3 589
Dairy products (milk equivalent) -75 -251 -514
Fish 509 2 488 5 997
Environment Forest area (% total land area) 32 42 48
Agricultural area (% total land area) 22 32 39
Freshwater withdrawal (% tot renewable) 9.3 Terrestrial protected areas (% total land area) 8
Organic area (ha) 7 54
Wood pellet production (1 000 t) 1 350
Emissions in agriculture (CO2 eq. Gg) 48 747 58 706 65 622
Net emissions in land use (CO2 eq. Gg) -44 756 -16 872 -18 836

233
Yemen
1995 2005 2016
The setting Population, total (mill.) 15.3 20.6 28.3
Rural population, total (mill.) 11.4 14.3 17.1
Govt. expenditure on agric. (% total outlays) Area harvested, crops (mill. ha) 1.0 1.1 1.1
Cropping intensity ratio 0.6 0.7 0.7
Total renewable water resources per cap. (m³) 128 97 76
Land area equipped for irrigation (1 000 ha) 485 680 680
Agric. area actually irrigated (% agric. area) Employment in agriculture (%) 55.4 30.1 36.0
Employment in agriculture, female (%) 88.1 40.0 57.2
Fertilizers use, nitrogen (1 000 t nutrients) 3.9 18.2
Fertilizers use, phosphate (1 000 t nutrients) 0.9 1.4
Fertilizers use, potash (1 000 t nutrients) 0.1 0.8
Agric. value added per worker (constant USD) 844 1 740 555
Hunger dimensions Average dietary energy supply (kcal/cap/day) 2 095 2 069
Average dietary energy supply adequacy (%) 99 95
Dietary energy supply, cereals/roots/tubers (%) 61 63
Prevalence of undernourishment (%) 30.1 34.4
Prevalence of severe food insecurity (%) GDP per capita (USD, PPP) 4 155 1 479
Cereal import dependency ratio (%) 84.4 95.3
Stunting, children under 5 (%) 57.7 46.5
Wasting, children under 5 (%) 15.2 16.3
Safely managed drinking water (% pop. using) Food supply Food production value, net (2004–06 mill. I$) 832 1 251 1 809
Agriculture, value added (% GDP) 17 9 15
Food (excl. fish) exports (mill. USD) 26 81 60
Food (excl. fish) imports (mill. USD) 750 1 192 2 398
Production indices (2004–06 = 100) Food 65 98 142
Crops 68 97 129
Cereals 131 90 129
Vegetable oils 68 96 129
Roots and tubers 87 102 139
Fruit and vegetables 56 98 128
Sugar Livestock 62 99 158
Milk 71 100 115
Meat 62 99 170
Fish 45 99 64
Net trade (mill. USD) Cereals and preparations -331 -482 -1 188
Fruit and vegetables -31 -47 -126
Meat and meat preparations -38 -121 -119
Dairy products (milk equivalent) -64 -132 -160
Fish 15 119 94
Environment Forest area (% total land area) 1 1 1
Agricultural area (% total land area) 45 45 45
Freshwater withdrawal (% tot renewable) 168.6 Terrestrial protected areas (% total land area) 1
Organic area (ha) Wood pellet production (1 000 t) Emissions in agriculture (CO2 eq. Gg) 4 347 6 176 7 689
Net emissions in land use (CO2 eq. Gg) 0 0 0

234
Zambia
1995 2005 2016
The setting Population, total (mill.) 9.1 12.1 17.1
Rural population, total (mill.) 5.6 7.3 9.6
Govt. expenditure on agric. (% total outlays) 4.5 10.3
Area harvested, crops (mill. ha) 1.1 1.2 2.4
Cropping intensity ratio 0.4 0.5 0.6
Total renewable water resources per cap. (m³) 10 733 8 227 6 317
Land area equipped for irrigation (1 000 ha) 79 156 156
Agric. area actually irrigated (% agric. area) Employment in agriculture (%) 71.4 72.8 53.3
Employment in agriculture, female (%) 79.0 80.6 62.9
Fertilizers use, nitrogen (1 000 t nutrients) 51.6 279.6
Fertilizers use, phosphate (1 000 t nutrients) 4.8 31.2
Fertilizers use, potash (1 000 t nutrients) 19.9 29.6
Agric. value added per worker (constant USD) 1 016 659 590
Hunger dimensions Average dietary energy supply (kcal/cap/day) 1 859 2 017
Average dietary energy supply adequacy (%) 88 93
Dietary energy supply, cereals/roots/tubers (%) 74 70
Prevalence of undernourishment (%) 51.1 44.5
Prevalence of severe food insecurity (%) GDP per capita (USD, PPP) 2 483 3 652
Cereal import dependency ratio (%) 8.9 -21.4
Stunting, children under 5 (%) 45.8 40.0
Wasting, children under 5 (%) 5.6 6.3
Safely managed drinking water (% pop. using) Food supply Food production value, net (2004–06 mill. I$) 758 1 025 1 878
Agriculture, value added (% GDP) 14 15 5
Food (excl. fish) exports (mill. USD) 25 151 159
Food (excl. fish) imports (mill. USD) 64 156 275
Production indices (2004–06 = 100) Food 73 98 180
Crops 55 99 171
Cereals 64 79 228
Vegetable oils 41 113 183
Roots and tubers 71 101 109
Fruit and vegetables 88 99 127
Sugar 55 97 181
Livestock 81 102 201
Milk 99 102 122
Meat 75 102 237
Fish 107 102 164
Net trade (mill. USD) Cereals and preparations -48 -43 61
Fruit and vegetables 0 4 -48
Meat and meat preparations 0 0 -9
Dairy products (milk equivalent) -2 -5 -12
Fish -1 -4 -101
Environment Forest area (% total land area) 70 68 65
Agricultural area (% total land area) 29 31 32
Freshwater withdrawal (% tot renewable) 1.5 1.5 Terrestrial protected areas (% total land area) 38
Organic area (ha) 3 8
Wood pellet production (1 000 t) Emissions in agriculture (CO2 eq. Gg) 19 096 21 723 22 649
Net emissions in land use (CO2 eq. Gg) 365 443 443 369 344 511

235
Zimbabwe
1995 2005 2016
The setting Population, total (mill.) 11.3 12.9 16.5
Rural population, total (mill.) 7.9 8.4 10.8
Govt. expenditure on agric. (% total outlays) Area harvested, crops (mill. ha) 2.7 3.3 2.6
Cropping intensity ratio 0.8 0.8 0.6
Total renewable water resources per cap. (m³) 1 658 1 504 1 238
Land area equipped for irrigation (1 000 ha) 135 174 175
Agric. area actually irrigated (% agric. area) Employment in agriculture (%) 59.8 72.6 67.4
Employment in agriculture, female (%) 69.7 80.2 71.8
Fertilizers use, nitrogen (1 000 t nutrients) 48.4 42.6
Fertilizers use, phosphate (1 000 t nutrients) 20.8 29.6
Fertilizers use, potash (1 000 t nutrients) 15.8 19.4
Agric. value added per worker (constant USD) 708 380 274
Hunger dimensions Average dietary energy supply (kcal/cap/day) 2 023 1 952
Average dietary energy supply adequacy (%) 91 87
Dietary energy supply, cereals/roots/tubers (%) 59 58
Prevalence of undernourishment (%) 42.2 46.6
Prevalence of severe food insecurity (%) GDP per capita (USD, PPP) 1 663 1 880
Cereal import dependency ratio (%) 28.7 42.5
Stunting, children under 5 (%) 35.8 26.8
Wasting, children under 5 (%) 7.3 3.2
Safely managed drinking water (% pop. using) Food supply Food production value, net (2004–06 mill. I$) 902 1 205 1 197
Agriculture, value added (% GDP) 13 11 10
Food (excl. fish) exports (mill. USD) 258 131 103
Food (excl. fish) imports (mill. USD) 103 139 887
Production indices (2004–06 = 100) Food 67 89 89
Crops 85 87 96
Cereals 42 68 42
Vegetable oils 75 81 84
Roots and tubers 74 100 127
Fruit and vegetables 77 100 121
Sugar 100 93 92
Livestock 72 100 106
Milk 89 98 108
Meat 67 100 106
Fish 126 98 196
Net trade (mill. USD) Cereals and preparations 21 -49 -570
Fruit and vegetables 25 34 -15
Meat and meat preparations 24 6 -9
Dairy products (milk equivalent) 10 0 -8
Fish -14 -1 -17
Environment Forest area (% total land area) 53 45 36
Agricultural area (% total land area) 36 42 42
Freshwater withdrawal (% tot renewable) 17.9 Terrestrial protected areas (% total land area) 27
Organic area (ha) 0 3
Wood pellet production (1 000 t) Emissions in agriculture (CO2 eq. Gg) 9 459 10 182 11 273
Net emissions in land use (CO2 eq. Gg) 37 853 37 867 36 111

236
Definitions
Agricultural land
Land used for cultivation of crops and
animal husbandry. The total of areas
under "Cropland" and "Permanent
meadows and pastures".
Source: FAO, Statistics Division
Owner: FAO
Agricultural water withdrawal
Annual quantity of self-supplied water
withdrawn for irrigation, livestock and
aquaculture purposes. It can include
water from primary renewable and
secondary freshwater resources, as well
as water from over-abstraction of
renewable groundwater or withdrawal
from fossil groundwater, direct use of
agricultural drainage water, direct use of
(treated) wastewater, and desalinated
water. Water for the dairy and meat
industries and industrial processing of
harvested agricultural products is
included under industrial water
withdrawal. Note: Withdrawal is
synonymous with abstraction.
Source: FAO, Land and Water Division
(AQUASTAT)
Owner: FAO
Agricultural water withdrawal as % of
total renewable water resources
Water withdrawn for irrigation in a given
year, expressed in percent of the total
renewable water resources. This
parameter is an indication of the pressure
on the renewable water resources caused
by irrigation. Note: While freshwater
withdrawal as a percentage of total
renewable water resources refers to
withdrawal of primary and secondary
surface water and groundwater,
agricultural water withdrawal also
includes non-conventional sources of
water (such as direct use of wastewater
and agricultural drainage water,
desalinated water). Thus in some
countries agricultural water withdrawal
as a percentage of total renewable water
resources can be higher than freshwater
withdrawal as a percentage of total
renewable water resources.
Source: FAO, Land and Water Division
(AQUASTAT)
Owner: FAO
Agriculture area actually irrigated
Land area actually irrigated that is used
for agriculture.
Source: FAO, Statistics Division
Owner: FAO
Agriculture Orientation Index (AOI) of
government expenditure
This is the ratio of the agriculture share
in government expenditure, over the
agriculture contribution to the economy.
An AOI greater than 1 shows higher
prominence in government expenditure
to agriculture than its contribution to the
economy, as measured by GDP, while an
AOI less than 1 shows more prominence
of non-agricultural sectors.
Source: FAO, Statistics Division
Owner: FAO
Agriculture, forestry and fishing (AFF)
It refers to broad agricultural sector
including crop growing and animal
production, forestry and logging, and
fishing and aquaculture. These sub–sectors correspond to Section A of the
International Standard Industrial
Classification (ISIC), revision 4 and are
covered in its Divisions 1, 2 and 3. To
distinguish with the agricultural sector
(crop and livestock in Division 1 of ISIC),
the broad agricultural sector is
abbreviated in this publication as AFF.
Source: United Nations Statistics Division
Owner: UN
Agriculture, value added
This is the total value added in AFF. The
value added is the net output of a sector
after adding up value of all outputs and
subtracting intermediate inputs. It is
calculated without making deductions
for depreciation of fabricated assets or
depletion and degradation of natural
resources. The International Standard
Industrial Classification (ISIC), revision 3
or 4, determines the origin of value
added. Agriculture here refers to the
broad agricultural sector (AFF).
Source: World Bank
Owner: World Bank
Agriculture, value added per worker
(constant 2010 USD)
Value added per worker is a measure of
labour productivity in agricultural sector
- value added per unit of input. Value
added per worker is calculated by
dividing value added of a sector by the
labour force employed in the sector. For
international comparisons constant 2010
USD have been used.
Source: World Bank
Owner: FAO, ILO and World Bank
Aid commitment flows to agriculture,
forestry and fishing
The DAC uses a sector classification
specifically developed to track aid flows
and to permit measuring the share of
each sector (e.g. health, energy,
agriculture) or other purpose category
"non-sector allocable aid" (e.g. general
budget support, humanitarian aid) in
total aid. The sector of destination is
assigned by answering the question
"Which specific area of the recipient's
economic and social structure is the
transfer intended to foster?".
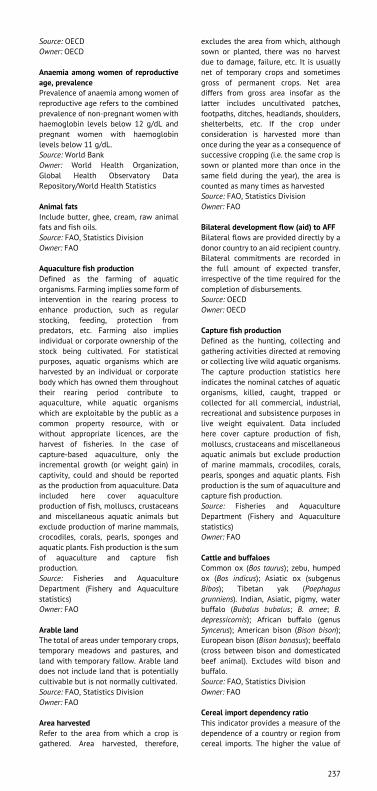
237
Source: OECD
Owner: OECD
Anaemia among women of reproductive
age, prevalence
Prevalence of anaemia among women of
reproductive age refers to the combined
prevalence of non-pregnant women with
haemoglobin levels below 12 g/dL and
pregnant women with haemoglobin
levels below 11 g/dL.
Source: World Bank
Owner: World Health Organization,
Global Health Observatory Data
Repository/World Health Statistics
Animal fats
Include butter, ghee, cream, raw animal
fats and fish oils.
Source: FAO, Statistics Division
Owner: FAO
Aquaculture fish production
Defined as the farming of aquatic
organisms. Farming implies some form of
intervention in the rearing process to
enhance production, such as regular
stocking, feeding, protection from
predators, etc. Farming also implies
individual or corporate ownership of the
stock being cultivated. For statistical
purposes, aquatic organisms which are
harvested by an individual or corporate
body which has owned them throughout
their rearing period contribute to
aquaculture, while aquatic organisms
which are exploitable by the public as a
common property resource, with or
without appropriate licences, are the
harvest of fisheries. In the case of
capture-based aquaculture, only the
incremental growth (or weight gain) in
captivity, could and should be reported
as the production from aquaculture. Data
included here cover aquaculture
production of fish, molluscs, crustaceans
and miscellaneous aquatic animals but
exclude production of marine mammals,
crocodiles, corals, pearls, sponges and
aquatic plants. Fish production is the sum
of aquaculture and capture fish
production.
Source: Fisheries and Aquaculture
Department (Fishery and Aquaculture
statistics)
Owner: FAO
Arable land
The total of areas under temporary crops,
temporary meadows and pastures, and
land with temporary fallow. Arable land
does not include land that is potentially
cultivable but is not normally cultivated.
Source: FAO, Statistics Division
Owner: FAO
Area harvested
Refer to the area from which a crop is
gathered. Area harvested, therefore,
excludes the area from which, although
sown or planted, there was no harvest
due to damage, failure, etc. It is usually
net of temporary crops and sometimes
gross of permanent crops. Net area
differs from gross area insofar as the
latter includes uncultivated patches,
footpaths, ditches, headlands, shoulders,
shelterbelts, etc. If the crop under
consideration is harvested more than
once during the year as a consequence of
successive cropping (i.e. the same crop is
sown or planted more than once in the
same field during the year), the area is
counted as many times as harvested
Source: FAO, Statistics Division
Owner: FAO
Bilateral development flow (aid) to AFF
Bilateral flows are provided directly by a
donor country to an aid recipient country.
Bilateral commitments are recorded in
the full amount of expected transfer,
irrespective of the time required for the
completion of disbursements.
Source: OECD
Owner: OECD
Capture fish production
Defined as the hunting, collecting and
gathering activities directed at removing
or collecting live wild aquatic organisms.
The capture production statistics here
indicates the nominal catches of aquatic
organisms, killed, caught, trapped or
collected for all commercial, industrial,
recreational and subsistence purposes in
live weight equivalent. Data included
here cover capture production of fish,
molluscs, crustaceans and miscellaneous
aquatic animals but exclude production
of marine mammals, crocodiles, corals,
pearls, sponges and aquatic plants. Fish
production is the sum of aquaculture and
capture fish production.
Source: Fisheries and Aquaculture
Department (Fishery and Aquaculture
statistics)
Owner: FAO
Cattle and buffaloes
Common ox (Bos taurus); zebu, humped
ox (Bos indicus); Asiatic ox (subgenus
Bibos); Tibetan yak (Poephagus
grunniens). Indian, Asiatic, pigmy, water
buffalo (Bubalus bubalus; B. arnee; B.
depressicornis); African buffalo (genus
Syncerus); American bison (Bison bison);
European bison (Bison bonasus); beeffalo
(cross between bison and domesticated
beef animal). Excludes wild bison and
buffalo.
Source: FAO, Statistics Division
Owner: FAO
Cereal import dependency ratio
This indicator provides a measure of the
dependence of a country or region from
cereal imports. The higher the value of

238
the indicator, the higher the dependence.
Specifically, the cereal imports
dependency ratio tells how much of the
available domestic food supply of cereals
has been imported and how much comes
from the country's own production. It is
computed as (cereal imports - cereal
exports)/(cereal production + cereal
imports - cereal exports) * 100. Given this
formula the indicator assumes only
values <= 100. Negative values indicate
that the country is a net exporter of
cereals. The indicator is calculated in
three year averages, to reduce the impact
of possible errors in estimated
production and trade, due to the
difficulties in properly accounting of
stock variations in major food.
Source: FAO, Statistics Division
Owner: FAO
Cereals
Include wheat, rice paddy, barley, maize,
popcorn, rye, oats, millets, sorghum,
buckwheat, quinoa, fonio, triticale,
canary seed, mixed grain and cereals nes.
Source: FAO, Statistics Division
Owner: FAO
Cereals and preparations
Includes cereals, flours and cereal grains
that are either rolled, flaked, pearled,
sliced or kibbled.
Source: FAO, Statistics Division
Owner: FAO
Consumer price index (all items)
Consumer price index (CPI) (all items)
measures the price change between the
current and reference periods of an
average basket of goods and services
purchased by households. The CPI (all
items) is typically used to measure and
monitor inflation, set monetary policy
targets, index social benefits such as
pensions and unemployment benefits.
Source: IMF and UNSD
Owner: IMF and UNSD
Consumer price index (food)
The food CPI measures the price change
between the current and reference
periods of the average basket of food
items purchased by households. The food
CPI is rescaled to a unique base year of
2010 by FAO for all countries with
sufficient time coverage. FAO uses the
geometric mean of the monthly indices
of the year 2010 as the rescaling factor.
Source: IMF, UNSD, OECD and national
statistics’ websites
Owner: IMF, UNSD and FAO
Credit to agriculture
This dataset is built by compiling official
country data published online by
national central banks in their monetary
and financial statistics publications.
Source: FAO, Statistics Division
Owner: FAO
Cropland
Land used for cultivation of crops. The
total of areas under "Arable land" and
"Permanent crops".
Source: FAO, Statistics Division
Owner: FAO
Cropping intensity ratio
The ratio of area harvested to total
cropland. The cropping intensity ratio
may exceed 1 where more than one crop
cycle is permitted each year on the same
area.
Source: FAO, Statistics Division
Owner: FAO
Crops
Crop statistics include permanent and
temporary crops and cover the following
categories: Crops primary, Fibre crops
primary, Cereals, Coarse grain, Citrus
fruit, Fruit, Oil crops (oil and cakes
equivalent), Pulses, Roots and tubers,
Treenuts and Vegetables.
Source: FAO, Statistics Division
Owner: FAO
Dairy products
Refers to group Milk equivalent
including: butter, buttermilk, cheese,
cream, ghee, milk, whey and yoghurt.
Source: FAO, Statistics Division
Owner: FAO
Dietary energy supply (kcal/cap/day)
The food available for human
consumption, expressed in kilocalories
per person per day. At the country level,
it is calculated as the food remaining for
human use after taking out all non-food
utilization, including exports, industrial
use, animal feed, seed, wastage and
changes in stocks.
Source: FAO, Statistics Division
Owner: FAO
Dietary energy supply adequacy, average
Expresses the Dietary energy supply
(DES) as a percentage of the Average
dietary energy requirement (ADER). Each
country's or region's average supply of
calories for food consumption is
normalized by the average dietary energy
requirement estimated for its population
to provide an index of adequacy of the
food supply in terms of calories.
Source: FAO, Statistics Division
Owner: FAO
Dietary energy supply, average
These figures are based on the latest
available data from national food
balance sheets, which for most countries
refer to a year between 2013 and 2016.
Source: FAO, Statistics Division
Owner: FAO

239
Dietary energy supply, share
Expresses the energy supply (in
kcal/cap/day) provided by a commodity
group as a percentage of the total Dietary
energy supply (DES) (in kcal/cap/day)
calculated from the corresponding
countries in the FAOSTAT food balance
sheets.
Source: FAO, Statistics Division
Owner: FAO
Drinking water services, at least basic
The percentage of people using at least
basic water services. This indicator
encompasses people using basic water
services as well as those using safely
managed water services. Basic drinking
water services is defined as drinking
water from an improved source, provided
collection time is not more than 30
minutes for a round trip. Improved water
sources include piped water, boreholes
or tubewells, protected dug wells,
protected springs, and packaged or
delivered water.
Source: World Bank
Owner: WHO/UNICEF Joint Monitoring
Programme (JMP) for Water Supply,
Sanitation and Hygiene (washdata.org)
Eggs, primary
Egg production by type of poultry should
refer to the total production of eggs in
the shell by all types of hens in both the
traditional sector (individually owned
small flocks) and the modern sector
(large-scale, intensive commercial
poultry farms). Total production includes
eggs for hatching but excludes farm
waste.
Source: FAO, Statistics Division
Owner: FAO
Emissions from agriculture, forestry and
other land use (AFOLU)
Contains all the emissions produced in
the different agricultural emissions sub-
domains, providing a picture of the
contribution to the total amount of GHG
emissions from agriculture. GHG
emissions from agriculture consist of
non-CO₂ gases, namely methane (CH₄) and nitrous oxide (N₂O), produced by crop and livestock production and
management activities. Land use
includes CO₂ emissions by sources and removals by sinks from forest land,
cropland and grassland, as well as
emissions of non-CO₂ from fires of biomass and organic soils.
Source: FAO, Statistics Division and
Global Forest Resources Assessments
Owner: FAO
Emissions in agriculture
Emissions in agriculture contains all the
emissions produced in the different
agricultural emissions subdomains
(enteric fermentation, manure
management, rice cultivation, synthetic
fertilizers, manure applied to soils,
manure left on pastures, crop residues,
cultivation of organic soils, burning of
crop residues, burning of savanna, energy
use), providing a picture of the
contribution to the total amount of GHG
emissions from agriculture. GHG
emissions from agriculture consist of
non-CO₂ gases, namely methane (CH₄) and nitrous oxide (N₂O), produced by crop and livestock production and
management activities. The FAOSTAT
emissions database is computed
following Tier 1 IPCC 2006 Guidelines for
National GHG Inventories.
Source: FAO, Statistics Division
Owner: FAO
Emissions in land use
Land Use Total contains all GHG
emissions and removals produced in the
different Land Use subdomains,
representing the three IPCC Land Use
categories: cropland, forest land, and
grassland, collectively called
emissions/removals from the Forestry
and Other Land Use (FOLU) sector. FOLU
emissions consist of CO₂ (carbon dioxide), CH₄ (methane) and N₂O (nitrous oxide) associated with land management
activities. CO₂ emissions/removals are
derived from estimated net carbon stock
changes in above and below-ground
biomass pools of forest land, including
forest land converted to other land uses.
CH₄ and N₂O, and additional CO₂ emissions are estimated for fires and
drainage of organic soils. The FAOSTAT
emissions database is computed
following Tier 1 IPCC 2006 Guidelines for
National GHG Inventories
Source: FAO, Statistics Division
Owner: FAO
Emissions in peatland
Calculated as emissions (CO₂eq) for cropland organic soils + grassland
organic soils + burning - biomass organic
soils. The FAOSTAT emissions database
is computed following Tier 1 IPCC 2006
Guidelines for National GHG Inventories.
Source: FAO, Statistics Division
Owner: FAO
Employment in agriculture (total
population, male, female)
Information on people of working age
(15–64) who, during a specified brief
period, were classified in the following
categories: (i) paid employment (whether
at work or with a job but not at work);
(ii) self-employment (whether at work or
with an enterprise but not at work). Data
are disaggregated by economic activity
according to the latest version of the
International Standard Industrial
Classification of All Economic Activities
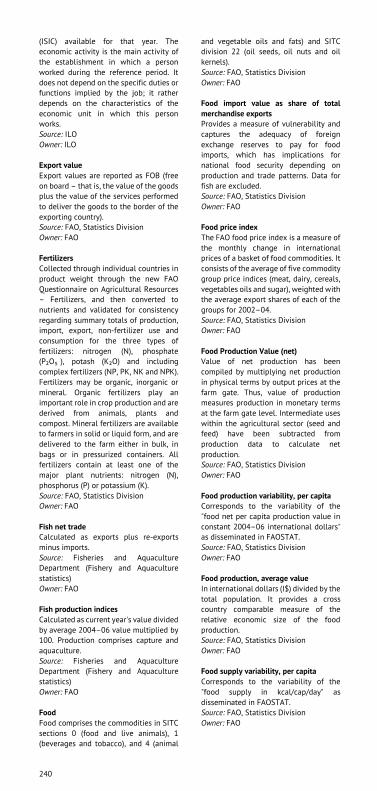
240
(ISIC) available for that year. The
economic activity is the main activity of
the establishment in which a person
worked during the reference period. It
does not depend on the specific duties or
functions implied by the job; it rather
depends on the characteristics of the
economic unit in which this person
works.
Source: ILO
Owner: ILO
Export value
Export values are reported as FOB (free
on board – that is, the value of the goods
plus the value of the services performed
to deliver the goods to the border of the
exporting country).
Source: FAO, Statistics Division
Owner: FAO
Fertilizers
Collected through individual countries in
product weight through the new FAO
Questionnaire on Agricultural Resources
– Fertilizers, and then converted to
nutrients and validated for consistency
regarding summary totals of production,
import, export, non-fertilizer use and
consumption for the three types of
fertilizers: nitrogen (N), phosphate
(P₂O₅ ), potash (K₂O) and including complex fertilizers (NP, PK, NK and NPK).
Fertilizers may be organic, inorganic or
mineral. Organic fertilizers play an
important role in crop production and are
derived from animals, plants and
compost. Mineral fertilizers are available
to farmers in solid or liquid form, and are
delivered to the farm either in bulk, in
bags or in pressurized containers. All
fertilizers contain at least one of the
major plant nutrients: nitrogen (N),
phosphorus (P) or potassium (K).
Source: FAO, Statistics Division
Owner: FAO
Fish net trade
Calculated as exports plus re-exports
minus imports.
Source: Fisheries and Aquaculture
Department (Fishery and Aquaculture
statistics)
Owner: FAO
Fish production indices
Calculated as current year's value divided
by average 2004–06 value multiplied by
100. Production comprises capture and
aquaculture.
Source: Fisheries and Aquaculture
Department (Fishery and Aquaculture
statistics)
Owner: FAO
Food
Food comprises the commodities in SITC
sections 0 (food and live animals), 1
(beverages and tobacco), and 4 (animal
and vegetable oils and fats) and SITC
division 22 (oil seeds, oil nuts and oil
kernels).
Source: FAO, Statistics Division
Owner: FAO
Food import value as share of total
merchandise exports
Provides a measure of vulnerability and
captures the adequacy of foreign
exchange reserves to pay for food
imports, which has implications for
national food security depending on
production and trade patterns. Data for
fish are excluded.
Source: FAO, Statistics Division
Owner: FAO
Food price index
The FAO food price index is a measure of
the monthly change in international
prices of a basket of food commodities. It
consists of the average of five commodity
group price indices (meat, dairy, cereals,
vegetables oils and sugar), weighted with
the average export shares of each of the
groups for 2002–04.
Source: FAO, Statistics Division
Owner: FAO
Food Production Value (net)
Value of net production has been
compiled by multiplying net production
in physical terms by output prices at the
farm gate. Thus, value of production
measures production in monetary terms
at the farm gate level. Intermediate uses
within the agricultural sector (seed and
feed) have been subtracted from
production data to calculate net
production.
Source: FAO, Statistics Division
Owner: FAO
Food production variability, per capita
Corresponds to the variability of the
"food net per capita production value in
constant 2004–06 international dollars"
as disseminated in FAOSTAT.
Source: FAO, Statistics Division
Owner: FAO
Food production, average value
In international dollars (I$) divided by the
total population. It provides a cross
country comparable measure of the
relative economic size of the food
production.
Source: FAO, Statistics Division
Owner: FAO
Food supply variability, per capita
Corresponds to the variability of the
"food supply in kcal/cap/day" as
disseminated in FAOSTAT.
Source: FAO, Statistics Division
Owner: FAO

241
Forest land
Land spanning more than 0.5 hectares
with trees higher than 5 metres and a
canopy cover of more than 10 percent, or
trees able to reach these thresholds in
situ. Excludes land that is predominantly
under agricultural or urban land use, and
land that is predominantly used for
maintenance and restoration of
environmental function. Explanatory
notes:
• Forest land is determined both by the presence of trees and by the absence of
other predominant land uses. The trees
should be able to reach a minimum
height of 5 metres in situ.
• Includes areas with young trees that have not yet reached but that are
expected to reach a canopy cover of 10
percent and tree height of 5 metres. It
also includes areas that are temporarily
unstocked owing to clear-cutting as part
of a forest management practice or
natural disasters, and that are expected
to be regenerated within five years. Local
conditions may, in exceptional cases,
justify the use of a longer time frame.
• Includes forest roads, firebreaks and other small open areas.
• May include forest land in national parks, nature reserves and other
protected areas, such as those of specific
environmental, scientific, historical,
cultural or spiritual interest.
• Includes windbreaks, shelter belts and corridors of trees with an area of more
than 0.5 hectares and width of more than
20 metres.
• Includes abandoned shifting cultivation land with a regeneration of trees that
have, or is expected to reach, a canopy
cover of 10 percent and tree height of 5
metres.
• Includes areas with mangroves in tidal zones, regardless of whether this area is
classified as land area or not.
• Includes areas with bamboo and palms provided that land use, height and
canopy cover criteria are met.
• Some agroforestry systems such as the taungya system, where crops are grown
only during the first years of the forest
rotation should be classified as forest.
• Excludes tree stands in agricultural production systems, such as fruit-tree
plantations (permanent crops), oil palm
plantations, rubber and Christmas trees
(permanent crops) and agroforestry
systems when crops are grown under tree
cover.
Source: FAO, Statistics Division
Owner: FAO
Forest products import and export
Includes the following products:
Chemical wood pulp; Dissolving wood
pulp; Fibreboard, compressed (1961–1994); Hardboard; Industrial roundwood,
coniferous (export/import); Industrial
roundwood, non-coniferous non-tropical;
export/import); Industrial roundwood,
non-coniferous tropical (export/import);
MDF/HDF; Mechanical wood pulp;
Newsprint; Other agglomerates; Other
fibreboard; Other industrial roundwood,
all species (export/import, 1961–1989);
Other industrial roundwood, coniferous
(production); Other industrial
roundwood, non-coniferous (production);
Other paper and paperboard; Particle
board and OSB; Plywood; Printing and
writing papers; Pulp from fibres other
than wood; Pulpwood and particles,
coniferous (production, 1961–97);
Pulpwood and particles, non-coniferous
(production, 1961–97); Pulpwood, round
and split, all species (export/import,
1961–89); Recovered paper; Sawlogs
and veneer logs, coniferous; Sawlogs and
veneer logs, non-coniferous; Sawnwood,
coniferous; Sawnwood, non-coniferous
all; Semi-chemical wood pulp; Veneer
sheets; Wood charcoal; Wood chips and
particles; Wood fuel, all species
(export/import); Wood pellets; Wood
residues.
Source: FAO, Forestry Department
Owner: FAO
Freshwater withdrawal as % of total
renewable water resources
Total freshwater withdrawn in a given
year, expressed as a percentage of the
total renewable water resources (TRWR).
This parameter is an indication of the
pressure on the renewable water
resources. It was the Millennium
Development Goal (MDG) Indicator 7.5,
from which the Sustainable Development
Goal (SDG) indicator 6.4.2 is derived with
the introduction of Environmental Flow
Requirements.
Source: FAO, Land and Water Division
(AQUASTAT)
Owner: FAO
Fruit and vegetables
Vegetables, as classified in this group,
are mainly annual plants cultivated as
field and garden crops in the open and
under glass, and used almost exclusively
for food. Vegetables grown principally for
animal feed or seed should be excluded.
Certain plants, normally classified as
cereals and pulses, belong to this group
when harvested green, such as green
maize, green peas, etc. Chillies and green
peppers are included in this grouping
when they are harvested for consumption
as vegetables and not processed into
spices. Trade data for fresh vegetables
also include chilled vegetables, meaning
the temperature of the products has been
reduced to around 0℃ without the
products being frozen. Fruit crops consist
of fruits and berries that, with few
exceptions, are characterized by their
sweet taste. Nearly all are permanent
242
crops, mainly from trees, bushes and
shrubs, as well as vines and palms. Fruit
crops are consumed directly as food and
are processed into dried fruit, fruit juice,
canned fruit, frozen fruit, jam, alcoholic
beverages, etc.
Source: FAO, Statistics Division
Owner: FAO
GDP per capita (constant 2011
international $, PPP)
GDP per capita based on purchasing
power parity (PPP). PPP GDP is gross
domestic product converted to
international dollars using purchasing
power parity rates. An international
dollar has the same purchasing power
over GDP as the USD has in the United
States of America. GDP at purchaser's
prices is the sum of gross value added by
all resident producers in the economy
plus any product taxes and minus any
subsidies not included in the value of the
products. It is calculated without making
deductions for depreciation of fabricated
assets or for depletion and degradation
of natural resources. Data are in constant
2011 international dollars.
Source: World Bank
Owner: World Bank
Government expenditure on agriculture
This refers to core areas of government
functions relevant to agriculture, forestry
and fishing (AFF) based on the
Classification of Functions of
Government (COFOG) as outlined in the
Government Finance Statistics Manual of
IMF, 2001 (GFSM 2001). Statistics on
expenditure in AFF are used to compile
an Agriculture Orientation Index (AOI).
Source: FAO, Statistics Division
Owner: FAO and IMF
Growth rate, average annual
Calculated using a least squares growth
rate with at least 50 percent of the values
present in the time series.
Source: FAO, Statistics Division
Owner: FAO
Growth rate, geometric
Calculated using a geometric growth rate
with at least 50 percent of the values
present in the time series.
Source: FAO, Statistics Division
Owner: FAO
Import value
Import values are reported as CIF (cost
insurance and freight – that is, the value
of the goods, plus the value of the
services performed to deliver goods to
the border of the exporting country, plus
the value of the services performed to
deliver the good from the border of the
exporting country to the border of the
importing country).
Source: FAO, Statistics Division
Owner: FAO
Import value index
Value indices represent the change in the
current values of import CIF (cost,
insurance and freight) all expressed in
USD. For countries which report import
values on an FOB (free on board) basis,
these are adjusted to approximate CIF
values (by a standard factor of
112 percent).
Source: FAO, Statistics Division
Owner: FAO
Industrial water withdrawal
Refers to the annual quantity of self-
supplied water withdrawn for industrial
uses. It can include water from primary
renewable and secondary freshwater
resources, as well as water from over-
abstraction of renewable groundwater or
withdrawal from fossil groundwater,
direct use of agricultural drainage water,
direct use of (treated) wastewater, and
desalinated water. This sector refers to
self-supplied industries not connected to
the public distribution network. The ratio
between net consumption and
withdrawal is estimated at less than
5 percent. It includes water for the
cooling of thermoelectric and nuclear
power plants, but it does not include
hydropower. Water withdrawn by
industries that are connected to the
public supply network is generally
included in municipal water withdrawal.
Source: FAO, Land and Water Division
(AQUASTAT)
Owner: FAO
Industry, value added
Industry corresponds to ISIC Divisions
10–45 and includes manufacturing (ISIC
Divisions 15–37). It comprises value
added in mining, manufacturing (also
reported as a separate subgroup),
construction, electricity, water, and gas.
Value added is the net output of a sector
after adding up all outputs and
subtracting intermediate inputs. It is
calculated without making deductions
for depreciation of fabricated assets or
depletion and degradation of natural
resources. The origin of value added is
determined by the International
Standard Industrial Classification (ISIC),
revision 3 or 4.
Source: World Bank
Owner: World Bank
Inflation rate
Inflation rate for any month refers to the
percentage change in the Index number
for the month as compared to the Index
number of the corresponding month of
the previous year. Global and regional
food consumer price inflation measures
food inflation for a group of countries at

243
different geographical scales: Africa,
Europe, Oceania, Latin America and the
Caribbean, North America and Asia.
Global and regional inflation are
calculated using population weights,
which may better reflect the impact of
food inflation on consumers than
indicators such as GDP weights.
Source: FAO, Statistics Division
Owner: FAO
Total renew. water resources
Total renew. water resources (IRWR)
refers to long-term average annual flow
of rivers and recharge of aquifers
generated from endogenous
precipitation. Double counting of surface
water and groundwater resources is
avoided by deducting the overlap from
the sum of the surface water and
groundwater resources.
Source: FAO, Land and Water Division
(AQUASTAT)
Owner: FAO
Labour force participation rate
The proportion of the population aged
15–64 that is economically active: all
people who supply labour for the
production of goods and services during
a specified period.
Source: World Bank
Owner: KILM database, ILO
Land area
Country area excluding area under inland
waters and coastal waters.
Source: FAO, Statistics Division
Owner: FAO
Land area equipped for irrigation
Land area equipped with irrigation
infrastructure and equipment, in working
order, to provide water to crops. The
equipment does not have to be used
during the reference year. The area
equipped for irrigation covers areas
equipped for fully controlled irrigation by
any of the methods of surface, sprinkler
or localized irrigation. It also includes
areas under partially controlled irrigation
methods of spate irrigation (controlling
floodwater to water crops), equipped
wetlands and inland valley bottoms and
equipped flood recession. It excludes
manual watering of plants using buckets,
watering cans or other devices.
Source: FAO, Statistics Division
Owner: FAO
Land under permanent crops
Land cultivated with long-term crops
which do not have to be replanted for
several years (such as cocoa and coffee),
land under trees and shrubs producing
flowers (such as roses and jasmine), and
nurseries (except those for forest trees,
which should be classified under
"Forestry"). Permanent meadows and
pastures are excluded from land
underpermanent crops.
Source: FAO, Statistics Division
Owner: FAO
Land under permanent meadows and
pastures
Land used permanently (five years or
more) to grow herbaceous forage crops
through cultivation or naturally (wild
prairie or grazing land). Permanent
meadows and pastures on which trees
and shrubs are grown should be recorded
under this heading only if the growing of
forage crops is the most important use of
the area. Measures may be taken to keep
or increase productivity of the land (i.e.
use of fertilizers, mowing or systematic
grazing by domestic animals.) This class
includes:
• Grazing in wooded areas (agroforestry areas, for example)
• Grazing in shrubby zones (heath, maquis, garigue)
• Grassland in the plain or low mountain areas used for grazing: land crossed
during transhumance where the animals
spend a part of the year (approximately
100 days) without returning to the
holding in the evening: mountain and
subalpine meadows and similar; and
steppes and dry meadows used for
pasture.
Source: FAO, Statistics Division
Owner: FAO
Life expectancy at birth (years)
Indicates the number of years a newborn
infant would live if prevailing patterns of
mortality at the time of its birth were to
stay the same throughout its life.
Source: World Bank
Owner: UNPD World Population
Prospects 2010
Live animals
Includes: asses, buffaloes, beehives,
camels, other camelids, cattle, chickens,
ducks, geese and guinea fowl, goats,
horses, mules, pigeons, other birds, pigs,
rabbits and hares, other rodents, sheep,
turkeys and live animals nes.
Source: FAO, Statistics Division
Owner: FAO
Livestock primary production
Includes products from live and
slaughtered animals. Products from
slaughtered animals include meat, offals,
raw fats, fresh hides and skins. Products
from live animals include milk, eggs,
honey, beeswax and fibres of animal
origin.
Source: FAO, Statistics Division
Owner: FAO
Meat
FAO defines meat as the flesh of animals
used for food. In production data, meat is
244
normally reported inclusive of bone and
exclusive of meat that is unfit for human
consumption. As reported by individual
countries, meat production data may
refer either to commercial production
(meat entering marketing channels),
inspected production (from animals
slaughtered under sanitary inspection),
or total production (the total of the
above-mentioned categories plus
slaughter for personal consumption). All
FAO annual production data refer to total
production.
Source: FAO, Statistics Division
Owner: FAO
Milk
Whole fresh milk production from
buffaloes, camels, cows, goats and sheep.
Source: FAO, Statistics Division
Owner: FAO
Multilateral development flow (aid) to
AFF
Multilateral flows are channelled via an
international organization active in
development (e.g. World Bank, UNDP).
Commitments of aid are reported as the
sum of (i) any disbursements in the year
reported on which have not previously
been notified as commitments and
(ii) expected disbursements in the
following year.
Source: OECD
Owner: OECD
Net emissions/removal from forest land
Net CO₂ emissions/removals from forest land consist of net carbon stock change
in the living biomass pool (aboveground
and belowground) associated with:
(i) forest, referring to changes occurred
on forest land in the reported year; and
(ii) net forest conversion from forest land
to other land uses. The FAOSTAT data are
computed at Tier 1, with the stock
difference method, following IPCC 2006
Vol. 4, Ch. 2 and 4.
Source: FAO, Statistics Division
Owner: FAO
Net forest conversion, net
emissions/removal
Annual net CO₂ emission/removal from forest land consist of net carbon stock
gain/loss in the living biomass pool
(aboveground and belowground
biomass) associated with forest and net
forest conversion. The FAOSTAT
emissions database is computed
following Tier 1 IPCC 2006 Guidelines for
National GHG Inventories and using area
and carbon stocks data compiled by
countries in the FAO Global Forest
Resource Assessments.
Source: FAO, Statistics Division
Owner: FAO
Net trade
Value in USD of exports - imports.
Source: FAO, Statistics Division
Owner: FAO
Offals
Can include edible offals from cattle,
buffaloes, sheep, goats, pigs, horses,
camels and other camelids, liver
preparations, and liver from chickens,
geese, ducks and turkeys.
Source: FAO, Statistics Division
Owner: FAO
Organic area
Sum of areas under "Agricultural area
certified organic" and "Agricultural area
in conversion to organic". Agricultural
area certified organic is the land area
exclusively dedicated to organic
agriculture and managed by applying
organic agriculture methods. It refers to
the land area fully converted to organic
agriculture. It is the portion of land area
(including arable lands, pastures or wild
areas) managed (cultivated) or wild
harvested in accordance with specific
organic standards or technical
regulations and that has been inspected
and approved by a certification body.
Agricultural area in conversion to organic
is the land area which is going through
the organic conversion process, usually a
two-year period of conversion to organic
land.
Source: FAO, Statistics Division
Owner: FAO
Other naturally regenerated forest
Naturally regenerated forest where there
are clearly visible indications of human
activities. Explanatory notes:
1. Includes selectively logged-over areas,
areas regenerating following agricultural
land use, areas recovering from human-
induced fires, etc.
2. Includes forests where it is not
possible to distinguish whether planted
or naturally regenerated.
3. Includes forests with a mix of naturally
regenerated trees and planted/seeded
trees, and where the naturally
regenerated trees are expected to
constitute more than 50 percent of the
growing stock at stand maturity.
Source: Global Forest Resources
Assessment, FAO
Owner: FAO
Paper and paperboard
The paper and paperboard category is an
aggregate category. In the production
and trade statistics, it represents the sum
of graphic papers; sanitary and
household papers; packaging materials
and other paper and paperboard. It
excludes manufactured paper products
such as boxes, cartons, books and
magazines, etc.
245
Source: FAO, Forestry Department
Owner: FAO
Pesticides
Refer to insecticides, fungicides,
herbicides, disinfectants and any
substance or mixture of substances
intended for preventing, destroying or
controlling any pest, including vectors of
human or animal disease, unwanted
species of plants or animals causing harm
during or otherwise interfering with the
production, processing, storage,
transport or marketing of food,
agricultural commodities, wood and
wood products or animal feedstuffs, or
substances which may be administered
to animals for the control of insects,
arachnids or other pests in or on their
bodies. The term includes substances
intended for use as a plant growth
regulator, defoliant, desiccant or agent
for thinning fruit or preventing the
premature fall of fruit, and substances
applied to crops either before or after
harvest to protected the commodity from
deterioration during storage and
transport. Pesticides use data refers to
quantities of pesticides applied to crops
and seeds in the agricultural sector.
Figures are expressed in metric tonnes of
active ingredients. However, due to some
country reporting practices, the data may
be reported by: use in formulated
product; sales; distribution or imports for
use in the agricultural sector.
Source: FAO, Statistics Division
Owner: FAO
Planted forest
Forest predominantly composed of trees
established through planting and/or
deliberate seeding. Explanatory notes:
1. In this context, predominantly means
that the planted/seeded trees are
expected to constitute more than 50
percent of the growing stock at maturity.
2. Includes coppice from trees that were
originally planted or seeded.
3. Includes rubberwood, cork oak and
Christmas tree plantations.
4. Excludes self-sown trees of introduced
species.
Source: Global Forest Resources
Assessment, FAO
Owner: FAO
Population, rural
De facto population living in areas
classified as rural (that is, it is the
difference between the total population
of a country and its urban population).
Data refer to 1 July of the year indicated.
Source: FAO, Statistics Division
Owner: United Nations, World
Urbanization Prospects – the 2014
Revision
Population, total
De facto population in a country, area or
region as of 1 July of the year indicated.
Source: FAO, Statistics Division
Owner: United Nations, World Population
Prospects – the 2017 Revision
Population, urban
De facto population living in areas
classified as rural (that is, it is the
difference between the total population
of a country and its rural population).
Data refer to 1 July of the year indicated.
Source: FAO, Statistics Division
Owner: United Nations, World
Urbanization Prospects – the 2014
Revision
Primary forest
Naturally regenerated forest of native
species, where there are no clearly visible
indications of human activities and the
ecological processes are not significantly
disturbed. Some key characteristics of
primary forests are:
• they show natural forest dynamics, such as natural tree species composition,
occurrence of dead wood, natural age
structure and natural regeneration
processes;
• the area is large enough to maintain its
natural characteristics;
• there has been no known significant human intervention or the last significant
human intervention was long enough
ago to have allowed the natural species
composition and processes to have
become re-established.
Source: Global Forest Resources
Assessment, FAO
Owner: FAO
Private development flow (aid) to AFF
It consists of flows at market terms
financed out of private sector resources
(i.e. changes in holdings of private long-
term assets held by residents of the
reporting country) and private grants (i.e.
grants by non-governmental
organizations and other private bodies,
net of subsidies received from the official
sector).
Source: OECD
Owner: OECD
Production
Figures relate to the total domestic
production whether inside or outside the
agricultural sector, i.e. it includes non-
commercial production and production
from kitchen gardens. Unless otherwise
indicated, production is reported at the
farm level for crop and livestock products
(i.e. in the case of crops, excluding
harvesting losses) and in terms of live
weight for fish items (i.e. the actual ex-
water weight at time of catch). All data
shown relate to total meat production
from both commercial and farm
246
slaughter. Data are expressed in terms of
dressed carcass weight, excluding offal
and slaughter fats. Production of beef
and buffalo meat includes veal; mutton
and goat meat includes meat from lambs
and kids; pig meat includes bacon and
ham in fresh equivalent. Poultry meat
includes meat from all domestic birds
and refers, wherever possible, to ready-
to-cook weight.
Source: FAO, Statistics Division
Owner: FAO
Production indices
The FAO indices of agricultural
production show the relative level of the
aggregate volume of agricultural
production for each year in comparison
with the base period 2004–06. It should
be noted that when calculating indices of
agricultural, food and non-food
production, all intermediate primary
inputs of agricultural origin are deducted.
Source: FAO, Statistics Division
Owner: FAO
Production, crops
Refer to the actual harvested production
from the field or orchard and gardens,
excluding harvesting and threshing
losses and that part of crop not harvested
for any reason. Production therefore
includes the quantities of the commodity
sold in the market (marketed production)
and the quantities consumed or used by
the producers (auto-consumption). When
the production data available refers to a
production period falling into two
successive calendar years and it is not
possible to allocate the relative
production to each of them, it is usual to
refer production data to that year into
which the bulk of the production falls.
Crop production data are recorded in
tonnes (t). In many countries, crop
production data are obtained as a
function of the estimated yield and the
total area. If such a compilation method
of production statistics is enforced by the
country, it must be ensured that the total
area does not refer to sown or planted
area, which would give then the
biological production, but to the actually
harvested area during the year.
Source: FAO, Statistics Division
Owner: FAO
Protein supply of animal origin, average
National average protein supply
(expressed in grams per capita per day).
Includes the following groups: meat;
offals; animal fats and products; milk and
products; eggs, fish, seafood and
products; and aquatic products, other.
Source: FAO, Statistics Division
Owner: FAO
Protein supply, average
National average protein supply
(expressed in grams per capita per day).
Source: FAO, Statistics Division
Owner: FAO
Rail lines density
Rail lines density corresponds to the ratio
between the length of railway route
available for train services, irrespective
of the number of parallel tracks (rail
lines, total route in km) with the area of
the country.
Source: FAO, Statistics Division
Owner: World Bank
Recovered paper
Waste and scraps of paper or paperboard
that have been collected for reuse or
trade. It includes paper and paperboard
that has been used for its original
purpose and residues from paper and
paperboard production.
Source: FAO, Forestry Department
Owner: FAO
Renewable water resources
Total renewable water resources refers
to the sum of internal renewable water
resources and external renewable water
resources. It corresponds to the
maximum theoretical yearly amount of
water available for a country at a given
moment.
Source: FAO, Land and Water Division
(AQUASTAT)
Owner: FAO
Roots and tubers
Roots and Tubers are plants yielding
starchy roots, tubers, rhizomes, corms
and stems. The denomination "roots and
tubers" excludes crops which are
cultivated mainly for feed (mangolds,
swedes) or for processing into sugar
(sugar beets), and those classified as
"roots, bulb and tuberous vegetables"
(onions, garlic and beets).
Source: FAO, Statistics Division
Owner: FAO
Safely managed drinking water services
(% of population using)
The percentage of people using drinking
water from an improved source that is
accessible on premises, available when
needed and free from faecal and priority
chemical contamination. Improved water
sources include piped water, boreholes
or tubewells, protected dug wells,
protected springs, and packaged or
delivered water.
Source: World Bank
Owner: WHO/UNICEF Joint Monitoring
Programme (JMP) for Water Supply,
Sanitation and Hygiene (washdata.org)

247
Sanitation services, at least basic
The percentage of people using at least
basic sanitation services, that is,
improved sanitation facilities that are not
shared with other households. This
indicator encompasses people using
basic sanitation services as well as those
using safely managed sanitation services.
Improved sanitation facilities include
flush/pour flush to piped sewer systems,
septic tanks or pit latrines, ventilated
improved pit latrines, compositing toilets
or pit latrines with slabs.
Source: World Bank
Owner: World Bank
Services, value added
Services correspond to the International
Standard Industrial Classification (ISIC)
Divisions 50–99 and they include value
added in wholesale and retail trade
(including hotels and restaurants),
transport, and government, financial,
professional and personal services such
as education, health care and real estate
services. Also included are imputed bank
service charges, import duties, and any
statistical discrepancies noted by
national compilers as well as
discrepancies arising from rescaling.
Value added is the net output of a sector
after adding up all outputs and
subtracting intermediate inputs. It is
calculated without making deductions
for depreciation of fabricated assets or
depletion and degradation of natural
resources. The industrial origin of value
added is determined by the International
Standard Industrial Classification (ISIC)
revision 3 or 4.
Source: World Bank
Owner: World Bank
Severe food insecurity, prevalence
The prevalence of severe food insecurity
is an estimate of the percentage of
people in the population who live in
households classified as severely food
insecure. The assessment is conducted
using data collected with the FIES or a
compatible experience-based food
security measurement questionnaire
(such as the HFSSM, the HFIAS, the EBIA,
the ELCSA, etc.). The probability to be
food insecure is estimated using the one-
parameter logistic Item Response Theory
model (the Rasch model) and thresholds
for classification are made cross country
comparable by calibrating the metrics
obtained in each country against the FIES
global reference scale, maintained by
FAO. The threshold to classify "severe"
food insecurity corresponds to the
severity associated with the item "having
not eaten for an entire day" on the global
FIES scale. In simpler terms, a household
is classified as severely food insecure
when at least one adult in the household
has reported to have been exposed, at
times during the year, to several of the
most severe experiences described in the
FIES questions, such as to have been
forced to reduce the quantity of the food,
to have skipped meals, having gone
hungry, or having to go for a whole day
without eating because of lack of money
or other resources. It is an indicator of
lack of food access.
Source: FAO, Statistics Division
Owner: FAO
Severely food insecure people, number
Estimated number of people living in
households classified as severely food
insecure. It is calculated by multiplying
the estimated percentage of people
affected by severe food insecurity by the
total population.
Source: FAO, Statistics Division
Owner: FAO
Starchy roots
Includes cassava and products, potatoes
and products, sweet potatoes and other
roots.
Source: FAO, Statistics Division
Owner: FAO
Stunting, children under 5 years of age
Height-for-age less than -2 standard
deviations of the WHO Child Growth
Standards median, among children aged
0–59 months.
Source: World Bank
Owner: UNICEF/WHO/The World Bank:
Joint child malnutrition estimates
Sugar
Includes: sugar beet, sugar cane, sugar
crops nes.
Source: FAO, Statistics Division
Owner: FAO
Sweeteners
Can include fructose, maltose, maple
sugar and syrups, molasses, glucose and
dextrose, lactose, isoglucose, non-
alcoholic beverages, sugar and sugar
crops not elsewhere specified.
Source: FAO, Statistics Division
Owner: FAO
Terrestrial protected areas (% total land
area)
Totally or partially protected areas of at
least 1 000 hectares that are designated
by national authorities as scientific
reserves with limited public access,
national parks, natural monuments,
nature reserves or wildlife sanctuaries,
protected landscapes, and areas
managed mainly for sustainable use.
Marine areas, unclassified areas, littoral
(intertidal) areas, and sites protected
under local or provincial law are
excluded.
248
Source: World Bank
Owner: United Nations Environmental
Program and the World Conservation
Monitoring Centre, as compiled by the
World Resources Institute
Undernourished, number of people
Number of people in a condition of
undernourishment. The number of
people undernourished is obtained by
multiplying estimates of the proportion
of undernourished for each country by
estimates of the total population.
Undernourishment refers to the
condition of people whose dietary energy
consumption is continuously below a
minimum dietary energy requirement for
maintaining a healthy life and carrying
out a light physical activity.
Source: FAO, Statistics Division
Owner: FAO
Undernourishment, prevalence
Expresses the probability that a
randomly selected individual from the
population consumes an amount of
calories that is insufficient to cover their
energy requirement for an active and
healthy life. The indicator is computed by
comparing a probability distribution of
habitual daily dietary energy
consumption with a threshold level
called the minimum dietary energy
requirement. Both are based on the
notion of an average individual in the
reference population.
Source: FAO, Statistics Division
Owner: FAO
Vegetable oils
Refers to the oil equivalent of oilcrops,
which include seeds, nuts, oil palm fruit,
olives and soybeans.
Source: FAO, Statistics Division
Owner: FAO
Wasting, children under 5 years of age
Weight-for-height is more than two
standard deviations below the median
for the international reference
population aged 0–59 months.
Source: World Bank
Owner: UNICEF/WHO/The World Bank:
Joint child malnutrition estimates
Wood pellet production
Wood agglomerates produced from co-
products (such as cutter shavings,
sawdust or chips) of the mechanical
wood processing industry, furniture-
making industry or other wood
transformation activities. They are
produced either directly by compression
or by the addition of a binder in a
proportion not exceeding 3 percent by
weight. Such pellets are cylindrical, with
a diameter not exceeding 25 mm and a
length not exceeding 100 mm.
Source: FAO, Forestry Department
Owner: FAO
Wood pulp
Fibrous material prepared from
pulpwood, wood chips, particles or
residues by mechanical and/or chemical
process for further manufacture into
paper, paperboard, fibreboard or other
cellulose products. It is an aggregate
comprising mechanical wood pulp; semi-
chemical wood pulp; chemical wood
pulp; and dissolving wood pulp. It is
reported in metric tonnes air-dry weight
(i.e. with 10 percent moisture content).
Source: FAO, Forestry Department
Owner: FAO
Yield, crops
Harvested production per unit of
harvested area for crop products. In most
of the cases yield data are not recorded
but are obtained by dividing the
production data by the data on area
harvested. Data on yields of permanent
crops are not as reliable as those for
temporary crops either because most of
the area information may correspond to
planted area, as for grapes, or because of
the scarcity and unreliability of the area
figures reported by the countries, as for
example for cocoa and coffee.
Source: FAO, Statistics Division
Owner: FAO

Good decisions are based on accurate information. Since its foundation, FAO is at the forefront of providing internationally comparable, sound and timely data on world agriculture and food security. This pocketbook offers easy access to the most important FAOSTAT data, at a glance.
To access and download complete data and documentation, check the FAOSTAT website, available in Arabic, Chinese, English, French, Russian and Spanish.
www.fao.org/faostat/
| W
ORLD
FO
OD
AND A
GRIC
ULTU
RE
| STA
TIS
TIC
AL P
OC
KETB
OO
K | 2
018
FAO
STA
TIS
TIC
S
WORLD FOOD AND AGRICULTURE
2017
STATISTICAL POCKETBOOK
2018
FAOSTATISTICS
CA1796EN/2/02.19
ISBN 978-92-5-131012-0
9 7 8 9 2 5 1 3 1 0 1 2 0