world bank thailand office country director: ian c....
TRANSCRIPT

World Bank Thailand Office Country Director: Ian C. Porter
Chief Economist: Homi Kharas
Comments to: Kazi M. Matin
[email protected] Kirida Bhaopichitr
30th Floor, Siam Tower 989 Rama I Road, Pathumwan
Bangkok 10330, Thailand (662) 686-8300
http://www.worldbank.or.th
Acknowledgements This report was prepared by Kirida Bhaopichitr (Task Team Leader), Wallada Atsavasirilert, Ruangrong Thongampai and Angkanee Luangpenthong under the overall supervision of Kazi M. Matin. We would like to acknowledge input from Renuka Vongviriyatham and Cristina Otano (Financial and Corporate Sector), Tanatat Puttasuwan (Corporate Sector and Business Climate), Eric Sidgwick (Public Sector Reforms), Kaspar Richter (Poverty), Cheanchom Thongjen (Poverty and Public Sector Reforms), Kwanchai Niyomthamkit (Social Protection), Behdad Nowroozi (Corporate Governance) Zhi Liu (Infrastructure). Valuable comments and information were provided by officials of the Bank of Thailand, Board of Investment, Department of Trade Negotiations, Department of Export Promotion, Energy Policy and Planning Office, EXIM Bank, Federation of Thai Industry, Fiscal Policy Office, Fiscal Policy Research Institute, Government Savings Bank, Ministry of Labor, National Credit Bureau, Office of the National Economic and Social Development Board, National Statistics Office, Office of Agricultural Economics, Office of Industrial Economics, Office of the Decentralization to Local Government Organization Committee, Office of the Public Sector Development Commission, Securities and Exchange Commission, Stock Exchange of Thailand, Thai Bond Market Association, Thai Chamber of Commerce, Thailand Development Research Institute, TISCO, as well as by World Bank staff including Homi Kharas, Ian C. Porter, and Milan Brahmbhatt.

THAILAND ECONOMIC MONITOR NOVEMBER 2005
2
ABBREVIATIONS
ADB Asian Development Bank AGM Annual General Meeting AMC Asset Management Companies AMLO Anti-Money Laundering Office ASEAN Association of Southeast Asian Nations BAAC Bank for Agriculture and Agricultural Cooperatives BOI Board of Investment BOT Bank of Thailand CBC Central Bankruptcy Court CEP Closer Economic Partnership CDMA Code Division Multiple Access CDP Country Development Partnership CDRAC Corporate Debt Restructuring Advisory Committee CEO Chief Executive Officer CPI Consumer Price Index DOI Department of Insurance DOT Direction of Trade EGA E-Government Agency EGAT Electricity Generating Authority of Thailand EHP Early Harvest Program EU European Union EXIM Bank Export-Import Bank FDI Foreign Direct Investments FIDF Financial Institutions Development Fund FPO Fiscal Policy Office FTA Free Trade Agreements FTPI Thailand Productivity Institute FY Fiscal Year GCC Gulf Cooperation Council GCS Government Counter Services
GDP Gross Domestic Product GFMIS Government Fiscal Management Information System GSB Government Savings Bank HS Harmonized System ICAAT The Institute of Certified Accountant and Auditor of Thailand ICP Insurance Core Principles ISIC International Standard Industrial Classification

THAILAND ECONOMIC MONITOR NOVEMBER 2005
3
KPIs Key Performance Indicators LFS Labour Force Survey LRC Legal Reform Committee for Development of Thailand MCFD Mediation Center for Financial Disputes MFN tariff Most-Favored-Nation tariff MOAC Ministry of Agriculture and Cooperatives MOC Ministry of Commerce MOU Memorandum of Understanding MLR Minimum Loan Rates MSDC Microfinance System Development Committee MUV Manufacturing Unit Value NIDA National Institute for Development Administration NBFIs Non-bank Financial Institutions NESDB National Economic and Social Development Board NLRDC National Legal Reform and Development Committee NLFDC National Legal Framework and Policy Committee NPLs Non-Performing Loans OECD Organization for Economic Cooperation and Development OPDC Office of Public Development Commission PAMP Public Affairs Management Plan PATH People’s Audit for Thailand PCA Public Limited Companies Act PICS Productivity and Investment Climate Study PII Private Investment Index PPI Producer Price Index PPP Private Public Partnership PSA Public Sector Account PSDS Public Sector Development Strategy ROSCs Report on Standards and Codes RTGS Real Time Gross Settlement SARS Severe Acute Respiratory Syndrome SDUs Service Delivery Units SEA Securities and Exchange Commission Act SEC Securities Exchange Commission SES Socio-Economic Survey SET Stock Exchange of Thailand SFIs Specialized financial institutions SMEs Small and Medium Enterprises SML Small-Medium-Large SOEs State-owned Enterprises SPVs Special Purpose Vehicles

THAILAND ECONOMIC MONITOR NOVEMBER 2005
4
TAMC Thai Asset Management Corporation TCI Technology Capacity Index TFEX Thailand Future Exchange TFP Total Factor Productivity TOT Telephone Organization of Thailand TSD Thailand Security Depositary Company TVQ Thai Vocational Qualifications UTCC University of The Thai Chamber of Commerce WB World Bank WTI West Texas Intermediate yoy Year-on-year
THAILAND ECONOMIC MONITOR NOVEMBER 2005
5
TABLE OF CONTENTS
SECTION 1 Overview 6
SECTION 2 Recovery and Outlook 10
2.1 Real GDP Growth 2005 and 2006 10
2.2 Poverty 12
2.3 Uncertain External Environment 15
2.4 Export Performance 19
2.5 Household Consumption 22
2.6 Investment 23
2.6.1 Private Investment 23
2.6.2 Public Investment 28
2.7 Financial and Corporate Sector Development 32
2.8 Improving Competitiveness 39
SECTION 3 Implementation of Structural Reforms 45
3.1 Financial and Corporate Sector Reforms and Restructuring 46
3.2 Recent Trade Reforms 52
3.3 Public Sector Reform 54
Appendix 1: Key Economic Indicators 57
Appendix 2. Monitoring Matrices for Structural Reform Implementation 59

THAILAND ECONOMIC MONITOR NOVEMBER 2005
6
SECTION 1
OVERVIEW Economic growth is estimated to be 4.2 percent in 2005, but significantly lower than the 6.1 percent achieved last year, but should speed up to 5 percent next year. The tsunami, drought, unrest in the South, slowdown in world trade and, of course, a large rise in oil prices have all taken a toll on consumer and investor confidence this year. Growth in domestic demand is thus depressed and net export growth is down. While the effects of tsunami and drought will wear off, and export demand is expected to pick up next year, the effects of large increases in oil prices will continue to constrain the pace of recovery in GDP growth in 2006, as the economy adjusts to higher oil prices. GDP is thus expected to grow at around 5 percent next year. Poverty reduction remains high on the national agenda. Under the recently revised poverty line, incidence of poverty in terms of headcount has fallen from 21.3 percent in 2000 (14.2 percent in 2000 based on the old poverty line) to 11.3 percent in 2004. This decline was mainly contributed by the reduction in the number of poor in the Northeast. The Northeast, which is the most populous region and houses more than half of Thailand’s poor, has seen a reduction in headcount from 35 percent of population in 2000 to 17.2 percent in 2004. Thailand is one of the countries in the region that has been very effective in judiciously passing-through the higher world oil price to its users. As a result, average retail prices for oil products in 2005 are more than 40 percent higher than the retail price in 2003 and more than 50 percent higher than that in 2002. The largest increase this year has been for diesel as the subsidy was removed1. This measure is strengthening further the macro-economic situation in the face of higher world oil prices in several ways. First, the Oil Fund is no longer adding to the deficit of nearly Bt 90 billion that it accumulated in the earlier period, thereby reducing the consolidated fiscal deficit. Second, growth in domestic oil consumption has slowed noticeably, reducing the pressure on the import bill and the current account balance. In fact, growth in gasoline consumption, falling since last year, has turned negative this year, while growth in diesel consumption, though still brisk, has fallen. Third, this pass-through of higher prices is promoting conservation and increased efficiency in the use of oil and energy; also the government’s support for conservation will help accelerate this trend. Fourth, the Government has taken supplementary measures to alleviate the impact on workers by raising the minimum wages as well as promoting additional fiscal spending. Nevertheless, higher oil prices will constrain the rebound in GDP growth next year, as households and firms adjust to become more efficient user of oil and energy. Given the high oil intensity in Thailand, growth in consumption and investment will pick up slowly next year, as households and firms adjust. The higher cost of production for service providers like those in transport and power, has also led to increases in transport and power costs. This is turn affects manufacturers and other service providers in Thailand that use oil, power and transport as production inputs to varying degrees. This is already evident in the growth of manufacturing production which has slowed in the first 8 months of 2005 relative to the same period in 2004. Household consumption growth is also down this year and is likely to recover gradually given the reduction in real disposable income. With rising domestic retail oil prices as well as power and transport prices, headline inflation in 2005 could reach 4.5 percent, significantly higher than recent years. In the first three quarters of this year, headline inflation is 4.3 percent. But on a year-on-year basis, October inflation is 6.2 percent and this rising trend is expected to continue until the end of the year. This is mainly due to the rise in oil and transport prices, as well as increased food prices arising from drought in the beginning of this year. Nominal interest rates are also being adjusted upwards as the central bank tries to stem inflationary expectations, and it is likely that next year real interest-rates will rise as inflation falls.
1 Diesel retail price is floating with world price; there is currently only an exemption of Bt1.10 per liter for excise tax.

THAILAND ECONOMIC MONITOR NOVEMBER 2005
7
Private investment slowed this year, following the shocks to investor confidence and the resulting uncertainty. Private investment recovery since the crisis, especially domestic, has been sluggish relative to past recoveries as well as in terms of levels; it has remained below 20 percent of GDP, lower than the average of the 1980s, even before the pre-crisis investment boom. With capacity utilization now close to the pre-crisis level and exceeding 80 percent in over half of the exporting sectors, private investment needs to pick up to avert a serious supply constraint. Foreign direct investment inflow, which grew strongly during last few years of recovery, continued to be high this year. So clearly a pick-up in domestic private investment is necessary for rapid GDP growth in the next few years. And this has to happen in the context of a profit squeeze that is underway with higher prices of oil, power and transport, with opportunities for passing-through higher costs to buyers limited by the depressed growth in domestic demand. The imperative for firms in Thailand to become more efficient and increase rates of return to private investment is now more urgent. Unless firms become more efficient users of oil and energy which will take time, and improve their overall efficiency and productivity in the near term, the rates of return will not be high enough to encourage increased private investment in the face of increased uncertainty. Firms in Thailand tell us in the Productivity and Investment Climate Study (PICS) that regulatory burden, infrastructure weaknesses and skill shortages are major constraints to increasing competitiveness. The above study (based on a survey of 1,385 firms in 2003 to 2004) conducted jointly by the National Economic & Social Development Board (NESDB) and the World Bank, shows that these constraints cannot be overcome by firms alone or by the Government alone; they need actions from both parties. Reducing the regulatory burden will be the least costly and most effective measure for the Government to take quickly. Firms tell us that regulations for starting a business, for importing goods and services, for hiring and firing labor, and for taxes are all taking a large toll on firms. Also interestingly, it is the more productive firms (e.g. large, or export-oriented or high-tech or foreign-owned firms) in Thailand that are most adversely affected by regulations, and so relaxing that burden will raise productivity and investment the most too. The Government can do this quickly and such actions will not only have the most ‘bang-for-the-buck’ but also the fastest impact because the most productive firms will make use of it to raise investment and productivity. Overcoming skill-shortages will also make a significant contribution, as it can add anywhere between 15 percent and 40 percent of sales revenue, depending on the sector in which firms are located. Also such shortages limit firms’ efforts at innovation and reduces potential for within-sector productivity-growth through innovation; without these skills, moving up the value-chain to remain competitive in the face of rising wages, becomes difficult. Nevertheless, the impact of measures to reduce skill shortage takes time. Improving the quality of secondary education graduates — as well as English language and ICT skills taught in secondary schools —takes time to implement, but more importantly take nearly a decade after implementation to improve the skill-composition of the labor force. Improving effectiveness of vocational education and of incentives for firms for skill development of its labor will work faster, but still take a few years. For this very reason, Thailand needs to expedite its education reform program. The Government is already fine-tuning its competitiveness strategy to ensure effective economic restructuring over the next 4 years, but it needs to move faster. A Committee is examining laws and regulations in order to streamline them, and reduce firms’ transaction cost. On strengthening secondary education, the reform program is being strengthened; however, this will affect the skill-composition of the labor force significantly only after a decade or so. Meanwhile there are efforts to reform the vocational education system as well as to provide appropriate skill-development incentives, but these need to be expedited and implemented. The Government is preparing the 10th Five Year National Development Plan (FY2007-2011), now called the National Development Strategy, which will cover 5 pillars: Coping with the changing development context, Economic restructuring, Adding value through innovation and knowledge creation, Pursuing social development, and Enhancing global and regional linkages. The Office of National Economic and Social Development Board (NESDB) is responsible for

THAILAND ECONOMIC MONITOR NOVEMBER 2005
8
drafting the Strategy with first draft planned for February 2006 and the final draft for September with issuance of the document in October 2006. Also, infrastructure weaknesses are raising cost and reducing returns; it takes a long time to obtain telephone, water and power connections, longer than many of its competitors. Traffic congestion not only in Bangkok but on key trunk routes are also costing firms, including those in the Central and Eastern seaboard provinces where most manufacturing and high-tech firms are now located. The railway-system is not very effective in transporting goods. Power outages and fixed line interruptions have also risen. The Government is addressing infrastructure weaknesses more frontally. It has initiated a major infrastructure public investment program, with a proposed program of mega-projects of Baht 1.8 trillion to be implemented during 2005-2009 period. Together with other public investments, this will raise total public investment from 7 percent of GDP this year, to 9 percent of GDP by 2009, if fully implemented along the planned timeline. The proposed expansion in public investment in infrastructure is much needed, following more than five years of retrenchment since the crisis. Of course, the strategic targeting of these investments as well as their prioritization must be well worked out to ensure that these public infrastructure projects do increase private sector competitiveness and private investment returns. This process of choosing the projects and sequencing them appropriately is critical, and still underway. Nearly a fifth of the mega-projects program is planned to be financed by external borrowing, but given the current macroeconomic situation, this is feasible. Current information suggests that half of the Bt1.8 billion public infrastructure mega-projects will be financed by the Government’s budget and state-owned enterprises’ (SOEs) revenues. The remaining 27 percent will be financed by domestic borrowing and 18 percent by external borrowing. The import content of the mega projects have been estimated at around 35 percent, implying an addition to the current account deficit from its implementation, but the final size of the current account deficit will also be a function of changes in private investment. However, given existing external debt and the overall fiscal situation, a current account deficit in excess of 2 percent in some years will be manageable. It is expected that this investment program will be accompanied by appropriate policy and institutional changes to improve infrastructure efficiency and encourage private participation. This policy and institutional area related to infrastructure is being examined by various agencies, drawing on successful experiences of other countries, and a large agenda of analytical work is underway in respect of policies relevant to improving urban infrastructure services, greater inter-modal efficiency as well as promotion of private-public partnership in infrastructure investments Without these complementary changes in policies and institutions, the economy in general and firms in particular, will not derive as much benefit from these infrastructure projects as they would otherwise do. Growth in export earnings and in export volume is also lower than last year. Export volume growth, after an abysmal performance in the first half, has recovered in the third quarter. Export earnings growth has been helped by export price increases of around 12 percent or so – and more importantly by sustaining growth in the Chinese market, though China’s imports slowed sharply in 2005. Export value to China grew by 30 percent, more than last year – and there are indications that Thailand is make special effort to cultivate that market and to encourage Chinese foreign investment in Thailand for exports back to China. More than 85 percent of exports are manufactures, and recent growth in exports has been most rapid in respect of electronics, automobiles and parts as well as machinery and parts; wearing apparel, textile and food processing has been contracting or grown slightly in recent years. Tourism receipts continued to be depressed following the tsunami in December 2004, and the southern unrest has not helped this situation either. Thailand’s current account deficit is estimated to be around US$2.7 billion or 1.5 percent of GDP in 2005, following many years of surpluses. The first half of this year saw a large rise in the import bill driven largely by a jump in oil and steel imports. Import growth is slowing in the second half; but the current account deficit will still
THAILAND ECONOMIC MONITOR NOVEMBER 2005
9
be significant, given slow growth in export earnings and gradual recovery in tourism receipts. The current account is expected to remain in deficit next year with continued growth in the private investment and public investment, but that is consistent with Thailand’s position as a low middle-income country. Nevertheless, Thailand’s external and fiscal situation remains strong. It has reserves of more than US$48 billion (3 times of short term external debt) by August, and its total external debt has fallen to around 27 percent of GDP as of June 2005. The government is committed to continue running a balanced budget, though the consolidated budget will go into deficit as the mega-projects program is implemented. Public debt as a share of GDP is now below 50 percent and is projected to decline over the next 5 years. The financial sector has been doing better too. For the first time, the ratio of non-performing loans (NPLs) in total loans has fallen below 10 percent. The NPLs of commercial banks are down by 3 percent but those of financial institutions have fallen by much more, as 20 percent of their NPLs, restructured earlier, are removed from NPL status following successful repayment experience. The TAMC has made progress too, resolving most of the distressed assets transferred to it. Increased profitability of Thai banks has improved their balance sheet in general; medium-sized banks had lower profitability and capital adequacy ratios, but also lower NPLs than large and small banks. The performance and health of Thailand’ corporate sector has improved significantly. An average debt-equity ratio of less than one and interest coverage ratio of nearly ten for all listed companies implies a significant turnaround, not only relative to 1998 but also to 2002. Also, all SET groups have debt to equity ratio of around one, even if interest coverage ratios go from a low of 8 for services and agriculture and food groups, to a high of 18 for the electrical group. This is comparable to the region’s better performers. The strong recovery in domestic and export demand has made this possible, by raising average net profit margins to 13 percent and return on assets to 12 percent; The manufacturing group had the highest returns while agriculture and food group, the lowest. There was little change in ownership, and more investigation is needed to ascertain whether there was significant operational restructuring in this process. Reforms continued in the areas of trade, financial and corporate sector and public sector governance. The Bank of Thailand (BOT) is continuing its financial sector consolidation and rationalization as well as gearing up preparation for the implementation of Basel II which will be fully effective in 2008. Non-performing loans in June 2005 still remained at doubled digits of 10.3 percent of total loans, a minimal decline of 0.58-percentage point from December 2004. Corporatization of additional state-owned enterprises (SOEs) has taken place in 2005, namely, the Telephone Organization of Thailand (TOT), CAT Telecom, and Electricity Generating Authority of Thailand (EGAT). This year regulations on consumer lending has been implemented to curb excessive consumer indebtedness. The recently completed Thailand Report on Standards and Codes (ROSC) on corporate governance showed that listed companies largely observed two-thirds of the Organization for Economic Co-operation and Development (OECD) Principles on Corporate Governance, while the remaining one-third of the principles are partially observed. The Free Trade Agreements (FTAs) are continuing, helping to increase competition and encourage firms to raise their productivity and competitiveness. The Thailand-Australia FTA, the ASEAN-China, and the Thailand-New Zealand FTAs are effective this year leading to preferential tariff reductions. The Government has also adopted the Government Fiscal Management Information System (GFMIS) since March 2005 to be able to better monitor budget execution on a monthly basis. The Cabinet has also approved the E-Government Action Plan (2005-2007) which focuses on providing services on-line, improving/amending laws to facilitate such services, building infrastructure to accommodate the services, and establishing the E-Government Agency (EGA) as an oversight agency.
THAILAND ECONOMIC MONITOR NOVEMBER 2005
10
SECTION 2
RECOVERY AND OUTLOOK 2.1 Real GDP Growth 2005 and 2006 Economic growth will be 4.2 percent in 2005, significantly lower than the 6.1 percent last year , and will speed up to 5 percent next year. The tsunami, drought, unrest in the South, slowdown in world trade and, of course, a large rise in oil prices have all taken a toll on consumer and investor confidence this year. Growth in domestic demand is thus depressed and net export growth is down. While the effects of tsunami and drought will wear off, and export demand is expected to pick up next year, the effects of large increases in oil prices will continue to constrain the pace of recovery in GDP growth in 2006, as the economy adjusts to higher oil prices. GDP is thus expected to grow at around 5 percent next year. The tsunami disaster and the drought had severe impacts on certain regions of the country an will shave off GDP growth. The tsunami disaster that hit the six southern provinces in Thailand in December last year had severely affected the livelihoods of people in those provinces, as well as the tourism industry in Thailand. Reconstruction of the affected areas has somewhat mitigated the impact. Nevertheless, tourist arrivals had fallen by 10 percent in the first quarter of the year, and have slowly recovered since the second quarter. The drought in late last year into the beginning of this year has resulted in the fall of crop production by almost 6 percent in the first half of this year, before recovering in the third quarter by 3.5 percent. For the whole year, crop production should decline slightly from that of last year and would reduce GDP growth this year by no more than 0.2 percent. Together with the impact of the tsunami disaster, their impact on GDP growth would be less than 0.5 percent. Higher oil prices will constrain the rebound in GDP growth this year and next year, as households and firms take time to adjust to more efficient use of oil and energy. Given the high oil intensity in Thailand, growth in consumption and investment have slowed down this year and will pick up slowly next year, as households and firms adjust (see Figure 1 and Figure 2). In 2005, retail prices of diesel rose by 41 percent and of gasoline by 28 percent, together, raising the average retail prices of oil products by 30 percent relative to 2004 (see Box 1). Compared to 2003, the average retail price of oil products has risen by more than 40 percent and compared to 2002, by more than 70 percent. The higher cost of production for service providers like those in transport and power, has also led to increases in transport and power costs. This is turn affects manufacturers and other service providers in Thailand that use oil, power and transport as production inputs to varying degrees. This is already evident in the growth of manufacturing production which has slowed in the first 8 months of 2005 relative to the same period in 2004. Consumption growth is also down this year and is likely to recover gradually given the reduction in real disposable income.
Table 1. Changes in Relative Retail Price of Oil (2002-2005) (Index 2002=100)
2002 2003 2004 8M 2005
Weighted average petroleum prices 100.0 108.2 115.7 140.6*
Ratio of weighted average petroleum prices to Headline CPI 100.0 106.3 110.6 130.0
Ratio of weighted average petroleum prices to PPI 100.0 100.8 114.5 114.2 Ratio of weighted average petroleum prices to Export Price Index 100.0 99.2 94.5 104.7
Source: EPPO and BOT *Estimate for the whole year 2005 is 153.7
THAILAND ECONOMIC MONITOR NOVEMBER 2005
11
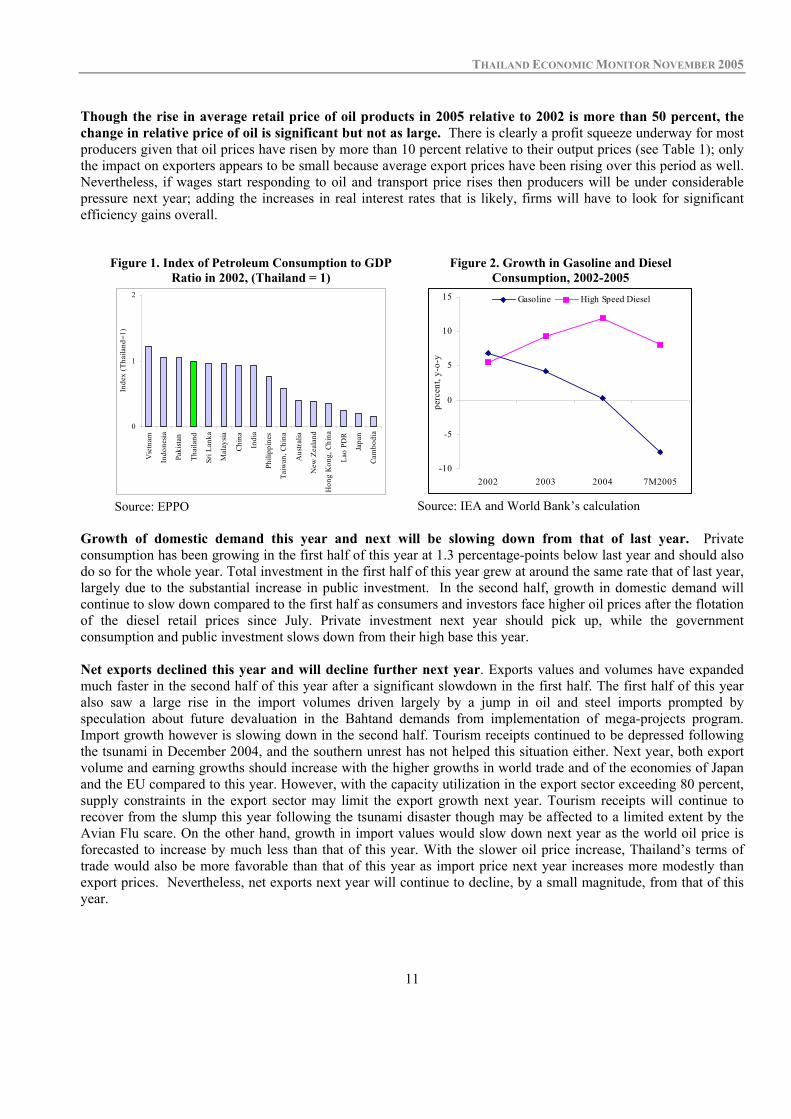
Though the rise in average retail price of oil products in 2005 relative to 2002 is more than 50 percent, the change in relative price of oil is significant but not as large. There is clearly a profit squeeze underway for most producers given that oil prices have risen by more than 10 percent relative to their output prices (see Table 1); only the impact on exporters appears to be small because average export prices have been rising over this period as well. Nevertheless, if wages start responding to oil and transport price rises then producers will be under considerable pressure next year; adding the increases in real interest rates that is likely, firms will have to look for significant efficiency gains overall.
Figure 1. Index of Petroleum Consumption to GDP Ratio in 2002, (Thailand = 1)
Figure 2. Growth in Gasoline and Diesel Consumption, 2002-2005
0
1
2
Vie
tnam
Indo
nesia
Paki
stan
Thai
land
Sri L
anka
Mal
aysia
Chin
a
Indi
a
Phili
ppin
es
Taiw
an, C
hina
Aus
tralia
New
Zea
land
Hon
g K
ong,
Chi
na
Lao
PDR
Japa
n
Cam
bodi
a
Inde
x (T
haila
nd=1
)
Source: EPPO
-10
-5
0
5
10
15
2002 2003 2004 7M2005
perc
ent,
y-o-
y
Gasoline High Speed Diesel
Source: IEA and World Bank’s calculation
Growth of domestic demand this year and next will be slowing down from that of last year. Private consumption has been growing in the first half of this year at 1.3 percentage-points below last year and should also do so for the whole year. Total investment in the first half of this year grew at around the same rate that of last year, largely due to the substantial increase in public investment. In the second half, growth in domestic demand will continue to slow down compared to the first half as consumers and investors face higher oil prices after the flotation of the diesel retail prices since July. Private investment next year should pick up, while the government consumption and public investment slows down from their high base this year. Net exports declined this year and will decline further next year. Exports values and volumes have expanded much faster in the second half of this year after a significant slowdown in the first half. The first half of this year also saw a large rise in the import volumes driven largely by a jump in oil and steel imports prompted by speculation about future devaluation in the Bahtand demands from implementation of mega-projects program. Import growth however is slowing down in the second half. Tourism receipts continued to be depressed following the tsunami in December 2004, and the southern unrest has not helped this situation either. Next year, both export volume and earning growths should increase with the higher growths in world trade and of the economies of Japan and the EU compared to this year. However, with the capacity utilization in the export sector exceeding 80 percent, supply constraints in the export sector may limit the export growth next year. Tourism receipts will continue to recover from the slump this year following the tsunami disaster though may be affected to a limited extent by the Avian Flu scare. On the other hand, growth in import values would slow down next year as the world oil price is forecasted to increase by much less than that of this year. With the slower oil price increase, Thailand’s terms of trade would also be more favorable than that of this year as import price next year increases more modestly than export prices. Nevertheless, net exports next year will continue to decline, by a small magnitude, from that of this year.
THAILAND ECONOMIC MONITOR NOVEMBER 2005
12
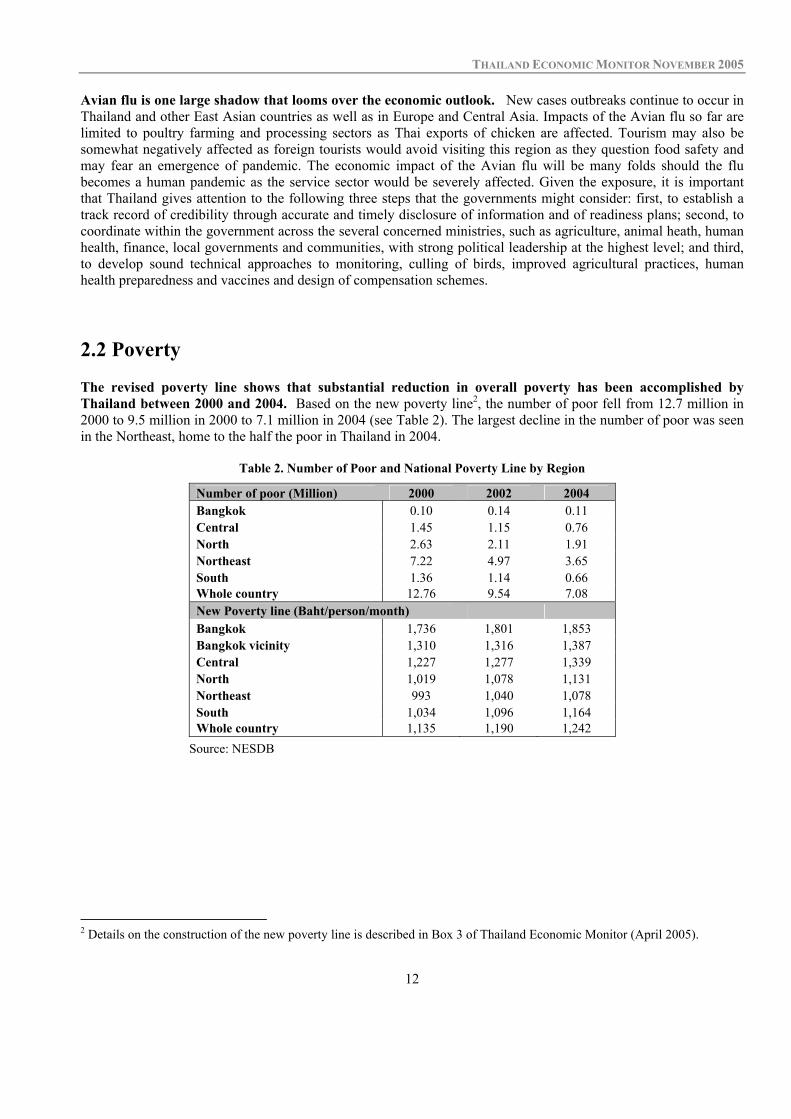
Avian flu is one large shadow that looms over the economic outlook. New cases outbreaks continue to occur in Thailand and other East Asian countries as well as in Europe and Central Asia. Impacts of the Avian flu so far are limited to poultry farming and processing sectors as Thai exports of chicken are affected. Tourism may also be somewhat negatively affected as foreign tourists would avoid visiting this region as they question food safety and may fear an emergence of pandemic. The economic impact of the Avian flu will be many folds should the flu becomes a human pandemic as the service sector would be severely affected. Given the exposure, it is important that Thailand gives attention to the following three steps that the governments might consider: first, to establish a track record of credibility through accurate and timely disclosure of information and of readiness plans; second, to coordinate within the government across the several concerned ministries, such as agriculture, animal heath, human health, finance, local governments and communities, with strong political leadership at the highest level; and third, to develop sound technical approaches to monitoring, culling of birds, improved agricultural practices, human health preparedness and vaccines and design of compensation schemes. 2.2 Poverty The revised poverty line shows that substantial reduction in overall poverty has been accomplished by Thailand between 2000 and 2004. Based on the new poverty line2, the number of poor fell from 12.7 million in 2000 to 9.5 million in 2000 to 7.1 million in 2004 (see Table 2). The largest decline in the number of poor was seen in the Northeast, home to the half the poor in Thailand in 2004.
Table 2. Number of Poor and National Poverty Line by Region
Number of poor (Million) 2000 2002 2004 Bangkok 0.10 0.14 0.11 Central 1.45 1.15 0.76 North 2.63 2.11 1.91 Northeast 7.22 4.97 3.65 South 1.36 1.14 0.66 Whole country 12.76 9.54 7.08 New Poverty line (Baht/person/month) Bangkok 1,736 1,801 1,853 Bangkok vicinity 1,310 1,316 1,387 Central 1,227 1,277 1,339 North 1,019 1,078 1,131 Northeast 993 1,040 1,078 South 1,034 1,096 1,164 Whole country 1,135 1,190 1,242
Source: NESDB
2 Details on the construction of the new poverty line is described in Box 3 of Thailand Economic Monitor (April 2005).

THAILAND ECONOMIC MONITOR NOVEMBER 2005
13
Box 1 Impact of Oil Price Rise on Inflation and Growth
With the sharp rise in world oil price this year, the lifting of retail petroleum price ceilings have translated into a 30 percent increase in retail oil prices this year. World oil price this year is expected to rise to an average of US$53.6 per barrel, compared to US$37.7 per barrel last year (see Table 4 in External Environment section). As a result, retail benzene (premium and regular gasoline) prices which have been floated since October last year would rise by almost 30 percent this year3 (see Table 3). The subsidy for retail diesel price from the Oil Fund has been reduced several times since January this year, resulting in the rises in its price ceilings. By mid-July, the retail diesel price ceiling was lifted and its subsidies from the Oil Fund ceased4. However, a Bt1.10 per liter reduction in excise taxes for diesel was put into effect in mid-July. Nevertheless, the retail diesel price ceiling which was fixed at Bt14.59 per liter since January 2004, have risen to Bt23.90 per liter by September. In the last quarter of this year, the reduction in excise taxes will be decreased to Bt0.9 per liter. Thus, for the whole year, retail price of diesel will rise by more than 40 percent from last year. As a result, retail petroleum prices, on average, should rise by around 30 percent this year (see Table 3).
Table 3.Petroleum Price Increase, 2004-2006
Share in Petroleum Consumption (%) Petroleum Price Increase (%)
2004 2005
(Jan-July) 2004 2005 2006p* Premium Gasoline (Octane 95) 7.3 6.8 12.7 26.6 3.78 Regular Gasoline (Octane 92) 11.1 10.3 14.5 27.8 4.10 Diesel (Highspeed) 46.9 48.0 4.0 41.7 26.38 Fuel Oil 14.6 0.2 7.4 27.8 2.29 LPG 9.7 14.8 10.2 2.5 0.00
Weighted Average 6.6 29.1 13.7
Source: EPPO and World Bank estimation * Assumes (a) average world oil price rising by 4.5 percent in 2006, (b) floating of premium and regular gasoline and fuel oil retail prices, (c) excise tax reduction for diesel be decreased to Bt0.5 per liter in the first quarter of 2006 and to zero after that and no additional subsidies will be put in place, and (d) LPG prices are fixed at 2005’s level.
The sharp rise in the retail petroleum prices could raise transportation and manufacturing costs by almost 3.5 percent and reduce GDP growth by around 2 percentage-points this year. In addition to the direct impact of higher retail benzene and diesel prices on automobile users, the higher diesel and fuel oil prices also affect the costs of commercial transportation and manufacturing production5. With the rise in the prices of the petroleum products by almost 30 percent, transportation and manufacturing costs would rise by roughly 3.5 percent, which would contribute to the rise in inflation. The increase in retail gasoline prices and inflation would have the largest impact on private consumption, which could result in a 2 percentage-point reduction in real GDP growth this year. The rise in petroleum prices next year could reduce real GDP growth by 1 percentage-point. World oil price next year is expected to rise by another 4.5 percent. In the first quarter of next year, excise tax reduction for diesel will also be decreased to Bt0.5 per liter and to zero for the remaining months of the year. Retail diesel prices would therefore rise by another 26 percent, year on year, while benzene price rises by about 4 percent (see Table 3). Petroleum prices next year should rise by 14 percent year on year. This would translate into an increase in transportation and manufacturing costs by roughly 1.5 percent and would reduce GDP growth by around 1 percentage-point.
3 The rise in retail benzene prices is lower than that of crude oil import price largely because of the lower rise in ex-refinery prices of benzene and the reduction of marketing margins by oil companies. 4 The Oil Fund was subsidizing retail diesel prices up to Bt7 per liter before the float. From Jan 10, 2004 to July 13, 2005, Oil Fund subsidies for both benzene and diesel totaled Bt92 billion. 5 Almost all commercial automobiles uses diesel. Transportation costs accounts for roughly 2.5 percent of retail product price. Diesel, fuel oil, and LPG make up 98 percent of petroleum products used in the manufacturing sector. Petroleum cost is roughly 10 percent of total manufacturing costs.

THAILAND ECONOMIC MONITOR NOVEMBER 2005
14
The poverty headcount ratio in Thailand fell by 10 percentage-points from 2000 to 2004. It fell from 21 percent of population below the poverty-line in 2000 to 11 percent in 2004 (see Figure 3). The largest gain was from the Northeast (see Box 2 for detailed discussion of the economic development in the Northeast), though North did pretty well too. The rise in household incomes, especially agricultural incomes, has contributed to the reduction in poverty. As the majority of the poor reside in the rural areas and are engaged in agricultural activities, the double-digit rise in farm incomes since 2002 (see Figure 4) had contributed to poverty alleviation. From 2000 to 2004, agricultural incomes have risen by 40 percent, higher than the rise in any other forms of income (see Figure 5).
Figure 3. Headcount Ratio by Region,1996-2004 Figure 4. Farm Production, Price and Income, 2003-2005
0
5
10
15
20
25
30
35
Bangkok Central North Northeast South Wholecountry
Perc
ent
1996 2000 2004
Source: NESDB
-10
-5
0
5
10
15
20
25
30
2003 2004 Jan- Aug2004
Jan- Aug2005
Perc
ent,
y-o-
yGrowth of farm price Growth of crop productionGrowth of farm income
Source: BOT Despite the progress in poverty reduction, regional disparities remain large. The headcount ratios in the Northeast and North are nearly three-times as that in the Central and 10 times that of Bangkok. Although the disparities between average incomes of individuals in the regions and in Bangkok have narrowed over the years, the average individual income in the Northeast and the North is only one-third and two-fifths that of Bangkok and Vicinity, respectively (see Figure 6).
Figure 5. Household Incomes by Types of Income, 2000-2004
Figure 6. Average Individual Income by Region as a Fraction of Individual Income in Bangkok, 1996-2004
02468
10121416
Tota
lin
com
e
Sala
ry
Non
-ag
ricilt
ure
Agr
icul
ture
Oth
erin
com
e
Frin
gebe
nefit
Thou
sand
Bah
t
051015202530354045
Perc
ent
2000(LHS)2004(LHS)% Change 2000-2004 (RHS)
Source: SES 2004
0.0 0.1 0.2 0.3 0.4 0.5 0.6
Northeast
North
South
Central
Fraction of Bangkok
2004
2000
1996
Source: SES 2004

THAILAND ECONOMIC MONITOR NOVEMBER 2005
15
Income inequality slightly decreased from 2000 to 2004 but remains high. The Gini coefficient declined slightly from 0.525 in 2000 to 0.499 in 2004, indicating a slight decrease in income inequality. The decline is due to lower income inequality in the South and the Northeast, while income inequality in Bangkok and the North remained greater than that in pre-crisis (see Figure 7). Nevertheless, income inequality in Thailand remains persistently high with the Gini coefficient at around 0.5 since 1996.
Figure 7. Gini Coefficient by Region, 1996-2004
0.0
0.1
0.2
0.3
0.4
0.5
0.6
Bangkok Central North Northeast South WholeCountry
Gin
i Coe
ffic
ient
1996 2000 2004
Source: NESDB
2.3 Uncertain External Environment Oil prices next year are forecasted to rise further from that of this year. By the end of this year, average world crude oil prices will have risen by more than 40 percent from that of last year to an average of US$53.6 per barrel (see Table 4). Next year, average world crude oil prices will rise further to US$56 per barrel. This represents almost a double in its price from 2003. World real output growths this year and next in the light of high oil prices are lower than that of last year. Output growths of major economies of the world have slowed down this year. Thus, world real output growth is 3.1 percent compared to 3.8 percent last year. Next year, US’s output growth will decelerate further but will be offset by the acceleration of growth in the Euro area. World output growth rate next year is estimated to be similar to that of this year. World trade volumes this year have expanded much slower than last year, but should speed up next year. Expansion of trade volumes in the major markets, namely, the US, Japan, and EU have slowed down this year. With higher growths in trade volumes of EU, China, and Japan next year, world trade volume is projected to accelerate to 7 percent next year (see Table 4).
THAILAND ECONOMIC MONITOR NOVEMBER 2005
16
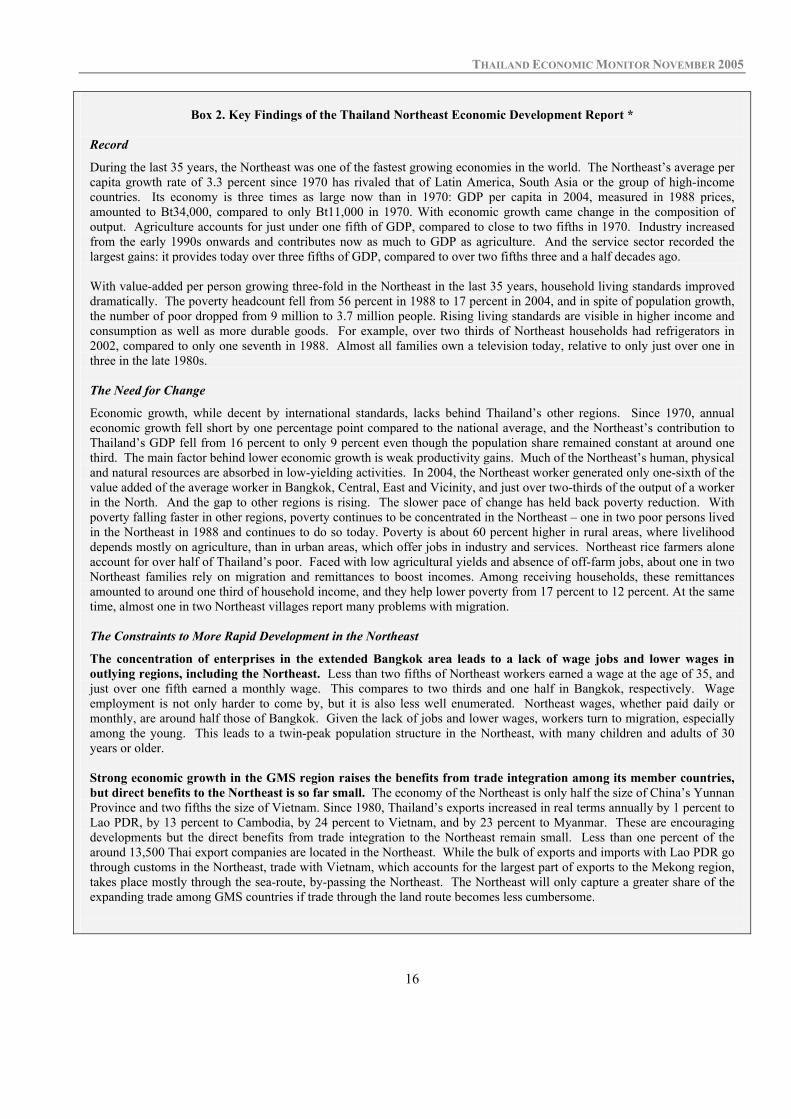
Box 2. Key Findings of the Thailand Northeast Economic Development Report *
Record
During the last 35 years, the Northeast was one of the fastest growing economies in the world. The Northeast’s average per capita growth rate of 3.3 percent since 1970 has rivaled that of Latin America, South Asia or the group of high-income countries. Its economy is three times as large now than in 1970: GDP per capita in 2004, measured in 1988 prices, amounted to Bt34,000, compared to only Bt11,000 in 1970. With economic growth came change in the composition of output. Agriculture accounts for just under one fifth of GDP, compared to close to two fifths in 1970. Industry increased from the early 1990s onwards and contributes now as much to GDP as agriculture. And the service sector recorded the largest gains: it provides today over three fifths of GDP, compared to over two fifths three and a half decades ago. With value-added per person growing three-fold in the Northeast in the last 35 years, household living standards improved dramatically. The poverty headcount fell from 56 percent in 1988 to 17 percent in 2004, and in spite of population growth, the number of poor dropped from 9 million to 3.7 million people. Rising living standards are visible in higher income and consumption as well as more durable goods. For example, over two thirds of Northeast households had refrigerators in 2002, compared to only one seventh in 1988. Almost all families own a television today, relative to only just over one in three in the late 1980s. The Need for Change
Economic growth, while decent by international standards, lacks behind Thailand’s other regions. Since 1970, annual economic growth fell short by one percentage point compared to the national average, and the Northeast’s contribution to Thailand’s GDP fell from 16 percent to only 9 percent even though the population share remained constant at around one third. The main factor behind lower economic growth is weak productivity gains. Much of the Northeast’s human, physical and natural resources are absorbed in low-yielding activities. In 2004, the Northeast worker generated only one-sixth of the value added of the average worker in Bangkok, Central, East and Vicinity, and just over two-thirds of the output of a worker in the North. And the gap to other regions is rising. The slower pace of change has held back poverty reduction. With poverty falling faster in other regions, poverty continues to be concentrated in the Northeast – one in two poor persons lived in the Northeast in 1988 and continues to do so today. Poverty is about 60 percent higher in rural areas, where livelihood depends mostly on agriculture, than in urban areas, which offer jobs in industry and services. Northeast rice farmers alone account for over half of Thailand’s poor. Faced with low agricultural yields and absence of off-farm jobs, about one in two Northeast families rely on migration and remittances to boost incomes. Among receiving households, these remittances amounted to around one third of household income, and they help lower poverty from 17 percent to 12 percent. At the same time, almost one in two Northeast villages report many problems with migration. The Constraints to More Rapid Development in the Northeast
The concentration of enterprises in the extended Bangkok area leads to a lack of wage jobs and lower wages in outlying regions, including the Northeast. Less than two fifths of Northeast workers earned a wage at the age of 35, and just over one fifth earned a monthly wage. This compares to two thirds and one half in Bangkok, respectively. Wage employment is not only harder to come by, but it is also less well enumerated. Northeast wages, whether paid daily or monthly, are around half those of Bangkok. Given the lack of jobs and lower wages, workers turn to migration, especially among the young. This leads to a twin-peak population structure in the Northeast, with many children and adults of 30 years or older. Strong economic growth in the GMS region raises the benefits from trade integration among its member countries, but direct benefits to the Northeast is so far small. The economy of the Northeast is only half the size of China’s Yunnan Province and two fifths the size of Vietnam. Since 1980, Thailand’s exports increased in real terms annually by 1 percent to Lao PDR, by 13 percent to Cambodia, by 24 percent to Vietnam, and by 23 percent to Myanmar. These are encouraging developments but the direct benefits from trade integration to the Northeast remain small. Less than one percent of the around 13,500 Thai export companies are located in the Northeast. While the bulk of exports and imports with Lao PDR go through customs in the Northeast, trade with Vietnam, which accounts for the largest part of exports to the Mekong region, takes place mostly through the sea-route, by-passing the Northeast. The Northeast will only capture a greater share of the expanding trade among GMS countries if trade through the land route becomes less cumbersome.

THAILAND ECONOMIC MONITOR NOVEMBER 2005
17
While cities are important growth drivers, the bulk of the Northeast population resides in villages and is engaged in agricultural activities in which productivity is low. Over four in five families live in rural areas. The need for higher income is perhaps nowhere greater than in agriculture. The Northeast generates just over one fifth of Thailand’s agricultural GDP, even though the region accounts for one half of the farms and two fifths of the agricultural land (see Figure 8). Low agricultural productivity is linked to factors like small farm size, low market power of farmers, limited irrigation and lack of fertilizers and pesticides use. But perhaps the most important reasons are weak natural resources and the focus on rice production, a water-intensive crop. The Northeast has a long dry season as well as porous and highly saline soils which retain water poorly.
Figure 8. Agricultural Value Added by Agricultural Worker, 1991 to 2004
Figure 9. Government Spending, FY 1999 to FY 2003 (Baht Per Capita, 1999 Prices)
0.00
0.02
0.04
0.06
0.08
0.10
0.12
1991 1992 1993 1994 1995 1996 1997 1998 1999 2000 2001 2002 2003 2004
Vicinity East Central West North Northeast South
0
1,000
2,000
3,000
4,000
5,000
6,000
7,000
8,000
9,000
10,000
11,000
FY99 FY00 FY01 FY02 FY03
Northeast Central North South
The Northeast receives fewer public resources than any other region. Regional economic development depends, among other factors, on how key sectors are funded with public resources. Channeling public resources to disadvantaged regions, if done well, can be a powerful way of promoting convergence in living standards. The expenditure gap between the Northeast and other regions has remained fairly constant over the last five years (see Figure 9). The Northeast obtained in FY 2003 Bt6,400 per capita (1999 Prices; US$160), which was one third less than the Center and 27 percent less than the North and the South. The spending shortfall compared to these three regions was close to around 30 percent in FY 1999 and FY 2003. The Agenda Economic affluence is associated with prosperous enterprises, and enterprises locate where they expect the highest profitability. Firms will only invest in the Northeast if resources, business climate and markets are as or more favorable for their products than in other regions: economic development of the Northeast is connected to economic development in the country as a whole. Thailand has also thus far connected with its neighbors through Bangkok. While this has worked well for the country in general, this strategy may now have become a constraint for Northeast growth. The time may be right to augment the strong regional links through Bangkok and proximate areas with equally strong subregional international links through other parts of Thailand, especially the Northeast. But the success of these shifts in strategy in helping Northeast living standards converge with those of other Thai regions will depend on how well-prepared the Northeast population is to compete. Fostering such a conducive climate will require government actions to upgrade services and institutions centered on three pillars: Thailand, the Northeast, and the Greater Mekong Subregion. First, for the foreseeable future, the Northeast economy is dependent on the dynamism of the national economy. In the absence of weather shocks, growth in the Northeast tracks growth in Thailand closely, and jobs in the extended Bangkok area provide employment to Northeast workers whose remittances support a large service sector in the Northeast. Second, in the longer term, economic convergence will depend on how well Thai policymakers meet the challenge of improved skills and service delivery in the Northeast. Finally, promoting and integrating with a prosperous Greater Mekong Subregion can turn the Northeast from a land-locked into a land-linked region. This will require reducing structural and institutional impediments to the movements of goods, people, and capital.
* The Thailand Northeast Economic Development Report, released in July 2005, is a joint report between the NESDB and World Bank. It can be found at www.worldbank.or.th
THAILAND ECONOMIC MONITOR NOVEMBER 2005
18
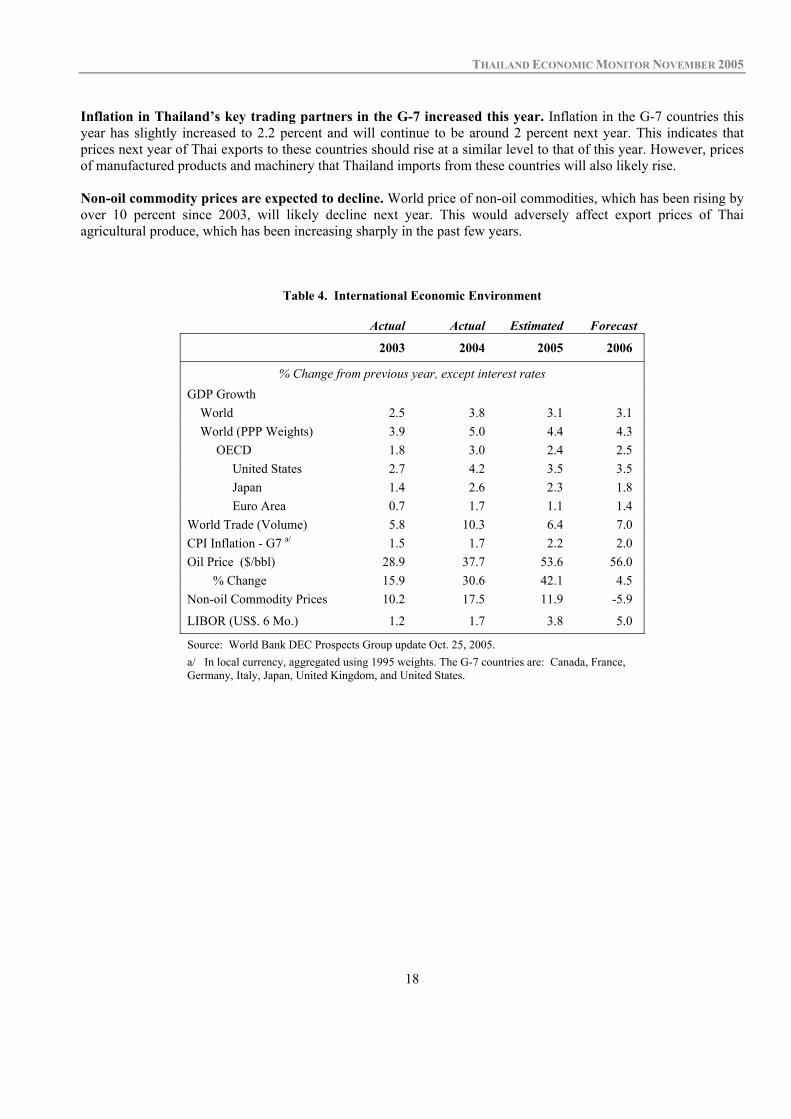
Inflation in Thailand’s key trading partners in the G-7 increased this year. Inflation in the G-7 countries this year has slightly increased to 2.2 percent and will continue to be around 2 percent next year. This indicates that prices next year of Thai exports to these countries should rise at a similar level to that of this year. However, prices of manufactured products and machinery that Thailand imports from these countries will also likely rise. Non-oil commodity prices are expected to decline. World price of non-oil commodities, which has been rising by over 10 percent since 2003, will likely decline next year. This would adversely affect export prices of Thai agricultural produce, which has been increasing sharply in the past few years.
Table 4. International Economic Environment
Actual Actual Estimated Forecast 2003 2004 2005 2006
% Change from previous year, except interest rates GDP Growth World 2.5 3.8 3.1 3.1 World (PPP Weights) 3.9 5.0 4.4 4.3 OECD 1.8 3.0 2.4 2.5 United States 2.7 4.2 3.5 3.5 Japan 1.4 2.6 2.3 1.8 Euro Area 0.7 1.7 1.1 1.4 World Trade (Volume) 5.8 10.3 6.4 7.0 CPI Inflation - G7 a/ 1.5 1.7 2.2 2.0 Oil Price ($/bbl) 28.9 37.7 53.6 56.0 % Change 15.9 30.6 42.1 4.5 Non-oil Commodity Prices 10.2 17.5 11.9 -5.9
LIBOR (US$. 6 Mo.) 1.2 1.7 3.8 5.0
Source: World Bank DEC Prospects Group update Oct. 25, 2005. a/ In local currency, aggregated using 1995 weights. The G-7 countries are: Canada, France, Germany, Italy, Japan, United Kingdom, and United States.
THAILAND ECONOMIC MONITOR NOVEMBER 2005
19
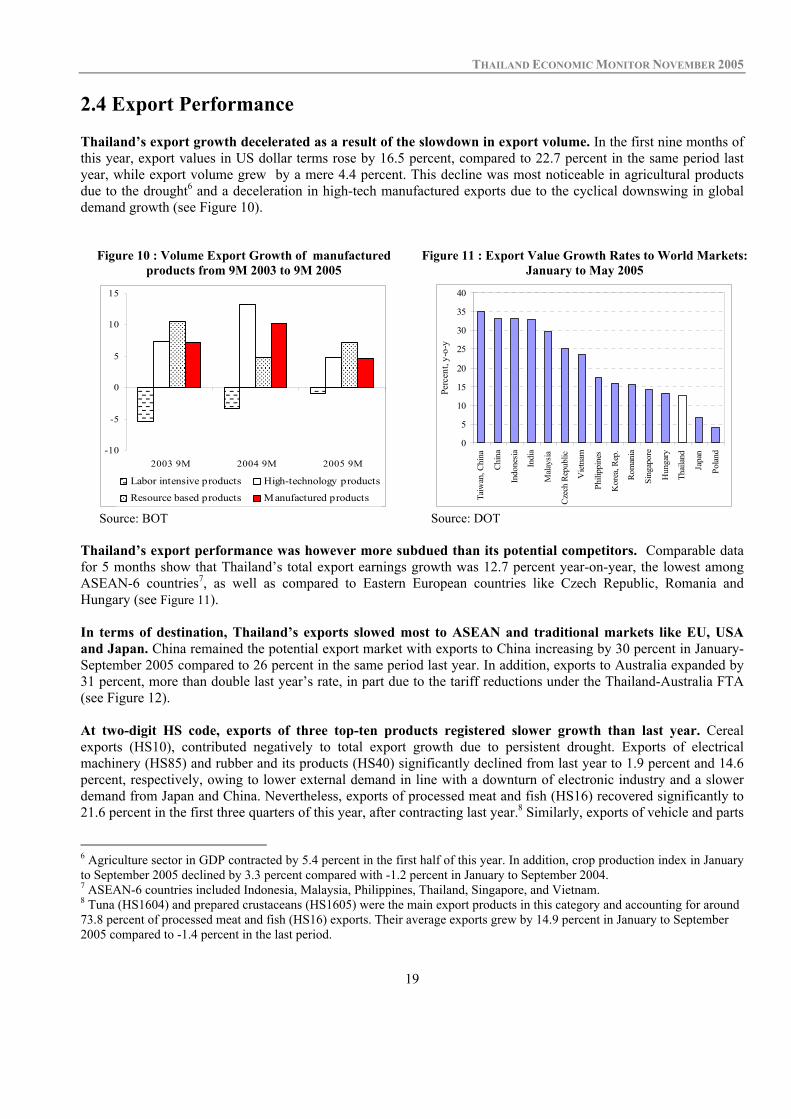
2.4 Export Performance Thailand’s export growth decelerated as a result of the slowdown in export volume. In the first nine months of this year, export values in US dollar terms rose by 16.5 percent, compared to 22.7 percent in the same period last year, while export volume grew by a mere 4.4 percent. This decline was most noticeable in agricultural products due to the drought6 and a deceleration in high-tech manufactured exports due to the cyclical downswing in global demand growth (see Figure 10).
Figure 10 : Volume Export Growth of manufactured products from 9M 2003 to 9M 2005
Figure 11 : Export Value Growth Rates to World Markets: January to May 2005
-10
-5
0
5
10
15
2003 9M 2004 9M 2005 9M
Labor intensive products High-technology products
Resource based products Manufactured products
Source: BOT
0
5
10
15
20
25
30
35
40
Taiw
an, C
hina
Chi
na
Indo
nesi
a
Indi
a
Mal
aysi
a
Cze
ch R
epub
lic
Vie
tnam
Phili
ppin
es
Kor
ea, R
ep.
Rom
ania
Sing
apor
e
Hun
gary
Thai
land
Japa
n
Pola
nd
Perc
ent,
y-o-
y
Source: DOT
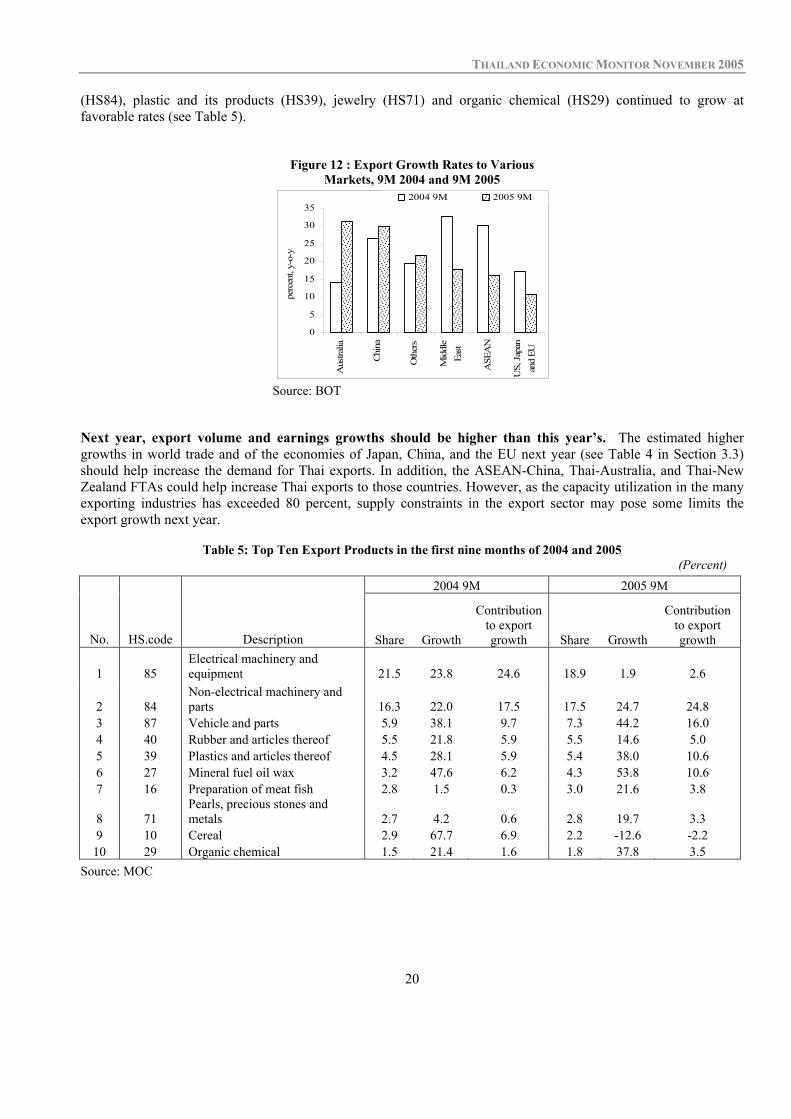
Thailand’s export performance was however more subdued than its potential competitors. Comparable data for 5 months show that Thailand’s total export earnings growth was 12.7 percent year-on-year, the lowest among ASEAN-6 countries7, as well as compared to Eastern European countries like Czech Republic, Romania and Hungary (see Figure 11). In terms of destination, Thailand’s exports slowed most to ASEAN and traditional markets like EU, USA and Japan. China remained the potential export market with exports to China increasing by 30 percent in January- September 2005 compared to 26 percent in the same period last year. In addition, exports to Australia expanded by 31 percent, more than double last year’s rate, in part due to the tariff reductions under the Thailand-Australia FTA (see Figure 12). At two-digit HS code, exports of three top-ten products registered slower growth than last year. Cereal exports (HS10), contributed negatively to total export growth due to persistent drought. Exports of electrical machinery (HS85) and rubber and its products (HS40) significantly declined from last year to 1.9 percent and 14.6 percent, respectively, owing to lower external demand in line with a downturn of electronic industry and a slower demand from Japan and China. Nevertheless, exports of processed meat and fish (HS16) recovered significantly to 21.6 percent in the first three quarters of this year, after contracting last year.8 Similarly, exports of vehicle and parts
6 Agriculture sector in GDP contracted by 5.4 percent in the first half of this year. In addition, crop production index in January to September 2005 declined by 3.3 percent compared with -1.2 percent in January to September 2004. 7 ASEAN-6 countries included Indonesia, Malaysia, Philippines, Thailand, Singapore, and Vietnam. 8 Tuna (HS1604) and prepared crustaceans (HS1605) were the main export products in this category and accounting for around 73.8 percent of processed meat and fish (HS16) exports. Their average exports grew by 14.9 percent in January to September 2005 compared to -1.4 percent in the last period.
THAILAND ECONOMIC MONITOR NOVEMBER 2005
20
(HS84), plastic and its products (HS39), jewelry (HS71) and organic chemical (HS29) continued to grow at favorable rates (see Table 5).
Figure 12 : Export Growth Rates to Various Markets, 9M 2004 and 9M 2005
0
5
10
15
20
25
30
35
Aus
tralia
Chi
na
Oth
ers
Mid
dle
East
ASE
AN
US,
Jap
anan
d EU
perc
ent,
y-o-
y
2004 9M 2005 9M
Source: BOT
Next year, export volume and earnings growths should be higher than this year’s. The estimated higher growths in world trade and of the economies of Japan, China, and the EU next year (see Table 4 in Section 3.3) should help increase the demand for Thai exports. In addition, the ASEAN-China, Thai-Australia, and Thai-New Zealand FTAs could help increase Thai exports to those countries. However, as the capacity utilization in the many exporting industries has exceeded 80 percent, supply constraints in the export sector may pose some limits the export growth next year.
Table 5: Top Ten Export Products in the first nine months of 2004 and 2005 (Percent)
2004 9M 2005 9M
No. HS.code Description Share Growth
Contribution to export growth Share Growth
Contribution to export growth
1 85 Electrical machinery and equipment 21.5 23.8 24.6 18.9 1.9 2.6
2 84 Non-electrical machinery and parts 16.3 22.0 17.5 17.5 24.7 24.8
3 87 Vehicle and parts 5.9 38.1 9.7 7.3 44.2 16.0 4 40 Rubber and articles thereof 5.5 21.8 5.9 5.5 14.6 5.0 5 39 Plastics and articles thereof 4.5 28.1 5.9 5.4 38.0 10.6 6 27 Mineral fuel oil wax 3.2 47.6 6.2 4.3 53.8 10.6 7 16 Preparation of meat fish 2.8 1.5 0.3 3.0 21.6 3.8
8 71 Pearls, precious stones and metals 2.7 4.2 0.6 2.8 19.7 3.3
9 10 Cereal 2.9 67.7 6.9 2.2 -12.6 -2.2 10 29 Organic chemical 1.5 21.4 1.6 1.8 37.8 3.5
Source: MOC

THAILAND ECONOMIC MONITOR NOVEMBER 2005
21
Exports to China Despite a weak domestic demand in China, Thailand’s total exports to Chinese market grew faster than last year. In the first eight months of 2005, Chinese imports from world market slowed to 15.1 percent from 40.4 percent in January to August 2004 due to drawdown of inventory. However, China’s imports from Thailand grew faster than imports from other countries like Vietnam and those in Eastern Europe9 (see Figure 13).
Figure 13: China’s Imports from Selected Countries, January to August 2005
-50-40-30-20-10
01020304050
Phi
lippi
nes
Ind
ia
Sout
h K
orea
Pol
and
S
inga
pore
T
haila
nd
In
done
sia
Tai
wan
M
alay
sia
Jap
an
Vie
tnam
C
zech
Rep
ublic
Rom
ania
Hun
gary
perc
ent,
y-o-
y
Source: World Trade Atlas
Thai export products to China had a mixed performance. Exports of non-electrical machinery (HS84) and organic chemical (HS29) continued to rise substantially, in the first nine months of 2005 while a surge in export growth of steel and iron (HS72) was a result of a stockpile due to an anticipation of higher prices coupled with the low base effect.10 In contrast, agricultural exports including rubber and its products (HS40) and cereal (HS10) did not perform well due to drought induced reductions in Thailand and increase in domestically-produced grains. Tariff reductions and trade facilitation under the Thailand-China Early Harvest Program had expanded fruits and vegetables trade but not so for trade of HS01-0611. After the implementation of the Early Harvest Program on fruits and vegetables trade in October 2003, the two governments have continued to discuss and resolve the remaining non-tariff measures like SPS measure and product standards. Accordingly, exports of fruits (HS08) and vegetables (HS07) expanded by 39 percent and 33 percent, in the first three quarters of 2005, while imports also rose by 11 percent and 44 percent, respectively. Nevertheless, Thailand remains a net exporter of fruits and vegetables with a US$222 million trade surplus compared to US$160 million in the same period last year. In contrast, despite the tariff reductions of items under HS 01-06, effective on 1 January 2004, trade on these items continued to contract.
9 China’s import data does not equal to its trading partners’ export-to-China data. However, China’s import data can be used to rank China’s imports from the different countries or, in other words, exports from the different countries to China. 10 Thailand’s exports of iron and steel to China in 2004 dropped by almost 50 percent due mainly to contractionary policies to control over-invested sectors in China. 11 HS01-06 includes HS01 (Live animals), HS02 ( Meat and Edible Meat Offal), HS03 (Fish and Seafood), HS04 (Dairy Products), HS05 (Other Animal Products), HS06 (Live Trees).
THAILAND ECONOMIC MONITOR NOVEMBER 2005
22
Table 6: Top Ten Export Products to Chinese Market in the first nine months of 2004 and 2005
(percent) 2004 9M 2005 9M
No. HS.code Description Share Growth
Contribution to export growth Share Growth
Contribution to export growth
1 84 Non-electrical machinery and parts 22.8 27.7 24.6 29.1 65.9 49.8
2 85 Electrical machinery and equipment 13.3 18.3 10.2 12.9 26.1 11.5
3 40 Rubber and articles thereof 12.4 13.6 7.4 9.9 3.7 1.5 4 27 Mineral fuel oil wax 10.2 16.3 7.1 9.2 17.8 6.0 5 39 Plastics and articles thereof 8.5 47.9 13.7 9.0 36.8 10.4 6 29 Organic chemical 4.9 12.4 2.7 5.0 31.2 5.1 7 07 Edible Vegetables 3.3 69.1 6.7 3.3 33.0 3.6 8 72 Iron and steel 1.5 -51.5 -7.7 2.8 151.6 7.4 9 44 Wood & articles 2.9 39.6 4.0 2.7 21.6 2.0
10 10 Cereal 3.0 266.3 10.9 1.6 -32.2 -3.2 Source: MOC Additional tariff reductions under ASEAN-China FTA, effective on 20 July 2005, are likely to further promote trade between the two countries12. Exports to China in August and September of 2005 increased by 38 percent year-on-year, a marginal increase from 35 percent in the corresponding months of 2004, while imports from China in the corresponding months also grew by 31 percent, year-on-year, a deceleration from last year’s 49 percent growth.
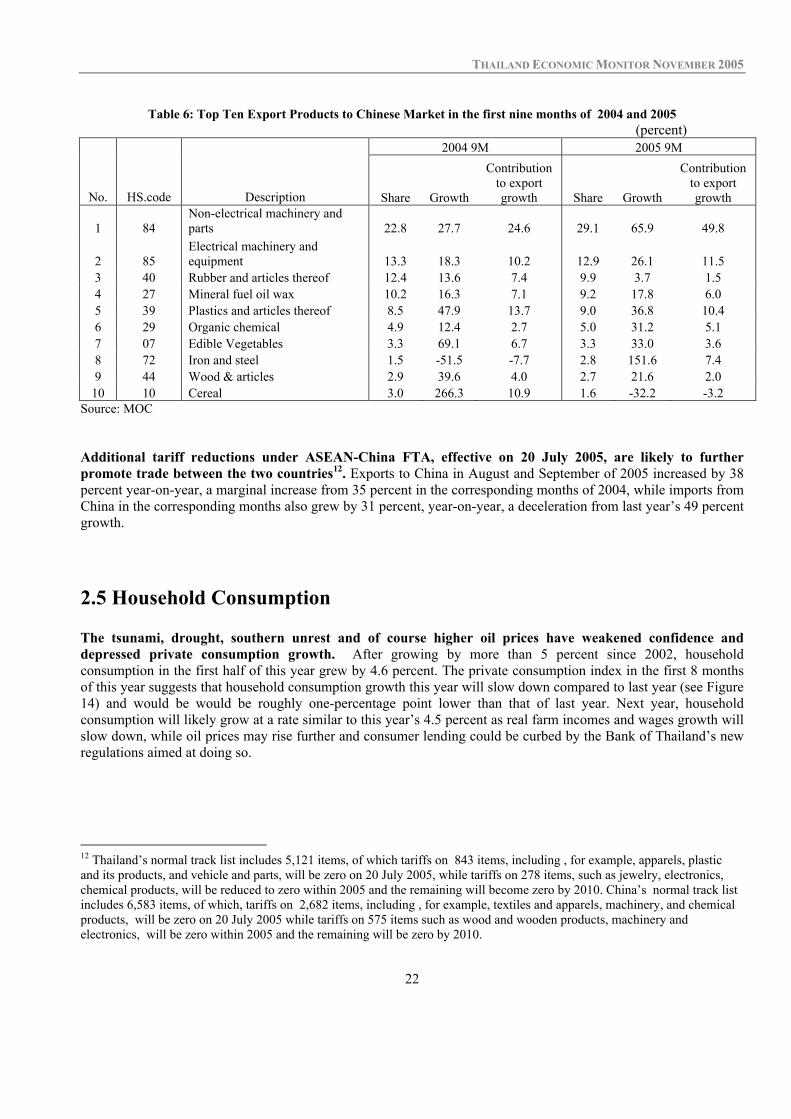
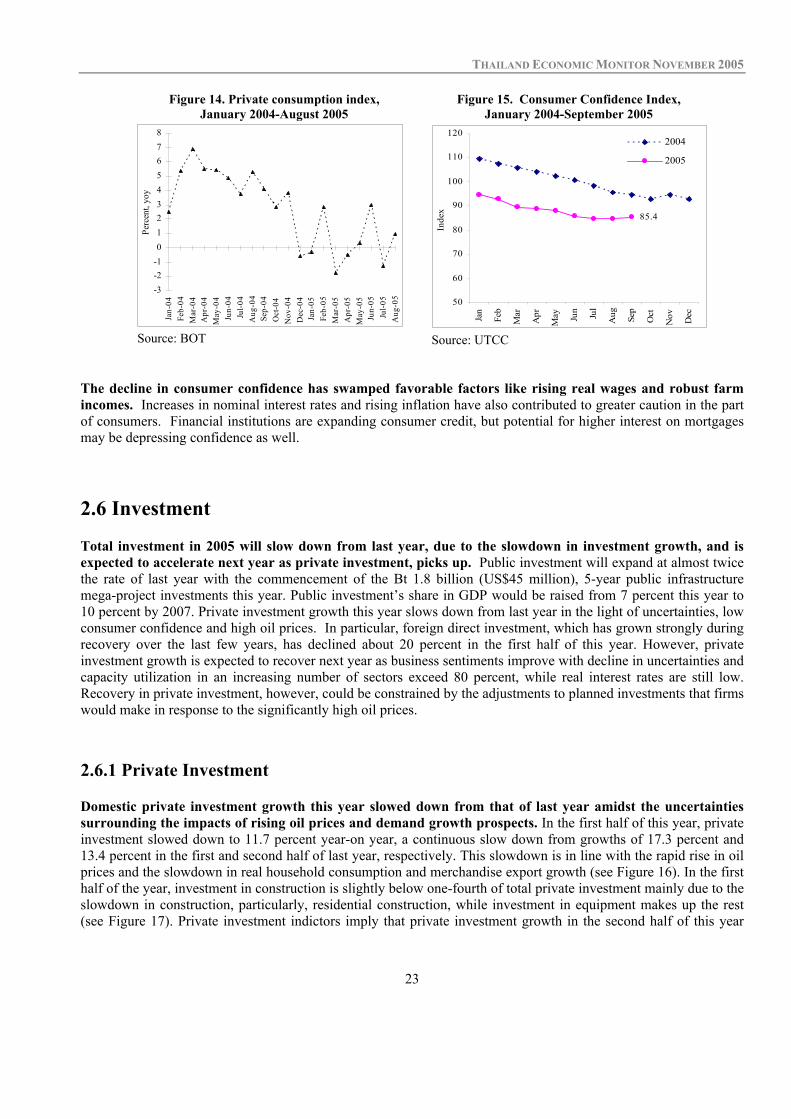
2.5 Household Consumption The tsunami, drought, southern unrest and of course higher oil prices have weakened confidence and depressed private consumption growth. After growing by more than 5 percent since 2002, household consumption in the first half of this year grew by 4.6 percent. The private consumption index in the first 8 months of this year suggests that household consumption growth this year will slow down compared to last year (see Figure 14) and would be would be roughly one-percentage point lower than that of last year. Next year, household consumption will likely grow at a rate similar to this year’s 4.5 percent as real farm incomes and wages growth will slow down, while oil prices may rise further and consumer lending could be curbed by the Bank of Thailand’s new regulations aimed at doing so.
12 Thailand’s normal track list includes 5,121 items, of which tariffs on 843 items, including , for example, apparels, plastic and its products, and vehicle and parts, will be zero on 20 July 2005, while tariffs on 278 items, such as jewelry, electronics, chemical products, will be reduced to zero within 2005 and the remaining will become zero by 2010. China’s normal track list includes 6,583 items, of which, tariffs on 2,682 items, including , for example, textiles and apparels, machinery, and chemical products, will be zero on 20 July 2005 while tariffs on 575 items such as wood and wooden products, machinery and electronics, will be zero within 2005 and the remaining will be zero by 2010.
THAILAND ECONOMIC MONITOR NOVEMBER 2005
23
Figure 14. Private consumption index, January 2004-August 2005
Figure 15. Consumer Confidence Index, January 2004-September 2005
-3-2-1012345678
Jan-
04Fe
b-04
Mar
-04
Apr
-04
May
-04
Jun-
04Ju
l-04
Aug
-04
Sep-
04O
ct-0
4N
ov-0
4D
ec-0
4Ja
n-05
Feb-
05M
ar-0
5A
pr-0
5M
ay-0
5Ju
n-05
Jul-0
5A
ug-0
5
Perc
ent,
yoy
Source: BOT
85.4
50
60
70
80
90
100
110
120
Jan
Feb
Mar
Apr
May Ju
n Jul
Aug Sep
Oct
Nov Dec
Inde
x
2004
2005
Source: UTCC
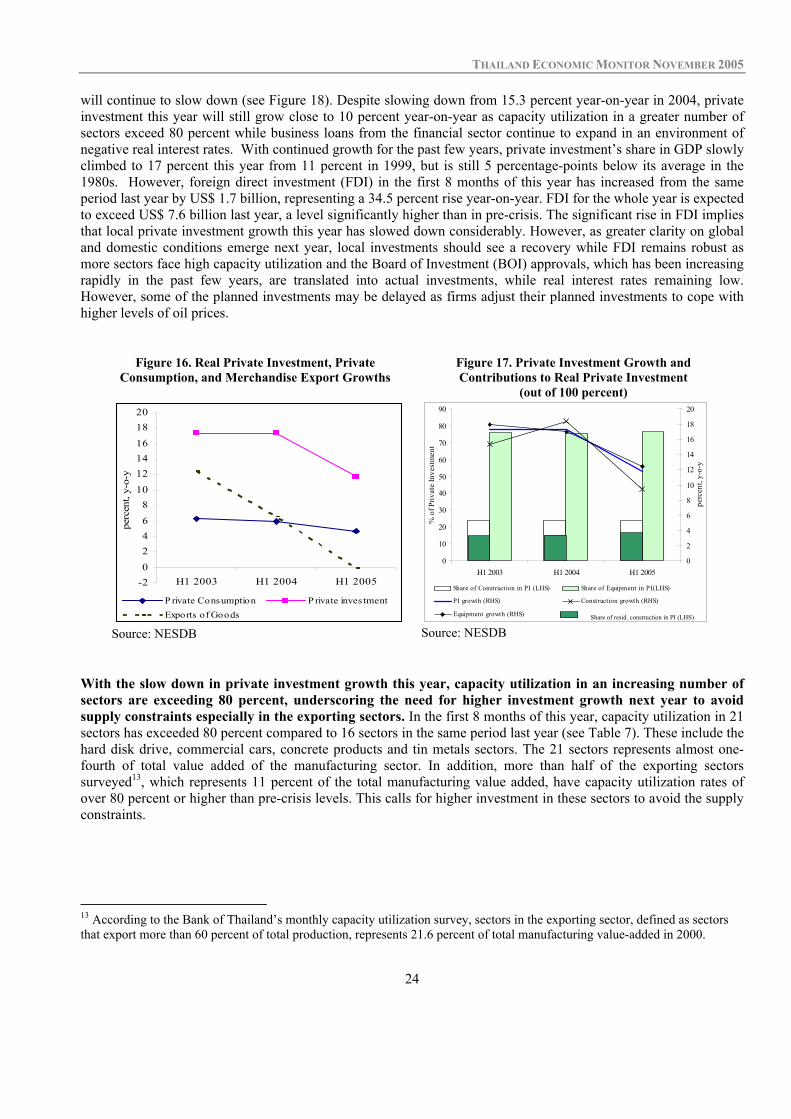
The decline in consumer confidence has swamped favorable factors like rising real wages and robust farm incomes. Increases in nominal interest rates and rising inflation have also contributed to greater caution in the part of consumers. Financial institutions are expanding consumer credit, but potential for higher interest on mortgages may be depressing confidence as well. 2.6 Investment Total investment in 2005 will slow down from last year, due to the slowdown in investment growth, and is expected to accelerate next year as private investment, picks up. Public investment will expand at almost twice the rate of last year with the commencement of the Bt 1.8 billion (US$45 million), 5-year public infrastructure mega-project investments this year. Public investment’s share in GDP would be raised from 7 percent this year to 10 percent by 2007. Private investment growth this year slows down from last year in the light of uncertainties, low consumer confidence and high oil prices. In particular, foreign direct investment, which has grown strongly during recovery over the last few years, has declined about 20 percent in the first half of this year. However, private investment growth is expected to recover next year as business sentiments improve with decline in uncertainties and capacity utilization in an increasing number of sectors exceed 80 percent, while real interest rates are still low. Recovery in private investment, however, could be constrained by the adjustments to planned investments that firms would make in response to the significantly high oil prices. 2.6.1 Private Investment Domestic private investment growth this year slowed down from that of last year amidst the uncertainties surrounding the impacts of rising oil prices and demand growth prospects. In the first half of this year, private investment slowed down to 11.7 percent year-on year, a continuous slow down from growths of 17.3 percent and 13.4 percent in the first and second half of last year, respectively. This slowdown is in line with the rapid rise in oil prices and the slowdown in real household consumption and merchandise export growth (see Figure 16). In the first half of the year, investment in construction is slightly below one-fourth of total private investment mainly due to the slowdown in construction, particularly, residential construction, while investment in equipment makes up the rest (see Figure 17). Private investment indictors imply that private investment growth in the second half of this year
THAILAND ECONOMIC MONITOR NOVEMBER 2005
24
will continue to slow down (see Figure 18). Despite slowing down from 15.3 percent year-on-year in 2004, private investment this year will still grow close to 10 percent year-on-year as capacity utilization in a greater number of sectors exceed 80 percent while business loans from the financial sector continue to expand in an environment of negative real interest rates. With continued growth for the past few years, private investment’s share in GDP slowly climbed to 17 percent this year from 11 percent in 1999, but is still 5 percentage-points below its average in the 1980s. However, foreign direct investment (FDI) in the first 8 months of this year has increased from the same period last year by US$ 1.7 billion, representing a 34.5 percent rise year-on-year. FDI for the whole year is expected to exceed US$ 7.6 billion last year, a level significantly higher than in pre-crisis. The significant rise in FDI implies that local private investment growth this year has slowed down considerably. However, as greater clarity on global and domestic conditions emerge next year, local investments should see a recovery while FDI remains robust as more sectors face high capacity utilization and the Board of Investment (BOI) approvals, which has been increasing rapidly in the past few years, are translated into actual investments, while real interest rates remaining low. However, some of the planned investments may be delayed as firms adjust their planned investments to cope with higher levels of oil prices.
Figure 16. Real Private Investment, Private Consumption, and Merchandise Export Growths
Figure 17. Private Investment Growth and Contributions to Real Private Investment
(out of 100 percent)
-202468
101214161820
H1 2003 H1 2004 H1 2005
perc
ent,
y-o-
y
P rivate Consumption P rivate inves tmentExports of Goods
Source: NESDB
0
10
20
30
40
50
60
70
80
90
H1 2003 H1 2004 H1 2005
% o
f Priv
ate
Inve
stm
ent
0
2
4
6
8
10
12
14
16
18
20
perc
ent,
y-o-
y
Share of Construction in PI (LHS) Share of Equipment in PI(LHS)
PI growth (RHS) Construction growth (RHS)
Equipment growth (RHS)
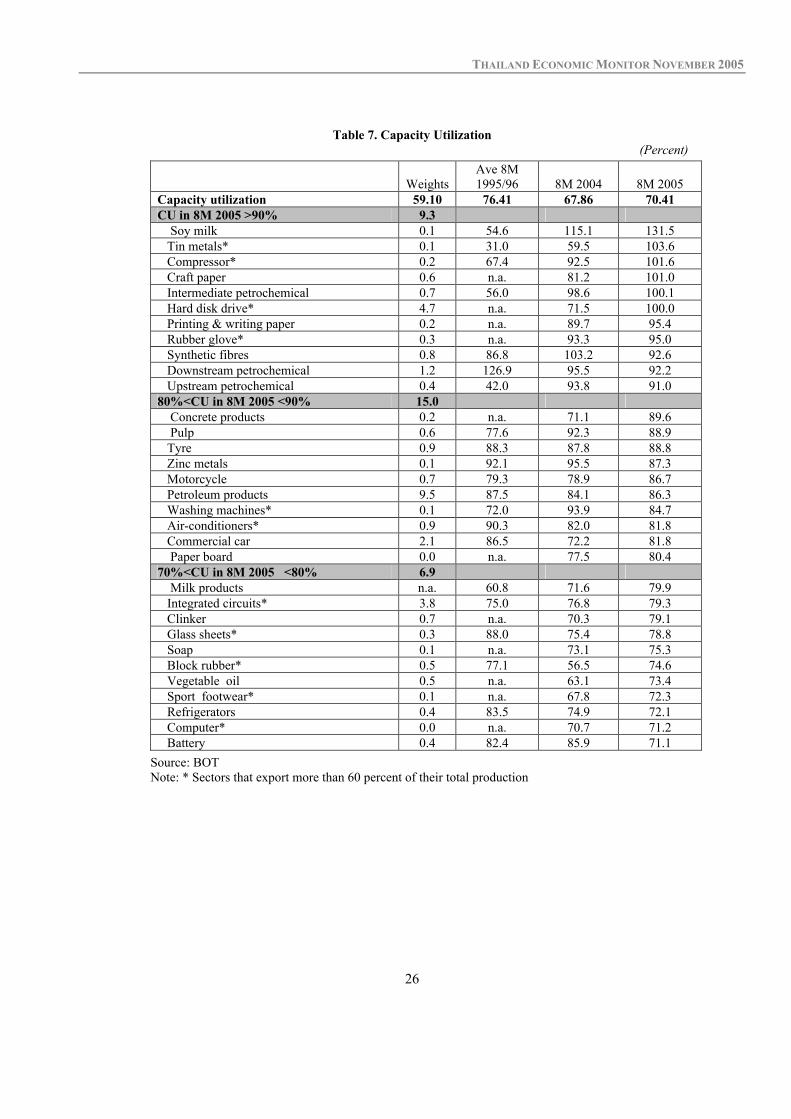
Source: NESDB With the slow down in private investment growth this year, capacity utilization in an increasing number of sectors are exceeding 80 percent, underscoring the need for higher investment growth next year to avoid supply constraints especially in the exporting sectors. In the first 8 months of this year, capacity utilization in 21 sectors has exceeded 80 percent compared to 16 sectors in the same period last year (see Table 7). These include the hard disk drive, commercial cars, concrete products and tin metals sectors. The 21 sectors represents almost one-fourth of total value added of the manufacturing sector. In addition, more than half of the exporting sectors surveyed13, which represents 11 percent of the total manufacturing value added, have capacity utilization rates of over 80 percent or higher than pre-crisis levels. This calls for higher investment in these sectors to avoid the supply constraints.
13 According to the Bank of Thailand’s monthly capacity utilization survey, sectors in the exporting sector, defined as sectors that export more than 60 percent of total production, represents 21.6 percent of total manufacturing value-added in 2000.
Share of resid. construction in PI (LHS)

THAILAND ECONOMIC MONITOR NOVEMBER 2005
25
Figure 18. Private Investment Index and Indicators, January 2004-September 2005
Figure 19. Real Lending Rates* (PPI-adjusted)
0
2
4
6
8
10
12
14
16
18
Jan-
04 Feb
Mar
Apr
May Ju
nJu
lA
ug Sep
Oct
Nov Dec
Jan-
05 Feb
Mar
Apr
May Ju
nJu
lA
ug Sep
Perc
ent,
yoy
-30
-20
-10
0
10
20
30
40
50
60
70
Perc
ent,
yoy
P rivate Inves tment Index (LHS)Domes tic cement sales (RHS)Domes tic commercial car sales (RHS)Import of capital goods at 1995 prices (RHS)
Source: BOT
-6
-4
-2
0
2
4
6
8
10
2003 2004 8M 2005
Perc
ent
Lending rate Inflation PPIReal interest rate
Source: BOT * Lending rate is proxied by the Minimum Loan Rate
(MLR)
Low real interest rates and continued expansion in loans to business have helped support private investment growth this year and will to a certain extent continue to do so next year. Interest rates have been slowly rising this year. Changes in producer prices, however, have been rising more rapidly, averaging 9.4 percent in the first 8 months. As a result, real interest rates have been negative at -3.7 percent on average, a further decline from last year’s level (see Figure 19). Financial sector loans to the business sector expanded at an annualized rate of 7 percent this year compared to 9 percent last year (see Figure 20) mostly as a result of the expansion of commercial bank loans to the real estate, manufacturing, and commerce sectors (see Table 8). Real interest rates next year will likely rise with the expected rise in nominal interest rates, while inflation would be lower than that of this year. However, real interest rates should continue to remain low, thus, not a constraint to further loan growth to the business sector.
Figure 20. Financial Sector Business Loan Growth**
0
1
2
3
4
5
6
7
8
9
10
2001 2002 2003* 2004 2005***
perc
ent,
y-o-
y
Source: BOT Note: * Change in classification of business types in accordance with the International Standard Industrial Classification (ISIC) in December 2003 ** Loans are adjusted by adding back loan write-off and loan transfer to AMCs excl. loan to AMCs. Financial sector include commercial bank and SFIs. ***Annualized
THAILAND ECONOMIC MONITOR NOVEMBER 2005
26
Table 7. Capacity Utilization (Percent)
Weights Ave 8M 1995/96 8M 2004 8M 2005
Capacity utilization 59.10 76.41 67.86 70.41 CU in 8M 2005 >90% 9.3 Soy milk 0.1 54.6 115.1 131.5 Tin metals* 0.1 31.0 59.5 103.6 Compressor* 0.2 67.4 92.5 101.6 Craft paper 0.6 n.a. 81.2 101.0 Intermediate petrochemical 0.7 56.0 98.6 100.1 Hard disk drive* 4.7 n.a. 71.5 100.0 Printing & writing paper 0.2 n.a. 89.7 95.4 Rubber glove* 0.3 n.a. 93.3 95.0 Synthetic fibres 0.8 86.8 103.2 92.6 Downstream petrochemical 1.2 126.9 95.5 92.2 Upstream petrochemical 0.4 42.0 93.8 91.0 80%<CU in 8M 2005 <90% 15.0 Concrete products 0.2 n.a. 71.1 89.6 Pulp 0.6 77.6 92.3 88.9 Tyre 0.9 88.3 87.8 88.8 Zinc metals 0.1 92.1 95.5 87.3 Motorcycle 0.7 79.3 78.9 86.7 Petroleum products 9.5 87.5 84.1 86.3 Washing machines* 0.1 72.0 93.9 84.7 Air-conditioners* 0.9 90.3 82.0 81.8 Commercial car 2.1 86.5 72.2 81.8 Paper board 0.0 n.a. 77.5 80.4 70%<CU in 8M 2005 <80% 6.9 Milk products n.a. 60.8 71.6 79.9 Integrated circuits* 3.8 75.0 76.8 79.3 Clinker 0.7 n.a. 70.3 79.1 Glass sheets* 0.3 88.0 75.4 78.8 Soap 0.1 n.a. 73.1 75.3 Block rubber* 0.5 77.1 56.5 74.6 Vegetable oil 0.5 n.a. 63.1 73.4 Sport footwear* 0.1 n.a. 67.8 72.3 Refrigerators 0.4 83.5 74.9 72.1 Computer* 0.0 n.a. 70.7 71.2 Battery 0.4 82.4 85.9 71.1
Source: BOT Note: * Sectors that export more than 60 percent of their total production

THAILAND ECONOMIC MONITOR NOVEMBER 2005
27
Table 8. Growth to Commercial Bank Loans (Percent)
2004 H1 2005
Share of
Loans Growth Share of
Loans Growth
(Annualized) Total Commercial Banks' Loans 100.0 8.3 100.0 5.5 Household Loans 16.0 12.2 16.3 8.1 Loans to Financial Institutions 12.9 -10.68 12.3 -5.6 Business Sector Loans 71.2 11.1 71.4 6.7 of which Manufacturing 27.3 16.1 27.4 3.9 Public Utilities 2.0 23.3 2.1 10.7 Construction 3.0 13.9 2.8 -10.0 Commerce 17.4 6.1 17.5 4.3 Hotel and Restaurant 3.7 22.7 3.7 6.2 Transportation 4.3 41 4.4 4.3 Real Estate 7.4 15.1 8.1 23.4 Others** 6.0 -13.8 5.5 -13.8
Source: BOT Note: Due to lack of sectoral adjustment data, these growth figures are unadjusted for write-offs, write-back, transfers to AMCs, and the effect of a merger in 2004 between a specialized financial institution and two commercial banks. ** Agriculture, fishing, mining and other business sectors
Gross FDI inflow has increased this year and is expected to play a larger role in supporting private investment growth next year. Gross inflows of FDI in the first 8 months of this year increased to US$6.5 billion compared to US$4.8 billion in the same period last year (see Figure 21). FDI inflows for the whole year will likely exceed last year’s level of US$7.6 billion. FDI is expected to remain high next year given that uncertainties surrounding the oil prices clear up and the strong increase in Board of Investment’s (BOI) approval for FDI in the past few years translates into actual investments (see Figure 22). Moreover, Thailand is ranked as the third most attractive investment destination after China and India according to the recent survey of 325 largest transnational corporation in the world by UNCTAD14.
Figure 21. Gross FDI Inflows Figure 22. BOI FDI Approvals
0
1
2
3
4
5
6
7
8
Avg1988/92
2003 2004 8M 2004 8M 2005
Billi
ons o
f US$
Source: BOT
0
50
100
150
200
250
300
350
400
2002 2003 2004 Jan-Sep2004
Jan-Sep2005
Bt B
illio
n
100% foreign equity10%<foreign equity<100%
Source: BOI
14 Source: UNCTAD Global Investment Prospect Assessment, September 2005.
THAILAND ECONOMIC MONITOR NOVEMBER 2005
28
The steady decline in excess capacity utilization and the increase in BOI investment approvals in the past few years should lead to a speeding up of private investment next year, though the impact of high oil prices on firms may pose some limits. With brighter growth prospects next year, firms’ confidence and hence their investments should increase as higher private investment growth will be need in many sectors to avoid the potential supply constraints should demand pick up. Next year, we should see more of BOI investment promotion approvals, which have been increasing sharply since 2003, get translated into actual investments, particularly, in the following sectors (see Table 9): services and infrastructure, electronics and electrical appliances, mining and base metal, chemical, paper, and plastics, and metal products, machinery, and transport equipment. However, a portion of the planned investments could be delayed as firms adjust their investments to cope with high levels of oil prices such as investing in more full-efficient technologies. With retail oil prices this year over 50 percent higher than those in 2002, firms’ cost of production have risen significantly, thus reducing their profit margins and limiting their financial capacity to make additional investments.
Table 9. BOI Promotion Approvals by Sector (Billion Baht)
2003 2004 2004 (Jan-Aug)
2005 (Jan-Aug)
Total (Billion Baht) 283.8 600.8 246.3 394.3
Agriculture 30.0 57.1 36.1 18.1 Mining, ceramics and base metal 17.1 64.1 4.7 102.9 Light industry 12.8 18.4 11.5 8.7 Metal products, machinery and transport equipment 69.5 74.9 47.9 116.1 Electronics and electrical appliance 44.3 94.3 68.2 43.5 Chemical, paper and plastic 49.3 121.7 23.4 24.1 Services and infrastructure 60.8 170.3 54.5 80.9
Source: BOI 2.6.2 Public Investment Public investments grew at almost twice the rate of last year with the implementation of the Bt1.8 trillion (US$42.5 billion), 5-year infrastructure mega-project investments (2005-2009)15 starting this year. Given the high public investment expansion in the first half and the Bt42.7 billion disbursement public mega-project investment in the second half of this year, public investments this year should grow close to 20 percent year-on-year. With a sharp rise in mega-project investments next year, public investment, particularly in construction, will continue to grow at double digit rates next year. The public investment plans for the next 5 years will help raise public investment shares of GDP from 7 percent this year to 10 percent by 2007 (see Table 10). This compliments investments in “non-mega projects” 16 of roughly Bt1.9 trillion in the same 5-year period. Given the current levels of private investment growth, the impact on fiscal and current account balance and public debt are consistent with the medium term macroeconomic stability. The infrastructure program should therefore be prioritized to reduce costs and raise the quality of infrastructure services so that private investors’ competitiveness can be increased. 15 The mega-project plan of Bt1.7 trillion was approved by the Cabinet on June 14, 2005. The plan was revised to Bt1.8 trillion on November 1, 2005. The increase is mainly due to the addition of 2 low income housing projects. Mega-projects refer to those which cost Bt1 billion (US25 million) and above. 16 Defined as the “basic investments” below Bt1 billion that the Government and state-owned enterprises (SOEs) would normally invest to maintain or upgrade existing infrastructure.
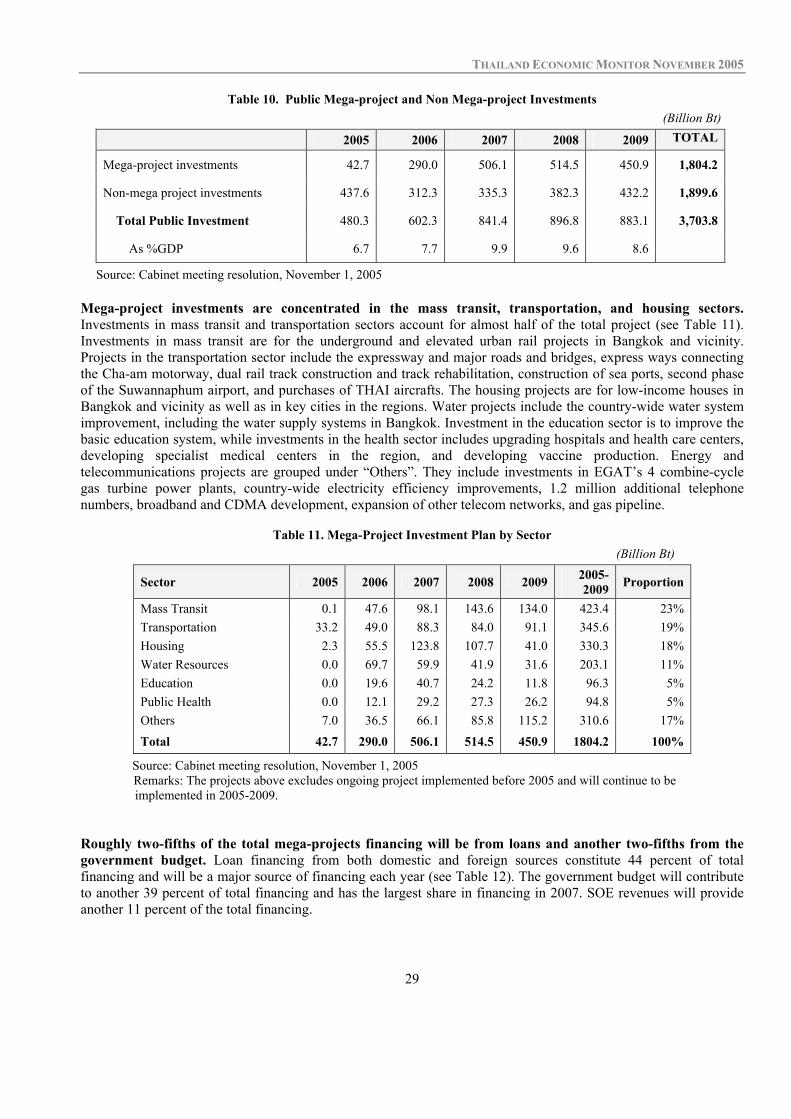
THAILAND ECONOMIC MONITOR NOVEMBER 2005
29
Table 10. Public Mega-project and Non Mega-project Investments (Billion Bt)
2005 2006 2007 2008 2009 TOTAL
Mega-project investments 42.7 290.0 506.1 514.5 450.9 1,804.2
Non-mega project investments 437.6 312.3 335.3 382.3 432.2 1,899.6
Total Public Investment 480.3 602.3 841.4 896.8 883.1 3,703.8
As %GDP 6.7 7.7 9.9 9.6 8.6
Source: Cabinet meeting resolution, November 1, 2005 Mega-project investments are concentrated in the mass transit, transportation, and housing sectors. Investments in mass transit and transportation sectors account for almost half of the total project (see Table 11). Investments in mass transit are for the underground and elevated urban rail projects in Bangkok and vicinity. Projects in the transportation sector include the expressway and major roads and bridges, express ways connecting the Cha-am motorway, dual rail track construction and track rehabilitation, construction of sea ports, second phase of the Suwannaphum airport, and purchases of THAI aircrafts. The housing projects are for low-income houses in Bangkok and vicinity as well as in key cities in the regions. Water projects include the country-wide water system improvement, including the water supply systems in Bangkok. Investment in the education sector is to improve the basic education system, while investments in the health sector includes upgrading hospitals and health care centers, developing specialist medical centers in the region, and developing vaccine production. Energy and telecommunications projects are grouped under “Others”. They include investments in EGAT’s 4 combine-cycle gas turbine power plants, country-wide electricity efficiency improvements, 1.2 million additional telephone numbers, broadband and CDMA development, expansion of other telecom networks, and gas pipeline.
Table 11. Mega-Project Investment Plan by Sector
(Billion Bt)
Sector 2005 2006 2007 2008 2009 2005-2009 Proportion
Mass Transit 0.1 47.6 98.1 143.6 134.0 423.4 23% Transportation 33.2 49.0 88.3 84.0 91.1 345.6 19% Housing 2.3 55.5 123.8 107.7 41.0 330.3 18% Water Resources 0.0 69.7 59.9 41.9 31.6 203.1 11% Education 0.0 19.6 40.7 24.2 11.8 96.3 5% Public Health 0.0 12.1 29.2 27.3 26.2 94.8 5% Others 7.0 36.5 66.1 85.8 115.2 310.6 17% Total 42.7 290.0 506.1 514.5 450.9 1804.2 100%
Source: Cabinet meeting resolution, November 1, 2005 Remarks: The projects above excludes ongoing project implemented before 2005 and will continue to be
implemented in 2005-2009. Roughly two-fifths of the total mega-projects financing will be from loans and another two-fifths from the government budget. Loan financing from both domestic and foreign sources constitute 44 percent of total financing and will be a major source of financing each year (see Table 12). The government budget will contribute to another 39 percent of total financing and has the largest share in financing in 2007. SOE revenues will provide another 11 percent of the total financing.
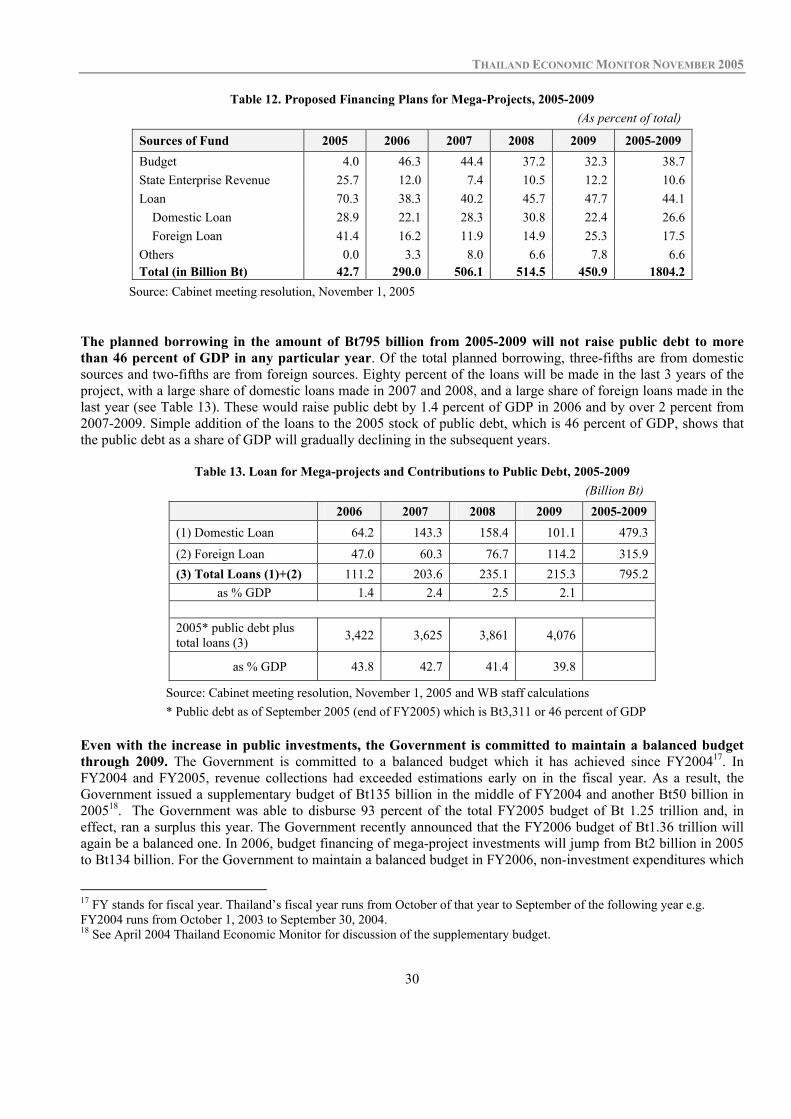
THAILAND ECONOMIC MONITOR NOVEMBER 2005
30
Table 12. Proposed Financing Plans for Mega-Projects, 2005-2009 (As percent of total)
Sources of Fund 2005 2006 2007 2008 2009 2005-2009 Budget 4.0 46.3 44.4 37.2 32.3 38.7 State Enterprise Revenue 25.7 12.0 7.4 10.5 12.2 10.6 Loan 70.3 38.3 40.2 45.7 47.7 44.1 Domestic Loan 28.9 22.1 28.3 30.8 22.4 26.6 Foreign Loan 41.4 16.2 11.9 14.9 25.3 17.5 Others 0.0 3.3 8.0 6.6 7.8 6.6 Total (in Billion Bt) 42.7 290.0 506.1 514.5 450.9 1804.2
Source: Cabinet meeting resolution, November 1, 2005 The planned borrowing in the amount of Bt795 billion from 2005-2009 will not raise public debt to more than 46 percent of GDP in any particular year. Of the total planned borrowing, three-fifths are from domestic sources and two-fifths are from foreign sources. Eighty percent of the loans will be made in the last 3 years of the project, with a large share of domestic loans made in 2007 and 2008, and a large share of foreign loans made in the last year (see Table 13). These would raise public debt by 1.4 percent of GDP in 2006 and by over 2 percent from 2007-2009. Simple addition of the loans to the 2005 stock of public debt, which is 46 percent of GDP, shows that the public debt as a share of GDP will gradually declining in the subsequent years.
Table 13. Loan for Mega-projects and Contributions to Public Debt, 2005-2009 (Billion Bt)
2006 2007 2008 2009 2005-2009 (1) Domestic Loan 64.2 143.3 158.4 101.1 479.3
(2) Foreign Loan 47.0 60.3 76.7 114.2 315.9 (3) Total Loans (1)+(2) 111.2 203.6 235.1 215.3 795.2
as % GDP 1.4 2.4 2.5 2.1 2005* public debt plus total loans (3) 3,422 3,625 3,861 4,076
as % GDP 43.8 42.7 41.4 39.8
Source: Cabinet meeting resolution, November 1, 2005 and WB staff calculations * Public debt as of September 2005 (end of FY2005) which is Bt3,311 or 46 percent of GDP
Even with the increase in public investments, the Government is committed to maintain a balanced budget through 2009. The Government is committed to a balanced budget which it has achieved since FY200417. In FY2004 and FY2005, revenue collections had exceeded estimations early on in the fiscal year. As a result, the Government issued a supplementary budget of Bt135 billion in the middle of FY2004 and another Bt50 billion in 200518. The Government was able to disburse 93 percent of the total FY2005 budget of Bt 1.25 trillion and, in effect, ran a surplus this year. The Government recently announced that the FY2006 budget of Bt1.36 trillion will again be a balanced one. In 2006, budget financing of mega-project investments will jump from Bt2 billion in 2005 to Bt134 billion. For the Government to maintain a balanced budget in FY2006, non-investment expenditures which
17 FY stands for fiscal year. Thailand’s fiscal year runs from October of that year to September of the following year e.g. FY2004 runs from October 1, 2003 to September 30, 2004. 18 See April 2004 Thailand Economic Monitor for discussion of the supplementary budget.

THAILAND ECONOMIC MONITOR NOVEMBER 2005
31
have been growing in the past few years will need to be reduced by roughly 3 percent before increasing in the subsequent years (see Figure 23).
Figure 23. Central Government Budget for Investment and Non-investment Expenditures
Figure 24. Import for Mega-project Investments, 2005-2009
0.00.20.40.60.81.01.21.41.61.82.0
FY20
03
2004
2005
2006
2007
e
2008
e
2009
e
Trill
ion
Bt
CG Investment expendituresNon-investment expenditures
Source: FY2003-2006, Bureau of Budget
FY2007-2009, WB estimate Remark: For FY2007-2009, investment expenditures are budget financing of mega projects plus half of the non-mega project costs. Total government budget is projected to grow at 10 percent in FY2007-2009
0
50
100
150
200
2005 2006 2007 2008 2009
Bill
ion
Bt
0.0
0.5
1.0
1.5
2.0
2.5
Perc
ent o
f GD
P
Import content (LHS)% of GDP (RHS)
Source: FPO, “Mega Projects to Macro Projections (Part II), September 26, 2005 and Cabinet meeting resolution, November 1, 2005
Investments on the mega-projects will put a higher pressure on Thailand’s current accounts in the short term. Overall imports for the mega-project investment are estimated at Bt 664 billion or 37 percent of the total investments. The import content, however, varies by sector. Sectors with larger investments namely the transportation, mass transit, and energy and telecom sectors (under “others”) are those with the highest import content of over 45 percent. Housing and water resources are sectors with the lowest import content of about 10 percent (see Table 14). However, the imports are to rise annually, reaching its maximum of Bt190 billion or 2 percent of GDP in 2009 (see Figure 24). Given that Thailand’s merchandise imports is roughly 60 percent of nominal GDP, an addition increase of imports on an average of 1.5 percent per year from the mega-project investments is not large. However, because Thailand’s current account deficits will likely reach 1.5 percent of GDP this year and will remain in deficit in the next few years with high oil prices and pick up in private investments, any addition to the current account deficit must be closely monitored (see Box 3 for a discussion of Thailand’s current account). Nevertheless, the mega-project investments appear to be consistent with the medium term macroeconomic stability and will help improve Thailand’s competitiveness as the problem of inadequate infrastructure is alleviated. Public infrastructure investment is long over-due agenda since the crisis. It is therefore timely for the projects to be undertaken. Nevertheless, the strategic importance of the investments as well as their priorities need to be well worked out to ensure that the public investment increases private sector competitiveness and promotes private investment; this means the choice and sequencing of projects will be critical.
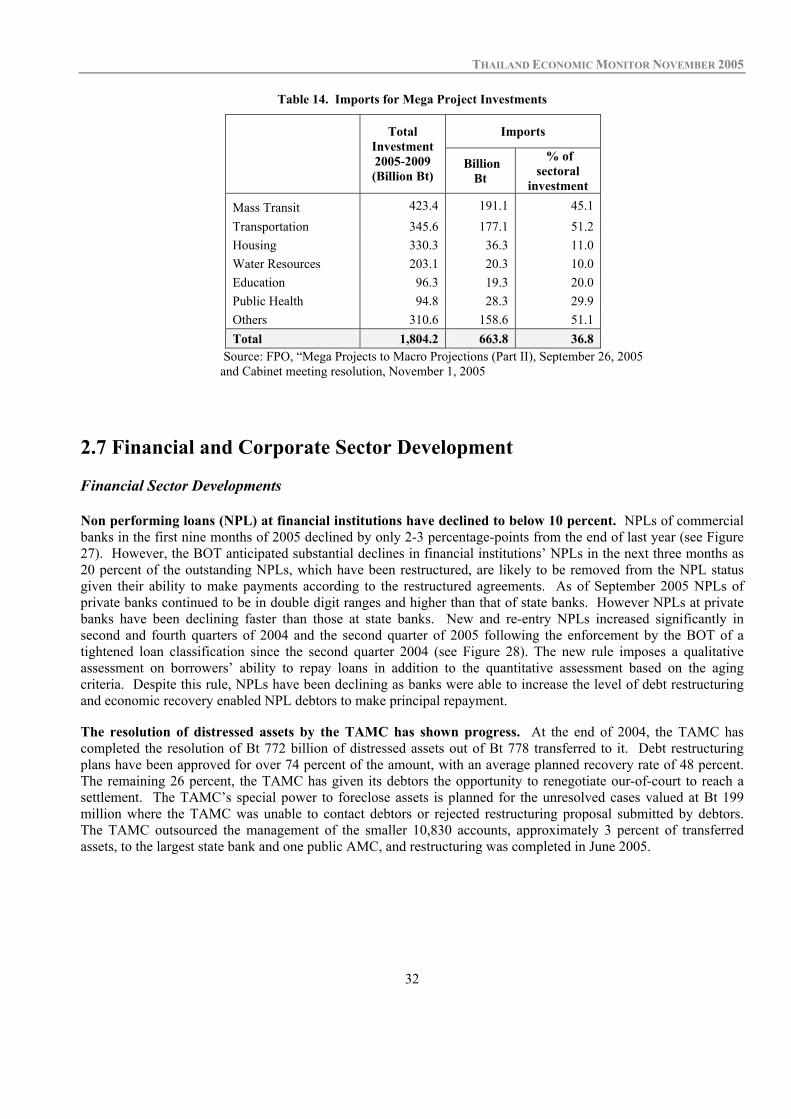
THAILAND ECONOMIC MONITOR NOVEMBER 2005
32
Table 14. Imports for Mega Project Investments
Imports
Total Investment 2005-2009 (Billion Bt)
Billion Bt
% of sectoral
investment
Mass Transit 423.4 191.1 45.1 Transportation 345.6 177.1 51.2 Housing 330.3 36.3 11.0 Water Resources 203.1 20.3 10.0 Education 96.3 19.3 20.0 Public Health 94.8 28.3 29.9 Others 310.6 158.6 51.1 Total 1,804.2 663.8 36.8
Source: FPO, “Mega Projects to Macro Projections (Part II), September 26, 2005 and Cabinet meeting resolution, November 1, 2005
2.7 Financial and Corporate Sector Development Financial Sector Developments Non performing loans (NPL) at financial institutions have declined to below 10 percent. NPLs of commercial banks in the first nine months of 2005 declined by only 2-3 percentage-points from the end of last year (see Figure 27). However, the BOT anticipated substantial declines in financial institutions’ NPLs in the next three months as 20 percent of the outstanding NPLs, which have been restructured, are likely to be removed from the NPL status given their ability to make payments according to the restructured agreements. As of September 2005 NPLs of private banks continued to be in double digit ranges and higher than that of state banks. However NPLs at private banks have been declining faster than those at state banks. New and re-entry NPLs increased significantly in second and fourth quarters of 2004 and the second quarter of 2005 following the enforcement by the BOT of a tightened loan classification since the second quarter 2004 (see Figure 28). The new rule imposes a qualitative assessment on borrowers’ ability to repay loans in addition to the quantitative assessment based on the aging criteria. Despite this rule, NPLs have been declining as banks were able to increase the level of debt restructuring and economic recovery enabled NPL debtors to make principal repayment. The resolution of distressed assets by the TAMC has shown progress. At the end of 2004, the TAMC has completed the resolution of Bt 772 billion of distressed assets out of Bt 778 transferred to it. Debt restructuring plans have been approved for over 74 percent of the amount, with an average planned recovery rate of 48 percent. The remaining 26 percent, the TAMC has given its debtors the opportunity to renegotiate our-of-court to reach a settlement. The TAMC’s special power to foreclose assets is planned for the unresolved cases valued at Bt 199 million where the TAMC was unable to contact debtors or rejected restructuring proposal submitted by debtors. The TAMC outsourced the management of the smaller 10,830 accounts, approximately 3 percent of transferred assets, to the largest state bank and one public AMC, and restructuring was completed in June 2005.
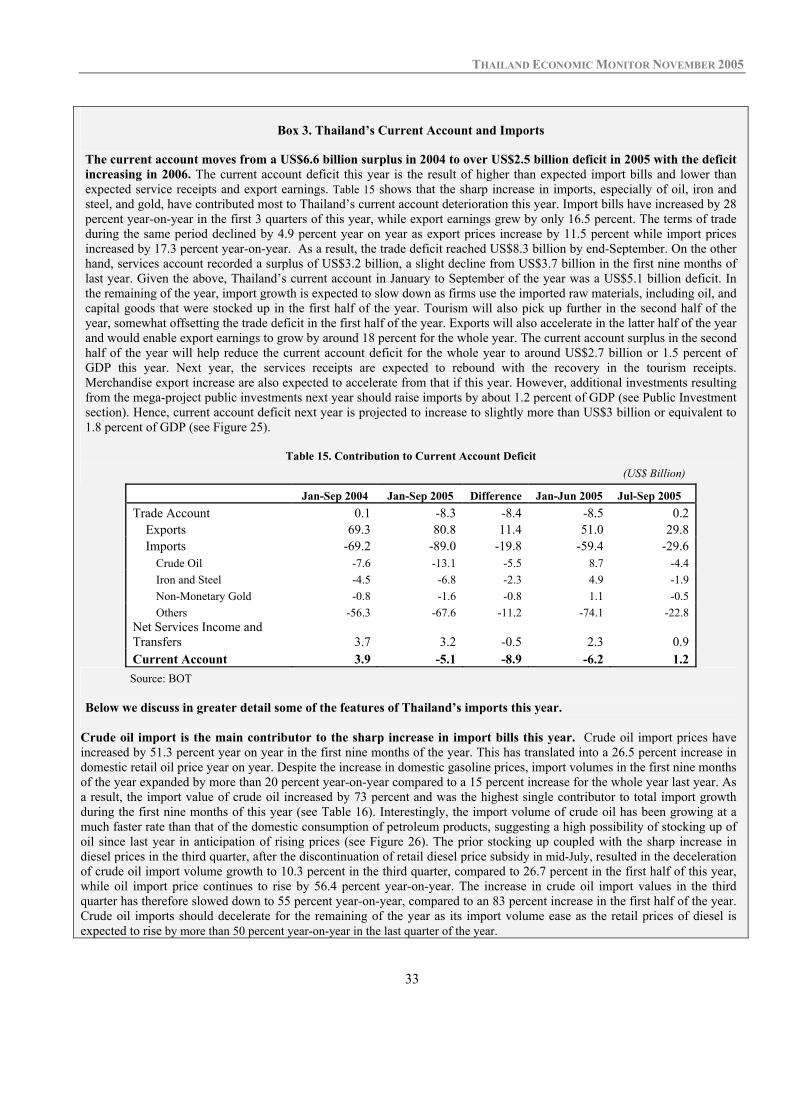
THAILAND ECONOMIC MONITOR NOVEMBER 2005
33
Box 3. Thailand’s Current Account and Imports The current account moves from a US$6.6 billion surplus in 2004 to over US$2.5 billion deficit in 2005 with the deficit increasing in 2006. The current account deficit this year is the result of higher than expected import bills and lower than expected service receipts and export earnings. Table 15 shows that the sharp increase in imports, especially of oil, iron and steel, and gold, have contributed most to Thailand’s current account deterioration this year. Import bills have increased by 28 percent year-on-year in the first 3 quarters of this year, while export earnings grew by only 16.5 percent. The terms of trade during the same period declined by 4.9 percent year on year as export prices increase by 11.5 percent while import prices increased by 17.3 percent year-on-year. As a result, the trade deficit reached US$8.3 billion by end-September. On the other hand, services account recorded a surplus of US$3.2 billion, a slight decline from US$3.7 billion in the first nine months of last year. Given the above, Thailand’s current account in January to September of the year was a US$5.1 billion deficit. In the remaining of the year, import growth is expected to slow down as firms use the imported raw materials, including oil, and capital goods that were stocked up in the first half of the year. Tourism will also pick up further in the second half of the year, somewhat offsetting the trade deficit in the first half of the year. Exports will also accelerate in the latter half of the year and would enable export earnings to grow by around 18 percent for the whole year. The current account surplus in the second half of the year will help reduce the current account deficit for the whole year to around US$2.7 billion or 1.5 percent of GDP this year. Next year, the services receipts are expected to rebound with the recovery in the tourism receipts. Merchandise export increase are also expected to accelerate from that if this year. However, additional investments resulting from the mega-project public investments next year should raise imports by about 1.2 percent of GDP (see Public Investment section). Hence, current account deficit next year is projected to increase to slightly more than US$3 billion or equivalent to 1.8 percent of GDP (see Figure 25).
Table 15. Contribution to Current Account Deficit (US$ Billion)
Jan-Sep 2004 Jan-Sep 2005 Difference Jan-Jun 2005 Jul-Sep 2005 Trade Account 0.1 -8.3 -8.4 -8.5 0.2
Exports 69.3 80.8 11.4 51.0 29.8 Imports -69.2 -89.0 -19.8 -59.4 -29.6
Crude Oil -7.6 -13.1 -5.5 8.7 -4.4 Iron and Steel -4.5 -6.8 -2.3 4.9 -1.9 Non-Monetary Gold -0.8 -1.6 -0.8 1.1 -0.5 Others -56.3 -67.6 -11.2 -74.1 -22.8
Net Services Income and Transfers 3.7 3.2 -0.5 2.3 0.9 Current Account 3.9 -5.1 -8.9 -6.2 1.2
Source: BOT Below we discuss in greater detail some of the features of Thailand’s imports this year.
Crude oil import is the main contributor to the sharp increase in import bills this year. Crude oil import prices have increased by 51.3 percent year on year in the first nine months of the year. This has translated into a 26.5 percent increase in domestic retail oil price year on year. Despite the increase in domestic gasoline prices, import volumes in the first nine months of the year expanded by more than 20 percent year-on-year compared to a 15 percent increase for the whole year last year. As a result, the import value of crude oil increased by 73 percent and was the highest single contributor to total import growth during the first nine months of this year (see Table 16). Interestingly, the import volume of crude oil has been growing at a much faster rate than that of the domestic consumption of petroleum products, suggesting a high possibility of stocking up of oil since last year in anticipation of rising prices (see Figure 26). The prior stocking up coupled with the sharp increase in diesel prices in the third quarter, after the discontinuation of retail diesel price subsidy in mid-July, resulted in the deceleration of crude oil import volume growth to 10.3 percent in the third quarter, compared to 26.7 percent in the first half of this year, while oil import price continues to rise by 56.4 percent year-on-year. The increase in crude oil import values in the third quarter has therefore slowed down to 55 percent year-on-year, compared to an 83 percent increase in the first half of the year. Crude oil imports should decelerate for the remaining of the year as its import volume ease as the retail prices of diesel is expected to rise by more than 50 percent year-on-year in the last quarter of the year.

THAILAND ECONOMIC MONITOR NOVEMBER 2005
34
Figure 25. Current Account, 2003-2006p Figure 26. Growth of Crude Oil Imports and Domestic
Petroleum Consumption, 2001 to Jan-Sep 2005
-10-8-6-4-202468
10
2003 2004 2005p 2006p
US$
Bill
ion
-8
-6
-4
-2
0
2
4
6
8
% o
f GD
P
Current AccountTrade AccountCurrent Account (% GDP)Trade Account (%GDP)
Source: BOT for 2003 and 2004 WB estimate for 2005 and 2006
-5
0
5
10
15
20
25
2001 2002 2003 2004 9M2005*
Perc
ent,
y-o-
y
Volume of crude oil imports (HS2709)Consumption of petroleum products
Source: Customs Dept and Energy Policy and Planning Office Note: * Eight months data for consumption of petroleum products.
Excluding crude oil imports, imports of non-oil raw materials and intermediate products grew by 20 percent and contributed to roughly two fifths of total import growth in the first three quarters of the year. This rapid rise in non-oil raw materials and intermediate goods is mainly due to its higher import prices which grew by 14.5 percent year-on-year compared to 10.3 percent last year. Their import volumes, on the other hand, decelerated from those of last year. Iron and steel import values, in particular, increased rapidly by 72.4 percent in the first half of the year as a result of the continued growth in the construction sector and the temporary shut down of large local steel producers in the first quarter for a major upgrading, resulting in a contraction in local steel production in the first quarter19. There is also some evidence of stocking up by firms in the first half of the year to take advantage of the slow down in the rise in import price of steel this year20. Beginning in the third quarter, imports of steel have slowed down to 16.8 percent year-on-year as firms have stocked up in the beginning of the year and local manufacturers resumed operations (see Table 16).
Table 16. Contribution to Import Growth (Percent)
January-June 2005 July-September 2005 January-September 2005
Growth Share
Contribution to Import Growth
Growth Share Contribution
to Import Growth
Growth Share Contribution
to Import Growth
Consumer Goods 12.3 7.1 3.2 5.8 7.4 2.4 10.0 7.2 3.0
Capital Goods 27.1 22.9 20.2 21.8 23.5 24.7 25.3 23.1 21.3
Raw Materials and Intermediate Goods 34.1 63.4 66.6 19.6 63.1 61.1 29.0 63.3 65.2
Crude Oil 83.1 14.5 27.2 54.9 14.9 31.1 72.6 14.7 28.2
Iron and Steel 72.4 8.1 14.1 16.8 6.5 5.5 52.0 7.6 11.9
Other Imports 58.9 6.5 10.0 50.4 6.0 11.8 56.1 6.4 10.5
Total imports 32.0 100.0 100.0 20.4 100.0 100.0 27.9 100.0 100.0
Source: BOT
19 Fiscal Policy Office, Thailand Economic Forecast 2005, May 2005 20 Bank of Thailand, Inflation Report, April 2005

THAILAND ECONOMIC MONITOR NOVEMBER 2005
35
Figure 27. Non-performing Loans, June 2001-September 2005
Figure 28. Changes in NPLs, 1Q 2003-2Q 2005
0%
5%
10%
15%
20%
25%
Jun-
01
Dec
-01
Jun-
02
Dec
-02
Jun-
03
Dec
-03
Jun-
04
Dec
-04
Jun-
05
% o
f tot
al lo
ans
Private banksState-owned banksTotal commercial banks
Source: BOT and World Bank’s Estimate
0 50 100 150 200
1Q 03
2Q 03
3Q 03
4Q 03
1Q 04
2Q 04
3Q 04
4Q 04
1Q 05
2Q 05
Increase in NPLsDecline in NPLs
Billion Baht Source: BOT and World Bank’s estimates
The profitability of Thai commercial banks has continued to improve and their balance sheets have gradually strengthened. Strong loan growth and wider margin have been the key contributing factors to the improvement in Thai banks’ profitability (see Figure 29). Wider margin was caused by the reduction in interest expense burden following the redemption of high cost hybrid capital. Improved profits enabled Thai banks to accumulate their capital base and increase their ability to absorb risk. However the performance varied between different sizes of banks21 classified by the BOT. While large banks reported higher return on assets than medium and small banks, their asset quality appeared weaker as indicated by higher NPL ratios. Profitability and capital adequacy ratios of medium banks were not as high, but their NPL ratios were reported to be lower than large and small banks. The capital level of small banks was quite strong with average tier-1 capital above 14 percent of total risk assets.
Figure 29. Average Interest Yields, Funding Costs, and Interest Margins of Thai Commercial Banks, 2000-2005
Figure 30. Minimum Lending Rates and Deposit Rates for 3- month Deposits, 4Q 2001-2Q 2005
1.0%
2.0%
3.0%
4.0%
5.0%
2000 2001 2002 2003 2004 2005
Interest Yields Funding Costs
Interest Margins
Source: BOT and the World Bank’s Estimate Note: 2005 information corresponds to the 1Q
01
23
456
78
910
4Q 2
001
2Q 2
002
4Q 2
002
2Q 2
003
4Q 2
003
2Q 2
004
4Q 2
004
2Q 2
005
perc
ent
3-month Deposit Rates Average MLR
Source: BOT and the World Bank’s Estimate Note: 2005 information corresponds to 3Q.
21 Large banks include Thai commercial banks with market share of total assets greater than or equal to 10 percent; Medium banks include Thai commercial banks with market share of total assets between 3 and 10 percent; Small banks include Thai commercial banks with market share of total assets less than 3 percent.
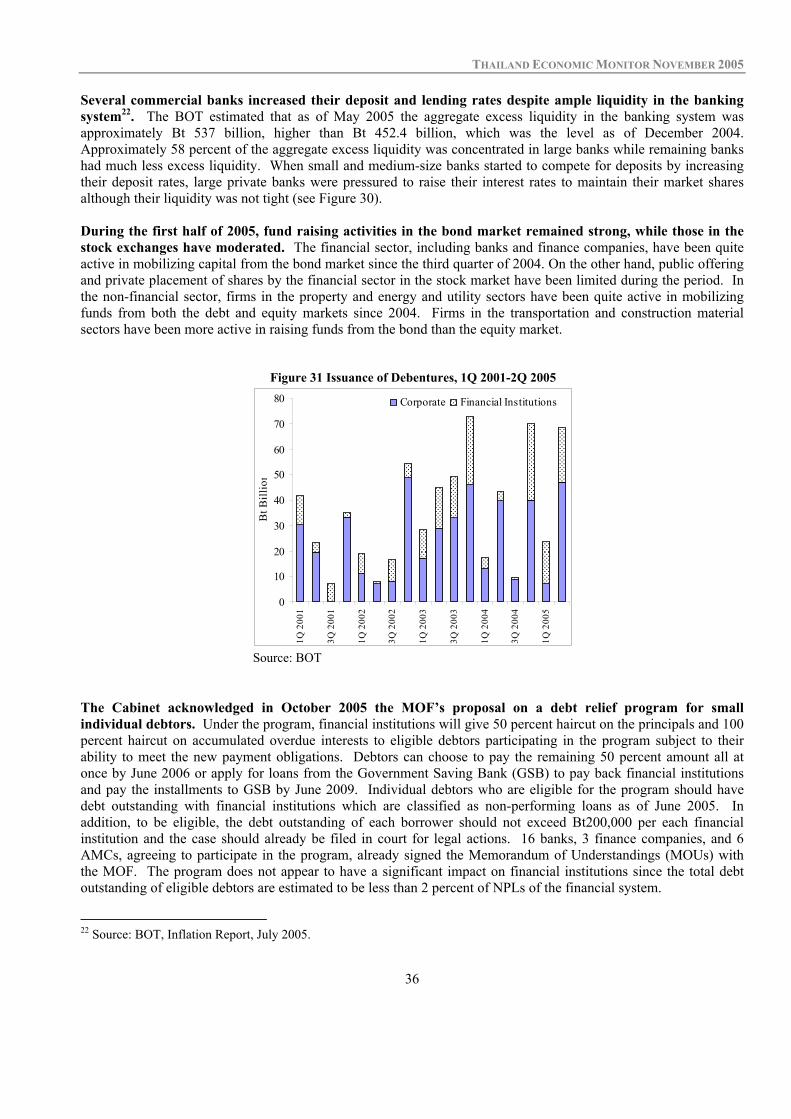
THAILAND ECONOMIC MONITOR NOVEMBER 2005
36
Several commercial banks increased their deposit and lending rates despite ample liquidity in the banking system22. The BOT estimated that as of May 2005 the aggregate excess liquidity in the banking system was approximately Bt 537 billion, higher than Bt 452.4 billion, which was the level as of December 2004. Approximately 58 percent of the aggregate excess liquidity was concentrated in large banks while remaining banks had much less excess liquidity. When small and medium-size banks started to compete for deposits by increasing their deposit rates, large private banks were pressured to raise their interest rates to maintain their market shares although their liquidity was not tight (see Figure 30). During the first half of 2005, fund raising activities in the bond market remained strong, while those in the stock exchanges have moderated. The financial sector, including banks and finance companies, have been quite active in mobilizing capital from the bond market since the third quarter of 2004. On the other hand, public offering and private placement of shares by the financial sector in the stock market have been limited during the period. In the non-financial sector, firms in the property and energy and utility sectors have been quite active in mobilizing funds from both the debt and equity markets since 2004. Firms in the transportation and construction material sectors have been more active in raising funds from the bond than the equity market.
The Cabinet acknowledged in October 2005 the MOF’s proposal on a debt relief program for small individual debtors. Under the program, financial institutions will give 50 percent haircut on the principals and 100 percent haircut on accumulated overdue interests to eligible debtors participating in the program subject to their ability to meet the new payment obligations. Debtors can choose to pay the remaining 50 percent amount all at once by June 2006 or apply for loans from the Government Saving Bank (GSB) to pay back financial institutions and pay the installments to GSB by June 2009. Individual debtors who are eligible for the program should have debt outstanding with financial institutions which are classified as non-performing loans as of June 2005. In addition, to be eligible, the debt outstanding of each borrower should not exceed Bt200,000 per each financial institution and the case should already be filed in court for legal actions. 16 banks, 3 finance companies, and 6 AMCs, agreeing to participate in the program, already signed the Memorandum of Understandings (MOUs) with the MOF. The program does not appear to have a significant impact on financial institutions since the total debt outstanding of eligible debtors are estimated to be less than 2 percent of NPLs of the financial system.
22 Source: BOT, Inflation Report, July 2005.
Figure 31 Issuance of Debentures, 1Q 2001-2Q 2005
0
10
20
30
40
50
60
70
80
1Q 2
001
3Q 2
001
1Q 2
002
3Q 2
002
1Q 2
003
3Q 2
003
1Q 2
004
3Q 2
004
1Q 2
005
Bt B
illio
n
Corporate Financial Institutions
Source: BOT

THAILAND ECONOMIC MONITOR NOVEMBER 2005
37
Corporate Sector Development The performance and health of Thailand’ corporate sector has improved significantly. An average debt-equity ratio of less than one and interest coverage ratio of nearly ten for all listed companies implies a significant turnaround, not only relative to 1998 but also to 2002. Also, all SET groups have debt to equity ratio of around one, even if interest coverage ratios go from a low of 8 for services and agriculture and food groups, to a high of 18 for the electrical group. This is comparable to the region’s better performers. The strong recovery in domestic and export demand has made this possible, by raising average net profit margins to 13 percent and return on assets to 12 percent; The manufacturing group had the highest returns while agriculture and food group, the lowest. There was little change in ownership, and more investigation is needed to ascertain whether there was significant operational restructuring in this process. Debt to equity (D/E) ratio of listed firms has declined. The D/E ratio for the market declined from almost 1.5 times in 2002 to less than 1 in 2004. The largest decline was in the construction sector in which the D/E ratio declined from 3.2 times in 1998 to 0.9 in 2004 (see Figure 32). As a result of decreased debt and low interest rates in the past few years, the interest coverage ratio (ICR) of listed firms has increased from 4 times in 2002 to 20 times in 2004. The ICR is highest in the electrical appliance and electronics sector, reaching18 times in 2004 (See Figure 33)23.
Figure 32. Debt-to-Equity (D/E) Ratio, 1998-2004 Figure 33. Interest Coverage Ratio, 1998-2004
0.0
0.5
1.0
1.5
2.0
2.5
3.0
3.5
SET Ag&Food
Elec. Manuf. Const. Serv.
Tim
es
1998 2000 2002 2004
Source: Thaichareon, Yunyong, and Praphan Kietkomol (2001) and Chaisantikulawat, Thanapat (forthcoming) Note: D/E ratio = Total Liabilities/Total Shareholders’
Equity
02468
101214161820
SET Ag&Food
Elec. Manuf. Const. Serv.
Tim
es1998 2000 2002 2004
Source: Thaichareon, Yunyong, and Praphan Kietkomol (2001) and Chaisantikulawat, Thanapat (forthcoming). Note: ICR = Earnings Before Interest and Taxes /Interest
Expense Profitability and liquidity of the corporate sector has been improving. Overall stock market profitability and liquidity have increased from 2002 to 2004 has contributed to the fall in leverage. The returns on asset (ROA) of listed firms were over 10 percent in 2004, a 3 percentage-points increase from that in 2002 (see Figure 34). The overall net profit margin (NPM) of the market also increased from 2002 to 2004 (see Figure 35). The manufacturing sector had the highest ROA and NPM in 2004, a significant increase from its levels in 2002, which is in line with the rapid rise in export prices and domestic demand in 2003 and 2004. With the exception of the agriculture and food sector, returns on assets in all other sectors24 have increased significantly from their 1998 levels. Liquidity, proxied by the quick ratio (QR), also showed signed of improvement with the rise in liquidity in the manufacturing, construction, and the service sectors since 1998. 23 1998 and 2000 data are from Thaichareon, Yunyong, and Praphan Kietkomol (2001) “Corporate Balance Sheet Adjustment and Restructuring in Thailand,” Symposium Paper, Bank of Thailand Symposium 2002. 2002 and 2004 data are from Chaisantikulawat, Thanapat, “Thailand Corporate Performance” (forthcoming). 24 Non-financial firms in the Stock Exchange of Thailand are grouped into the following sectors: Agriculture and Food (5.2 percent of total listed firm assets in 2004), Electrical Appliance and Electronics (3.6 percent), Manufacturing (33.3 percent), Construction (26.9 percent), and Services (31 percent).

THAILAND ECONOMIC MONITOR NOVEMBER 2005
38
Figure 34. Returns on Assets (ROA) of Listed Firms,
1998-2004 Figure 35. Net Profit Margin of Listed Firms,
1998-2004
-5
0
5
10
15
20
SET Ag&Food
Elec. Manuf. Const. Serv.
Perc
ent
1998 2000 2002 2004
Source: Thaichareon, Yunyong, and Praphan Kietkomol (2001) and Chaisantikulawat, Thanapat (forthcoming). Note: ROA = Net Income/Average Total Assets. Assets are average assets of the current calendar year and the previous year
-5
0
5
10
15
20
SET Ag&Food
Elec. Manuf. Const. Serv.
Perc
ent
1998 2000 2002 2004
Source: Thaichareon, Yunyong, and Praphan Kietkomol (2001) and Chaisantikulawat, Thanapat (forthcoming). Note: NPM = Net Income/Total Revenues
This year, progress in corporate debt restructuring slowed down. As of March 2005, a cumulative total Bt3.01 trillion of NPLs were restructured by financial institutions (see Figure 36). Progress has slowed down substantially given a cumulative total of Bt3.0 trillion of NPLs were restructured at the end of 2004, Bt2.9 trillion at the end of 2003, Bt2.8 trillion at the end of December 2002, and Bt2.4 trillion at the end of December 200125. The slowdown in the pace of restructuring continues to be attributed to (1) the lack of a voluntary debt restructuring framework since the closure of the CDRAC voluntary debt workout framework in 200326; (2) the sizeable volume of new NPLs in state banks and re-entry NPLs are not being resolved expeditiously; and (3) TAMC only afforded NPLs from state owned banks and AMCs, while a sizeable proportion of NPLs in the private banks are left to bilateral negotiations and court-supervised workouts.
Figure 36. Completed Restructuring and NPLs, Q1 2000-Q1 2005
0
50
100
150
200
250
1Q 0
0
3Q 0
0
1Q 0
1
3Q 0
1
1Q 0
2
3Q 0
2
1Q 0
3
3Q 0
3
1Q 0
4
3Q 0
4
1Q 0
5
Bt. B
illio
n
0
5
10
15
20
25
30
35
40
Perc
ent
Completed restructuring (LHS) NPLs (RHS) Source: BOT and WB analysis Remark: Increase in headline NPLs as of December 2002 was due to a change in definition.
25 Sources: Bank of Thailand and WB analysis. After December 2003, the BOT’s ceased the public report on the cumulative debt restructuring statistics. The completed debt restructuring statistics in the subsequent years are estimates derived from WB analysis of the volume of official NPLs as reported by the BOT. 26 In five years of operations from 1999-2003, the CDRAC process completed 49 percent of its US$ 67 billion (Bt2.9 trillion) target cases by credit value, a significant contribution to the cumulative completed debt restructuring.
THAILAND ECONOMIC MONITOR NOVEMBER 2005
39
The BOT’s initiative on voluntary out-of-court mediation framework has a small positive impact on removing NPL overhang. At the closure of the CDRAC process in 2003, the BOT introduced a voluntary mediation framework led by the CDRAC for private banks and AMCs to accelerate debt restructuring for debtors in different stages of resolution, which would help lessen the backlog of NPL cases in the Civil Courts. There are two groups of target debtors under this framework: (1) cases that are in the court process; and (2) cases that are in the legal execution process after court judgments are rendered.27 The BOT had selected a target group of 136,728 cases with the value of Bt 426,843 million, of which three-fifths are cases in the legal execution. In 20 months of operations through June 2005, progress remains moderate. Creditors have selected only 8.9 percent of the total target debtors by credit value, and only roughly half of the selected debtors have participated in the program. The completion rate is 1.5 percent of the total target debtors by value, an insignificant improvement from 0.18 percent completion rate in July 2003, 0.64 percent in December 2003, and 1.4 percent in December 2004. The court-supervised mediation, an alternative to trial in resolving NPLs, continues to be in demand by small-medium-sized and consumer loans. The formal out-of-court mediation, administered by the Mediation Center for Financial Disputes (MCFD), continues to be in demand by creditors and debtors as an alternative to trial. However, requests for mediation are mostly for small-medium-sized and consumer loans, while the larger and more complex NPL cases are not actively utilizing the process. In 2003, a total of 1,983 cases requested out-of-court mediation as compared to 1,476 cases in year 2002. At the end of 2004, 2,372 cases were requested while 1,844 cases were successfully mediated, and court filings withdrawn. Corporatization of additional state-owned enterprises (SOEs) has taken place in 2005. The Telephone Organization of Thailand (TOT) Corporation, CAT Telecom, and Electricity Generating Authority of Thailand (EGAT) were corporatized this year. EGAT is currently awaiting its initial public offering (IPO) in the Stock Exchange of Thailand ,which should take place before the end of this year. So far, seven SOES have been corporatized.
2.8 Improving Competitiveness Improvement in the investment climate is key to reducing firms’ costs and to increasing their investment and productivity, hence, competitiveness of the Thai economy. As firms in Thailand face significantly higher oil prices and intensifying competition from other countries, strengthening the investment climate is an urgent agenda for firms in Thailand to remain competitive. Thailand’s growth in the past 3 decades has relied to a large extent on capital accumulation as well as increased employment as redundant labor from the agricultural sector moves to the industry and services sectors. The reallocation of labor from agriculture to the more productive industry and services sectors was a major contributor to the growth in Total Factor Productivity (TFP) from 1977-1996. However, as redundant labor in the agriculture sector declines, rapid employment growth will unlikely be the major source of growth in the future. The contribution of capital accumulation to Thailand’s real output growth post-crisis has also been low (see Table 17) as investment’s share in GDP has remained low. As capacity utilization of the manufacturing sector is rising closer to the pre-crisis level, significant increase in investments and/or improvements in firm’s productivity are critical to sustain growth in the medium-term. A favorable investment climate could help increase investments and productivity that Thailand needs.
27 In this process, creditors and debtors agree to enter the CDRAC-led mediation process to further negotiate a debt settlement under a required guideline and timeframe. Failure to reach an agreement within the timeframe would result in continued legal process.
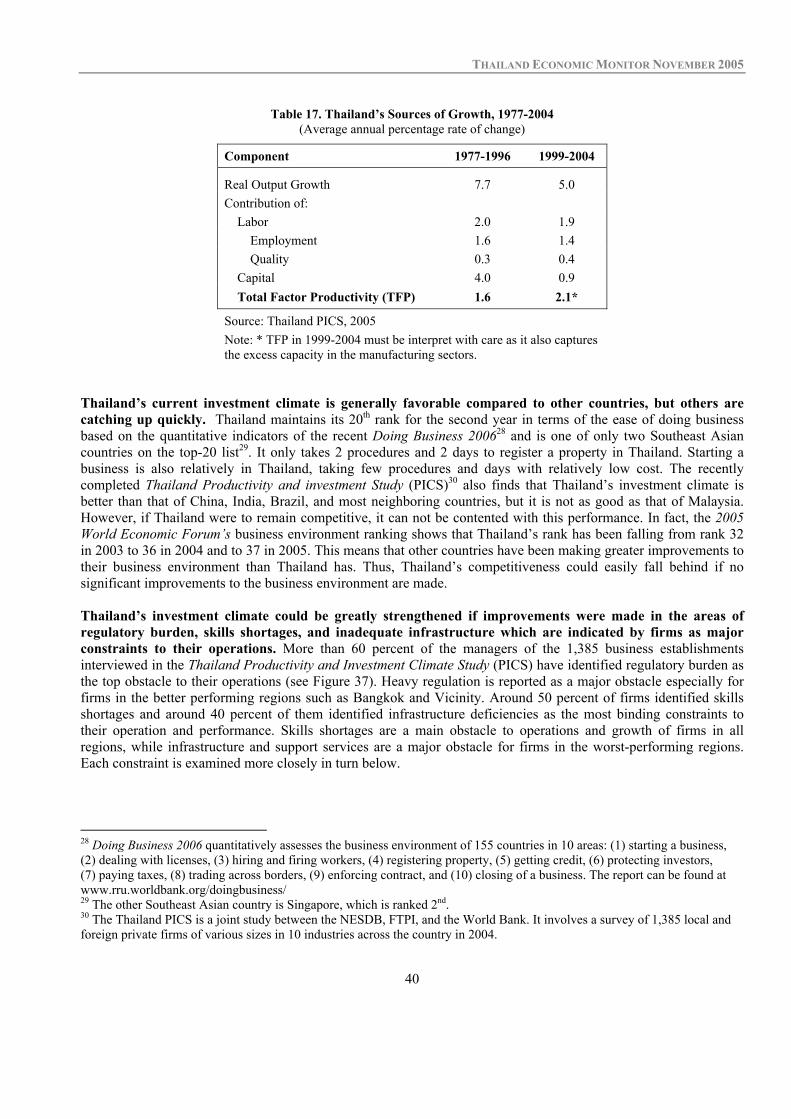
THAILAND ECONOMIC MONITOR NOVEMBER 2005
40
Table 17. Thailand’s Sources of Growth, 1977-2004
(Average annual percentage rate of change)
Component 1977-1996 1999-2004
Real Output Growth 7.7 5.0 Contribution of:
Labor 2.0 1.9 Employment 1.6 1.4 Quality 0.3 0.4
Capital 4.0 0.9 Total Factor Productivity (TFP) 1.6 2.1*
Source: Thailand PICS, 2005 Note: * TFP in 1999-2004 must be interpret with care as it also captures the excess capacity in the manufacturing sectors.
Thailand’s current investment climate is generally favorable compared to other countries, but others are catching up quickly. Thailand maintains its 20th rank for the second year in terms of the ease of doing business based on the quantitative indicators of the recent Doing Business 200628 and is one of only two Southeast Asian countries on the top-20 list29. It only takes 2 procedures and 2 days to register a property in Thailand. Starting a business is also relatively in Thailand, taking few procedures and days with relatively low cost. The recently completed Thailand Productivity and investment Study (PICS)30 also finds that Thailand’s investment climate is better than that of China, India, Brazil, and most neighboring countries, but it is not as good as that of Malaysia. However, if Thailand were to remain competitive, it can not be contented with this performance. In fact, the 2005 World Economic Forum’s business environment ranking shows that Thailand’s rank has been falling from rank 32 in 2003 to 36 in 2004 and to 37 in 2005. This means that other countries have been making greater improvements to their business environment than Thailand has. Thus, Thailand’s competitiveness could easily fall behind if no significant improvements to the business environment are made. Thailand’s investment climate could be greatly strengthened if improvements were made in the areas of regulatory burden, skills shortages, and inadequate infrastructure which are indicated by firms as major constraints to their operations. More than 60 percent of the managers of the 1,385 business establishments interviewed in the Thailand Productivity and Investment Climate Study (PICS) have identified regulatory burden as the top obstacle to their operations (see Figure 37). Heavy regulation is reported as a major obstacle especially for firms in the better performing regions such as Bangkok and Vicinity. Around 50 percent of firms identified skills shortages and around 40 percent of them identified infrastructure deficiencies as the most binding constraints to their operation and performance. Skills shortages are a main obstacle to operations and growth of firms in all regions, while infrastructure and support services are a major obstacle for firms in the worst-performing regions. Each constraint is examined more closely in turn below.
28 Doing Business 2006 quantitatively assesses the business environment of 155 countries in 10 areas: (1) starting a business, (2) dealing with licenses, (3) hiring and firing workers, (4) registering property, (5) getting credit, (6) protecting investors, (7) paying taxes, (8) trading across borders, (9) enforcing contract, and (10) closing of a business. The report can be found at www.rru.worldbank.org/doingbusiness/ 29 The other Southeast Asian country is Singapore, which is ranked 2nd. 30 The Thailand PICS is a joint study between the NESDB, FTPI, and the World Bank. It involves a survey of 1,385 local and foreign private firms of various sizes in 10 industries across the country in 2004.
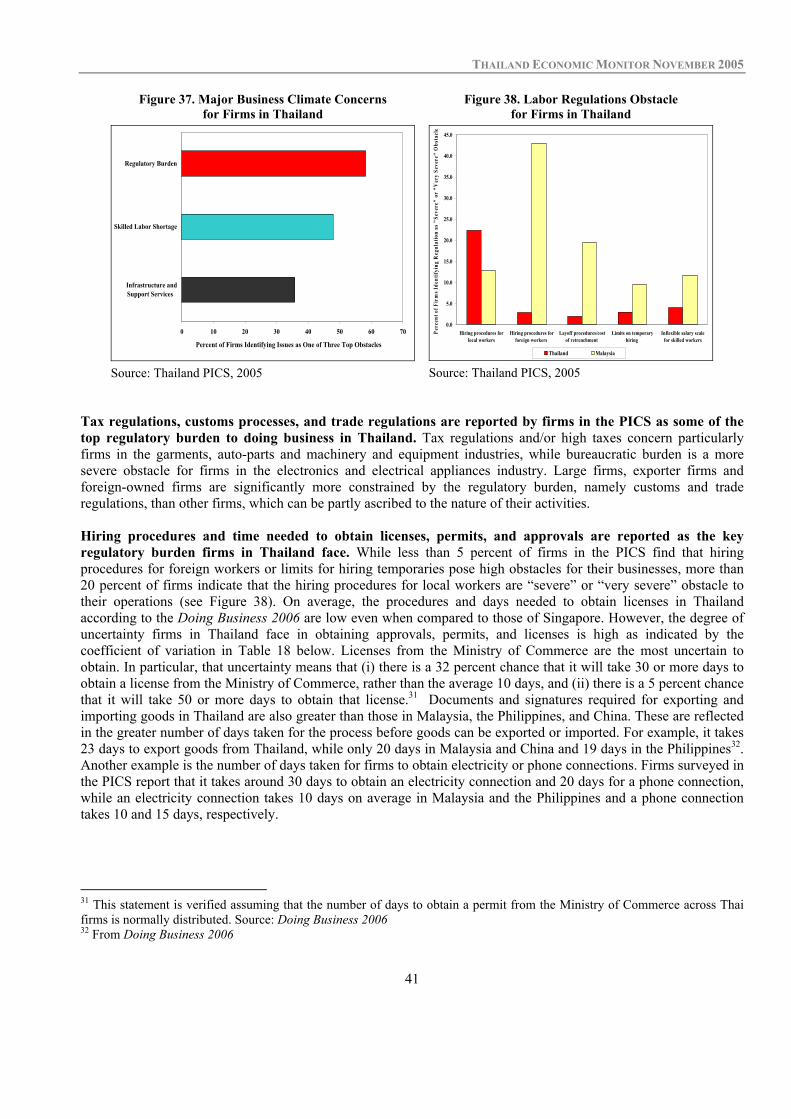
THAILAND ECONOMIC MONITOR NOVEMBER 2005
41
Figure 37. Major Business Climate Concerns for Firms in Thailand
Figure 38. Labor Regulations Obstacle for Firms in Thailand
0 10 20 30 40 50 60 70
Infrastructure andSupport Services
Skilled Labor Shortage
Regulatory Burden
Percent of Firms Identifying Issues as One of Three Top Obstacles
Source: Thailand PICS, 2005
0.0
5.0
10.0
15.0
20.0
25.0
30.0
35.0
40.0
45.0
Hiring procedures forlocal workers
Hiring procedures forforeign workers
Layoff procedures/costof retrenchment
Limits on temporaryhiring
Inflexible salary scalefor skilled workers
Perc
ent o
f Fir
ms I
dent
ifyin
g R
egul
atio
n as
"Se
vere
" or
"V
ery
Seve
re"
Obs
tacl
e
Thailand Malaysia Source: Thailand PICS, 2005
Tax regulations, customs processes, and trade regulations are reported by firms in the PICS as some of the top regulatory burden to doing business in Thailand. Tax regulations and/or high taxes concern particularly firms in the garments, auto-parts and machinery and equipment industries, while bureaucratic burden is a more severe obstacle for firms in the electronics and electrical appliances industry. Large firms, exporter firms and foreign-owned firms are significantly more constrained by the regulatory burden, namely customs and trade regulations, than other firms, which can be partly ascribed to the nature of their activities. Hiring procedures and time needed to obtain licenses, permits, and approvals are reported as the key regulatory burden firms in Thailand face. While less than 5 percent of firms in the PICS find that hiring procedures for foreign workers or limits for hiring temporaries pose high obstacles for their businesses, more than 20 percent of firms indicate that the hiring procedures for local workers are “severe” or “very severe” obstacle to their operations (see Figure 38). On average, the procedures and days needed to obtain licenses in Thailand according to the Doing Business 2006 are low even when compared to those of Singapore. However, the degree of uncertainty firms in Thailand face in obtaining approvals, permits, and licenses is high as indicated by the coefficient of variation in Table 18 below. Licenses from the Ministry of Commerce are the most uncertain to obtain. In particular, that uncertainty means that (i) there is a 32 percent chance that it will take 30 or more days to obtain a license from the Ministry of Commerce, rather than the average 10 days, and (ii) there is a 5 percent chance that it will take 50 or more days to obtain that license.31 Documents and signatures required for exporting and importing goods in Thailand are also greater than those in Malaysia, the Philippines, and China. These are reflected in the greater number of days taken for the process before goods can be exported or imported. For example, it takes 23 days to export goods from Thailand, while only 20 days in Malaysia and China and 19 days in the Philippines32. Another example is the number of days taken for firms to obtain electricity or phone connections. Firms surveyed in the PICS report that it takes around 30 days to obtain an electricity connection and 20 days for a phone connection, while an electricity connection takes 10 days on average in Malaysia and the Philippines and a phone connection takes 10 and 15 days, respectively.
31 This statement is verified assuming that the number of days to obtain a permit from the Ministry of Commerce across Thai firms is normally distributed. Source: Doing Business 2006 32 From Doing Business 2006

THAILAND ECONOMIC MONITOR NOVEMBER 2005
42
Table 18. Number of Days to Obtain Different Licenses/Permits/Approvals/ Certificates
Avg. St. Dev. Coeff. Variat. Median N. Obs.Ministry of Commerce 10 20 1.9 2 964Department of Industrial Works 17 22 1.3 7 926Immigration Department 10 14 1.4 3 80Land Office 13 22 1.7 3 131Local Government 10 15 1.6 2 419 Source: Thailand PICS, 2005
Thailand lags behind its competitors in contract enforcement and closing of a business. Thailand’s 390 days to needed for contract enforcement33 places it well into the third quartile of all countries. In particular, that figure is substantially longer than 75 days for Korea, 241 days for China and 300 days for Malaysia. Firms in the PICS report that court cases to resolve a dispute over payments take on average 420 days but can take up to 1,680 days. To close a business in Thailand takes up to 3 years on average and costs 36 percent of the total estate value. This is far greater than in Malaysia (2 years and 15 percent) or in China (2 years and 22 percent).
Figure 39.Time to Fill Vacancies for Professionals and Skilled Production Workers in Past 2 Years
Time to Fill Vacancy for Professional in Last 2 Years (weeks)
0 2 4 6 8 10
Indonesia
Bangladesh
India
Philipines
Malaysia
Thailand
Brazil
Source: Thailand PICS, 2005
Time to Fill Vacancy for Skilled Production Worker in Last 2 Years
0 1 2 3 4 5 6 7
Bangladesh
Indonesia
Philipines
India
Brazil
Malaysia
Thailand
Source: Thailand PICS, 2005
Skills shortages and skills mismatch in Thai manufacturing sector are pervasive across firms in Thailand. Skills shortages are pervasive across firm size and are felt equally by exporters and non-exporters, and by domestic as well as foreign-owned firms surveyed in the PICS. The shortage of skilled labor has led firms to pay large wage premiums to tertiary education graduates, and to workers who receive training in technical skills, reflecting extreme levels of excess demand for the highest skilled labor in Thailand (see Figure 40). Also, as shown in Figure 39 below, it takes longer (more than 6 weeks) in Thailand than in any other benchmark country to fill a vacancy of a skilled production worker or a professional. When asked about the reasons for these vacancies, over 80 percent of the managers cited the fact that applicants lack appropriate basic and technical skills. The skills shortages, particularly in English and IT, are leading managers to adopt sub-optimal hiring policies, which creates a skills mismatch in firms. Analysis of employee data in the PICS suggests that employers are hiring less-than-qualified workers. More than 30 percent of workers who have completed only lower secondary education are doing a job that they believe requires at least an upper secondary level education. As a consequence, in relation to what employers consider as the desirable skills, Thai managers consistently rank their workers as having poor skills. Nearly 60 percent of managers rate the English skills of their local professional workforce as poor. Over 40 percent rate IT skills as poor. Ratings are worse for Thai skilled production workers, with over 90 33 The number of days required to resolve a typical contract dispute such as collecting a bad check.

THAILAND ECONOMIC MONITOR NOVEMBER 2005
43
and 80 percent of managers rating their English and IT skills as poor, respectively. In Malaysia, only around 12 and 20 percent of managers rate the English and IT skills of their local professional workforce as poor34.
Figure 40. Thailand’s Wage Premiums (Total Returns Relative to Workers with Less than
Secondary Education Completion)
Figure 41. Sales Gain from Reduction in Skills Shortages by Industry
05
1 01 52 02 53 03 54 04 55 0
High sch o o l/P o r W o r Ch o r
P or W o r So r Co llege Degree
perc
ent
Source: Thailand PICS, 2005 Note: Por Wor Chor and Por Wor Sor are vocational-
school degrees
Machinery/Equipment
Wood Products/Furnit.
Rubber/Plastics
Electronics/Elec. Appliances
Auto-parts
Clothing
Textiles Food Processing
4
5
5
6
6
7
7
8
8
9
0 5 10 15 20 25 30 35 40 45 50
% Sales Gain from Reduction in Skill Shortages
Num
ber
of D
ays T
aken
to F
ill L
ates
t Vac
ancy
fo
r a
Prof
essio
nal
Source: Thailand PICS, 2005
The cost of this wrong skills mix is significant in terms of lost of sales. The wrong skills mix is costing firms 15 percent of their sales on average. The industries where an increase in firms’ skilled employment would have the greatest benefits in terms of increased sales are also those which have more binding skilled labor shortage constraints, as suggested by longest time needed to fill a vacancy for a professional (see Figure 41).
Figure 42. Technology Capacity Index Table 19. Constraints to Introducing or Expanding IT Use that Firms Considered
“Important” or “Very Important”
0.1 0.2 0.3 0.4 0.5 0.6 0.7 0.8 0.9
Technological Capabilities Index
Den
sity
Food Processing Textiles ClothingAuto Parts Electronics & Electrical Appliances Rubber & PlasticsWood & Wood Furniture Machinery & Equipment
Clothing
Textiles
Food Processing
Auto Parts
Electronics & Electrical Appliances
Wood & Wood FurnitureRubber &
Plastics
Machinery & Equipment
Source: Thailand PICS (2005)
Constraints Small Medium Large
Lack of knowledge and trained IT personnel
42% 35% 33%
Lack of experienced consultants to provide or design IT-based solution systems
39% 37% 32%
High cost of IT equipment and maintenance
20% 18% 18%
Low returns to investments in IT
15% 12% 11%
Source: Thailand PICS (2005) Relatively low technological capacity in Thailand is highly correlated with the lack of qualified IT personnel. Firm’s technology capacity index (TCI)35 shows that there is much room for improvement in the technological capabilities of Thai manufacturing establishments. As seen in Figure 42, all but three industries (Electronics &
34 See Malaysia Productivity and Investment Climate Study, 2005. 35 TCI includes 3 broad categories of firm-level technological capabilities – investment, production, and linkages. Methodology for constructing the TCI can be found in Chapter 4 of the Thailand Productivity and Investment Climate Study (2005).
Technology Capacity Index (TCI)
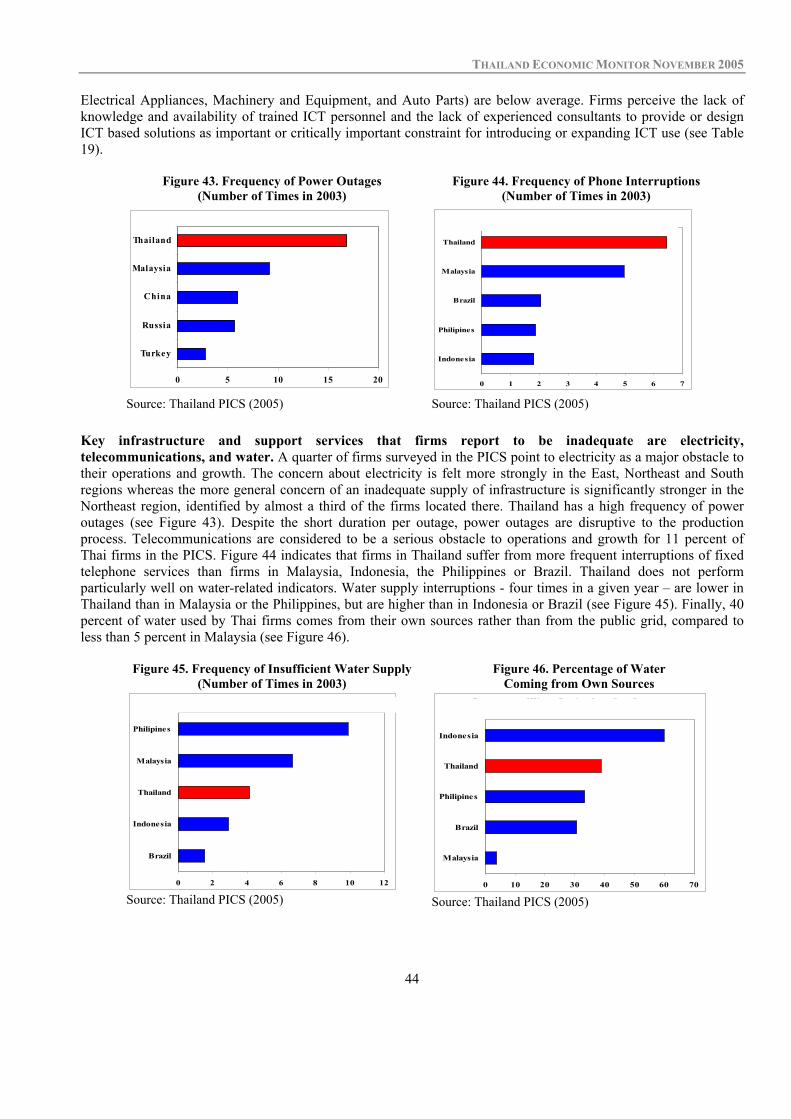
THAILAND ECONOMIC MONITOR NOVEMBER 2005
44
Electrical Appliances, Machinery and Equipment, and Auto Parts) are below average. Firms perceive the lack of knowledge and availability of trained ICT personnel and the lack of experienced consultants to provide or design ICT based solutions as important or critically important constraint for introducing or expanding ICT use (see Table 19).
Figure 43. Frequency of Power Outages (Number of Times in 2003)
Figure 44. Frequency of Phone Interruptions (Number of Times in 2003)
0 5 10 15 20
Turkey
Russia
China
Malaysia
Thailand
Source: Thailand PICS (2005)
Frequency of Phone Interruptions Last Year
0 1 2 3 4 5 6 7
Indonesia
Philipines
Brazil
Malaysia
Thailand
Source: Thailand PICS (2005)
Key infrastructure and support services that firms report to be inadequate are electricity, telecommunications, and water. A quarter of firms surveyed in the PICS point to electricity as a major obstacle to their operations and growth. The concern about electricity is felt more strongly in the East, Northeast and South regions whereas the more general concern of an inadequate supply of infrastructure is significantly stronger in the Northeast region, identified by almost a third of the firms located there. Thailand has a high frequency of power outages (see Figure 43). Despite the short duration per outage, power outages are disruptive to the production process. Telecommunications are considered to be a serious obstacle to operations and growth for 11 percent of Thai firms in the PICS. Figure 44 indicates that firms in Thailand suffer from more frequent interruptions of fixed telephone services than firms in Malaysia, Indonesia, the Philippines or Brazil. Thailand does not perform particularly well on water-related indicators. Water supply interruptions - four times in a given year – are lower in Thailand than in Malaysia or the Philippines, but are higher than in Indonesia or Brazil (see Figure 45). Finally, 40 percent of water used by Thai firms comes from their own sources rather than from the public grid, compared to less than 5 percent in Malaysia (see Figure 46).
Figure 45. Frequency of Insufficient Water Supply (Number of Times in 2003)
Figure 46. Percentage of Water Coming from Own Sources
Frequency of Insufficient Water Supply Last Year
0 2 4 6 8 10 12
Brazil
Indonesia
Thailand
Malaysia
Philipines
Source: Thailand PICS (2005)
Percentage of Water Coming from Own Sources
0 10 20 30 40 50 60 70
Malaysia
Brazil
Philipines
Thailand
Indonesia
Source: Thailand PICS (2005)

THAILAND ECONOMIC MONITOR NOVEMBER 2005
45
SECTION 3
IMPLEMENTATION
OF STRUCTURAL REFORMS The Government remains focused on improving Thailand’s competitiveness. The Government is preparing the 10th Five Year National Development Plan (FY2007-2011), which is now called the National Development Strategy. The Strategy includes 5 pillars: (1) Coping with the changing development context, (2) Economic restructuring (3) Enhancing value-added through value & knowledge creation, (4) Pursuing social development, and (5) Enhancing global and regional linkages. The Office of the National Economic and Social Development Board is responsible for drafting the Strategy. The first draft of the National Strategy is planned for February 2006 and the final draft for September and issuance in October 2006. The Government’s policy measures and incentives to improve competitiveness continue to be implemented. The RTG continues to harness firm competitiveness through a combination of policy measures and fiscal incentives. Notable fiscal measures to support businesses to increase efficiency and competitiveness include import tariff reform, development of business clusters36, strategy to improve national logistics system and supply chain network, fiscal incentives to develop human capital in terms of vocational skilled workforce, and provision of tax incentives for R&D expenditures to promote innovations (see Box 4) and for long-term investment in the Stock Exchange of Thailand37. In addition, the RTG’s pro-business policy agenda planned for the next four years include overhauling the corporate tax structure and investment incentives, promoting innovations and technology transfers, forging ahead with privatization, continuing to negotiate and finalize FTAs with key trade partners, and focusing on regional cooperation such as Asia bond market and GMS business ventures. Public sector reforms have also made progress to make the government more efficient and responsive to the needs of the private sector. Some of these initiatives receive immediate attention far more than others. However, structural reform to enable business environment and removing legal and regulatory impediments, which would take a considerable amount of time and political commitment to implement, are not be tackled directly by the Government. This issue of the Monitor examines in detail the progress in the implementation of the financial and corporate sector reforms and restructuring, public sector governance reform, and trade reform. In the first two areas, there is on-going work carried out with Government agencies under the relevant Country Development Partnership (CDP) programs. In the area of trade reform – which is critical for competitiveness improvement – but where there is no CDP, work with relevant agencies was carried out to ascertain the state of the progress. Below we look at the three areas.
36 The strategy focuses on 6 industrial clusters: ceramics, digital content, fashion and accessories, textile, auto parts. The cluster strategy is currently being formulated by NESDB. 37 Individuals and institutional investors who invest in the SET-registered equity fund for over 5 years will be entitled to income tax exemption up to Bt300,000 (US$7,500) per year.

THAILAND ECONOMIC MONITOR NOVEMBER 2005
46
Box 4. Government’s Policy Measures for Private Sector
Provision and Use of More Skills Development and Educational Services
In recent years, increasing the national and firm-level competitiveness has been a main policy focus for the Government of Thailand. Fiscal measures in the form of tax incentives were introduced and aimed to promote the transfer of knowledge and technology for R&D activities, increase workers’ technical skills and education in the manufacturing sectors, and support innovations. Both Thai and foreign firms that are registered in Thailand are eligible for the tax incentives, provided they have properly petitioned and been granted approval by the Revenue Department.38 Key incentives and the year to which they were announced are:
1. Eligible academic, vocational, technical, and training institutes that provide skills enhancement, training, and
educational development services are exempted from paying business income tax (2002); 2. Actual expenses incurred for employees’ education, skills development, and training (domestic, overseas, or in-
house) are eligible for 50 percent tax deduction (2002); 3. Actual expenses incurred by contracting individuals, firms or institutes to undertake a qualified basic or applied
research and development (R&D) within Thailand are eligible for double tax deduction (200 percent), provided the researchers meet the Revenue Department’s requirements (2001);
4. Special depreciation allowance. Capital expenditures incurred for: 4.1 Machinery and equipment used in R&D and testing facilities as approved by the Revenue Department can be
depreciated 40 percent on the acquisition date. The remaining amount to be depreciated on straight line method for the next four years (1998)
4.2 Computer hardware and peripherals used in R&D and testing facilities can be depreciated 30 percent on the acquisition date. The remaining amount to be depreciated on straight line within 3 accounting periods instead of 5 accounting periods (2002);
5. Cash donations to support academic and training institutes that are eligible for income tax deduction up to 2 percent of the annual net income (1994).
3.1 Financial and Corporate Sector Reforms and Restructuring Financial Sector Reforms The BOT has tightened the regulation on consumer lending. To curb excessive consumer indebtedness, the BOT issued another regulation effective in July 2005 on consumer lending. Key elements of the regulation include (i) setting a definition of consumer lending subjected to the supervision by the BOT, (ii) strengthening the qualification of non-bank financial institutions, which can provide consumer lending, (iii) reducing the ratio of loan amount to five times of average monthly salary of the borrower (or average cash outstanding during the past 6 months in the borrower’s deposit account) and (iv) putting a ceiling on total effective costs (including 15 percent interest rate, penalty fee, service fee, and others) at 28 percent per annum. Lenders are required to disclose the effective rates of their lending. This regulation aims to curb excessive growth in debts of lower income households especially from non-bank financial institutions and to provide consumer protection. However, this could limit access to formal financial services by the lower income group, which could instead turn to the informal source.
38 To be eligible for the incentives, a business must meet two requirements: (1) a business must be legally registered as a juristic person with the Ministry of Commerce in Thailand; and (2) a business must file a petition with the Revenue Department illustrating that its core businesses are indeed training and educational development services, and eligibility must be granted by the Revenue Department.
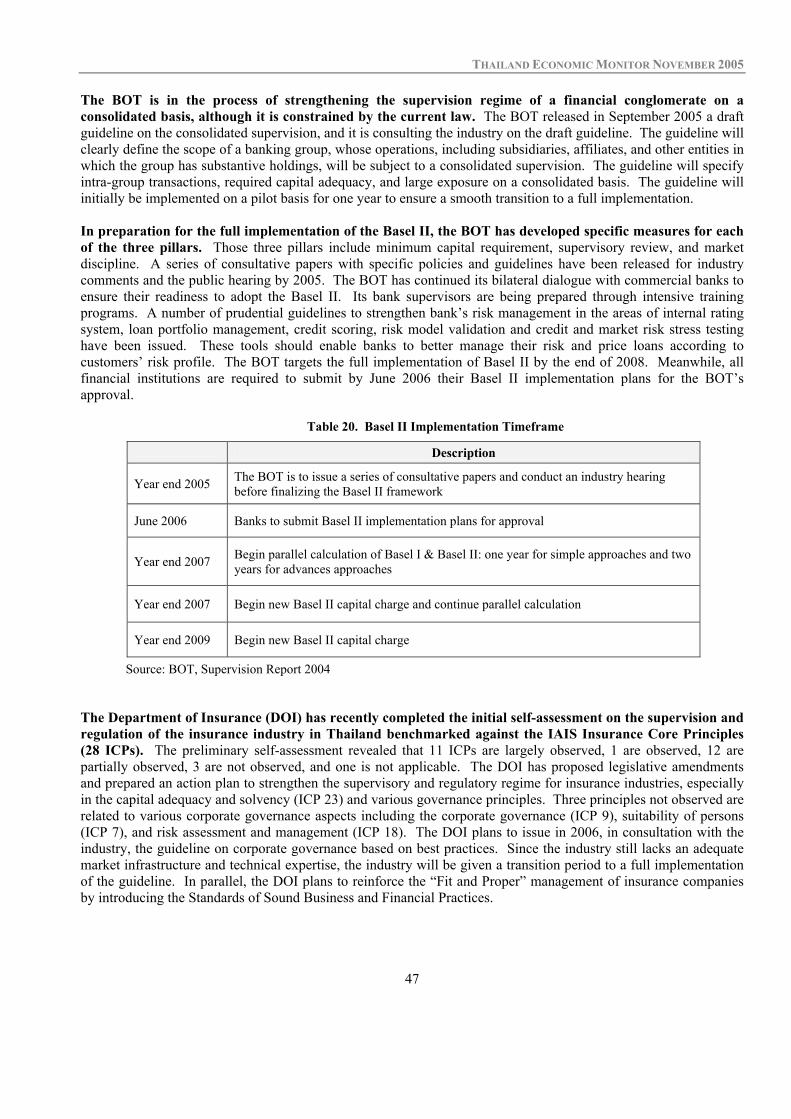
THAILAND ECONOMIC MONITOR NOVEMBER 2005
47
The BOT is in the process of strengthening the supervision regime of a financial conglomerate on a consolidated basis, although it is constrained by the current law. The BOT released in September 2005 a draft guideline on the consolidated supervision, and it is consulting the industry on the draft guideline. The guideline will clearly define the scope of a banking group, whose operations, including subsidiaries, affiliates, and other entities in which the group has substantive holdings, will be subject to a consolidated supervision. The guideline will specify intra-group transactions, required capital adequacy, and large exposure on a consolidated basis. The guideline will initially be implemented on a pilot basis for one year to ensure a smooth transition to a full implementation. In preparation for the full implementation of the Basel II, the BOT has developed specific measures for each of the three pillars. Those three pillars include minimum capital requirement, supervisory review, and market discipline. A series of consultative papers with specific policies and guidelines have been released for industry comments and the public hearing by 2005. The BOT has continued its bilateral dialogue with commercial banks to ensure their readiness to adopt the Basel II. Its bank supervisors are being prepared through intensive training programs. A number of prudential guidelines to strengthen bank’s risk management in the areas of internal rating system, loan portfolio management, credit scoring, risk model validation and credit and market risk stress testing have been issued. These tools should enable banks to better manage their risk and price loans according to customers’ risk profile. The BOT targets the full implementation of Basel II by the end of 2008. Meanwhile, all financial institutions are required to submit by June 2006 their Basel II implementation plans for the BOT’s approval.
Table 20. Basel II Implementation Timeframe
Description
Year end 2005 The BOT is to issue a series of consultative papers and conduct an industry hearing before finalizing the Basel II framework
June 2006 Banks to submit Basel II implementation plans for approval
Year end 2007 Begin parallel calculation of Basel I & Basel II: one year for simple approaches and two years for advances approaches
Year end 2007 Begin new Basel II capital charge and continue parallel calculation
Year end 2009 Begin new Basel II capital charge
Source: BOT, Supervision Report 2004 The Department of Insurance (DOI) has recently completed the initial self-assessment on the supervision and regulation of the insurance industry in Thailand benchmarked against the IAIS Insurance Core Principles (28 ICPs). The preliminary self-assessment revealed that 11 ICPs are largely observed, 1 are observed, 12 are partially observed, 3 are not observed, and one is not applicable. The DOI has proposed legislative amendments and prepared an action plan to strengthen the supervisory and regulatory regime for insurance industries, especially in the capital adequacy and solvency (ICP 23) and various governance principles. Three principles not observed are related to various corporate governance aspects including the corporate governance (ICP 9), suitability of persons (ICP 7), and risk assessment and management (ICP 18). The DOI plans to issue in 2006, in consultation with the industry, the guideline on corporate governance based on best practices. Since the industry still lacks an adequate market infrastructure and technical expertise, the industry will be given a transition period to a full implementation of the guideline. In parallel, the DOI plans to reinforce the “Fit and Proper” management of insurance companies by introducing the Standards of Sound Business and Financial Practices.
THAILAND ECONOMIC MONITOR NOVEMBER 2005
48
The Anti-Money Laundering Office (AMLO) is in the process of requiring non-financial institutions to report suspicious transaction to restrain money laundering activities as well as proposing amendments to the Anti-money Laundering Act. On July 2005, the AMLO organized a public hearing for adding a new section to Article 1639. This new article 16/1 states that non-financial businesses namely jewelers/gold shops and car dealers will have to report to AMLO in a prompt manner of suspicious transactions such as a non-regular spending over Bt400,000 and/or paying cash in small bills or the cases in which customers refuse to provide identification. Failure to report can result in a fine of Bt300,000 per account. In addition, the AMLO has proposed amendments to the Anti-money Laundering Act to include more offences and to give the AMLO more authorities for the arrestment and investigation. The offences proposed to be added in the law include offences relating to natural resources, the environment, wildlife, foreign exchange, gambling, weapons of war, labor fraud, bidding collusion, share manipulation and excise tax. The amendment is currently pending approval by the Cabinet. By the end of the year, Thailand Security Depositary Company (TSD), a subsidiary of the Stock Exchange of Thailand (SET), will be responsible for clearing and settling trading of government securities. Currently, trading of government securities is settled by the BOT, while some trading of corporate bonds is settled by the TSD. TSD also clears and settles equities traded on the stock exchanges. The transfer of responsibilities for clearing and settlement of government securities from the BOT to TSD is the Phase I of the Bond Market Committee’s plan to centralize the depository, clearing, and settlement functions for all securities at the TSD. Phase II is to consolidate those of corporate bonds at TSD. Ultimately TSD will assume collateral management functions for securities borrowing and lending transactions. This should lead to a more efficient clearing and settlement system. The trading of government securities at TSD will be settled on a Real Time Gross Settlement (RTGS). Securities will be delivered through the TSD’s system simultaneously with the payment transfer through the BOT’s Bahtnet facility (DVP). In addition, the Committee also decided to consolidate the trading platforms of all securities to be under the SET. This should help eliminate the potential conflict of interest for Thai BDC which has become an Self Regulatory Organization (SRO) for the bond market if it is allowed to compete with other operators. Thailand is negotiation the liberalization of financial services under the Thailand-US Free Trade Agreement (FTA) framework. Under the FTA, the US requests for free market access to investment and trade in financial services especially in the insurance and mutual fund industries and free transfers of capital with the exception of prudential reason to maintain safety, soundness, integrity, and financial responsibility. The Fiscal Policy Office (FPO) is in the process of assessing the impact of the financial services liberalization on domestic financial sector and formulating strategic options. The FPO is of concern that the Thai market is not ready for such liberalization. In its opinion, time is needed to strengthen domestic financial institutions, to put in place some structural and managerial reforms, to analyze the risk and consequences of free transfers of capital, and to enhance supervisory capacity. In addition, the FPO still see the necessity of maintaining state-owned specialized financial institutions as tools to carry out the government policies. Corporate Sector Reforms No progress has been made in the legal reforms to promote corporate restructuring in the past six months. The proposed amendments to the Civil Commercial Code on Legal Execution to expedite the sale of foreclosed properties, to the bankruptcy liquidation framework of the Bankruptcy Act, and to the Secured Transaction Act have not been undertaken. The amendments to the Civil Commercial Code on Legal Execution to expedite the sale of foreclosed properties40 have been awaiting Parliamentary consideration since early 2004. These are not procedural changes to expedite the sale process, but rather fees reductions to attract buyers to the foreclosed properties market. 39 Article 16 under anti-money laundering Act became effective since April 10, 1999. It states that Financial Institutions must report to AMLO any suspicious transactions with possible relations to money laundering. 40 The amendments proposed to (1) reduce the auction fee from 5 percent to 3 percent of the sale value; (2) reduce the foreclosed property discharging fee from 3.5 percent to 2 percent; and (3) reduce the fee for sales not going through the auction process from 3 percent to 2 percent.

THAILAND ECONOMIC MONITOR NOVEMBER 2005
49
The prevailing market consensus is the reduction in fees would minimally accelerate the sale process, and more rigorous amendments to the legal execution procedures are still needed to expedite the sale process. The Cabinet endorsed a three-point amendment to the individual bankruptcy liquidation framework41 of the Bankruptcy Act since ate 2003. Two years later, it is still under review by the Council of State before submission to the Parliament. The amendments only cover individual bankruptcies, while the corporate bankruptcy framework remains the same. The Secured Transaction Act, which since 2003 has been awaiting a sub-cabinet review before submission to the Cabinet and then the Parliament for approval. The Act would greatly enhance the corporate restructuring framework by providing greater flexibility in collateralization of other assets besides the traditional pledging of real estate. The efficacy of the reform in the judicial process to lessen the backlog in the Civil Courts remains an on-going concern due to delays in remedial actions. The courts are required to schedule continuous hearings, and cases must be presided by a set of two judges through judgments. In practice, there is limited number of days available to schedule continuous hearings. The earliest a new civil court case can be scheduled continuously through completion would be between 10-15 months. With the existing volume of more than 72,000 civil cases awaiting court judgments, the possibility of an accelerated NPL resolution is remote. The institutional arrangement to carry out comprehensive legal reform is unclear. In July 2004, the Prime Minister established a new national committee, the National Legal Framework and Policy Committee (NLFPC) to replace the Legal Reform Committee for Development of Thailand (LRC). The NLFPC is chaired by the Prime Minister, most committee members drawn from the LRC, and with virtually the same mandate as the LRC. In practice, it is still unclear as to the objectives, missions and activities of the committee. Since its inception, the NLFPC has convened two meetings to establish several sub-committees, mandated responsible line ministries to review and submit suggestions for legal changes of the laws under their authorities. However, the scope of the review and the specific laws to be reviewed were not identified at the meetings. The recently completed corporate governance Report on Observance of Standards and Codes (ROSC) for Thailand indicates that Thailand’s corporate governance practices are improving, but further reform is required. The ROSC provides a benchmark for the observance of corporate governance practices against the OECD Principles of Corporate Governance.42 The corporate governance ROSC on Thailand concludes that the corporate governance framework and actual practices of listed companies are generally either “largely observing” or “partially observing” the OECD Principles of Corporate Governance.43 There is, however, room for improvement to achieve full observance of OECD principles. The overall average score for observance of 32 OECD principles and sub-principles is 68 out of 100.44 Based on corporate governance ROSCs completed for several Asian countries at various times during the 2001-2005 period, Thailand’s corporate governance framework and practices generally rank higher than those in Indonesia and the Philippines but lower than those in India and Korea.45 41 The amendments proposed to (1) allow retroactive discharge from bankruptcy after three-year period for individuals whose court judgments were rendered after year 1994, or within five years prior to the 1998 bankruptcy amendment. Prior to 1998, bankrupted individuals are subjected to a ten-year bankruptcy period before they can petition for a discharge; (2) extend the bankruptcy period from five to ten years for individuals who are ruled dishonest or fraudulent by the CBC; but the revised law would allow those individuals to petition the court for discharge from bankruptcy after five years; (3) disallow the collection of repayments or assets from family members of bankrupted individuals who are under 18 years old, while the spouse’s assets must be divided 50:50 before collection under the Thai marital law. 42 The ROSC is an assessment of actual practices and analysis of effectiveness of the mechanisms for ensuring compliance with international standards and best practices. 43 The Thailand ROSC was completed in September 2005 and can be found at www.worldbank.or.th 44 The averages are calculated based on the following criteria: 100% for sub-principles that are “Observed”, 75% for “Largely Observed”, 50% for “Partially Observed”, 25% for “Materially Not Observed”, and 0% for “Not Observed”. 45 Philippines corporate governance ROSC (2001), Korea corporate governance ROSC (2002), Indonesia corporate governance ROSC (2004), India corporate governance ROSC (2004).

THAILAND ECONOMIC MONITOR NOVEMBER 2005
50
Table 21. Observance of Corporate Governance Principles under the ROSC
Number of Sub-principles
Principles Observed*
Largely Observed*
Partially Observed*
Materially Not
Observed Not
Observed
I. Corporate Governance Framework - 4 - - - Transparent and efficient markets, consistent with the rule of law and clearly articulate the division of responsibilities among different supervisory, regulatory and enforcement authorities
II. Rights of Shareholders - 5 2 - - The exercise of shareholders’ rights protected and facilitated
III. Equitable Treatment of Shareholders - 2 1 - - Equitable treatment of all shareholders, including minority and foreign shareholders. All shareholders should have the opportunity to obtain effective redress for violation of their rights.
IV. Roles of Stakeholders - 4 2 - - Rights of stakeholders established by law or through mutual agreements and active co-operation between corporations and stakeholders in creating wealth, jobs, and the sustainability of financially sound enterprises
V. Disclosure and Transparency - 5 1 - - Timely and accurate disclosure on all material matters regarding the corporation, including the financial situation, performance, ownership, and governance of the company
VI. Responsibilities of the Board - 2 4 - - Strategic guidance of the company, effective monitoring of management by the board, and the board’s accountability to the company and the shareholders.
Total - 22 10 - -
% of Total Sub-principles - 69 31 - -
Source: Thailand Corporate Governance ROSC, September 2005. * “Observed” means all essential criteria are met without significant deficiencies. “Largely Observed” means only minor short-comings are observed, which do not raise questions about the authorities’ ability and intent to achieve full observance. “Partially Observed” means that while the legal and regulatory framework complies with the principle, practices and enforcement diverge. “Materially Not Observed” means that, despite progress, shortcomings are sufficient to raise doubts about the authorities’ ability to achieve observance. “Not Observed” means no substantive progress toward observance has been made.
While Thailand has made significant progress in improving the corporate governance framework and corporate governance practices since the crisis, the reform agenda remains incomplete. In recent years, significant corporate governance reforms have been introduced and are underway, including reforms in the structure and function of the board of directors of listed companies, the establishment of the Thai Institute of Directors Association and the Department of Special Investigation, the adoption by the SET of 15 Principles of Good Corporate Governance, and draft legislation to reinforce the rights of minority shareholders. In addition, the SEC has improved its monitoring of financial statements of listed companies and stepped up enforcement efforts and increased sanctions for violations. Most recently, the SEC has supported issuance of a Directors’ Handbook and the establishment of a Director Registry System. The ICAAT also has intensified its efforts to improve skills and knowledge of accountants and auditors. In the area of financial reporting and disclosure, Thailand has announced a plan to fully adopt international accounting standards by 2006.

THAILAND ECONOMIC MONITOR NOVEMBER 2005
51
While these are commendable efforts, the reform agenda remains incomplete, both in terms of legislative and regulatory reform, and in terms of changes in practices. Progress in revising relevant laws including the Public Limited Companies Act (PCA) and Securities and Exchange Act (SEA) and the drafting of class action lawsuits has been slow. It is important to set a reasonable time frame for authorities for enactment of these legislations. Further steps need to be taken to improve corporate governance in Thailand, including enhancing protection of shareholder rights, particularly, the introduction of cost-effective legal channels for shareholders seeking redress. Going forward, the focus should remain on implementation and on completing the legislative and regulatory agenda, improving enforcement (prosecution process), enhancing financial reporting and disclosure consistent with international standards, and promoting business ethics and best practices (see Box 5 for details of the recommendations in the ROSC).
Box 5. Key Findings from the Thailand Corporate Governance Report on
Observance of Standards and Codes (ROSC)
The following are the key assessment of Thailand’s compliance with the OECD Principles of Corporate Governance.
Investor protection: Basic shareholder rights are largely in place in Thailand. Share registration is secure and shares are freely transferable. Shareholders can obtain material information from the company and are entitled to attend and vote in the annual general meeting (AGM). Nevertheless, because company control is concentrated, cumulative voting, although permissible, is rare. Most company boards are dominated by the controlling shareholders. While shareholders may participate in the AGM, it is difficult for minority shareholders to propose additional agenda items. Legislation to address this problem is currently under the consideration of the Council of State, however, it is unclear if and when such legislation will be adopted. In addition, because most company boards are selected by controlling shareholders, it is difficult for minority shareholders to make their influence felt. This is changing gradually, however, through active participation of the Thai Investors Association at AGMs of listed companies.
Disclosure: Basic disclosure requirements are in place. Listed companies submit quarterly and annual financial statements, which are reviewed and audited by the company’s auditor and are available to the public. In addition, timely disclosure is required upon the occurrence of an event which may have a material effect on the company. SEC regulations also require disclosure by listed companies of the top 10 shareholders and of the identities of the ultimate beneficial owners of those shareholders. Related party transactions also must be disclosed. The Federation of Professional Accountants has recently been established. It is too early to determine how this new organization will help improve the audit profession. While a great deal of effort has been expended, further improvements are required. Thailand accounting standards are not yet fully consistent with international accounting standards.
Company oversight and the board: While the concepts of fiduciary duty, duty of care and duty of loyalty are embedded within the law, in practice, particularly in smaller companies, it appears that directors have only a limited understanding of their roles and responsibilities. Thai law provides that board members are to be nominated and elected by the AGM. In practice, controlling shareholders nominate the directors and AGM approval is a mere formality. The requirement that all listed companies have an independent audit committee should improve the effectiveness of boards of directors of listed companies, over time. However, it is still too early to determine whether these audit committees are acting independently from the management, particularly in smaller companies.
Legal enforcement: Legal enforcement remains a major challenge. For corporate governance reforms to result in improved practices, managers and directors must appreciate that implementation is important and will be enforced. Recent court cases have resulted in more stringent fines and imprisonment for corporate fraud. These developments send an important signal about the importance of compliance and enforcement. Regulators and prosecutors should continue these stepped up efforts. Corporate governance reform is a long-term process. It requires changes in incentives and behavior. There is an urgent need for Thailand to persist with corporate governance reform and complete the unfinished agenda in order to further develop its capital market and increase its competitiveness
Source: Thailand corporate governance ROSC, September 2005.

THAILAND ECONOMIC MONITOR NOVEMBER 2005
52
3.2 Recent Trade Reforms Tariff Reform There has been no further tariff reduction into three-rate system this year. Since the major tariff restructure in 2003, tariff rates have been continuously restructured into the three-rate system46. As of January 2005, around 73 percent of total tariff lines are aligned with the three-rate system. However, according to the tariff restructure plan approved previously, there would be a further tariff reduction in 2007 and 2008 which would bring down another 3 percent of total tariff lines into the system47.
Export Promotion and Assistance Two FTA agreements have led to tariff reductions in July this year. Further free-trade agreement (FTA) discussion between ASEAN-China on trade in goods last year resulted in the tariff reduction of items under normal track on 20 July 2005. In addition, Thailand and New Zealand FTA, signed in April this year has led to a tariff reduction in July 2005. Meanwhile, Thailand is negotiating bilateral FTAs with key trading partners such as the US and Japan as well as countries that could be “gateways” to new markets for Thai exports (see Box 6). The Ministry of commerce still pursues a 20 percent targeted export growth for the year, despite high oil prices and global economic slowdown. Export growth in 2005 is targeted to grow at 20 percent with the ratio of export share between new markets and traditional market equal to 39:6148. However, to achieve 20 percent export growth in 2005, export growth in the remaining three months needs to grow around 30 percent49. Several proactive strategies have been implemented throughout the year to promote export performance. For instance, eleven special task forces were sent to seven new markets, in line with the government’s FTA agreement, to analyze their demand50. Twelve international trade fairs are also expected to exhibit in Thailand in FY 2005 to increase business opportunity for Thai exporters. Export assistance through financial services had been initiated by the Thailand Export-Import Bank (EXIM Bank) to expand exports to new potential markets and to FTA counterparts, on top of the establishment of the Information Center for SMEs exporters. The EXIM has established a program to promote exports to new potential markets by providing information on buyer’s risk and exempting fee on checking export documents such as Letter of Credit and Bill of collection for exports to these markets. Program to support exports to FTA counterpart was set up to give information on the FTAs and a 50 percent discount on the buyer’s risk analysis fee. In accordance with government policy to promote exports by small and medium enterprises (SMEs), in June 2005, the EXIM set up the Information Center for SMEs exporters. The Center would provide general consultation and financial support to SMEs that are interested in exports.
46 The three rates capture each stage of production as follows: 1 percent for raw materials, 5 percent for semi-finished goods, and 10 percent for finished goods. The major tariff restructure started in 2003 leading to two major tariff reductions, effective in October and December 2003. The remaining tariff restructure was completed in December 2004. 47 These three percent include mostly items under Iron and Steel categories. 48 New markets include, for example, China, Latin America, Middle East and Eastern Europe while traditional markets include US, EU, Japan, and ASEAN. In 2004, the ratio was at 34: 66. 49 In the first nine months of this year, exports grew by 16.5 percent. 50 Seven markets include China, South Asia, Middle East, Latin America, Russia and CIS, Africa and Australia and New Zealand. In the Middle East market, purchase order of US$ 3,210 million within a year is expected after the mission.

THAILAND ECONOMIC MONITOR NOVEMBER 2005
53
Box 6. Progress on Thailand’s Free Trade Agreements (FTAs)
Thailand has continued to apply proactive strategy to expand international trade via FTAs. In 2005, there was favorable progress in FTA negotiations between Thailand and its trading partners which resulted in tariff reductions between the two as follows:
• ASEAN and China: Tariff reduction on items under normal track including those under HS09 (Coffee, tea and spices) to HS97 (Art and antiques) was delayed from 1 July 2005 to 20 July 2005 due to technical problems in China. Thailand’s normal track list included 5,121 items. Tariff rates of 843 items were reduced on the effective date. In addition, tariff rates of 278 items including jewelry, machinery, electronics and chemical products will become zero rates by end-2005. China’s normal track list included 6,583 items. Tariffs of 2,682 items like textiles and apparels, machinery and processed meat were also reduced on 20 July 2005. By end-2005, tariff rates of 575 items including wood and wooden products, machinery, and electronics will be reduced to zero.51
• Thailand and Australia: Thailand and Australia have already implemented the tariff reductions under a framework agreement on Free Trade Area since 1 January 2005. So far, the tariff reductions have helped generate trade flows between the two such that exports to and imports from Australia increased by 31.3 percent and 69.4percent, respectively, in the first three quarters of 2005. Thailand exports to Australia accounted for 2.9 percent of total exports and so did imports from Australia.
• Thailand and New Zealand: Thailand and New Zealand signed a Closer Economic Partnership Agreement on 19 April 2005. The agreement, effective on 1 July 2005, is a comprehensive one. It includes trade in goods and services, investment, and trade cooperation such as e-commerce, government procurement and intellectual property. On the effective date, New Zealand’s tariffs on 79 percent of total items was reduced to zero, while 54 percent of Thailand’s total tariff lines were reduced to zero52.
Several other bilateral agreements are under negotiation.
• Thailand and US: In the recent meeting in September 2005, 13 of the 22 subgroups negotiated on different issues such as trade on manufactured products, agriculture products, rules of origin, and labor and environment. The progress of each subgroup was mixed.
• Thailand and Japan: The meeting at ministerial level in August 2005 had reconciled major negotiation issues- tariff reduction of steel, vehicle parts, car and agriculture products, collaborations on SPS, science and technology, ICT and Small and Medium Enterprises, and trade in services as well as investment. After this mutual agreement, the draft framework agreement will be prepared and is expected to complete within 8 months. Therefore, the two parties should be able to sign the framework agreement in April next year with the agreement becoming effective before the end of 2006.
• Thailand and India: In the September meeting, Thailand and India discussed the tariff reduction of trade in goods which was divided into two categories, namely, normal track and sensitive track. The two had submitted the sensitive list: India’s sensitive list accounted for 1,367 items or 25 percent of total items at 6-digit HS code and Thailand’s sensitive list accounted for 1,303 items. However, the detail of the schedule is still under negotiation. In addition, rules of origin, investment, collaboration on Sanitary and Phytosanitary (SPS) measures, and the dispute settlement mechanism were also discussed.
• Thailand and Bahrain: In the recent meeting in May 2005, Bahrain would like to renegotiate the FTA so that other members of the Gulf Cooperation Council (GCC) will be included in the FTA. Therefore, it is likely that the bilateral FTA negotiation between the two parties will be changed to a multilateral FTA negotiation between Thailand and GCC. As a result, the early harvest program (EHP) agreed earlier in the framework agreement signed in 2002 will not be effective.
• Thailand and Peru: Thailand and Peru signed a framework agreement on a Closer Economic Partnership on 17 October 2002. According to the meeting in August, Thailand and Peru mutually agreed to implement the early harvest package on items which can be negotiated first. Tariffs of certain items will be exempted on the effective date while tariffs of others will be reduced to zero rates in five years. In total, products under the early harvest package will account for at least 60 percent of average imports of the two and not lower than 70 percent of total
51 See detail of tariff reductions and product coverage in Thailand Economic Monitor April 2005 issue. 52 See detail of tariff reductions and product coverage in Thailand Economic Monitor April 2005 issue.

THAILAND ECONOMIC MONITOR NOVEMBER 2005
54
items. Peru has offered 67 percent of three-year average imports from Thailand to be included in the early harvest package. Thailand is expected to benefit from the immediate tariff reduction of pick-up car, plastic, rubber and its products. Trade in services and investment will be negotiated later this year.
• Thailand and European Free Trade Association (EFTA): Thailand and the EFTA held the first official meeting in October this year. The two parties mutually agreed on the comprehensive FTA framework to cover trade in goods and services, investment, intellectual property, and government procurement. They are expected to complete their negotiation by 2006.
• BIMST-EC 653: As of September 2005, there has been a significant progress on BIMST-EC FTA’s meeting with regards to an agreement on trade in goods. Under the FTA in goods, tariff reduction will be divided into two categories, namely, the fast track and normal track. Tariff reduction on items under the fast track will expect to begin on 1 July 2006 and those under the normal track on 1 July 2007. In addition, BIMST-EC members exchanged a list of items which will not be included in the tariff reduction schedule, but, there will be further discussions to minimize the list.
• ASEAN and Korea: There has been a significant progress on the ASEAN-Korea FTA this year. As of August 2005, four meetings between the ASEAN-Korea trade negotiating committees had been organized. The latest mutual agreements specified a list of items at 6 digit-HS code to be negotiated, rules of origin, calculation of production cost, and dispute settlement. As for tariff reduction, it will be divided into two groups, namely, normal track and sensitive list. Firstly, tariffs of 80 percent of items under the normal track will be reduced to zero percent within 2009 and the remaining 20 percent by 2012. Secondly, tariffs of items under the sensitive list will be zero by 2015. The two parties are expected to sign the Framework Agreement on Comprehensive Economic Cooperation in December 2005 at the ASEAN-Korea Summit.
3.3 Public Sector Reform Public sector reform has made further progress this year. Progress have been made in closely aligning government agencies deliverables to achieve the national strategic goals as laid out in the recently Cabinet-approved Public Affairs Management Plan (PAMP). In an on-going attempt to improve service delivery of and work process in government agencies, several changes in the structure of the ministries have been initiated and some such as the Service Delivery Units and the Government Counter Services are implemented. In addition, the Government has made progress in adopting ICT to improve its work process. For example, the Government Financial Management Information Systems (GFMIS) was established and fully implemented this year. In an attempt to improve the incentives for work in the government service and raise the quality of government officials, civil servant salaries were increased and a Fast Track Executive Training Program was established this year. Decentralization, however, made minimal progress, and amendment to the Decentralization Act (1999) was proposed. The Cabinet has approved in principle the strategies, action plans, and KPIs developed by government agencies under the Public Affairs Management Plan (PAMP). Consistent with the Public Sector Development Strategy (PSDS; 2003-2007), the Government adopted a Public Affairs Management Plan (PAMP), which was published in the Royal Gazette on April 12, 2005. Under the PAMP, every ministry, department, and provincial administration office was required to develop a four-year implementation action plan together with a detailed annual action plan. These plans, which were submitted to the Cabinet on June 7, 2005, define the strategies, objectives, and key performance indicators (KPIs) to be used by the respective agencies towards achieving the national strategic goals identified in the PSDS and PAMP. The agency plans were approved in principle by the Cabinet and are now being revised in line with estimated available budgets for each agency.
53 BIMST-EC includes seven countries, namely, Bangladesh, Bhutan, India, Myanmar, Nepal, Sri Lanka and Thailand.

THAILAND ECONOMIC MONITOR NOVEMBER 2005
55
Revisions to the Ministerial structure have been proposed. Following a series of consultations, including with the academic community, the Government is considering a new Ministerial structure under which the number of Ministries would be reduced to 18 (from 20), and the number of Tabuang/Bureaus would be increased to 7-9 (from 4) and the number of Departments would be increased to 130 (from 127). Under the new structure, some ministries would be merged and agencies moved. In addition, some Tabuang/Bureaus would be given overall responsibility for specific issues, including water, land, forest, and the environment. The final proposed structure is to be submitted to Cabinet for approval in 2006. Several initiatives have been implemented to improve management efficiency and service quality. These include granting certain government agencies quasi-autonomy to provide services to other agencies and the private sector and establishing one-stop service centers. The quasi-autonomous service agencies are known as the Service Delivery Units (SDUs). Since January 2005, three SDUs have been piloted: the Thai Mint, Government Printing Office, and the Civil Service Training Institute. The SDUs are to act as outsourcing units and operate quasi-autonomously under the umbrella of their respective parent organization with their own management, personnel, and financial arrangements. Their tasks are to provide services and non-core functions to their parent organization. Other departments and the private sector can also receive services from SDU. Two Government Counter Services (GCS) have been established this year to provide a one-stop service for the public. It provides 22 services from 17 government agencies. Services provided are those that can be provided quickly such as processing payments of various Government charges, postal services, tax filing, passport renewal, issuance of personal identification card, issuance of 30 Baht health scheme card, airline and bus ticket reservations, electricity/water/telephone connection requests, and distribution of official forms. Two GCS have been established this year – one at the Mo Chit BTS station in Bangkok and one in a large department store in Chiang Mai. More simple services such as requesting legal services, requesting for basic needs and establishing of small enterprise are provided by Service Link Units (SLU) which have been established in 8 locations around the country The E-Government Action Plan (2005–2007) was approved on August 16, 2005. The objectives of the e-Government action plan are to expand e-services and develop a government portal; enhancing efficiency of infrastructure and networks; improving laws and regulations related to e-commerce, security and computer crimes; and establishing an E-Government Agency (EGA). The Government has fully implemented the GFMIS this year, which would help improve the management and monitoring of government finances. The GFMIS, a real time financial management system for the public sector, has been fully implemented in all government agencies. The systems includes budget planning and appropriation system, budget monitoring, budget execution, and electronic payment, national accounting, capital procurement, audit information, organizational management, personal administration, and personnel benefits. Since March 1, 2005, all government disbursements have been conducted under GFMIS instead of issuing disbursement letters. Most payment transfers from the government to clients or suppliers can be made through the Bank of Thailand or Krung Thai Bank under the GFMIS. Since the government can monitor on-line real time expenses under GFMIS, the preparation of the FY 2006 Budget required all government agencies to submit proposed individual budgets consistent with the Government overall strategic objectives. These budget plans are disaggregated on a monthly basis so that the government can closely monitor execution against the budget. Civil servants’ salaries were raised by 5 percent, effective October 1st, 2005, and a Fast Track Executive Training Program was introduced. For the first time in a decade, the Government has increased the base of civil servants’ salaries, in an attempt to narrow the gap between private and public sector employees. In addition, a Fast Track Executive Training Program was launched in August 2005. The 26-months program aims to develop a new generation of civil servants and develop future leaders, visionary thinkers, developers, planners, and operators. Participants were selected from the pool of new graduates, civil servants, and external organizations, including the private sector and international organizations. The Training Program includes assignments in different departments, both at the central and local government levels, in government offices abroad, and in the private sector.

THAILAND ECONOMIC MONITOR NOVEMBER 2005
56
Fiscal decentralization is proceeding, but more slowly than initially planned. Though the share of local government revenue to national government revenue increased from 22.8 percent in FY 2004 to 23.5 percent in FY 2005, and is budgeted to reach 24.1 percent in FY 2006, the share of local government revenue remains well below the initial target of 35 percent set in the Decentralization Act (1999) (see Figure 47).54 In particular, the transfer of some important functions to local governments, such as education, has been delayed due to the need to revise laws and regulations. Some revisions to the laws and the organization structure related to decentralization have been proposed to the Cabinet. These include grouping all the laws related to local governments into the Local Administration Law and amending the Decentralization Act. Also, there is a controversial proposal to move the Office of the Decentralization in the Prime Minister’s Office to the Department of Local Administration under Ministry of Interior in order to enhance capacity to overseeing the management of local governments. Amidst the uncertainties in the direction of decentralization in the past few years, personnel decentralization has been slow. Between FY 2003-2005, only 4,458 personnel which is account for 0.4% of total civil servants were transferred to local governments.
Figure 47 Local Government and Central Government Revenue* (FY 2001-FY 2006)
0
200
400
600
800
1,000
1,200
1,400
1,600
FY2001 FY2002 FY2003 FY2004 FY2005 FY2006
Bt T
rillio
n
0
5
10
15
20
25
30
Perc
ent
LG revenue (LHS) CG revenue (LHS) LG/CG (RHS) LG/GDP (RHS)
Source: Office of the Decentralization to local government organization committee, Prime Minister’s office. Compiled by Fiscal Policy Office, Ministry of Finance Note: *estimated data
54 Fiscal year 2006 begins October 1st, 2005 and ends on September 30th, 2006.
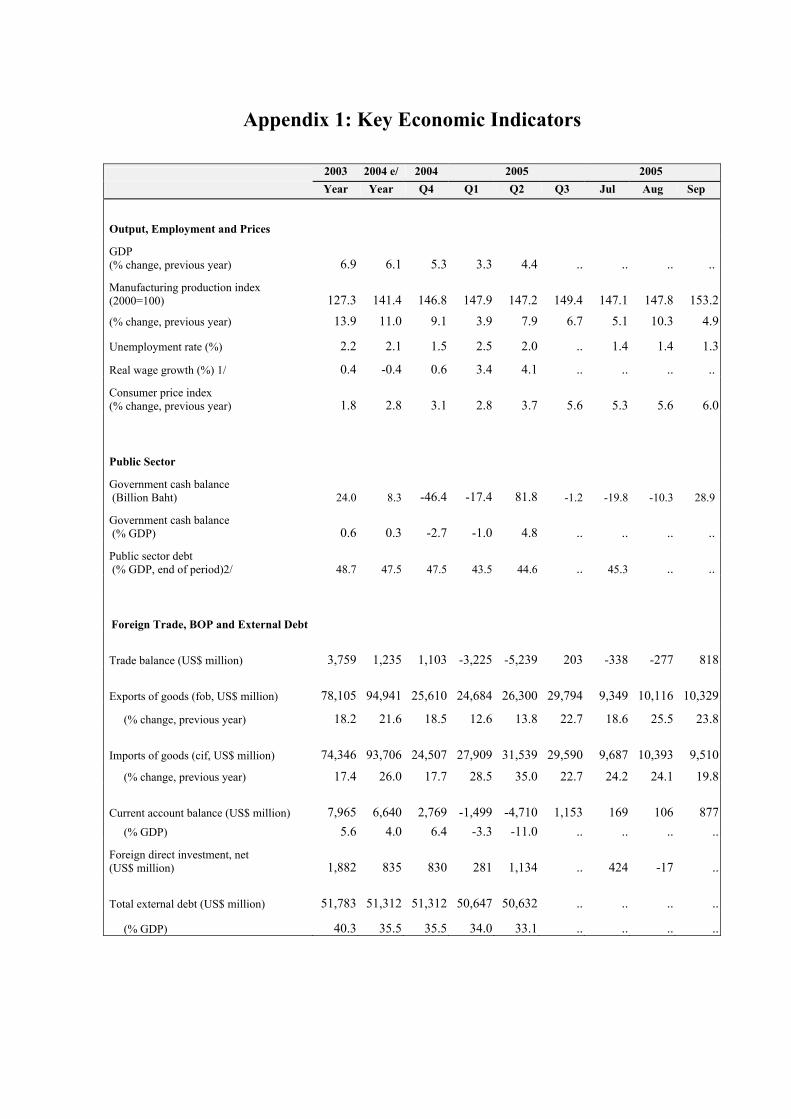
Appendix 1: Key Economic Indicators
2003 2004 e/ 2004 2005 2005
Year Year Q4 Q1 Q2 Q3 Jul Aug Sep
Output, Employment and Prices
GDP (% change, previous year) 6.9 6.1 5.3 3.3 4.4 .. .. .. ..
Manufacturing production index (2000=100) 127.3 141.4 146.8 147.9 147.2 149.4 147.1 147.8 153.2
(% change, previous year) 13.9 11.0 9.1 3.9 7.9 6.7 5.1 10.3 4.9
Unemployment rate (%) 2.2 2.1 1.5 2.5 2.0 .. 1.4 1.4 1.3
Real wage growth (%) 1/ 0.4 -0.4 0.6 3.4 4.1 .. .. .. ..
Consumer price index (% change, previous year) 1.8 2.8 3.1 2.8 3.7 5.6 5.3 5.6 6.0
Public Sector
Government cash balance (Billion Baht) 24.0 8.3 -46.4 -17.4 81.8 -1.2 -19.8 -10.3 28.9
Government cash balance (% GDP) 0.6 0.3 -2.7 -1.0 4.8 .. .. .. ..
Public sector debt (% GDP, end of period)2/ 48.7 47.5 47.5 43.5 44.6 .. 45.3 .. ..
Foreign Trade, BOP and External Debt
Trade balance (US$ million) 3,759 1,235 1,103 -3,225 -5,239 203 -338 -277 818
Exports of goods (fob, US$ million) 78,105 94,941 25,610 24,684 26,300 29,794 9,349 10,116 10,329
(% change, previous year) 18.2 21.6 18.5 12.6 13.8 22.7 18.6 25.5 23.8
Imports of goods (cif, US$ million) 74,346 93,706 24,507 27,909 31,539 29,590 9,687 10,393 9,510
(% change, previous year) 17.4 26.0 17.7 28.5 35.0 22.7 24.2 24.1 19.8
Current account balance (US$ million) 7,965 6,640 2,769 -1,499 -4,710 1,153 169 106 877 (% GDP) 5.6 4.0 6.4 -3.3 -11.0 .. .. .. ..
Foreign direct investment, net (US$ million) 1,882 835 830 281 1,134 .. 424 -17 ..
Total external debt (US$ million) 51,783 51,312 51,312 50,647 50,632 .. .. .. ..
(% GDP) 40.3 35.5 35.5 34.0 33.1 .. .. .. ..

THAILAND ECONOMIC MONITOR NOVEMBER 2005
58
2003 2004 e/ 2004 2005 2005
Year Year Q4 Q1 Q2 Q3 Jul Aug Sep
Short-term debt (US$ million) 10,904 12,174 12,174 14,180 16,034 .. .. .. ..
Debt service ratio (% exports of goods and services) 16.0 8.5 6.5 13.8 8.1 .. .. .. ..
Reserves, including gold (US$ million) 42,148 49,832 49,832 48,681 48,357 49,795 48,414 49,382 49,795 (months of imports of goods) 6.8 6.3 6.1 5.2 4.6 5.0 5.0 4.8 5.2
Financial Markets
Domestic credit (% change, previous year) 3/ 4.3 7.4 7.4 6.8 6.1 .. .. .. ..
Short-term interest rate (average period) 4/ 1.3 1.0 1.0 1.3 1.3 1.4 1.3 1.3 1.6
Exchange rate (average period) 41.5 40.2 40.2 38.6 40.0 41.3 41.7 41.1 41.0
Real effective exchange rate (1994=100) 78.0 77.7 76.2 79.1 78.4 78.5 77.8 78.5 79.2 (% change, previous year) -2.1 -0.3 -3.6 -0.2 -0.6 2.3 1.1 2.6 3.4
Stock market index (Dec 1996=100) 772.2 668.1 668.1 681.5 675.5 723.2 675.7 697.9 723.2
Memo: GDP (US$ billion) 143.0 163.5 43.2 45.0 42.9 .. .. .. ..
e = estimate p = projection 1/ Computed from average wage of employed person from Labor Force Survey 2/ Include direct government debt, non-financial-state-enterprise debt and financial institutions development fund (FIDF) debt 3/ Yearly and quarterly data include credits extended by all financial institutions 4/ Average interest rates on time deposits of less than 6 months (percent per annum)

THAILAND ECONOMIC MONITOR NOVEMBER 2005
59
Appendix 2. Monitoring Matrices for Structural Reform Implementation55 1. Poverty Reduction Diagnostics
2. Financial and Corporate Sector Reform
3. Reforms to Improve Business and Investment Environment
4. Trade Reforms
5. Public Sector and Governance Reform
6. Social Protection
55 This appendix specifies in some detail, the reform measures taken during the last 6-12 months and their significance as well as measures to be taken in the next 6-12 months, the latter identifying key process steps that may have been taken as a prelude to those measures to be taken
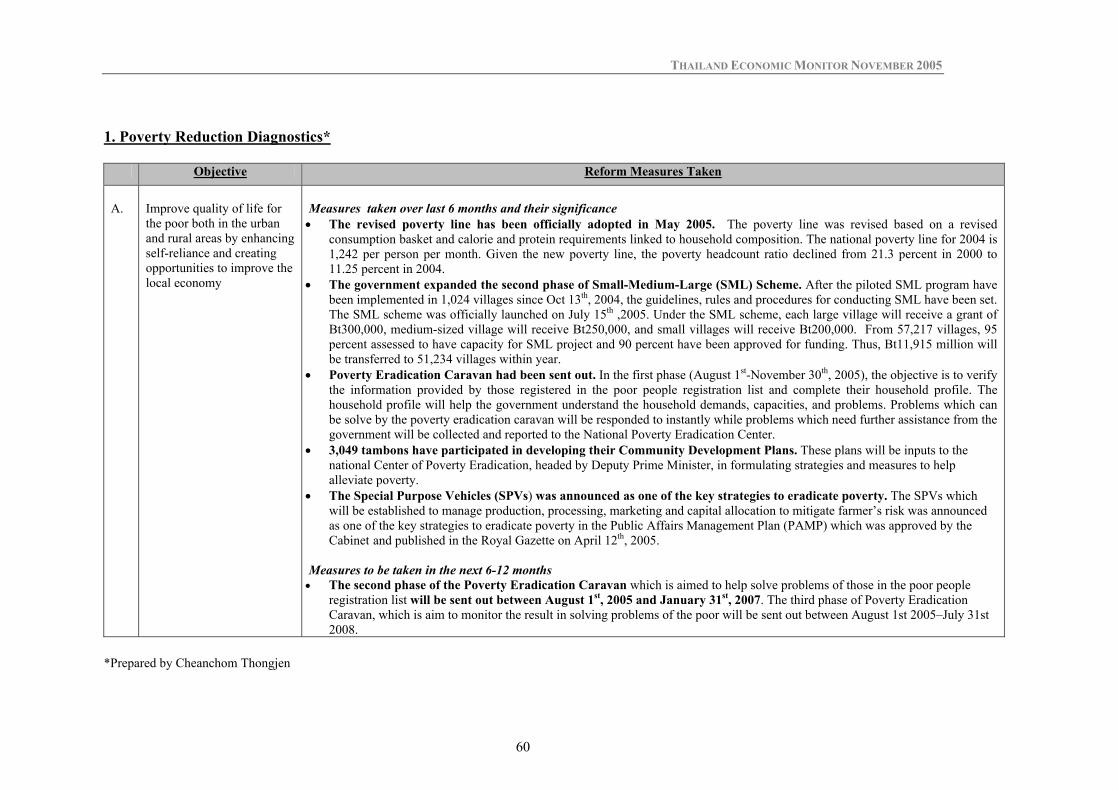
THAILAND ECONOMIC MONITOR NOVEMBER 2005
60
1. Poverty Reduction Diagnostics*
Objective Reform Measures Taken
A.
Improve quality of life for the poor both in the urban and rural areas by enhancing self-reliance and creating opportunities to improve the local economy
Measures taken over last 6 months and their significance • The revised poverty line has been officially adopted in May 2005. The poverty line was revised based on a revised
consumption basket and calorie and protein requirements linked to household composition. The national poverty line for 2004 is 1,242 per person per month. Given the new poverty line, the poverty headcount ratio declined from 21.3 percent in 2000 to 11.25 percent in 2004.
• The government expanded the second phase of Small-Medium-Large (SML) Scheme. After the piloted SML program have been implemented in 1,024 villages since Oct 13th, 2004, the guidelines, rules and procedures for conducting SML have been set. The SML scheme was officially launched on July 15th ,2005. Under the SML scheme, each large village will receive a grant of Bt300,000, medium-sized village will receive Bt250,000, and small villages will receive Bt200,000. From 57,217 villages, 95 percent assessed to have capacity for SML project and 90 percent have been approved for funding. Thus, Bt11,915 million will be transferred to 51,234 villages within year.
• Poverty Eradication Caravan had been sent out. In the first phase (August 1st-November 30th, 2005), the objective is to verify the information provided by those registered in the poor people registration list and complete their household profile. The household profile will help the government understand the household demands, capacities, and problems. Problems which can be solve by the poverty eradication caravan will be responded to instantly while problems which need further assistance from the government will be collected and reported to the National Poverty Eradication Center.
• 3,049 tambons have participated in developing their Community Development Plans. These plans will be inputs to the national Center of Poverty Eradication, headed by Deputy Prime Minister, in formulating strategies and measures to help alleviate poverty.
• The Special Purpose Vehicles (SPVs) was announced as one of the key strategies to eradicate poverty. The SPVs which will be established to manage production, processing, marketing and capital allocation to mitigate farmer’s risk was announced as one of the key strategies to eradicate poverty in the Public Affairs Management Plan (PAMP) which was approved by the Cabinet and published in the Royal Gazette on April 12th, 2005.
Measures to be taken in the next 6-12 months • The second phase of the Poverty Eradication Caravan which is aimed to help solve problems of those in the poor people
registration list will be sent out between August 1st, 2005 and January 31st, 2007. The third phase of Poverty Eradication Caravan, which is aim to monitor the result in solving problems of the poor will be sent out between August 1st 2005–July 31st 2008.
*Prepared by Cheanchom Thongjen

THAILAND ECONOMIC MONITOR NOVEMBER 2005
61
2. Financial and Corporate Sector Reform*
Objective Reform Measures Taken
A. Enable sharing of credit information among financial institutions
Measures taken over last 6 months and their significance • The House of Representatives endorsed in September 2005 the proposed amendments to the Credit Information Business Act.
The enactment of the proposed amendments will reduce onerous legal risk for the Credit Bureau and their members and provide more flexibility for the operations of Credit Bureau. The current Act, effective in 2003, has many positive attributes but mandates large fines and criminal penalties against the bureaus or their members for all violations, including negligence. Notifications issued by the Credit Information Protection Committee and the legal opinion issued by the Council of State subsequent to the enactment of the Act helps reduce legal liabilities imposed by the law. However the proposed amendment still limits the types of business that the Credit Bureau can offer. The Senate ad-hoc Committee is considering the draft amendment.
• The legal process for a merger of the Central Credit Information Service Co., Ltd. and Thai Credit Bureau has been completed. The newly merged credit bureau was renamed National Credit Bureau. Credit databases have now grown to more than 20 million accounts, covering more than 10 million consumers.
B. Formulate and implement a medium-term strategy for Thai financial sector
Measures taken over last 6 months and their significance • A preliminary draft Master Plan for Grass-Root Financial Services has been completed. The draft Master Plan was prepared
by the Microfinance System Development Committee (MSDC), which is chaired by the Finance Minister and its members comprise of representatives from concerned agencies. The Master Plan has three strategic focuses: (1) strengthening microfinance intermediaries and their human resource and improving their service providing capacities, (2) rationalize role and responsibilities of the government agencies involved in microfinance intermediation, and (3) fostering the microfinance network for sharing of experience. The MSDC will organize a public hearing on the draft Master Plan in mid November.
Measures to be taken in the next 6-12 months • The Master Plan for Grass-Root Financial Services will be submitted to the Finance Minister for his approval. The drafted
Master Plan is currently under the consideration by the Permanent Secretary of the MOF. After the Finance Minister’s approval, the MSDC will organize a public hearing to receive feedback, fine tune and finalize the Master Plan.
• Amendment to the BAAC Act to transform the BAAC into a rural bank was submitted to the Parliament (Lower House) for endorsement. After the endorsement by the lower House, the draft amendment would be submitted to the Senate, which will set up the Committee to consider the Act. The transformation of BAAC into a rural bank is one of government’s measures to improve access to finance in the rural areas, using BAAC’s established branch network.
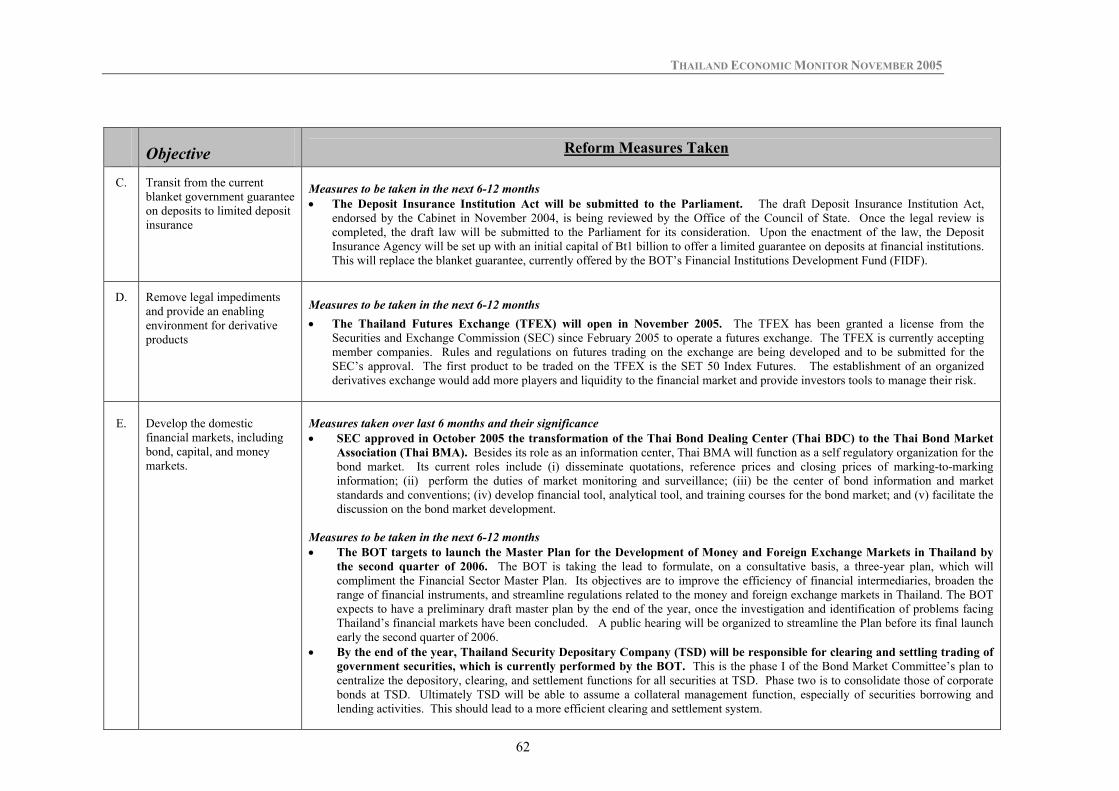
THAILAND ECONOMIC MONITOR NOVEMBER 2005
62
Objective Reform Measures Taken
C. Transit from the current blanket government guarantee on deposits to limited deposit insurance
Measures to be taken in the next 6-12 months • The Deposit Insurance Institution Act will be submitted to the Parliament. The draft Deposit Insurance Institution Act,
endorsed by the Cabinet in November 2004, is being reviewed by the Office of the Council of State. Once the legal review is completed, the draft law will be submitted to the Parliament for its consideration. Upon the enactment of the law, the Deposit Insurance Agency will be set up with an initial capital of Bt1 billion to offer a limited guarantee on deposits at financial institutions. This will replace the blanket guarantee, currently offered by the BOT’s Financial Institutions Development Fund (FIDF).
D. Remove legal impediments and provide an enabling environment for derivative products
Measures to be taken in the next 6-12 months • The Thailand Futures Exchange (TFEX) will open in November 2005. The TFEX has been granted a license from the
Securities and Exchange Commission (SEC) since February 2005 to operate a futures exchange. The TFEX is currently accepting member companies. Rules and regulations on futures trading on the exchange are being developed and to be submitted for the SEC’s approval. The first product to be traded on the TFEX is the SET 50 Index Futures. The establishment of an organized derivatives exchange would add more players and liquidity to the financial market and provide investors tools to manage their risk.
E. Develop the domestic financial markets, including bond, capital, and money markets.
Measures taken over last 6 months and their significance • SEC approved in October 2005 the transformation of the Thai Bond Dealing Center (Thai BDC) to the Thai Bond Market
Association (Thai BMA). Besides its role as an information center, Thai BMA will function as a self regulatory organization for the bond market. Its current roles include (i) disseminate quotations, reference prices and closing prices of marking-to-marking information; (ii) perform the duties of market monitoring and surveillance; (iii) be the center of bond information and market standards and conventions; (iv) develop financial tool, analytical tool, and training courses for the bond market; and (v) facilitate the discussion on the bond market development.
Measures to be taken in the next 6-12 months • The BOT targets to launch the Master Plan for the Development of Money and Foreign Exchange Markets in Thailand by
the second quarter of 2006. The BOT is taking the lead to formulate, on a consultative basis, a three-year plan, which will compliment the Financial Sector Master Plan. Its objectives are to improve the efficiency of financial intermediaries, broaden the range of financial instruments, and streamline regulations related to the money and foreign exchange markets in Thailand. The BOT expects to have a preliminary draft master plan by the end of the year, once the investigation and identification of problems facing Thailand’s financial markets have been concluded. A public hearing will be organized to streamline the Plan before its final launch early the second quarter of 2006.
• By the end of the year, Thailand Security Depositary Company (TSD) will be responsible for clearing and settling trading of government securities, which is currently performed by the BOT. This is the phase I of the Bond Market Committee’s plan to centralize the depository, clearing, and settlement functions for all securities at TSD. Phase two is to consolidate those of corporate bonds at TSD. Ultimately TSD will be able to assume a collateral management function, especially of securities borrowing and lending activities. This should lead to a more efficient clearing and settlement system.

THAILAND ECONOMIC MONITOR NOVEMBER 2005
63
Objective Reform Measures Taken
• The Thai Bond Market Association (BMA) will develop pricing models and a market/model convention to price new complex
derivatives products and illiquid bonds. Thai BMA has been assigned by the sub-committee of the Bond Market Committee to develop pricing models and a market/model convention to price illiquid bonds and their complex derivatives, which is expected to be completed early next year. Appropriate valuation of bonds and their derivatives is critical to further development of the Thai bond market. However limited market liquidity and not well-functioning market-making mechanism make the task of Thai BMA in providing fair value of bonds and their derivatives challenging.
F. Rationalize state holding of specialized financial institutions, state owned enterprises, and state commercial banks
Measures taken over the last 6 months and their significance
• SME bank has taken an initial step to implement a Public Service Account (PSA). The SME bank has proceeded with an initial implementation of the PSA by separating social and commercial activities on its income statement since early 2005. It has yet to separate accounts on its balance sheet. A public service account reports costs and performance of social mandate activities in separation from commercial activities. This is an initial step to improve the transparency of financial reports by specialized financial institutions (SFIs). By properly costing and budgeting socially mandate activities, the MOF can hold SFIs accountable for costs and benefits. The FPO has yet to finalize its proposal and a definite timeframe for the implementation of the PSA by remaining state owned financial institutions. Currently through the electronic information transfer, FPO can receive timely financial reports from all SFIs.
G. Enable corporate sector restructuring through reduced fees on the sale of foreclosed properties and streamlined the “buyer-take-possession” procedure following the sale of foreclosed properties
Measure taken over the last 6 months and their significance
• In September 2005, the Revenue Department announced new tax incentives for the purchase of pre-owned residential properties. The incentives in the forms of reduced property transfer fees and reduced tax rates are intended to attract home buyers to the secondary residential property market, and also to promote the home mortgage financing for the financial sector. The measure was made effective retroactive to January 2005 and will expire December 2006.
Measure to be taken in the next 6-12 months
• The amendments to Code of Civil Procedures on Legal Execution to reduce the fees on the sale of foreclosed properties, and to allow for an immediate “buyer-take-possession” following the sale of foreclosed properties are awaiting Parliamentary approval. The amendments would lower the fees of 5 percent for properties auctioned, 3.5 percent for property discharging, and 5% for sales not through the auction by at least half in each category. Although these are not procedural reforms to streamline the auction process, it is expected that the lower fees would attract more buyers to the foreclosed properties market. Similarly, the immediate “buyer-take-possession” would eliminate the redundant requirement for the buyer to petition and obtain court order to transfer legal ownership of the properties, thus, reducing the transaction cost and time for both the seller and the buyer. The Ministry of Justice expects the Parliament to approve the amendments during the current Parliamentary session.
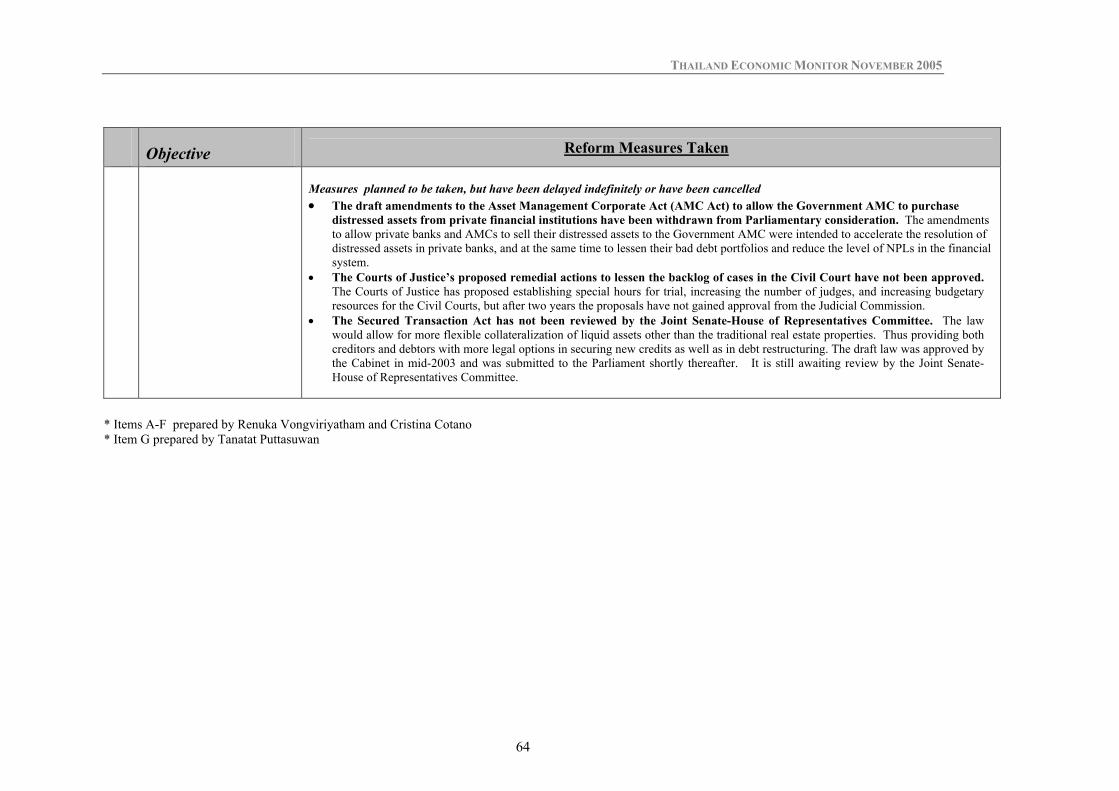
THAILAND ECONOMIC MONITOR NOVEMBER 2005
64
Objective Reform Measures Taken
Measures planned to be taken, but have been delayed indefinitely or have been cancelled • The draft amendments to the Asset Management Corporate Act (AMC Act) to allow the Government AMC to purchase
distressed assets from private financial institutions have been withdrawn from Parliamentary consideration. The amendments to allow private banks and AMCs to sell their distressed assets to the Government AMC were intended to accelerate the resolution of distressed assets in private banks, and at the same time to lessen their bad debt portfolios and reduce the level of NPLs in the financial system.
• The Courts of Justice’s proposed remedial actions to lessen the backlog of cases in the Civil Court have not been approved. The Courts of Justice has proposed establishing special hours for trial, increasing the number of judges, and increasing budgetary resources for the Civil Courts, but after two years the proposals have not gained approval from the Judicial Commission.
• The Secured Transaction Act has not been reviewed by the Joint Senate-House of Representatives Committee. The law would allow for more flexible collateralization of liquid assets other than the traditional real estate properties. Thus providing both creditors and debtors with more legal options in securing new credits as well as in debt restructuring. The draft law was approved by the Cabinet in mid-2003 and was submitted to the Parliament shortly thereafter. It is still awaiting review by the Joint Senate-House of Representatives Committee.
* Items A-F prepared by Renuka Vongviriyatham and Cristina Cotano * Item G prepared by Tanatat Puttasuwan

THAILAND ECONOMIC MONITOR NOVEMBER 2005
65
3. Reforms to Improve Business and Investment Environment*
Objective Reform Measures Taken
A. Reform institutions to enhance competitiveness
Measure taken in the last 6 months and their significance • The National Communications Commission (NCC) was selected by the Senate after more than 2 years delay. The
NCC has the authorities to formulate the national communications and media policy (e.g. airwaves, print media, TV and community radio) and new entry regulations as mandated by the 1997 Constitutions. After more than two years and several rounds of anew applications and selection process, the seven-member commissioners were appointed in September 2005.
Measure to be taken in the next 6-12 months • The Electricity Generating Authority of Thailand (EGAT) was corporatized as a public limited company in early
2005, and will be listed on the Stock Exchange of Thailand in November 2005. The potentially large market capitalization of EGAT would be attractive to both domestic and institutional investors, and at the same time the listing would generate a sizeable source of fund for future investments of EGAT.
B. Reform of legal and judicial regime
Measure taken in the last 6 months, but progress has not been recorded • In March 2005, ten sub-committees were set up to review the 377 laws identified by line ministries to be redundant,
outdated, or in need of a new law. To date, specific reform activities and detailed work plan of the sub-committees and timeline have not been determined. The NLRDC, chaired by a Deputy Prime Minister, comprised mostly government officials with a few private sector and academic representatives, received a comprehensive mandate for legal reform and development.
C. Improve the skills and quality of labors
Measure taken in the last 6 months • In September, the Office of Vocational Education has approved the establishment of the Thailand Vocation
Qualification Institute (TVQI). In collaboration with the Federation of Thai Industries, the TVQI will implement the Thai Vocational Qualifications (TVQs) program to standardize and build vocational skills in a manner consistent with international standards.
* Prepared by Tanatat Puttasuwan
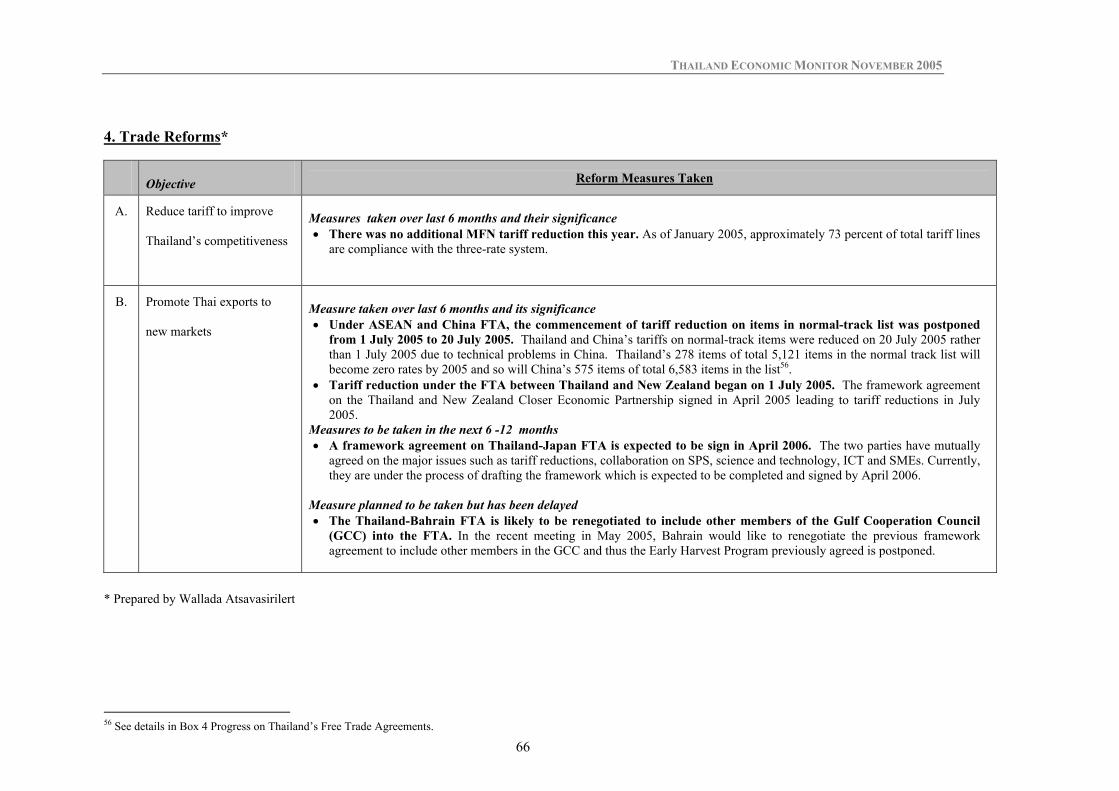
THAILAND ECONOMIC MONITOR NOVEMBER 2005
66
4. Trade Reforms*
Objective Reform Measures Taken
A. Reduce tariff to improve
Thailand’s competitiveness
Measures taken over last 6 months and their significance • There was no additional MFN tariff reduction this year. As of January 2005, approximately 73 percent of total tariff lines
are compliance with the three-rate system.
B. Promote Thai exports to
new markets
Measure taken over last 6 months and its significance • Under ASEAN and China FTA, the commencement of tariff reduction on items in normal-track list was postponed
from 1 July 2005 to 20 July 2005. Thailand and China’s tariffs on normal-track items were reduced on 20 July 2005 rather than 1 July 2005 due to technical problems in China. Thailand’s 278 items of total 5,121 items in the normal track list will become zero rates by 2005 and so will China’s 575 items of total 6,583 items in the list56.
• Tariff reduction under the FTA between Thailand and New Zealand began on 1 July 2005. The framework agreement on the Thailand and New Zealand Closer Economic Partnership signed in April 2005 leading to tariff reductions in July 2005.
Measures to be taken in the next 6 -12 months • A framework agreement on Thailand-Japan FTA is expected to be sign in April 2006. The two parties have mutually
agreed on the major issues such as tariff reductions, collaboration on SPS, science and technology, ICT and SMEs. Currently, they are under the process of drafting the framework which is expected to be completed and signed by April 2006.
Measure planned to be taken but has been delayed • The Thailand-Bahrain FTA is likely to be renegotiated to include other members of the Gulf Cooperation Council
(GCC) into the FTA. In the recent meeting in May 2005, Bahrain would like to renegotiate the previous framework agreement to include other members in the GCC and thus the Early Harvest Program previously agreed is postponed.
* Prepared by Wallada Atsavasirilert
56 See details in Box 4 Progress on Thailand’s Free Trade Agreements.

THAILAND ECONOMIC MONITOR NOVEMBER 2005
67
5. Public Sector and Governance Reform57*
Objectives Reform Measures Taken
A.
Improving public service quality by streamlining and redesigning work processes and procedures
Measure taken over the last 6 months and their significance • The Public Affairs Management Plan (PAMP) covering the period 2005-2008 was approved by the Cabinet and was
published in the Royal Gazette on April 12th, 2005. Draft four- and one-year action plans were developed by each ministry, department, and provincial administration, and submitted to the Cabinet on June 7th 2005. The Cabinet has approved these action plans in principle and assigned the ministries and head of government offices to revise their action plans in line with estimated budgets.
• The Service Link Unit has been expanded. “Basic service needs” links, which provide a one-stop shop for requesting various Government services (e.g., house registration, water, electricity and telephone connections) have been set up in 8 locations, in Bangkok and the Provinces. Also, the pilot project of service links unit for “small enterprise” was set up in Chiang Mai on December 21st, 2004. The link provides services to obtain business and individual tax identification cards and social security cards for employees. In addition, the service link unit of Ministry of Justice was set up on December 8, 2004 to provide services on appeal procedures and other legal services.
• The Government Counter Services (GCS) have been established to provide better and more convenient services to the public. With the GCS, citizens can easily access 22 kinds of services from 17 government agencies at one service counter. Examples of the types of services provided include postal services, tax filing services, renewing passport, issuance of personal identification cards, airplane/bus ticket reservations, electricity/water/telephone requests, government form downloads, etc. The first GCS was opened at the Mo Chit BTS station in Bangkok on 26th January 2005. Another GCS unit, located in the Central Airport Plaza in Chiang Mai, was officially opened in October 2005.
• The Government Fiscal Management Information System (GFMIS) has been fully implemented in all government agencies. This real time financial management system for the public sector includes budget planning and appropriation system, budget monitoring, budget execution, and electronic payment, national accounting, capital procurement, audit information, organizational management, personal administration, and personnel benefits. Since March 1, 2005, all government disbursements have been conducted under GFMIS instead of issuing disbursement letters. Most payment transfers from the government to clients or suppliers can be made through the Bank of Thailand or Krung Thai Bank under the GFMIS. Since the government can monitor on-line real time expenses under GFMIS, the preparation of the FY 2006 Budget required all government agencies to submit proposed individual budgets consistent with the Government overall strategic objectives. These budget plans are disaggregated on a monthly basis so that the government can closely monitor execution against the budget.
• Service Quality Awards have been issued to government agencies to provide incentives for improving timely service delivery. The Office of Public Sector Development Commission (OPDC) and the National Institute for Development Administration (NIDA) awarded the 7 First Public Service Quality Awards and 16 Consolation prizes were awarded to government agencies both in central and local government on May 9, 2005.
57 The objectives of this matrix are consistent with the Government’s Public Sector Development Strategy (2003-2007), and the more recent, PAMP.

THAILAND ECONOMIC MONITOR NOVEMBER 2005
68
Objectives Reform Measures Taken Measures to be taken in the next 6-12 months • Consistent with the Public Affairs Management Plan, each Ministry and agency will submit their revised Action Plans to the
Cabinet before end-2005. • Under the development of GFMIS, there is a plan to link daily revenues collected by three tax collection agencies (Revenue
Department, Excise Department and Custom Department) to monitor government revenues on a daily basis. B.
Changing roles, responsibilities, and rightsizing the government bureaucracy by restructuring public administration and improving intergovernmental relations at all levels
Measure taken over the last 6 months and their significance • Reforms to the ministerial structure have been proposed. The final proposals will be submitted to Cabinet in 2006. • Regulations on establishing Service Delivery Units (SDUs) have been adopted. SDUs have been effective since 31 January
2005. SDUs are quasi-autonomy organizations which provide services or non-core functions to their parent government agency or to the public. SDU is a unit under the umbrella of its parent agency but it has own management team, personnel and financial management. Qualified government organizations can transform into SDUs through the Office of Public Sector Development Commission (OPDC) and after receiving Cabinet approval. Three pilot organizations which have been approved by Cabinet to transform in to SDU are Thai Mint, Government Printing Office and Civil Service Training Institute.
• All laws related to local governments will be combined into the Local Administration Law, and the Decentralization Act (1999) will be amended and submitted to the Cabinet on October 2006.
C.
Enhancing capacity and performance of public sector to efficiently and effectively perform their functions by reforming financial and budgetary system, reviewing system of human resource management and compensation, developing a new mindset, work culture and value, and modernizing government operation.
Measure taken over the last 6 months and their significance • To reduce the widening salary differential between private and public sector, the Cabinet approved an increase of 5 percent in
the base salary of all civil servants on September 20, 2005. The increase became effective on 1st October 2005. • The first Fast Track Executive Training Program was launched on August 2005. The 26-months program aims to develop a
new generation of civil servants and encourage change leaders, visionary thinkers, developers, planners, and operators. Participants were selected from the pool of new graduates, civil servants and external organizations, including the private sector and international organizations. Participants will be trained in different departments, both at the central and local governments, in the private sector, and in government offices abroad.
• Public Sector Development Awards were given on May 9, 2005 to provide incentives for improving the use of information technology and knowledge management at the provincial level.
• The Cabinet approved an E-Government action plan (Year 2005-2007), which aims to develop a Government portal; developing an efficiency network system in each government agency; designing road map of information framework for each agency and standardizing data for transferring information among government agencies; developing security networks between government agencies by VPN; encouraging the use of laws related to e-government such as e-commerce, personal information protection, laws related to computer crime; and establishing an E-Government Agency (EGA) to encourage the best use of ICT.
Measure to be taken in the next 6-12 months • The Prime Minister’s Office regulation on Controlling and Monitoring Civil Affairs in Provincial Government Offices is
being reviewed by the State Council and will be presented to the Cabinet. The regulation will empower the Deputy Prime Ministers to oversee the management of provincial clusters.

THAILAND ECONOMIC MONITOR NOVEMBER 2005
69
Objectives Reform Measures Taken D.
Improving governance in public sector through participation, accountability, and transparency
Measure taken over the last 6 months and their significance • A curriculum for the People’s Audit for Thailand (PATH) has been developed and used to train community leaders in
monitoring and evaluating governance in the public sector. After having been piloted and developed in Pitsanulok in December 2004, the training was extended to Petchburi, Songkhla, Chiang Rai, Sakonakorn, and Mahasarakam, during the period March to May 2005. The project plans to offer the training in every province.
• Rules on commodity radio were approved by the Cabinet in August. To support community radio as a tool to strengthen community and enhance knowledge about the public sector, the Department of Public Relations and the Prime Minister’s Office proposed guidelines to resolve the problems of community radio to the Cabinet on August 16th, 2005. The following rules on commodity radio have since been issued:
o Community radio stations are permitted no more than a 30-Watt transmitter, transmission towers no taller than 30 meters and a broadcast range no greater than 15 kilometers.
o Advertisements are limited to a maximum of 6 minutes per hour for the purpose of raising revenue. o Other laws related to broadcasting will be strictly applied, especially those related to transmitters that interfere
with the signals of authorized transmissions such as authorized radio, TV operators, mobile telephones, and communications between aircraft and control towers.
o Community radio programs will be closely monitored, especially with regard to issues of national security, and moral standards.
o Domestic and international seminars for brainstorming on lesson learned and frameworks for conducting community radio programs are encouraged.
* Prepared by Eric Sidgwick, Cheanchom Thongjen, and Angkanee Luangpenthong
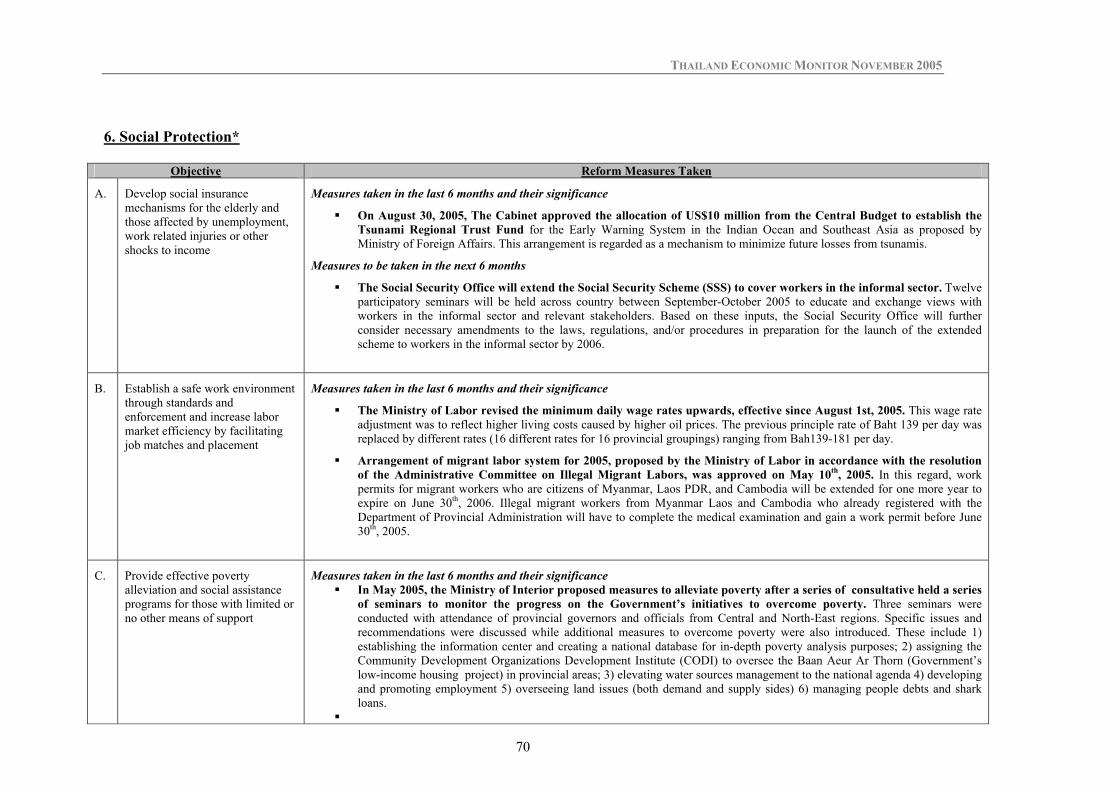
THAILAND ECONOMIC MONITOR NOVEMBER 2005
70
6. Social Protection*
Objective Reform Measures Taken
A. Develop social insurance mechanisms for the elderly and those affected by unemployment, work related injuries or other shocks to income
Measures taken in the last 6 months and their significance
On August 30, 2005, The Cabinet approved the allocation of US$10 million from the Central Budget to establish the Tsunami Regional Trust Fund for the Early Warning System in the Indian Ocean and Southeast Asia as proposed by Ministry of Foreign Affairs. This arrangement is regarded as a mechanism to minimize future losses from tsunamis.
Measures to be taken in the next 6 months
The Social Security Office will extend the Social Security Scheme (SSS) to cover workers in the informal sector. Twelve participatory seminars will be held across country between September-October 2005 to educate and exchange views with workers in the informal sector and relevant stakeholders. Based on these inputs, the Social Security Office will further consider necessary amendments to the laws, regulations, and/or procedures in preparation for the launch of the extended scheme to workers in the informal sector by 2006.
B. Establish a safe work environment through standards and enforcement and increase labor market efficiency by facilitating job matches and placement
Measures taken in the last 6 months and their significance
The Ministry of Labor revised the minimum daily wage rates upwards, effective since August 1st, 2005. This wage rate adjustment was to reflect higher living costs caused by higher oil prices. The previous principle rate of Baht 139 per day was replaced by different rates (16 different rates for 16 provincial groupings) ranging from Bah139-181 per day.
Arrangement of migrant labor system for 2005, proposed by the Ministry of Labor in accordance with the resolution of the Administrative Committee on Illegal Migrant Labors, was approved on May 10th, 2005. In this regard, work permits for migrant workers who are citizens of Myanmar, Laos PDR, and Cambodia will be extended for one more year to expire on June 30th, 2006. Illegal migrant workers from Myanmar Laos and Cambodia who already registered with the Department of Provincial Administration will have to complete the medical examination and gain a work permit before June 30th, 2005.
C. Provide effective poverty alleviation and social assistance programs for those with limited or no other means of support
Measures taken in the last 6 months and their significance In May 2005, the Ministry of Interior proposed measures to alleviate poverty after a series of consultative held a series
of seminars to monitor the progress on the Government’s initiatives to overcome poverty. Three seminars were conducted with attendance of provincial governors and officials from Central and North-East regions. Specific issues and recommendations were discussed while additional measures to overcome poverty were also introduced. These include 1) establishing the information center and creating a national database for in-depth poverty analysis purposes; 2) assigning the Community Development Organizations Development Institute (CODI) to oversee the Baan Aeur Ar Thorn (Government’s low-income housing project) in provincial areas; 3) elevating water sources management to the national agenda 4) developing and promoting employment 5) overseeing land issues (both demand and supply sides) 6) managing people debts and shark loans.

THAILAND ECONOMIC MONITOR NOVEMBER 2005
71
Objective Reform Measures Taken
In June 2005, the Cabinet approved in the principle the establishment of the Human Trafficking Operation Center at the provincial, national and international levels as proposed by the Ministry of Social Development and Human Security. The Cabinet also approved the government agencies to appoint to the ministries and agencies Human Trafficking Coordinators who are attached to Ministry of Social Development and Human Security. The Operation Center is aimed at setting up a clear-cut central mechanism on human trafficking in all levels of every government agency. The Operation Center has the following missions: 1) to collect the information on human trafficking 2) to create a national database for decision making 3) to form the management strategy, and 4) to be the command center in communications and coordination among agencies concerned.
The Thailand-Laos Memorandum of Understanding (MoU) on bilateral cooperation on the fight against human trafficking, as proposed by Ministry of Social Development and Human Security, was acknowledged by the Cabinet in June 2005.
The Cabinet approved in July 2005 the decision to join the ChildNet International Organization in the Asia Pacific Region. Through membership of the ChildNet, Thailand could improve its work and effort in association with the Convention on Children Rights as well as exchange knowledge and experiences with others around the world. In addition, Thailand could take this opportunity to be a leader in promoting the cooperation and coordination on work on children rights issues among the member nations in Asia Pacific.
The MoU between the Ministry of Social Development and Human Security and Ministry of Public Health to improve lives of abandoned children was signed on September 9, 2005. The first steps are to set an inter-ministry committee, to co-develop guidelines and implementation plan and to build capacity of relevant staff in both agencies.
Measures to be taken in the next 6 months (Oct 05 – April 06)
In August 2005, the Cabinet approved the mobilization of support from government agencies and local governments to the Poverty Eradication Caravan program. Specific support requests includes: 1) all government agencies and state enterprises will provide support to the Poverty Eradication Caravan hosted by the provincial governors and district administrators; 2) the related ministries will send their officials to participate in the program both at provincial and district levels; 3) the local government offices (provinces, districts and sub-districts) will support both in terms of budgets and staff to the program; 4) the national Poverty Eradication Center and the Ministry of Interior will propose administrative and organizational frameworks at the provincial and district administrations to support the program as well as the overall government policies on tackling poverty problems and submit to the Cabinet for approval.
* Prepared by Kwanchai Niyomthamkit