worktable 210r. death rates for 113 selected causes ... rates for 113 selected causes,...
TRANSCRIPT

19JUL10 Plate 1 of 2 Page 1
Worktable 210R. Death rates for 113 selected causes, alcohol-induced causes, drug-induced causes, and injury by firearms, by 5-year agegroups, race, and sex: United States, 2007
[Rates per 100,000 population in specified group. Rates based on populations estimated as of July 1, 2007. Race categories are consistentwith the 1977 Office of Management and Budget (OMB) standards. In 2007, multiple-race data were reported by California, Connecticut, Delaware, Districtof Columbia, Florida, Hawaii, Idaho, Kansas, Maine, Michigan, Minnesota, Montana, Nebraska, New Hampshire, New Jersey, New Mexico, New York, Ohio,Oklahoma, Oregon, Rhode Island, South Carolina, South Dakota, Texas, Utah, Washington, Wisconsin, and Wyoming. The multiple-race data for these areas werebridged to the single-race categories of the 1977 OMB standards for comparability with other areas; see http://www.cdc.gov/nchs and refer to "Detailedtechnical notes to the United States 2007 data—mortality." For explanation of asterisks preceding cause-of-death codes, see http://www.cdc.gov/nchs andrefer to "Detailed technical notes to the United States 2007 data - mortality"]_____________________________________________________________________________________________________________________________________________________________
Cause of death (Based on theInternational Classificationof Diseases, Tenth Revision, Second All Under 1 1-4 5-9 10-14 15-19 20-24 25-29 30-34 35-39Edition, 2004), race, and sex ages 1/ Year 2/ years years years years years years years years______________________________________________________________________________________________________________________________________________________________
All causes
All races 3/, both sexes............. 803.6 684.5 28.6 13.7 16.9 61.9 98.3 99.4 110.8 145.8 Male............................ 809.9 747.8 31.3 15.0 19.9 86.8 145.2 140.2 148.2 185.4 Female.......................... 797.4 618.1 25.7 12.3 13.8 35.7 48.4 56.6 72.3 105.7 White, both sexes................... 851.5 573.7 25.8 12.9 15.7 58.6 93.0 93.0 103.4 135.9 Male............................ 848.1 627.8 28.3 14.0 18.3 80.0 136.1 130.6 138.1 173.3 Female.......................... 854.9 516.8 23.1 11.8 13.0 36.0 46.6 52.8 66.8 97.0 Black, both sexes................... 723.4 1,250.0 42.2 18.0 23.6 83.4 138.0 155.4 184.4 243.9 Male............................ 775.6 1,363.2 45.3 20.4 28.7 128.1 212.3 227.1 255.8 313.8 Female.......................... 675.7 1,132.2 39.0 15.6 18.4 37.4 61.6 86.4 119.5 181.5
Salmonella infections (A01-A02)
All races 3/, both sexes............. 0.0 * * * * * * * * * Male............................ * * * * * * * * * * Female.......................... * * * * * * * * * * White, both sexes................... 0.0 * * * * * * * * * Male............................ * * * * * * * * * * Female.......................... * * * * * * * * * * Black, both sexes................... * * * * * * * * * * Male............................ * * * * * * * * * * Female.......................... * * * * * * * * * *

19JUL10 Plate 1 of 2 Page 2
Worktable 210R. Death rates for 113 selected causes, alcohol-induced causes, drug-induced causes, and injury by firearms, by 5-year agegroups, race, and sex: United States, 2007
[Rates per 100,000 population in specified group. Rates based on populations estimated as of July 1, 2007. Race categories are consistentwith the 1977 Office of Management and Budget (OMB) standards. In 2007, multiple-race data were reported by California, Connecticut, Delaware, Districtof Columbia, Florida, Hawaii, Idaho, Kansas, Maine, Michigan, Minnesota, Montana, Nebraska, New Hampshire, New Jersey, New Mexico, New York, Ohio,Oklahoma, Oregon, Rhode Island, South Carolina, South Dakota, Texas, Utah, Washington, Wisconsin, and Wyoming. The multiple-race data for these areas werebridged to the single-race categories of the 1977 OMB standards for comparability with other areas; see http://www.cdc.gov/nchs and refer to "Detailedtechnical notes to the United States 2007 data—mortality." For explanation of asterisks preceding cause-of-death codes, see http://www.cdc.gov/nchs andrefer to "Detailed technical notes to the United States 2007 data - mortality"]_____________________________________________________________________________________________________________________________________________________________
Cause of death (Based on theInternational Classificationof Diseases, Tenth Revision, Second All Under 1 1-4 5-9 10-14 15-19 20-24 25-29 30-34 35-39Edition, 2004), race, and sex ages 1/ Year 2/ years years years years years years years years______________________________________________________________________________________________________________________________________________________________
Shigellosis and amebiasis (A03,A06)
All races 3/, both sexes................ * * * * * * * * * * Male............................ * * * * * * * * * * Female.......................... * * * * * * * * * * White, both sexes................... * * * * * * * * * * Male............................ * * * * * * * * * * Female.......................... * * * * * * * * * * Black, both sexes................... * * * * * * * * * * Male............................ * * * * * * * * * * Female.......................... * * * * * * * * * *
Certain other intestinal infections (A04,A07-A09)
All races 3/, both sexes............. 2.2 * * * * * * * * * Male............................ 1.7 * * * * * * * * * Female.......................... 2.8 * * * * * * * * * White, both sexes................... 2.6 * * * * * * * * * Male............................ 1.9 * * * * * * * * * Female.......................... 3.2 * * * * * * * * * Black, both sexes................... 1.1 * * * * * * * * * Male............................ 0.8 * * * * * * * * * Female.......................... 1.3 * * * * * * * * *

19JUL10 Plate 1 of 2 Page 3
Worktable 210R. Death rates for 113 selected causes, alcohol-induced causes, drug-induced causes, and injury by firearms, by 5-year agegroups, race, and sex: United States, 2007
[Rates per 100,000 population in specified group. Rates based on populations estimated as of July 1, 2007. Race categories are consistentwith the 1977 Office of Management and Budget (OMB) standards. In 2007, multiple-race data were reported by California, Connecticut, Delaware, Districtof Columbia, Florida, Hawaii, Idaho, Kansas, Maine, Michigan, Minnesota, Montana, Nebraska, New Hampshire, New Jersey, New Mexico, New York, Ohio,Oklahoma, Oregon, Rhode Island, South Carolina, South Dakota, Texas, Utah, Washington, Wisconsin, and Wyoming. The multiple-race data for these areas werebridged to the single-race categories of the 1977 OMB standards for comparability with other areas; see http://www.cdc.gov/nchs and refer to "Detailedtechnical notes to the United States 2007 data—mortality." For explanation of asterisks preceding cause-of-death codes, see http://www.cdc.gov/nchs andrefer to "Detailed technical notes to the United States 2007 data - mortality"]_____________________________________________________________________________________________________________________________________________________________
Cause of death (Based on theInternational Classificationof Diseases, Tenth Revision, Second All Under 1 1-4 5-9 10-14 15-19 20-24 25-29 30-34 35-39Edition, 2004), race, and sex ages 1/ Year 2/ years years years years years years years years______________________________________________________________________________________________________________________________________________________________
Tuberculosis (A16-A19)
All races 3/, both sexes............. 0.2 * * * * * * * * * Male............................ 0.2 * * * * * * * * * Female.......................... 0.1 * * * * * * * * * White, both sexes................... 0.1 * * * * * * * * * Male............................ 0.2 * * * * * * * * * Female.......................... 0.1 * * * * * * * * * Black, both sexes................... 0.3 * * * * * * * * * Male............................ 0.4 * * * * * * * * * Female.......................... 0.2 * * * * * * * * *
Respiratory tuberculosis (A16)
All races 3/, both sexes............. 0.1 * * * * * * * * * Male............................ 0.2 * * * * * * * * * Female.......................... 0.1 * * * * * * * * * White, both sexes................... 0.1 * * * * * * * * * Male............................ 0.1 * * * * * * * * * Female.......................... 0.1 * * * * * * * * * Black, both sexes................... 0.2 * * * * * * * * * Male............................ 0.3 * * * * * * * * * Female.......................... 0.1 * * * * * * * * *

19JUL10 Plate 1 of 2 Page 4
Worktable 210R. Death rates for 113 selected causes, alcohol-induced causes, drug-induced causes, and injury by firearms, by 5-year agegroups, race, and sex: United States, 2007
[Rates per 100,000 population in specified group. Rates based on populations estimated as of July 1, 2007. Race categories are consistentwith the 1977 Office of Management and Budget (OMB) standards. In 2007, multiple-race data were reported by California, Connecticut, Delaware, Districtof Columbia, Florida, Hawaii, Idaho, Kansas, Maine, Michigan, Minnesota, Montana, Nebraska, New Hampshire, New Jersey, New Mexico, New York, Ohio,Oklahoma, Oregon, Rhode Island, South Carolina, South Dakota, Texas, Utah, Washington, Wisconsin, and Wyoming. The multiple-race data for these areas werebridged to the single-race categories of the 1977 OMB standards for comparability with other areas; see http://www.cdc.gov/nchs and refer to "Detailedtechnical notes to the United States 2007 data—mortality." For explanation of asterisks preceding cause-of-death codes, see http://www.cdc.gov/nchs andrefer to "Detailed technical notes to the United States 2007 data - mortality"]_____________________________________________________________________________________________________________________________________________________________
Cause of death (Based on theInternational Classificationof Diseases, Tenth Revision, Second All Under 1 1-4 5-9 10-14 15-19 20-24 25-29 30-34 35-39Edition, 2004), race, and sex ages 1/ Year 2/ years years years years years years years years______________________________________________________________________________________________________________________________________________________________
Other tuberculosis (A17-A19)
All races 3/, both sexes............. 0.0 * * * * * * * * * Male............................ 0.1 * * * * * * * * * Female.......................... 0.0 * * * * * * * * * White, both sexes................... 0.0 * * * * * * * * * Male............................ 0.0 * * * * * * * * * Female.......................... 0.0 * * * * * * * * * Black, both sexes................... 0.1 * * * * * * * * * Male............................ 0.1 * * * * * * * * * Female.......................... * * * * * * * * * *
Whooping cough (A37)
All races 3/, both sexes................ * * * * * * * * * * Male............................ * * * * * * * * * * Female.......................... * * * * * * * * * * White, both sexes................... * * * * * * * * * * Male............................ * * * * * * * * * * Female.......................... * * * * * * * * * * Black, both sexes................... * * * * * * * * * * Male............................ * * * * * * * * * * Female.......................... * * * * * * * * * *
19JUL10 Plate 1 of 2 Page 5
Worktable 210R. Death rates for 113 selected causes, alcohol-induced causes, drug-induced causes, and injury by firearms, by 5-year agegroups, race, and sex: United States, 2007
[Rates per 100,000 population in specified group. Rates based on populations estimated as of July 1, 2007. Race categories are consistentwith the 1977 Office of Management and Budget (OMB) standards. In 2007, multiple-race data were reported by California, Connecticut, Delaware, Districtof Columbia, Florida, Hawaii, Idaho, Kansas, Maine, Michigan, Minnesota, Montana, Nebraska, New Hampshire, New Jersey, New Mexico, New York, Ohio,Oklahoma, Oregon, Rhode Island, South Carolina, South Dakota, Texas, Utah, Washington, Wisconsin, and Wyoming. The multiple-race data for these areas werebridged to the single-race categories of the 1977 OMB standards for comparability with other areas; see http://www.cdc.gov/nchs and refer to "Detailedtechnical notes to the United States 2007 data—mortality." For explanation of asterisks preceding cause-of-death codes, see http://www.cdc.gov/nchs andrefer to "Detailed technical notes to the United States 2007 data - mortality"]_____________________________________________________________________________________________________________________________________________________________
Cause of death (Based on theInternational Classificationof Diseases, Tenth Revision, Second All Under 1 1-4 5-9 10-14 15-19 20-24 25-29 30-34 35-39Edition, 2004), race, and sex ages 1/ Year 2/ years years years years years years years years______________________________________________________________________________________________________________________________________________________________
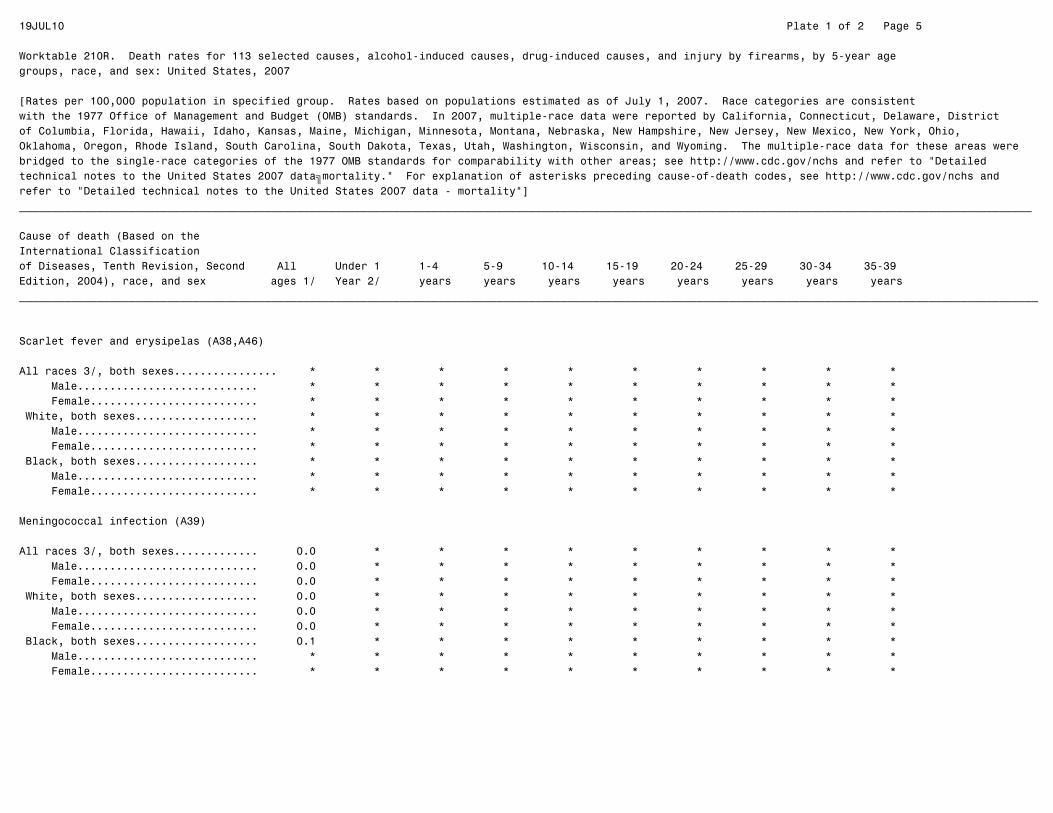
Scarlet fever and erysipelas (A38,A46)
All races 3/, both sexes................ * * * * * * * * * * Male............................ * * * * * * * * * * Female.......................... * * * * * * * * * * White, both sexes................... * * * * * * * * * * Male............................ * * * * * * * * * * Female.......................... * * * * * * * * * * Black, both sexes................... * * * * * * * * * * Male............................ * * * * * * * * * * Female.......................... * * * * * * * * * *
Meningococcal infection (A39)
All races 3/, both sexes............. 0.0 * * * * * * * * * Male............................ 0.0 * * * * * * * * * Female.......................... 0.0 * * * * * * * * * White, both sexes................... 0.0 * * * * * * * * * Male............................ 0.0 * * * * * * * * * Female.......................... 0.0 * * * * * * * * * Black, both sexes................... 0.1 * * * * * * * * * Male............................ * * * * * * * * * * Female.......................... * * * * * * * * * *
19JUL10 Plate 1 of 2 Page 6
Worktable 210R. Death rates for 113 selected causes, alcohol-induced causes, drug-induced causes, and injury by firearms, by 5-year agegroups, race, and sex: United States, 2007
[Rates per 100,000 population in specified group. Rates based on populations estimated as of July 1, 2007. Race categories are consistentwith the 1977 Office of Management and Budget (OMB) standards. In 2007, multiple-race data were reported by California, Connecticut, Delaware, Districtof Columbia, Florida, Hawaii, Idaho, Kansas, Maine, Michigan, Minnesota, Montana, Nebraska, New Hampshire, New Jersey, New Mexico, New York, Ohio,Oklahoma, Oregon, Rhode Island, South Carolina, South Dakota, Texas, Utah, Washington, Wisconsin, and Wyoming. The multiple-race data for these areas werebridged to the single-race categories of the 1977 OMB standards for comparability with other areas; see http://www.cdc.gov/nchs and refer to "Detailedtechnical notes to the United States 2007 data—mortality." For explanation of asterisks preceding cause-of-death codes, see http://www.cdc.gov/nchs andrefer to "Detailed technical notes to the United States 2007 data - mortality"]_____________________________________________________________________________________________________________________________________________________________
Cause of death (Based on theInternational Classificationof Diseases, Tenth Revision, Second All Under 1 1-4 5-9 10-14 15-19 20-24 25-29 30-34 35-39Edition, 2004), race, and sex ages 1/ Year 2/ years years years years years years years years______________________________________________________________________________________________________________________________________________________________
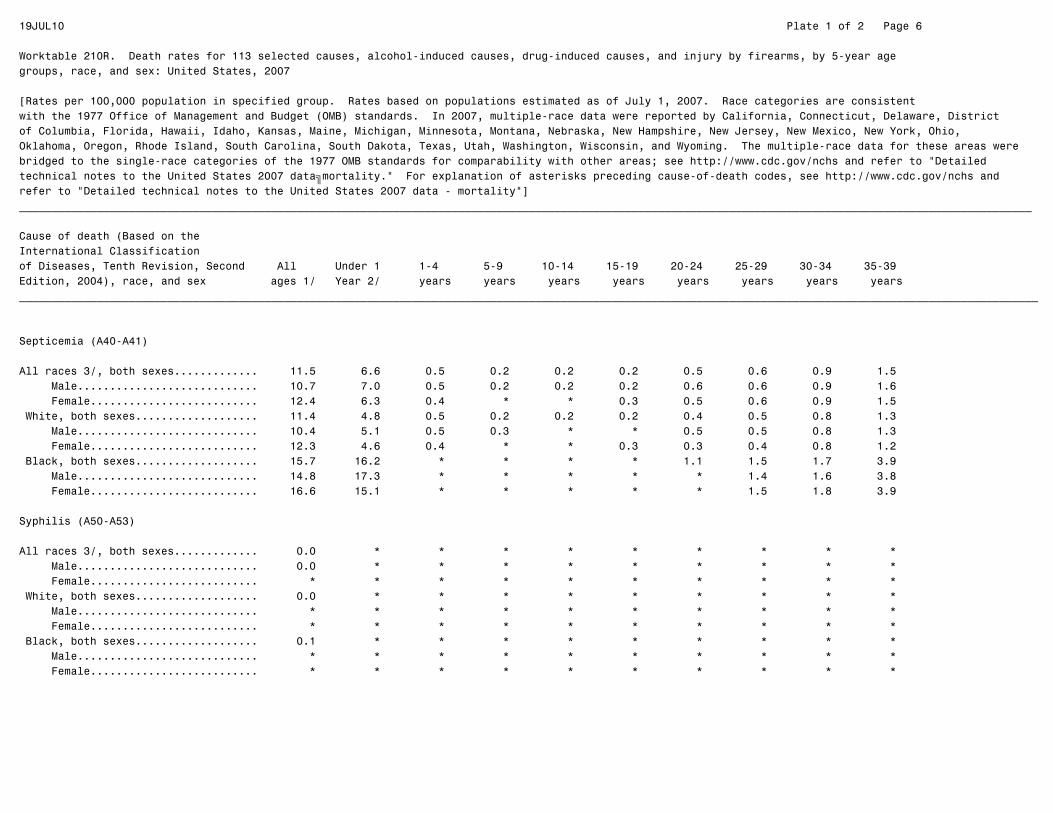
Septicemia (A40-A41)
All races 3/, both sexes............. 11.5 6.6 0.5 0.2 0.2 0.2 0.5 0.6 0.9 1.5 Male............................ 10.7 7.0 0.5 0.2 0.2 0.2 0.6 0.6 0.9 1.6 Female.......................... 12.4 6.3 0.4 * * 0.3 0.5 0.6 0.9 1.5 White, both sexes................... 11.4 4.8 0.5 0.2 0.2 0.2 0.4 0.5 0.8 1.3 Male............................ 10.4 5.1 0.5 0.3 * * 0.5 0.5 0.8 1.3 Female.......................... 12.3 4.6 0.4 * * 0.3 0.3 0.4 0.8 1.2 Black, both sexes................... 15.7 16.2 * * * * 1.1 1.5 1.7 3.9 Male............................ 14.8 17.3 * * * * * 1.4 1.6 3.8 Female.......................... 16.6 15.1 * * * * * 1.5 1.8 3.9
Syphilis (A50-A53)
All races 3/, both sexes............. 0.0 * * * * * * * * * Male............................ 0.0 * * * * * * * * * Female.......................... * * * * * * * * * * White, both sexes................... 0.0 * * * * * * * * * Male............................ * * * * * * * * * * Female.......................... * * * * * * * * * * Black, both sexes................... 0.1 * * * * * * * * * Male............................ * * * * * * * * * * Female.......................... * * * * * * * * * *

19JUL10 Plate 1 of 2 Page 7
Worktable 210R. Death rates for 113 selected causes, alcohol-induced causes, drug-induced causes, and injury by firearms, by 5-year agegroups, race, and sex: United States, 2007
[Rates per 100,000 population in specified group. Rates based on populations estimated as of July 1, 2007. Race categories are consistentwith the 1977 Office of Management and Budget (OMB) standards. In 2007, multiple-race data were reported by California, Connecticut, Delaware, Districtof Columbia, Florida, Hawaii, Idaho, Kansas, Maine, Michigan, Minnesota, Montana, Nebraska, New Hampshire, New Jersey, New Mexico, New York, Ohio,Oklahoma, Oregon, Rhode Island, South Carolina, South Dakota, Texas, Utah, Washington, Wisconsin, and Wyoming. The multiple-race data for these areas werebridged to the single-race categories of the 1977 OMB standards for comparability with other areas; see http://www.cdc.gov/nchs and refer to "Detailedtechnical notes to the United States 2007 data—mortality." For explanation of asterisks preceding cause-of-death codes, see http://www.cdc.gov/nchs andrefer to "Detailed technical notes to the United States 2007 data - mortality"]_____________________________________________________________________________________________________________________________________________________________
Cause of death (Based on theInternational Classificationof Diseases, Tenth Revision, Second All Under 1 1-4 5-9 10-14 15-19 20-24 25-29 30-34 35-39Edition, 2004), race, and sex ages 1/ Year 2/ years years years years years years years years______________________________________________________________________________________________________________________________________________________________
Acute poliomyelitis (A80)
All races 3/, both sexes................ * * * * * * * * * * Male............................ * * * * * * * * * * Female.......................... * * * * * * * * * * White, both sexes................... * * * * * * * * * * Male............................ * * * * * * * * * * Female.......................... * * * * * * * * * * Black, both sexes................... * * * * * * * * * * Male............................ * * * * * * * * * * Female.......................... * * * * * * * * * *
Arthropod-borne viral encephalitis (A83-A84,A85.2)
All races 3/, both sexes................ * * * * * * * * * * Male............................ * * * * * * * * * * Female.......................... * * * * * * * * * * White, both sexes................... * * * * * * * * * * Male............................ * * * * * * * * * * Female.......................... * * * * * * * * * * Black, both sexes................... * * * * * * * * * * Male............................ * * * * * * * * * * Female.......................... * * * * * * * * * *
19JUL10 Plate 1 of 2 Page 8
Worktable 210R. Death rates for 113 selected causes, alcohol-induced causes, drug-induced causes, and injury by firearms, by 5-year agegroups, race, and sex: United States, 2007
[Rates per 100,000 population in specified group. Rates based on populations estimated as of July 1, 2007. Race categories are consistentwith the 1977 Office of Management and Budget (OMB) standards. In 2007, multiple-race data were reported by California, Connecticut, Delaware, Districtof Columbia, Florida, Hawaii, Idaho, Kansas, Maine, Michigan, Minnesota, Montana, Nebraska, New Hampshire, New Jersey, New Mexico, New York, Ohio,Oklahoma, Oregon, Rhode Island, South Carolina, South Dakota, Texas, Utah, Washington, Wisconsin, and Wyoming. The multiple-race data for these areas werebridged to the single-race categories of the 1977 OMB standards for comparability with other areas; see http://www.cdc.gov/nchs and refer to "Detailedtechnical notes to the United States 2007 data—mortality." For explanation of asterisks preceding cause-of-death codes, see http://www.cdc.gov/nchs andrefer to "Detailed technical notes to the United States 2007 data - mortality"]_____________________________________________________________________________________________________________________________________________________________
Cause of death (Based on theInternational Classificationof Diseases, Tenth Revision, Second All Under 1 1-4 5-9 10-14 15-19 20-24 25-29 30-34 35-39Edition, 2004), race, and sex ages 1/ Year 2/ years years years years years years years years______________________________________________________________________________________________________________________________________________________________
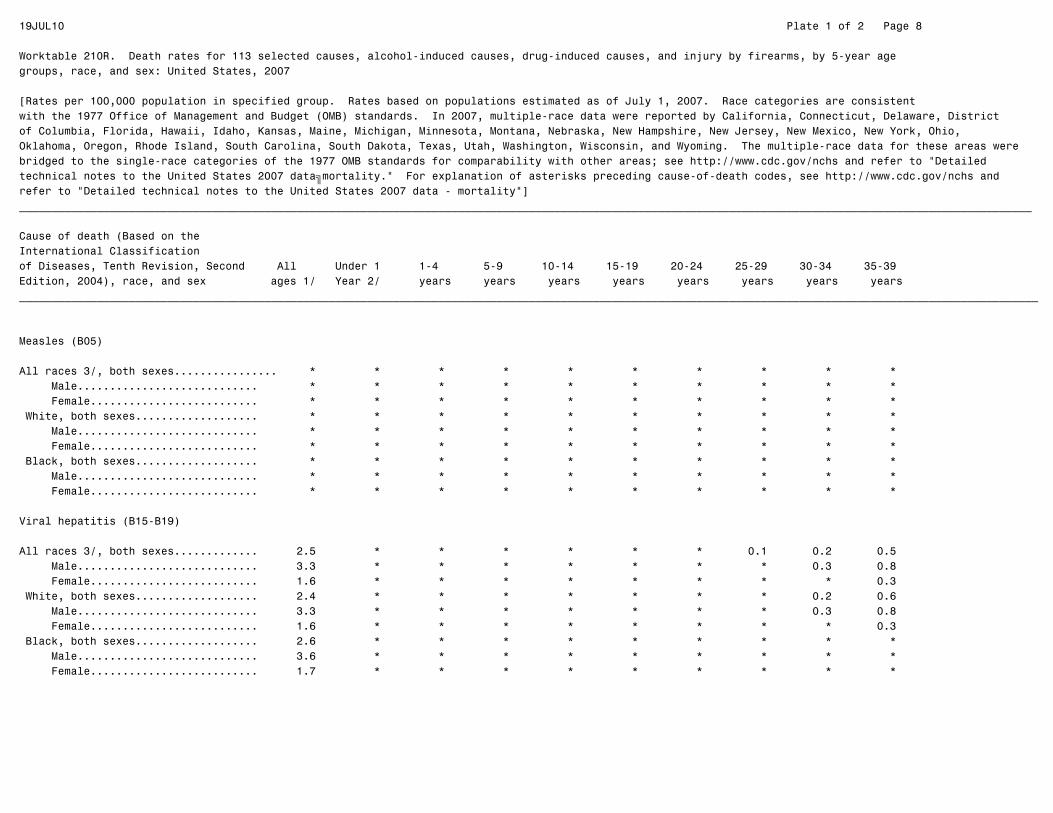
Measles (B05)
All races 3/, both sexes................ * * * * * * * * * * Male............................ * * * * * * * * * * Female.......................... * * * * * * * * * * White, both sexes................... * * * * * * * * * * Male............................ * * * * * * * * * * Female.......................... * * * * * * * * * * Black, both sexes................... * * * * * * * * * * Male............................ * * * * * * * * * * Female.......................... * * * * * * * * * *
Viral hepatitis (B15-B19)
All races 3/, both sexes............. 2.5 * * * * * * 0.1 0.2 0.5 Male............................ 3.3 * * * * * * * 0.3 0.8 Female.......................... 1.6 * * * * * * * * 0.3 White, both sexes................... 2.4 * * * * * * * 0.2 0.6 Male............................ 3.3 * * * * * * * 0.3 0.8 Female.......................... 1.6 * * * * * * * * 0.3 Black, both sexes................... 2.6 * * * * * * * * * Male............................ 3.6 * * * * * * * * * Female.......................... 1.7 * * * * * * * * *

19JUL10 Plate 1 of 2 Page 9
Worktable 210R. Death rates for 113 selected causes, alcohol-induced causes, drug-induced causes, and injury by firearms, by 5-year agegroups, race, and sex: United States, 2007
[Rates per 100,000 population in specified group. Rates based on populations estimated as of July 1, 2007. Race categories are consistentwith the 1977 Office of Management and Budget (OMB) standards. In 2007, multiple-race data were reported by California, Connecticut, Delaware, Districtof Columbia, Florida, Hawaii, Idaho, Kansas, Maine, Michigan, Minnesota, Montana, Nebraska, New Hampshire, New Jersey, New Mexico, New York, Ohio,Oklahoma, Oregon, Rhode Island, South Carolina, South Dakota, Texas, Utah, Washington, Wisconsin, and Wyoming. The multiple-race data for these areas werebridged to the single-race categories of the 1977 OMB standards for comparability with other areas; see http://www.cdc.gov/nchs and refer to "Detailedtechnical notes to the United States 2007 data—mortality." For explanation of asterisks preceding cause-of-death codes, see http://www.cdc.gov/nchs andrefer to "Detailed technical notes to the United States 2007 data - mortality"]_____________________________________________________________________________________________________________________________________________________________
Cause of death (Based on theInternational Classificationof Diseases, Tenth Revision, Second All Under 1 1-4 5-9 10-14 15-19 20-24 25-29 30-34 35-39Edition, 2004), race, and sex ages 1/ Year 2/ years years years years years years years years______________________________________________________________________________________________________________________________________________________________
Human immunodeficiency virus (HIV) disease (B20-B24)
All races 3/, both sexes............. 3.7 * * * * 0.2 0.6 2.0 3.5 6.5 Male............................ 5.4 * * * * * 0.7 2.3 4.1 8.7 Female.......................... 2.1 * * * * * 0.5 1.6 2.8 4.4 White, both sexes................... 1.9 * * * * * 0.3 0.7 1.6 3.3 Male............................ 3.1 * * * * * 0.3 1.0 2.2 5.2 Female.......................... 0.7 * * * * * * 0.4 1.0 1.3 Black, both sexes................... 16.2 * * * * 0.7 2.6 9.3 15.8 29.0 Male............................ 21.9 * * * * * 2.8 10.2 17.6 35.3 Female.......................... 10.9 * * * * * 2.5 8.5 14.1 23.4
Malaria (B50-B54)
All races 3/, both sexes................ * * * * * * * * * * Male............................ * * * * * * * * * * Female.......................... * * * * * * * * * * White, both sexes................... * * * * * * * * * * Male............................ * * * * * * * * * * Female.......................... * * * * * * * * * * Black, both sexes................... * * * * * * * * * * Male............................ * * * * * * * * * * Female.......................... * * * * * * * * * *

19JUL10 Plate 1 of 2 Page 10
Worktable 210R. Death rates for 113 selected causes, alcohol-induced causes, drug-induced causes, and injury by firearms, by 5-year agegroups, race, and sex: United States, 2007
[Rates per 100,000 population in specified group. Rates based on populations estimated as of July 1, 2007. Race categories are consistentwith the 1977 Office of Management and Budget (OMB) standards. In 2007, multiple-race data were reported by California, Connecticut, Delaware, Districtof Columbia, Florida, Hawaii, Idaho, Kansas, Maine, Michigan, Minnesota, Montana, Nebraska, New Hampshire, New Jersey, New Mexico, New York, Ohio,Oklahoma, Oregon, Rhode Island, South Carolina, South Dakota, Texas, Utah, Washington, Wisconsin, and Wyoming. The multiple-race data for these areas werebridged to the single-race categories of the 1977 OMB standards for comparability with other areas; see http://www.cdc.gov/nchs and refer to "Detailedtechnical notes to the United States 2007 data—mortality." For explanation of asterisks preceding cause-of-death codes, see http://www.cdc.gov/nchs andrefer to "Detailed technical notes to the United States 2007 data - mortality"]_____________________________________________________________________________________________________________________________________________________________
Cause of death (Based on theInternational Classificationof Diseases, Tenth Revision, Second All Under 1 1-4 5-9 10-14 15-19 20-24 25-29 30-34 35-39Edition, 2004), race, and sex ages 1/ Year 2/ years years years years years years years years______________________________________________________________________________________________________________________________________________________________
Other and unspecified infectious and parasitic diseases and their sequelae (A00,A05,A20-A36,A42-A44,A48-A49,A54-A79,A81-A82,A85.0-A85.1, A85.8,A86-B04,B06-B09,B25-B49,B55-B99)
All races 3/, both sexes............. 1.9 3.6 0.4 0.1 0.1 0.2 0.3 0.3 0.4 0.5 Male............................ 2.0 3.9 0.4 * 0.2 0.2 0.3 0.4 0.4 0.5 Female.......................... 1.9 3.4 0.4 * * * 0.2 0.2 0.3 0.5 White, both sexes................... 2.0 3.3 0.4 * 0.1 0.2 0.3 0.3 0.3 0.4 Male............................ 2.0 3.4 0.3 * * * 0.3 0.3 0.3 0.4 Female.......................... 1.9 3.1 0.4 * * * * * 0.3 0.3 Black, both sexes................... 1.9 5.7 * * * * * * 0.9 1.0 Male............................ 2.1 6.6 * * * * * * * * Female.......................... 1.8 * * * * * * * * *
Malignant neoplasms (C00-C97)
All races 3/, both sexes............. 186.6 1.7 2.2 2.4 2.4 3.1 4.7 6.3 11.0 20.0 Male............................ 197.0 1.8 2.3 2.5 2.3 3.6 5.5 6.6 9.9 16.5 Female.......................... 176.5 1.6 2.2 2.3 2.4 2.7 3.8 5.9 12.1 23.6 White, both sexes................... 198.7 1.8 2.2 2.5 2.4 3.2 4.7 6.1 10.8 19.7 Male............................ 208.8 1.8 2.2 2.6 2.4 3.7 5.4 6.6 9.7 16.5 Female.......................... 188.8 1.8 2.3 2.5 2.4 2.6 3.8 5.7 11.8 22.9 Black, both sexes................... 160.0 * 2.0 2.0 2.4 3.0 4.8 7.7 14.4 25.6 Male............................ 172.9 * 2.4 1.9 2.4 3.1 5.5 7.3 12.1 19.1 Female.......................... 148.2 * 1.7 2.1 2.3 2.9 4.2 8.0 16.4 31.4
19JUL10 Plate 1 of 2 Page 11
Worktable 210R. Death rates for 113 selected causes, alcohol-induced causes, drug-induced causes, and injury by firearms, by 5-year agegroups, race, and sex: United States, 2007
[Rates per 100,000 population in specified group. Rates based on populations estimated as of July 1, 2007. Race categories are consistentwith the 1977 Office of Management and Budget (OMB) standards. In 2007, multiple-race data were reported by California, Connecticut, Delaware, Districtof Columbia, Florida, Hawaii, Idaho, Kansas, Maine, Michigan, Minnesota, Montana, Nebraska, New Hampshire, New Jersey, New Mexico, New York, Ohio,Oklahoma, Oregon, Rhode Island, South Carolina, South Dakota, Texas, Utah, Washington, Wisconsin, and Wyoming. The multiple-race data for these areas werebridged to the single-race categories of the 1977 OMB standards for comparability with other areas; see http://www.cdc.gov/nchs and refer to "Detailedtechnical notes to the United States 2007 data—mortality." For explanation of asterisks preceding cause-of-death codes, see http://www.cdc.gov/nchs andrefer to "Detailed technical notes to the United States 2007 data - mortality"]_____________________________________________________________________________________________________________________________________________________________
Cause of death (Based on theInternational Classificationof Diseases, Tenth Revision, Second All Under 1 1-4 5-9 10-14 15-19 20-24 25-29 30-34 35-39Edition, 2004), race, and sex ages 1/ Year 2/ years years years years years years years years______________________________________________________________________________________________________________________________________________________________
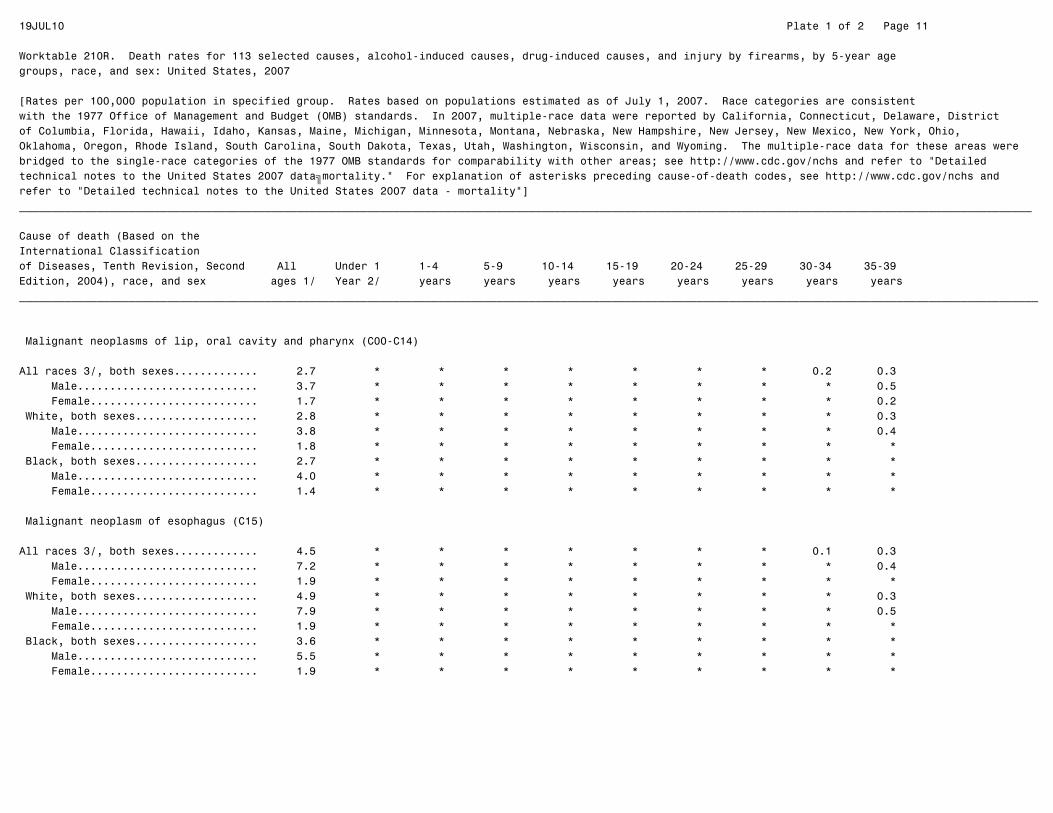
Malignant neoplasms of lip, oral cavity and pharynx (C00-C14)
All races 3/, both sexes............. 2.7 * * * * * * * 0.2 0.3 Male............................ 3.7 * * * * * * * * 0.5 Female.......................... 1.7 * * * * * * * * 0.2 White, both sexes................... 2.8 * * * * * * * * 0.3 Male............................ 3.8 * * * * * * * * 0.4 Female.......................... 1.8 * * * * * * * * * Black, both sexes................... 2.7 * * * * * * * * * Male............................ 4.0 * * * * * * * * * Female.......................... 1.4 * * * * * * * * *
Malignant neoplasm of esophagus (C15)
All races 3/, both sexes............. 4.5 * * * * * * * 0.1 0.3 Male............................ 7.2 * * * * * * * * 0.4 Female.......................... 1.9 * * * * * * * * * White, both sexes................... 4.9 * * * * * * * * 0.3 Male............................ 7.9 * * * * * * * * 0.5 Female.......................... 1.9 * * * * * * * * * Black, both sexes................... 3.6 * * * * * * * * * Male............................ 5.5 * * * * * * * * * Female.......................... 1.9 * * * * * * * * *

19JUL10 Plate 1 of 2 Page 12
Worktable 210R. Death rates for 113 selected causes, alcohol-induced causes, drug-induced causes, and injury by firearms, by 5-year agegroups, race, and sex: United States, 2007
[Rates per 100,000 population in specified group. Rates based on populations estimated as of July 1, 2007. Race categories are consistentwith the 1977 Office of Management and Budget (OMB) standards. In 2007, multiple-race data were reported by California, Connecticut, Delaware, Districtof Columbia, Florida, Hawaii, Idaho, Kansas, Maine, Michigan, Minnesota, Montana, Nebraska, New Hampshire, New Jersey, New Mexico, New York, Ohio,Oklahoma, Oregon, Rhode Island, South Carolina, South Dakota, Texas, Utah, Washington, Wisconsin, and Wyoming. The multiple-race data for these areas werebridged to the single-race categories of the 1977 OMB standards for comparability with other areas; see http://www.cdc.gov/nchs and refer to "Detailedtechnical notes to the United States 2007 data—mortality." For explanation of asterisks preceding cause-of-death codes, see http://www.cdc.gov/nchs andrefer to "Detailed technical notes to the United States 2007 data - mortality"]_____________________________________________________________________________________________________________________________________________________________
Cause of death (Based on theInternational Classificationof Diseases, Tenth Revision, Second All Under 1 1-4 5-9 10-14 15-19 20-24 25-29 30-34 35-39Edition, 2004), race, and sex ages 1/ Year 2/ years years years years years years years years______________________________________________________________________________________________________________________________________________________________
Malignant neoplasm of stomach (C16)
All races 3/, both sexes............. 3.8 * * * * * * 0.2 0.4 0.8 Male............................ 4.5 * * * * * * 0.3 0.3 0.8 Female.......................... 3.0 * * * * * * * 0.5 0.9 White, both sexes................... 3.5 * * * * * * 0.2 0.4 0.8 Male............................ 4.2 * * * * * * 0.3 0.3 0.8 Female.......................... 2.8 * * * * * * * 0.5 0.8 Black, both sexes................... 5.0 * * * * * * * * 0.9 Male............................ 6.2 * * * * * * * * * Female.......................... 3.9 * * * * * * * * *
Malignant neoplasms of colon, rectum and anus (C18-C21)
All races 3/, both sexes............. 17.8 * * * * * 0.1 0.5 0.9 1.9 Male............................ 18.2 * * * * * * 0.5 1.0 2.1 Female.......................... 17.3 * * * * * * 0.4 0.9 1.7 White, both sexes................... 18.5 * * * * * * 0.4 0.9 1.9 Male............................ 19.0 * * * * * * 0.4 1.0 2.0 Female.......................... 18.1 * * * * * * 0.4 0.8 1.7 Black, both sexes................... 17.3 * * * * * * 0.7 1.2 2.5 Male............................ 18.0 * * * * * * * * 3.1 Female.......................... 16.6 * * * * * * * * 2.0

19JUL10 Plate 1 of 2 Page 13
Worktable 210R. Death rates for 113 selected causes, alcohol-induced causes, drug-induced causes, and injury by firearms, by 5-year agegroups, race, and sex: United States, 2007
[Rates per 100,000 population in specified group. Rates based on populations estimated as of July 1, 2007. Race categories are consistentwith the 1977 Office of Management and Budget (OMB) standards. In 2007, multiple-race data were reported by California, Connecticut, Delaware, Districtof Columbia, Florida, Hawaii, Idaho, Kansas, Maine, Michigan, Minnesota, Montana, Nebraska, New Hampshire, New Jersey, New Mexico, New York, Ohio,Oklahoma, Oregon, Rhode Island, South Carolina, South Dakota, Texas, Utah, Washington, Wisconsin, and Wyoming. The multiple-race data for these areas werebridged to the single-race categories of the 1977 OMB standards for comparability with other areas; see http://www.cdc.gov/nchs and refer to "Detailedtechnical notes to the United States 2007 data—mortality." For explanation of asterisks preceding cause-of-death codes, see http://www.cdc.gov/nchs andrefer to "Detailed technical notes to the United States 2007 data - mortality"]_____________________________________________________________________________________________________________________________________________________________
Cause of death (Based on theInternational Classificationof Diseases, Tenth Revision, Second All Under 1 1-4 5-9 10-14 15-19 20-24 25-29 30-34 35-39Edition, 2004), race, and sex ages 1/ Year 2/ years years years years years years years years______________________________________________________________________________________________________________________________________________________________
Malignant neoplasms of liver and intrahepatic bile ducts (C22)
All races 3/, both sexes............. 5.7 * * * * * 0.1 0.2 0.3 0.5 Male............................ 7.6 * * * * * * 0.2 0.4 0.7 Female.......................... 3.8 * * * * * * * * 0.4 White, both sexes................... 5.6 * * * * * 0.1 0.1 0.2 0.4 Male............................ 7.4 * * * * * * * * 0.5 Female.......................... 3.8 * * * * * * * * 0.4 Black, both sexes................... 5.7 * * * * * * * * * Male............................ 8.3 * * * * * * * * * Female.......................... 3.2 * * * * * * * * *
Malignant neoplasm of pancreas (C25)
All races 3/, both sexes............. 11.3 * * * * * * * 0.2 0.6 Male............................ 11.5 * * * * * * * 0.3 0.8 Female.......................... 11.1 * * * * * * * * 0.5 White, both sexes................... 11.9 * * * * * * * 0.2 0.6 Male............................ 12.2 * * * * * * * * 0.8 Female.......................... 11.7 * * * * * * * * 0.4 Black, both sexes................... 10.2 * * * * * * * * 0.9 Male............................ 9.9 * * * * * * * * * Female.......................... 10.4 * * * * * * * * *
19JUL10 Plate 1 of 2 Page 14
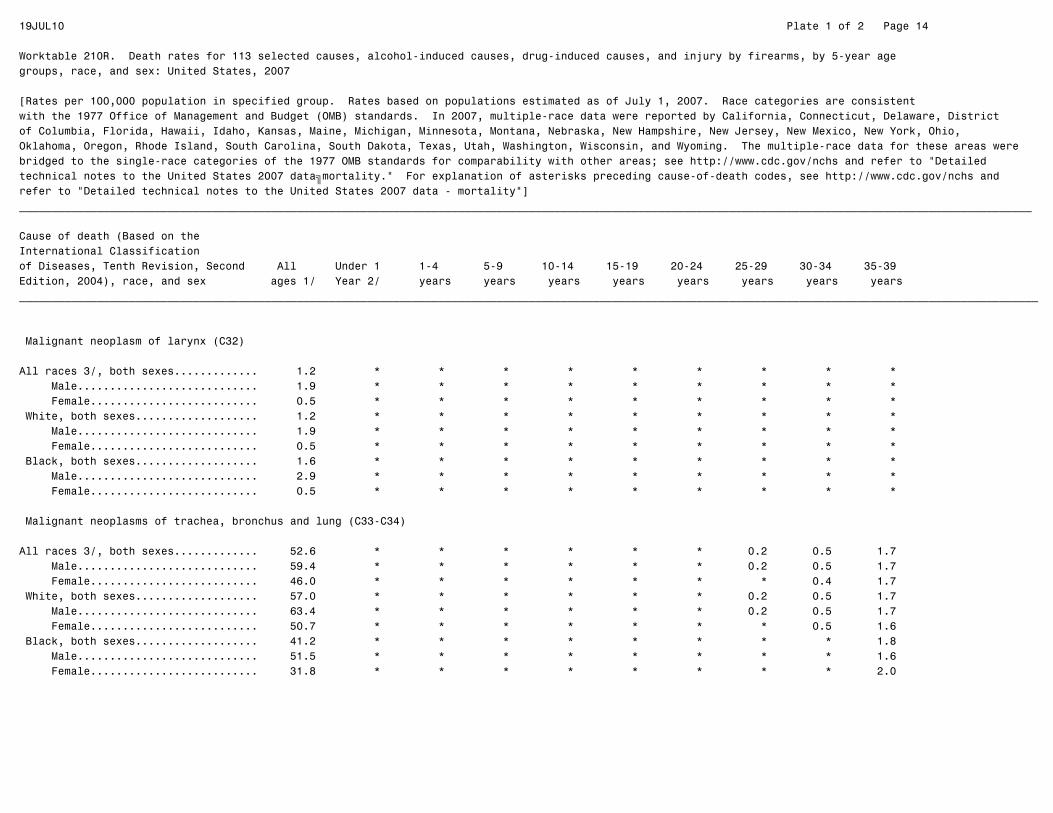
Worktable 210R. Death rates for 113 selected causes, alcohol-induced causes, drug-induced causes, and injury by firearms, by 5-year agegroups, race, and sex: United States, 2007
[Rates per 100,000 population in specified group. Rates based on populations estimated as of July 1, 2007. Race categories are consistentwith the 1977 Office of Management and Budget (OMB) standards. In 2007, multiple-race data were reported by California, Connecticut, Delaware, Districtof Columbia, Florida, Hawaii, Idaho, Kansas, Maine, Michigan, Minnesota, Montana, Nebraska, New Hampshire, New Jersey, New Mexico, New York, Ohio,Oklahoma, Oregon, Rhode Island, South Carolina, South Dakota, Texas, Utah, Washington, Wisconsin, and Wyoming. The multiple-race data for these areas werebridged to the single-race categories of the 1977 OMB standards for comparability with other areas; see http://www.cdc.gov/nchs and refer to "Detailedtechnical notes to the United States 2007 data—mortality." For explanation of asterisks preceding cause-of-death codes, see http://www.cdc.gov/nchs andrefer to "Detailed technical notes to the United States 2007 data - mortality"]_____________________________________________________________________________________________________________________________________________________________
Cause of death (Based on theInternational Classificationof Diseases, Tenth Revision, Second All Under 1 1-4 5-9 10-14 15-19 20-24 25-29 30-34 35-39Edition, 2004), race, and sex ages 1/ Year 2/ years years years years years years years years______________________________________________________________________________________________________________________________________________________________
Malignant neoplasm of larynx (C32)
All races 3/, both sexes............. 1.2 * * * * * * * * * Male............................ 1.9 * * * * * * * * * Female.......................... 0.5 * * * * * * * * * White, both sexes................... 1.2 * * * * * * * * * Male............................ 1.9 * * * * * * * * * Female.......................... 0.5 * * * * * * * * * Black, both sexes................... 1.6 * * * * * * * * * Male............................ 2.9 * * * * * * * * * Female.......................... 0.5 * * * * * * * * *
Malignant neoplasms of trachea, bronchus and lung (C33-C34)
All races 3/, both sexes............. 52.6 * * * * * * 0.2 0.5 1.7 Male............................ 59.4 * * * * * * 0.2 0.5 1.7 Female.......................... 46.0 * * * * * * * 0.4 1.7 White, both sexes................... 57.0 * * * * * * 0.2 0.5 1.7 Male............................ 63.4 * * * * * * 0.2 0.5 1.7 Female.......................... 50.7 * * * * * * * 0.5 1.6 Black, both sexes................... 41.2 * * * * * * * * 1.8 Male............................ 51.5 * * * * * * * * 1.6 Female.......................... 31.8 * * * * * * * * 2.0

19JUL10 Plate 1 of 2 Page 15
Worktable 210R. Death rates for 113 selected causes, alcohol-induced causes, drug-induced causes, and injury by firearms, by 5-year agegroups, race, and sex: United States, 2007
[Rates per 100,000 population in specified group. Rates based on populations estimated as of July 1, 2007. Race categories are consistentwith the 1977 Office of Management and Budget (OMB) standards. In 2007, multiple-race data were reported by California, Connecticut, Delaware, Districtof Columbia, Florida, Hawaii, Idaho, Kansas, Maine, Michigan, Minnesota, Montana, Nebraska, New Hampshire, New Jersey, New Mexico, New York, Ohio,Oklahoma, Oregon, Rhode Island, South Carolina, South Dakota, Texas, Utah, Washington, Wisconsin, and Wyoming. The multiple-race data for these areas werebridged to the single-race categories of the 1977 OMB standards for comparability with other areas; see http://www.cdc.gov/nchs and refer to "Detailedtechnical notes to the United States 2007 data—mortality." For explanation of asterisks preceding cause-of-death codes, see http://www.cdc.gov/nchs andrefer to "Detailed technical notes to the United States 2007 data - mortality"]_____________________________________________________________________________________________________________________________________________________________
Cause of death (Based on theInternational Classificationof Diseases, Tenth Revision, Second All Under 1 1-4 5-9 10-14 15-19 20-24 25-29 30-34 35-39Edition, 2004), race, and sex ages 1/ Year 2/ years years years years years years years years______________________________________________________________________________________________________________________________________________________________
Malignant melanoma of skin (C43)
All races 3/, both sexes............. 2.8 * * * * * 0.1 0.4 0.5 0.8 Male............................ 3.7 * * * * * * 0.4 0.6 0.8 Female.......................... 1.9 * * * * * * 0.4 0.4 0.7 White, both sexes................... 3.4 * * * * * 0.1 0.4 0.6 0.9 Male............................ 4.5 * * * * * * 0.4 0.7 1.0 Female.......................... 2.3 * * * * * * 0.5 0.6 0.8 Black, both sexes................... 0.3 * * * * * * * * * Male............................ 0.3 * * * * * * * * * Female.......................... 0.4 * * * * * * * * *
Malignant neoplasm of breast (C50)
All races 3/, both sexes............. 13.6 * * * * * * 0.3 1.4 3.5 Male............................ 0.2 * * * * * * * * * Female.......................... 26.5 * * * * * * 0.6 2.9 7.0 White, both sexes................... 14.0 * * * * * * 0.2 1.2 3.1 Male............................ 0.3 * * * * * * * * * Female.......................... 27.6 * * * * * * 0.5 2.4 6.3 Black, both sexes................... 14.6 * * * * * * 0.8 3.1 6.9 Male............................ 0.3 * * * * * * * * * Female.......................... 27.7 * * * * * * 1.6 5.9 13.0

19JUL10 Plate 1 of 2 Page 16
Worktable 210R. Death rates for 113 selected causes, alcohol-induced causes, drug-induced causes, and injury by firearms, by 5-year agegroups, race, and sex: United States, 2007
[Rates per 100,000 population in specified group. Rates based on populations estimated as of July 1, 2007. Race categories are consistentwith the 1977 Office of Management and Budget (OMB) standards. In 2007, multiple-race data were reported by California, Connecticut, Delaware, Districtof Columbia, Florida, Hawaii, Idaho, Kansas, Maine, Michigan, Minnesota, Montana, Nebraska, New Hampshire, New Jersey, New Mexico, New York, Ohio,Oklahoma, Oregon, Rhode Island, South Carolina, South Dakota, Texas, Utah, Washington, Wisconsin, and Wyoming. The multiple-race data for these areas werebridged to the single-race categories of the 1977 OMB standards for comparability with other areas; see http://www.cdc.gov/nchs and refer to "Detailedtechnical notes to the United States 2007 data—mortality." For explanation of asterisks preceding cause-of-death codes, see http://www.cdc.gov/nchs andrefer to "Detailed technical notes to the United States 2007 data - mortality"]_____________________________________________________________________________________________________________________________________________________________
Cause of death (Based on theInternational Classificationof Diseases, Tenth Revision, Second All Under 1 1-4 5-9 10-14 15-19 20-24 25-29 30-34 35-39Edition, 2004), race, and sex ages 1/ Year 2/ years years years years years years years years______________________________________________________________________________________________________________________________________________________________
Malignant neoplasm of cervix uteri (C53)
All races 3/, both sexes............. 1.3 * * * * * * 0.2 0.7 1.3 Male............................ ... ... ... ... ... ... ... ... ... ... Female.......................... 2.6 * * * * * * 0.5 1.4 2.6 White, both sexes................... 1.2 * * * * * * 0.2 0.6 1.3 Male............................ ... ... ... ... ... ... ... ... ... ... Female.......................... 2.5 * * * * * * 0.4 1.3 2.6 Black, both sexes................... 2.0 * * * * * * * 1.4 1.9 Male............................ ... ... ... ... ... ... ... ... ... ... Female.......................... 3.9 * * * * * * * 2.6 3.7
Malignant neoplasms of corpus uteri and uterus, part unspecified (C54-C55)
All races 3/, both sexes............. 2.5 * * * * * * * 0.1 0.3 Male............................ ... ... ... ... ... ... ... ... ... ... Female.......................... 4.9 * * * * * * * 0.2 0.6 White, both sexes................... 2.4 * * * * * * * * 0.3 Male............................ ... ... ... ... ... ... ... ... ... ... Female.......................... 4.9 * * * * * * * * 0.5 Black, both sexes................... 3.2 * * * * * * * * * Male............................ ... ... ... ... ... ... ... ... ... ... Female.......................... 6.2 * * * * * * * * *
19JUL10 Plate 1 of 2 Page 17
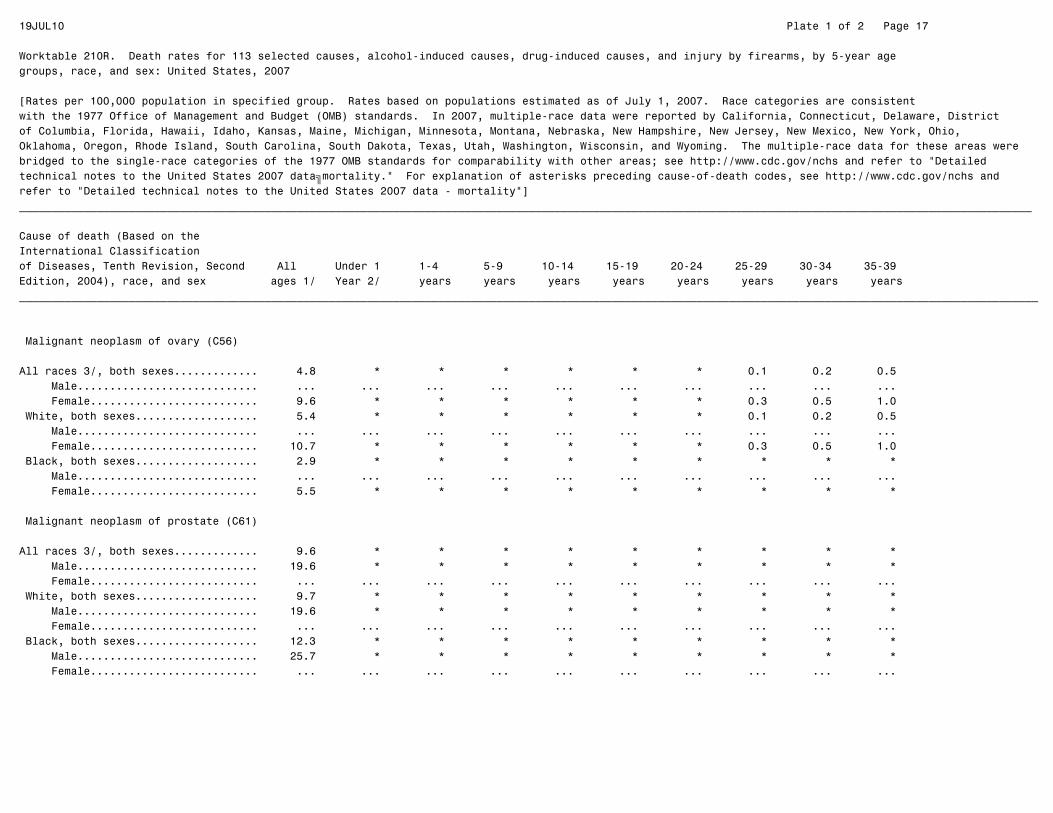
Worktable 210R. Death rates for 113 selected causes, alcohol-induced causes, drug-induced causes, and injury by firearms, by 5-year agegroups, race, and sex: United States, 2007
[Rates per 100,000 population in specified group. Rates based on populations estimated as of July 1, 2007. Race categories are consistentwith the 1977 Office of Management and Budget (OMB) standards. In 2007, multiple-race data were reported by California, Connecticut, Delaware, Districtof Columbia, Florida, Hawaii, Idaho, Kansas, Maine, Michigan, Minnesota, Montana, Nebraska, New Hampshire, New Jersey, New Mexico, New York, Ohio,Oklahoma, Oregon, Rhode Island, South Carolina, South Dakota, Texas, Utah, Washington, Wisconsin, and Wyoming. The multiple-race data for these areas werebridged to the single-race categories of the 1977 OMB standards for comparability with other areas; see http://www.cdc.gov/nchs and refer to "Detailedtechnical notes to the United States 2007 data—mortality." For explanation of asterisks preceding cause-of-death codes, see http://www.cdc.gov/nchs andrefer to "Detailed technical notes to the United States 2007 data - mortality"]_____________________________________________________________________________________________________________________________________________________________
Cause of death (Based on theInternational Classificationof Diseases, Tenth Revision, Second All Under 1 1-4 5-9 10-14 15-19 20-24 25-29 30-34 35-39Edition, 2004), race, and sex ages 1/ Year 2/ years years years years years years years years______________________________________________________________________________________________________________________________________________________________
Malignant neoplasm of ovary (C56)
All races 3/, both sexes............. 4.8 * * * * * * 0.1 0.2 0.5 Male............................ ... ... ... ... ... ... ... ... ... ... Female.......................... 9.6 * * * * * * 0.3 0.5 1.0 White, both sexes................... 5.4 * * * * * * 0.1 0.2 0.5 Male............................ ... ... ... ... ... ... ... ... ... ... Female.......................... 10.7 * * * * * * 0.3 0.5 1.0 Black, both sexes................... 2.9 * * * * * * * * * Male............................ ... ... ... ... ... ... ... ... ... ... Female.......................... 5.5 * * * * * * * * *
Malignant neoplasm of prostate (C61)
All races 3/, both sexes............. 9.6 * * * * * * * * * Male............................ 19.6 * * * * * * * * * Female.......................... ... ... ... ... ... ... ... ... ... ... White, both sexes................... 9.7 * * * * * * * * * Male............................ 19.6 * * * * * * * * * Female.......................... ... ... ... ... ... ... ... ... ... ... Black, both sexes................... 12.3 * * * * * * * * * Male............................ 25.7 * * * * * * * * * Female.......................... ... ... ... ... ... ... ... ... ... ...

19JUL10 Plate 1 of 2 Page 18
Worktable 210R. Death rates for 113 selected causes, alcohol-induced causes, drug-induced causes, and injury by firearms, by 5-year agegroups, race, and sex: United States, 2007
[Rates per 100,000 population in specified group. Rates based on populations estimated as of July 1, 2007. Race categories are consistentwith the 1977 Office of Management and Budget (OMB) standards. In 2007, multiple-race data were reported by California, Connecticut, Delaware, Districtof Columbia, Florida, Hawaii, Idaho, Kansas, Maine, Michigan, Minnesota, Montana, Nebraska, New Hampshire, New Jersey, New Mexico, New York, Ohio,Oklahoma, Oregon, Rhode Island, South Carolina, South Dakota, Texas, Utah, Washington, Wisconsin, and Wyoming. The multiple-race data for these areas werebridged to the single-race categories of the 1977 OMB standards for comparability with other areas; see http://www.cdc.gov/nchs and refer to "Detailedtechnical notes to the United States 2007 data—mortality." For explanation of asterisks preceding cause-of-death codes, see http://www.cdc.gov/nchs andrefer to "Detailed technical notes to the United States 2007 data - mortality"]_____________________________________________________________________________________________________________________________________________________________
Cause of death (Based on theInternational Classificationof Diseases, Tenth Revision, Second All Under 1 1-4 5-9 10-14 15-19 20-24 25-29 30-34 35-39Edition, 2004), race, and sex ages 1/ Year 2/ years years years years years years years years______________________________________________________________________________________________________________________________________________________________
Malignant neoplasms of kidney and renal pelvis (C64-C65)
All races 3/, both sexes............. 4.2 * * * * * 0.1 * 0.2 0.3 Male............................ 5.4 * * * * * * * 0.3 0.4 Female.......................... 3.1 * * * * * * * * 0.2 White, both sexes................... 4.6 * * * * * * * 0.2 0.3 Male............................ 5.8 * * * * * * * * 0.4 Female.......................... 3.4 * * * * * * * * * Black, both sexes................... 3.1 * * * * * * * * * Male............................ 3.9 * * * * * * * * * Female.......................... 2.3 * * * * * * * * *
Malignant neoplasm of bladder (C67)
All races 3/, both sexes............. 4.6 * * * * * * * * 0.1 Male............................ 6.5 * * * * * * * * * Female.......................... 2.7 * * * * * * * * * White, both sexes................... 5.2 * * * * * * * * 0.1 Male............................ 7.4 * * * * * * * * * Female.......................... 3.0 * * * * * * * * * Black, both sexes................... 2.6 * * * * * * * * * Male............................ 3.0 * * * * * * * * * Female.......................... 2.2 * * * * * * * * *

19JUL10 Plate 1 of 2 Page 19
Worktable 210R. Death rates for 113 selected causes, alcohol-induced causes, drug-induced causes, and injury by firearms, by 5-year agegroups, race, and sex: United States, 2007
[Rates per 100,000 population in specified group. Rates based on populations estimated as of July 1, 2007. Race categories are consistentwith the 1977 Office of Management and Budget (OMB) standards. In 2007, multiple-race data were reported by California, Connecticut, Delaware, Districtof Columbia, Florida, Hawaii, Idaho, Kansas, Maine, Michigan, Minnesota, Montana, Nebraska, New Hampshire, New Jersey, New Mexico, New York, Ohio,Oklahoma, Oregon, Rhode Island, South Carolina, South Dakota, Texas, Utah, Washington, Wisconsin, and Wyoming. The multiple-race data for these areas werebridged to the single-race categories of the 1977 OMB standards for comparability with other areas; see http://www.cdc.gov/nchs and refer to "Detailedtechnical notes to the United States 2007 data—mortality." For explanation of asterisks preceding cause-of-death codes, see http://www.cdc.gov/nchs andrefer to "Detailed technical notes to the United States 2007 data - mortality"]_____________________________________________________________________________________________________________________________________________________________
Cause of death (Based on theInternational Classificationof Diseases, Tenth Revision, Second All Under 1 1-4 5-9 10-14 15-19 20-24 25-29 30-34 35-39Edition, 2004), race, and sex ages 1/ Year 2/ years years years years years years years years______________________________________________________________________________________________________________________________________________________________
Malignant neoplasms of meninges, brain and other parts of central nervous system (C70-C72)
All races 3/, both sexes............. 4.4 * 0.7 0.9 0.6 0.4 0.5 0.7 1.2 1.5 Male............................ 4.9 * 0.7 0.8 0.6 0.4 0.6 0.9 1.4 2.0 Female.......................... 3.9 * 0.6 0.9 0.7 0.4 0.4 0.5 1.0 1.1 White, both sexes................... 5.0 * 0.7 1.0 0.7 0.5 0.5 0.7 1.3 1.8 Male............................ 5.6 * 0.8 0.9 0.6 0.5 0.6 0.9 1.4 2.2 Female.......................... 4.4 * 0.6 1.0 0.8 0.5 0.4 0.5 1.1 1.3 Black, both sexes................... 2.0 * * 0.6 0.6 * * * * * Male............................ 2.1 * * * * * * * * * Female.......................... 1.9 * * * * * * * * *
Malignant neoplasms of lymphoid, hematopoietic and related tissue (C81-C96)
All races 3/, both sexes............. 18.2 0.6 0.7 0.8 1.0 1.2 1.7 1.7 2.1 2.6 Male............................ 20.3 * 0.7 0.9 1.1 1.4 2.0 2.1 2.4 3.0 Female.......................... 16.2 * 0.7 0.6 0.9 1.1 1.4 1.4 1.7 2.1 White, both sexes................... 19.9 0.6 0.7 0.8 1.0 1.2 1.8 1.7 2.1 2.6 Male............................ 22.2 * 0.6 1.0 1.1 1.4 2.1 2.0 2.4 2.9 Female.......................... 17.6 * 0.7 0.6 0.9 1.0 1.4 1.4 1.7 2.2 Black, both sexes................... 13.1 * 0.7 * 1.0 1.2 1.7 2.2 2.4 3.2 Male............................ 13.9 * * * 1.2 1.3 2.0 2.6 2.6 4.1 Female.......................... 12.4 * * * * 1.1 1.4 1.9 2.3 2.5
19JUL10 Plate 1 of 2 Page 20
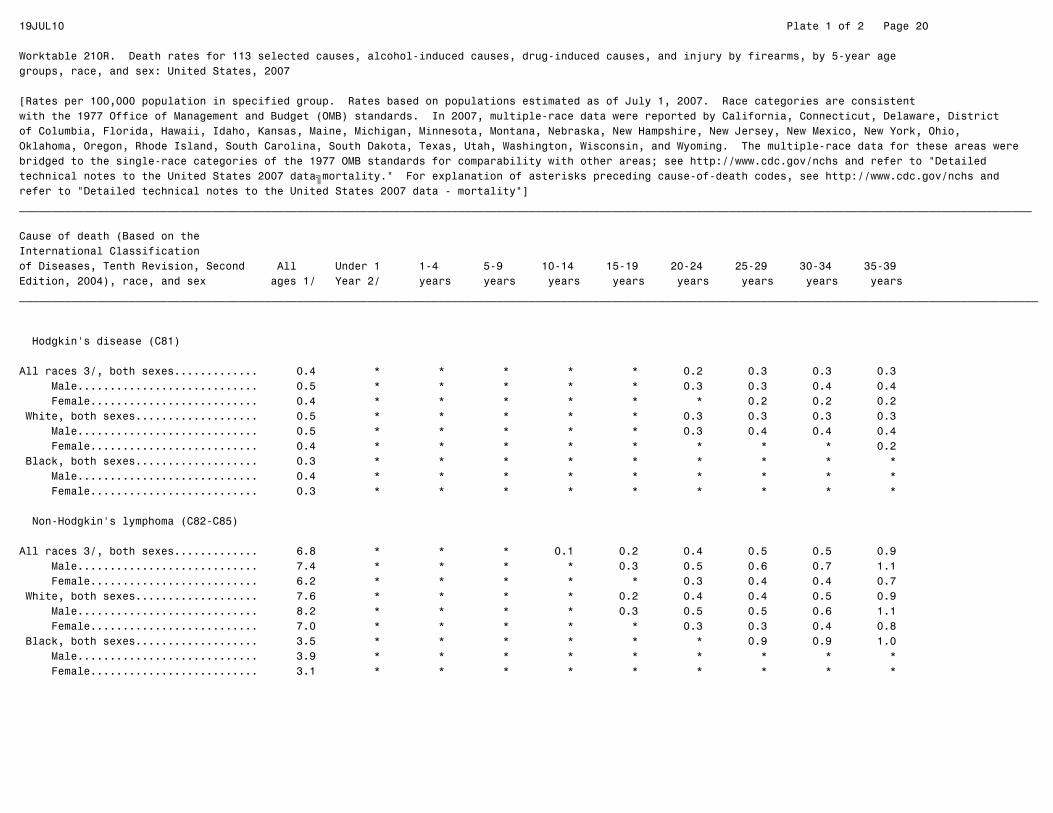
Worktable 210R. Death rates for 113 selected causes, alcohol-induced causes, drug-induced causes, and injury by firearms, by 5-year agegroups, race, and sex: United States, 2007
[Rates per 100,000 population in specified group. Rates based on populations estimated as of July 1, 2007. Race categories are consistentwith the 1977 Office of Management and Budget (OMB) standards. In 2007, multiple-race data were reported by California, Connecticut, Delaware, Districtof Columbia, Florida, Hawaii, Idaho, Kansas, Maine, Michigan, Minnesota, Montana, Nebraska, New Hampshire, New Jersey, New Mexico, New York, Ohio,Oklahoma, Oregon, Rhode Island, South Carolina, South Dakota, Texas, Utah, Washington, Wisconsin, and Wyoming. The multiple-race data for these areas werebridged to the single-race categories of the 1977 OMB standards for comparability with other areas; see http://www.cdc.gov/nchs and refer to "Detailedtechnical notes to the United States 2007 data—mortality." For explanation of asterisks preceding cause-of-death codes, see http://www.cdc.gov/nchs andrefer to "Detailed technical notes to the United States 2007 data - mortality"]_____________________________________________________________________________________________________________________________________________________________
Cause of death (Based on theInternational Classificationof Diseases, Tenth Revision, Second All Under 1 1-4 5-9 10-14 15-19 20-24 25-29 30-34 35-39Edition, 2004), race, and sex ages 1/ Year 2/ years years years years years years years years______________________________________________________________________________________________________________________________________________________________
Hodgkin's disease (C81)
All races 3/, both sexes............. 0.4 * * * * * 0.2 0.3 0.3 0.3 Male............................ 0.5 * * * * * 0.3 0.3 0.4 0.4 Female.......................... 0.4 * * * * * * 0.2 0.2 0.2 White, both sexes................... 0.5 * * * * * 0.3 0.3 0.3 0.3 Male............................ 0.5 * * * * * 0.3 0.4 0.4 0.4 Female.......................... 0.4 * * * * * * * * 0.2 Black, both sexes................... 0.3 * * * * * * * * * Male............................ 0.4 * * * * * * * * * Female.......................... 0.3 * * * * * * * * *
Non-Hodgkin's lymphoma (C82-C85)
All races 3/, both sexes............. 6.8 * * * 0.1 0.2 0.4 0.5 0.5 0.9 Male............................ 7.4 * * * * 0.3 0.5 0.6 0.7 1.1 Female.......................... 6.2 * * * * * 0.3 0.4 0.4 0.7 White, both sexes................... 7.6 * * * * 0.2 0.4 0.4 0.5 0.9 Male............................ 8.2 * * * * 0.3 0.5 0.5 0.6 1.1 Female.......................... 7.0 * * * * * 0.3 0.3 0.4 0.8 Black, both sexes................... 3.5 * * * * * * 0.9 0.9 1.0 Male............................ 3.9 * * * * * * * * * Female.......................... 3.1 * * * * * * * * *
19JUL10 Plate 1 of 2 Page 21
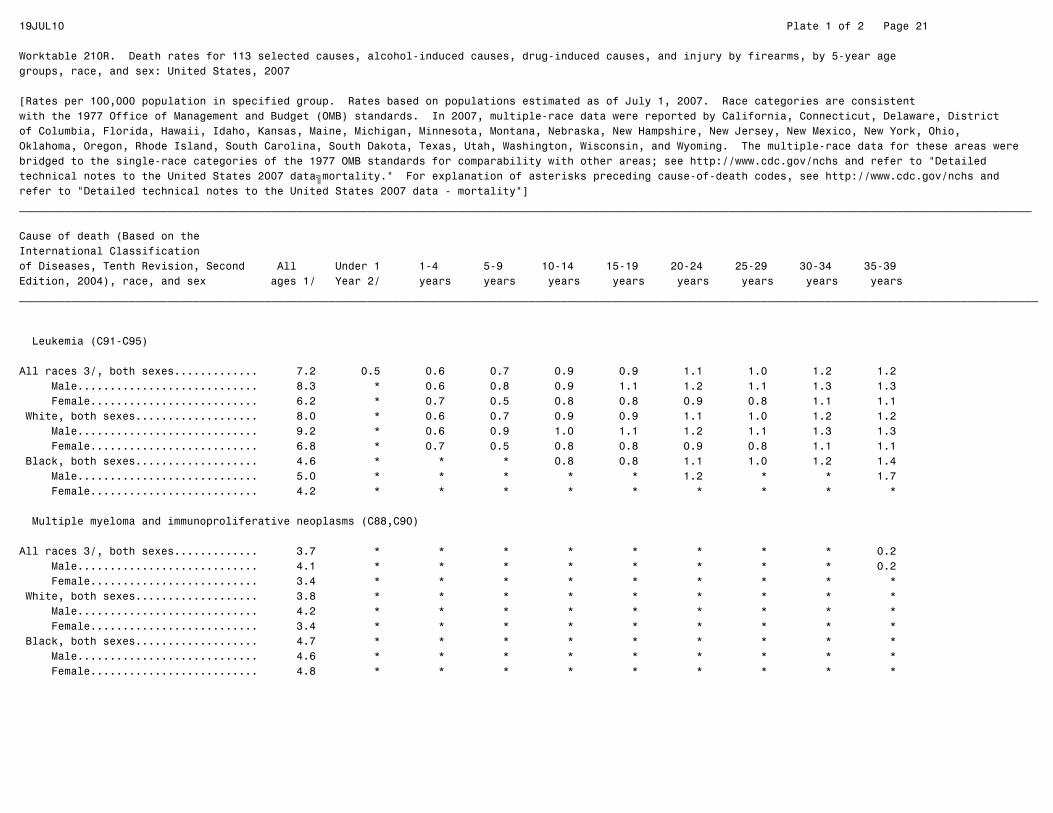
Worktable 210R. Death rates for 113 selected causes, alcohol-induced causes, drug-induced causes, and injury by firearms, by 5-year agegroups, race, and sex: United States, 2007
[Rates per 100,000 population in specified group. Rates based on populations estimated as of July 1, 2007. Race categories are consistentwith the 1977 Office of Management and Budget (OMB) standards. In 2007, multiple-race data were reported by California, Connecticut, Delaware, Districtof Columbia, Florida, Hawaii, Idaho, Kansas, Maine, Michigan, Minnesota, Montana, Nebraska, New Hampshire, New Jersey, New Mexico, New York, Ohio,Oklahoma, Oregon, Rhode Island, South Carolina, South Dakota, Texas, Utah, Washington, Wisconsin, and Wyoming. The multiple-race data for these areas werebridged to the single-race categories of the 1977 OMB standards for comparability with other areas; see http://www.cdc.gov/nchs and refer to "Detailedtechnical notes to the United States 2007 data—mortality." For explanation of asterisks preceding cause-of-death codes, see http://www.cdc.gov/nchs andrefer to "Detailed technical notes to the United States 2007 data - mortality"]_____________________________________________________________________________________________________________________________________________________________
Cause of death (Based on theInternational Classificationof Diseases, Tenth Revision, Second All Under 1 1-4 5-9 10-14 15-19 20-24 25-29 30-34 35-39Edition, 2004), race, and sex ages 1/ Year 2/ years years years years years years years years______________________________________________________________________________________________________________________________________________________________
Leukemia (C91-C95)
All races 3/, both sexes............. 7.2 0.5 0.6 0.7 0.9 0.9 1.1 1.0 1.2 1.2 Male............................ 8.3 * 0.6 0.8 0.9 1.1 1.2 1.1 1.3 1.3 Female.......................... 6.2 * 0.7 0.5 0.8 0.8 0.9 0.8 1.1 1.1 White, both sexes................... 8.0 * 0.6 0.7 0.9 0.9 1.1 1.0 1.2 1.2 Male............................ 9.2 * 0.6 0.9 1.0 1.1 1.2 1.1 1.3 1.3 Female.......................... 6.8 * 0.7 0.5 0.8 0.8 0.9 0.8 1.1 1.1 Black, both sexes................... 4.6 * * * 0.8 0.8 1.1 1.0 1.2 1.4 Male............................ 5.0 * * * * * 1.2 * * 1.7 Female.......................... 4.2 * * * * * * * * *
Multiple myeloma and immunoproliferative neoplasms (C88,C90)
All races 3/, both sexes............. 3.7 * * * * * * * * 0.2 Male............................ 4.1 * * * * * * * * 0.2 Female.......................... 3.4 * * * * * * * * * White, both sexes................... 3.8 * * * * * * * * * Male............................ 4.2 * * * * * * * * * Female.......................... 3.4 * * * * * * * * * Black, both sexes................... 4.7 * * * * * * * * * Male............................ 4.6 * * * * * * * * * Female.......................... 4.8 * * * * * * * * *

19JUL10 Plate 1 of 2 Page 22
Worktable 210R. Death rates for 113 selected causes, alcohol-induced causes, drug-induced causes, and injury by firearms, by 5-year agegroups, race, and sex: United States, 2007
[Rates per 100,000 population in specified group. Rates based on populations estimated as of July 1, 2007. Race categories are consistentwith the 1977 Office of Management and Budget (OMB) standards. In 2007, multiple-race data were reported by California, Connecticut, Delaware, Districtof Columbia, Florida, Hawaii, Idaho, Kansas, Maine, Michigan, Minnesota, Montana, Nebraska, New Hampshire, New Jersey, New Mexico, New York, Ohio,Oklahoma, Oregon, Rhode Island, South Carolina, South Dakota, Texas, Utah, Washington, Wisconsin, and Wyoming. The multiple-race data for these areas werebridged to the single-race categories of the 1977 OMB standards for comparability with other areas; see http://www.cdc.gov/nchs and refer to "Detailedtechnical notes to the United States 2007 data—mortality." For explanation of asterisks preceding cause-of-death codes, see http://www.cdc.gov/nchs andrefer to "Detailed technical notes to the United States 2007 data - mortality"]_____________________________________________________________________________________________________________________________________________________________
Cause of death (Based on theInternational Classificationof Diseases, Tenth Revision, Second All Under 1 1-4 5-9 10-14 15-19 20-24 25-29 30-34 35-39Edition, 2004), race, and sex ages 1/ Year 2/ years years years years years years years years______________________________________________________________________________________________________________________________________________________________
Other and unspecified malignant neoplasms of lymphoid, hematopoietic and related tissue (C96)
All races 3/, both sexes............. 0.0 * * * * * * * * * Male............................ 0.0 * * * * * * * * * Female.......................... 0.0 * * * * * * * * * White, both sexes................... 0.0 * * * * * * * * * Male............................ 0.0 * * * * * * * * * Female.......................... 0.0 * * * * * * * * * Black, both sexes................... * * * * * * * * * * Male............................ * * * * * * * * * * Female.......................... * * * * * * * * * *
All other and unspecified malignant neoplasms (C17,C23-C24,C26-C31,C37-C41,C44-C49,C51-C52,C57-C60,C62-C63,C66,C68-C69,C73-C80,C97)
All races 3/, both sexes............. 21.0 0.5 0.7 0.6 0.6 1.1 1.5 1.5 2.0 2.9 Male............................ 22.1 * 0.7 0.6 0.5 1.4 2.0 1.8 2.4 3.1 Female.......................... 19.8 * 0.7 0.6 0.7 0.8 1.0 1.1 1.5 2.8 White, both sexes................... 22.5 * 0.7 0.6 0.6 1.1 1.5 1.5 1.9 2.9 Male............................ 23.7 * 0.6 0.6 0.6 1.4 2.1 1.8 2.3 3.0 Female.......................... 21.3 * 0.7 0.7 0.7 0.8 1.0 1.1 1.5 2.7 Black, both sexes................... 16.7 * 0.7 0.6 0.6 1.0 1.6 1.4 2.8 3.7 Male............................ 17.5 * * * * 1.2 1.7 1.6 3.8 4.3 Female.......................... 15.9 * * * * * 1.5 * 1.9 3.2

19JUL10 Plate 1 of 2 Page 23
Worktable 210R. Death rates for 113 selected causes, alcohol-induced causes, drug-induced causes, and injury by firearms, by 5-year agegroups, race, and sex: United States, 2007
[Rates per 100,000 population in specified group. Rates based on populations estimated as of July 1, 2007. Race categories are consistentwith the 1977 Office of Management and Budget (OMB) standards. In 2007, multiple-race data were reported by California, Connecticut, Delaware, Districtof Columbia, Florida, Hawaii, Idaho, Kansas, Maine, Michigan, Minnesota, Montana, Nebraska, New Hampshire, New Jersey, New Mexico, New York, Ohio,Oklahoma, Oregon, Rhode Island, South Carolina, South Dakota, Texas, Utah, Washington, Wisconsin, and Wyoming. The multiple-race data for these areas werebridged to the single-race categories of the 1977 OMB standards for comparability with other areas; see http://www.cdc.gov/nchs and refer to "Detailedtechnical notes to the United States 2007 data—mortality." For explanation of asterisks preceding cause-of-death codes, see http://www.cdc.gov/nchs andrefer to "Detailed technical notes to the United States 2007 data - mortality"]_____________________________________________________________________________________________________________________________________________________________
Cause of death (Based on theInternational Classificationof Diseases, Tenth Revision, Second All Under 1 1-4 5-9 10-14 15-19 20-24 25-29 30-34 35-39Edition, 2004), race, and sex ages 1/ Year 2/ years years years years years years years years______________________________________________________________________________________________________________________________________________________________
In situ neoplasms, benign neoplasms and neoplasms of uncertain or unknown behavior (D00-D48)
All races 3/, both sexes............. 4.7 1.4 0.4 0.2 0.2 0.1 0.2 0.3 0.3 0.7 Male............................ 4.9 1.1 0.3 0.2 0.3 * 0.2 0.4 0.4 0.7 Female.......................... 4.5 1.7 0.4 0.2 * * 0.2 0.2 0.3 0.7 White, both sexes................... 5.2 1.4 0.4 0.2 0.2 0.1 0.2 0.3 0.3 0.6 Male............................ 5.4 * 0.4 * * * * 0.4 0.4 0.6 Female.......................... 5.0 1.8 0.4 * * * * * 0.3 0.7 Black, both sexes................... 3.0 * * * * * * * * 1.0 Male............................ 3.1 * * * * * * * * * Female.......................... 2.9 * * * * * * * * *
Anemias (D50-D64)
All races 3/, both sexes............. 1.6 * * * * 0.2 0.3 0.3 0.3 0.4 Male............................ 1.3 * * * * * 0.3 0.4 0.3 0.4 Female.......................... 1.9 * * * * 0.2 0.2 0.3 0.3 0.3 White, both sexes................... 1.5 * * * * * * * * * Male............................ 1.2 * * * * * * * * * Female.......................... 1.9 * * * * * * * * * Black, both sexes................... 2.4 * * * * 0.7 1.3 1.7 1.9 2.3 Male............................ 2.3 * * * * * 1.5 2.0 2.0 2.7 Female.......................... 2.5 * * * * * * 1.4 1.7 1.9

19JUL10 Plate 1 of 2 Page 24
Worktable 210R. Death rates for 113 selected causes, alcohol-induced causes, drug-induced causes, and injury by firearms, by 5-year agegroups, race, and sex: United States, 2007
[Rates per 100,000 population in specified group. Rates based on populations estimated as of July 1, 2007. Race categories are consistentwith the 1977 Office of Management and Budget (OMB) standards. In 2007, multiple-race data were reported by California, Connecticut, Delaware, Districtof Columbia, Florida, Hawaii, Idaho, Kansas, Maine, Michigan, Minnesota, Montana, Nebraska, New Hampshire, New Jersey, New Mexico, New York, Ohio,Oklahoma, Oregon, Rhode Island, South Carolina, South Dakota, Texas, Utah, Washington, Wisconsin, and Wyoming. The multiple-race data for these areas werebridged to the single-race categories of the 1977 OMB standards for comparability with other areas; see http://www.cdc.gov/nchs and refer to "Detailedtechnical notes to the United States 2007 data—mortality." For explanation of asterisks preceding cause-of-death codes, see http://www.cdc.gov/nchs andrefer to "Detailed technical notes to the United States 2007 data - mortality"]_____________________________________________________________________________________________________________________________________________________________
Cause of death (Based on theInternational Classificationof Diseases, Tenth Revision, Second All Under 1 1-4 5-9 10-14 15-19 20-24 25-29 30-34 35-39Edition, 2004), race, and sex ages 1/ Year 2/ years years years years years years years years______________________________________________________________________________________________________________________________________________________________
Diabetes mellitus (E10-E14)
All races 3/, both sexes............. 23.7 * * * * 0.3 0.5 1.0 2.0 3.5 Male............................ 23.9 * * * * 0.3 0.6 1.1 2.4 4.5 Female.......................... 23.5 * * * * 0.2 0.5 0.9 1.7 2.6 White, both sexes................... 23.2 * * * * 0.2 0.5 0.8 1.6 3.0 Male............................ 23.8 * * * * 0.3 0.6 0.9 2.0 3.8 Female.......................... 22.5 * * * * * 0.3 0.6 1.3 2.1 Black, both sexes................... 31.1 * * * * 0.6 1.1 2.7 4.9 7.6 Male............................ 28.7 * * * * * * 2.8 5.8 9.5 Female.......................... 33.3 * * * * * 1.4 2.6 4.0 6.0
Nutritional deficiencies (E40-E64)
All races 3/, both sexes............. 0.9 * * * * * * * * * Male............................ 0.7 * * * * * * * * * Female.......................... 1.2 * * * * * * * * * White, both sexes................... 1.0 * * * * * * * * * Male............................ 0.7 * * * * * * * * * Female.......................... 1.2 * * * * * * * * * Black, both sexes................... 1.0 * * * * * * * * * Male............................ 0.9 * * * * * * * * * Female.......................... 1.1 * * * * * * * * *

19JUL10 Plate 1 of 2 Page 25
Worktable 210R. Death rates for 113 selected causes, alcohol-induced causes, drug-induced causes, and injury by firearms, by 5-year agegroups, race, and sex: United States, 2007
[Rates per 100,000 population in specified group. Rates based on populations estimated as of July 1, 2007. Race categories are consistentwith the 1977 Office of Management and Budget (OMB) standards. In 2007, multiple-race data were reported by California, Connecticut, Delaware, Districtof Columbia, Florida, Hawaii, Idaho, Kansas, Maine, Michigan, Minnesota, Montana, Nebraska, New Hampshire, New Jersey, New Mexico, New York, Ohio,Oklahoma, Oregon, Rhode Island, South Carolina, South Dakota, Texas, Utah, Washington, Wisconsin, and Wyoming. The multiple-race data for these areas werebridged to the single-race categories of the 1977 OMB standards for comparability with other areas; see http://www.cdc.gov/nchs and refer to "Detailedtechnical notes to the United States 2007 data—mortality." For explanation of asterisks preceding cause-of-death codes, see http://www.cdc.gov/nchs andrefer to "Detailed technical notes to the United States 2007 data - mortality"]_____________________________________________________________________________________________________________________________________________________________
Cause of death (Based on theInternational Classificationof Diseases, Tenth Revision, Second All Under 1 1-4 5-9 10-14 15-19 20-24 25-29 30-34 35-39Edition, 2004), race, and sex ages 1/ Year 2/ years years years years years years years years______________________________________________________________________________________________________________________________________________________________
Malnutrition (E40-E46)
All races 3/, both sexes............. 0.9 * * * * * * * * * Male............................ 0.7 * * * * * * * * * Female.......................... 1.1 * * * * * * * * * White, both sexes................... 0.9 * * * * * * * * * Male............................ 0.7 * * * * * * * * * Female.......................... 1.1 * * * * * * * * * Black, both sexes................... 0.9 * * * * * * * * * Male............................ 0.8 * * * * * * * * * Female.......................... 1.0 * * * * * * * * *
Other nutritional deficiencies (E50-E64)
All races 3/, both sexes............. 0.1 * * * * * * * * * Male............................ 0.1 * * * * * * * * * Female.......................... 0.1 * * * * * * * * * White, both sexes................... 0.1 * * * * * * * * * Male............................ 0.1 * * * * * * * * * Female.......................... 0.1 * * * * * * * * * Black, both sexes................... * * * * * * * * * * Male............................ * * * * * * * * * * Female.......................... * * * * * * * * * *

19JUL10 Plate 1 of 2 Page 26
Worktable 210R. Death rates for 113 selected causes, alcohol-induced causes, drug-induced causes, and injury by firearms, by 5-year agegroups, race, and sex: United States, 2007
[Rates per 100,000 population in specified group. Rates based on populations estimated as of July 1, 2007. Race categories are consistentwith the 1977 Office of Management and Budget (OMB) standards. In 2007, multiple-race data were reported by California, Connecticut, Delaware, Districtof Columbia, Florida, Hawaii, Idaho, Kansas, Maine, Michigan, Minnesota, Montana, Nebraska, New Hampshire, New Jersey, New Mexico, New York, Ohio,Oklahoma, Oregon, Rhode Island, South Carolina, South Dakota, Texas, Utah, Washington, Wisconsin, and Wyoming. The multiple-race data for these areas werebridged to the single-race categories of the 1977 OMB standards for comparability with other areas; see http://www.cdc.gov/nchs and refer to "Detailedtechnical notes to the United States 2007 data—mortality." For explanation of asterisks preceding cause-of-death codes, see http://www.cdc.gov/nchs andrefer to "Detailed technical notes to the United States 2007 data - mortality"]_____________________________________________________________________________________________________________________________________________________________
Cause of death (Based on theInternational Classificationof Diseases, Tenth Revision, Second All Under 1 1-4 5-9 10-14 15-19 20-24 25-29 30-34 35-39Edition, 2004), race, and sex ages 1/ Year 2/ years years years years years years years years______________________________________________________________________________________________________________________________________________________________
Meningitis (G00,G03)
All races 3/, both sexes............. 0.2 1.9 * * * * 0.1 * * 0.2 Male............................ 0.2 1.6 * * * * * * * 0.2 Female.......................... 0.2 2.3 * * * * * * * * White, both sexes................... 0.2 1.6 * * * * * * * 0.2 Male............................ 0.2 * * * * * * * * * Female.......................... 0.2 2.0 * * * * * * * * Black, both sexes................... 0.3 3.2 * * * * * * * * Male............................ 0.4 * * * * * * * * * Female.......................... 0.3 * * * * * * * * *
Parkinson's disease (G20-G21)
All races 3/, both sexes............. 6.7 * * * * * * * * * Male............................ 7.8 * * * * * * * * * Female.......................... 5.6 * * * * * * * * * White, both sexes................... 7.7 * * * * * * * * * Male............................ 9.0 * * * * * * * * * Female.......................... 6.5 * * * * * * * * * Black, both sexes................... 2.0 * * * * * * * * * Male............................ 2.3 * * * * * * * * * Female.......................... 1.7 * * * * * * * * *
19JUL10 Plate 1 of 2 Page 27
Worktable 210R. Death rates for 113 selected causes, alcohol-induced causes, drug-induced causes, and injury by firearms, by 5-year agegroups, race, and sex: United States, 2007
[Rates per 100,000 population in specified group. Rates based on populations estimated as of July 1, 2007. Race categories are consistentwith the 1977 Office of Management and Budget (OMB) standards. In 2007, multiple-race data were reported by California, Connecticut, Delaware, Districtof Columbia, Florida, Hawaii, Idaho, Kansas, Maine, Michigan, Minnesota, Montana, Nebraska, New Hampshire, New Jersey, New Mexico, New York, Ohio,Oklahoma, Oregon, Rhode Island, South Carolina, South Dakota, Texas, Utah, Washington, Wisconsin, and Wyoming. The multiple-race data for these areas werebridged to the single-race categories of the 1977 OMB standards for comparability with other areas; see http://www.cdc.gov/nchs and refer to "Detailedtechnical notes to the United States 2007 data—mortality." For explanation of asterisks preceding cause-of-death codes, see http://www.cdc.gov/nchs andrefer to "Detailed technical notes to the United States 2007 data - mortality"]_____________________________________________________________________________________________________________________________________________________________
Cause of death (Based on theInternational Classificationof Diseases, Tenth Revision, Second All Under 1 1-4 5-9 10-14 15-19 20-24 25-29 30-34 35-39Edition, 2004), race, and sex ages 1/ Year 2/ years years years years years years years years______________________________________________________________________________________________________________________________________________________________
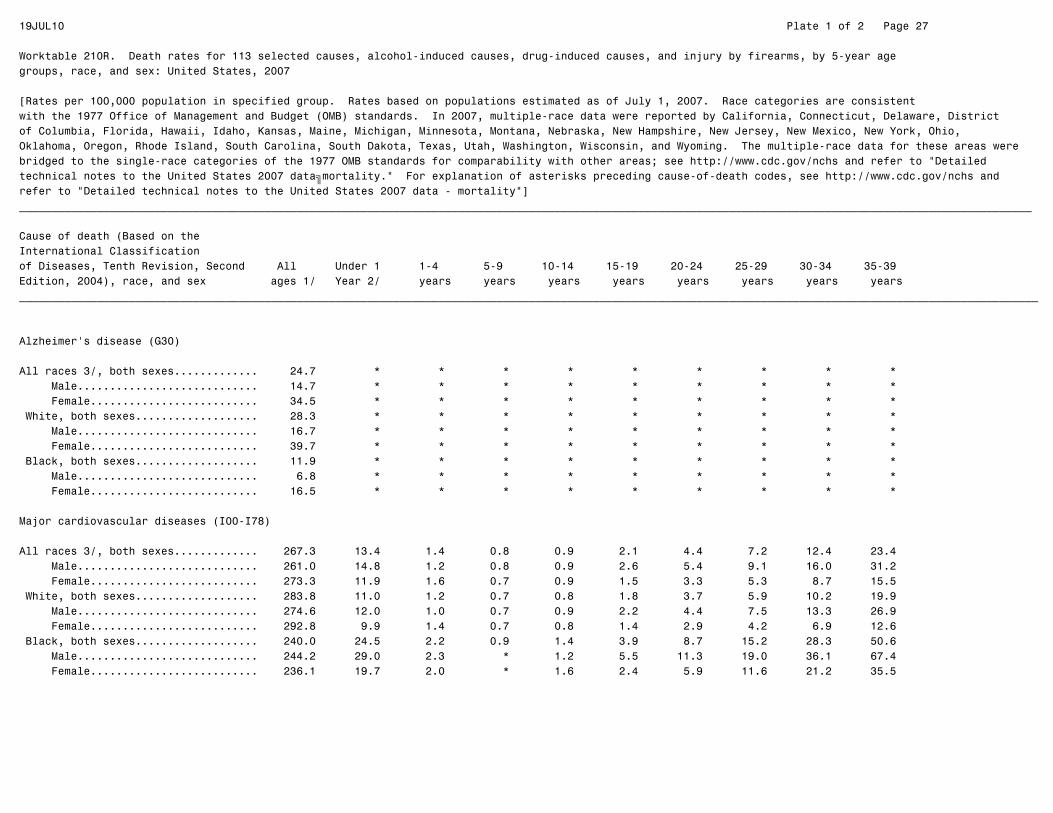
Alzheimer's disease (G30)
All races 3/, both sexes............. 24.7 * * * * * * * * * Male............................ 14.7 * * * * * * * * * Female.......................... 34.5 * * * * * * * * * White, both sexes................... 28.3 * * * * * * * * * Male............................ 16.7 * * * * * * * * * Female.......................... 39.7 * * * * * * * * * Black, both sexes................... 11.9 * * * * * * * * * Male............................ 6.8 * * * * * * * * * Female.......................... 16.5 * * * * * * * * *
Major cardiovascular diseases (I00-I78)
All races 3/, both sexes............. 267.3 13.4 1.4 0.8 0.9 2.1 4.4 7.2 12.4 23.4 Male............................ 261.0 14.8 1.2 0.8 0.9 2.6 5.4 9.1 16.0 31.2 Female.......................... 273.3 11.9 1.6 0.7 0.9 1.5 3.3 5.3 8.7 15.5 White, both sexes................... 283.8 11.0 1.2 0.7 0.8 1.8 3.7 5.9 10.2 19.9 Male............................ 274.6 12.0 1.0 0.7 0.9 2.2 4.4 7.5 13.3 26.9 Female.......................... 292.8 9.9 1.4 0.7 0.8 1.4 2.9 4.2 6.9 12.6 Black, both sexes................... 240.0 24.5 2.2 0.9 1.4 3.9 8.7 15.2 28.3 50.6 Male............................ 244.2 29.0 2.3 * 1.2 5.5 11.3 19.0 36.1 67.4 Female.......................... 236.1 19.7 2.0 * 1.6 2.4 5.9 11.6 21.2 35.5

19JUL10 Plate 1 of 2 Page 28
Worktable 210R. Death rates for 113 selected causes, alcohol-induced causes, drug-induced causes, and injury by firearms, by 5-year agegroups, race, and sex: United States, 2007
[Rates per 100,000 population in specified group. Rates based on populations estimated as of July 1, 2007. Race categories are consistentwith the 1977 Office of Management and Budget (OMB) standards. In 2007, multiple-race data were reported by California, Connecticut, Delaware, Districtof Columbia, Florida, Hawaii, Idaho, Kansas, Maine, Michigan, Minnesota, Montana, Nebraska, New Hampshire, New Jersey, New Mexico, New York, Ohio,Oklahoma, Oregon, Rhode Island, South Carolina, South Dakota, Texas, Utah, Washington, Wisconsin, and Wyoming. The multiple-race data for these areas werebridged to the single-race categories of the 1977 OMB standards for comparability with other areas; see http://www.cdc.gov/nchs and refer to "Detailedtechnical notes to the United States 2007 data—mortality." For explanation of asterisks preceding cause-of-death codes, see http://www.cdc.gov/nchs andrefer to "Detailed technical notes to the United States 2007 data - mortality"]_____________________________________________________________________________________________________________________________________________________________
Cause of death (Based on theInternational Classificationof Diseases, Tenth Revision, Second All Under 1 1-4 5-9 10-14 15-19 20-24 25-29 30-34 35-39Edition, 2004), race, and sex ages 1/ Year 2/ years years years years years years years years______________________________________________________________________________________________________________________________________________________________
Diseases of heart (I00-I09,I11,I13,I20-I51)
All races 3/, both sexes............. 204.3 10.0 1.1 0.6 0.6 1.6 3.5 6.0 10.0 18.4 Male............................ 208.4 10.9 1.0 0.6 0.7 2.1 4.3 7.9 13.4 25.4 Female.......................... 200.2 9.0 1.1 0.5 0.6 1.1 2.6 4.1 6.5 11.3 White, both sexes................... 218.3 7.7 0.9 0.5 0.6 1.3 2.9 4.9 8.3 15.9 Male............................ 221.1 8.5 0.7 0.5 0.6 1.7 3.5 6.3 11.4 22.2 Female.......................... 215.5 6.9 1.0 0.5 0.5 1.0 2.3 3.3 5.1 9.4 Black, both sexes................... 177.9 19.4 1.6 0.7 1.2 3.2 7.3 13.1 22.3 38.6 Male............................ 186.5 21.6 2.0 * * 4.5 9.5 17.2 29.5 52.8 Female.......................... 170.0 17.1 * * 1.3 1.9 5.1 9.3 15.8 25.9
Acute rheumatic fever and chronic rheumatic heart diseases (I00-I09)
All races 3/, both sexes............. 1.1 * * * * * * * * 0.1 Male............................ 0.7 * * * * * * * * * Female.......................... 1.4 * * * * * * * * * White, both sexes................... 1.2 * * * * * * * * * Male............................ 0.8 * * * * * * * * * Female.......................... 1.6 * * * * * * * * * Black, both sexes................... 0.6 * * * * * * * * * Male............................ 0.4 * * * * * * * * * Female.......................... 0.8 * * * * * * * * *

19JUL10 Plate 1 of 2 Page 29
Worktable 210R. Death rates for 113 selected causes, alcohol-induced causes, drug-induced causes, and injury by firearms, by 5-year agegroups, race, and sex: United States, 2007
[Rates per 100,000 population in specified group. Rates based on populations estimated as of July 1, 2007. Race categories are consistentwith the 1977 Office of Management and Budget (OMB) standards. In 2007, multiple-race data were reported by California, Connecticut, Delaware, Districtof Columbia, Florida, Hawaii, Idaho, Kansas, Maine, Michigan, Minnesota, Montana, Nebraska, New Hampshire, New Jersey, New Mexico, New York, Ohio,Oklahoma, Oregon, Rhode Island, South Carolina, South Dakota, Texas, Utah, Washington, Wisconsin, and Wyoming. The multiple-race data for these areas werebridged to the single-race categories of the 1977 OMB standards for comparability with other areas; see http://www.cdc.gov/nchs and refer to "Detailedtechnical notes to the United States 2007 data—mortality." For explanation of asterisks preceding cause-of-death codes, see http://www.cdc.gov/nchs andrefer to "Detailed technical notes to the United States 2007 data - mortality"]_____________________________________________________________________________________________________________________________________________________________
Cause of death (Based on theInternational Classificationof Diseases, Tenth Revision, Second All Under 1 1-4 5-9 10-14 15-19 20-24 25-29 30-34 35-39Edition, 2004), race, and sex ages 1/ Year 2/ years years years years years years years years______________________________________________________________________________________________________________________________________________________________
Hypertensive heart disease (I11)
All races 3/, both sexes............. 10.2 * * * * * 0.2 0.5 1.1 2.1 Male............................ 9.6 * * * * * 0.3 0.8 1.6 3.0 Female.......................... 10.8 * * * * * * 0.3 0.7 1.2 White, both sexes................... 9.4 * * * * * * 0.4 0.7 1.4 Male............................ 8.5 * * * * * * 0.5 1.0 2.1 Female.......................... 10.4 * * * * * * * 0.4 0.6 Black, both sexes................... 17.8 * * * * * 0.7 1.5 4.3 6.9 Male............................ 19.2 * * * * * * 2.3 5.9 9.8 Female.......................... 16.4 * * * * * * * 2.9 4.4
Hypertensive heart and renal disease (I13)
All races 3/, both sexes............. 1.0 * * * * * * * 0.1 0.2 Male............................ 0.9 * * * * * * * * 0.2 Female.......................... 1.1 * * * * * * * * * White, both sexes................... 0.8 * * * * * * * * * Male............................ 0.7 * * * * * * * * * Female.......................... 1.0 * * * * * * * * * Black, both sexes................... 2.1 * * * * * * * * 0.9 Male............................ 2.2 * * * * * * * * * Female.......................... 2.0 * * * * * * * * *

19JUL10 Plate 1 of 2 Page 30
Worktable 210R. Death rates for 113 selected causes, alcohol-induced causes, drug-induced causes, and injury by firearms, by 5-year agegroups, race, and sex: United States, 2007
[Rates per 100,000 population in specified group. Rates based on populations estimated as of July 1, 2007. Race categories are consistentwith the 1977 Office of Management and Budget (OMB) standards. In 2007, multiple-race data were reported by California, Connecticut, Delaware, Districtof Columbia, Florida, Hawaii, Idaho, Kansas, Maine, Michigan, Minnesota, Montana, Nebraska, New Hampshire, New Jersey, New Mexico, New York, Ohio,Oklahoma, Oregon, Rhode Island, South Carolina, South Dakota, Texas, Utah, Washington, Wisconsin, and Wyoming. The multiple-race data for these areas werebridged to the single-race categories of the 1977 OMB standards for comparability with other areas; see http://www.cdc.gov/nchs and refer to "Detailedtechnical notes to the United States 2007 data—mortality." For explanation of asterisks preceding cause-of-death codes, see http://www.cdc.gov/nchs andrefer to "Detailed technical notes to the United States 2007 data - mortality"]_____________________________________________________________________________________________________________________________________________________________
Cause of death (Based on theInternational Classificationof Diseases, Tenth Revision, Second All Under 1 1-4 5-9 10-14 15-19 20-24 25-29 30-34 35-39Edition, 2004), race, and sex ages 1/ Year 2/ years years years years years years years years______________________________________________________________________________________________________________________________________________________________
Ischemic heart diseases (I20-I25)
All races 3/, both sexes............. 134.7 0.6 * * * 0.2 0.5 1.6 3.7 8.4 Male............................ 145.3 * * * * 0.2 0.7 2.3 5.7 12.6 Female.......................... 124.4 * * * * * 0.3 0.8 1.6 4.2 White, both sexes................... 145.5 * * * * 0.2 0.4 1.4 3.4 8.1 Male............................ 156.6 * * * * * 0.6 2.0 5.2 12.1 Female.......................... 134.7 * * * * * * 0.7 1.5 3.9 Black, both sexes................... 106.6 * * * * * 1.1 2.9 6.3 12.8 Male............................ 113.8 * * * * * 1.5 4.2 10.1 18.7 Female.......................... 100.0 * * * * * * 1.5 2.8 7.5
Acute myocardial infarction (I21-I22)
All races 3/, both sexes............. 44.1 * * * * * 0.2 0.6 1.4 3.2 Male............................ 48.2 * * * * * 0.2 0.8 2.1 4.6 Female.......................... 40.0 * * * * * * 0.3 0.7 1.8 White, both sexes................... 47.6 * * * * * 0.2 0.5 1.3 3.2 Male............................ 52.2 * * * * * * 0.7 1.9 4.7 Female.......................... 43.1 * * * * * * 0.3 0.6 1.7 Black, both sexes................... 35.2 * * * * * * 1.0 2.5 4.3 Male............................ 36.6 * * * * * * 1.3 3.9 6.1 Female.......................... 34.0 * * * * * * * * 2.8

19JUL10 Plate 1 of 2 Page 31
Worktable 210R. Death rates for 113 selected causes, alcohol-induced causes, drug-induced causes, and injury by firearms, by 5-year agegroups, race, and sex: United States, 2007
[Rates per 100,000 population in specified group. Rates based on populations estimated as of July 1, 2007. Race categories are consistentwith the 1977 Office of Management and Budget (OMB) standards. In 2007, multiple-race data were reported by California, Connecticut, Delaware, Districtof Columbia, Florida, Hawaii, Idaho, Kansas, Maine, Michigan, Minnesota, Montana, Nebraska, New Hampshire, New Jersey, New Mexico, New York, Ohio,Oklahoma, Oregon, Rhode Island, South Carolina, South Dakota, Texas, Utah, Washington, Wisconsin, and Wyoming. The multiple-race data for these areas werebridged to the single-race categories of the 1977 OMB standards for comparability with other areas; see http://www.cdc.gov/nchs and refer to "Detailedtechnical notes to the United States 2007 data—mortality." For explanation of asterisks preceding cause-of-death codes, see http://www.cdc.gov/nchs andrefer to "Detailed technical notes to the United States 2007 data - mortality"]_____________________________________________________________________________________________________________________________________________________________
Cause of death (Based on theInternational Classificationof Diseases, Tenth Revision, Second All Under 1 1-4 5-9 10-14 15-19 20-24 25-29 30-34 35-39Edition, 2004), race, and sex ages 1/ Year 2/ years years years years years years years years______________________________________________________________________________________________________________________________________________________________
Other acute ischemic heart diseases (I24)
All races 3/, both sexes............. 1.4 * * * * * * * * 0.2 Male............................ 1.5 * * * * * * * * 0.2 Female.......................... 1.3 * * * * * * * * * White, both sexes................... 1.4 * * * * * * * * * Male............................ 1.5 * * * * * * * * * Female.......................... 1.3 * * * * * * * * * Black, both sexes................... 1.3 * * * * * * * * * Male............................ 1.6 * * * * * * * * * Female.......................... 1.1 * * * * * * * * *
Other forms of chronic ischemic heart disease (I20,I25)
All races 3/, both sexes............. 89.3 * * * * 0.1 0.3 0.9 2.2 5.1 Male............................ 95.6 * * * * * 0.5 1.4 3.5 7.7 Female.......................... 83.1 * * * * * * 0.5 0.9 2.3 White, both sexes................... 96.5 * * * * * 0.3 0.8 2.1 4.7 Male............................ 102.9 * * * * * 0.4 1.2 3.2 7.2 Female.......................... 90.3 * * * * * * 0.4 0.8 2.2 Black, both sexes................... 70.1 * * * * * 0.7 1.8 3.6 8.1 Male............................ 75.7 * * * * * * 2.7 6.0 12.3 Female.......................... 64.9 * * * * * * * 1.4 4.3

19JUL10 Plate 1 of 2 Page 32
Worktable 210R. Death rates for 113 selected causes, alcohol-induced causes, drug-induced causes, and injury by firearms, by 5-year agegroups, race, and sex: United States, 2007
[Rates per 100,000 population in specified group. Rates based on populations estimated as of July 1, 2007. Race categories are consistentwith the 1977 Office of Management and Budget (OMB) standards. In 2007, multiple-race data were reported by California, Connecticut, Delaware, Districtof Columbia, Florida, Hawaii, Idaho, Kansas, Maine, Michigan, Minnesota, Montana, Nebraska, New Hampshire, New Jersey, New Mexico, New York, Ohio,Oklahoma, Oregon, Rhode Island, South Carolina, South Dakota, Texas, Utah, Washington, Wisconsin, and Wyoming. The multiple-race data for these areas werebridged to the single-race categories of the 1977 OMB standards for comparability with other areas; see http://www.cdc.gov/nchs and refer to "Detailedtechnical notes to the United States 2007 data—mortality." For explanation of asterisks preceding cause-of-death codes, see http://www.cdc.gov/nchs andrefer to "Detailed technical notes to the United States 2007 data - mortality"]_____________________________________________________________________________________________________________________________________________________________
Cause of death (Based on theInternational Classificationof Diseases, Tenth Revision, Second All Under 1 1-4 5-9 10-14 15-19 20-24 25-29 30-34 35-39Edition, 2004), race, and sex ages 1/ Year 2/ years years years years years years years years______________________________________________________________________________________________________________________________________________________________
Atherosclerotic cardiovascular disease, so described (I25.0)
All races 3/, both sexes............. 19.6 * * * * * * 0.3 0.7 1.9 Male............................ 22.5 * * * * * * 0.5 1.2 2.9 Female.......................... 16.8 * * * * * * * 0.2 0.8 White, both sexes................... 20.0 * * * * * * 0.3 0.7 1.7 Male............................ 22.7 * * * * * * 0.4 1.1 2.7 Female.......................... 17.3 * * * * * * * * 0.7 Black, both sexes................... 22.3 * * * * * * 0.7 1.2 3.2 Male............................ 27.0 * * * * * * * 2.3 5.0 Female.......................... 18.0 * * * * * * * * 1.7
All other forms of chronic ischemic heart disease (I20,I25.1-I25.9)
All races 3/, both sexes............. 69.7 * * * * 0.1 0.3 0.6 1.5 3.2 Male............................ 73.2 * * * * * 0.4 0.9 2.3 4.8 Female.......................... 66.3 * * * * * * 0.3 0.7 1.5 White, both sexes................... 76.6 * * * * * 0.2 0.5 1.4 3.0 Male............................ 80.2 * * * * * 0.4 0.8 2.2 4.5 Female.......................... 72.9 * * * * * * 0.3 0.6 1.5 Black, both sexes................... 47.8 * * * * * * 1.1 2.4 4.8 Male............................ 48.7 * * * * * * 1.5 3.7 7.3 Female.......................... 46.9 * * * * * * * * 2.6

19JUL10 Plate 1 of 2 Page 33
Worktable 210R. Death rates for 113 selected causes, alcohol-induced causes, drug-induced causes, and injury by firearms, by 5-year agegroups, race, and sex: United States, 2007
[Rates per 100,000 population in specified group. Rates based on populations estimated as of July 1, 2007. Race categories are consistentwith the 1977 Office of Management and Budget (OMB) standards. In 2007, multiple-race data were reported by California, Connecticut, Delaware, Districtof Columbia, Florida, Hawaii, Idaho, Kansas, Maine, Michigan, Minnesota, Montana, Nebraska, New Hampshire, New Jersey, New Mexico, New York, Ohio,Oklahoma, Oregon, Rhode Island, South Carolina, South Dakota, Texas, Utah, Washington, Wisconsin, and Wyoming. The multiple-race data for these areas werebridged to the single-race categories of the 1977 OMB standards for comparability with other areas; see http://www.cdc.gov/nchs and refer to "Detailedtechnical notes to the United States 2007 data—mortality." For explanation of asterisks preceding cause-of-death codes, see http://www.cdc.gov/nchs andrefer to "Detailed technical notes to the United States 2007 data - mortality"]_____________________________________________________________________________________________________________________________________________________________
Cause of death (Based on theInternational Classificationof Diseases, Tenth Revision, Second All Under 1 1-4 5-9 10-14 15-19 20-24 25-29 30-34 35-39Edition, 2004), race, and sex ages 1/ Year 2/ years years years years years years years years______________________________________________________________________________________________________________________________________________________________
Other heart diseases (I26-I51)
All races 3/, both sexes............. 57.3 9.3 1.0 0.5 0.6 1.4 2.7 3.8 5.0 7.6 Male............................ 51.9 10.3 0.9 0.6 0.6 1.8 3.3 4.7 6.0 9.5 Female.......................... 62.5 8.3 1.1 0.4 0.6 1.0 2.2 2.9 4.0 5.8 White, both sexes................... 61.3 7.1 0.8 0.4 0.5 1.2 2.3 3.1 4.1 6.3 Male............................ 54.6 7.9 0.7 0.5 0.5 1.4 2.7 3.8 5.1 7.8 Female.......................... 67.9 6.3 1.0 0.4 0.5 0.9 2.0 2.2 3.1 4.7 Black, both sexes................... 50.8 19.0 1.5 0.7 1.1 2.7 5.3 8.5 11.2 17.9 Male............................ 50.9 21.4 2.0 * * 3.7 6.8 10.3 13.1 22.9 Female.......................... 50.8 16.5 * * 1.2 1.5 3.7 6.8 9.5 13.5
Acute and subacute endocarditis (I33)
All races 3/, both sexes............. 0.4 * * * * * * * * 0.2 Male............................ 0.5 * * * * * * * * 0.2 Female.......................... 0.3 * * * * * * * * * White, both sexes................... 0.4 * * * * * * * * 0.2 Male............................ 0.5 * * * * * * * * * Female.......................... 0.3 * * * * * * * * * Black, both sexes................... 0.6 * * * * * * * * * Male............................ 0.8 * * * * * * * * * Female.......................... 0.4 * * * * * * * * *
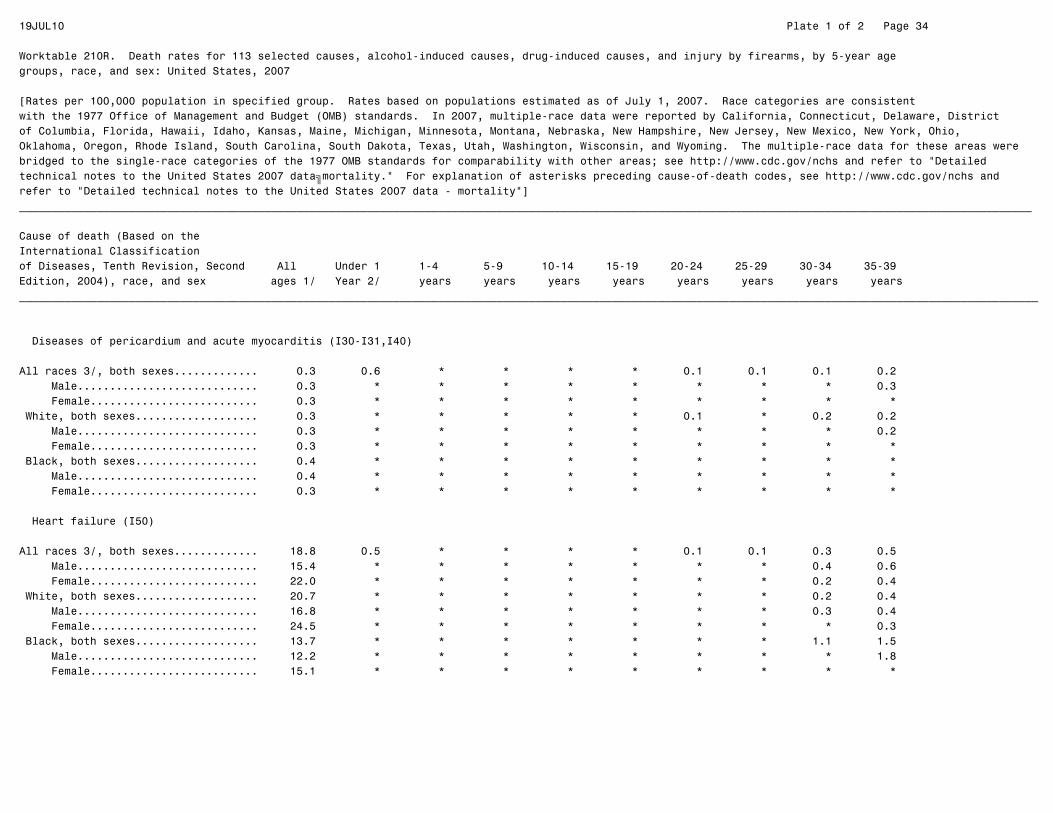
19JUL10 Plate 1 of 2 Page 34
Worktable 210R. Death rates for 113 selected causes, alcohol-induced causes, drug-induced causes, and injury by firearms, by 5-year agegroups, race, and sex: United States, 2007
[Rates per 100,000 population in specified group. Rates based on populations estimated as of July 1, 2007. Race categories are consistentwith the 1977 Office of Management and Budget (OMB) standards. In 2007, multiple-race data were reported by California, Connecticut, Delaware, Districtof Columbia, Florida, Hawaii, Idaho, Kansas, Maine, Michigan, Minnesota, Montana, Nebraska, New Hampshire, New Jersey, New Mexico, New York, Ohio,Oklahoma, Oregon, Rhode Island, South Carolina, South Dakota, Texas, Utah, Washington, Wisconsin, and Wyoming. The multiple-race data for these areas werebridged to the single-race categories of the 1977 OMB standards for comparability with other areas; see http://www.cdc.gov/nchs and refer to "Detailedtechnical notes to the United States 2007 data—mortality." For explanation of asterisks preceding cause-of-death codes, see http://www.cdc.gov/nchs andrefer to "Detailed technical notes to the United States 2007 data - mortality"]_____________________________________________________________________________________________________________________________________________________________
Cause of death (Based on theInternational Classificationof Diseases, Tenth Revision, Second All Under 1 1-4 5-9 10-14 15-19 20-24 25-29 30-34 35-39Edition, 2004), race, and sex ages 1/ Year 2/ years years years years years years years years______________________________________________________________________________________________________________________________________________________________
Diseases of pericardium and acute myocarditis (I30-I31,I40)
All races 3/, both sexes............. 0.3 0.6 * * * * 0.1 0.1 0.1 0.2 Male............................ 0.3 * * * * * * * * 0.3 Female.......................... 0.3 * * * * * * * * * White, both sexes................... 0.3 * * * * * 0.1 * 0.2 0.2 Male............................ 0.3 * * * * * * * * 0.2 Female.......................... 0.3 * * * * * * * * * Black, both sexes................... 0.4 * * * * * * * * * Male............................ 0.4 * * * * * * * * * Female.......................... 0.3 * * * * * * * * *
Heart failure (I50)
All races 3/, both sexes............. 18.8 0.5 * * * * 0.1 0.1 0.3 0.5 Male............................ 15.4 * * * * * * * 0.4 0.6 Female.......................... 22.0 * * * * * * * 0.2 0.4 White, both sexes................... 20.7 * * * * * * * 0.2 0.4 Male............................ 16.8 * * * * * * * 0.3 0.4 Female.......................... 24.5 * * * * * * * * 0.3 Black, both sexes................... 13.7 * * * * * * * 1.1 1.5 Male............................ 12.2 * * * * * * * * 1.8 Female.......................... 15.1 * * * * * * * * *
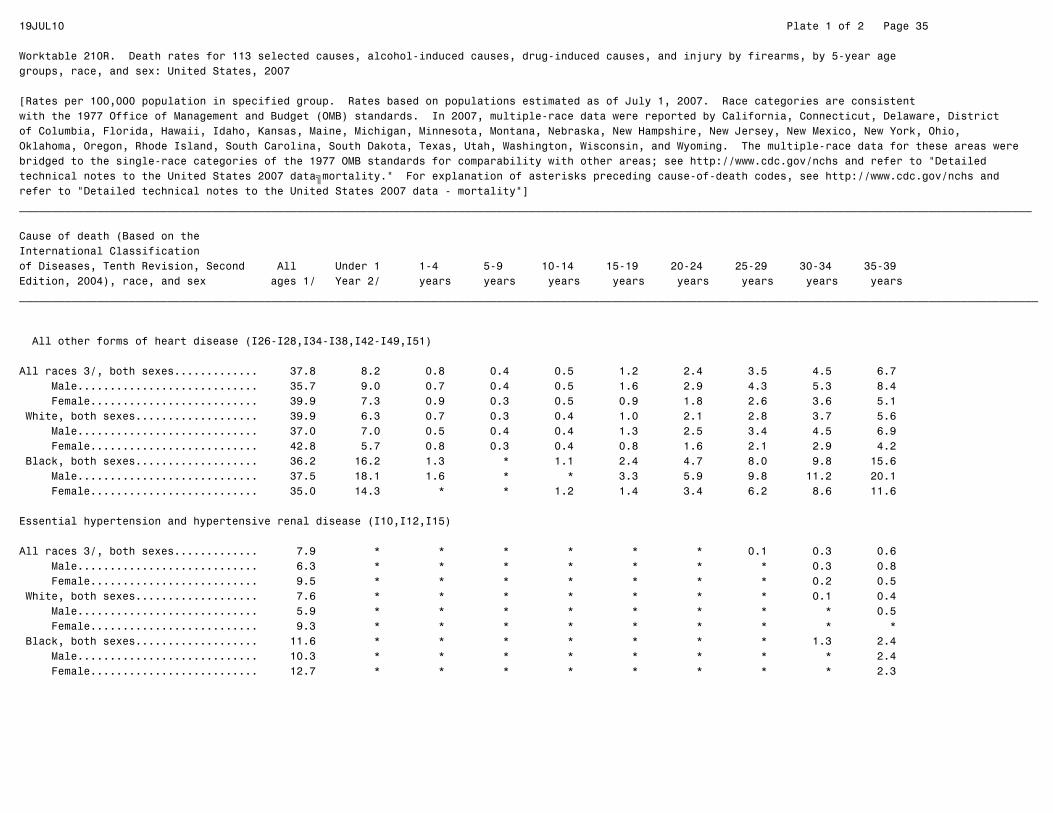
19JUL10 Plate 1 of 2 Page 35
Worktable 210R. Death rates for 113 selected causes, alcohol-induced causes, drug-induced causes, and injury by firearms, by 5-year agegroups, race, and sex: United States, 2007
[Rates per 100,000 population in specified group. Rates based on populations estimated as of July 1, 2007. Race categories are consistentwith the 1977 Office of Management and Budget (OMB) standards. In 2007, multiple-race data were reported by California, Connecticut, Delaware, Districtof Columbia, Florida, Hawaii, Idaho, Kansas, Maine, Michigan, Minnesota, Montana, Nebraska, New Hampshire, New Jersey, New Mexico, New York, Ohio,Oklahoma, Oregon, Rhode Island, South Carolina, South Dakota, Texas, Utah, Washington, Wisconsin, and Wyoming. The multiple-race data for these areas werebridged to the single-race categories of the 1977 OMB standards for comparability with other areas; see http://www.cdc.gov/nchs and refer to "Detailedtechnical notes to the United States 2007 data—mortality." For explanation of asterisks preceding cause-of-death codes, see http://www.cdc.gov/nchs andrefer to "Detailed technical notes to the United States 2007 data - mortality"]_____________________________________________________________________________________________________________________________________________________________
Cause of death (Based on theInternational Classificationof Diseases, Tenth Revision, Second All Under 1 1-4 5-9 10-14 15-19 20-24 25-29 30-34 35-39Edition, 2004), race, and sex ages 1/ Year 2/ years years years years years years years years______________________________________________________________________________________________________________________________________________________________
All other forms of heart disease (I26-I28,I34-I38,I42-I49,I51)
All races 3/, both sexes............. 37.8 8.2 0.8 0.4 0.5 1.2 2.4 3.5 4.5 6.7 Male............................ 35.7 9.0 0.7 0.4 0.5 1.6 2.9 4.3 5.3 8.4 Female.......................... 39.9 7.3 0.9 0.3 0.5 0.9 1.8 2.6 3.6 5.1 White, both sexes................... 39.9 6.3 0.7 0.3 0.4 1.0 2.1 2.8 3.7 5.6 Male............................ 37.0 7.0 0.5 0.4 0.4 1.3 2.5 3.4 4.5 6.9 Female.......................... 42.8 5.7 0.8 0.3 0.4 0.8 1.6 2.1 2.9 4.2 Black, both sexes................... 36.2 16.2 1.3 * 1.1 2.4 4.7 8.0 9.8 15.6 Male............................ 37.5 18.1 1.6 * * 3.3 5.9 9.8 11.2 20.1 Female.......................... 35.0 14.3 * * 1.2 1.4 3.4 6.2 8.6 11.6
Essential hypertension and hypertensive renal disease (I10,I12,I15)
All races 3/, both sexes............. 7.9 * * * * * * 0.1 0.3 0.6 Male............................ 6.3 * * * * * * * 0.3 0.8 Female.......................... 9.5 * * * * * * * 0.2 0.5 White, both sexes................... 7.6 * * * * * * * 0.1 0.4 Male............................ 5.9 * * * * * * * * 0.5 Female.......................... 9.3 * * * * * * * * * Black, both sexes................... 11.6 * * * * * * * 1.3 2.4 Male............................ 10.3 * * * * * * * * 2.4 Female.......................... 12.7 * * * * * * * * 2.3

19JUL10 Plate 1 of 2 Page 36
Worktable 210R. Death rates for 113 selected causes, alcohol-induced causes, drug-induced causes, and injury by firearms, by 5-year agegroups, race, and sex: United States, 2007
[Rates per 100,000 population in specified group. Rates based on populations estimated as of July 1, 2007. Race categories are consistentwith the 1977 Office of Management and Budget (OMB) standards. In 2007, multiple-race data were reported by California, Connecticut, Delaware, Districtof Columbia, Florida, Hawaii, Idaho, Kansas, Maine, Michigan, Minnesota, Montana, Nebraska, New Hampshire, New Jersey, New Mexico, New York, Ohio,Oklahoma, Oregon, Rhode Island, South Carolina, South Dakota, Texas, Utah, Washington, Wisconsin, and Wyoming. The multiple-race data for these areas werebridged to the single-race categories of the 1977 OMB standards for comparability with other areas; see http://www.cdc.gov/nchs and refer to "Detailedtechnical notes to the United States 2007 data—mortality." For explanation of asterisks preceding cause-of-death codes, see http://www.cdc.gov/nchs andrefer to "Detailed technical notes to the United States 2007 data - mortality"]_____________________________________________________________________________________________________________________________________________________________
Cause of death (Based on theInternational Classificationof Diseases, Tenth Revision, Second All Under 1 1-4 5-9 10-14 15-19 20-24 25-29 30-34 35-39Edition, 2004), race, and sex ages 1/ Year 2/ years years years years years years years years______________________________________________________________________________________________________________________________________________________________
Cerebrovascular diseases (I60-I69)
All races 3/, both sexes............. 45.1 3.1 0.3 0.2 0.2 0.3 0.6 0.9 1.7 3.5 Male............................ 36.4 3.5 0.2 * 0.2 0.4 0.7 0.8 1.6 3.8 Female.......................... 53.5 2.6 0.4 0.2 0.3 0.3 0.5 0.9 1.7 3.2 White, both sexes................... 47.1 2.9 0.3 0.2 0.2 0.3 0.5 0.8 1.3 2.8 Male............................ 37.0 3.0 * * * 0.3 0.6 0.8 1.2 2.9 Female.......................... 57.0 2.7 * * * 0.3 0.5 0.8 1.4 2.7 Black, both sexes................... 42.7 4.8 * * * * 0.9 1.4 3.9 7.7 Male............................ 39.5 6.9 * * * * * * 4.1 9.5 Female.......................... 45.6 * * * * * * 1.5 3.8 6.1
Atherosclerosis (I70)
All races 3/, both sexes............. 2.7 * * * * * * * * * Male............................ 2.2 * * * * * * * * * Female.......................... 3.3 * * * * * * * * * White, both sexes................... 3.1 * * * * * * * * * Male............................ 2.4 * * * * * * * * * Female.......................... 3.7 * * * * * * * * * Black, both sexes................... 1.6 * * * * * * * * * Male............................ 1.4 * * * * * * * * * Female.......................... 1.9 * * * * * * * * *
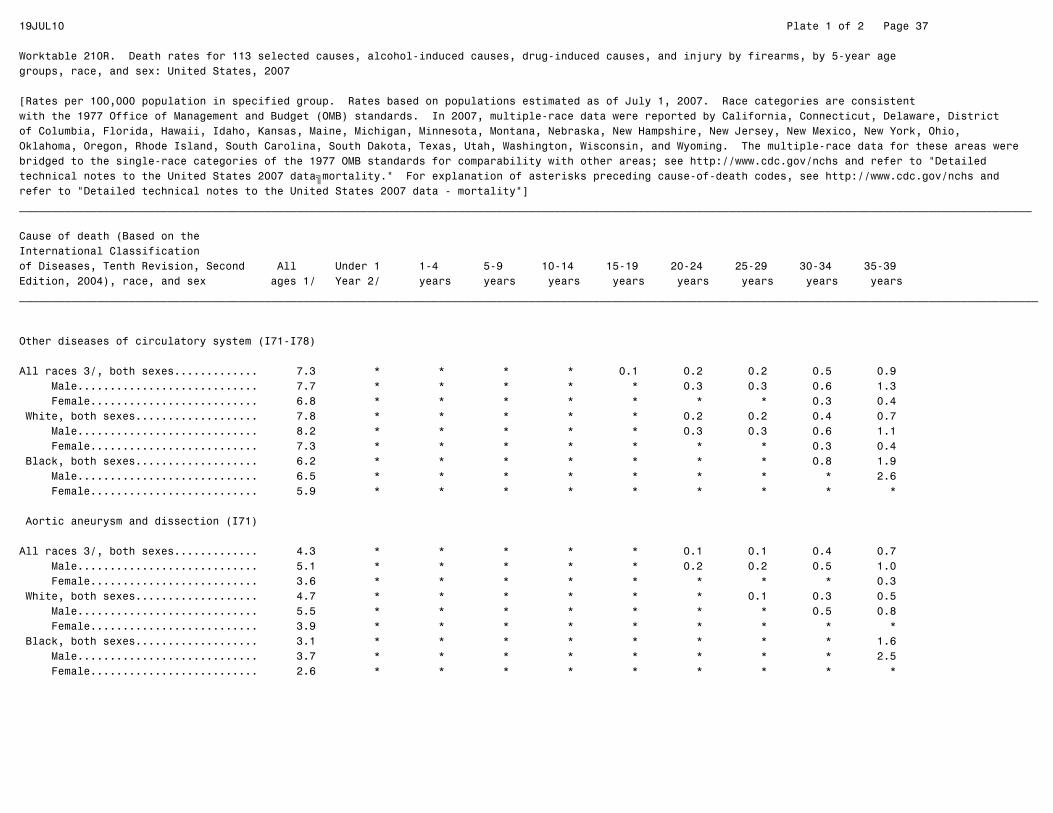
19JUL10 Plate 1 of 2 Page 37
Worktable 210R. Death rates for 113 selected causes, alcohol-induced causes, drug-induced causes, and injury by firearms, by 5-year agegroups, race, and sex: United States, 2007
[Rates per 100,000 population in specified group. Rates based on populations estimated as of July 1, 2007. Race categories are consistentwith the 1977 Office of Management and Budget (OMB) standards. In 2007, multiple-race data were reported by California, Connecticut, Delaware, Districtof Columbia, Florida, Hawaii, Idaho, Kansas, Maine, Michigan, Minnesota, Montana, Nebraska, New Hampshire, New Jersey, New Mexico, New York, Ohio,Oklahoma, Oregon, Rhode Island, South Carolina, South Dakota, Texas, Utah, Washington, Wisconsin, and Wyoming. The multiple-race data for these areas werebridged to the single-race categories of the 1977 OMB standards for comparability with other areas; see http://www.cdc.gov/nchs and refer to "Detailedtechnical notes to the United States 2007 data—mortality." For explanation of asterisks preceding cause-of-death codes, see http://www.cdc.gov/nchs andrefer to "Detailed technical notes to the United States 2007 data - mortality"]_____________________________________________________________________________________________________________________________________________________________
Cause of death (Based on theInternational Classificationof Diseases, Tenth Revision, Second All Under 1 1-4 5-9 10-14 15-19 20-24 25-29 30-34 35-39Edition, 2004), race, and sex ages 1/ Year 2/ years years years years years years years years______________________________________________________________________________________________________________________________________________________________
Other diseases of circulatory system (I71-I78)
All races 3/, both sexes............. 7.3 * * * * 0.1 0.2 0.2 0.5 0.9 Male............................ 7.7 * * * * * 0.3 0.3 0.6 1.3 Female.......................... 6.8 * * * * * * * 0.3 0.4 White, both sexes................... 7.8 * * * * * 0.2 0.2 0.4 0.7 Male............................ 8.2 * * * * * 0.3 0.3 0.6 1.1 Female.......................... 7.3 * * * * * * * 0.3 0.4 Black, both sexes................... 6.2 * * * * * * * 0.8 1.9 Male............................ 6.5 * * * * * * * * 2.6 Female.......................... 5.9 * * * * * * * * *
Aortic aneurysm and dissection (I71)
All races 3/, both sexes............. 4.3 * * * * * 0.1 0.1 0.4 0.7 Male............................ 5.1 * * * * * 0.2 0.2 0.5 1.0 Female.......................... 3.6 * * * * * * * * 0.3 White, both sexes................... 4.7 * * * * * * 0.1 0.3 0.5 Male............................ 5.5 * * * * * * * 0.5 0.8 Female.......................... 3.9 * * * * * * * * * Black, both sexes................... 3.1 * * * * * * * * 1.6 Male............................ 3.7 * * * * * * * * 2.5 Female.......................... 2.6 * * * * * * * * *

19JUL10 Plate 1 of 2 Page 38
Worktable 210R. Death rates for 113 selected causes, alcohol-induced causes, drug-induced causes, and injury by firearms, by 5-year agegroups, race, and sex: United States, 2007
[Rates per 100,000 population in specified group. Rates based on populations estimated as of July 1, 2007. Race categories are consistentwith the 1977 Office of Management and Budget (OMB) standards. In 2007, multiple-race data were reported by California, Connecticut, Delaware, Districtof Columbia, Florida, Hawaii, Idaho, Kansas, Maine, Michigan, Minnesota, Montana, Nebraska, New Hampshire, New Jersey, New Mexico, New York, Ohio,Oklahoma, Oregon, Rhode Island, South Carolina, South Dakota, Texas, Utah, Washington, Wisconsin, and Wyoming. The multiple-race data for these areas werebridged to the single-race categories of the 1977 OMB standards for comparability with other areas; see http://www.cdc.gov/nchs and refer to "Detailedtechnical notes to the United States 2007 data—mortality." For explanation of asterisks preceding cause-of-death codes, see http://www.cdc.gov/nchs andrefer to "Detailed technical notes to the United States 2007 data - mortality"]_____________________________________________________________________________________________________________________________________________________________
Cause of death (Based on theInternational Classificationof Diseases, Tenth Revision, Second All Under 1 1-4 5-9 10-14 15-19 20-24 25-29 30-34 35-39Edition, 2004), race, and sex ages 1/ Year 2/ years years years years years years years years______________________________________________________________________________________________________________________________________________________________
Other diseases of arteries, arterioles and capillaries (I72-I78)
All races 3/, both sexes............. 3.0 * * * * * * * 0.1 0.2 Male............................ 2.6 * * * * * * * * 0.2 Female.......................... 3.3 * * * * * * * * * White, both sexes................... 3.1 * * * * * * * * 0.2 Male............................ 2.8 * * * * * * * * 0.3 Female.......................... 3.5 * * * * * * * * * Black, both sexes................... 3.0 * * * * * * * * * Male............................ 2.8 * * * * * * * * * Female.......................... 3.2 * * * * * * * * *
Other disorders of circulatory system (I80-I99)
All races 3/, both sexes............. 1.4 1.2 * * * * 0.1 0.2 0.4 0.6 Male............................ 1.3 1.4 * * * * * 0.2 0.5 0.7 Female.......................... 1.4 1.1 * * * * * 0.3 0.2 0.6 White, both sexes................... 1.4 1.2 * * * * * 0.2 0.3 0.5 Male............................ 1.3 1.3 * * * * * * 0.4 0.5 Female.......................... 1.5 * * * * * * * * 0.5 Black, both sexes................... 1.8 * * * * * * * 0.8 1.7 Male............................ 1.8 * * * * * * * * 2.1 Female.......................... 1.7 * * * * * * * * 1.4

19JUL10 Plate 1 of 2 Page 39
Worktable 210R. Death rates for 113 selected causes, alcohol-induced causes, drug-induced causes, and injury by firearms, by 5-year agegroups, race, and sex: United States, 2007
[Rates per 100,000 population in specified group. Rates based on populations estimated as of July 1, 2007. Race categories are consistentwith the 1977 Office of Management and Budget (OMB) standards. In 2007, multiple-race data were reported by California, Connecticut, Delaware, Districtof Columbia, Florida, Hawaii, Idaho, Kansas, Maine, Michigan, Minnesota, Montana, Nebraska, New Hampshire, New Jersey, New Mexico, New York, Ohio,Oklahoma, Oregon, Rhode Island, South Carolina, South Dakota, Texas, Utah, Washington, Wisconsin, and Wyoming. The multiple-race data for these areas werebridged to the single-race categories of the 1977 OMB standards for comparability with other areas; see http://www.cdc.gov/nchs and refer to "Detailedtechnical notes to the United States 2007 data—mortality." For explanation of asterisks preceding cause-of-death codes, see http://www.cdc.gov/nchs andrefer to "Detailed technical notes to the United States 2007 data - mortality"]_____________________________________________________________________________________________________________________________________________________________
Cause of death (Based on theInternational Classificationof Diseases, Tenth Revision, Second All Under 1 1-4 5-9 10-14 15-19 20-24 25-29 30-34 35-39Edition, 2004), race, and sex ages 1/ Year 2/ years years years years years years years years______________________________________________________________________________________________________________________________________________________________
Influenza and pneumonia (J09-J18)
All races 3/, both sexes............. 17.5 5.2 0.7 0.2 0.3 0.2 0.5 0.7 0.9 1.4 Male............................ 16.2 6.2 0.7 0.2 0.3 0.2 0.6 0.8 1.0 1.4 Female.......................... 18.7 4.2 0.7 0.2 0.3 0.3 0.4 0.6 0.8 1.3 White, both sexes................... 18.9 4.0 0.6 0.2 0.3 0.2 0.5 0.6 0.8 1.2 Male............................ 17.2 5.1 0.5 * * * 0.6 0.7 0.8 1.3 Female.......................... 20.5 2.9 0.7 * 0.3 0.3 0.4 0.6 0.7 1.1 Black, both sexes................... 12.9 10.5 1.1 * * * * 1.5 1.8 2.6 Male............................ 13.1 11.5 * * * * * 1.8 1.9 2.8 Female.......................... 12.7 9.4 * * * * * * 1.7 2.4
Influenza (J09-J11)
All races 3/, both sexes............. 0.1 * * 0.1 * * * * * * Male............................ 0.1 * * * * * * * * * Female.......................... 0.1 * * * * * * * * * White, both sexes................... 0.2 * * * * * * * * * Male............................ 0.1 * * * * * * * * * Female.......................... 0.2 * * * * * * * * * Black, both sexes................... 0.1 * * * * * * * * * Male............................ * * * * * * * * * * Female.......................... * * * * * * * * * *
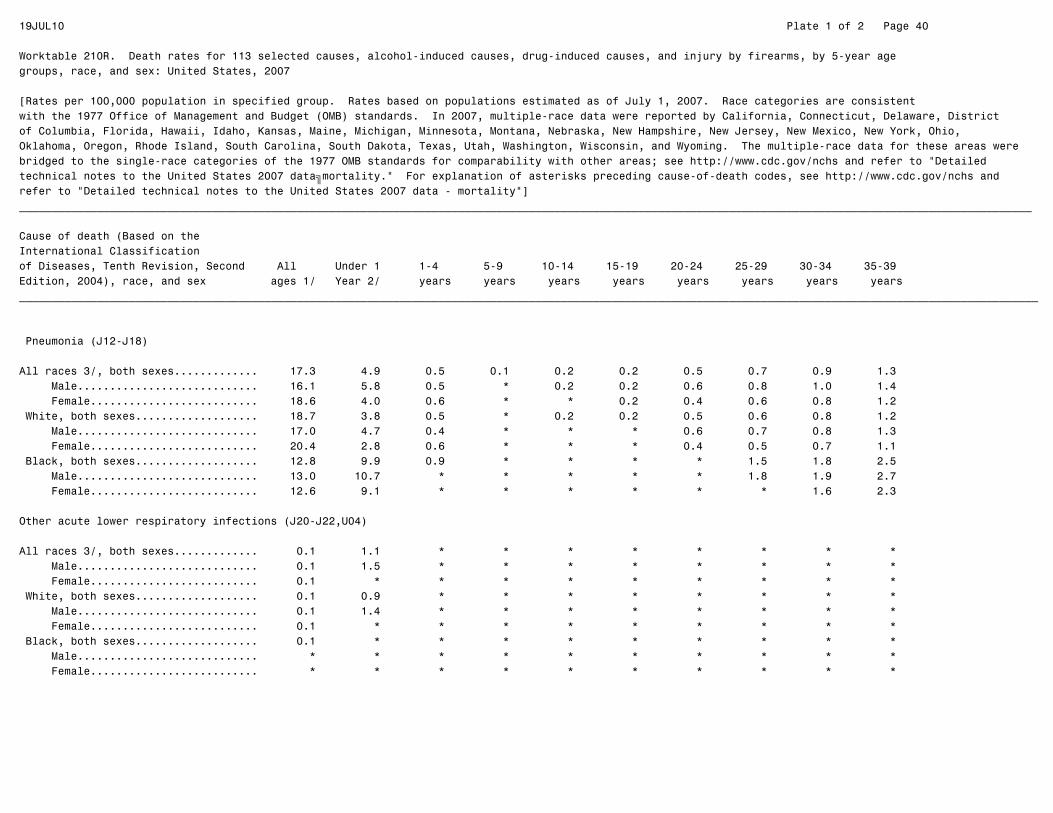
19JUL10 Plate 1 of 2 Page 40
Worktable 210R. Death rates for 113 selected causes, alcohol-induced causes, drug-induced causes, and injury by firearms, by 5-year agegroups, race, and sex: United States, 2007
[Rates per 100,000 population in specified group. Rates based on populations estimated as of July 1, 2007. Race categories are consistentwith the 1977 Office of Management and Budget (OMB) standards. In 2007, multiple-race data were reported by California, Connecticut, Delaware, Districtof Columbia, Florida, Hawaii, Idaho, Kansas, Maine, Michigan, Minnesota, Montana, Nebraska, New Hampshire, New Jersey, New Mexico, New York, Ohio,Oklahoma, Oregon, Rhode Island, South Carolina, South Dakota, Texas, Utah, Washington, Wisconsin, and Wyoming. The multiple-race data for these areas werebridged to the single-race categories of the 1977 OMB standards for comparability with other areas; see http://www.cdc.gov/nchs and refer to "Detailedtechnical notes to the United States 2007 data—mortality." For explanation of asterisks preceding cause-of-death codes, see http://www.cdc.gov/nchs andrefer to "Detailed technical notes to the United States 2007 data - mortality"]_____________________________________________________________________________________________________________________________________________________________
Cause of death (Based on theInternational Classificationof Diseases, Tenth Revision, Second All Under 1 1-4 5-9 10-14 15-19 20-24 25-29 30-34 35-39Edition, 2004), race, and sex ages 1/ Year 2/ years years years years years years years years______________________________________________________________________________________________________________________________________________________________
Pneumonia (J12-J18)
All races 3/, both sexes............. 17.3 4.9 0.5 0.1 0.2 0.2 0.5 0.7 0.9 1.3 Male............................ 16.1 5.8 0.5 * 0.2 0.2 0.6 0.8 1.0 1.4 Female.......................... 18.6 4.0 0.6 * * 0.2 0.4 0.6 0.8 1.2 White, both sexes................... 18.7 3.8 0.5 * 0.2 0.2 0.5 0.6 0.8 1.2 Male............................ 17.0 4.7 0.4 * * * 0.6 0.7 0.8 1.3 Female.......................... 20.4 2.8 0.6 * * * 0.4 0.5 0.7 1.1 Black, both sexes................... 12.8 9.9 0.9 * * * * 1.5 1.8 2.5 Male............................ 13.0 10.7 * * * * * 1.8 1.9 2.7 Female.......................... 12.6 9.1 * * * * * * 1.6 2.3
Other acute lower respiratory infections (J20-J22,U04)
All races 3/, both sexes............. 0.1 1.1 * * * * * * * * Male............................ 0.1 1.5 * * * * * * * * Female.......................... 0.1 * * * * * * * * * White, both sexes................... 0.1 0.9 * * * * * * * * Male............................ 0.1 1.4 * * * * * * * * Female.......................... 0.1 * * * * * * * * * Black, both sexes................... 0.1 * * * * * * * * * Male............................ * * * * * * * * * * Female.......................... * * * * * * * * * *
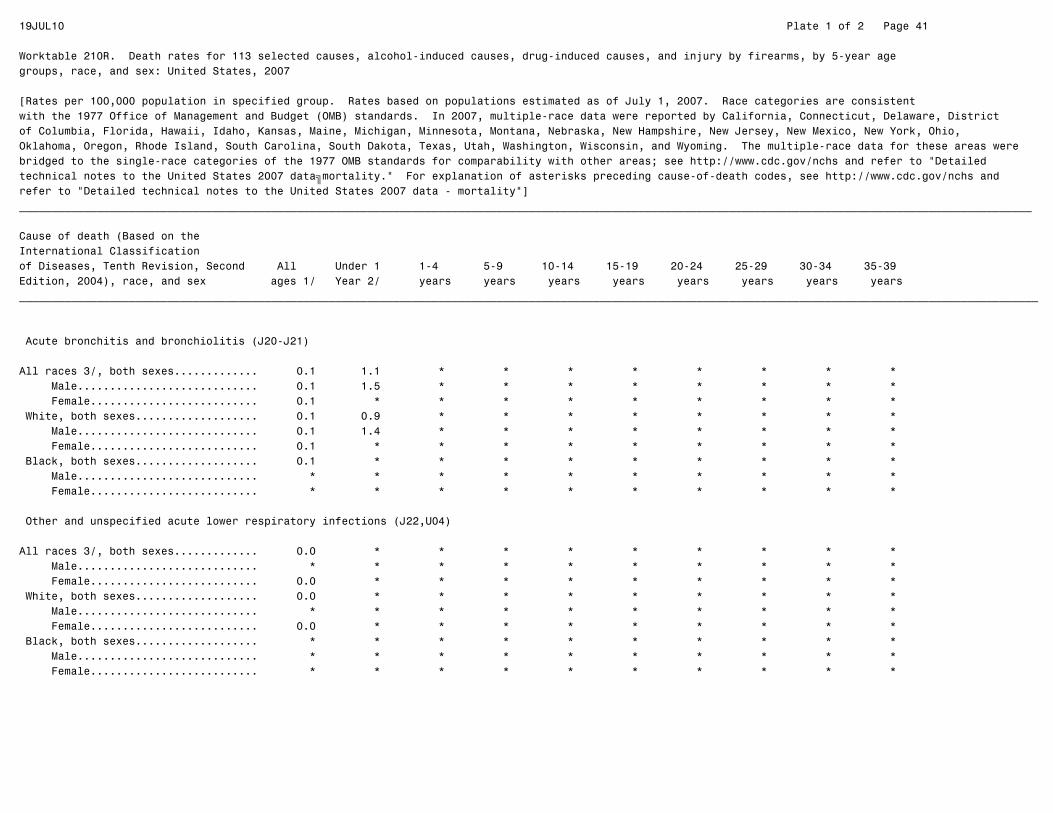
19JUL10 Plate 1 of 2 Page 41
Worktable 210R. Death rates for 113 selected causes, alcohol-induced causes, drug-induced causes, and injury by firearms, by 5-year agegroups, race, and sex: United States, 2007
[Rates per 100,000 population in specified group. Rates based on populations estimated as of July 1, 2007. Race categories are consistentwith the 1977 Office of Management and Budget (OMB) standards. In 2007, multiple-race data were reported by California, Connecticut, Delaware, Districtof Columbia, Florida, Hawaii, Idaho, Kansas, Maine, Michigan, Minnesota, Montana, Nebraska, New Hampshire, New Jersey, New Mexico, New York, Ohio,Oklahoma, Oregon, Rhode Island, South Carolina, South Dakota, Texas, Utah, Washington, Wisconsin, and Wyoming. The multiple-race data for these areas werebridged to the single-race categories of the 1977 OMB standards for comparability with other areas; see http://www.cdc.gov/nchs and refer to "Detailedtechnical notes to the United States 2007 data—mortality." For explanation of asterisks preceding cause-of-death codes, see http://www.cdc.gov/nchs andrefer to "Detailed technical notes to the United States 2007 data - mortality"]_____________________________________________________________________________________________________________________________________________________________
Cause of death (Based on theInternational Classificationof Diseases, Tenth Revision, Second All Under 1 1-4 5-9 10-14 15-19 20-24 25-29 30-34 35-39Edition, 2004), race, and sex ages 1/ Year 2/ years years years years years years years years______________________________________________________________________________________________________________________________________________________________
Acute bronchitis and bronchiolitis (J20-J21)
All races 3/, both sexes............. 0.1 1.1 * * * * * * * * Male............................ 0.1 1.5 * * * * * * * * Female.......................... 0.1 * * * * * * * * * White, both sexes................... 0.1 0.9 * * * * * * * * Male............................ 0.1 1.4 * * * * * * * * Female.......................... 0.1 * * * * * * * * * Black, both sexes................... 0.1 * * * * * * * * * Male............................ * * * * * * * * * * Female.......................... * * * * * * * * * *
Other and unspecified acute lower respiratory infections (J22,U04)
All races 3/, both sexes............. 0.0 * * * * * * * * * Male............................ * * * * * * * * * * Female.......................... 0.0 * * * * * * * * * White, both sexes................... 0.0 * * * * * * * * * Male............................ * * * * * * * * * * Female.......................... 0.0 * * * * * * * * * Black, both sexes................... * * * * * * * * * * Male............................ * * * * * * * * * * Female.......................... * * * * * * * * * *

19JUL10 Plate 1 of 2 Page 42
Worktable 210R. Death rates for 113 selected causes, alcohol-induced causes, drug-induced causes, and injury by firearms, by 5-year agegroups, race, and sex: United States, 2007
[Rates per 100,000 population in specified group. Rates based on populations estimated as of July 1, 2007. Race categories are consistentwith the 1977 Office of Management and Budget (OMB) standards. In 2007, multiple-race data were reported by California, Connecticut, Delaware, Districtof Columbia, Florida, Hawaii, Idaho, Kansas, Maine, Michigan, Minnesota, Montana, Nebraska, New Hampshire, New Jersey, New Mexico, New York, Ohio,Oklahoma, Oregon, Rhode Island, South Carolina, South Dakota, Texas, Utah, Washington, Wisconsin, and Wyoming. The multiple-race data for these areas werebridged to the single-race categories of the 1977 OMB standards for comparability with other areas; see http://www.cdc.gov/nchs and refer to "Detailedtechnical notes to the United States 2007 data—mortality." For explanation of asterisks preceding cause-of-death codes, see http://www.cdc.gov/nchs andrefer to "Detailed technical notes to the United States 2007 data - mortality"]_____________________________________________________________________________________________________________________________________________________________
Cause of death (Based on theInternational Classificationof Diseases, Tenth Revision, Second All Under 1 1-4 5-9 10-14 15-19 20-24 25-29 30-34 35-39Edition, 2004), race, and sex ages 1/ Year 2/ years years years years years years years years______________________________________________________________________________________________________________________________________________________________
Chronic lower respiratory diseases (J40-J47)
All races 3/, both sexes............. 42.4 1.0 0.3 0.3 0.3 0.3 0.4 0.6 0.7 1.1 Male............................ 41.2 1.2 0.4 0.4 0.4 0.4 0.5 0.7 0.7 1.0 Female.......................... 43.6 * 0.3 * 0.2 0.3 0.2 0.5 0.6 1.1 White, both sexes................... 48.5 0.8 0.2 0.2 0.2 0.2 0.2 0.5 0.5 0.9 Male............................ 46.3 * * * * 0.3 0.3 0.5 0.5 0.8 Female.......................... 50.6 * * * * * * 0.4 0.5 1.0 Black, both sexes................... 19.7 * 1.1 0.8 1.1 0.8 1.2 1.5 1.9 2.3 Male............................ 22.0 * * * 1.4 * 1.7 1.9 2.4 2.5 Female.......................... 17.7 * * * * * * * 1.5 2.2
Bronchitis, chronic and unspecified (J40-J42)
All races 3/, both sexes............. 0.2 0.6 * * * * * * * * Male............................ 0.2 * * * * * * * * * Female.......................... 0.3 * * * * * * * * * White, both sexes................... 0.2 * * * * * * * * * Male............................ 0.2 * * * * * * * * * Female.......................... 0.3 * * * * * * * * * Black, both sexes................... 0.1 * * * * * * * * * Male............................ 0.1 * * * * * * * * * Female.......................... 0.2 * * * * * * * * *

19JUL10 Plate 1 of 2 Page 43
Worktable 210R. Death rates for 113 selected causes, alcohol-induced causes, drug-induced causes, and injury by firearms, by 5-year agegroups, race, and sex: United States, 2007
[Rates per 100,000 population in specified group. Rates based on populations estimated as of July 1, 2007. Race categories are consistentwith the 1977 Office of Management and Budget (OMB) standards. In 2007, multiple-race data were reported by California, Connecticut, Delaware, Districtof Columbia, Florida, Hawaii, Idaho, Kansas, Maine, Michigan, Minnesota, Montana, Nebraska, New Hampshire, New Jersey, New Mexico, New York, Ohio,Oklahoma, Oregon, Rhode Island, South Carolina, South Dakota, Texas, Utah, Washington, Wisconsin, and Wyoming. The multiple-race data for these areas werebridged to the single-race categories of the 1977 OMB standards for comparability with other areas; see http://www.cdc.gov/nchs and refer to "Detailedtechnical notes to the United States 2007 data—mortality." For explanation of asterisks preceding cause-of-death codes, see http://www.cdc.gov/nchs andrefer to "Detailed technical notes to the United States 2007 data - mortality"]_____________________________________________________________________________________________________________________________________________________________
Cause of death (Based on theInternational Classificationof Diseases, Tenth Revision, Second All Under 1 1-4 5-9 10-14 15-19 20-24 25-29 30-34 35-39Edition, 2004), race, and sex ages 1/ Year 2/ years years years years years years years years______________________________________________________________________________________________________________________________________________________________
Emphysema (J43)
All races 3/, both sexes............. 4.2 * * * * * * * * * Male............................ 4.4 * * * * * * * * * Female.......................... 4.0 * * * * * * * * * White, both sexes................... 4.9 * * * * * * * * * Male............................ 5.0 * * * * * * * * * Female.......................... 4.8 * * * * * * * * * Black, both sexes................... 1.8 * * * * * * * * * Male............................ 2.4 * * * * * * * * * Female.......................... 1.3 * * * * * * * * *
Asthma (J45-J46)
All races 3/, both sexes............. 1.1 * 0.2 0.2 0.3 0.3 0.3 0.5 0.5 0.6 Male............................ 0.9 * 0.2 0.3 0.4 0.4 0.5 0.6 0.6 0.5 Female.......................... 1.4 * 0.2 * 0.2 0.2 0.2 0.4 0.4 0.7 White, both sexes................... 1.0 * * 0.1 0.2 0.2 0.2 0.4 0.4 0.4 Male............................ 0.7 * * * * 0.2 0.3 0.4 0.4 0.3 Female.......................... 1.3 * * * * * * 0.3 0.4 0.6 Black, both sexes................... 2.3 * 1.0 0.7 1.0 0.7 1.1 1.2 1.5 1.7 Male............................ 2.1 * * * 1.4 * 1.6 1.5 2.1 1.8 Female.......................... 2.4 * * * * * * * * 1.6

19JUL10 Plate 1 of 2 Page 44
Worktable 210R. Death rates for 113 selected causes, alcohol-induced causes, drug-induced causes, and injury by firearms, by 5-year agegroups, race, and sex: United States, 2007
[Rates per 100,000 population in specified group. Rates based on populations estimated as of July 1, 2007. Race categories are consistentwith the 1977 Office of Management and Budget (OMB) standards. In 2007, multiple-race data were reported by California, Connecticut, Delaware, Districtof Columbia, Florida, Hawaii, Idaho, Kansas, Maine, Michigan, Minnesota, Montana, Nebraska, New Hampshire, New Jersey, New Mexico, New York, Ohio,Oklahoma, Oregon, Rhode Island, South Carolina, South Dakota, Texas, Utah, Washington, Wisconsin, and Wyoming. The multiple-race data for these areas werebridged to the single-race categories of the 1977 OMB standards for comparability with other areas; see http://www.cdc.gov/nchs and refer to "Detailedtechnical notes to the United States 2007 data—mortality." For explanation of asterisks preceding cause-of-death codes, see http://www.cdc.gov/nchs andrefer to "Detailed technical notes to the United States 2007 data - mortality"]_____________________________________________________________________________________________________________________________________________________________
Cause of death (Based on theInternational Classificationof Diseases, Tenth Revision, Second All Under 1 1-4 5-9 10-14 15-19 20-24 25-29 30-34 35-39Edition, 2004), race, and sex ages 1/ Year 2/ years years years years years years years years______________________________________________________________________________________________________________________________________________________________
Other chronic lower respiratory diseases (J44,J47)
All races 3/, both sexes............. 36.8 * * * * * * 0.1 0.1 0.4 Male............................ 35.7 * * * * * * * * 0.4 Female.......................... 37.9 * * * * * * * * 0.4 White, both sexes................... 42.4 * * * * * * * 0.1 0.4 Male............................ 40.5 * * * * * * * * 0.4 Female.......................... 44.2 * * * * * * * * 0.4 Black, both sexes................... 15.5 * * * * * * * * * Male............................ 17.4 * * * * * * * * * Female.......................... 13.8 * * * * * * * * *
Pneumoconioses and chemical effects (J60-J66,J68)
All races 3/, both sexes............. 0.3 * * * * * * * * * Male............................ 0.6 * * * * * * * * * Female.......................... 0.0 * * * * * * * * * White, both sexes................... 0.4 * * * * * * * * * Male............................ 0.7 * * * * * * * * * Female.......................... 0.0 * * * * * * * * * Black, both sexes................... 0.1 * * * * * * * * * Male............................ 0.2 * * * * * * * * * Female.......................... * * * * * * * * * *

19JUL10 Plate 1 of 2 Page 45
Worktable 210R. Death rates for 113 selected causes, alcohol-induced causes, drug-induced causes, and injury by firearms, by 5-year agegroups, race, and sex: United States, 2007
[Rates per 100,000 population in specified group. Rates based on populations estimated as of July 1, 2007. Race categories are consistentwith the 1977 Office of Management and Budget (OMB) standards. In 2007, multiple-race data were reported by California, Connecticut, Delaware, Districtof Columbia, Florida, Hawaii, Idaho, Kansas, Maine, Michigan, Minnesota, Montana, Nebraska, New Hampshire, New Jersey, New Mexico, New York, Ohio,Oklahoma, Oregon, Rhode Island, South Carolina, South Dakota, Texas, Utah, Washington, Wisconsin, and Wyoming. The multiple-race data for these areas werebridged to the single-race categories of the 1977 OMB standards for comparability with other areas; see http://www.cdc.gov/nchs and refer to "Detailedtechnical notes to the United States 2007 data—mortality." For explanation of asterisks preceding cause-of-death codes, see http://www.cdc.gov/nchs andrefer to "Detailed technical notes to the United States 2007 data - mortality"]_____________________________________________________________________________________________________________________________________________________________
Cause of death (Based on theInternational Classificationof Diseases, Tenth Revision, Second All Under 1 1-4 5-9 10-14 15-19 20-24 25-29 30-34 35-39Edition, 2004), race, and sex ages 1/ Year 2/ years years years years years years years years______________________________________________________________________________________________________________________________________________________________
Pneumonitis due to solids and liquids (J69)
All races 3/, both sexes............. 5.6 * * * * 0.1 0.1 0.1 0.3 0.3 Male............................ 6.0 * * * * * * * 0.3 0.4 Female.......................... 5.3 * * * * * * * * 0.2 White, both sexes................... 6.3 * * * * * 0.1 * 0.2 0.3 Male............................ 6.6 * * * * * * * 0.3 0.4 Female.......................... 5.9 * * * * * * * * * Black, both sexes................... 3.6 * * * * * * * * * Male............................ 3.9 * * * * * * * * * Female.......................... 3.3 * * * * * * * * *
Other diseases of respiratory system (J00-J06,J30-J39,J67,J70-J98)
All races 3/, both sexes............. 9.5 7.5 0.6 0.2 0.2 0.3 0.4 0.5 0.6 0.9 Male............................ 9.6 8.7 0.8 * * 0.3 0.5 0.5 0.6 0.9 Female.......................... 9.3 6.2 0.4 0.2 * 0.2 0.4 0.4 0.6 0.9 White, both sexes................... 10.3 5.8 0.5 0.2 * 0.2 0.4 0.4 0.5 0.7 Male............................ 10.5 6.9 0.6 * * 0.3 0.5 0.5 0.5 0.7 Female.......................... 10.2 4.6 0.4 * * * 0.3 0.4 0.5 0.8 Black, both sexes................... 6.5 15.7 1.1 * * * 0.6 0.9 1.2 1.7 Male............................ 6.6 17.8 1.7 * * * * * * 2.0 Female.......................... 6.4 13.4 * * * * * * * 1.6
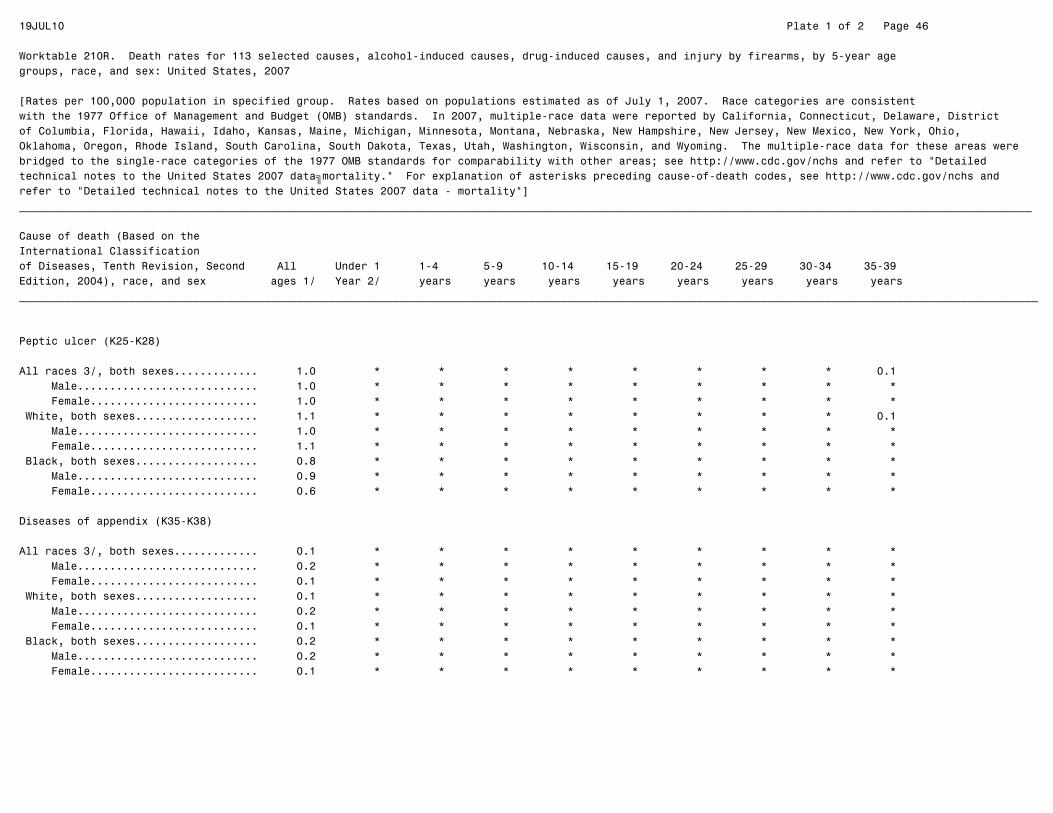
19JUL10 Plate 1 of 2 Page 46
Worktable 210R. Death rates for 113 selected causes, alcohol-induced causes, drug-induced causes, and injury by firearms, by 5-year agegroups, race, and sex: United States, 2007
[Rates per 100,000 population in specified group. Rates based on populations estimated as of July 1, 2007. Race categories are consistentwith the 1977 Office of Management and Budget (OMB) standards. In 2007, multiple-race data were reported by California, Connecticut, Delaware, Districtof Columbia, Florida, Hawaii, Idaho, Kansas, Maine, Michigan, Minnesota, Montana, Nebraska, New Hampshire, New Jersey, New Mexico, New York, Ohio,Oklahoma, Oregon, Rhode Island, South Carolina, South Dakota, Texas, Utah, Washington, Wisconsin, and Wyoming. The multiple-race data for these areas werebridged to the single-race categories of the 1977 OMB standards for comparability with other areas; see http://www.cdc.gov/nchs and refer to "Detailedtechnical notes to the United States 2007 data—mortality." For explanation of asterisks preceding cause-of-death codes, see http://www.cdc.gov/nchs andrefer to "Detailed technical notes to the United States 2007 data - mortality"]_____________________________________________________________________________________________________________________________________________________________
Cause of death (Based on theInternational Classificationof Diseases, Tenth Revision, Second All Under 1 1-4 5-9 10-14 15-19 20-24 25-29 30-34 35-39Edition, 2004), race, and sex ages 1/ Year 2/ years years years years years years years years______________________________________________________________________________________________________________________________________________________________
Peptic ulcer (K25-K28)
All races 3/, both sexes............. 1.0 * * * * * * * * 0.1 Male............................ 1.0 * * * * * * * * * Female.......................... 1.0 * * * * * * * * * White, both sexes................... 1.1 * * * * * * * * 0.1 Male............................ 1.0 * * * * * * * * * Female.......................... 1.1 * * * * * * * * * Black, both sexes................... 0.8 * * * * * * * * * Male............................ 0.9 * * * * * * * * * Female.......................... 0.6 * * * * * * * * *
Diseases of appendix (K35-K38)
All races 3/, both sexes............. 0.1 * * * * * * * * * Male............................ 0.2 * * * * * * * * * Female.......................... 0.1 * * * * * * * * * White, both sexes................... 0.1 * * * * * * * * * Male............................ 0.2 * * * * * * * * * Female.......................... 0.1 * * * * * * * * * Black, both sexes................... 0.2 * * * * * * * * * Male............................ 0.2 * * * * * * * * * Female.......................... 0.1 * * * * * * * * *
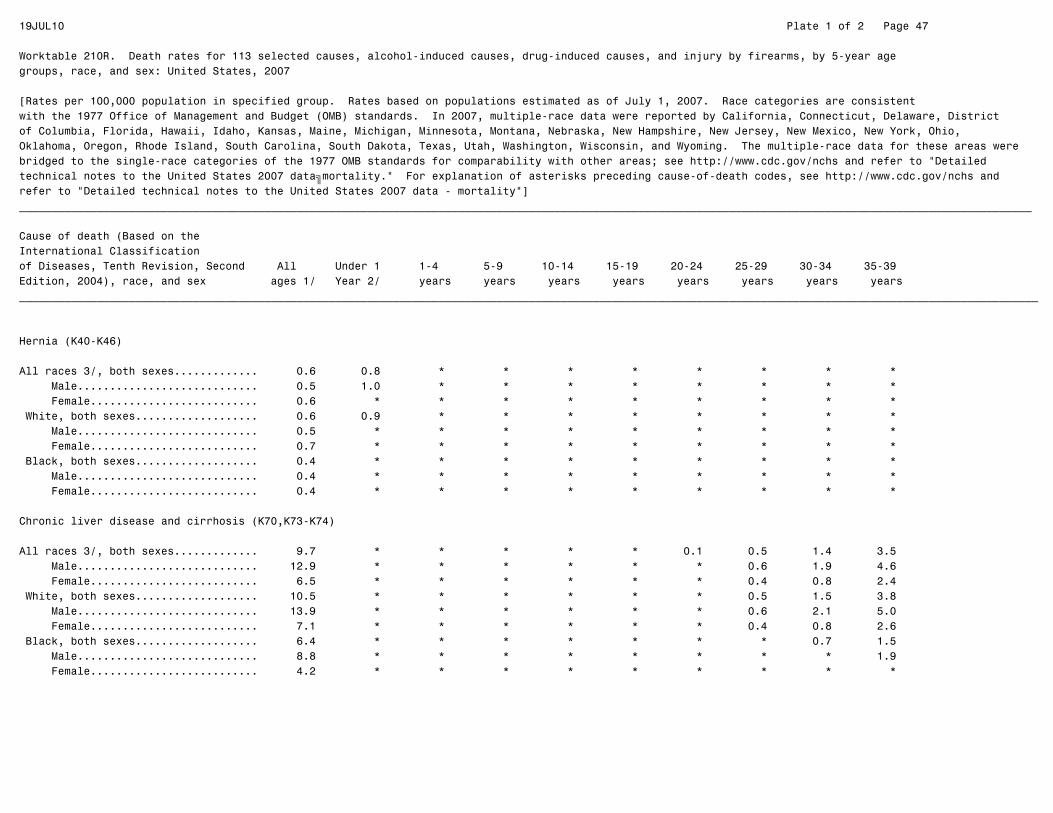
19JUL10 Plate 1 of 2 Page 47
Worktable 210R. Death rates for 113 selected causes, alcohol-induced causes, drug-induced causes, and injury by firearms, by 5-year agegroups, race, and sex: United States, 2007
[Rates per 100,000 population in specified group. Rates based on populations estimated as of July 1, 2007. Race categories are consistentwith the 1977 Office of Management and Budget (OMB) standards. In 2007, multiple-race data were reported by California, Connecticut, Delaware, Districtof Columbia, Florida, Hawaii, Idaho, Kansas, Maine, Michigan, Minnesota, Montana, Nebraska, New Hampshire, New Jersey, New Mexico, New York, Ohio,Oklahoma, Oregon, Rhode Island, South Carolina, South Dakota, Texas, Utah, Washington, Wisconsin, and Wyoming. The multiple-race data for these areas werebridged to the single-race categories of the 1977 OMB standards for comparability with other areas; see http://www.cdc.gov/nchs and refer to "Detailedtechnical notes to the United States 2007 data—mortality." For explanation of asterisks preceding cause-of-death codes, see http://www.cdc.gov/nchs andrefer to "Detailed technical notes to the United States 2007 data - mortality"]_____________________________________________________________________________________________________________________________________________________________
Cause of death (Based on theInternational Classificationof Diseases, Tenth Revision, Second All Under 1 1-4 5-9 10-14 15-19 20-24 25-29 30-34 35-39Edition, 2004), race, and sex ages 1/ Year 2/ years years years years years years years years______________________________________________________________________________________________________________________________________________________________
Hernia (K40-K46)
All races 3/, both sexes............. 0.6 0.8 * * * * * * * * Male............................ 0.5 1.0 * * * * * * * * Female.......................... 0.6 * * * * * * * * * White, both sexes................... 0.6 0.9 * * * * * * * * Male............................ 0.5 * * * * * * * * * Female.......................... 0.7 * * * * * * * * * Black, both sexes................... 0.4 * * * * * * * * * Male............................ 0.4 * * * * * * * * * Female.......................... 0.4 * * * * * * * * *
Chronic liver disease and cirrhosis (K70,K73-K74)
All races 3/, both sexes............. 9.7 * * * * * 0.1 0.5 1.4 3.5 Male............................ 12.9 * * * * * * 0.6 1.9 4.6 Female.......................... 6.5 * * * * * * 0.4 0.8 2.4 White, both sexes................... 10.5 * * * * * * 0.5 1.5 3.8 Male............................ 13.9 * * * * * * 0.6 2.1 5.0 Female.......................... 7.1 * * * * * * 0.4 0.8 2.6 Black, both sexes................... 6.4 * * * * * * * 0.7 1.5 Male............................ 8.8 * * * * * * * * 1.9 Female.......................... 4.2 * * * * * * * * *

19JUL10 Plate 1 of 2 Page 48
Worktable 210R. Death rates for 113 selected causes, alcohol-induced causes, drug-induced causes, and injury by firearms, by 5-year agegroups, race, and sex: United States, 2007
[Rates per 100,000 population in specified group. Rates based on populations estimated as of July 1, 2007. Race categories are consistentwith the 1977 Office of Management and Budget (OMB) standards. In 2007, multiple-race data were reported by California, Connecticut, Delaware, Districtof Columbia, Florida, Hawaii, Idaho, Kansas, Maine, Michigan, Minnesota, Montana, Nebraska, New Hampshire, New Jersey, New Mexico, New York, Ohio,Oklahoma, Oregon, Rhode Island, South Carolina, South Dakota, Texas, Utah, Washington, Wisconsin, and Wyoming. The multiple-race data for these areas werebridged to the single-race categories of the 1977 OMB standards for comparability with other areas; see http://www.cdc.gov/nchs and refer to "Detailedtechnical notes to the United States 2007 data—mortality." For explanation of asterisks preceding cause-of-death codes, see http://www.cdc.gov/nchs andrefer to "Detailed technical notes to the United States 2007 data - mortality"]_____________________________________________________________________________________________________________________________________________________________
Cause of death (Based on theInternational Classificationof Diseases, Tenth Revision, Second All Under 1 1-4 5-9 10-14 15-19 20-24 25-29 30-34 35-39Edition, 2004), race, and sex ages 1/ Year 2/ years years years years years years years years______________________________________________________________________________________________________________________________________________________________
Alcoholic liver disease (K70)
All races 3/, both sexes............. 4.8 * * * * * * 0.4 1.1 2.6 Male............................ 7.1 * * * * * * 0.5 1.5 3.4 Female.......................... 2.5 * * * * * * 0.3 0.6 1.8 White, both sexes................... 5.1 * * * * * * 0.4 1.1 2.8 Male............................ 7.7 * * * * * * 0.5 1.6 3.7 Female.......................... 2.7 * * * * * * 0.3 0.5 2.0 Black, both sexes................... 3.0 * * * * * * * * 1.0 Male............................ 4.5 * * * * * * * * * Female.......................... 1.7 * * * * * * * * *
Other chronic liver disease and cirrhosis (K73-K74)
All races 3/, both sexes............. 4.9 * * * * * * 0.1 0.3 0.9 Male............................ 5.8 * * * * * * * 0.5 1.2 Female.......................... 4.0 * * * * * * * 0.2 0.6 White, both sexes................... 5.3 * * * * * * * 0.4 0.9 Male............................ 6.2 * * * * * * * 0.5 1.3 Female.......................... 4.4 * * * * * * * * 0.6 Black, both sexes................... 3.4 * * * * * * * * * Male............................ 4.3 * * * * * * * * * Female.......................... 2.5 * * * * * * * * *
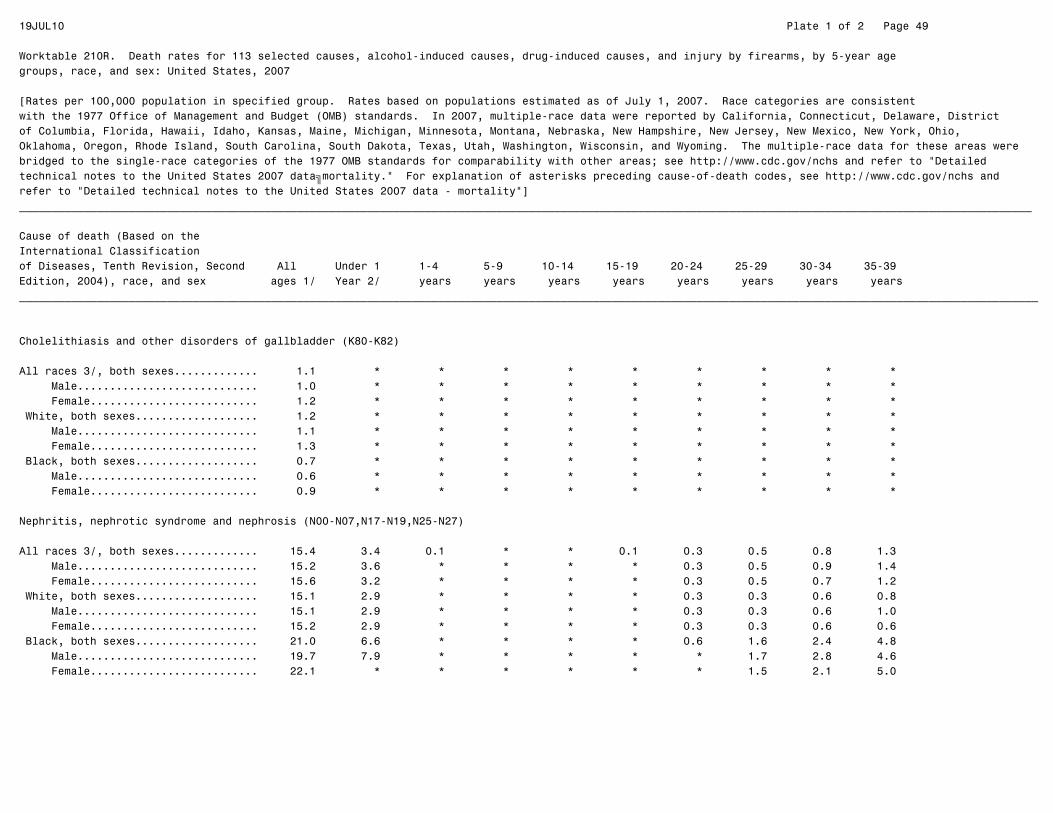
19JUL10 Plate 1 of 2 Page 49
Worktable 210R. Death rates for 113 selected causes, alcohol-induced causes, drug-induced causes, and injury by firearms, by 5-year agegroups, race, and sex: United States, 2007
[Rates per 100,000 population in specified group. Rates based on populations estimated as of July 1, 2007. Race categories are consistentwith the 1977 Office of Management and Budget (OMB) standards. In 2007, multiple-race data were reported by California, Connecticut, Delaware, Districtof Columbia, Florida, Hawaii, Idaho, Kansas, Maine, Michigan, Minnesota, Montana, Nebraska, New Hampshire, New Jersey, New Mexico, New York, Ohio,Oklahoma, Oregon, Rhode Island, South Carolina, South Dakota, Texas, Utah, Washington, Wisconsin, and Wyoming. The multiple-race data for these areas werebridged to the single-race categories of the 1977 OMB standards for comparability with other areas; see http://www.cdc.gov/nchs and refer to "Detailedtechnical notes to the United States 2007 data—mortality." For explanation of asterisks preceding cause-of-death codes, see http://www.cdc.gov/nchs andrefer to "Detailed technical notes to the United States 2007 data - mortality"]_____________________________________________________________________________________________________________________________________________________________
Cause of death (Based on theInternational Classificationof Diseases, Tenth Revision, Second All Under 1 1-4 5-9 10-14 15-19 20-24 25-29 30-34 35-39Edition, 2004), race, and sex ages 1/ Year 2/ years years years years years years years years______________________________________________________________________________________________________________________________________________________________
Cholelithiasis and other disorders of gallbladder (K80-K82)
All races 3/, both sexes............. 1.1 * * * * * * * * * Male............................ 1.0 * * * * * * * * * Female.......................... 1.2 * * * * * * * * * White, both sexes................... 1.2 * * * * * * * * * Male............................ 1.1 * * * * * * * * * Female.......................... 1.3 * * * * * * * * * Black, both sexes................... 0.7 * * * * * * * * * Male............................ 0.6 * * * * * * * * * Female.......................... 0.9 * * * * * * * * *
Nephritis, nephrotic syndrome and nephrosis (N00-N07,N17-N19,N25-N27)
All races 3/, both sexes............. 15.4 3.4 0.1 * * 0.1 0.3 0.5 0.8 1.3 Male............................ 15.2 3.6 * * * * 0.3 0.5 0.9 1.4 Female.......................... 15.6 3.2 * * * * 0.3 0.5 0.7 1.2 White, both sexes................... 15.1 2.9 * * * * 0.3 0.3 0.6 0.8 Male............................ 15.1 2.9 * * * * 0.3 0.3 0.6 1.0 Female.......................... 15.2 2.9 * * * * 0.3 0.3 0.6 0.6 Black, both sexes................... 21.0 6.6 * * * * 0.6 1.6 2.4 4.8 Male............................ 19.7 7.9 * * * * * 1.7 2.8 4.6 Female.......................... 22.1 * * * * * * 1.5 2.1 5.0

19JUL10 Plate 1 of 2 Page 50
Worktable 210R. Death rates for 113 selected causes, alcohol-induced causes, drug-induced causes, and injury by firearms, by 5-year agegroups, race, and sex: United States, 2007
[Rates per 100,000 population in specified group. Rates based on populations estimated as of July 1, 2007. Race categories are consistentwith the 1977 Office of Management and Budget (OMB) standards. In 2007, multiple-race data were reported by California, Connecticut, Delaware, Districtof Columbia, Florida, Hawaii, Idaho, Kansas, Maine, Michigan, Minnesota, Montana, Nebraska, New Hampshire, New Jersey, New Mexico, New York, Ohio,Oklahoma, Oregon, Rhode Island, South Carolina, South Dakota, Texas, Utah, Washington, Wisconsin, and Wyoming. The multiple-race data for these areas werebridged to the single-race categories of the 1977 OMB standards for comparability with other areas; see http://www.cdc.gov/nchs and refer to "Detailedtechnical notes to the United States 2007 data—mortality." For explanation of asterisks preceding cause-of-death codes, see http://www.cdc.gov/nchs andrefer to "Detailed technical notes to the United States 2007 data - mortality"]_____________________________________________________________________________________________________________________________________________________________
Cause of death (Based on theInternational Classificationof Diseases, Tenth Revision, Second All Under 1 1-4 5-9 10-14 15-19 20-24 25-29 30-34 35-39Edition, 2004), race, and sex ages 1/ Year 2/ years years years years years years years years______________________________________________________________________________________________________________________________________________________________
Acute and rapidly progressive nephritic and nephrotic syndrome (N00-N01,N04)
All races 3/, both sexes............. 0.1 * * * * * * * * * Male............................ 0.1 * * * * * * * * * Female.......................... 0.1 * * * * * * * * * White, both sexes................... 0.1 * * * * * * * * * Male............................ 0.1 * * * * * * * * * Female.......................... 0.1 * * * * * * * * * Black, both sexes................... 0.1 * * * * * * * * * Male............................ * * * * * * * * * * Female.......................... * * * * * * * * * *
Chronic glomerulonephritis, nephritis and nephropathy not specified as acute or chronic, and renal sclerosis unspecified (N02-N03,N05-N07,N26)
All races 3/, both sexes............. 1.0 * * * * * * * * * Male............................ 1.0 * * * * * * * * * Female.......................... 1.0 * * * * * * * * * White, both sexes................... 1.0 * * * * * * * * * Male............................ 1.0 * * * * * * * * * Female.......................... 1.0 * * * * * * * * * Black, both sexes................... 1.3 * * * * * * * * * Male............................ 1.2 * * * * * * * * * Female.......................... 1.4 * * * * * * * * *

19JUL10 Plate 1 of 2 Page 51
Worktable 210R. Death rates for 113 selected causes, alcohol-induced causes, drug-induced causes, and injury by firearms, by 5-year agegroups, race, and sex: United States, 2007
[Rates per 100,000 population in specified group. Rates based on populations estimated as of July 1, 2007. Race categories are consistentwith the 1977 Office of Management and Budget (OMB) standards. In 2007, multiple-race data were reported by California, Connecticut, Delaware, Districtof Columbia, Florida, Hawaii, Idaho, Kansas, Maine, Michigan, Minnesota, Montana, Nebraska, New Hampshire, New Jersey, New Mexico, New York, Ohio,Oklahoma, Oregon, Rhode Island, South Carolina, South Dakota, Texas, Utah, Washington, Wisconsin, and Wyoming. The multiple-race data for these areas werebridged to the single-race categories of the 1977 OMB standards for comparability with other areas; see http://www.cdc.gov/nchs and refer to "Detailedtechnical notes to the United States 2007 data—mortality." For explanation of asterisks preceding cause-of-death codes, see http://www.cdc.gov/nchs andrefer to "Detailed technical notes to the United States 2007 data - mortality"]_____________________________________________________________________________________________________________________________________________________________
Cause of death (Based on theInternational Classificationof Diseases, Tenth Revision, Second All Under 1 1-4 5-9 10-14 15-19 20-24 25-29 30-34 35-39Edition, 2004), race, and sex ages 1/ Year 2/ years years years years years years years years______________________________________________________________________________________________________________________________________________________________
Renal failure (N17-N19)
All races 3/, both sexes............. 14.3 3.2 * * * * 0.3 0.4 0.7 1.2 Male............................ 14.2 3.4 * * * * 0.3 0.5 0.8 1.4 Female.......................... 14.5 3.1 * * * * 0.3 0.4 0.7 1.1 White, both sexes................... 14.1 2.7 * * * * 0.2 0.3 0.5 0.8 Male............................ 14.0 2.6 * * * * * 0.3 0.5 0.9 Female.......................... 14.1 2.8 * * * * * 0.3 0.5 0.5 Black, both sexes................... 19.6 6.4 * * * * 0.6 1.4 2.3 4.5 Male............................ 18.4 7.9 * * * * * 1.5 2.4 4.6 Female.......................... 20.6 * * * * * * 1.3 2.1 4.5
Other disorders of kidney (N25,N27)
All races 3/, both sexes............. 0.0 * * * * * * * * * Male............................ * * * * * * * * * * Female.......................... * * * * * * * * * * White, both sexes................... * * * * * * * * * * Male............................ * * * * * * * * * * Female.......................... * * * * * * * * * * Black, both sexes................... * * * * * * * * * * Male............................ * * * * * * * * * * Female.......................... * * * * * * * * * *

19JUL10 Plate 1 of 2 Page 52
Worktable 210R. Death rates for 113 selected causes, alcohol-induced causes, drug-induced causes, and injury by firearms, by 5-year agegroups, race, and sex: United States, 2007
[Rates per 100,000 population in specified group. Rates based on populations estimated as of July 1, 2007. Race categories are consistentwith the 1977 Office of Management and Budget (OMB) standards. In 2007, multiple-race data were reported by California, Connecticut, Delaware, Districtof Columbia, Florida, Hawaii, Idaho, Kansas, Maine, Michigan, Minnesota, Montana, Nebraska, New Hampshire, New Jersey, New Mexico, New York, Ohio,Oklahoma, Oregon, Rhode Island, South Carolina, South Dakota, Texas, Utah, Washington, Wisconsin, and Wyoming. The multiple-race data for these areas werebridged to the single-race categories of the 1977 OMB standards for comparability with other areas; see http://www.cdc.gov/nchs and refer to "Detailedtechnical notes to the United States 2007 data—mortality." For explanation of asterisks preceding cause-of-death codes, see http://www.cdc.gov/nchs andrefer to "Detailed technical notes to the United States 2007 data - mortality"]_____________________________________________________________________________________________________________________________________________________________
Cause of death (Based on theInternational Classificationof Diseases, Tenth Revision, Second All Under 1 1-4 5-9 10-14 15-19 20-24 25-29 30-34 35-39Edition, 2004), race, and sex ages 1/ Year 2/ years years years years years years years years______________________________________________________________________________________________________________________________________________________________
Infections of kidney (N10-N12,N13.6,N15.1)
All races 3/, both sexes............. 0.2 * * * * * * * * * Male............................ 0.1 * * * * * * * * * Female.......................... 0.3 * * * * * * * * * White, both sexes................... 0.2 * * * * * * * * * Male............................ 0.2 * * * * * * * * * Female.......................... 0.3 * * * * * * * * * Black, both sexes................... 0.1 * * * * * * * * * Male............................ 0.1 * * * * * * * * * Female.......................... 0.2 * * * * * * * * *
Hyperplasia of prostate (N40)
All races 3/, both sexes............. 0.2 * * * * * * * * * Male............................ 0.3 * * * * * * * * * Female.......................... ... ... ... ... ... ... ... ... ... ... White, both sexes................... 0.2 * * * * * * * * * Male............................ 0.4 * * * * * * * * * Female.......................... ... ... ... ... ... ... ... ... ... ... Black, both sexes................... 0.1 * * * * * * * * * Male............................ 0.2 * * * * * * * * * Female.......................... ... ... ... ... ... ... ... ... ... ...

19JUL10 Plate 1 of 2 Page 53
Worktable 210R. Death rates for 113 selected causes, alcohol-induced causes, drug-induced causes, and injury by firearms, by 5-year agegroups, race, and sex: United States, 2007
[Rates per 100,000 population in specified group. Rates based on populations estimated as of July 1, 2007. Race categories are consistentwith the 1977 Office of Management and Budget (OMB) standards. In 2007, multiple-race data were reported by California, Connecticut, Delaware, Districtof Columbia, Florida, Hawaii, Idaho, Kansas, Maine, Michigan, Minnesota, Montana, Nebraska, New Hampshire, New Jersey, New Mexico, New York, Ohio,Oklahoma, Oregon, Rhode Island, South Carolina, South Dakota, Texas, Utah, Washington, Wisconsin, and Wyoming. The multiple-race data for these areas werebridged to the single-race categories of the 1977 OMB standards for comparability with other areas; see http://www.cdc.gov/nchs and refer to "Detailedtechnical notes to the United States 2007 data—mortality." For explanation of asterisks preceding cause-of-death codes, see http://www.cdc.gov/nchs andrefer to "Detailed technical notes to the United States 2007 data - mortality"]_____________________________________________________________________________________________________________________________________________________________
Cause of death (Based on theInternational Classificationof Diseases, Tenth Revision, Second All Under 1 1-4 5-9 10-14 15-19 20-24 25-29 30-34 35-39Edition, 2004), race, and sex ages 1/ Year 2/ years years years years years years years years______________________________________________________________________________________________________________________________________________________________
Inflammatory diseases of female pelvic organs (N70-N76)
All races 3/, both sexes............. 0.0 * * * * * * * * * Male............................ ... ... ... ... ... ... ... ... ... ... Female.......................... 0.1 * * * * * * * * * White, both sexes................... 0.0 * * * * * * * * * Male............................ ... ... ... ... ... ... ... ... ... ... Female.......................... 0.1 * * * * * * * * * Black, both sexes................... 0.0 * * * * * * * * * Male............................ ... ... ... ... ... ... ... ... ... ... Female.......................... 0.1 * * * * * * * * *
Pregnancy, childbirth and the puerperium (O00-O99)
All races 3/, both sexes............. 0.3 ... ... ... * 0.2 0.6 0.8 0.9 0.7 Male............................ ... ... ... ... ... ... ... ... ... ... Female.......................... 0.5 ... ... ... * 0.4 1.1 1.5 1.7 1.5 White, both sexes................... 0.2 ... ... ... * * 0.4 0.6 0.7 0.6 Male............................ ... ... ... ... ... ... ... ... ... ... Female.......................... 0.4 ... ... ... * * 0.8 1.1 1.4 1.2 Black, both sexes................... 0.6 ... ... ... * 0.6 1.5 1.8 1.9 1.5 Male............................ ... ... ... ... ... ... ... ... ... ... Female.......................... 1.2 ... ... ... * 1.1 3.1 3.6 3.7 2.9
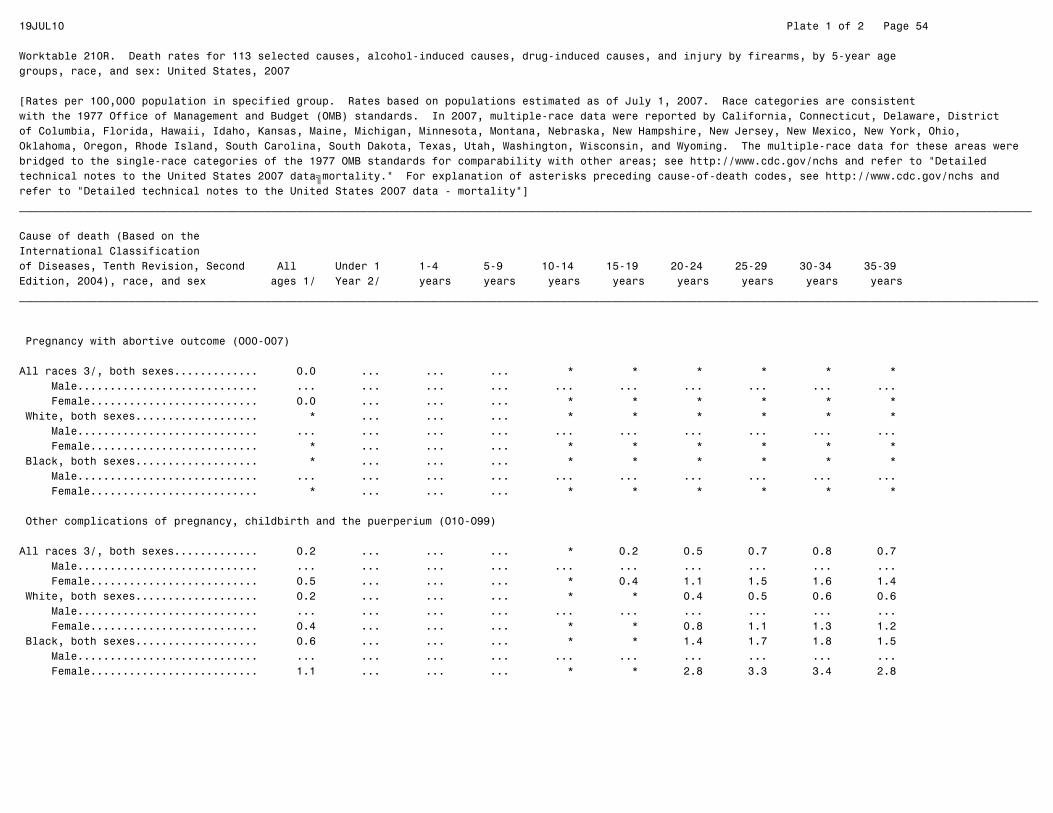
19JUL10 Plate 1 of 2 Page 54
Worktable 210R. Death rates for 113 selected causes, alcohol-induced causes, drug-induced causes, and injury by firearms, by 5-year agegroups, race, and sex: United States, 2007
[Rates per 100,000 population in specified group. Rates based on populations estimated as of July 1, 2007. Race categories are consistentwith the 1977 Office of Management and Budget (OMB) standards. In 2007, multiple-race data were reported by California, Connecticut, Delaware, Districtof Columbia, Florida, Hawaii, Idaho, Kansas, Maine, Michigan, Minnesota, Montana, Nebraska, New Hampshire, New Jersey, New Mexico, New York, Ohio,Oklahoma, Oregon, Rhode Island, South Carolina, South Dakota, Texas, Utah, Washington, Wisconsin, and Wyoming. The multiple-race data for these areas werebridged to the single-race categories of the 1977 OMB standards for comparability with other areas; see http://www.cdc.gov/nchs and refer to "Detailedtechnical notes to the United States 2007 data—mortality." For explanation of asterisks preceding cause-of-death codes, see http://www.cdc.gov/nchs andrefer to "Detailed technical notes to the United States 2007 data - mortality"]_____________________________________________________________________________________________________________________________________________________________
Cause of death (Based on theInternational Classificationof Diseases, Tenth Revision, Second All Under 1 1-4 5-9 10-14 15-19 20-24 25-29 30-34 35-39Edition, 2004), race, and sex ages 1/ Year 2/ years years years years years years years years______________________________________________________________________________________________________________________________________________________________
Pregnancy with abortive outcome (O00-O07)
All races 3/, both sexes............. 0.0 ... ... ... * * * * * * Male............................ ... ... ... ... ... ... ... ... ... ... Female.......................... 0.0 ... ... ... * * * * * * White, both sexes................... * ... ... ... * * * * * * Male............................ ... ... ... ... ... ... ... ... ... ... Female.......................... * ... ... ... * * * * * * Black, both sexes................... * ... ... ... * * * * * * Male............................ ... ... ... ... ... ... ... ... ... ... Female.......................... * ... ... ... * * * * * *
Other complications of pregnancy, childbirth and the puerperium (O10-O99)
All races 3/, both sexes............. 0.2 ... ... ... * 0.2 0.5 0.7 0.8 0.7 Male............................ ... ... ... ... ... ... ... ... ... ... Female.......................... 0.5 ... ... ... * 0.4 1.1 1.5 1.6 1.4 White, both sexes................... 0.2 ... ... ... * * 0.4 0.5 0.6 0.6 Male............................ ... ... ... ... ... ... ... ... ... ... Female.......................... 0.4 ... ... ... * * 0.8 1.1 1.3 1.2 Black, both sexes................... 0.6 ... ... ... * * 1.4 1.7 1.8 1.5 Male............................ ... ... ... ... ... ... ... ... ... ... Female.......................... 1.1 ... ... ... * * 2.8 3.3 3.4 2.8

19JUL10 Plate 1 of 2 Page 55
Worktable 210R. Death rates for 113 selected causes, alcohol-induced causes, drug-induced causes, and injury by firearms, by 5-year agegroups, race, and sex: United States, 2007
[Rates per 100,000 population in specified group. Rates based on populations estimated as of July 1, 2007. Race categories are consistentwith the 1977 Office of Management and Budget (OMB) standards. In 2007, multiple-race data were reported by California, Connecticut, Delaware, Districtof Columbia, Florida, Hawaii, Idaho, Kansas, Maine, Michigan, Minnesota, Montana, Nebraska, New Hampshire, New Jersey, New Mexico, New York, Ohio,Oklahoma, Oregon, Rhode Island, South Carolina, South Dakota, Texas, Utah, Washington, Wisconsin, and Wyoming. The multiple-race data for these areas werebridged to the single-race categories of the 1977 OMB standards for comparability with other areas; see http://www.cdc.gov/nchs and refer to "Detailedtechnical notes to the United States 2007 data—mortality." For explanation of asterisks preceding cause-of-death codes, see http://www.cdc.gov/nchs andrefer to "Detailed technical notes to the United States 2007 data - mortality"]_____________________________________________________________________________________________________________________________________________________________
Cause of death (Based on theInternational Classificationof Diseases, Tenth Revision, Second All Under 1 1-4 5-9 10-14 15-19 20-24 25-29 30-34 35-39Edition, 2004), race, and sex ages 1/ Year 2/ years years years years years years years years______________________________________________________________________________________________________________________________________________________________
Certain conditions originating in the perinatal period (P00-P96)
All races 3/, both sexes............. 4.8 339.8 0.4 * * * * * * * Male............................ 5.5 373.6 0.4 * * * * * * * Female.......................... 4.2 304.4 0.4 * * * * * * * White, both sexes................... 3.6 268.4 0.3 * * * * * * * Male............................ 4.1 294.5 * * * * * * * * Female.......................... 3.2 241.1 0.3 * * * * * * * Black, both sexes................... 12.6 700.6 1.0 * * * * * * * Male............................ 14.9 774.6 * * * * * * * * Female.......................... 10.6 623.6 * * * * * * * *
Congenital malformations, deformations and chromosomal abnormalities (Q00-Q99)
All races 3/, both sexes............. 3.5 135.9 3.3 1.0 0.9 0.9 1.0 1.1 1.0 1.1 Male............................ 3.7 140.7 3.4 1.0 0.9 1.0 1.2 1.2 1.1 1.1 Female.......................... 3.2 130.8 3.2 1.0 0.8 0.7 0.8 0.9 0.9 1.1 White, both sexes................... 3.3 132.7 3.1 0.9 0.8 0.8 1.0 1.0 1.0 1.1 Male............................ 3.6 138.8 3.2 0.9 0.9 0.9 1.1 1.2 1.0 1.1 Female.......................... 3.1 126.4 3.0 0.9 0.8 0.7 0.9 0.9 0.9 1.1 Black, both sexes................... 4.5 158.9 4.4 1.3 1.1 1.3 1.2 1.3 1.6 1.6 Male............................ 4.8 159.5 4.2 1.2 * 1.5 1.6 1.7 2.2 1.7 Female.......................... 4.2 158.3 4.6 1.3 * * * * * 1.4

19JUL10 Plate 1 of 2 Page 56
Worktable 210R. Death rates for 113 selected causes, alcohol-induced causes, drug-induced causes, and injury by firearms, by 5-year agegroups, race, and sex: United States, 2007
[Rates per 100,000 population in specified group. Rates based on populations estimated as of July 1, 2007. Race categories are consistentwith the 1977 Office of Management and Budget (OMB) standards. In 2007, multiple-race data were reported by California, Connecticut, Delaware, Districtof Columbia, Florida, Hawaii, Idaho, Kansas, Maine, Michigan, Minnesota, Montana, Nebraska, New Hampshire, New Jersey, New Mexico, New York, Ohio,Oklahoma, Oregon, Rhode Island, South Carolina, South Dakota, Texas, Utah, Washington, Wisconsin, and Wyoming. The multiple-race data for these areas werebridged to the single-race categories of the 1977 OMB standards for comparability with other areas; see http://www.cdc.gov/nchs and refer to "Detailedtechnical notes to the United States 2007 data—mortality." For explanation of asterisks preceding cause-of-death codes, see http://www.cdc.gov/nchs andrefer to "Detailed technical notes to the United States 2007 data - mortality"]_____________________________________________________________________________________________________________________________________________________________
Cause of death (Based on theInternational Classificationof Diseases, Tenth Revision, Second All Under 1 1-4 5-9 10-14 15-19 20-24 25-29 30-34 35-39Edition, 2004), race, and sex ages 1/ Year 2/ years years years years years years years years______________________________________________________________________________________________________________________________________________________________
Symptoms, signs and abnormal clinical and laboratory findings, not elsewhere classified (R00-R99)
All races 3/, both sexes............. 11.1 85.0 1.4 0.2 0.3 1.0 1.8 2.1 2.2 2.8 Male............................ 9.6 96.3 1.6 0.2 0.4 1.3 2.4 2.8 2.8 3.4 Female.......................... 12.6 73.1 1.3 0.2 0.3 0.6 1.1 1.4 1.6 2.2 White, both sexes................... 11.5 71.6 1.3 0.2 0.3 0.9 1.7 2.0 2.0 2.6 Male............................ 9.6 82.8 1.5 * 0.3 1.2 2.4 2.7 2.6 3.0 Female.......................... 13.4 59.8 1.2 * 0.3 0.6 1.0 1.2 1.4 2.2 Black, both sexes................... 11.6 154.6 1.8 * * 1.2 2.3 3.5 4.0 4.7 Male............................ 11.8 166.1 1.8 * * 1.7 3.0 4.5 5.2 6.2 Female.......................... 11.4 142.6 1.8 * * * 1.7 2.6 2.9 3.3
All other diseases (Residual) (D65-E07,E15-E34,E65-F99,G04-G12,G23-G25,G31-H93,K00-K22,K29-K31,K50-K66,K71-K72,K75-K76,K83-M99,N13.0-N13.5, N13.7-N13.9,N14,N15.0,N15.8-N15.9,N20-N23,N28-N39,N41-N64,N80-N98)
All races 3/, both sexes............. 79.0 31.4 3.6 1.9 2.4 3.6 5.6 6.9 8.7 12.6 Male............................ 64.9 35.8 3.9 2.2 2.8 4.2 6.3 7.8 9.6 14.2 Female.......................... 92.7 26.9 3.4 1.6 2.0 3.0 4.8 6.0 7.7 10.9 White, both sexes................... 85.0 25.5 3.1 1.8 2.3 3.5 5.3 6.4 7.7 11.5 Male............................ 68.7 28.9 3.4 2.0 2.6 4.2 6.2 7.4 8.9 13.3 Female.......................... 100.9 21.9 2.9 1.6 1.9 2.8 4.5 5.3 6.5 9.6 Black, both sexes................... 65.9 58.8 5.8 2.7 3.1 4.6 7.6 11.2 16.1 22.5 Male............................ 59.0 67.1 5.8 3.2 3.9 4.6 8.1 11.7 16.4 23.9 Female.......................... 72.2 50.2 5.7 2.2 2.3 4.5 7.1 10.8 15.9 21.3
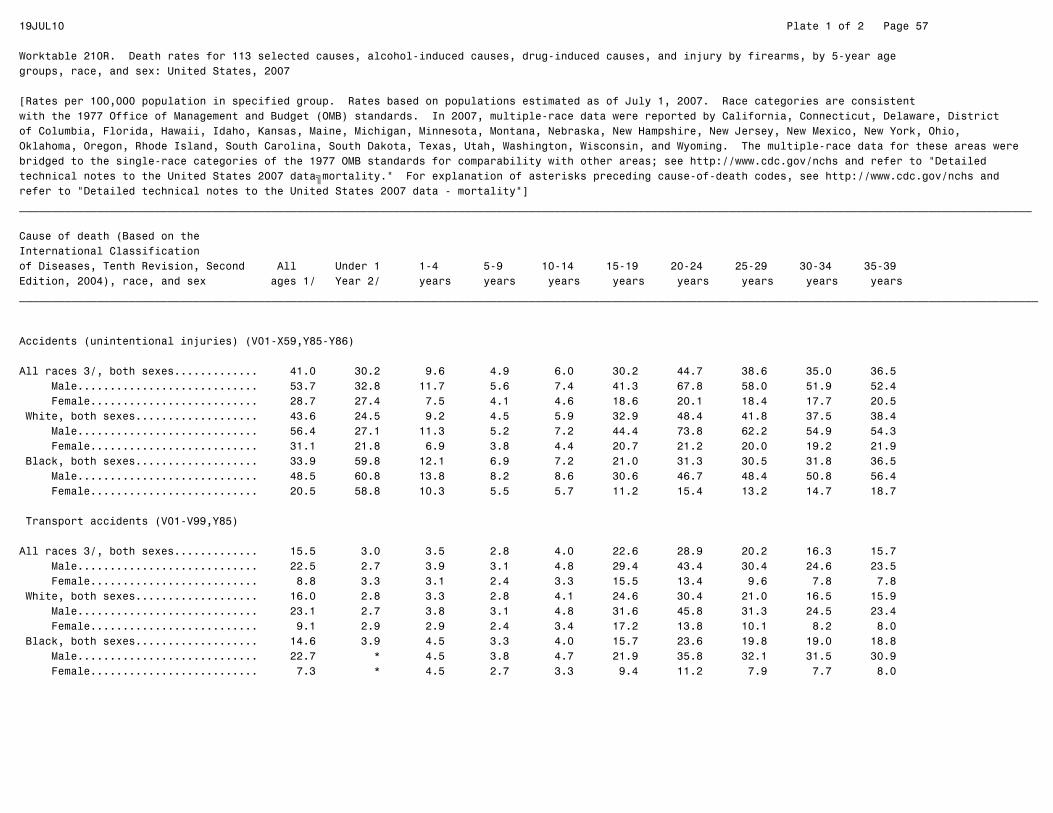
19JUL10 Plate 1 of 2 Page 57
Worktable 210R. Death rates for 113 selected causes, alcohol-induced causes, drug-induced causes, and injury by firearms, by 5-year agegroups, race, and sex: United States, 2007
[Rates per 100,000 population in specified group. Rates based on populations estimated as of July 1, 2007. Race categories are consistentwith the 1977 Office of Management and Budget (OMB) standards. In 2007, multiple-race data were reported by California, Connecticut, Delaware, Districtof Columbia, Florida, Hawaii, Idaho, Kansas, Maine, Michigan, Minnesota, Montana, Nebraska, New Hampshire, New Jersey, New Mexico, New York, Ohio,Oklahoma, Oregon, Rhode Island, South Carolina, South Dakota, Texas, Utah, Washington, Wisconsin, and Wyoming. The multiple-race data for these areas werebridged to the single-race categories of the 1977 OMB standards for comparability with other areas; see http://www.cdc.gov/nchs and refer to "Detailedtechnical notes to the United States 2007 data—mortality." For explanation of asterisks preceding cause-of-death codes, see http://www.cdc.gov/nchs andrefer to "Detailed technical notes to the United States 2007 data - mortality"]_____________________________________________________________________________________________________________________________________________________________
Cause of death (Based on theInternational Classificationof Diseases, Tenth Revision, Second All Under 1 1-4 5-9 10-14 15-19 20-24 25-29 30-34 35-39Edition, 2004), race, and sex ages 1/ Year 2/ years years years years years years years years______________________________________________________________________________________________________________________________________________________________
Accidents (unintentional injuries) (V01-X59,Y85-Y86)
All races 3/, both sexes............. 41.0 30.2 9.6 4.9 6.0 30.2 44.7 38.6 35.0 36.5 Male............................ 53.7 32.8 11.7 5.6 7.4 41.3 67.8 58.0 51.9 52.4 Female.......................... 28.7 27.4 7.5 4.1 4.6 18.6 20.1 18.4 17.7 20.5 White, both sexes................... 43.6 24.5 9.2 4.5 5.9 32.9 48.4 41.8 37.5 38.4 Male............................ 56.4 27.1 11.3 5.2 7.2 44.4 73.8 62.2 54.9 54.3 Female.......................... 31.1 21.8 6.9 3.8 4.4 20.7 21.2 20.0 19.2 21.9 Black, both sexes................... 33.9 59.8 12.1 6.9 7.2 21.0 31.3 30.5 31.8 36.5 Male............................ 48.5 60.8 13.8 8.2 8.6 30.6 46.7 48.4 50.8 56.4 Female.......................... 20.5 58.8 10.3 5.5 5.7 11.2 15.4 13.2 14.7 18.7
Transport accidents (V01-V99,Y85)
All races 3/, both sexes............. 15.5 3.0 3.5 2.8 4.0 22.6 28.9 20.2 16.3 15.7 Male............................ 22.5 2.7 3.9 3.1 4.8 29.4 43.4 30.4 24.6 23.5 Female.......................... 8.8 3.3 3.1 2.4 3.3 15.5 13.4 9.6 7.8 7.8 White, both sexes................... 16.0 2.8 3.3 2.8 4.1 24.6 30.4 21.0 16.5 15.9 Male............................ 23.1 2.7 3.8 3.1 4.8 31.6 45.8 31.3 24.5 23.4 Female.......................... 9.1 2.9 2.9 2.4 3.4 17.2 13.8 10.1 8.2 8.0 Black, both sexes................... 14.6 3.9 4.5 3.3 4.0 15.7 23.6 19.8 19.0 18.8 Male............................ 22.7 * 4.5 3.8 4.7 21.9 35.8 32.1 31.5 30.9 Female.......................... 7.3 * 4.5 2.7 3.3 9.4 11.2 7.9 7.7 8.0

19JUL10 Plate 1 of 2 Page 58
Worktable 210R. Death rates for 113 selected causes, alcohol-induced causes, drug-induced causes, and injury by firearms, by 5-year agegroups, race, and sex: United States, 2007
[Rates per 100,000 population in specified group. Rates based on populations estimated as of July 1, 2007. Race categories are consistentwith the 1977 Office of Management and Budget (OMB) standards. In 2007, multiple-race data were reported by California, Connecticut, Delaware, Districtof Columbia, Florida, Hawaii, Idaho, Kansas, Maine, Michigan, Minnesota, Montana, Nebraska, New Hampshire, New Jersey, New Mexico, New York, Ohio,Oklahoma, Oregon, Rhode Island, South Carolina, South Dakota, Texas, Utah, Washington, Wisconsin, and Wyoming. The multiple-race data for these areas werebridged to the single-race categories of the 1977 OMB standards for comparability with other areas; see http://www.cdc.gov/nchs and refer to "Detailedtechnical notes to the United States 2007 data—mortality." For explanation of asterisks preceding cause-of-death codes, see http://www.cdc.gov/nchs andrefer to "Detailed technical notes to the United States 2007 data - mortality"]_____________________________________________________________________________________________________________________________________________________________
Cause of death (Based on theInternational Classificationof Diseases, Tenth Revision, Second All Under 1 1-4 5-9 10-14 15-19 20-24 25-29 30-34 35-39Edition, 2004), race, and sex ages 1/ Year 2/ years years years years years years years years______________________________________________________________________________________________________________________________________________________________
Motor vehicle accidents (V02-V04,V09.0,V09.2,V12-V14,V19.0-V19.2,V19.4-V19.6,V20-V79,V80.3-V80.5,V81.0-V81.1,V82.0-V82.1,V83-V86,V87.0-V87.8, V88.0-V88.8,V89.0,V89.2)
All races 3/, both sexes............. 14.6 2.9 3.3 2.6 3.8 22.0 27.8 19.4 15.4 14.7 Male............................ 20.9 2.6 3.7 2.9 4.5 28.5 41.7 29.0 23.1 21.8 Female.......................... 8.4 3.2 3.0 2.3 3.0 15.2 12.9 9.3 7.4 7.5 White, both sexes................... 15.0 2.8 3.1 2.6 3.8 23.9 29.3 20.1 15.5 14.8 Male............................ 21.5 2.7 3.6 2.9 4.6 30.6 44.1 29.9 22.9 21.6 Female.......................... 8.8 2.8 2.7 2.3 3.0 16.8 13.3 9.8 7.8 7.7 Black, both sexes................... 13.8 3.8 4.3 3.0 3.8 15.1 22.6 19.1 18.2 17.9 Male............................ 21.2 * 4.3 3.5 4.4 21.0 34.4 30.9 30.3 29.3 Female.......................... 7.0 * 4.4 2.5 3.2 9.1 10.6 7.7 7.2 7.8
Other land transport accidents (V01,V05-V06,V09.1,V09.3-V09.9,V10-V11,V15-V18,V19.3,V19.8-V19.9,V80.0-V80.2,V80.6-V80.9,V81.2-V81.9, V82.2-V82.9,V87.9,V88.9,V89.1,V89.3,V89.9)
All races 3/, both sexes............. 0.4 * * * 0.2 0.3 0.5 0.3 0.3 0.4 Male............................ 0.6 * * * * 0.5 0.7 0.6 0.5 0.6 Female.......................... 0.1 * * * 0.2 0.2 0.2 * * * White, both sexes................... 0.3 * * * 0.2 0.3 0.5 0.4 0.3 0.3 Male............................ 0.6 * * * * 0.5 0.8 0.6 0.5 0.6 Female.......................... 0.1 * * * * * * * * * Black, both sexes................... 0.4 * * * * * * * * * Male............................ 0.7 * * * * * * * * * Female.......................... 0.2 * * * * * * * * *
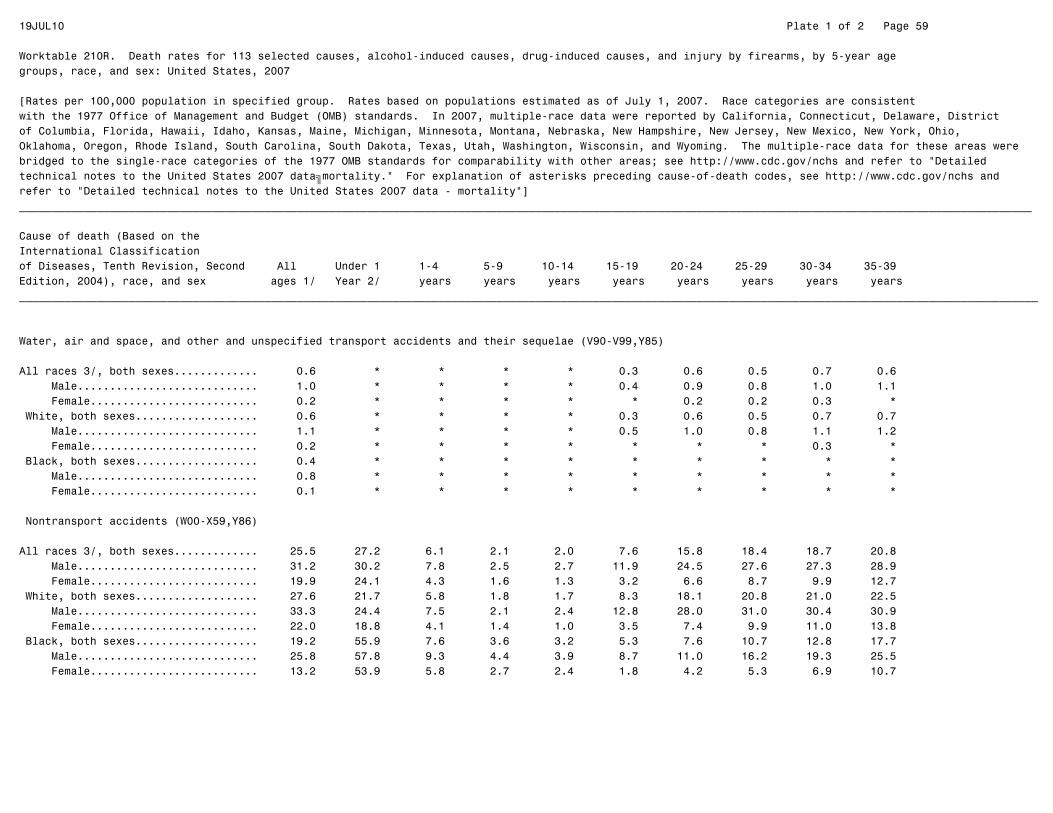
19JUL10 Plate 1 of 2 Page 59
Worktable 210R. Death rates for 113 selected causes, alcohol-induced causes, drug-induced causes, and injury by firearms, by 5-year agegroups, race, and sex: United States, 2007
[Rates per 100,000 population in specified group. Rates based on populations estimated as of July 1, 2007. Race categories are consistentwith the 1977 Office of Management and Budget (OMB) standards. In 2007, multiple-race data were reported by California, Connecticut, Delaware, Districtof Columbia, Florida, Hawaii, Idaho, Kansas, Maine, Michigan, Minnesota, Montana, Nebraska, New Hampshire, New Jersey, New Mexico, New York, Ohio,Oklahoma, Oregon, Rhode Island, South Carolina, South Dakota, Texas, Utah, Washington, Wisconsin, and Wyoming. The multiple-race data for these areas werebridged to the single-race categories of the 1977 OMB standards for comparability with other areas; see http://www.cdc.gov/nchs and refer to "Detailedtechnical notes to the United States 2007 data—mortality." For explanation of asterisks preceding cause-of-death codes, see http://www.cdc.gov/nchs andrefer to "Detailed technical notes to the United States 2007 data - mortality"]_____________________________________________________________________________________________________________________________________________________________
Cause of death (Based on theInternational Classificationof Diseases, Tenth Revision, Second All Under 1 1-4 5-9 10-14 15-19 20-24 25-29 30-34 35-39Edition, 2004), race, and sex ages 1/ Year 2/ years years years years years years years years______________________________________________________________________________________________________________________________________________________________
Water, air and space, and other and unspecified transport accidents and their sequelae (V90-V99,Y85)
All races 3/, both sexes............. 0.6 * * * * 0.3 0.6 0.5 0.7 0.6 Male............................ 1.0 * * * * 0.4 0.9 0.8 1.0 1.1 Female.......................... 0.2 * * * * * 0.2 0.2 0.3 * White, both sexes................... 0.6 * * * * 0.3 0.6 0.5 0.7 0.7 Male............................ 1.1 * * * * 0.5 1.0 0.8 1.1 1.2 Female.......................... 0.2 * * * * * * * 0.3 * Black, both sexes................... 0.4 * * * * * * * * * Male............................ 0.8 * * * * * * * * * Female.......................... 0.1 * * * * * * * * *
Nontransport accidents (W00-X59,Y86)
All races 3/, both sexes............. 25.5 27.2 6.1 2.1 2.0 7.6 15.8 18.4 18.7 20.8 Male............................ 31.2 30.2 7.8 2.5 2.7 11.9 24.5 27.6 27.3 28.9 Female.......................... 19.9 24.1 4.3 1.6 1.3 3.2 6.6 8.7 9.9 12.7 White, both sexes................... 27.6 21.7 5.8 1.8 1.7 8.3 18.1 20.8 21.0 22.5 Male............................ 33.3 24.4 7.5 2.1 2.4 12.8 28.0 31.0 30.4 30.9 Female.......................... 22.0 18.8 4.1 1.4 1.0 3.5 7.4 9.9 11.0 13.8 Black, both sexes................... 19.2 55.9 7.6 3.6 3.2 5.3 7.6 10.7 12.8 17.7 Male............................ 25.8 57.8 9.3 4.4 3.9 8.7 11.0 16.2 19.3 25.5 Female.......................... 13.2 53.9 5.8 2.7 2.4 1.8 4.2 5.3 6.9 10.7
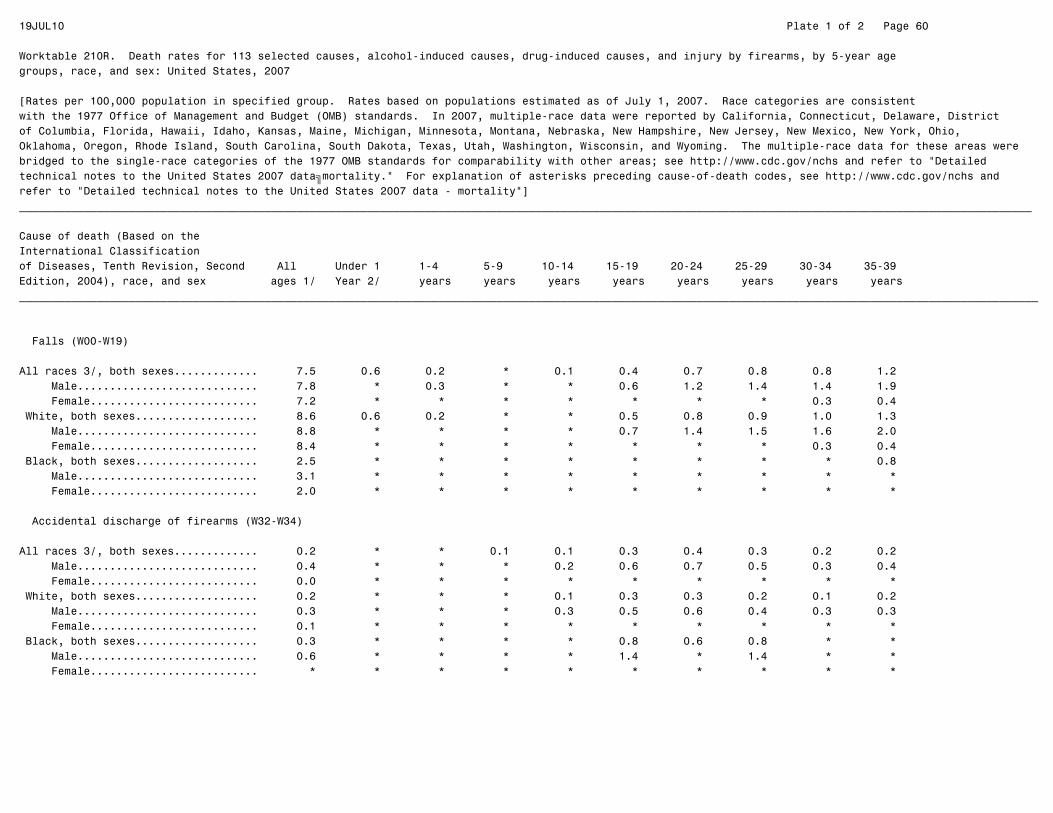
19JUL10 Plate 1 of 2 Page 60
Worktable 210R. Death rates for 113 selected causes, alcohol-induced causes, drug-induced causes, and injury by firearms, by 5-year agegroups, race, and sex: United States, 2007
[Rates per 100,000 population in specified group. Rates based on populations estimated as of July 1, 2007. Race categories are consistentwith the 1977 Office of Management and Budget (OMB) standards. In 2007, multiple-race data were reported by California, Connecticut, Delaware, Districtof Columbia, Florida, Hawaii, Idaho, Kansas, Maine, Michigan, Minnesota, Montana, Nebraska, New Hampshire, New Jersey, New Mexico, New York, Ohio,Oklahoma, Oregon, Rhode Island, South Carolina, South Dakota, Texas, Utah, Washington, Wisconsin, and Wyoming. The multiple-race data for these areas werebridged to the single-race categories of the 1977 OMB standards for comparability with other areas; see http://www.cdc.gov/nchs and refer to "Detailedtechnical notes to the United States 2007 data—mortality." For explanation of asterisks preceding cause-of-death codes, see http://www.cdc.gov/nchs andrefer to "Detailed technical notes to the United States 2007 data - mortality"]_____________________________________________________________________________________________________________________________________________________________
Cause of death (Based on theInternational Classificationof Diseases, Tenth Revision, Second All Under 1 1-4 5-9 10-14 15-19 20-24 25-29 30-34 35-39Edition, 2004), race, and sex ages 1/ Year 2/ years years years years years years years years______________________________________________________________________________________________________________________________________________________________
Falls (W00-W19)
All races 3/, both sexes............. 7.5 0.6 0.2 * 0.1 0.4 0.7 0.8 0.8 1.2 Male............................ 7.8 * 0.3 * * 0.6 1.2 1.4 1.4 1.9 Female.......................... 7.2 * * * * * * * 0.3 0.4 White, both sexes................... 8.6 0.6 0.2 * * 0.5 0.8 0.9 1.0 1.3 Male............................ 8.8 * * * * 0.7 1.4 1.5 1.6 2.0 Female.......................... 8.4 * * * * * * * 0.3 0.4 Black, both sexes................... 2.5 * * * * * * * * 0.8 Male............................ 3.1 * * * * * * * * * Female.......................... 2.0 * * * * * * * * *
Accidental discharge of firearms (W32-W34)
All races 3/, both sexes............. 0.2 * * 0.1 0.1 0.3 0.4 0.3 0.2 0.2 Male............................ 0.4 * * * 0.2 0.6 0.7 0.5 0.3 0.4 Female.......................... 0.0 * * * * * * * * * White, both sexes................... 0.2 * * * 0.1 0.3 0.3 0.2 0.1 0.2 Male............................ 0.3 * * * 0.3 0.5 0.6 0.4 0.3 0.3 Female.......................... 0.1 * * * * * * * * * Black, both sexes................... 0.3 * * * * 0.8 0.6 0.8 * * Male............................ 0.6 * * * * 1.4 * 1.4 * * Female.......................... * * * * * * * * * *
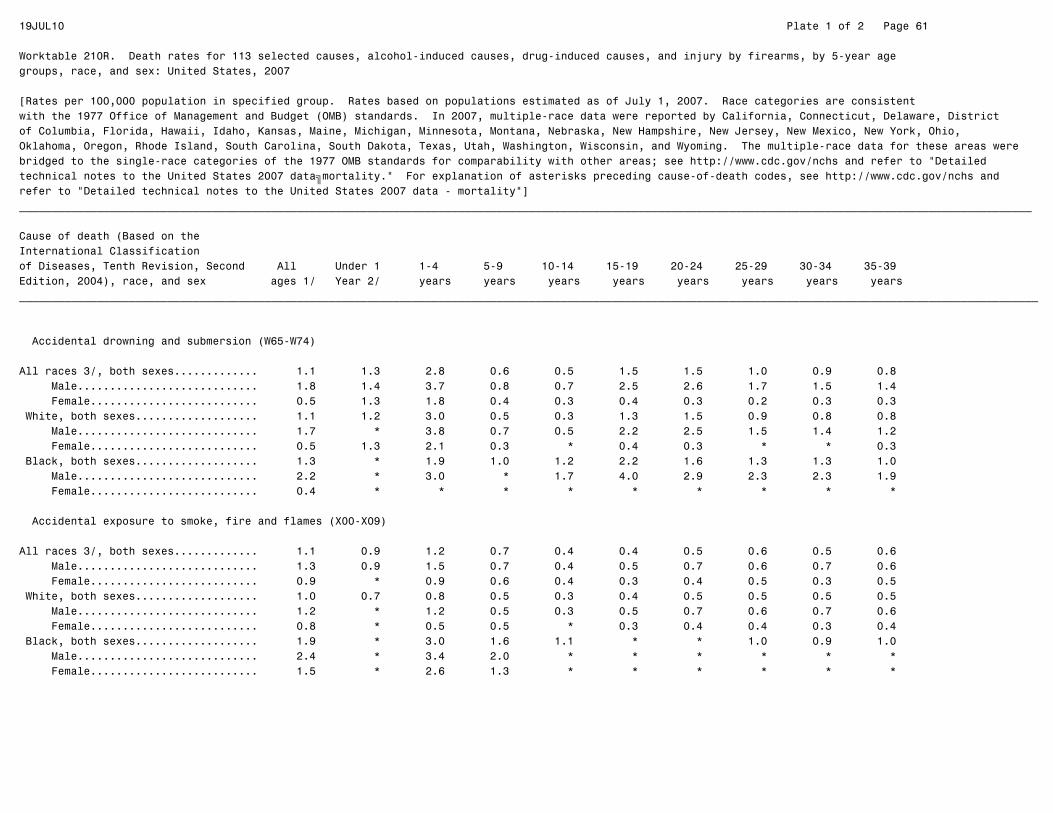
19JUL10 Plate 1 of 2 Page 61
Worktable 210R. Death rates for 113 selected causes, alcohol-induced causes, drug-induced causes, and injury by firearms, by 5-year agegroups, race, and sex: United States, 2007
[Rates per 100,000 population in specified group. Rates based on populations estimated as of July 1, 2007. Race categories are consistentwith the 1977 Office of Management and Budget (OMB) standards. In 2007, multiple-race data were reported by California, Connecticut, Delaware, Districtof Columbia, Florida, Hawaii, Idaho, Kansas, Maine, Michigan, Minnesota, Montana, Nebraska, New Hampshire, New Jersey, New Mexico, New York, Ohio,Oklahoma, Oregon, Rhode Island, South Carolina, South Dakota, Texas, Utah, Washington, Wisconsin, and Wyoming. The multiple-race data for these areas werebridged to the single-race categories of the 1977 OMB standards for comparability with other areas; see http://www.cdc.gov/nchs and refer to "Detailedtechnical notes to the United States 2007 data—mortality." For explanation of asterisks preceding cause-of-death codes, see http://www.cdc.gov/nchs andrefer to "Detailed technical notes to the United States 2007 data - mortality"]_____________________________________________________________________________________________________________________________________________________________
Cause of death (Based on theInternational Classificationof Diseases, Tenth Revision, Second All Under 1 1-4 5-9 10-14 15-19 20-24 25-29 30-34 35-39Edition, 2004), race, and sex ages 1/ Year 2/ years years years years years years years years______________________________________________________________________________________________________________________________________________________________
Accidental drowning and submersion (W65-W74)
All races 3/, both sexes............. 1.1 1.3 2.8 0.6 0.5 1.5 1.5 1.0 0.9 0.8 Male............................ 1.8 1.4 3.7 0.8 0.7 2.5 2.6 1.7 1.5 1.4 Female.......................... 0.5 1.3 1.8 0.4 0.3 0.4 0.3 0.2 0.3 0.3 White, both sexes................... 1.1 1.2 3.0 0.5 0.3 1.3 1.5 0.9 0.8 0.8 Male............................ 1.7 * 3.8 0.7 0.5 2.2 2.5 1.5 1.4 1.2 Female.......................... 0.5 1.3 2.1 0.3 * 0.4 0.3 * * 0.3 Black, both sexes................... 1.3 * 1.9 1.0 1.2 2.2 1.6 1.3 1.3 1.0 Male............................ 2.2 * 3.0 * 1.7 4.0 2.9 2.3 2.3 1.9 Female.......................... 0.4 * * * * * * * * *
Accidental exposure to smoke, fire and flames (X00-X09)
All races 3/, both sexes............. 1.1 0.9 1.2 0.7 0.4 0.4 0.5 0.6 0.5 0.6 Male............................ 1.3 0.9 1.5 0.7 0.4 0.5 0.7 0.6 0.7 0.6 Female.......................... 0.9 * 0.9 0.6 0.4 0.3 0.4 0.5 0.3 0.5 White, both sexes................... 1.0 0.7 0.8 0.5 0.3 0.4 0.5 0.5 0.5 0.5 Male............................ 1.2 * 1.2 0.5 0.3 0.5 0.7 0.6 0.7 0.6 Female.......................... 0.8 * 0.5 0.5 * 0.3 0.4 0.4 0.3 0.4 Black, both sexes................... 1.9 * 3.0 1.6 1.1 * * 1.0 0.9 1.0 Male............................ 2.4 * 3.4 2.0 * * * * * * Female.......................... 1.5 * 2.6 1.3 * * * * * *

19JUL10 Plate 1 of 2 Page 62
Worktable 210R. Death rates for 113 selected causes, alcohol-induced causes, drug-induced causes, and injury by firearms, by 5-year agegroups, race, and sex: United States, 2007
[Rates per 100,000 population in specified group. Rates based on populations estimated as of July 1, 2007. Race categories are consistentwith the 1977 Office of Management and Budget (OMB) standards. In 2007, multiple-race data were reported by California, Connecticut, Delaware, Districtof Columbia, Florida, Hawaii, Idaho, Kansas, Maine, Michigan, Minnesota, Montana, Nebraska, New Hampshire, New Jersey, New Mexico, New York, Ohio,Oklahoma, Oregon, Rhode Island, South Carolina, South Dakota, Texas, Utah, Washington, Wisconsin, and Wyoming. The multiple-race data for these areas werebridged to the single-race categories of the 1977 OMB standards for comparability with other areas; see http://www.cdc.gov/nchs and refer to "Detailedtechnical notes to the United States 2007 data—mortality." For explanation of asterisks preceding cause-of-death codes, see http://www.cdc.gov/nchs andrefer to "Detailed technical notes to the United States 2007 data - mortality"]_____________________________________________________________________________________________________________________________________________________________
Cause of death (Based on theInternational Classificationof Diseases, Tenth Revision, Second All Under 1 1-4 5-9 10-14 15-19 20-24 25-29 30-34 35-39Edition, 2004), race, and sex ages 1/ Year 2/ years years years years years years years years______________________________________________________________________________________________________________________________________________________________
Accidental poisoning and exposure to noxious substances (X40-X49)
All races 3/, both sexes............. 9.9 * 0.2 * 0.3 3.9 11.0 13.9 14.2 15.8 Male............................ 13.2 * * * 0.4 5.8 16.5 20.3 20.0 21.0 Female.......................... 6.7 * * * 0.3 1.9 5.2 7.1 8.3 10.6 White, both sexes................... 10.7 * * * 0.3 4.7 13.0 16.3 16.3 17.5 Male............................ 14.2 * * * 0.4 7.0 19.5 23.7 22.9 23.0 Female.......................... 7.2 * * * 0.3 2.2 6.0 8.4 9.4 11.8 Black, both sexes................... 8.2 * * * * 1.0 3.6 5.5 8.3 12.0 Male............................ 11.2 * * * * 1.5 4.7 8.0 12.0 16.3 Female.......................... 5.4 * * * * * 2.5 3.1 4.9 8.1
Other and unspecified nontransport accidents and their sequelae (W20-W31,W35-W64,W75-W99,X10-X39,X50-X59,Y86)
All races 3/, both sexes............. 5.7 23.9 1.6 0.6 0.6 1.1 1.7 1.9 2.1 2.2 Male............................ 6.7 26.5 1.9 0.7 0.8 1.8 2.9 3.1 3.4 3.6 Female.......................... 4.6 21.2 1.2 0.5 0.3 0.4 0.5 0.6 0.7 0.8 White, both sexes................... 6.0 18.9 1.6 0.6 0.6 1.2 1.9 2.0 2.2 2.3 Male............................ 7.0 21.5 1.9 0.7 0.8 2.0 3.2 3.3 3.6 3.7 Female.......................... 4.9 16.2 1.2 0.4 0.3 0.4 0.5 0.6 0.7 0.8 Black, both sexes................... 5.0 49.8 1.8 * * 0.7 0.9 1.7 1.8 2.5 Male............................ 6.2 50.7 2.1 * * 1.1 * 2.7 2.7 3.9 Female.......................... 3.9 48.8 * * * * * * * *
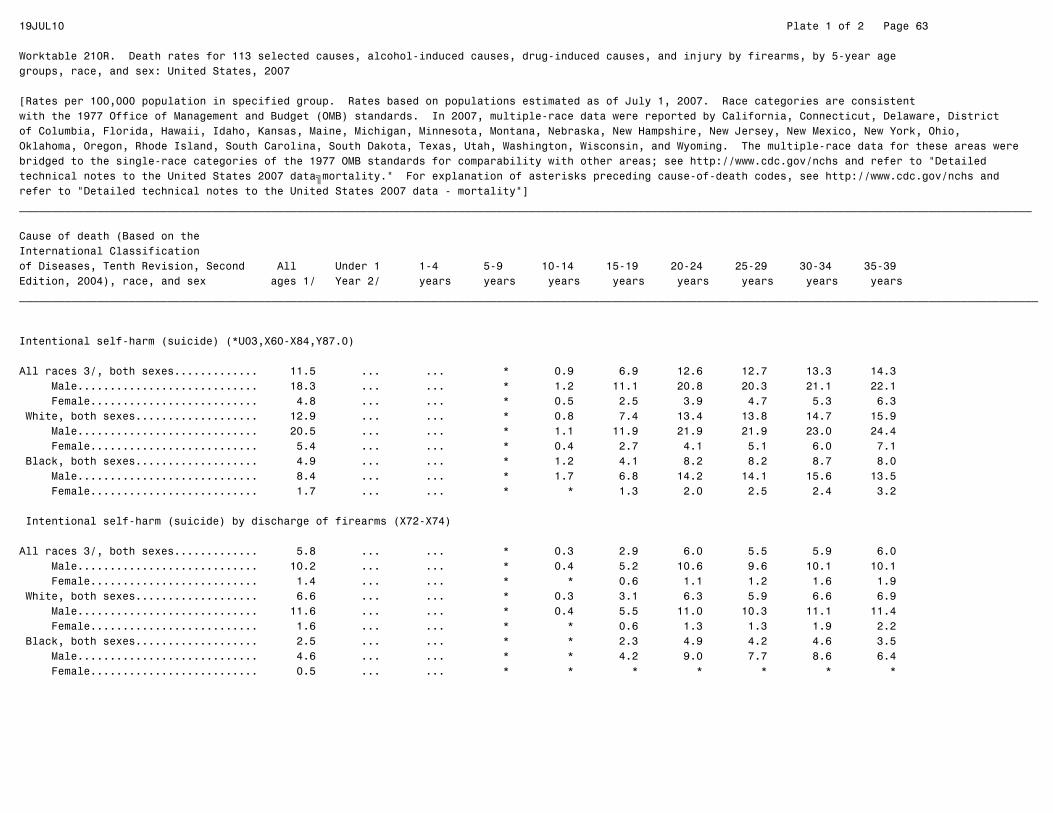
19JUL10 Plate 1 of 2 Page 63
Worktable 210R. Death rates for 113 selected causes, alcohol-induced causes, drug-induced causes, and injury by firearms, by 5-year agegroups, race, and sex: United States, 2007
[Rates per 100,000 population in specified group. Rates based on populations estimated as of July 1, 2007. Race categories are consistentwith the 1977 Office of Management and Budget (OMB) standards. In 2007, multiple-race data were reported by California, Connecticut, Delaware, Districtof Columbia, Florida, Hawaii, Idaho, Kansas, Maine, Michigan, Minnesota, Montana, Nebraska, New Hampshire, New Jersey, New Mexico, New York, Ohio,Oklahoma, Oregon, Rhode Island, South Carolina, South Dakota, Texas, Utah, Washington, Wisconsin, and Wyoming. The multiple-race data for these areas werebridged to the single-race categories of the 1977 OMB standards for comparability with other areas; see http://www.cdc.gov/nchs and refer to "Detailedtechnical notes to the United States 2007 data—mortality." For explanation of asterisks preceding cause-of-death codes, see http://www.cdc.gov/nchs andrefer to "Detailed technical notes to the United States 2007 data - mortality"]_____________________________________________________________________________________________________________________________________________________________
Cause of death (Based on theInternational Classificationof Diseases, Tenth Revision, Second All Under 1 1-4 5-9 10-14 15-19 20-24 25-29 30-34 35-39Edition, 2004), race, and sex ages 1/ Year 2/ years years years years years years years years______________________________________________________________________________________________________________________________________________________________
Intentional self-harm (suicide) (*U03,X60-X84,Y87.0)
All races 3/, both sexes............. 11.5 ... ... * 0.9 6.9 12.6 12.7 13.3 14.3 Male............................ 18.3 ... ... * 1.2 11.1 20.8 20.3 21.1 22.1 Female.......................... 4.8 ... ... * 0.5 2.5 3.9 4.7 5.3 6.3 White, both sexes................... 12.9 ... ... * 0.8 7.4 13.4 13.8 14.7 15.9 Male............................ 20.5 ... ... * 1.1 11.9 21.9 21.9 23.0 24.4 Female.......................... 5.4 ... ... * 0.4 2.7 4.1 5.1 6.0 7.1 Black, both sexes................... 4.9 ... ... * 1.2 4.1 8.2 8.2 8.7 8.0 Male............................ 8.4 ... ... * 1.7 6.8 14.2 14.1 15.6 13.5 Female.......................... 1.7 ... ... * * 1.3 2.0 2.5 2.4 3.2
Intentional self-harm (suicide) by discharge of firearms (X72-X74)
All races 3/, both sexes............. 5.8 ... ... * 0.3 2.9 6.0 5.5 5.9 6.0 Male............................ 10.2 ... ... * 0.4 5.2 10.6 9.6 10.1 10.1 Female.......................... 1.4 ... ... * * 0.6 1.1 1.2 1.6 1.9 White, both sexes................... 6.6 ... ... * 0.3 3.1 6.3 5.9 6.6 6.9 Male............................ 11.6 ... ... * 0.4 5.5 11.0 10.3 11.1 11.4 Female.......................... 1.6 ... ... * * 0.6 1.3 1.3 1.9 2.2 Black, both sexes................... 2.5 ... ... * * 2.3 4.9 4.2 4.6 3.5 Male............................ 4.6 ... ... * * 4.2 9.0 7.7 8.6 6.4 Female.......................... 0.5 ... ... * * * * * * *
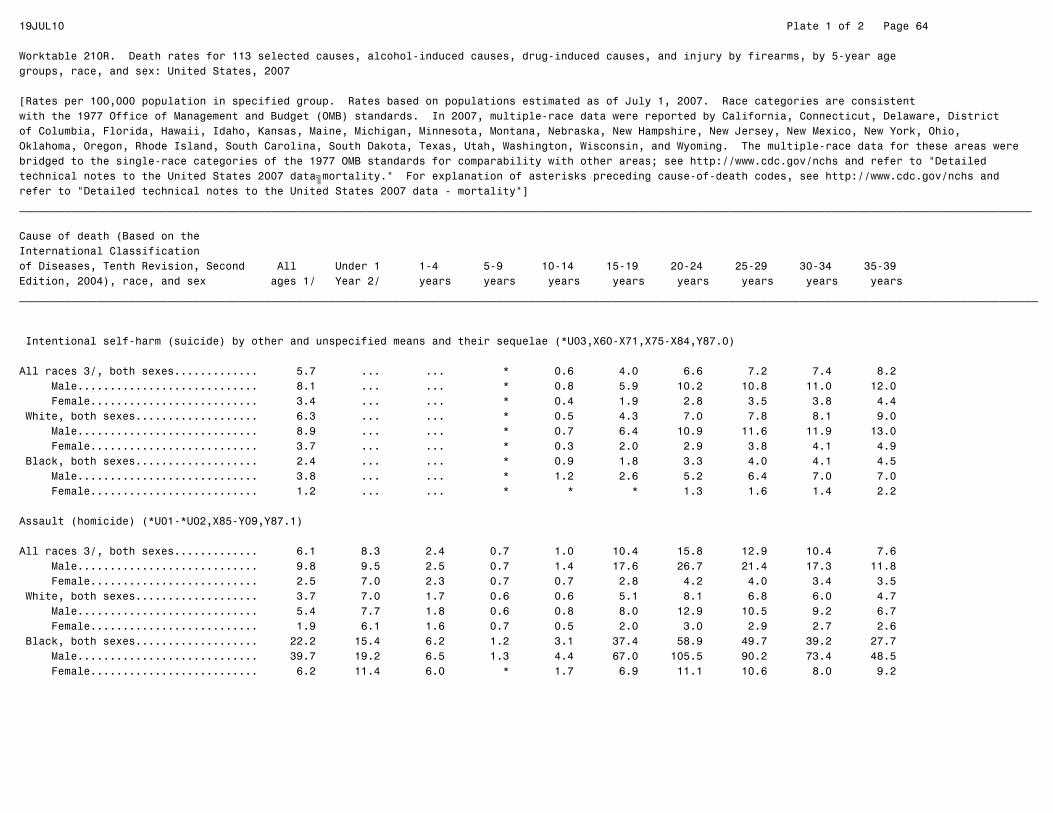
19JUL10 Plate 1 of 2 Page 64
Worktable 210R. Death rates for 113 selected causes, alcohol-induced causes, drug-induced causes, and injury by firearms, by 5-year agegroups, race, and sex: United States, 2007
[Rates per 100,000 population in specified group. Rates based on populations estimated as of July 1, 2007. Race categories are consistentwith the 1977 Office of Management and Budget (OMB) standards. In 2007, multiple-race data were reported by California, Connecticut, Delaware, Districtof Columbia, Florida, Hawaii, Idaho, Kansas, Maine, Michigan, Minnesota, Montana, Nebraska, New Hampshire, New Jersey, New Mexico, New York, Ohio,Oklahoma, Oregon, Rhode Island, South Carolina, South Dakota, Texas, Utah, Washington, Wisconsin, and Wyoming. The multiple-race data for these areas werebridged to the single-race categories of the 1977 OMB standards for comparability with other areas; see http://www.cdc.gov/nchs and refer to "Detailedtechnical notes to the United States 2007 data—mortality." For explanation of asterisks preceding cause-of-death codes, see http://www.cdc.gov/nchs andrefer to "Detailed technical notes to the United States 2007 data - mortality"]_____________________________________________________________________________________________________________________________________________________________
Cause of death (Based on theInternational Classificationof Diseases, Tenth Revision, Second All Under 1 1-4 5-9 10-14 15-19 20-24 25-29 30-34 35-39Edition, 2004), race, and sex ages 1/ Year 2/ years years years years years years years years______________________________________________________________________________________________________________________________________________________________
Intentional self-harm (suicide) by other and unspecified means and their sequelae (*U03,X60-X71,X75-X84,Y87.0)
All races 3/, both sexes............. 5.7 ... ... * 0.6 4.0 6.6 7.2 7.4 8.2 Male............................ 8.1 ... ... * 0.8 5.9 10.2 10.8 11.0 12.0 Female.......................... 3.4 ... ... * 0.4 1.9 2.8 3.5 3.8 4.4 White, both sexes................... 6.3 ... ... * 0.5 4.3 7.0 7.8 8.1 9.0 Male............................ 8.9 ... ... * 0.7 6.4 10.9 11.6 11.9 13.0 Female.......................... 3.7 ... ... * 0.3 2.0 2.9 3.8 4.1 4.9 Black, both sexes................... 2.4 ... ... * 0.9 1.8 3.3 4.0 4.1 4.5 Male............................ 3.8 ... ... * 1.2 2.6 5.2 6.4 7.0 7.0 Female.......................... 1.2 ... ... * * * 1.3 1.6 1.4 2.2
Assault (homicide) (*U01-*U02,X85-Y09,Y87.1)
All races 3/, both sexes............. 6.1 8.3 2.4 0.7 1.0 10.4 15.8 12.9 10.4 7.6 Male............................ 9.8 9.5 2.5 0.7 1.4 17.6 26.7 21.4 17.3 11.8 Female.......................... 2.5 7.0 2.3 0.7 0.7 2.8 4.2 4.0 3.4 3.5 White, both sexes................... 3.7 7.0 1.7 0.6 0.6 5.1 8.1 6.8 6.0 4.7 Male............................ 5.4 7.7 1.8 0.6 0.8 8.0 12.9 10.5 9.2 6.7 Female.......................... 1.9 6.1 1.6 0.7 0.5 2.0 3.0 2.9 2.7 2.6 Black, both sexes................... 22.2 15.4 6.2 1.2 3.1 37.4 58.9 49.7 39.2 27.7 Male............................ 39.7 19.2 6.5 1.3 4.4 67.0 105.5 90.2 73.4 48.5 Female.......................... 6.2 11.4 6.0 * 1.7 6.9 11.1 10.6 8.0 9.2
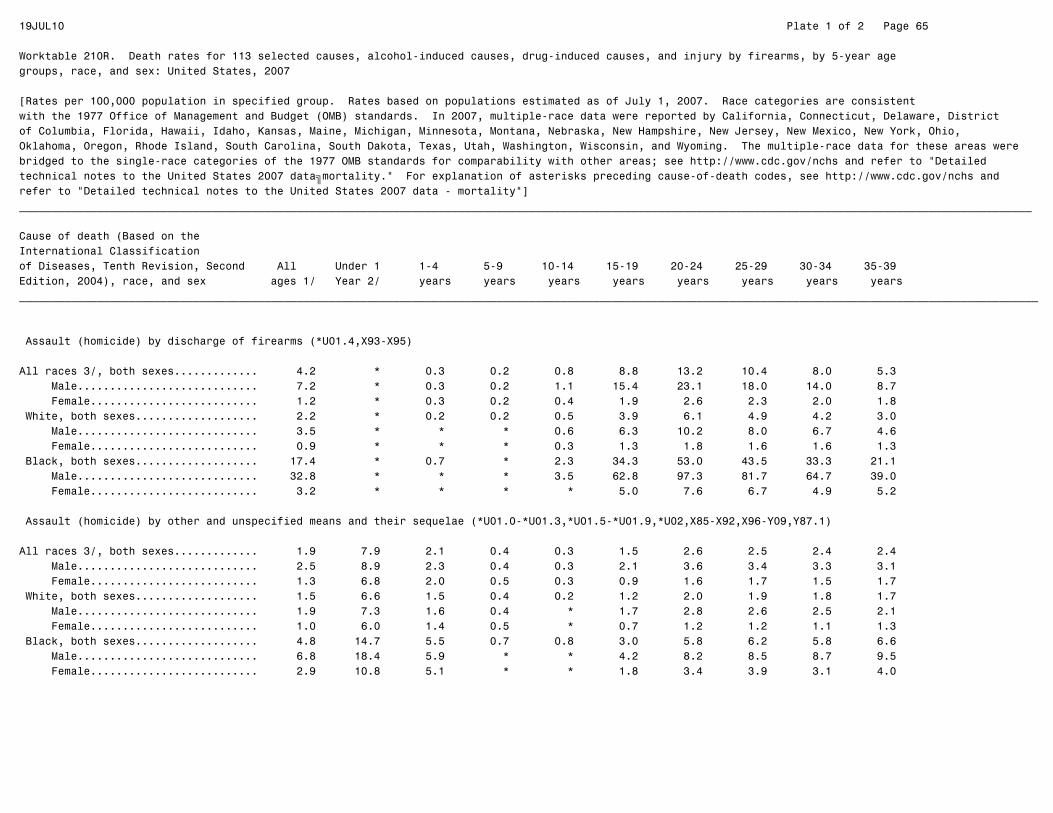
19JUL10 Plate 1 of 2 Page 65
Worktable 210R. Death rates for 113 selected causes, alcohol-induced causes, drug-induced causes, and injury by firearms, by 5-year agegroups, race, and sex: United States, 2007
[Rates per 100,000 population in specified group. Rates based on populations estimated as of July 1, 2007. Race categories are consistentwith the 1977 Office of Management and Budget (OMB) standards. In 2007, multiple-race data were reported by California, Connecticut, Delaware, Districtof Columbia, Florida, Hawaii, Idaho, Kansas, Maine, Michigan, Minnesota, Montana, Nebraska, New Hampshire, New Jersey, New Mexico, New York, Ohio,Oklahoma, Oregon, Rhode Island, South Carolina, South Dakota, Texas, Utah, Washington, Wisconsin, and Wyoming. The multiple-race data for these areas werebridged to the single-race categories of the 1977 OMB standards for comparability with other areas; see http://www.cdc.gov/nchs and refer to "Detailedtechnical notes to the United States 2007 data—mortality." For explanation of asterisks preceding cause-of-death codes, see http://www.cdc.gov/nchs andrefer to "Detailed technical notes to the United States 2007 data - mortality"]_____________________________________________________________________________________________________________________________________________________________
Cause of death (Based on theInternational Classificationof Diseases, Tenth Revision, Second All Under 1 1-4 5-9 10-14 15-19 20-24 25-29 30-34 35-39Edition, 2004), race, and sex ages 1/ Year 2/ years years years years years years years years______________________________________________________________________________________________________________________________________________________________
Assault (homicide) by discharge of firearms (*U01.4,X93-X95)
All races 3/, both sexes............. 4.2 * 0.3 0.2 0.8 8.8 13.2 10.4 8.0 5.3 Male............................ 7.2 * 0.3 0.2 1.1 15.4 23.1 18.0 14.0 8.7 Female.......................... 1.2 * 0.3 0.2 0.4 1.9 2.6 2.3 2.0 1.8 White, both sexes................... 2.2 * 0.2 0.2 0.5 3.9 6.1 4.9 4.2 3.0 Male............................ 3.5 * * * 0.6 6.3 10.2 8.0 6.7 4.6 Female.......................... 0.9 * * * 0.3 1.3 1.8 1.6 1.6 1.3 Black, both sexes................... 17.4 * 0.7 * 2.3 34.3 53.0 43.5 33.3 21.1 Male............................ 32.8 * * * 3.5 62.8 97.3 81.7 64.7 39.0 Female.......................... 3.2 * * * * 5.0 7.6 6.7 4.9 5.2
Assault (homicide) by other and unspecified means and their sequelae (*U01.0-*U01.3,*U01.5-*U01.9,*U02,X85-X92,X96-Y09,Y87.1)
All races 3/, both sexes............. 1.9 7.9 2.1 0.4 0.3 1.5 2.6 2.5 2.4 2.4 Male............................ 2.5 8.9 2.3 0.4 0.3 2.1 3.6 3.4 3.3 3.1 Female.......................... 1.3 6.8 2.0 0.5 0.3 0.9 1.6 1.7 1.5 1.7 White, both sexes................... 1.5 6.6 1.5 0.4 0.2 1.2 2.0 1.9 1.8 1.7 Male............................ 1.9 7.3 1.6 0.4 * 1.7 2.8 2.6 2.5 2.1 Female.......................... 1.0 6.0 1.4 0.5 * 0.7 1.2 1.2 1.1 1.3 Black, both sexes................... 4.8 14.7 5.5 0.7 0.8 3.0 5.8 6.2 5.8 6.6 Male............................ 6.8 18.4 5.9 * * 4.2 8.2 8.5 8.7 9.5 Female.......................... 2.9 10.8 5.1 * * 1.8 3.4 3.9 3.1 4.0
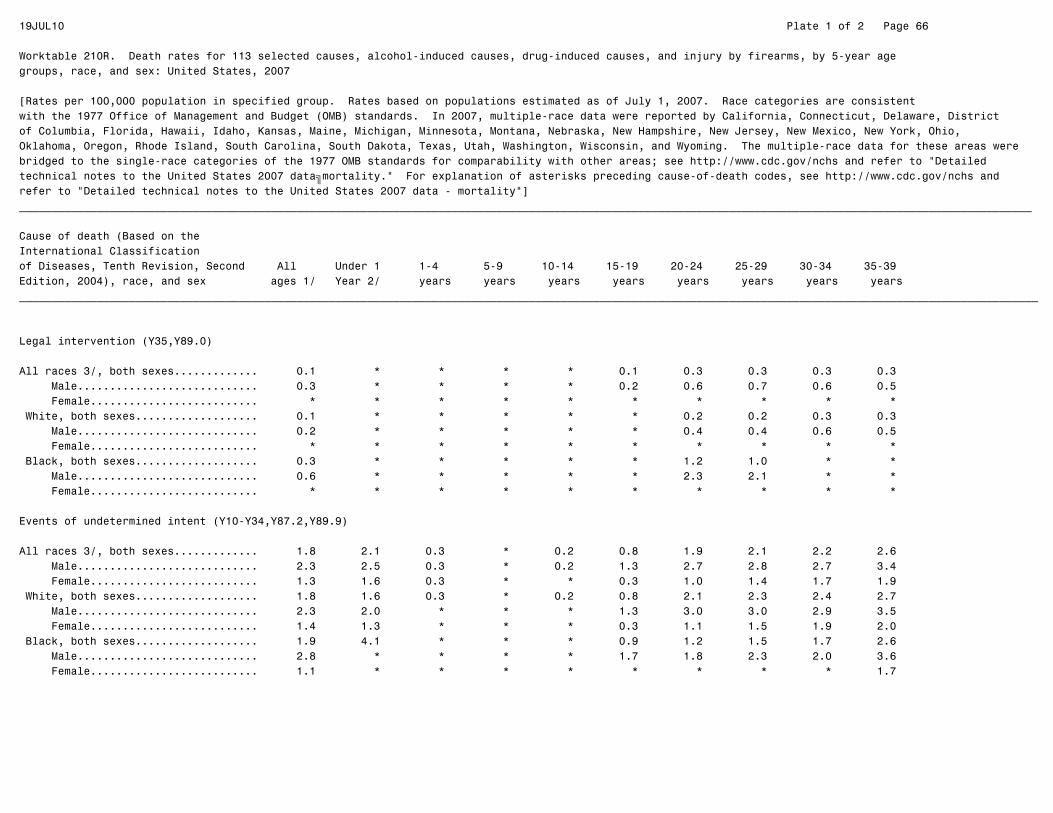
19JUL10 Plate 1 of 2 Page 66
Worktable 210R. Death rates for 113 selected causes, alcohol-induced causes, drug-induced causes, and injury by firearms, by 5-year agegroups, race, and sex: United States, 2007
[Rates per 100,000 population in specified group. Rates based on populations estimated as of July 1, 2007. Race categories are consistentwith the 1977 Office of Management and Budget (OMB) standards. In 2007, multiple-race data were reported by California, Connecticut, Delaware, Districtof Columbia, Florida, Hawaii, Idaho, Kansas, Maine, Michigan, Minnesota, Montana, Nebraska, New Hampshire, New Jersey, New Mexico, New York, Ohio,Oklahoma, Oregon, Rhode Island, South Carolina, South Dakota, Texas, Utah, Washington, Wisconsin, and Wyoming. The multiple-race data for these areas werebridged to the single-race categories of the 1977 OMB standards for comparability with other areas; see http://www.cdc.gov/nchs and refer to "Detailedtechnical notes to the United States 2007 data—mortality." For explanation of asterisks preceding cause-of-death codes, see http://www.cdc.gov/nchs andrefer to "Detailed technical notes to the United States 2007 data - mortality"]_____________________________________________________________________________________________________________________________________________________________
Cause of death (Based on theInternational Classificationof Diseases, Tenth Revision, Second All Under 1 1-4 5-9 10-14 15-19 20-24 25-29 30-34 35-39Edition, 2004), race, and sex ages 1/ Year 2/ years years years years years years years years______________________________________________________________________________________________________________________________________________________________
Legal intervention (Y35,Y89.0)
All races 3/, both sexes............. 0.1 * * * * 0.1 0.3 0.3 0.3 0.3 Male............................ 0.3 * * * * 0.2 0.6 0.7 0.6 0.5 Female.......................... * * * * * * * * * * White, both sexes................... 0.1 * * * * * 0.2 0.2 0.3 0.3 Male............................ 0.2 * * * * * 0.4 0.4 0.6 0.5 Female.......................... * * * * * * * * * * Black, both sexes................... 0.3 * * * * * 1.2 1.0 * * Male............................ 0.6 * * * * * 2.3 2.1 * * Female.......................... * * * * * * * * * *
Events of undetermined intent (Y10-Y34,Y87.2,Y89.9)
All races 3/, both sexes............. 1.8 2.1 0.3 * 0.2 0.8 1.9 2.1 2.2 2.6 Male............................ 2.3 2.5 0.3 * 0.2 1.3 2.7 2.8 2.7 3.4 Female.......................... 1.3 1.6 0.3 * * 0.3 1.0 1.4 1.7 1.9 White, both sexes................... 1.8 1.6 0.3 * 0.2 0.8 2.1 2.3 2.4 2.7 Male............................ 2.3 2.0 * * * 1.3 3.0 3.0 2.9 3.5 Female.......................... 1.4 1.3 * * * 0.3 1.1 1.5 1.9 2.0 Black, both sexes................... 1.9 4.1 * * * 0.9 1.2 1.5 1.7 2.6 Male............................ 2.8 * * * * 1.7 1.8 2.3 2.0 3.6 Female.......................... 1.1 * * * * * * * * 1.7

19JUL10 Plate 1 of 2 Page 67
Worktable 210R. Death rates for 113 selected causes, alcohol-induced causes, drug-induced causes, and injury by firearms, by 5-year agegroups, race, and sex: United States, 2007
[Rates per 100,000 population in specified group. Rates based on populations estimated as of July 1, 2007. Race categories are consistentwith the 1977 Office of Management and Budget (OMB) standards. In 2007, multiple-race data were reported by California, Connecticut, Delaware, Districtof Columbia, Florida, Hawaii, Idaho, Kansas, Maine, Michigan, Minnesota, Montana, Nebraska, New Hampshire, New Jersey, New Mexico, New York, Ohio,Oklahoma, Oregon, Rhode Island, South Carolina, South Dakota, Texas, Utah, Washington, Wisconsin, and Wyoming. The multiple-race data for these areas werebridged to the single-race categories of the 1977 OMB standards for comparability with other areas; see http://www.cdc.gov/nchs and refer to "Detailedtechnical notes to the United States 2007 data—mortality." For explanation of asterisks preceding cause-of-death codes, see http://www.cdc.gov/nchs andrefer to "Detailed technical notes to the United States 2007 data - mortality"]_____________________________________________________________________________________________________________________________________________________________
Cause of death (Based on theInternational Classificationof Diseases, Tenth Revision, Second All Under 1 1-4 5-9 10-14 15-19 20-24 25-29 30-34 35-39Edition, 2004), race, and sex ages 1/ Year 2/ years years years years years years years years______________________________________________________________________________________________________________________________________________________________
Discharge of firearms, undetermined intent (Y22-Y24)
All races 3/, both sexes............. 0.1 * * * * 0.2 0.2 0.1 * * Male............................ 0.2 * * * * 0.4 0.3 0.2 * * Female.......................... 0.0 * * * * * * * * * White, both sexes................... 0.1 * * * * * 0.2 0.1 * * Male............................ 0.1 * * * * * 0.3 0.2 * * Female.......................... 0.0 * * * * * * * * * Black, both sexes................... 0.1 * * * * 0.7 * * * * Male............................ 0.2 * * * * 1.3 * * * * Female.......................... * * * * * * * * * *
Other and unspecified events of undetermined intent and their sequelae (Y10-Y21,Y25-Y34,Y87.2,Y89.9)
All races 3/, both sexes............. 1.7 2.1 0.3 * 0.1 0.6 1.7 2.0 2.1 2.6 Male............................ 2.1 2.5 0.3 * * 1.0 2.5 2.5 2.6 3.2 Female.......................... 1.3 1.6 0.3 * * 0.3 0.9 1.3 1.6 1.9 White, both sexes................... 1.7 1.6 0.3 * * 0.7 1.9 2.2 2.4 2.7 Male............................ 2.1 2.0 * * * 1.1 2.7 2.8 2.9 3.4 Female.......................... 1.4 1.3 * * * 0.3 1.0 1.5 1.8 2.0 Black, both sexes................... 1.8 4.1 * * * * 0.9 1.3 1.5 2.5 Male............................ 2.5 * * * * * 1.6 1.9 1.8 3.5 Female.......................... 1.1 * * * * * * * * 1.7
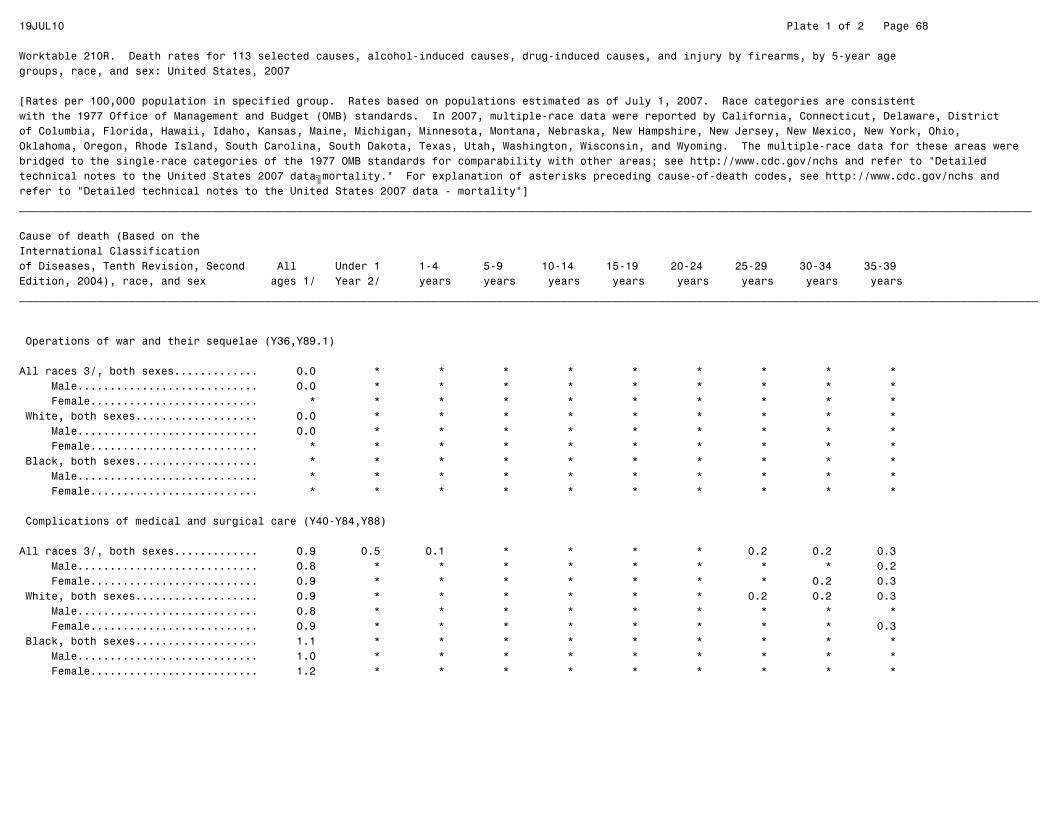
19JUL10 Plate 1 of 2 Page 68
Worktable 210R. Death rates for 113 selected causes, alcohol-induced causes, drug-induced causes, and injury by firearms, by 5-year agegroups, race, and sex: United States, 2007
[Rates per 100,000 population in specified group. Rates based on populations estimated as of July 1, 2007. Race categories are consistentwith the 1977 Office of Management and Budget (OMB) standards. In 2007, multiple-race data were reported by California, Connecticut, Delaware, Districtof Columbia, Florida, Hawaii, Idaho, Kansas, Maine, Michigan, Minnesota, Montana, Nebraska, New Hampshire, New Jersey, New Mexico, New York, Ohio,Oklahoma, Oregon, Rhode Island, South Carolina, South Dakota, Texas, Utah, Washington, Wisconsin, and Wyoming. The multiple-race data for these areas werebridged to the single-race categories of the 1977 OMB standards for comparability with other areas; see http://www.cdc.gov/nchs and refer to "Detailedtechnical notes to the United States 2007 data—mortality." For explanation of asterisks preceding cause-of-death codes, see http://www.cdc.gov/nchs andrefer to "Detailed technical notes to the United States 2007 data - mortality"]_____________________________________________________________________________________________________________________________________________________________
Cause of death (Based on theInternational Classificationof Diseases, Tenth Revision, Second All Under 1 1-4 5-9 10-14 15-19 20-24 25-29 30-34 35-39Edition, 2004), race, and sex ages 1/ Year 2/ years years years years years years years years______________________________________________________________________________________________________________________________________________________________
Operations of war and their sequelae (Y36,Y89.1)
All races 3/, both sexes............. 0.0 * * * * * * * * * Male............................ 0.0 * * * * * * * * * Female.......................... * * * * * * * * * * White, both sexes................... 0.0 * * * * * * * * * Male............................ 0.0 * * * * * * * * * Female.......................... * * * * * * * * * * Black, both sexes................... * * * * * * * * * * Male............................ * * * * * * * * * * Female.......................... * * * * * * * * * *
Complications of medical and surgical care (Y40-Y84,Y88)
All races 3/, both sexes............. 0.9 0.5 0.1 * * * * 0.2 0.2 0.3 Male............................ 0.8 * * * * * * * * 0.2 Female.......................... 0.9 * * * * * * * 0.2 0.3 White, both sexes................... 0.9 * * * * * * 0.2 0.2 0.3 Male............................ 0.8 * * * * * * * * * Female.......................... 0.9 * * * * * * * * 0.3 Black, both sexes................... 1.1 * * * * * * * * * Male............................ 1.0 * * * * * * * * * Female.......................... 1.2 * * * * * * * * *

19JUL10 Plate 1 of 2 Page 69
Worktable 210R. Death rates for 113 selected causes, alcohol-induced causes, drug-induced causes, and injury by firearms, by 5-year agegroups, race, and sex: United States, 2007
[Rates per 100,000 population in specified group. Rates based on populations estimated as of July 1, 2007. Race categories are consistentwith the 1977 Office of Management and Budget (OMB) standards. In 2007, multiple-race data were reported by California, Connecticut, Delaware, Districtof Columbia, Florida, Hawaii, Idaho, Kansas, Maine, Michigan, Minnesota, Montana, Nebraska, New Hampshire, New Jersey, New Mexico, New York, Ohio,Oklahoma, Oregon, Rhode Island, South Carolina, South Dakota, Texas, Utah, Washington, Wisconsin, and Wyoming. The multiple-race data for these areas werebridged to the single-race categories of the 1977 OMB standards for comparability with other areas; see http://www.cdc.gov/nchs and refer to "Detailedtechnical notes to the United States 2007 data—mortality." For explanation of asterisks preceding cause-of-death codes, see http://www.cdc.gov/nchs andrefer to "Detailed technical notes to the United States 2007 data - mortality"]_____________________________________________________________________________________________________________________________________________________________
Cause of death (Based on theInternational Classificationof Diseases, Tenth Revision, Second All Under 1 1-4 5-9 10-14 15-19 20-24 25-29 30-34 35-39Edition, 2004), race, and sex ages 1/ Year 2/ years years years years years years years years______________________________________________________________________________________________________________________________________________________________
Alcohol-induced causes (E24.4,F10,G31.2,G62.1,G72.1,I42.6,K29.2,K70,K85.2,K86.0,R78.0,X45,X65,Y15) 4/
All races 3/, both sexes............. 7.7 * * * * 0.3 0.7 1.3 2.4 4.7 Male............................ 11.7 * * * * 0.3 1.0 1.8 3.6 6.7 Female.......................... 3.8 * * * * * 0.3 0.6 1.2 2.7 White, both sexes................... 8.2 * * * * 0.3 0.7 1.3 2.5 5.0 Male............................ 12.4 * * * * 0.4 1.1 1.9 3.8 7.1 Female.......................... 4.0 * * * * * 0.3 0.6 1.1 2.9 Black, both sexes................... 5.6 * * * * * * 0.7 1.4 2.7 Male............................ 8.9 * * * * * * * 1.9 3.9 Female.......................... 2.6 * * * * * * * * 1.6
Drug-induced causes (D52.1,D59.0,D59.2,D61.1,D64.2,E06.4,E16.0,E23.1,E24.2,E27.3,E66.1,F11.0-F11.5,F11.7-F11.9,F12.0-F12.5,F12.7-F12.9,F13.0-F13.5,F13.7-F13.9,F14.0-F14.5,F14.7-F14.9,F15.0-F15.5,F15.7-F15.9,F16.0-F16.5,F16.7-F16.9,F17.0,F17.3-F17.5,F17.7-F17.9,F18.0-F18.5,F18.7-F18.9,F19.0-F19.5,F19.7-F19.9,G21.1,G24.0,G25.1,G25.4,G25.6,G44.4,G62.0,G72.0,I95.2,J70.2-J70.4,K85.3,L10.5,L27.0-L27.1,M10.2,M32.0,M80.4,M81.4,M83.5,M87.1,R50.2,R78.1-R78.5,X40-X44,X60-X64,X85,Y10-Y14) 4/All races 3/, both sexes............. 12.7 0.8 0.3 * 0.3 4.5 12.9 16.8 17.4 19.9 Male............................ 16.1 * 0.2 * 0.3 6.6 18.8 23.6 23.4 25.3 Female.......................... 9.5 * 0.3 * 0.2 2.2 6.7 9.8 11.3 14.5 White, both sexes................... 13.7 * 0.2 * 0.3 5.4 15.2 19.8 20.0 21.9 Male............................ 17.2 * * * 0.3 7.9 22.2 27.6 26.8 27.6 Female.......................... 10.3 * * * 0.3 2.7 7.7 11.5 12.9 16.0 Black, both sexes................... 10.5 * 0.7 * * 1.0 4.1 7.0 10.0 15.9 Male............................ 14.2 * * * * 1.4 5.5 9.6 13.7 21.3 Female.......................... 7.1 * * * * * 2.5 4.4 6.6 11.0
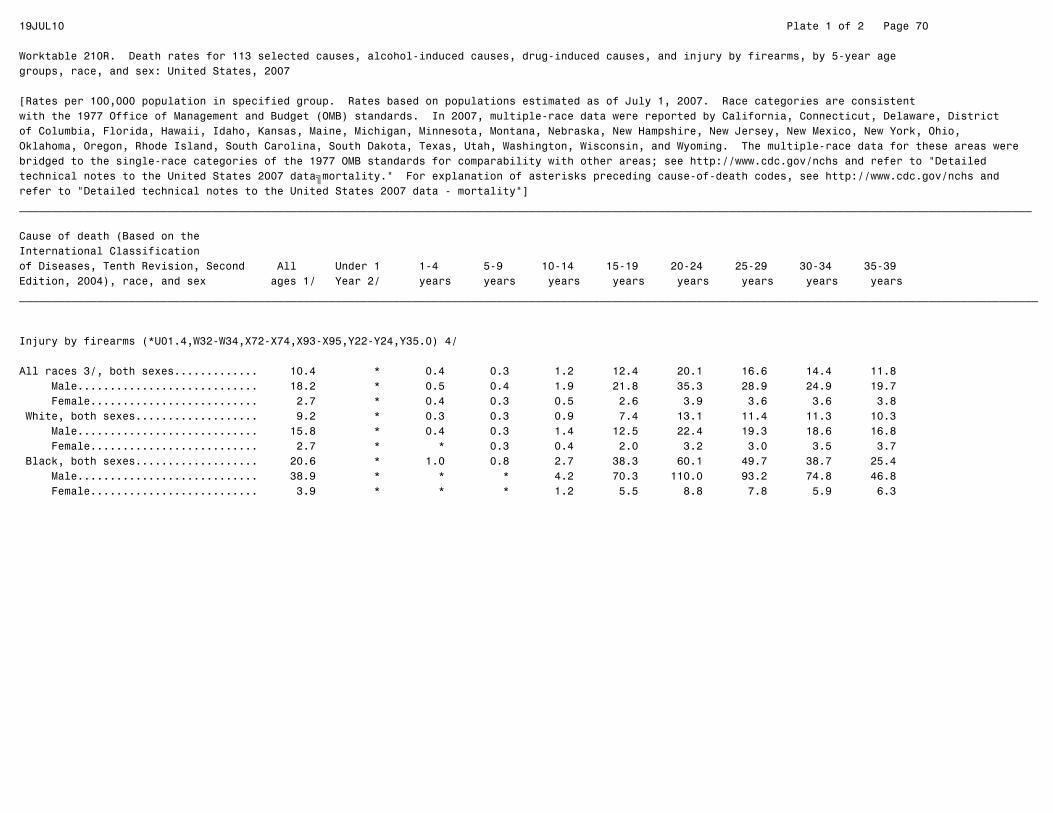
19JUL10 Plate 1 of 2 Page 70
Worktable 210R. Death rates for 113 selected causes, alcohol-induced causes, drug-induced causes, and injury by firearms, by 5-year agegroups, race, and sex: United States, 2007
[Rates per 100,000 population in specified group. Rates based on populations estimated as of July 1, 2007. Race categories are consistentwith the 1977 Office of Management and Budget (OMB) standards. In 2007, multiple-race data were reported by California, Connecticut, Delaware, Districtof Columbia, Florida, Hawaii, Idaho, Kansas, Maine, Michigan, Minnesota, Montana, Nebraska, New Hampshire, New Jersey, New Mexico, New York, Ohio,Oklahoma, Oregon, Rhode Island, South Carolina, South Dakota, Texas, Utah, Washington, Wisconsin, and Wyoming. The multiple-race data for these areas werebridged to the single-race categories of the 1977 OMB standards for comparability with other areas; see http://www.cdc.gov/nchs and refer to "Detailedtechnical notes to the United States 2007 data—mortality." For explanation of asterisks preceding cause-of-death codes, see http://www.cdc.gov/nchs andrefer to "Detailed technical notes to the United States 2007 data - mortality"]_____________________________________________________________________________________________________________________________________________________________
Cause of death (Based on theInternational Classificationof Diseases, Tenth Revision, Second All Under 1 1-4 5-9 10-14 15-19 20-24 25-29 30-34 35-39Edition, 2004), race, and sex ages 1/ Year 2/ years years years years years years years years______________________________________________________________________________________________________________________________________________________________
Injury by firearms (*U01.4,W32-W34,X72-X74,X93-X95,Y22-Y24,Y35.0) 4/
All races 3/, both sexes............. 10.4 * 0.4 0.3 1.2 12.4 20.1 16.6 14.4 11.8 Male............................ 18.2 * 0.5 0.4 1.9 21.8 35.3 28.9 24.9 19.7 Female.......................... 2.7 * 0.4 0.3 0.5 2.6 3.9 3.6 3.6 3.8 White, both sexes................... 9.2 * 0.3 0.3 0.9 7.4 13.1 11.4 11.3 10.3 Male............................ 15.8 * 0.4 0.3 1.4 12.5 22.4 19.3 18.6 16.8 Female.......................... 2.7 * * 0.3 0.4 2.0 3.2 3.0 3.5 3.7 Black, both sexes................... 20.6 * 1.0 0.8 2.7 38.3 60.1 49.7 38.7 25.4 Male............................ 38.9 * * * 4.2 70.3 110.0 93.2 74.8 46.8 Female.......................... 3.9 * * * 1.2 5.5 8.8 7.8 5.9 6.3
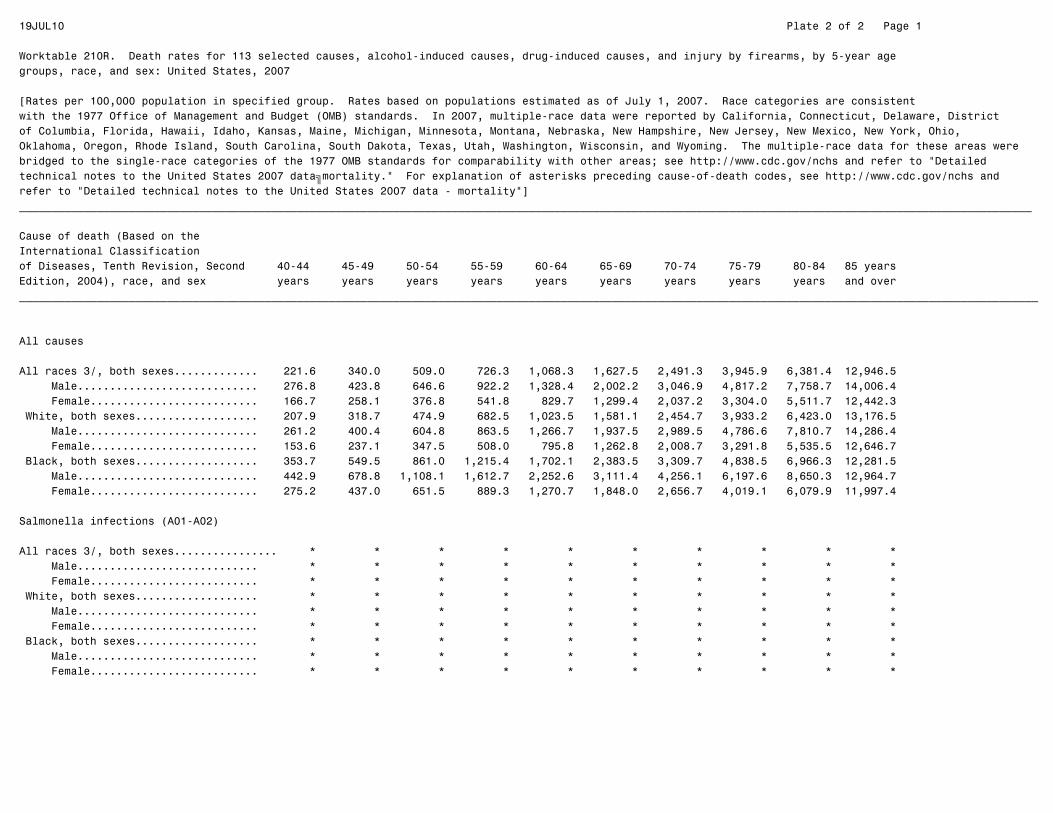
19JUL10 Plate 2 of 2 Page 1
Worktable 210R. Death rates for 113 selected causes, alcohol-induced causes, drug-induced causes, and injury by firearms, by 5-year agegroups, race, and sex: United States, 2007
[Rates per 100,000 population in specified group. Rates based on populations estimated as of July 1, 2007. Race categories are consistentwith the 1977 Office of Management and Budget (OMB) standards. In 2007, multiple-race data were reported by California, Connecticut, Delaware, Districtof Columbia, Florida, Hawaii, Idaho, Kansas, Maine, Michigan, Minnesota, Montana, Nebraska, New Hampshire, New Jersey, New Mexico, New York, Ohio,Oklahoma, Oregon, Rhode Island, South Carolina, South Dakota, Texas, Utah, Washington, Wisconsin, and Wyoming. The multiple-race data for these areas werebridged to the single-race categories of the 1977 OMB standards for comparability with other areas; see http://www.cdc.gov/nchs and refer to "Detailedtechnical notes to the United States 2007 data—mortality." For explanation of asterisks preceding cause-of-death codes, see http://www.cdc.gov/nchs andrefer to "Detailed technical notes to the United States 2007 data - mortality"]_____________________________________________________________________________________________________________________________________________________________
Cause of death (Based on theInternational Classificationof Diseases, Tenth Revision, Second 40-44 45-49 50-54 55-59 60-64 65-69 70-74 75-79 80-84 85 yearsEdition, 2004), race, and sex years years years years years years years years years and over______________________________________________________________________________________________________________________________________________________________
All causes
All races 3/, both sexes............. 221.6 340.0 509.0 726.3 1,068.3 1,627.5 2,491.3 3,945.9 6,381.4 12,946.5 Male............................ 276.8 423.8 646.6 922.2 1,328.4 2,002.2 3,046.9 4,817.2 7,758.7 14,006.4 Female.......................... 166.7 258.1 376.8 541.8 829.7 1,299.4 2,037.2 3,304.0 5,511.7 12,442.3 White, both sexes................... 207.9 318.7 474.9 682.5 1,023.5 1,581.1 2,454.7 3,933.2 6,423.0 13,176.5 Male............................ 261.2 400.4 604.8 863.5 1,266.7 1,937.5 2,989.5 4,786.6 7,810.7 14,286.4 Female.......................... 153.6 237.1 347.5 508.0 795.8 1,262.8 2,008.7 3,291.8 5,535.5 12,646.7 Black, both sexes................... 353.7 549.5 861.0 1,215.4 1,702.1 2,383.5 3,309.7 4,838.5 6,966.3 12,281.5 Male............................ 442.9 678.8 1,108.1 1,612.7 2,252.6 3,111.4 4,256.1 6,197.6 8,650.3 12,964.7 Female.......................... 275.2 437.0 651.5 889.3 1,270.7 1,848.0 2,656.7 4,019.1 6,079.9 11,997.4
Salmonella infections (A01-A02)
All races 3/, both sexes................ * * * * * * * * * * Male............................ * * * * * * * * * * Female.......................... * * * * * * * * * * White, both sexes................... * * * * * * * * * * Male............................ * * * * * * * * * * Female.......................... * * * * * * * * * * Black, both sexes................... * * * * * * * * * * Male............................ * * * * * * * * * * Female.......................... * * * * * * * * * *

19JUL10 Plate 2 of 2 Page 2
Worktable 210R. Death rates for 113 selected causes, alcohol-induced causes, drug-induced causes, and injury by firearms, by 5-year agegroups, race, and sex: United States, 2007
[Rates per 100,000 population in specified group. Rates based on populations estimated as of July 1, 2007. Race categories are consistentwith the 1977 Office of Management and Budget (OMB) standards. In 2007, multiple-race data were reported by California, Connecticut, Delaware, Districtof Columbia, Florida, Hawaii, Idaho, Kansas, Maine, Michigan, Minnesota, Montana, Nebraska, New Hampshire, New Jersey, New Mexico, New York, Ohio,Oklahoma, Oregon, Rhode Island, South Carolina, South Dakota, Texas, Utah, Washington, Wisconsin, and Wyoming. The multiple-race data for these areas werebridged to the single-race categories of the 1977 OMB standards for comparability with other areas; see http://www.cdc.gov/nchs and refer to "Detailedtechnical notes to the United States 2007 data—mortality." For explanation of asterisks preceding cause-of-death codes, see http://www.cdc.gov/nchs andrefer to "Detailed technical notes to the United States 2007 data - mortality"]_____________________________________________________________________________________________________________________________________________________________
Cause of death (Based on theInternational Classificationof Diseases, Tenth Revision, Second 40-44 45-49 50-54 55-59 60-64 65-69 70-74 75-79 80-84 85 yearsEdition, 2004), race, and sex years years years years years years years years years and over______________________________________________________________________________________________________________________________________________________________
Shigellosis and amebiasis (A03,A06)
All races 3/, both sexes................ * * * * * * * * * * Male............................ * * * * * * * * * * Female.......................... * * * * * * * * * * White, both sexes................... * * * * * * * * * * Male............................ * * * * * * * * * * Female.......................... * * * * * * * * * * Black, both sexes................... * * * * * * * * * * Male............................ * * * * * * * * * * Female.......................... * * * * * * * * * *
Certain other intestinal infections (A04,A07-A09)
All races 3/, both sexes............. 0.1 0.2 0.4 0.8 1.3 3.3 6.5 13.7 25.3 52.0 Male............................ * * 0.4 0.9 1.3 3.3 6.3 13.7 24.7 50.4 Female.......................... * 0.2 0.5 0.6 1.3 3.3 6.7 13.7 25.7 52.7 White, both sexes................... 0.1 0.2 0.4 0.8 1.3 3.4 6.8 14.4 26.7 54.9 Male............................ * * 0.4 1.0 1.3 3.4 6.3 14.3 25.8 53.5 Female.......................... * * 0.4 0.6 1.3 3.4 7.3 14.5 27.3 55.6 Black, both sexes................... * * * * 1.7 3.9 5.3 10.5 16.8 31.7 Male............................ * * * * * * 6.6 11.5 18.9 28.0 Female.......................... * * * * * 4.0 4.4 9.9 15.6 33.2

19JUL10 Plate 2 of 2 Page 3
Worktable 210R. Death rates for 113 selected causes, alcohol-induced causes, drug-induced causes, and injury by firearms, by 5-year agegroups, race, and sex: United States, 2007
[Rates per 100,000 population in specified group. Rates based on populations estimated as of July 1, 2007. Race categories are consistentwith the 1977 Office of Management and Budget (OMB) standards. In 2007, multiple-race data were reported by California, Connecticut, Delaware, Districtof Columbia, Florida, Hawaii, Idaho, Kansas, Maine, Michigan, Minnesota, Montana, Nebraska, New Hampshire, New Jersey, New Mexico, New York, Ohio,Oklahoma, Oregon, Rhode Island, South Carolina, South Dakota, Texas, Utah, Washington, Wisconsin, and Wyoming. The multiple-race data for these areas werebridged to the single-race categories of the 1977 OMB standards for comparability with other areas; see http://www.cdc.gov/nchs and refer to "Detailedtechnical notes to the United States 2007 data—mortality." For explanation of asterisks preceding cause-of-death codes, see http://www.cdc.gov/nchs andrefer to "Detailed technical notes to the United States 2007 data - mortality"]_____________________________________________________________________________________________________________________________________________________________
Cause of death (Based on theInternational Classificationof Diseases, Tenth Revision, Second 40-44 45-49 50-54 55-59 60-64 65-69 70-74 75-79 80-84 85 yearsEdition, 2004), race, and sex years years years years years years years years years and over______________________________________________________________________________________________________________________________________________________________
Tuberculosis (A16-A19)
All races 3/, both sexes................ * 0.1 0.2 0.2 0.3 0.4 0.7 0.9 1.5 1.6 Male............................ * 0.2 0.3 0.4 0.5 0.4 0.9 1.2 2.0 2.8 Female.......................... * * * * * * 0.5 0.6 1.3 1.1 White, both sexes................... * * 0.1 0.1 0.2 0.3 0.4 0.6 1.0 1.5 Male............................ * * 0.2 * 0.3 * * 0.9 1.2 2.6 Female.......................... * * * * * * * * 0.9 1.0 Black, both sexes................... * * * * * * 2.5 * * * Male............................ * * * * * * * * * * Female.......................... * * * * * * * * * *
Respiratory tuberculosis (A16)
All races 3/, both sexes................ * 0.1 0.2 0.2 0.2 0.3 0.5 0.7 1.2 1.3 Male............................ * * 0.2 0.2 0.4 * 0.6 1.1 1.5 2.4 Female.......................... * * * * * * * 0.5 0.9 0.9 White, both sexes................... * * * * * 0.2 * 0.5 0.8 1.3 Male............................ * * * * * * * 0.8 * 2.3 Female.......................... * * * * * * * * 0.7 0.8 Black, both sexes................... * * * * * * * * * * Male............................ * * * * * * * * * * Female.......................... * * * * * * * * * *
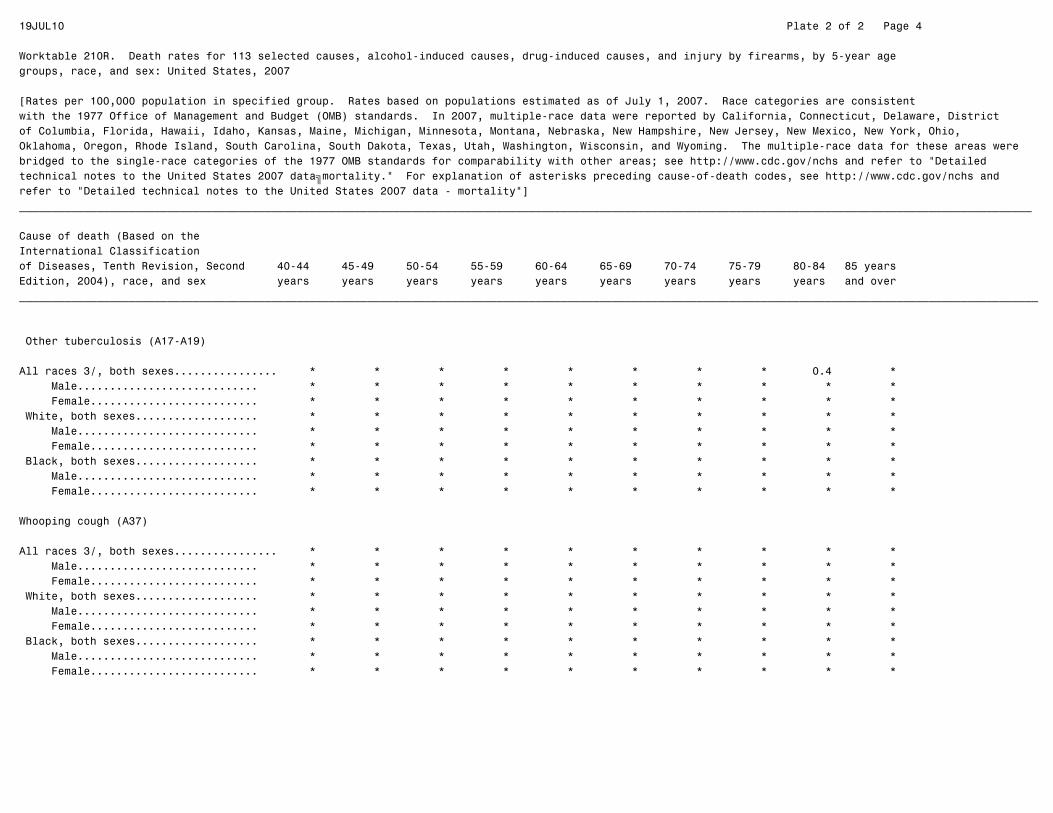
19JUL10 Plate 2 of 2 Page 4
Worktable 210R. Death rates for 113 selected causes, alcohol-induced causes, drug-induced causes, and injury by firearms, by 5-year agegroups, race, and sex: United States, 2007
[Rates per 100,000 population in specified group. Rates based on populations estimated as of July 1, 2007. Race categories are consistentwith the 1977 Office of Management and Budget (OMB) standards. In 2007, multiple-race data were reported by California, Connecticut, Delaware, Districtof Columbia, Florida, Hawaii, Idaho, Kansas, Maine, Michigan, Minnesota, Montana, Nebraska, New Hampshire, New Jersey, New Mexico, New York, Ohio,Oklahoma, Oregon, Rhode Island, South Carolina, South Dakota, Texas, Utah, Washington, Wisconsin, and Wyoming. The multiple-race data for these areas werebridged to the single-race categories of the 1977 OMB standards for comparability with other areas; see http://www.cdc.gov/nchs and refer to "Detailedtechnical notes to the United States 2007 data—mortality." For explanation of asterisks preceding cause-of-death codes, see http://www.cdc.gov/nchs andrefer to "Detailed technical notes to the United States 2007 data - mortality"]_____________________________________________________________________________________________________________________________________________________________
Cause of death (Based on theInternational Classificationof Diseases, Tenth Revision, Second 40-44 45-49 50-54 55-59 60-64 65-69 70-74 75-79 80-84 85 yearsEdition, 2004), race, and sex years years years years years years years years years and over______________________________________________________________________________________________________________________________________________________________
Other tuberculosis (A17-A19)
All races 3/, both sexes................ * * * * * * * * 0.4 * Male............................ * * * * * * * * * * Female.......................... * * * * * * * * * * White, both sexes................... * * * * * * * * * * Male............................ * * * * * * * * * * Female.......................... * * * * * * * * * * Black, both sexes................... * * * * * * * * * * Male............................ * * * * * * * * * * Female.......................... * * * * * * * * * *
Whooping cough (A37)
All races 3/, both sexes................ * * * * * * * * * * Male............................ * * * * * * * * * * Female.......................... * * * * * * * * * * White, both sexes................... * * * * * * * * * * Male............................ * * * * * * * * * * Female.......................... * * * * * * * * * * Black, both sexes................... * * * * * * * * * * Male............................ * * * * * * * * * * Female.......................... * * * * * * * * * *
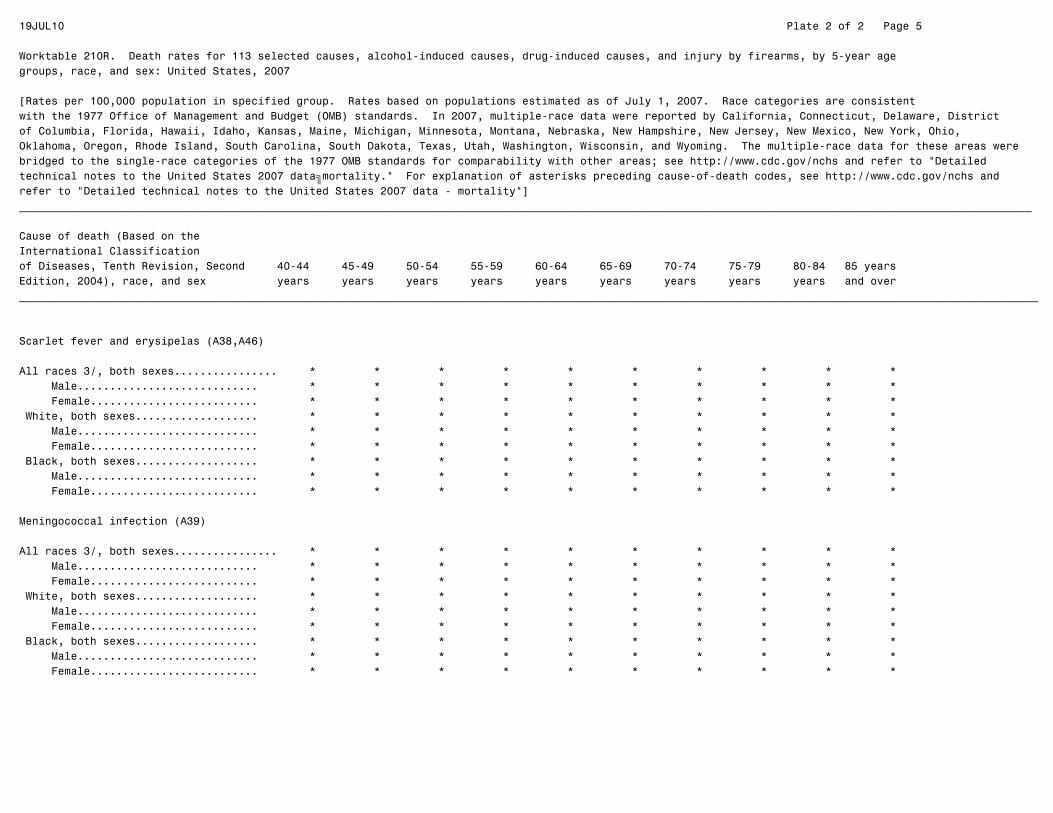
19JUL10 Plate 2 of 2 Page 5
Worktable 210R. Death rates for 113 selected causes, alcohol-induced causes, drug-induced causes, and injury by firearms, by 5-year agegroups, race, and sex: United States, 2007
[Rates per 100,000 population in specified group. Rates based on populations estimated as of July 1, 2007. Race categories are consistentwith the 1977 Office of Management and Budget (OMB) standards. In 2007, multiple-race data were reported by California, Connecticut, Delaware, Districtof Columbia, Florida, Hawaii, Idaho, Kansas, Maine, Michigan, Minnesota, Montana, Nebraska, New Hampshire, New Jersey, New Mexico, New York, Ohio,Oklahoma, Oregon, Rhode Island, South Carolina, South Dakota, Texas, Utah, Washington, Wisconsin, and Wyoming. The multiple-race data for these areas werebridged to the single-race categories of the 1977 OMB standards for comparability with other areas; see http://www.cdc.gov/nchs and refer to "Detailedtechnical notes to the United States 2007 data—mortality." For explanation of asterisks preceding cause-of-death codes, see http://www.cdc.gov/nchs andrefer to "Detailed technical notes to the United States 2007 data - mortality"]_____________________________________________________________________________________________________________________________________________________________
Cause of death (Based on theInternational Classificationof Diseases, Tenth Revision, Second 40-44 45-49 50-54 55-59 60-64 65-69 70-74 75-79 80-84 85 yearsEdition, 2004), race, and sex years years years years years years years years years and over______________________________________________________________________________________________________________________________________________________________
Scarlet fever and erysipelas (A38,A46)
All races 3/, both sexes................ * * * * * * * * * * Male............................ * * * * * * * * * * Female.......................... * * * * * * * * * * White, both sexes................... * * * * * * * * * * Male............................ * * * * * * * * * * Female.......................... * * * * * * * * * * Black, both sexes................... * * * * * * * * * * Male............................ * * * * * * * * * * Female.......................... * * * * * * * * * *
Meningococcal infection (A39)
All races 3/, both sexes................ * * * * * * * * * * Male............................ * * * * * * * * * * Female.......................... * * * * * * * * * * White, both sexes................... * * * * * * * * * * Male............................ * * * * * * * * * * Female.......................... * * * * * * * * * * Black, both sexes................... * * * * * * * * * * Male............................ * * * * * * * * * * Female.......................... * * * * * * * * * *

19JUL10 Plate 2 of 2 Page 6
Worktable 210R. Death rates for 113 selected causes, alcohol-induced causes, drug-induced causes, and injury by firearms, by 5-year agegroups, race, and sex: United States, 2007
[Rates per 100,000 population in specified group. Rates based on populations estimated as of July 1, 2007. Race categories are consistentwith the 1977 Office of Management and Budget (OMB) standards. In 2007, multiple-race data were reported by California, Connecticut, Delaware, Districtof Columbia, Florida, Hawaii, Idaho, Kansas, Maine, Michigan, Minnesota, Montana, Nebraska, New Hampshire, New Jersey, New Mexico, New York, Ohio,Oklahoma, Oregon, Rhode Island, South Carolina, South Dakota, Texas, Utah, Washington, Wisconsin, and Wyoming. The multiple-race data for these areas werebridged to the single-race categories of the 1977 OMB standards for comparability with other areas; see http://www.cdc.gov/nchs and refer to "Detailedtechnical notes to the United States 2007 data—mortality." For explanation of asterisks preceding cause-of-death codes, see http://www.cdc.gov/nchs andrefer to "Detailed technical notes to the United States 2007 data - mortality"]_____________________________________________________________________________________________________________________________________________________________
Cause of death (Based on theInternational Classificationof Diseases, Tenth Revision, Second 40-44 45-49 50-54 55-59 60-64 65-69 70-74 75-79 80-84 85 yearsEdition, 2004), race, and sex years years years years years years years years years and over______________________________________________________________________________________________________________________________________________________________
Septicemia (A40-A41)
All races 3/, both sexes............. 2.6 4.4 6.8 10.7 15.7 26.0 41.3 63.2 101.3 174.4 Male............................ 2.7 4.8 7.4 11.9 16.6 28.7 46.9 70.8 116.4 189.3 Female.......................... 2.6 4.0 6.2 9.7 14.9 23.6 36.7 57.6 91.8 167.3 White, both sexes................... 2.2 3.5 5.5 9.2 13.9 22.9 37.0 58.9 96.4 167.5 Male............................ 2.3 3.9 5.9 10.0 14.5 25.1 41.7 66.4 112.9 181.9 Female.......................... 2.2 3.2 5.2 8.4 13.3 21.0 33.0 53.3 85.9 160.6 Black, both sexes................... 5.8 10.6 17.0 25.5 36.0 60.2 86.4 123.4 181.1 294.3 Male............................ 5.7 11.5 20.2 30.4 42.1 71.9 104.2 141.2 195.8 331.4 Female.......................... 5.8 9.9 14.3 21.4 31.3 51.6 74.0 112.6 173.4 278.9
Syphilis (A50-A53)
All races 3/, both sexes................ * * * * * * * * * * Male............................ * * * * * * * * * * Female.......................... * * * * * * * * * * White, both sexes................... * * * * * * * * * * Male............................ * * * * * * * * * * Female.......................... * * * * * * * * * * Black, both sexes................... * * * * * * * * * * Male............................ * * * * * * * * * * Female.......................... * * * * * * * * * *
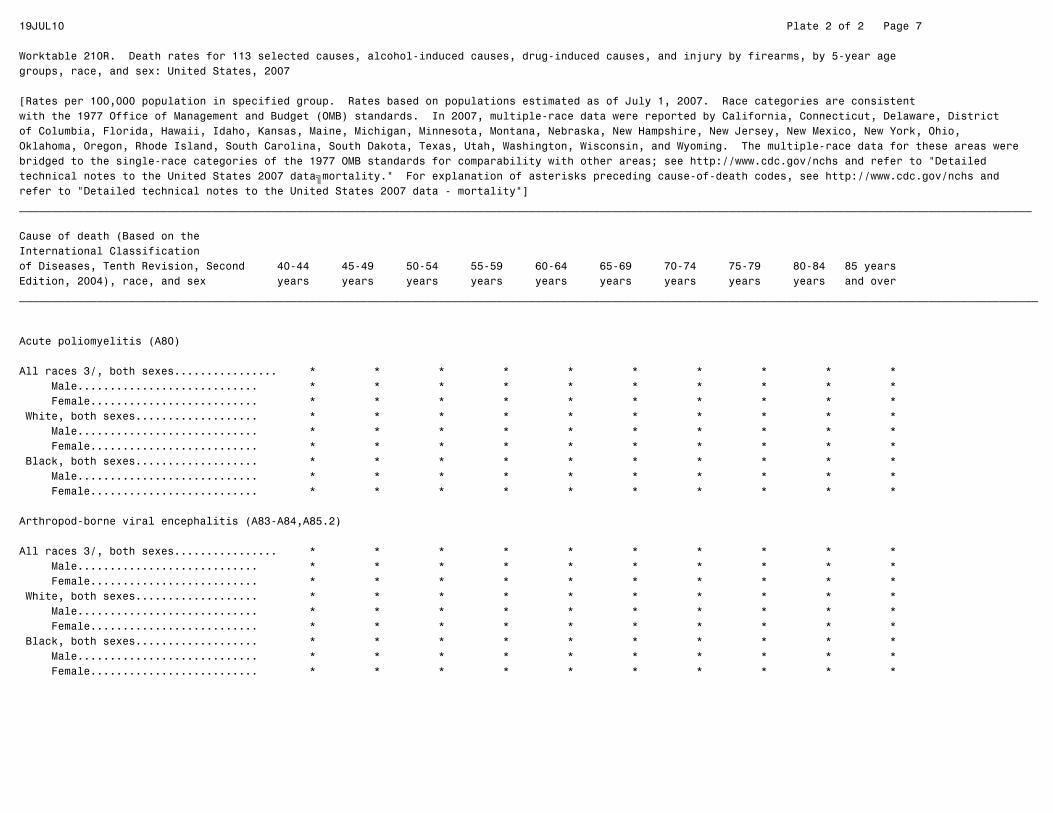
19JUL10 Plate 2 of 2 Page 7
Worktable 210R. Death rates for 113 selected causes, alcohol-induced causes, drug-induced causes, and injury by firearms, by 5-year agegroups, race, and sex: United States, 2007
[Rates per 100,000 population in specified group. Rates based on populations estimated as of July 1, 2007. Race categories are consistentwith the 1977 Office of Management and Budget (OMB) standards. In 2007, multiple-race data were reported by California, Connecticut, Delaware, Districtof Columbia, Florida, Hawaii, Idaho, Kansas, Maine, Michigan, Minnesota, Montana, Nebraska, New Hampshire, New Jersey, New Mexico, New York, Ohio,Oklahoma, Oregon, Rhode Island, South Carolina, South Dakota, Texas, Utah, Washington, Wisconsin, and Wyoming. The multiple-race data for these areas werebridged to the single-race categories of the 1977 OMB standards for comparability with other areas; see http://www.cdc.gov/nchs and refer to "Detailedtechnical notes to the United States 2007 data—mortality." For explanation of asterisks preceding cause-of-death codes, see http://www.cdc.gov/nchs andrefer to "Detailed technical notes to the United States 2007 data - mortality"]_____________________________________________________________________________________________________________________________________________________________
Cause of death (Based on theInternational Classificationof Diseases, Tenth Revision, Second 40-44 45-49 50-54 55-59 60-64 65-69 70-74 75-79 80-84 85 yearsEdition, 2004), race, and sex years years years years years years years years years and over______________________________________________________________________________________________________________________________________________________________
Acute poliomyelitis (A80)
All races 3/, both sexes................ * * * * * * * * * * Male............................ * * * * * * * * * * Female.......................... * * * * * * * * * * White, both sexes................... * * * * * * * * * * Male............................ * * * * * * * * * * Female.......................... * * * * * * * * * * Black, both sexes................... * * * * * * * * * * Male............................ * * * * * * * * * * Female.......................... * * * * * * * * * *
Arthropod-borne viral encephalitis (A83-A84,A85.2)
All races 3/, both sexes................ * * * * * * * * * * Male............................ * * * * * * * * * * Female.......................... * * * * * * * * * * White, both sexes................... * * * * * * * * * * Male............................ * * * * * * * * * * Female.......................... * * * * * * * * * * Black, both sexes................... * * * * * * * * * * Male............................ * * * * * * * * * * Female.......................... * * * * * * * * * *

19JUL10 Plate 2 of 2 Page 8
Worktable 210R. Death rates for 113 selected causes, alcohol-induced causes, drug-induced causes, and injury by firearms, by 5-year agegroups, race, and sex: United States, 2007
[Rates per 100,000 population in specified group. Rates based on populations estimated as of July 1, 2007. Race categories are consistentwith the 1977 Office of Management and Budget (OMB) standards. In 2007, multiple-race data were reported by California, Connecticut, Delaware, Districtof Columbia, Florida, Hawaii, Idaho, Kansas, Maine, Michigan, Minnesota, Montana, Nebraska, New Hampshire, New Jersey, New Mexico, New York, Ohio,Oklahoma, Oregon, Rhode Island, South Carolina, South Dakota, Texas, Utah, Washington, Wisconsin, and Wyoming. The multiple-race data for these areas werebridged to the single-race categories of the 1977 OMB standards for comparability with other areas; see http://www.cdc.gov/nchs and refer to "Detailedtechnical notes to the United States 2007 data—mortality." For explanation of asterisks preceding cause-of-death codes, see http://www.cdc.gov/nchs andrefer to "Detailed technical notes to the United States 2007 data - mortality"]_____________________________________________________________________________________________________________________________________________________________
Cause of death (Based on theInternational Classificationof Diseases, Tenth Revision, Second 40-44 45-49 50-54 55-59 60-64 65-69 70-74 75-79 80-84 85 yearsEdition, 2004), race, and sex years years years years years years years years years and over______________________________________________________________________________________________________________________________________________________________
Measles (B05)
All races 3/, both sexes................ * * * * * * * * * * Male............................ * * * * * * * * * * Female.......................... * * * * * * * * * * White, both sexes................... * * * * * * * * * * Male............................ * * * * * * * * * * Female.......................... * * * * * * * * * * Black, both sexes................... * * * * * * * * * * Male............................ * * * * * * * * * * Female.......................... * * * * * * * * * *
Viral hepatitis (B15-B19)
All races 3/, both sexes............. 1.7 4.5 8.5 9.0 5.3 4.3 4.7 4.3 4.4 2.9 Male............................ 2.2 6.3 12.5 13.9 7.7 5.4 4.9 4.4 5.1 3.0 Female.......................... 1.2 2.7 4.8 4.4 3.2 3.3 4.6 4.3 4.0 2.9 White, both sexes................... 1.7 4.6 8.5 8.5 4.8 4.0 4.3 3.9 4.1 2.7 Male............................ 2.1 6.5 12.5 13.1 6.9 5.1 4.3 4.1 4.7 3.0 Female.......................... 1.2 2.7 4.6 4.0 2.8 2.9 4.3 3.8 3.6 2.6 Black, both sexes................... 1.9 4.3 10.5 14.3 9.1 5.7 5.9 5.2 5.8 * Male............................ 2.3 5.9 15.6 23.0 14.8 7.6 8.5 * * * Female.......................... 1.5 3.0 6.2 7.1 4.5 4.4 4.2 * * *

19JUL10 Plate 2 of 2 Page 9
Worktable 210R. Death rates for 113 selected causes, alcohol-induced causes, drug-induced causes, and injury by firearms, by 5-year agegroups, race, and sex: United States, 2007
[Rates per 100,000 population in specified group. Rates based on populations estimated as of July 1, 2007. Race categories are consistentwith the 1977 Office of Management and Budget (OMB) standards. In 2007, multiple-race data were reported by California, Connecticut, Delaware, Districtof Columbia, Florida, Hawaii, Idaho, Kansas, Maine, Michigan, Minnesota, Montana, Nebraska, New Hampshire, New Jersey, New Mexico, New York, Ohio,Oklahoma, Oregon, Rhode Island, South Carolina, South Dakota, Texas, Utah, Washington, Wisconsin, and Wyoming. The multiple-race data for these areas werebridged to the single-race categories of the 1977 OMB standards for comparability with other areas; see http://www.cdc.gov/nchs and refer to "Detailedtechnical notes to the United States 2007 data—mortality." For explanation of asterisks preceding cause-of-death codes, see http://www.cdc.gov/nchs andrefer to "Detailed technical notes to the United States 2007 data - mortality"]_____________________________________________________________________________________________________________________________________________________________
Cause of death (Based on theInternational Classificationof Diseases, Tenth Revision, Second 40-44 45-49 50-54 55-59 60-64 65-69 70-74 75-79 80-84 85 yearsEdition, 2004), race, and sex years years years years years years years years years and over______________________________________________________________________________________________________________________________________________________________
Human immunodeficiency virus (HIV) disease (B20-B24)
All races 3/, both sexes............. 10.0 9.9 9.0 6.0 4.3 2.8 1.7 1.0 0.6 * Male............................ 14.4 14.4 13.6 9.5 7.3 5.0 3.0 2.1 1.0 * Female.......................... 5.5 5.6 4.5 2.8 1.6 0.8 0.7 * * * White, both sexes................... 5.5 5.2 4.4 3.0 2.0 1.6 0.9 0.5 * * Male............................ 9.1 8.5 7.3 5.0 3.5 3.1 1.7 1.2 * * Female.......................... 1.9 2.0 1.5 1.0 0.7 * * * * * Black, both sexes................... 41.4 44.0 44.7 31.8 26.3 14.6 10.0 6.2 * * Male............................ 56.3 61.0 67.0 50.3 48.0 26.3 18.1 12.8 * * Female.......................... 28.4 29.2 25.8 16.6 9.3 5.9 4.4 * * *
Malaria (B50-B54)
All races 3/, both sexes................ * * * * * * * * * * Male............................ * * * * * * * * * * Female.......................... * * * * * * * * * * White, both sexes................... * * * * * * * * * * Male............................ * * * * * * * * * * Female.......................... * * * * * * * * * * Black, both sexes................... * * * * * * * * * * Male............................ * * * * * * * * * * Female.......................... * * * * * * * * * *

19JUL10 Plate 2 of 2 Page 10
Worktable 210R. Death rates for 113 selected causes, alcohol-induced causes, drug-induced causes, and injury by firearms, by 5-year agegroups, race, and sex: United States, 2007
[Rates per 100,000 population in specified group. Rates based on populations estimated as of July 1, 2007. Race categories are consistentwith the 1977 Office of Management and Budget (OMB) standards. In 2007, multiple-race data were reported by California, Connecticut, Delaware, Districtof Columbia, Florida, Hawaii, Idaho, Kansas, Maine, Michigan, Minnesota, Montana, Nebraska, New Hampshire, New Jersey, New Mexico, New York, Ohio,Oklahoma, Oregon, Rhode Island, South Carolina, South Dakota, Texas, Utah, Washington, Wisconsin, and Wyoming. The multiple-race data for these areas werebridged to the single-race categories of the 1977 OMB standards for comparability with other areas; see http://www.cdc.gov/nchs and refer to "Detailedtechnical notes to the United States 2007 data—mortality." For explanation of asterisks preceding cause-of-death codes, see http://www.cdc.gov/nchs andrefer to "Detailed technical notes to the United States 2007 data - mortality"]_____________________________________________________________________________________________________________________________________________________________
Cause of death (Based on theInternational Classificationof Diseases, Tenth Revision, Second 40-44 45-49 50-54 55-59 60-64 65-69 70-74 75-79 80-84 85 yearsEdition, 2004), race, and sex years years years years years years years years years and over______________________________________________________________________________________________________________________________________________________________
Other and unspecified infectious and parasitic diseases and their sequelae (A00,A05,A20-A36,A42-A44,A48-A49,A54-A79,A81-A82,A85.0-A85.1,A85.8,A86-B04,B06-B09,B25-B49,B55-B99)
All races 3/, both sexes............. 0.6 0.9 1.4 2.2 3.5 4.8 6.7 9.5 13.5 20.0 Male............................ 0.7 1.1 1.9 2.5 4.0 5.2 8.4 10.9 17.2 25.3 Female.......................... 0.5 0.8 1.0 2.0 3.1 4.5 5.4 8.4 11.2 17.5 White, both sexes................... 0.5 0.7 1.4 2.1 3.4 4.7 6.7 9.4 13.5 20.5 Male............................ 0.6 0.9 1.8 2.4 3.8 4.9 8.2 10.8 17.3 25.8 Female.......................... 0.3 0.6 0.9 1.8 2.9 4.6 5.4 8.3 11.1 18.0 Black, both sexes................... 1.3 2.0 2.3 3.1 5.9 6.7 6.8 11.2 14.7 17.2 Male............................ * 2.3 3.2 3.2 6.8 9.8 9.7 12.4 16.9 23.8 Female.......................... 1.3 1.8 1.6 3.0 5.2 4.4 4.8 10.4 13.5 14.5
Malignant neoplasms (C00-C97)
All races 3/, both sexes............. 41.2 82.1 149.4 249.4 398.6 610.3 847.0 1,133.0 1,414.7 1,590.2 Male............................ 36.0 78.8 160.0 279.6 459.3 720.6 1,027.9 1,431.9 1,878.7 2,249.2 Female.......................... 46.3 85.5 139.2 220.9 342.8 513.8 699.2 912.8 1,121.7 1,276.7 White, both sexes................... 39.5 78.5 143.0 240.7 391.6 607.1 849.6 1,138.3 1,425.0 1,602.3 Male............................ 34.9 75.0 152.3 266.5 447.1 710.1 1,020.2 1,427.8 1,882.0 2,253.2 Female.......................... 44.2 82.0 133.9 215.9 339.7 515.2 707.3 920.7 1,132.7 1,291.6 Black, both sexes................... 57.4 118.4 221.5 362.4 546.9 779.3 990.2 1,288.9 1,521.4 1,668.2 Male............................ 48.6 116.5 250.0 444.2 692.0 1,006.0 1,315.7 1,772.8 2,187.2 2,637.1 Female.......................... 65.1 120.0 197.2 295.3 433.3 612.4 765.7 997.2 1,170.9 1,265.2

19JUL10 Plate 2 of 2 Page 11
Worktable 210R. Death rates for 113 selected causes, alcohol-induced causes, drug-induced causes, and injury by firearms, by 5-year agegroups, race, and sex: United States, 2007
[Rates per 100,000 population in specified group. Rates based on populations estimated as of July 1, 2007. Race categories are consistentwith the 1977 Office of Management and Budget (OMB) standards. In 2007, multiple-race data were reported by California, Connecticut, Delaware, Districtof Columbia, Florida, Hawaii, Idaho, Kansas, Maine, Michigan, Minnesota, Montana, Nebraska, New Hampshire, New Jersey, New Mexico, New York, Ohio,Oklahoma, Oregon, Rhode Island, South Carolina, South Dakota, Texas, Utah, Washington, Wisconsin, and Wyoming. The multiple-race data for these areas werebridged to the single-race categories of the 1977 OMB standards for comparability with other areas; see http://www.cdc.gov/nchs and refer to "Detailedtechnical notes to the United States 2007 data—mortality." For explanation of asterisks preceding cause-of-death codes, see http://www.cdc.gov/nchs andrefer to "Detailed technical notes to the United States 2007 data - mortality"]_____________________________________________________________________________________________________________________________________________________________
Cause of death (Based on theInternational Classificationof Diseases, Tenth Revision, Second 40-44 45-49 50-54 55-59 60-64 65-69 70-74 75-79 80-84 85 yearsEdition, 2004), race, and sex years years years years years years years years years and over______________________________________________________________________________________________________________________________________________________________
Malignant neoplasms of lip, oral cavity and pharynx (C00-C14)
All races 3/, both sexes............. 0.8 1.7 3.5 5.4 7.1 9.3 10.7 12.7 14.2 17.1 Male............................ 1.1 2.6 5.5 8.6 11.9 14.9 16.2 19.7 20.6 24.0 Female.......................... 0.6 0.9 1.7 2.4 2.8 4.3 6.1 7.6 10.1 13.8 White, both sexes................... 0.7 1.5 3.3 5.0 6.9 8.9 10.6 12.7 14.4 17.6 Male............................ 0.9 2.3 5.1 7.9 11.6 14.1 15.5 19.4 20.8 24.4 Female.......................... 0.4 0.7 1.5 2.2 2.6 4.2 6.5 7.7 10.3 14.3 Black, both sexes................... 1.5 3.0 5.4 9.1 10.6 14.3 13.0 14.7 11.9 14.2 Male............................ 2.1 4.3 9.1 15.5 17.5 26.1 25.4 26.1 19.6 23.8 Female.......................... * 1.8 2.2 3.9 5.2 5.6 4.4 7.7 7.8 10.3
Malignant neoplasm of esophagus (C15)
All races 3/, both sexes............. 0.9 2.4 4.3 8.3 12.9 16.9 22.2 24.4 27.9 25.0 Male............................ 1.5 4.1 7.6 14.5 22.8 30.2 38.6 44.2 52.8 48.4 Female.......................... 0.2 0.7 1.2 2.4 3.7 5.2 8.9 9.9 12.1 13.9 White, both sexes................... 0.9 2.5 4.3 8.1 13.0 17.2 22.8 25.0 28.3 25.8 Male............................ 1.6 4.3 7.6 14.3 23.1 30.8 39.5 45.1 53.8 49.8 Female.......................... * 0.6 1.0 2.2 3.5 5.0 8.8 10.0 12.0 14.3 Black, both sexes................... 1.0 2.6 6.0 12.0 16.5 19.7 23.3 24.0 27.5 18.7 Male............................ * 3.8 10.2 20.3 28.9 35.7 40.8 44.7 49.3 39.9 Female.......................... * 1.6 2.5 5.2 6.8 7.9 11.3 11.5 16.0 9.9

19JUL10 Plate 2 of 2 Page 12
Worktable 210R. Death rates for 113 selected causes, alcohol-induced causes, drug-induced causes, and injury by firearms, by 5-year agegroups, race, and sex: United States, 2007
[Rates per 100,000 population in specified group. Rates based on populations estimated as of July 1, 2007. Race categories are consistentwith the 1977 Office of Management and Budget (OMB) standards. In 2007, multiple-race data were reported by California, Connecticut, Delaware, Districtof Columbia, Florida, Hawaii, Idaho, Kansas, Maine, Michigan, Minnesota, Montana, Nebraska, New Hampshire, New Jersey, New Mexico, New York, Ohio,Oklahoma, Oregon, Rhode Island, South Carolina, South Dakota, Texas, Utah, Washington, Wisconsin, and Wyoming. The multiple-race data for these areas werebridged to the single-race categories of the 1977 OMB standards for comparability with other areas; see http://www.cdc.gov/nchs and refer to "Detailedtechnical notes to the United States 2007 data—mortality." For explanation of asterisks preceding cause-of-death codes, see http://www.cdc.gov/nchs andrefer to "Detailed technical notes to the United States 2007 data - mortality"]_____________________________________________________________________________________________________________________________________________________________
Cause of death (Based on theInternational Classificationof Diseases, Tenth Revision, Second 40-44 45-49 50-54 55-59 60-64 65-69 70-74 75-79 80-84 85 yearsEdition, 2004), race, and sex years years years years years years years years years and over______________________________________________________________________________________________________________________________________________________________
Malignant neoplasm of stomach (C16)
All races 3/, both sexes............. 1.3 2.2 3.1 4.6 7.2 11.0 15.9 21.9 29.0 35.4 Male............................ 1.5 2.5 4.1 6.3 10.1 16.1 23.1 30.8 41.4 51.1 Female.......................... 1.1 1.8 2.2 3.0 4.5 6.6 10.1 15.3 21.1 27.9 White, both sexes................... 1.1 1.8 2.6 3.8 6.0 9.6 13.7 19.0 25.4 31.9 Male............................ 1.4 2.0 3.4 5.3 8.3 14.2 20.1 26.9 35.4 46.4 Female.......................... 0.9 1.6 1.8 2.3 3.8 5.6 8.4 13.1 19.1 25.0 Black, both sexes................... 1.9 3.7 6.4 9.4 15.4 21.3 29.7 43.3 58.7 65.4 Male............................ 2.3 5.1 9.6 13.2 24.1 33.4 45.0 68.2 93.8 96.0 Female.......................... 1.6 2.5 3.6 6.4 8.5 12.3 19.2 28.3 40.2 52.7
Malignant neoplasms of colon, rectum and anus (C18-C21)
All races 3/, both sexes............. 4.1 8.0 14.1 22.4 34.3 50.4 72.3 100.7 141.1 200.8 Male............................ 4.4 8.7 16.3 26.8 42.9 62.0 90.6 123.5 173.0 223.5 Female.......................... 3.8 7.3 12.1 18.3 26.5 40.1 57.4 83.9 121.0 190.0 White, both sexes................... 3.9 7.4 13.1 20.8 32.2 48.6 70.4 98.7 140.3 200.9 Male............................ 4.1 8.0 15.2 24.7 40.7 59.7 88.4 121.3 172.8 223.1 Female.......................... 3.6 6.9 11.1 17.0 24.3 38.7 55.5 81.7 119.5 190.3 Black, both sexes................... 5.8 12.4 24.1 38.3 59.1 75.4 101.5 137.7 177.9 225.4 Male............................ 6.7 14.2 28.4 46.7 74.4 98.0 130.5 175.3 218.7 266.9 Female.......................... 5.1 10.9 20.5 31.4 47.2 58.8 81.5 115.0 156.4 208.2

19JUL10 Plate 2 of 2 Page 13
Worktable 210R. Death rates for 113 selected causes, alcohol-induced causes, drug-induced causes, and injury by firearms, by 5-year agegroups, race, and sex: United States, 2007
[Rates per 100,000 population in specified group. Rates based on populations estimated as of July 1, 2007. Race categories are consistentwith the 1977 Office of Management and Budget (OMB) standards. In 2007, multiple-race data were reported by California, Connecticut, Delaware, Districtof Columbia, Florida, Hawaii, Idaho, Kansas, Maine, Michigan, Minnesota, Montana, Nebraska, New Hampshire, New Jersey, New Mexico, New York, Ohio,Oklahoma, Oregon, Rhode Island, South Carolina, South Dakota, Texas, Utah, Washington, Wisconsin, and Wyoming. The multiple-race data for these areas werebridged to the single-race categories of the 1977 OMB standards for comparability with other areas; see http://www.cdc.gov/nchs and refer to "Detailedtechnical notes to the United States 2007 data—mortality." For explanation of asterisks preceding cause-of-death codes, see http://www.cdc.gov/nchs andrefer to "Detailed technical notes to the United States 2007 data - mortality"]_____________________________________________________________________________________________________________________________________________________________
Cause of death (Based on theInternational Classificationof Diseases, Tenth Revision, Second 40-44 45-49 50-54 55-59 60-64 65-69 70-74 75-79 80-84 85 yearsEdition, 2004), race, and sex years years years years years years years years years and over______________________________________________________________________________________________________________________________________________________________
Malignant neoplasms of liver and intrahepatic bile ducts (C22)
All races 3/, both sexes............. 1.2 3.4 8.2 12.3 13.3 17.1 23.8 30.2 36.0 32.0 Male............................ 1.7 5.0 13.7 20.3 20.9 24.8 33.8 43.0 50.3 43.3 Female.......................... 0.7 1.8 3.0 4.9 6.4 10.4 15.6 20.8 26.9 26.7 White, both sexes................... 0.9 3.0 7.4 10.6 11.8 16.0 22.4 29.2 34.9 31.1 Male............................ 1.3 4.4 12.1 17.3 17.9 22.8 31.4 41.2 49.4 41.8 Female.......................... 0.6 1.6 2.7 4.3 6.0 9.8 14.9 20.2 25.6 26.0 Black, both sexes................... 2.1 4.3 13.2 22.6 23.2 22.1 27.1 33.1 34.5 34.2 Male............................ 3.4 6.7 23.0 40.7 41.9 36.4 41.7 50.0 45.9 50.1 Female.......................... * 2.2 4.9 7.8 8.5 11.6 17.1 22.9 28.4 27.6
Malignant neoplasm of pancreas (C25)
All races 3/, both sexes............. 1.8 4.1 9.0 15.6 25.3 38.0 53.4 70.5 90.4 94.6 Male............................ 2.2 4.8 11.2 19.3 31.3 45.7 61.3 79.2 100.6 104.9 Female.......................... 1.5 3.3 6.8 12.1 19.9 31.2 46.8 64.1 83.9 89.8 White, both sexes................... 1.8 3.9 8.4 15.0 25.1 37.5 52.5 70.1 89.5 93.6 Male............................ 2.2 4.6 10.6 18.5 30.8 45.8 60.6 79.4 101.0 105.4 Female.......................... 1.4 3.3 6.3 11.7 19.7 30.0 45.6 63.1 82.2 88.0 Black, both sexes................... 2.2 5.4 14.5 23.6 32.5 50.6 68.8 88.4 110.6 114.1 Male............................ 2.5 6.8 18.0 31.2 43.2 56.6 77.7 96.1 104.0 107.1 Female.......................... 2.0 4.1 11.5 17.3 24.0 46.2 62.7 83.8 114.1 117.0
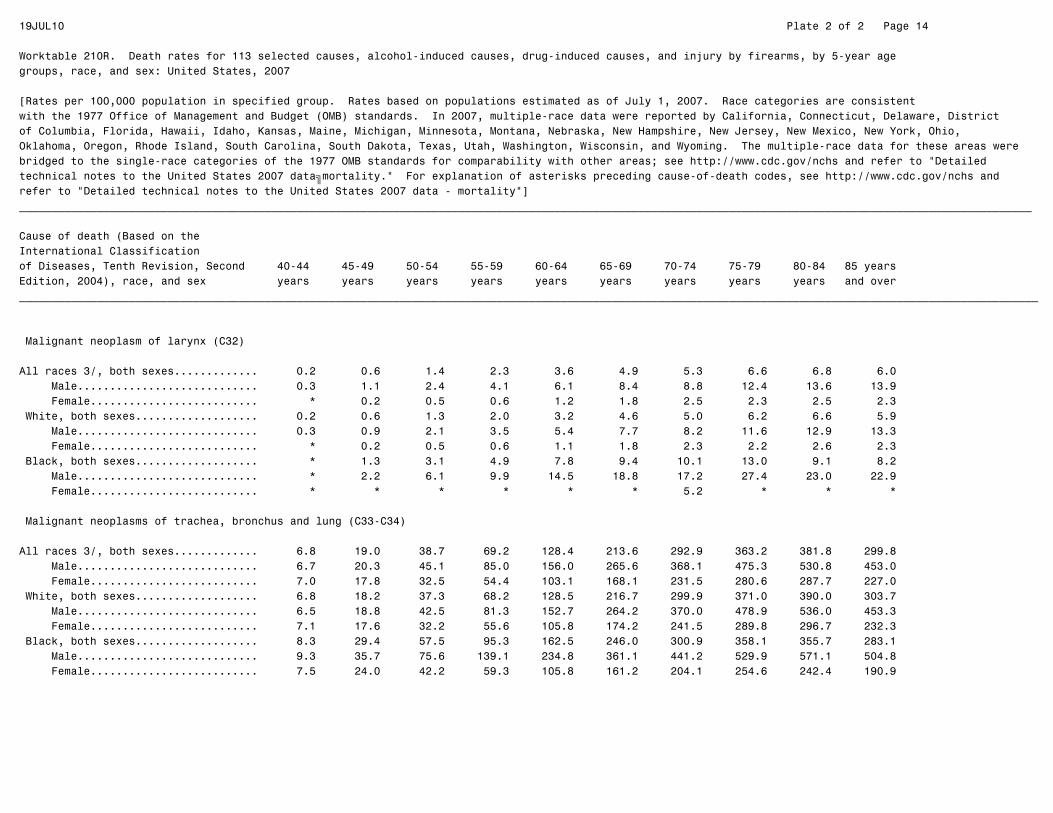
19JUL10 Plate 2 of 2 Page 14
Worktable 210R. Death rates for 113 selected causes, alcohol-induced causes, drug-induced causes, and injury by firearms, by 5-year agegroups, race, and sex: United States, 2007
[Rates per 100,000 population in specified group. Rates based on populations estimated as of July 1, 2007. Race categories are consistentwith the 1977 Office of Management and Budget (OMB) standards. In 2007, multiple-race data were reported by California, Connecticut, Delaware, Districtof Columbia, Florida, Hawaii, Idaho, Kansas, Maine, Michigan, Minnesota, Montana, Nebraska, New Hampshire, New Jersey, New Mexico, New York, Ohio,Oklahoma, Oregon, Rhode Island, South Carolina, South Dakota, Texas, Utah, Washington, Wisconsin, and Wyoming. The multiple-race data for these areas werebridged to the single-race categories of the 1977 OMB standards for comparability with other areas; see http://www.cdc.gov/nchs and refer to "Detailedtechnical notes to the United States 2007 data—mortality." For explanation of asterisks preceding cause-of-death codes, see http://www.cdc.gov/nchs andrefer to "Detailed technical notes to the United States 2007 data - mortality"]_____________________________________________________________________________________________________________________________________________________________
Cause of death (Based on theInternational Classificationof Diseases, Tenth Revision, Second 40-44 45-49 50-54 55-59 60-64 65-69 70-74 75-79 80-84 85 yearsEdition, 2004), race, and sex years years years years years years years years years and over______________________________________________________________________________________________________________________________________________________________
Malignant neoplasm of larynx (C32)
All races 3/, both sexes............. 0.2 0.6 1.4 2.3 3.6 4.9 5.3 6.6 6.8 6.0 Male............................ 0.3 1.1 2.4 4.1 6.1 8.4 8.8 12.4 13.6 13.9 Female.......................... * 0.2 0.5 0.6 1.2 1.8 2.5 2.3 2.5 2.3 White, both sexes................... 0.2 0.6 1.3 2.0 3.2 4.6 5.0 6.2 6.6 5.9 Male............................ 0.3 0.9 2.1 3.5 5.4 7.7 8.2 11.6 12.9 13.3 Female.......................... * 0.2 0.5 0.6 1.1 1.8 2.3 2.2 2.6 2.3 Black, both sexes................... * 1.3 3.1 4.9 7.8 9.4 10.1 13.0 9.1 8.2 Male............................ * 2.2 6.1 9.9 14.5 18.8 17.2 27.4 23.0 22.9 Female.......................... * * * * * * 5.2 * * *
Malignant neoplasms of trachea, bronchus and lung (C33-C34)
All races 3/, both sexes............. 6.8 19.0 38.7 69.2 128.4 213.6 292.9 363.2 381.8 299.8 Male............................ 6.7 20.3 45.1 85.0 156.0 265.6 368.1 475.3 530.8 453.0 Female.......................... 7.0 17.8 32.5 54.4 103.1 168.1 231.5 280.6 287.7 227.0 White, both sexes................... 6.8 18.2 37.3 68.2 128.5 216.7 299.9 371.0 390.0 303.7 Male............................ 6.5 18.8 42.5 81.3 152.7 264.2 370.0 478.9 536.0 453.3 Female.......................... 7.1 17.6 32.2 55.6 105.8 174.2 241.5 289.8 296.7 232.3 Black, both sexes................... 8.3 29.4 57.5 95.3 162.5 246.0 300.9 358.1 355.7 283.1 Male............................ 9.3 35.7 75.6 139.1 234.8 361.1 441.2 529.9 571.1 504.8 Female.......................... 7.5 24.0 42.2 59.3 105.8 161.2 204.1 254.6 242.4 190.9

19JUL10 Plate 2 of 2 Page 15
Worktable 210R. Death rates for 113 selected causes, alcohol-induced causes, drug-induced causes, and injury by firearms, by 5-year agegroups, race, and sex: United States, 2007
[Rates per 100,000 population in specified group. Rates based on populations estimated as of July 1, 2007. Race categories are consistentwith the 1977 Office of Management and Budget (OMB) standards. In 2007, multiple-race data were reported by California, Connecticut, Delaware, Districtof Columbia, Florida, Hawaii, Idaho, Kansas, Maine, Michigan, Minnesota, Montana, Nebraska, New Hampshire, New Jersey, New Mexico, New York, Ohio,Oklahoma, Oregon, Rhode Island, South Carolina, South Dakota, Texas, Utah, Washington, Wisconsin, and Wyoming. The multiple-race data for these areas werebridged to the single-race categories of the 1977 OMB standards for comparability with other areas; see http://www.cdc.gov/nchs and refer to "Detailedtechnical notes to the United States 2007 data—mortality." For explanation of asterisks preceding cause-of-death codes, see http://www.cdc.gov/nchs andrefer to "Detailed technical notes to the United States 2007 data - mortality"]_____________________________________________________________________________________________________________________________________________________________
Cause of death (Based on theInternational Classificationof Diseases, Tenth Revision, Second 40-44 45-49 50-54 55-59 60-64 65-69 70-74 75-79 80-84 85 yearsEdition, 2004), race, and sex years years years years years years years years years and over______________________________________________________________________________________________________________________________________________________________
Malignant melanoma of skin (C43)
All races 3/, both sexes............. 1.4 2.2 3.2 4.8 6.0 7.8 10.4 14.1 17.5 19.9 Male............................ 1.6 2.7 4.4 6.7 8.9 11.6 16.0 22.1 28.6 35.8 Female.......................... 1.2 1.7 2.0 3.0 3.3 4.5 5.9 8.3 10.6 12.4 White, both sexes................... 1.7 2.6 3.8 5.6 6.8 8.9 11.9 15.7 19.3 21.6 Male............................ 2.0 3.2 5.2 7.8 10.1 13.1 18.2 24.4 31.6 38.9 Female.......................... 1.4 2.0 2.5 3.5 3.7 5.2 6.6 9.1 11.4 13.4 Black, both sexes................... * * * * * * * * * 5.7 Male............................ * * * * * * * * * * Female.......................... * * * * * * * * * *
Malignant neoplasm of breast (C50)
All races 3/, both sexes............. 6.6 11.0 16.6 23.4 31.0 39.4 45.8 60.3 81.8 116.6 Male............................ * * 0.2 0.3 0.6 0.8 1.3 1.6 2.4 3.4 Female.......................... 13.0 21.6 32.3 45.1 58.9 73.2 82.3 103.5 131.9 170.4 White, both sexes................... 5.8 9.7 15.5 21.9 29.9 38.8 45.7 60.1 82.2 117.6 Male............................ * * 0.2 0.3 0.6 0.8 1.3 1.5 2.5 3.4 Female.......................... 11.7 19.4 30.4 42.8 57.4 72.8 82.7 104.1 133.1 172.1 Black, both sexes................... 12.3 20.6 27.9 39.4 46.6 55.3 58.4 78.1 99.9 136.8 Male............................ * * * * * * * * * * Female.......................... 23.2 38.2 51.3 70.9 82.6 94.5 97.8 123.3 151.0 191.9

19JUL10 Plate 2 of 2 Page 16
Worktable 210R. Death rates for 113 selected causes, alcohol-induced causes, drug-induced causes, and injury by firearms, by 5-year agegroups, race, and sex: United States, 2007
[Rates per 100,000 population in specified group. Rates based on populations estimated as of July 1, 2007. Race categories are consistentwith the 1977 Office of Management and Budget (OMB) standards. In 2007, multiple-race data were reported by California, Connecticut, Delaware, Districtof Columbia, Florida, Hawaii, Idaho, Kansas, Maine, Michigan, Minnesota, Montana, Nebraska, New Hampshire, New Jersey, New Mexico, New York, Ohio,Oklahoma, Oregon, Rhode Island, South Carolina, South Dakota, Texas, Utah, Washington, Wisconsin, and Wyoming. The multiple-race data for these areas werebridged to the single-race categories of the 1977 OMB standards for comparability with other areas; see http://www.cdc.gov/nchs and refer to "Detailedtechnical notes to the United States 2007 data—mortality." For explanation of asterisks preceding cause-of-death codes, see http://www.cdc.gov/nchs andrefer to "Detailed technical notes to the United States 2007 data - mortality"]_____________________________________________________________________________________________________________________________________________________________
Cause of death (Based on theInternational Classificationof Diseases, Tenth Revision, Second 40-44 45-49 50-54 55-59 60-64 65-69 70-74 75-79 80-84 85 yearsEdition, 2004), race, and sex years years years years years years years years years and over______________________________________________________________________________________________________________________________________________________________
Malignant neoplasm of cervix uteri (C53)
All races 3/, both sexes............. 1.7 1.8 2.4 2.7 2.8 3.1 3.2 3.4 4.5 4.7 Male............................ ... ... ... ... ... ... ... ... ... ... Female.......................... 3.3 3.5 4.7 5.2 5.3 5.9 5.8 5.9 7.3 7.0 White, both sexes................... 1.5 1.7 2.2 2.5 2.4 2.7 2.9 2.8 4.1 4.0 Male............................ ... ... ... ... ... ... ... ... ... ... Female.......................... 3.0 3.3 4.3 4.9 4.7 5.1 5.2 5.0 6.7 5.9 Black, both sexes................... 2.9 2.9 4.1 4.1 5.7 7.1 6.5 9.3 9.3 13.0 Male............................ ... ... ... ... ... ... ... ... ... ... Female.......................... 5.4 5.3 7.7 7.5 10.1 12.3 11.0 14.9 14.2 18.4
Malignant neoplasms of corpus uteri and uterus, part unspecified (C54-C55)
All races 3/, both sexes............. 0.5 0.9 1.8 3.7 6.3 9.7 11.4 13.5 17.0 20.1 Male............................ ... ... ... ... ... ... ... ... ... ... Female.......................... 1.0 1.8 3.5 7.1 12.1 18.1 20.8 23.5 27.8 29.6 White, both sexes................... 0.4 0.9 1.7 3.5 5.8 8.3 10.2 12.4 16.0 19.9 Male............................ ... ... ... ... ... ... ... ... ... ... Female.......................... 0.9 1.8 3.4 6.8 11.2 15.7 18.7 21.6 26.2 29.4 Black, both sexes................... * 1.2 2.6 5.5 12.8 24.5 24.7 29.1 31.9 27.0 Male............................ ... ... ... ... ... ... ... ... ... ... Female.......................... * 2.2 4.7 10.0 22.9 42.5 41.7 46.7 48.7 38.2

19JUL10 Plate 2 of 2 Page 17
Worktable 210R. Death rates for 113 selected causes, alcohol-induced causes, drug-induced causes, and injury by firearms, by 5-year agegroups, race, and sex: United States, 2007
[Rates per 100,000 population in specified group. Rates based on populations estimated as of July 1, 2007. Race categories are consistentwith the 1977 Office of Management and Budget (OMB) standards. In 2007, multiple-race data were reported by California, Connecticut, Delaware, Districtof Columbia, Florida, Hawaii, Idaho, Kansas, Maine, Michigan, Minnesota, Montana, Nebraska, New Hampshire, New Jersey, New Mexico, New York, Ohio,Oklahoma, Oregon, Rhode Island, South Carolina, South Dakota, Texas, Utah, Washington, Wisconsin, and Wyoming. The multiple-race data for these areas werebridged to the single-race categories of the 1977 OMB standards for comparability with other areas; see http://www.cdc.gov/nchs and refer to "Detailedtechnical notes to the United States 2007 data—mortality." For explanation of asterisks preceding cause-of-death codes, see http://www.cdc.gov/nchs andrefer to "Detailed technical notes to the United States 2007 data - mortality"]_____________________________________________________________________________________________________________________________________________________________
Cause of death (Based on theInternational Classificationof Diseases, Tenth Revision, Second 40-44 45-49 50-54 55-59 60-64 65-69 70-74 75-79 80-84 85 yearsEdition, 2004), race, and sex years years years years years years years years years and over______________________________________________________________________________________________________________________________________________________________
Malignant neoplasm of ovary (C56)
All races 3/, both sexes............. 1.1 2.4 4.7 7.5 11.2 16.3 21.6 26.6 35.0 37.6 Male............................ ... ... ... ... ... ... ... ... ... ... Female.......................... 2.3 4.8 9.1 14.6 21.6 30.6 39.3 46.3 57.1 55.4 White, both sexes................... 1.2 2.5 4.8 7.8 11.6 17.1 22.5 27.6 36.2 38.9 Male............................ ... ... ... ... ... ... ... ... ... ... Female.......................... 2.5 5.0 9.5 15.3 22.5 32.4 41.2 48.3 59.3 57.5 Black, both sexes................... 0.9 1.9 4.1 6.7 10.4 14.1 19.2 23.3 27.9 27.2 Male............................ ... ... ... ... ... ... ... ... ... ... Female.......................... 1.6 3.6 7.5 12.3 18.6 24.4 32.5 37.4 42.6 38.5
Malignant neoplasm of prostate (C61)
All races 3/, both sexes................ * 0.4 1.6 4.3 10.3 21.2 39.9 68.0 110.1 170.5 Male............................ * 0.8 3.2 8.9 21.5 45.5 88.8 160.4 284.4 528.9 Female.......................... ... ... ... ... ... ... ... ... ... ... White, both sexes................... * 0.3 1.4 3.6 8.9 18.5 35.3 62.5 103.9 163.2 Male............................ * 0.7 2.8 7.3 18.4 39.3 77.7 145.6 266.5 505.1 Female.......................... ... ... ... ... ... ... ... ... ... ... Black, both sexes................... * 1.1 3.5 11.1 25.7 51.0 93.4 143.7 207.4 292.6 Male............................ * 2.4 7.7 24.5 58.5 120.2 228.7 382.0 601.5 996.0 Female.......................... ... ... ... ... ... ... ... ... ... ...

19JUL10 Plate 2 of 2 Page 18
Worktable 210R. Death rates for 113 selected causes, alcohol-induced causes, drug-induced causes, and injury by firearms, by 5-year agegroups, race, and sex: United States, 2007
[Rates per 100,000 population in specified group. Rates based on populations estimated as of July 1, 2007. Race categories are consistentwith the 1977 Office of Management and Budget (OMB) standards. In 2007, multiple-race data were reported by California, Connecticut, Delaware, Districtof Columbia, Florida, Hawaii, Idaho, Kansas, Maine, Michigan, Minnesota, Montana, Nebraska, New Hampshire, New Jersey, New Mexico, New York, Ohio,Oklahoma, Oregon, Rhode Island, South Carolina, South Dakota, Texas, Utah, Washington, Wisconsin, and Wyoming. The multiple-race data for these areas werebridged to the single-race categories of the 1977 OMB standards for comparability with other areas; see http://www.cdc.gov/nchs and refer to "Detailedtechnical notes to the United States 2007 data—mortality." For explanation of asterisks preceding cause-of-death codes, see http://www.cdc.gov/nchs andrefer to "Detailed technical notes to the United States 2007 data - mortality"]_____________________________________________________________________________________________________________________________________________________________
Cause of death (Based on theInternational Classificationof Diseases, Tenth Revision, Second 40-44 45-49 50-54 55-59 60-64 65-69 70-74 75-79 80-84 85 yearsEdition, 2004), race, and sex years years years years years years years years years and over______________________________________________________________________________________________________________________________________________________________
Malignant neoplasms of kidney and renal pelvis (C64-C65)
All races 3/, both sexes............. 0.8 2.1 3.7 6.3 9.9 14.7 18.4 24.4 30.7 33.0 Male............................ 1.1 2.9 5.4 9.2 14.6 21.2 25.4 35.1 45.1 50.9 Female.......................... 0.5 1.2 2.0 3.7 5.5 9.0 12.6 16.6 21.6 24.5 White, both sexes................... 0.8 2.1 3.6 6.4 10.1 15.1 19.0 24.8 31.4 33.4 Male............................ 1.0 2.8 5.4 9.2 14.7 21.4 25.9 35.8 46.0 52.2 Female.......................... 0.5 1.3 1.9 3.8 5.7 9.4 13.2 16.5 22.1 24.5 Black, both sexes................... 1.1 2.6 4.2 7.0 10.7 13.7 16.7 26.0 28.2 30.2 Male............................ 1.6 4.1 6.4 10.4 17.5 22.0 24.2 33.6 41.9 41.6 Female.......................... * 1.3 2.4 4.2 5.3 7.6 11.5 21.3 21.0 25.5
Malignant neoplasm of bladder (C67)
All races 3/, both sexes............. 0.3 0.9 1.8 3.5 6.3 11.4 18.5 31.7 47.1 68.6 Male............................ 0.4 1.2 2.7 5.4 10.1 18.5 30.4 54.1 84.3 132.7 Female.......................... 0.3 0.6 0.9 1.8 2.9 5.1 8.9 15.3 23.6 38.1 White, both sexes................... 0.3 0.9 1.8 3.6 6.7 12.0 19.7 33.0 49.1 71.2 Male............................ 0.4 1.2 2.8 5.5 10.5 19.5 32.3 56.5 89.3 140.0 Female.......................... 0.2 0.5 0.8 1.7 3.1 5.2 9.2 15.3 23.4 38.4 Black, both sexes................... * 1.2 2.0 4.4 5.6 9.9 14.6 28.3 37.2 53.9 Male............................ * * 2.7 6.2 8.7 14.7 22.7 42.5 48.6 79.0 Female.......................... * * * 2.9 3.1 6.4 9.0 19.7 31.3 43.5

19JUL10 Plate 2 of 2 Page 19
Worktable 210R. Death rates for 113 selected causes, alcohol-induced causes, drug-induced causes, and injury by firearms, by 5-year agegroups, race, and sex: United States, 2007
[Rates per 100,000 population in specified group. Rates based on populations estimated as of July 1, 2007. Race categories are consistentwith the 1977 Office of Management and Budget (OMB) standards. In 2007, multiple-race data were reported by California, Connecticut, Delaware, Districtof Columbia, Florida, Hawaii, Idaho, Kansas, Maine, Michigan, Minnesota, Montana, Nebraska, New Hampshire, New Jersey, New Mexico, New York, Ohio,Oklahoma, Oregon, Rhode Island, South Carolina, South Dakota, Texas, Utah, Washington, Wisconsin, and Wyoming. The multiple-race data for these areas werebridged to the single-race categories of the 1977 OMB standards for comparability with other areas; see http://www.cdc.gov/nchs and refer to "Detailedtechnical notes to the United States 2007 data—mortality." For explanation of asterisks preceding cause-of-death codes, see http://www.cdc.gov/nchs andrefer to "Detailed technical notes to the United States 2007 data - mortality"]_____________________________________________________________________________________________________________________________________________________________
Cause of death (Based on theInternational Classificationof Diseases, Tenth Revision, Second 40-44 45-49 50-54 55-59 60-64 65-69 70-74 75-79 80-84 85 yearsEdition, 2004), race, and sex years years years years years years years years years and over______________________________________________________________________________________________________________________________________________________________
Malignant neoplasms of meninges, brain and other parts of central nervous system (C70-C72)
All races 3/, both sexes............. 2.4 3.6 5.2 7.9 10.6 14.3 17.0 19.4 20.8 16.1 Male............................ 2.9 4.4 6.3 9.7 13.3 17.5 19.8 23.8 24.6 21.1 Female.......................... 1.8 2.8 4.1 6.2 8.1 11.5 14.8 16.1 18.5 13.8 White, both sexes................... 2.6 3.9 5.6 8.6 11.6 15.4 18.5 21.1 22.3 16.9 Male............................ 3.1 4.8 6.9 10.4 14.4 18.8 21.3 25.7 26.4 22.5 Female.......................... 2.1 3.1 4.4 6.8 8.8 12.4 16.1 17.6 19.6 14.2 Black, both sexes................... 1.4 2.2 3.7 5.0 5.7 9.2 9.7 8.0 9.8 9.0 Male............................ 2.0 2.8 4.3 6.6 7.3 11.0 11.8 8.9 * * Female.......................... * 1.7 3.1 3.7 4.4 7.9 8.3 7.5 9.6 9.2
Malignant neoplasms of lymphoid, hematopoietic and related tissue (C81-C96)
All races 3/, both sexes............. 4.2 6.2 10.4 18.1 30.3 50.0 79.6 119.0 160.8 185.5 Male............................ 5.2 7.5 13.1 22.5 38.2 64.1 102.3 156.8 218.0 253.4 Female.......................... 3.2 5.0 7.8 14.0 23.1 37.6 61.1 91.2 124.7 153.3 White, both sexes................... 3.8 6.0 10.0 17.5 30.3 50.3 81.5 122.3 166.1 192.7 Male............................ 4.9 7.3 12.6 21.9 38.5 64.8 104.8 161.4 225.4 263.7 Female.......................... 2.7 4.7 7.4 13.4 22.6 37.2 62.1 93.0 128.1 158.9 Black, both sexes................... 7.1 8.8 15.0 25.6 37.7 58.5 80.7 105.2 131.1 138.6 Male............................ 8.5 10.4 19.6 30.7 45.2 72.8 100.3 134.6 166.1 181.9 Female.......................... 5.8 7.4 11.1 21.4 31.9 48.0 67.1 87.5 112.6 120.5

19JUL10 Plate 2 of 2 Page 20
Worktable 210R. Death rates for 113 selected causes, alcohol-induced causes, drug-induced causes, and injury by firearms, by 5-year agegroups, race, and sex: United States, 2007
[Rates per 100,000 population in specified group. Rates based on populations estimated as of July 1, 2007. Race categories are consistentwith the 1977 Office of Management and Budget (OMB) standards. In 2007, multiple-race data were reported by California, Connecticut, Delaware, Districtof Columbia, Florida, Hawaii, Idaho, Kansas, Maine, Michigan, Minnesota, Montana, Nebraska, New Hampshire, New Jersey, New Mexico, New York, Ohio,Oklahoma, Oregon, Rhode Island, South Carolina, South Dakota, Texas, Utah, Washington, Wisconsin, and Wyoming. The multiple-race data for these areas werebridged to the single-race categories of the 1977 OMB standards for comparability with other areas; see http://www.cdc.gov/nchs and refer to "Detailedtechnical notes to the United States 2007 data—mortality." For explanation of asterisks preceding cause-of-death codes, see http://www.cdc.gov/nchs andrefer to "Detailed technical notes to the United States 2007 data - mortality"]_____________________________________________________________________________________________________________________________________________________________
Cause of death (Based on theInternational Classificationof Diseases, Tenth Revision, Second 40-44 45-49 50-54 55-59 60-64 65-69 70-74 75-79 80-84 85 yearsEdition, 2004), race, and sex years years years years years years years years years and over______________________________________________________________________________________________________________________________________________________________
Hodgkin's disease (C81)
All races 3/, both sexes............. 0.3 0.3 0.4 0.5 0.6 0.9 1.3 1.8 2.6 2.4 Male............................ 0.4 0.4 0.6 0.5 0.8 1.2 1.5 2.5 2.9 2.8 Female.......................... 0.2 * 0.2 0.4 0.5 0.7 1.1 1.4 2.5 2.2 White, both sexes................... 0.3 0.3 0.4 0.4 0.7 0.9 1.4 2.0 2.9 2.6 Male............................ 0.4 0.4 0.5 0.5 0.8 1.2 1.6 2.6 3.1 2.9 Female.......................... * * * 0.4 0.5 0.7 1.3 1.5 2.7 2.4 Black, both sexes................... * * * * * * * * * * Male............................ * * * * * * * * * * Female.......................... * * * * * * * * * *
Non-Hodgkin's lymphoma (C82-C85)
All races 3/, both sexes............. 1.5 2.4 4.0 7.1 11.2 18.5 28.9 45.0 62.7 72.1 Male............................ 2.1 3.1 5.2 9.2 14.1 24.1 36.7 56.0 79.3 91.6 Female.......................... 0.9 1.8 2.8 5.1 8.6 13.6 22.5 36.8 52.2 62.8 White, both sexes................... 1.3 2.3 4.0 7.1 11.5 19.5 30.6 47.4 66.3 76.6 Male............................ 1.8 3.1 5.1 9.2 14.5 25.1 38.3 59.1 83.4 97.0 Female.......................... 0.8 1.6 2.8 5.1 8.8 14.4 24.1 38.6 55.4 66.8 Black, both sexes................... 2.7 3.3 4.6 8.0 10.7 14.8 18.4 23.5 28.6 31.2 Male............................ 3.8 3.9 6.5 10.4 13.4 21.5 25.1 27.9 33.1 36.5 Female.......................... 1.8 2.8 3.0 6.1 8.5 9.8 13.8 20.8 26.3 29.0
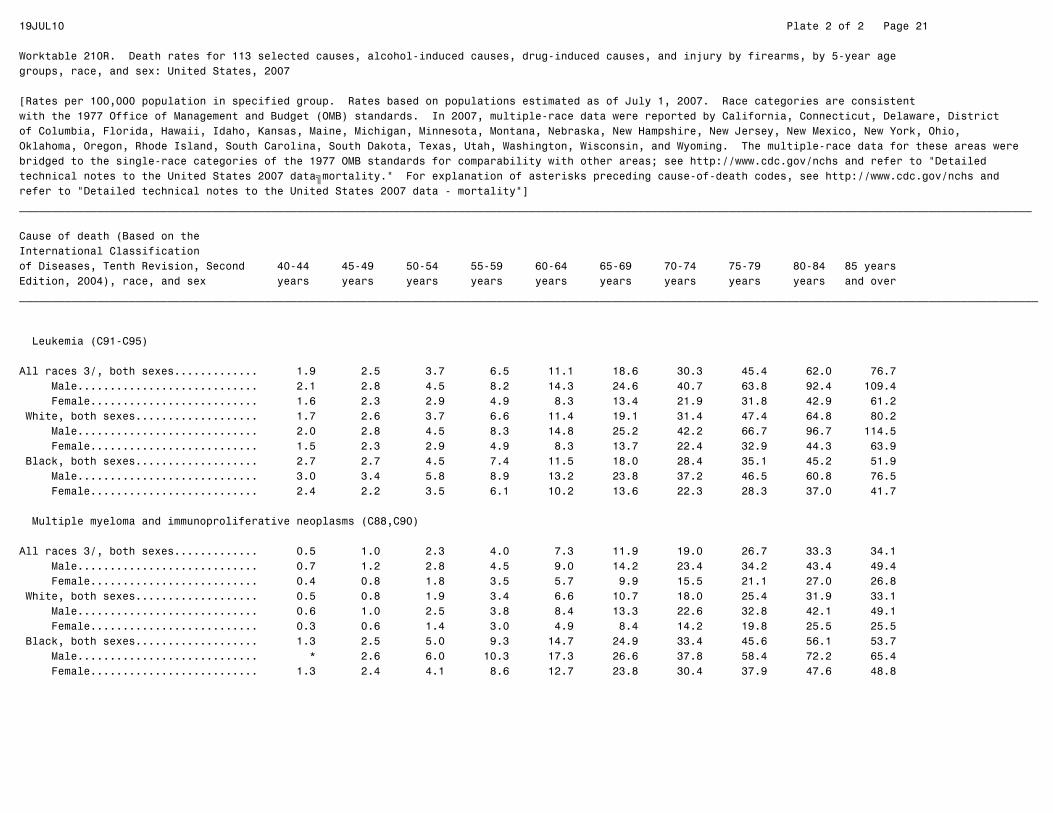
19JUL10 Plate 2 of 2 Page 21
Worktable 210R. Death rates for 113 selected causes, alcohol-induced causes, drug-induced causes, and injury by firearms, by 5-year agegroups, race, and sex: United States, 2007
[Rates per 100,000 population in specified group. Rates based on populations estimated as of July 1, 2007. Race categories are consistentwith the 1977 Office of Management and Budget (OMB) standards. In 2007, multiple-race data were reported by California, Connecticut, Delaware, Districtof Columbia, Florida, Hawaii, Idaho, Kansas, Maine, Michigan, Minnesota, Montana, Nebraska, New Hampshire, New Jersey, New Mexico, New York, Ohio,Oklahoma, Oregon, Rhode Island, South Carolina, South Dakota, Texas, Utah, Washington, Wisconsin, and Wyoming. The multiple-race data for these areas werebridged to the single-race categories of the 1977 OMB standards for comparability with other areas; see http://www.cdc.gov/nchs and refer to "Detailedtechnical notes to the United States 2007 data—mortality." For explanation of asterisks preceding cause-of-death codes, see http://www.cdc.gov/nchs andrefer to "Detailed technical notes to the United States 2007 data - mortality"]_____________________________________________________________________________________________________________________________________________________________
Cause of death (Based on theInternational Classificationof Diseases, Tenth Revision, Second 40-44 45-49 50-54 55-59 60-64 65-69 70-74 75-79 80-84 85 yearsEdition, 2004), race, and sex years years years years years years years years years and over______________________________________________________________________________________________________________________________________________________________
Leukemia (C91-C95)
All races 3/, both sexes............. 1.9 2.5 3.7 6.5 11.1 18.6 30.3 45.4 62.0 76.7 Male............................ 2.1 2.8 4.5 8.2 14.3 24.6 40.7 63.8 92.4 109.4 Female.......................... 1.6 2.3 2.9 4.9 8.3 13.4 21.9 31.8 42.9 61.2 White, both sexes................... 1.7 2.6 3.7 6.6 11.4 19.1 31.4 47.4 64.8 80.2 Male............................ 2.0 2.8 4.5 8.3 14.8 25.2 42.2 66.7 96.7 114.5 Female.......................... 1.5 2.3 2.9 4.9 8.3 13.7 22.4 32.9 44.3 63.9 Black, both sexes................... 2.7 2.7 4.5 7.4 11.5 18.0 28.4 35.1 45.2 51.9 Male............................ 3.0 3.4 5.8 8.9 13.2 23.8 37.2 46.5 60.8 76.5 Female.......................... 2.4 2.2 3.5 6.1 10.2 13.6 22.3 28.3 37.0 41.7
Multiple myeloma and immunoproliferative neoplasms (C88,C90)
All races 3/, both sexes............. 0.5 1.0 2.3 4.0 7.3 11.9 19.0 26.7 33.3 34.1 Male............................ 0.7 1.2 2.8 4.5 9.0 14.2 23.4 34.2 43.4 49.4 Female.......................... 0.4 0.8 1.8 3.5 5.7 9.9 15.5 21.1 27.0 26.8 White, both sexes................... 0.5 0.8 1.9 3.4 6.6 10.7 18.0 25.4 31.9 33.1 Male............................ 0.6 1.0 2.5 3.8 8.4 13.3 22.6 32.8 42.1 49.1 Female.......................... 0.3 0.6 1.4 3.0 4.9 8.4 14.2 19.8 25.5 25.5 Black, both sexes................... 1.3 2.5 5.0 9.3 14.7 24.9 33.4 45.6 56.1 53.7 Male............................ * 2.6 6.0 10.3 17.3 26.6 37.8 58.4 72.2 65.4 Female.......................... 1.3 2.4 4.1 8.6 12.7 23.8 30.4 37.9 47.6 48.8

19JUL10 Plate 2 of 2 Page 22
Worktable 210R. Death rates for 113 selected causes, alcohol-induced causes, drug-induced causes, and injury by firearms, by 5-year agegroups, race, and sex: United States, 2007
[Rates per 100,000 population in specified group. Rates based on populations estimated as of July 1, 2007. Race categories are consistentwith the 1977 Office of Management and Budget (OMB) standards. In 2007, multiple-race data were reported by California, Connecticut, Delaware, Districtof Columbia, Florida, Hawaii, Idaho, Kansas, Maine, Michigan, Minnesota, Montana, Nebraska, New Hampshire, New Jersey, New Mexico, New York, Ohio,Oklahoma, Oregon, Rhode Island, South Carolina, South Dakota, Texas, Utah, Washington, Wisconsin, and Wyoming. The multiple-race data for these areas werebridged to the single-race categories of the 1977 OMB standards for comparability with other areas; see http://www.cdc.gov/nchs and refer to "Detailedtechnical notes to the United States 2007 data—mortality." For explanation of asterisks preceding cause-of-death codes, see http://www.cdc.gov/nchs andrefer to "Detailed technical notes to the United States 2007 data - mortality"]_____________________________________________________________________________________________________________________________________________________________
Cause of death (Based on theInternational Classificationof Diseases, Tenth Revision, Second 40-44 45-49 50-54 55-59 60-64 65-69 70-74 75-79 80-84 85 yearsEdition, 2004), race, and sex years years years years years years years years years and over______________________________________________________________________________________________________________________________________________________________
Other and unspecified malignant neoplasms of lymphoid, hematopoietic and related tissue (C96)
All races 3/, both sexes................ * * * * * * * * * * Male............................ * * * * * * * * * * Female.......................... * * * * * * * * * * White, both sexes................... * * * * * * * * * * Male............................ * * * * * * * * * * Female.......................... * * * * * * * * * * Black, both sexes................... * * * * * * * * * * Male............................ * * * * * * * * * * Female.......................... * * * * * * * * * *
All other and unspecified malignant neoplasms (C17,C23-C24,C26-C31,C37-C41,C44-C49,C51-C52,C57-C60,C62-C63,C66,C68-C69,C73-C80,C97)
All races 3/, both sexes............. 5.1 9.3 15.7 26.9 41.7 61.3 84.4 122.1 162.2 206.7 Male............................ 5.2 10.2 18.7 32.2 50.2 73.7 103.5 149.8 208.1 260.9 Female.......................... 4.9 8.5 12.9 22.0 33.8 50.5 68.8 101.6 133.3 180.9 White, both sexes................... 4.9 9.0 14.9 26.2 40.8 61.0 85.3 124.1 165.1 212.4 Male............................ 5.0 9.7 17.9 31.3 49.2 73.0 105.0 152.9 212.3 269.8 Female.......................... 4.8 8.3 12.0 21.2 33.0 50.3 68.8 102.5 134.9 184.9 Black, both sexes................... 7.0 13.5 23.9 37.9 57.5 76.3 90.4 122.5 149.7 170.8 Male............................ 7.4 16.1 28.6 47.4 73.7 96.0 106.7 147.0 188.3 205.7 Female.......................... 6.6 11.3 19.9 30.2 44.7 61.8 79.2 107.8 129.4 156.2

19JUL10 Plate 2 of 2 Page 23
Worktable 210R. Death rates for 113 selected causes, alcohol-induced causes, drug-induced causes, and injury by firearms, by 5-year agegroups, race, and sex: United States, 2007
[Rates per 100,000 population in specified group. Rates based on populations estimated as of July 1, 2007. Race categories are consistentwith the 1977 Office of Management and Budget (OMB) standards. In 2007, multiple-race data were reported by California, Connecticut, Delaware, Districtof Columbia, Florida, Hawaii, Idaho, Kansas, Maine, Michigan, Minnesota, Montana, Nebraska, New Hampshire, New Jersey, New Mexico, New York, Ohio,Oklahoma, Oregon, Rhode Island, South Carolina, South Dakota, Texas, Utah, Washington, Wisconsin, and Wyoming. The multiple-race data for these areas werebridged to the single-race categories of the 1977 OMB standards for comparability with other areas; see http://www.cdc.gov/nchs and refer to "Detailedtechnical notes to the United States 2007 data—mortality." For explanation of asterisks preceding cause-of-death codes, see http://www.cdc.gov/nchs andrefer to "Detailed technical notes to the United States 2007 data - mortality"]_____________________________________________________________________________________________________________________________________________________________
Cause of death (Based on theInternational Classificationof Diseases, Tenth Revision, Second 40-44 45-49 50-54 55-59 60-64 65-69 70-74 75-79 80-84 85 yearsEdition, 2004), race, and sex years years years years years years years years years and over______________________________________________________________________________________________________________________________________________________________
In situ neoplasms, benign neoplasms and neoplasms of uncertain or unknown behavior (D00-D48)
All races 3/, both sexes............. 0.9 1.3 2.0 3.5 5.4 9.4 16.2 28.2 46.5 76.4 Male............................ 1.0 1.4 2.2 4.3 6.6 11.6 19.9 37.4 63.9 95.7 Female.......................... 0.8 1.1 1.7 2.7 4.3 7.4 13.2 21.5 35.6 67.2 White, both sexes................... 0.9 1.2 2.0 3.5 5.3 9.4 16.5 29.1 47.9 79.4 Male............................ 1.0 1.4 2.2 4.2 6.4 11.5 20.1 38.6 65.8 99.4 Female.......................... 0.8 1.0 1.7 2.8 4.2 7.5 13.4 21.9 36.4 69.9 Black, both sexes................... 1.3 1.7 2.3 4.1 6.7 10.2 18.0 24.3 38.2 49.4 Male............................ * 1.8 2.6 5.6 9.1 13.5 23.3 28.8 52.0 62.0 Female.......................... * 1.6 2.1 2.8 4.9 7.8 14.4 21.6 30.9 44.2
Anemias (D50-D64)
All races 3/, both sexes............. 0.5 0.6 0.6 0.8 1.2 2.1 3.9 6.5 13.2 36.1 Male............................ 0.5 0.5 0.7 0.8 1.2 2.2 3.9 7.1 14.2 34.3 Female.......................... 0.5 0.6 0.5 0.8 1.3 1.9 3.9 6.0 12.5 36.9 White, both sexes................... 0.2 0.2 0.4 0.5 1.1 1.9 3.6 6.3 12.9 36.4 Male............................ * * 0.4 0.5 1.1 2.0 3.7 6.9 14.1 34.5 Female.......................... * 0.3 0.3 0.5 1.1 1.7 3.5 5.8 12.1 37.3 Black, both sexes................... 2.7 3.0 2.3 3.1 2.8 4.7 7.6 9.3 18.2 35.7 Male............................ 3.1 3.0 2.6 3.3 * 5.3 6.6 10.6 19.6 33.1 Female.......................... 2.4 2.9 2.0 2.8 3.0 4.2 8.3 8.5 17.4 36.8

19JUL10 Plate 2 of 2 Page 24
Worktable 210R. Death rates for 113 selected causes, alcohol-induced causes, drug-induced causes, and injury by firearms, by 5-year agegroups, race, and sex: United States, 2007
[Rates per 100,000 population in specified group. Rates based on populations estimated as of July 1, 2007. Race categories are consistentwith the 1977 Office of Management and Budget (OMB) standards. In 2007, multiple-race data were reported by California, Connecticut, Delaware, Districtof Columbia, Florida, Hawaii, Idaho, Kansas, Maine, Michigan, Minnesota, Montana, Nebraska, New Hampshire, New Jersey, New Mexico, New York, Ohio,Oklahoma, Oregon, Rhode Island, South Carolina, South Dakota, Texas, Utah, Washington, Wisconsin, and Wyoming. The multiple-race data for these areas werebridged to the single-race categories of the 1977 OMB standards for comparability with other areas; see http://www.cdc.gov/nchs and refer to "Detailedtechnical notes to the United States 2007 data—mortality." For explanation of asterisks preceding cause-of-death codes, see http://www.cdc.gov/nchs andrefer to "Detailed technical notes to the United States 2007 data - mortality"]_____________________________________________________________________________________________________________________________________________________________
Cause of death (Based on theInternational Classificationof Diseases, Tenth Revision, Second 40-44 45-49 50-54 55-59 60-64 65-69 70-74 75-79 80-84 85 yearsEdition, 2004), race, and sex years years years years years years years years years and over______________________________________________________________________________________________________________________________________________________________
Diabetes mellitus (E10-E14)
All races 3/, both sexes............. 5.6 9.5 17.1 27.9 43.0 64.0 95.7 136.7 196.1 276.2 Male............................ 6.8 12.2 20.8 34.4 52.0 78.0 112.9 155.8 228.2 307.4 Female.......................... 4.4 6.8 13.6 21.8 34.7 51.7 81.7 122.6 175.9 261.4 White, both sexes................... 4.8 8.3 14.8 24.0 37.9 57.1 86.3 126.5 182.6 262.3 Male............................ 6.0 10.8 18.4 30.3 47.0 72.0 104.6 148.2 218.8 300.4 Female.......................... 3.6 5.7 11.4 18.0 29.4 43.8 71.0 110.2 159.4 244.1 Black, both sexes................... 12.1 19.1 36.1 60.4 93.0 129.2 188.7 256.2 356.0 442.1 Male............................ 14.0 24.5 41.7 72.3 106.2 145.4 206.1 269.6 378.0 393.5 Female.......................... 10.4 14.5 31.4 50.7 82.6 117.3 176.8 248.2 344.3 462.4
Nutritional deficiencies (E40-E64)
All races 3/, both sexes............. 0.1 0.1 0.3 0.5 0.8 1.3 2.2 4.3 8.6 24.4 Male............................ * * 0.3 0.5 0.8 1.4 2.5 4.2 9.2 22.1 Female.......................... * * 0.3 0.4 0.8 1.2 2.0 4.4 8.3 25.5 White, both sexes................... * 0.1 0.3 0.4 0.8 1.2 2.0 4.1 8.2 23.3 Male............................ * * 0.3 0.4 0.7 1.2 2.1 3.9 8.7 21.2 Female.......................... * * 0.3 0.4 0.9 1.1 1.8 4.2 7.9 24.4 Black, both sexes................... * * * * * 2.7 5.2 7.8 14.0 36.4 Male............................ * * * * * * 6.3 9.7 16.9 33.1 Female.......................... * * * * * * 4.4 6.7 12.4 37.8

19JUL10 Plate 2 of 2 Page 25
Worktable 210R. Death rates for 113 selected causes, alcohol-induced causes, drug-induced causes, and injury by firearms, by 5-year agegroups, race, and sex: United States, 2007
[Rates per 100,000 population in specified group. Rates based on populations estimated as of July 1, 2007. Race categories are consistentwith the 1977 Office of Management and Budget (OMB) standards. In 2007, multiple-race data were reported by California, Connecticut, Delaware, Districtof Columbia, Florida, Hawaii, Idaho, Kansas, Maine, Michigan, Minnesota, Montana, Nebraska, New Hampshire, New Jersey, New Mexico, New York, Ohio,Oklahoma, Oregon, Rhode Island, South Carolina, South Dakota, Texas, Utah, Washington, Wisconsin, and Wyoming. The multiple-race data for these areas werebridged to the single-race categories of the 1977 OMB standards for comparability with other areas; see http://www.cdc.gov/nchs and refer to "Detailedtechnical notes to the United States 2007 data—mortality." For explanation of asterisks preceding cause-of-death codes, see http://www.cdc.gov/nchs andrefer to "Detailed technical notes to the United States 2007 data - mortality"]_____________________________________________________________________________________________________________________________________________________________
Cause of death (Based on theInternational Classificationof Diseases, Tenth Revision, Second 40-44 45-49 50-54 55-59 60-64 65-69 70-74 75-79 80-84 85 yearsEdition, 2004), race, and sex years years years years years years years years years and over______________________________________________________________________________________________________________________________________________________________
Malnutrition (E40-E46)
All races 3/, both sexes............. 0.1 0.1 0.3 0.4 0.7 1.2 2.1 4.1 8.0 22.4 Male............................ * * 0.3 0.5 0.7 1.3 2.2 3.9 8.7 20.3 Female.......................... * * 0.3 0.4 0.8 1.2 2.0 4.2 7.6 23.3 White, both sexes................... * 0.1 0.3 0.4 0.7 1.1 1.8 3.8 7.6 21.4 Male............................ * * 0.2 0.4 0.6 1.1 1.8 3.6 8.2 19.3 Female.......................... * * 0.3 0.4 0.8 1.1 1.8 4.0 7.2 22.3 Black, both sexes................... * * * * * 2.6 5.2 7.3 13.5 34.7 Male............................ * * * * * * 6.3 9.3 16.9 33.1 Female.......................... * * * * * * 4.4 6.1 11.7 35.3
Other nutritional deficiencies (E50-E64)
All races 3/, both sexes................ * * * * * * * * 0.6 2.0 Male............................ * * * * * * * * * 1.8 Female.......................... * * * * * * * * 0.7 2.1 White, both sexes................... * * * * * * * * 0.6 2.0 Male............................ * * * * * * * * * 1.8 Female.......................... * * * * * * * * 0.7 2.0 Black, both sexes................... * * * * * * * * * * Male............................ * * * * * * * * * * Female.......................... * * * * * * * * * *

19JUL10 Plate 2 of 2 Page 26
Worktable 210R. Death rates for 113 selected causes, alcohol-induced causes, drug-induced causes, and injury by firearms, by 5-year agegroups, race, and sex: United States, 2007
[Rates per 100,000 population in specified group. Rates based on populations estimated as of July 1, 2007. Race categories are consistentwith the 1977 Office of Management and Budget (OMB) standards. In 2007, multiple-race data were reported by California, Connecticut, Delaware, Districtof Columbia, Florida, Hawaii, Idaho, Kansas, Maine, Michigan, Minnesota, Montana, Nebraska, New Hampshire, New Jersey, New Mexico, New York, Ohio,Oklahoma, Oregon, Rhode Island, South Carolina, South Dakota, Texas, Utah, Washington, Wisconsin, and Wyoming. The multiple-race data for these areas werebridged to the single-race categories of the 1977 OMB standards for comparability with other areas; see http://www.cdc.gov/nchs and refer to "Detailedtechnical notes to the United States 2007 data—mortality." For explanation of asterisks preceding cause-of-death codes, see http://www.cdc.gov/nchs andrefer to "Detailed technical notes to the United States 2007 data - mortality"]_____________________________________________________________________________________________________________________________________________________________
Cause of death (Based on theInternational Classificationof Diseases, Tenth Revision, Second 40-44 45-49 50-54 55-59 60-64 65-69 70-74 75-79 80-84 85 yearsEdition, 2004), race, and sex years years years years years years years years years and over______________________________________________________________________________________________________________________________________________________________
Meningitis (G00,G03)
All races 3/, both sexes............. 0.1 0.2 0.3 0.2 0.3 0.4 0.4 0.7 0.7 0.7 Male............................ * 0.3 0.3 0.3 0.3 0.4 0.5 0.7 * * Female.......................... * * 0.3 * 0.3 * * 0.7 0.6 0.7 White, both sexes................... 0.1 0.2 0.2 0.2 0.2 0.3 0.4 0.7 0.7 0.7 Male............................ * 0.3 0.3 0.3 * * * * * * Female.......................... * * * * * * * 0.7 * 0.7 Black, both sexes................... * * 0.8 * * * * * * * Male............................ * * * * * * * * * * Female.......................... * * * * * * * * * *
Parkinson's disease (G20-G21)
All races 3/, both sexes................ * * 0.2 0.7 1.9 6.5 18.7 50.5 99.4 143.5 Male............................ * * 0.3 0.8 2.6 9.4 26.7 74.8 152.8 228.0 Female.......................... * * * 0.5 1.3 3.9 12.2 32.6 65.7 103.3 White, both sexes................... * * 0.2 0.7 1.9 6.9 20.0 54.1 105.4 151.6 Male............................ * * 0.3 0.9 2.7 9.8 28.1 79.7 161.6 240.9 Female.......................... * * * 0.6 1.2 4.3 13.2 34.9 69.4 109.0 Black, both sexes................... * * * * 2.2 4.5 11.0 25.1 48.9 65.9 Male............................ * * * * * 8.2 17.8 38.1 77.6 99.4 Female.......................... * * * * * * 6.3 17.3 33.8 52.0
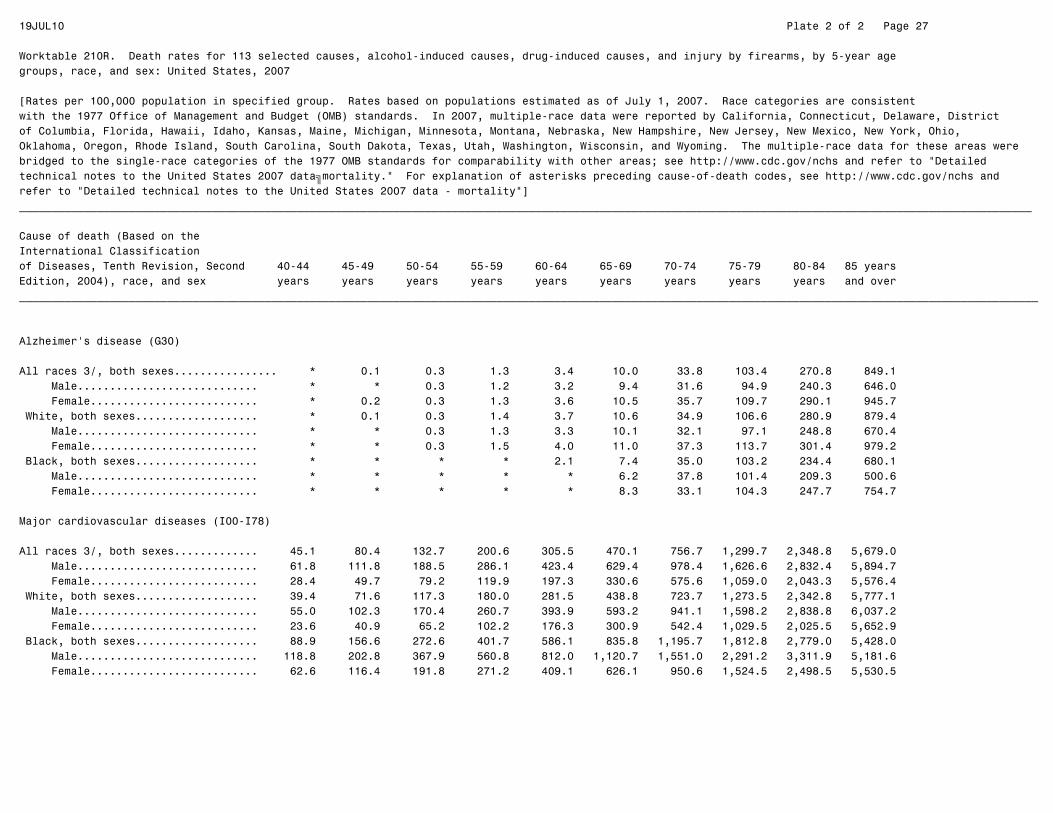
19JUL10 Plate 2 of 2 Page 27
Worktable 210R. Death rates for 113 selected causes, alcohol-induced causes, drug-induced causes, and injury by firearms, by 5-year agegroups, race, and sex: United States, 2007
[Rates per 100,000 population in specified group. Rates based on populations estimated as of July 1, 2007. Race categories are consistentwith the 1977 Office of Management and Budget (OMB) standards. In 2007, multiple-race data were reported by California, Connecticut, Delaware, Districtof Columbia, Florida, Hawaii, Idaho, Kansas, Maine, Michigan, Minnesota, Montana, Nebraska, New Hampshire, New Jersey, New Mexico, New York, Ohio,Oklahoma, Oregon, Rhode Island, South Carolina, South Dakota, Texas, Utah, Washington, Wisconsin, and Wyoming. The multiple-race data for these areas werebridged to the single-race categories of the 1977 OMB standards for comparability with other areas; see http://www.cdc.gov/nchs and refer to "Detailedtechnical notes to the United States 2007 data—mortality." For explanation of asterisks preceding cause-of-death codes, see http://www.cdc.gov/nchs andrefer to "Detailed technical notes to the United States 2007 data - mortality"]_____________________________________________________________________________________________________________________________________________________________
Cause of death (Based on theInternational Classificationof Diseases, Tenth Revision, Second 40-44 45-49 50-54 55-59 60-64 65-69 70-74 75-79 80-84 85 yearsEdition, 2004), race, and sex years years years years years years years years years and over______________________________________________________________________________________________________________________________________________________________
Alzheimer's disease (G30)
All races 3/, both sexes................ * 0.1 0.3 1.3 3.4 10.0 33.8 103.4 270.8 849.1 Male............................ * * 0.3 1.2 3.2 9.4 31.6 94.9 240.3 646.0 Female.......................... * 0.2 0.3 1.3 3.6 10.5 35.7 109.7 290.1 945.7 White, both sexes................... * 0.1 0.3 1.4 3.7 10.6 34.9 106.6 280.9 879.4 Male............................ * * 0.3 1.3 3.3 10.1 32.1 97.1 248.8 670.4 Female.......................... * * 0.3 1.5 4.0 11.0 37.3 113.7 301.4 979.2 Black, both sexes................... * * * * 2.1 7.4 35.0 103.2 234.4 680.1 Male............................ * * * * * 6.2 37.8 101.4 209.3 500.6 Female.......................... * * * * * 8.3 33.1 104.3 247.7 754.7
Major cardiovascular diseases (I00-I78)
All races 3/, both sexes............. 45.1 80.4 132.7 200.6 305.5 470.1 756.7 1,299.7 2,348.8 5,679.0 Male............................ 61.8 111.8 188.5 286.1 423.4 629.4 978.4 1,626.6 2,832.4 5,894.7 Female.......................... 28.4 49.7 79.2 119.9 197.3 330.6 575.6 1,059.0 2,043.3 5,576.4 White, both sexes................... 39.4 71.6 117.3 180.0 281.5 438.8 723.7 1,273.5 2,342.8 5,777.1 Male............................ 55.0 102.3 170.4 260.7 393.9 593.2 941.1 1,598.2 2,838.8 6,037.2 Female.......................... 23.6 40.9 65.2 102.2 176.3 300.9 542.4 1,029.5 2,025.5 5,652.9 Black, both sexes................... 88.9 156.6 272.6 401.7 586.1 835.8 1,195.7 1,812.8 2,779.0 5,428.0 Male............................ 118.8 202.8 367.9 560.8 812.0 1,120.7 1,551.0 2,291.2 3,311.9 5,181.6 Female.......................... 62.6 116.4 191.8 271.2 409.1 626.1 950.6 1,524.5 2,498.5 5,530.5

19JUL10 Plate 2 of 2 Page 28
Worktable 210R. Death rates for 113 selected causes, alcohol-induced causes, drug-induced causes, and injury by firearms, by 5-year agegroups, race, and sex: United States, 2007
[Rates per 100,000 population in specified group. Rates based on populations estimated as of July 1, 2007. Race categories are consistentwith the 1977 Office of Management and Budget (OMB) standards. In 2007, multiple-race data were reported by California, Connecticut, Delaware, Districtof Columbia, Florida, Hawaii, Idaho, Kansas, Maine, Michigan, Minnesota, Montana, Nebraska, New Hampshire, New Jersey, New Mexico, New York, Ohio,Oklahoma, Oregon, Rhode Island, South Carolina, South Dakota, Texas, Utah, Washington, Wisconsin, and Wyoming. The multiple-race data for these areas werebridged to the single-race categories of the 1977 OMB standards for comparability with other areas; see http://www.cdc.gov/nchs and refer to "Detailedtechnical notes to the United States 2007 data—mortality." For explanation of asterisks preceding cause-of-death codes, see http://www.cdc.gov/nchs andrefer to "Detailed technical notes to the United States 2007 data - mortality"]_____________________________________________________________________________________________________________________________________________________________
Cause of death (Based on theInternational Classificationof Diseases, Tenth Revision, Second 40-44 45-49 50-54 55-59 60-64 65-69 70-74 75-79 80-84 85 yearsEdition, 2004), race, and sex years years years years years years years years years and over______________________________________________________________________________________________________________________________________________________________
Diseases of heart (I00-I09,I11,I13,I20-I51)
All races 3/, both sexes............. 36.1 65.0 107.4 163.4 246.9 369.1 580.2 977.3 1,749.0 4,267.7 Male............................ 51.5 94.0 158.2 239.9 351.2 509.8 774.2 1,266.4 2,206.1 4,621.8 Female.......................... 20.9 36.7 58.6 91.2 151.1 246.0 421.7 764.4 1,460.4 4,099.3 White, both sexes................... 32.4 59.7 97.6 150.0 231.0 349.0 559.9 964.0 1,753.6 4,359.1 Male............................ 46.6 88.3 146.4 223.3 331.6 487.3 752.4 1,253.3 2,225.7 4,756.1 Female.......................... 18.0 31.1 49.6 79.4 136.8 225.5 399.4 746.5 1,451.7 4,169.6 Black, both sexes................... 66.5 116.9 204.4 306.4 448.6 625.4 888.1 1,319.5 2,009.8 3,937.8 Male............................ 93.1 157.0 285.8 436.2 634.8 852.1 1,170.6 1,703.3 2,450.5 3,879.6 Female.......................... 43.1 82.1 135.5 199.9 302.6 458.6 693.2 1,088.2 1,777.9 3,962.0
Acute rheumatic fever and chronic rheumatic heart diseases (I00-I09)
All races 3/, both sexes............. 0.2 0.4 0.5 0.8 1.3 2.0 3.6 6.0 10.8 17.9 Male............................ * 0.3 0.4 0.6 1.1 1.5 2.6 4.9 8.2 14.4 Female.......................... 0.3 0.4 0.5 0.9 1.5 2.5 4.4 6.9 12.4 19.6 White, both sexes................... 0.2 0.3 0.4 0.6 1.3 2.0 3.8 6.4 11.4 19.1 Male............................ * 0.2 0.4 0.5 1.1 1.5 2.7 5.1 8.4 15.4 Female.......................... 0.2 0.4 0.4 0.8 1.5 2.3 4.6 7.4 13.3 20.8 Black, both sexes................... * * 1.0 1.6 1.9 2.4 * 3.8 5.4 8.5 Male............................ * * * * * * * * * * Female.......................... * * * * * * * * * 9.5
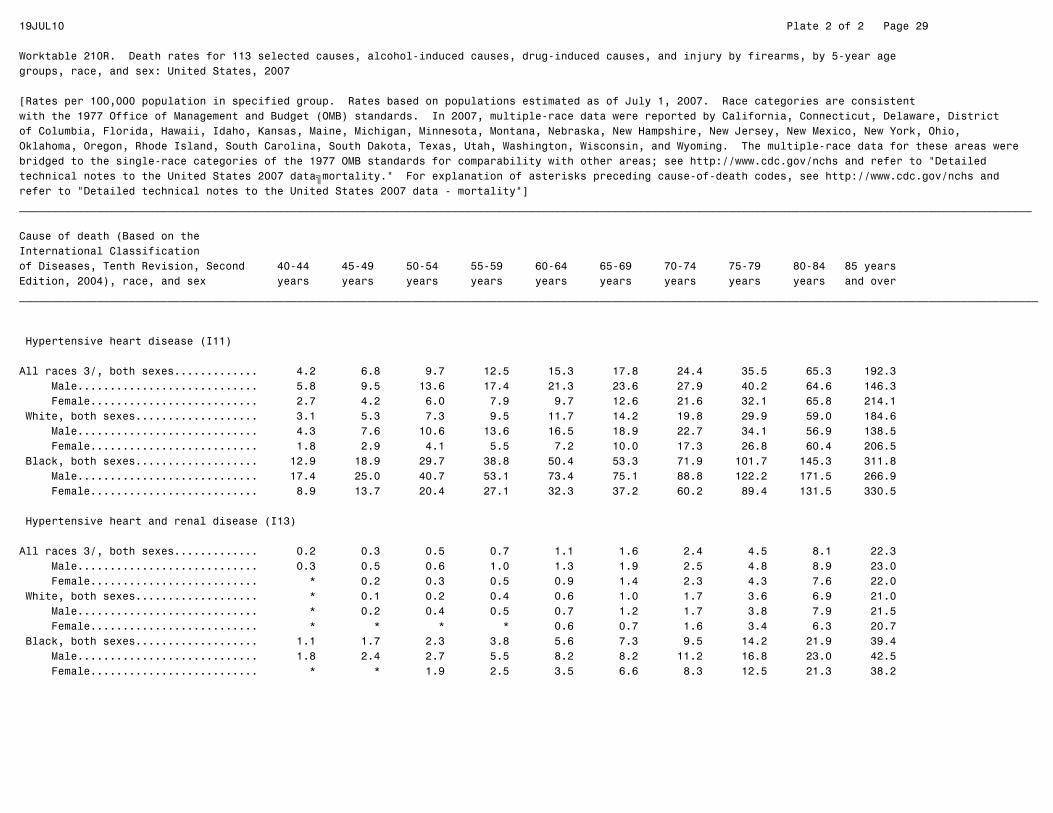
19JUL10 Plate 2 of 2 Page 29
Worktable 210R. Death rates for 113 selected causes, alcohol-induced causes, drug-induced causes, and injury by firearms, by 5-year agegroups, race, and sex: United States, 2007
[Rates per 100,000 population in specified group. Rates based on populations estimated as of July 1, 2007. Race categories are consistentwith the 1977 Office of Management and Budget (OMB) standards. In 2007, multiple-race data were reported by California, Connecticut, Delaware, Districtof Columbia, Florida, Hawaii, Idaho, Kansas, Maine, Michigan, Minnesota, Montana, Nebraska, New Hampshire, New Jersey, New Mexico, New York, Ohio,Oklahoma, Oregon, Rhode Island, South Carolina, South Dakota, Texas, Utah, Washington, Wisconsin, and Wyoming. The multiple-race data for these areas werebridged to the single-race categories of the 1977 OMB standards for comparability with other areas; see http://www.cdc.gov/nchs and refer to "Detailedtechnical notes to the United States 2007 data—mortality." For explanation of asterisks preceding cause-of-death codes, see http://www.cdc.gov/nchs andrefer to "Detailed technical notes to the United States 2007 data - mortality"]_____________________________________________________________________________________________________________________________________________________________
Cause of death (Based on theInternational Classificationof Diseases, Tenth Revision, Second 40-44 45-49 50-54 55-59 60-64 65-69 70-74 75-79 80-84 85 yearsEdition, 2004), race, and sex years years years years years years years years years and over______________________________________________________________________________________________________________________________________________________________
Hypertensive heart disease (I11)
All races 3/, both sexes............. 4.2 6.8 9.7 12.5 15.3 17.8 24.4 35.5 65.3 192.3 Male............................ 5.8 9.5 13.6 17.4 21.3 23.6 27.9 40.2 64.6 146.3 Female.......................... 2.7 4.2 6.0 7.9 9.7 12.6 21.6 32.1 65.8 214.1 White, both sexes................... 3.1 5.3 7.3 9.5 11.7 14.2 19.8 29.9 59.0 184.6 Male............................ 4.3 7.6 10.6 13.6 16.5 18.9 22.7 34.1 56.9 138.5 Female.......................... 1.8 2.9 4.1 5.5 7.2 10.0 17.3 26.8 60.4 206.5 Black, both sexes................... 12.9 18.9 29.7 38.8 50.4 53.3 71.9 101.7 145.3 311.8 Male............................ 17.4 25.0 40.7 53.1 73.4 75.1 88.8 122.2 171.5 266.9 Female.......................... 8.9 13.7 20.4 27.1 32.3 37.2 60.2 89.4 131.5 330.5
Hypertensive heart and renal disease (I13)
All races 3/, both sexes............. 0.2 0.3 0.5 0.7 1.1 1.6 2.4 4.5 8.1 22.3 Male............................ 0.3 0.5 0.6 1.0 1.3 1.9 2.5 4.8 8.9 23.0 Female.......................... * 0.2 0.3 0.5 0.9 1.4 2.3 4.3 7.6 22.0 White, both sexes................... * 0.1 0.2 0.4 0.6 1.0 1.7 3.6 6.9 21.0 Male............................ * 0.2 0.4 0.5 0.7 1.2 1.7 3.8 7.9 21.5 Female.......................... * * * * 0.6 0.7 1.6 3.4 6.3 20.7 Black, both sexes................... 1.1 1.7 2.3 3.8 5.6 7.3 9.5 14.2 21.9 39.4 Male............................ 1.8 2.4 2.7 5.5 8.2 8.2 11.2 16.8 23.0 42.5 Female.......................... * * 1.9 2.5 3.5 6.6 8.3 12.5 21.3 38.2

19JUL10 Plate 2 of 2 Page 30
Worktable 210R. Death rates for 113 selected causes, alcohol-induced causes, drug-induced causes, and injury by firearms, by 5-year agegroups, race, and sex: United States, 2007
[Rates per 100,000 population in specified group. Rates based on populations estimated as of July 1, 2007. Race categories are consistentwith the 1977 Office of Management and Budget (OMB) standards. In 2007, multiple-race data were reported by California, Connecticut, Delaware, Districtof Columbia, Florida, Hawaii, Idaho, Kansas, Maine, Michigan, Minnesota, Montana, Nebraska, New Hampshire, New Jersey, New Mexico, New York, Ohio,Oklahoma, Oregon, Rhode Island, South Carolina, South Dakota, Texas, Utah, Washington, Wisconsin, and Wyoming. The multiple-race data for these areas werebridged to the single-race categories of the 1977 OMB standards for comparability with other areas; see http://www.cdc.gov/nchs and refer to "Detailedtechnical notes to the United States 2007 data—mortality." For explanation of asterisks preceding cause-of-death codes, see http://www.cdc.gov/nchs andrefer to "Detailed technical notes to the United States 2007 data - mortality"]_____________________________________________________________________________________________________________________________________________________________
Cause of death (Based on theInternational Classificationof Diseases, Tenth Revision, Second 40-44 45-49 50-54 55-59 60-64 65-69 70-74 75-79 80-84 85 yearsEdition, 2004), race, and sex years years years years years years years years years and over______________________________________________________________________________________________________________________________________________________________
Ischemic heart diseases (I20-I25)
All races 3/, both sexes............. 20.2 40.6 71.9 113.7 175.7 261.3 406.2 675.1 1,170.4 2,705.3 Male............................ 30.9 62.4 111.5 174.6 260.3 376.2 566.1 914.1 1,554.7 3,089.2 Female.......................... 9.4 19.3 33.9 56.3 98.1 160.7 275.5 499.1 927.8 2,522.7 White, both sexes................... 19.5 39.4 68.4 108.2 168.7 251.9 396.7 670.1 1,177.7 2,762.1 Male............................ 30.2 61.5 107.3 167.9 252.1 366.6 557.2 910.5 1,578.6 3,183.0 Female.......................... 8.7 17.3 30.1 50.7 90.5 149.5 262.8 489.4 921.3 2,561.2 Black, both sexes................... 27.5 58.2 114.3 182.7 280.2 396.2 571.0 854.9 1,284.2 2,466.1 Male............................ 40.7 83.2 167.7 269.5 406.7 554.2 773.9 1,146.5 1,587.8 2,497.7 Female.......................... 16.0 36.5 69.1 111.4 181.2 280.0 431.1 679.1 1,124.4 2,452.9
Acute myocardial infarction (I21-I22)
All races 3/, both sexes............. 7.8 15.8 27.9 44.3 67.4 99.6 148.0 228.2 367.1 756.7 Male............................ 11.6 24.1 42.8 66.9 98.5 140.2 201.3 298.7 472.4 855.8 Female.......................... 4.0 7.6 13.6 23.1 38.8 64.1 104.4 176.2 300.6 709.5 White, both sexes................... 7.7 15.8 27.3 43.6 66.3 97.9 146.2 227.5 367.8 766.9 Male............................ 11.5 24.5 42.5 66.6 98.0 139.7 199.6 298.7 478.2 876.2 Female.......................... 3.8 7.1 12.3 21.4 36.6 60.6 101.6 174.1 297.1 714.8 Black, both sexes................... 10.2 19.9 39.1 62.8 94.6 137.1 195.9 278.5 420.0 750.5 Male............................ 14.6 27.7 54.8 88.1 130.4 180.0 262.0 357.2 490.1 753.8 Female.......................... 6.4 13.0 25.7 42.0 66.4 105.5 150.3 231.1 383.1 749.1
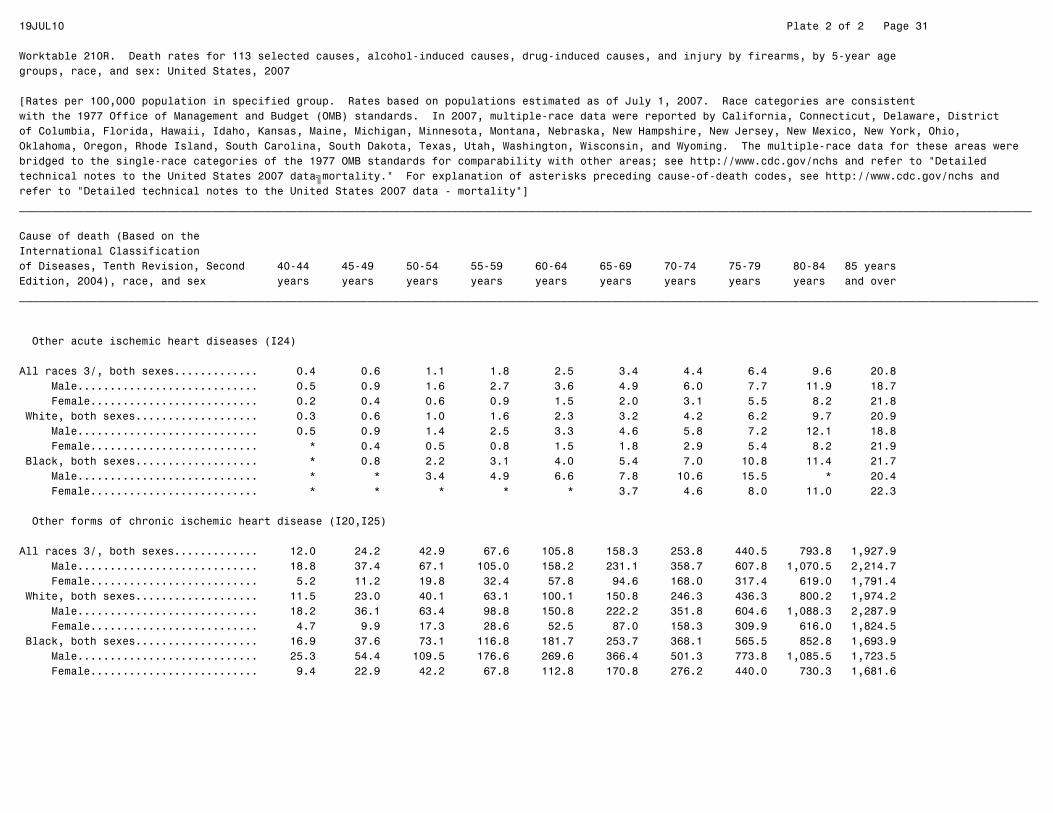
19JUL10 Plate 2 of 2 Page 31
Worktable 210R. Death rates for 113 selected causes, alcohol-induced causes, drug-induced causes, and injury by firearms, by 5-year agegroups, race, and sex: United States, 2007
[Rates per 100,000 population in specified group. Rates based on populations estimated as of July 1, 2007. Race categories are consistentwith the 1977 Office of Management and Budget (OMB) standards. In 2007, multiple-race data were reported by California, Connecticut, Delaware, Districtof Columbia, Florida, Hawaii, Idaho, Kansas, Maine, Michigan, Minnesota, Montana, Nebraska, New Hampshire, New Jersey, New Mexico, New York, Ohio,Oklahoma, Oregon, Rhode Island, South Carolina, South Dakota, Texas, Utah, Washington, Wisconsin, and Wyoming. The multiple-race data for these areas werebridged to the single-race categories of the 1977 OMB standards for comparability with other areas; see http://www.cdc.gov/nchs and refer to "Detailedtechnical notes to the United States 2007 data—mortality." For explanation of asterisks preceding cause-of-death codes, see http://www.cdc.gov/nchs andrefer to "Detailed technical notes to the United States 2007 data - mortality"]_____________________________________________________________________________________________________________________________________________________________
Cause of death (Based on theInternational Classificationof Diseases, Tenth Revision, Second 40-44 45-49 50-54 55-59 60-64 65-69 70-74 75-79 80-84 85 yearsEdition, 2004), race, and sex years years years years years years years years years and over______________________________________________________________________________________________________________________________________________________________
Other acute ischemic heart diseases (I24)
All races 3/, both sexes............. 0.4 0.6 1.1 1.8 2.5 3.4 4.4 6.4 9.6 20.8 Male............................ 0.5 0.9 1.6 2.7 3.6 4.9 6.0 7.7 11.9 18.7 Female.......................... 0.2 0.4 0.6 0.9 1.5 2.0 3.1 5.5 8.2 21.8 White, both sexes................... 0.3 0.6 1.0 1.6 2.3 3.2 4.2 6.2 9.7 20.9 Male............................ 0.5 0.9 1.4 2.5 3.3 4.6 5.8 7.2 12.1 18.8 Female.......................... * 0.4 0.5 0.8 1.5 1.8 2.9 5.4 8.2 21.9 Black, both sexes................... * 0.8 2.2 3.1 4.0 5.4 7.0 10.8 11.4 21.7 Male............................ * * 3.4 4.9 6.6 7.8 10.6 15.5 * 20.4 Female.......................... * * * * * 3.7 4.6 8.0 11.0 22.3
Other forms of chronic ischemic heart disease (I20,I25)
All races 3/, both sexes............. 12.0 24.2 42.9 67.6 105.8 158.3 253.8 440.5 793.8 1,927.9 Male............................ 18.8 37.4 67.1 105.0 158.2 231.1 358.7 607.8 1,070.5 2,214.7 Female.......................... 5.2 11.2 19.8 32.4 57.8 94.6 168.0 317.4 619.0 1,791.4 White, both sexes................... 11.5 23.0 40.1 63.1 100.1 150.8 246.3 436.3 800.2 1,974.2 Male............................ 18.2 36.1 63.4 98.8 150.8 222.2 351.8 604.6 1,088.3 2,287.9 Female.......................... 4.7 9.9 17.3 28.6 52.5 87.0 158.3 309.9 616.0 1,824.5 Black, both sexes................... 16.9 37.6 73.1 116.8 181.7 253.7 368.1 565.5 852.8 1,693.9 Male............................ 25.3 54.4 109.5 176.6 269.6 366.4 501.3 773.8 1,085.5 1,723.5 Female.......................... 9.4 22.9 42.2 67.8 112.8 170.8 276.2 440.0 730.3 1,681.6
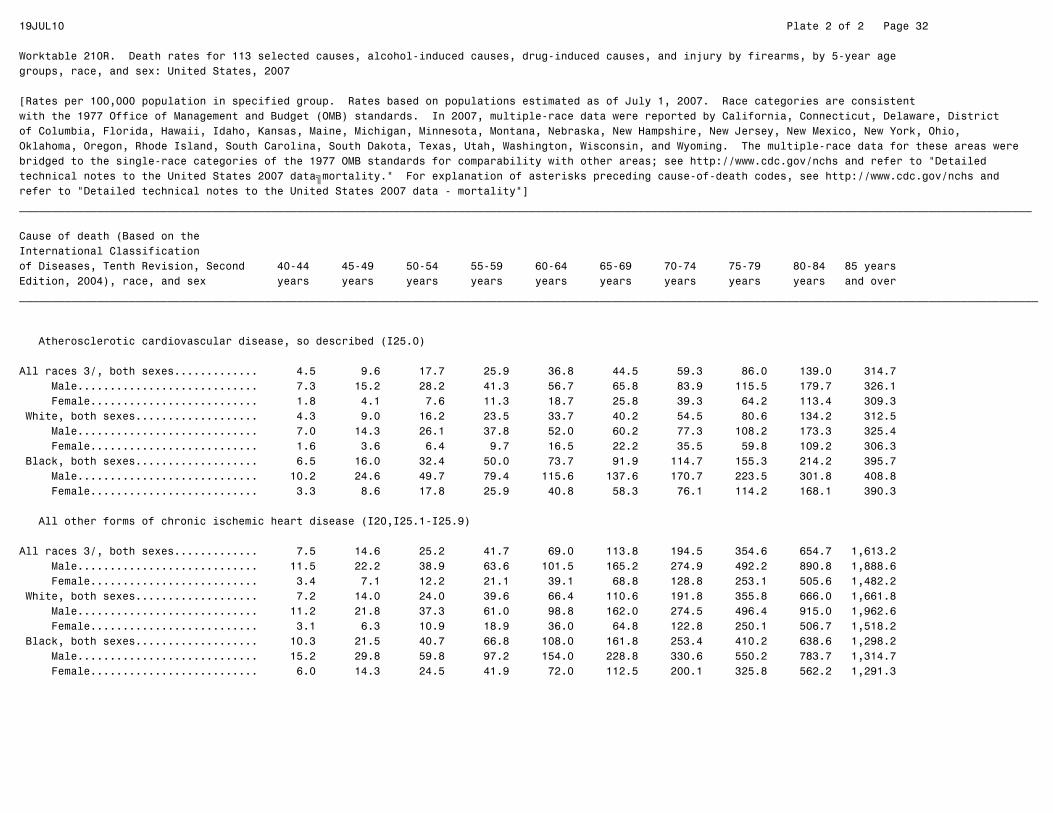
19JUL10 Plate 2 of 2 Page 32
Worktable 210R. Death rates for 113 selected causes, alcohol-induced causes, drug-induced causes, and injury by firearms, by 5-year agegroups, race, and sex: United States, 2007
[Rates per 100,000 population in specified group. Rates based on populations estimated as of July 1, 2007. Race categories are consistentwith the 1977 Office of Management and Budget (OMB) standards. In 2007, multiple-race data were reported by California, Connecticut, Delaware, Districtof Columbia, Florida, Hawaii, Idaho, Kansas, Maine, Michigan, Minnesota, Montana, Nebraska, New Hampshire, New Jersey, New Mexico, New York, Ohio,Oklahoma, Oregon, Rhode Island, South Carolina, South Dakota, Texas, Utah, Washington, Wisconsin, and Wyoming. The multiple-race data for these areas werebridged to the single-race categories of the 1977 OMB standards for comparability with other areas; see http://www.cdc.gov/nchs and refer to "Detailedtechnical notes to the United States 2007 data—mortality." For explanation of asterisks preceding cause-of-death codes, see http://www.cdc.gov/nchs andrefer to "Detailed technical notes to the United States 2007 data - mortality"]_____________________________________________________________________________________________________________________________________________________________
Cause of death (Based on theInternational Classificationof Diseases, Tenth Revision, Second 40-44 45-49 50-54 55-59 60-64 65-69 70-74 75-79 80-84 85 yearsEdition, 2004), race, and sex years years years years years years years years years and over______________________________________________________________________________________________________________________________________________________________
Atherosclerotic cardiovascular disease, so described (I25.0)
All races 3/, both sexes............. 4.5 9.6 17.7 25.9 36.8 44.5 59.3 86.0 139.0 314.7 Male............................ 7.3 15.2 28.2 41.3 56.7 65.8 83.9 115.5 179.7 326.1 Female.......................... 1.8 4.1 7.6 11.3 18.7 25.8 39.3 64.2 113.4 309.3 White, both sexes................... 4.3 9.0 16.2 23.5 33.7 40.2 54.5 80.6 134.2 312.5 Male............................ 7.0 14.3 26.1 37.8 52.0 60.2 77.3 108.2 173.3 325.4 Female.......................... 1.6 3.6 6.4 9.7 16.5 22.2 35.5 59.8 109.2 306.3 Black, both sexes................... 6.5 16.0 32.4 50.0 73.7 91.9 114.7 155.3 214.2 395.7 Male............................ 10.2 24.6 49.7 79.4 115.6 137.6 170.7 223.5 301.8 408.8 Female.......................... 3.3 8.6 17.8 25.9 40.8 58.3 76.1 114.2 168.1 390.3
All other forms of chronic ischemic heart disease (I20,I25.1-I25.9)
All races 3/, both sexes............. 7.5 14.6 25.2 41.7 69.0 113.8 194.5 354.6 654.7 1,613.2 Male............................ 11.5 22.2 38.9 63.6 101.5 165.2 274.9 492.2 890.8 1,888.6 Female.......................... 3.4 7.1 12.2 21.1 39.1 68.8 128.8 253.1 505.6 1,482.2 White, both sexes................... 7.2 14.0 24.0 39.6 66.4 110.6 191.8 355.8 666.0 1,661.8 Male............................ 11.2 21.8 37.3 61.0 98.8 162.0 274.5 496.4 915.0 1,962.6 Female.......................... 3.1 6.3 10.9 18.9 36.0 64.8 122.8 250.1 506.7 1,518.2 Black, both sexes................... 10.3 21.5 40.7 66.8 108.0 161.8 253.4 410.2 638.6 1,298.2 Male............................ 15.2 29.8 59.8 97.2 154.0 228.8 330.6 550.2 783.7 1,314.7 Female.......................... 6.0 14.3 24.5 41.9 72.0 112.5 200.1 325.8 562.2 1,291.3

19JUL10 Plate 2 of 2 Page 33
Worktable 210R. Death rates for 113 selected causes, alcohol-induced causes, drug-induced causes, and injury by firearms, by 5-year agegroups, race, and sex: United States, 2007
[Rates per 100,000 population in specified group. Rates based on populations estimated as of July 1, 2007. Race categories are consistentwith the 1977 Office of Management and Budget (OMB) standards. In 2007, multiple-race data were reported by California, Connecticut, Delaware, Districtof Columbia, Florida, Hawaii, Idaho, Kansas, Maine, Michigan, Minnesota, Montana, Nebraska, New Hampshire, New Jersey, New Mexico, New York, Ohio,Oklahoma, Oregon, Rhode Island, South Carolina, South Dakota, Texas, Utah, Washington, Wisconsin, and Wyoming. The multiple-race data for these areas werebridged to the single-race categories of the 1977 OMB standards for comparability with other areas; see http://www.cdc.gov/nchs and refer to "Detailedtechnical notes to the United States 2007 data—mortality." For explanation of asterisks preceding cause-of-death codes, see http://www.cdc.gov/nchs andrefer to "Detailed technical notes to the United States 2007 data - mortality"]_____________________________________________________________________________________________________________________________________________________________
Cause of death (Based on theInternational Classificationof Diseases, Tenth Revision, Second 40-44 45-49 50-54 55-59 60-64 65-69 70-74 75-79 80-84 85 yearsEdition, 2004), race, and sex years years years years years years years years years and over______________________________________________________________________________________________________________________________________________________________
Other heart diseases (I26-I51)
All races 3/, both sexes............. 11.3 16.9 24.8 35.7 53.5 86.5 143.6 256.2 494.3 1,329.8 Male............................ 14.3 21.4 32.1 46.4 67.2 106.6 175.1 302.4 569.6 1,348.9 Female.......................... 8.3 12.6 17.9 25.6 40.9 68.9 117.8 222.1 446.8 1,320.8 White, both sexes................... 9.6 14.5 21.3 31.3 48.7 79.9 138.0 254.0 498.5 1,372.4 Male............................ 11.9 18.7 27.7 40.7 61.3 98.9 168.1 299.9 573.8 1,397.6 Female.......................... 7.2 10.4 14.9 22.2 36.9 63.0 113.0 219.6 450.4 1,360.4 Black, both sexes................... 24.7 37.4 57.2 79.5 110.5 166.2 233.4 344.9 553.2 1,112.0 Male............................ 33.1 45.7 74.1 106.7 144.6 213.2 295.2 413.4 662.2 1,066.6 Female.......................... 17.2 30.1 42.8 57.3 83.7 131.6 190.8 303.7 495.7 1,130.8
Acute and subacute endocarditis (I33)
All races 3/, both sexes............. 0.3 0.4 0.6 0.6 0.7 1.1 1.4 2.1 2.8 2.4 Male............................ 0.4 0.4 0.8 0.8 0.9 1.3 1.7 2.9 3.8 3.4 Female.......................... * 0.3 0.4 0.4 0.5 0.9 1.2 1.5 2.1 2.0 White, both sexes................... 0.2 0.3 0.5 0.5 0.6 1.0 1.2 2.0 2.9 2.4 Male............................ 0.4 0.3 0.6 0.6 0.9 1.0 1.5 2.8 3.9 3.4 Female.......................... * 0.3 0.3 0.4 0.4 0.9 1.0 1.4 2.3 1.9 Black, both sexes................... * 0.9 1.3 1.5 1.5 2.6 2.8 * * * Male............................ * * 2.0 2.5 * * * * * * Female.......................... * * * * * * * * * *

19JUL10 Plate 2 of 2 Page 34
Worktable 210R. Death rates for 113 selected causes, alcohol-induced causes, drug-induced causes, and injury by firearms, by 5-year agegroups, race, and sex: United States, 2007
[Rates per 100,000 population in specified group. Rates based on populations estimated as of July 1, 2007. Race categories are consistentwith the 1977 Office of Management and Budget (OMB) standards. In 2007, multiple-race data were reported by California, Connecticut, Delaware, Districtof Columbia, Florida, Hawaii, Idaho, Kansas, Maine, Michigan, Minnesota, Montana, Nebraska, New Hampshire, New Jersey, New Mexico, New York, Ohio,Oklahoma, Oregon, Rhode Island, South Carolina, South Dakota, Texas, Utah, Washington, Wisconsin, and Wyoming. The multiple-race data for these areas werebridged to the single-race categories of the 1977 OMB standards for comparability with other areas; see http://www.cdc.gov/nchs and refer to "Detailedtechnical notes to the United States 2007 data—mortality." For explanation of asterisks preceding cause-of-death codes, see http://www.cdc.gov/nchs andrefer to "Detailed technical notes to the United States 2007 data - mortality"]_____________________________________________________________________________________________________________________________________________________________
Cause of death (Based on theInternational Classificationof Diseases, Tenth Revision, Second 40-44 45-49 50-54 55-59 60-64 65-69 70-74 75-79 80-84 85 yearsEdition, 2004), race, and sex years years years years years years years years years and over______________________________________________________________________________________________________________________________________________________________
Diseases of pericardium and acute myocarditis (I30-I31,I40)
All races 3/, both sexes............. 0.2 0.3 0.3 0.4 0.4 0.6 0.7 1.0 1.1 2.1 Male............................ 0.2 0.3 0.3 0.4 0.5 0.7 0.9 1.3 * 2.3 Female.......................... * 0.2 0.3 0.3 0.3 0.5 0.5 0.8 1.3 2.0 White, both sexes................... 0.2 0.2 0.2 0.3 0.3 0.5 0.7 1.0 1.2 2.1 Male............................ 0.2 0.2 0.2 0.4 0.4 0.6 0.9 1.3 * 2.3 Female.......................... * 0.2 0.3 0.3 * 0.5 * 0.8 1.4 2.0 Black, both sexes................... * * * * * * * * * * Male............................ * * * * * * * * * * Female.......................... * * * * * * * * * *
Heart failure (I50)
All races 3/, both sexes............. 1.0 1.7 3.3 6.2 11.2 21.3 40.2 81.7 174.6 554.4 Male............................ 1.3 2.2 4.0 8.1 13.4 26.1 48.8 94.2 197.7 552.8 Female.......................... 0.6 1.2 2.6 4.5 9.2 17.1 33.2 72.5 160.0 555.1 White, both sexes................... 0.7 1.3 2.5 5.1 10.0 19.8 39.3 81.5 177.4 574.5 Male............................ 0.9 1.7 3.2 6.6 11.9 24.6 47.9 93.6 201.5 575.8 Female.......................... 0.5 0.9 1.9 3.7 8.2 15.4 32.2 72.3 162.0 573.8 Black, both sexes................... 3.2 5.0 9.6 16.7 25.1 40.3 62.3 110.7 188.1 460.4 Male............................ 4.7 6.8 11.5 23.0 32.3 48.1 77.7 132.4 210.6 433.4 Female.......................... 1.8 3.4 8.0 11.6 19.4 34.5 51.7 97.7 176.3 471.6

19JUL10 Plate 2 of 2 Page 35
Worktable 210R. Death rates for 113 selected causes, alcohol-induced causes, drug-induced causes, and injury by firearms, by 5-year agegroups, race, and sex: United States, 2007
[Rates per 100,000 population in specified group. Rates based on populations estimated as of July 1, 2007. Race categories are consistentwith the 1977 Office of Management and Budget (OMB) standards. In 2007, multiple-race data were reported by California, Connecticut, Delaware, Districtof Columbia, Florida, Hawaii, Idaho, Kansas, Maine, Michigan, Minnesota, Montana, Nebraska, New Hampshire, New Jersey, New Mexico, New York, Ohio,Oklahoma, Oregon, Rhode Island, South Carolina, South Dakota, Texas, Utah, Washington, Wisconsin, and Wyoming. The multiple-race data for these areas werebridged to the single-race categories of the 1977 OMB standards for comparability with other areas; see http://www.cdc.gov/nchs and refer to "Detailedtechnical notes to the United States 2007 data—mortality." For explanation of asterisks preceding cause-of-death codes, see http://www.cdc.gov/nchs andrefer to "Detailed technical notes to the United States 2007 data - mortality"]_____________________________________________________________________________________________________________________________________________________________
Cause of death (Based on theInternational Classificationof Diseases, Tenth Revision, Second 40-44 45-49 50-54 55-59 60-64 65-69 70-74 75-79 80-84 85 yearsEdition, 2004), race, and sex years years years years years years years years years and over______________________________________________________________________________________________________________________________________________________________
All other forms of heart disease (I26-I28,I34-I38,I42-I49,I51)
All races 3/, both sexes............. 9.9 14.6 20.7 28.5 41.2 63.5 101.3 171.4 315.8 770.9 Male............................ 12.3 18.5 27.1 37.1 52.4 78.5 123.7 204.1 367.3 790.5 Female.......................... 7.4 10.9 14.6 20.3 30.9 50.3 83.0 147.3 283.3 761.7 White, both sexes................... 8.5 12.7 18.0 25.3 37.7 58.7 96.8 169.6 317.0 793.5 Male............................ 10.5 16.5 23.8 33.1 48.0 72.7 117.7 202.3 367.5 816.1 Female.......................... 6.5 9.0 12.4 17.8 28.0 46.2 79.3 145.0 284.7 782.7 Black, both sexes................... 20.8 31.0 45.7 60.7 82.9 122.1 167.6 230.1 363.4 646.4 Male............................ 27.4 37.0 60.1 80.7 108.8 159.6 213.6 275.8 448.2 627.2 Female.......................... 14.9 25.9 33.5 44.4 62.5 94.5 135.9 202.5 318.8 654.3
Essential hypertension and hypertensive renal disease (I10,I12,I15)
All races 3/, both sexes............. 1.1 1.9 3.8 5.2 8.1 12.8 20.4 35.1 67.9 191.1 Male............................ 1.6 2.4 4.8 6.5 10.0 14.6 22.4 38.4 66.8 157.9 Female.......................... 0.7 1.4 2.9 4.0 6.3 11.2 18.8 32.7 68.6 207.0 White, both sexes................... 0.8 1.2 2.6 3.7 6.1 10.1 17.1 30.5 62.1 183.0 Male............................ 1.1 1.6 3.3 5.0 7.5 11.6 18.7 33.6 61.1 150.4 Female.......................... 0.4 0.8 1.9 2.4 4.7 8.7 15.7 28.2 62.7 198.6 Black, both sexes................... 3.8 7.1 13.6 18.3 28.1 38.6 53.3 87.2 132.9 297.6 Male............................ 5.1 8.7 17.0 21.1 35.8 47.2 61.9 101.8 139.1 245.6 Female.......................... 2.7 5.7 10.7 16.0 22.1 32.3 47.3 78.5 129.7 319.2

19JUL10 Plate 2 of 2 Page 36
Worktable 210R. Death rates for 113 selected causes, alcohol-induced causes, drug-induced causes, and injury by firearms, by 5-year agegroups, race, and sex: United States, 2007
[Rates per 100,000 population in specified group. Rates based on populations estimated as of July 1, 2007. Race categories are consistentwith the 1977 Office of Management and Budget (OMB) standards. In 2007, multiple-race data were reported by California, Connecticut, Delaware, Districtof Columbia, Florida, Hawaii, Idaho, Kansas, Maine, Michigan, Minnesota, Montana, Nebraska, New Hampshire, New Jersey, New Mexico, New York, Ohio,Oklahoma, Oregon, Rhode Island, South Carolina, South Dakota, Texas, Utah, Washington, Wisconsin, and Wyoming. The multiple-race data for these areas werebridged to the single-race categories of the 1977 OMB standards for comparability with other areas; see http://www.cdc.gov/nchs and refer to "Detailedtechnical notes to the United States 2007 data—mortality." For explanation of asterisks preceding cause-of-death codes, see http://www.cdc.gov/nchs andrefer to "Detailed technical notes to the United States 2007 data - mortality"]_____________________________________________________________________________________________________________________________________________________________
Cause of death (Based on theInternational Classificationof Diseases, Tenth Revision, Second 40-44 45-49 50-54 55-59 60-64 65-69 70-74 75-79 80-84 85 yearsEdition, 2004), race, and sex years years years years years years years years years and over______________________________________________________________________________________________________________________________________________________________
Cerebrovascular diseases (I60-I69)
All races 3/, both sexes............. 6.4 11.4 17.9 26.0 39.8 69.4 122.6 231.7 438.8 1,015.5 Male............................ 6.8 12.5 20.4 31.2 46.7 79.3 138.9 253.2 445.8 895.7 Female.......................... 6.0 10.4 15.6 21.2 33.4 60.7 109.3 215.9 434.4 1,072.4 White, both sexes................... 5.0 9.0 14.1 20.9 34.2 61.4 113.0 223.0 433.2 1,026.1 Male............................ 5.5 9.9 16.3 24.7 39.8 69.2 126.6 242.0 436.3 905.0 Female.......................... 4.5 8.1 12.0 17.2 29.0 54.5 101.6 208.7 431.3 1,083.8 Black, both sexes................... 15.3 28.0 46.7 65.6 93.1 145.8 216.5 344.3 539.4 996.6 Male............................ 15.5 30.6 53.3 86.8 118.9 186.6 271.7 407.7 620.4 866.9 Female.......................... 15.1 25.7 41.2 48.2 72.9 115.8 178.5 306.1 496.8 1,050.6
Atherosclerosis (I70)
All races 3/, both sexes................ * 0.2 0.4 0.8 1.4 2.8 6.1 12.2 24.6 83.3 Male............................ * 0.3 0.6 1.1 2.0 3.7 7.4 13.7 27.2 76.5 Female.......................... * * 0.3 0.6 0.7 2.0 5.1 11.1 23.0 86.5 White, both sexes................... * 0.1 0.4 0.8 1.3 2.8 6.0 12.4 25.2 86.0 Male............................ * 0.2 0.6 1.1 1.8 3.7 7.3 14.1 28.1 79.2 Female.......................... * * 0.3 0.6 0.8 2.1 5.0 11.1 23.3 89.2 Black, both sexes................... * * * 1.1 2.4 3.2 8.3 13.0 23.0 69.9 Male............................ * * * * 4.5 4.6 10.3 13.3 22.3 62.9 Female.......................... * * * * * * 6.9 12.8 23.5 72.8

19JUL10 Plate 2 of 2 Page 37
Worktable 210R. Death rates for 113 selected causes, alcohol-induced causes, drug-induced causes, and injury by firearms, by 5-year agegroups, race, and sex: United States, 2007
[Rates per 100,000 population in specified group. Rates based on populations estimated as of July 1, 2007. Race categories are consistentwith the 1977 Office of Management and Budget (OMB) standards. In 2007, multiple-race data were reported by California, Connecticut, Delaware, Districtof Columbia, Florida, Hawaii, Idaho, Kansas, Maine, Michigan, Minnesota, Montana, Nebraska, New Hampshire, New Jersey, New Mexico, New York, Ohio,Oklahoma, Oregon, Rhode Island, South Carolina, South Dakota, Texas, Utah, Washington, Wisconsin, and Wyoming. The multiple-race data for these areas werebridged to the single-race categories of the 1977 OMB standards for comparability with other areas; see http://www.cdc.gov/nchs and refer to "Detailedtechnical notes to the United States 2007 data—mortality." For explanation of asterisks preceding cause-of-death codes, see http://www.cdc.gov/nchs andrefer to "Detailed technical notes to the United States 2007 data - mortality"]_____________________________________________________________________________________________________________________________________________________________
Cause of death (Based on theInternational Classificationof Diseases, Tenth Revision, Second 40-44 45-49 50-54 55-59 60-64 65-69 70-74 75-79 80-84 85 yearsEdition, 2004), race, and sex years years years years years years years years years and over______________________________________________________________________________________________________________________________________________________________
Other diseases of circulatory system (I71-I78)
All races 3/, both sexes............. 1.4 1.9 3.2 5.1 9.4 16.0 27.3 43.3 68.5 121.4 Male............................ 2.0 2.7 4.5 7.4 13.4 22.0 35.4 54.8 86.6 142.8 Female.......................... 0.8 1.1 1.9 3.0 5.7 10.7 20.7 34.8 57.0 111.3 White, both sexes................... 1.1 1.6 2.6 4.6 9.0 15.5 27.7 43.6 68.7 122.9 Male............................ 1.6 2.3 3.8 6.7 13.1 21.5 36.1 55.1 87.6 146.5 Female.......................... 0.7 0.9 1.5 2.6 5.2 10.1 20.7 35.0 56.6 111.7 Black, both sexes................... 3.1 4.1 7.2 10.4 14.0 22.7 29.6 48.8 73.8 126.1 Male............................ 4.8 5.8 10.9 15.0 18.1 30.2 36.6 65.1 79.7 126.6 Female.......................... 1.7 2.7 4.1 6.6 10.7 17.2 24.8 39.0 70.7 125.8
Aortic aneurysm and dissection (I71)
All races 3/, both sexes............. 1.0 1.3 2.1 3.3 6.0 10.2 17.7 27.2 41.3 59.5 Male............................ 1.5 2.0 3.3 5.1 9.2 15.0 24.5 36.0 55.4 81.8 Female.......................... 0.5 0.7 1.0 1.7 3.1 6.0 12.2 20.7 32.4 48.9 White, both sexes................... 0.8 1.1 1.8 3.0 5.9 10.0 18.5 28.1 42.4 61.6 Male............................ 1.2 1.7 2.8 4.7 9.3 15.0 25.6 37.0 57.4 85.8 Female.......................... 0.4 0.5 0.8 1.4 2.7 5.6 12.6 21.4 32.8 50.1 Black, both sexes................... 2.5 3.1 4.9 6.3 7.7 12.4 13.6 23.1 30.7 40.4 Male............................ 4.0 4.6 7.9 9.8 10.1 16.3 17.5 32.8 29.7 41.6 Female.......................... * 1.8 2.4 3.5 5.8 9.6 10.8 17.3 31.3 39.9

19JUL10 Plate 2 of 2 Page 38
Worktable 210R. Death rates for 113 selected causes, alcohol-induced causes, drug-induced causes, and injury by firearms, by 5-year agegroups, race, and sex: United States, 2007
[Rates per 100,000 population in specified group. Rates based on populations estimated as of July 1, 2007. Race categories are consistentwith the 1977 Office of Management and Budget (OMB) standards. In 2007, multiple-race data were reported by California, Connecticut, Delaware, Districtof Columbia, Florida, Hawaii, Idaho, Kansas, Maine, Michigan, Minnesota, Montana, Nebraska, New Hampshire, New Jersey, New Mexico, New York, Ohio,Oklahoma, Oregon, Rhode Island, South Carolina, South Dakota, Texas, Utah, Washington, Wisconsin, and Wyoming. The multiple-race data for these areas werebridged to the single-race categories of the 1977 OMB standards for comparability with other areas; see http://www.cdc.gov/nchs and refer to "Detailedtechnical notes to the United States 2007 data—mortality." For explanation of asterisks preceding cause-of-death codes, see http://www.cdc.gov/nchs andrefer to "Detailed technical notes to the United States 2007 data - mortality"]_____________________________________________________________________________________________________________________________________________________________
Cause of death (Based on theInternational Classificationof Diseases, Tenth Revision, Second 40-44 45-49 50-54 55-59 60-64 65-69 70-74 75-79 80-84 85 yearsEdition, 2004), race, and sex years years years years years years years years years and over______________________________________________________________________________________________________________________________________________________________
Other diseases of arteries, arterioles and capillaries (I72-I78)
All races 3/, both sexes............. 0.4 0.5 1.0 1.8 3.4 5.8 9.6 16.1 27.2 62.0 Male............................ 0.4 0.7 1.2 2.3 4.1 7.0 10.9 18.8 31.2 61.0 Female.......................... 0.3 0.4 0.9 1.3 2.7 4.7 8.5 14.1 24.6 62.4 White, both sexes................... 0.3 0.5 0.9 1.6 3.1 5.4 9.2 15.6 26.3 61.3 Male............................ 0.4 0.6 1.0 2.0 3.8 6.5 10.5 18.1 30.3 60.7 Female.......................... 0.3 0.4 0.7 1.2 2.5 4.5 8.1 13.6 23.7 61.6 Black, both sexes................... * 1.0 2.3 4.1 6.3 10.3 16.0 25.6 43.1 85.6 Male............................ * * 3.0 5.2 8.1 14.0 19.0 32.3 50.0 85.0 Female.......................... * * 1.7 3.1 4.9 7.6 14.0 21.6 39.4 85.9
Other disorders of circulatory system (I80-I99)
All races 3/, both sexes............. 0.9 1.2 1.4 1.6 2.0 2.3 3.5 5.7 8.2 17.4 Male............................ 1.0 1.4 1.7 1.9 2.3 2.6 3.8 5.8 8.3 15.8 Female.......................... 0.7 1.0 1.1 1.3 1.7 2.1 3.3 5.7 8.2 18.2 White, both sexes................... 0.8 1.0 1.3 1.4 1.8 2.3 3.4 5.7 8.2 17.4 Male............................ 1.0 1.2 1.6 1.6 2.1 2.5 3.9 5.8 8.2 16.0 Female.......................... 0.5 0.8 1.0 1.3 1.6 2.0 3.0 5.7 8.2 18.0 Black, both sexes................... 1.8 3.1 2.4 3.3 4.3 3.8 5.4 7.8 10.5 23.0 Male............................ 1.9 3.6 3.1 5.0 5.3 4.8 * * * 19.5 Female.......................... 1.8 2.6 1.7 1.9 3.5 * 5.8 7.5 10.0 24.4

19JUL10 Plate 2 of 2 Page 39
Worktable 210R. Death rates for 113 selected causes, alcohol-induced causes, drug-induced causes, and injury by firearms, by 5-year agegroups, race, and sex: United States, 2007
[Rates per 100,000 population in specified group. Rates based on populations estimated as of July 1, 2007. Race categories are consistentwith the 1977 Office of Management and Budget (OMB) standards. In 2007, multiple-race data were reported by California, Connecticut, Delaware, Districtof Columbia, Florida, Hawaii, Idaho, Kansas, Maine, Michigan, Minnesota, Montana, Nebraska, New Hampshire, New Jersey, New Mexico, New York, Ohio,Oklahoma, Oregon, Rhode Island, South Carolina, South Dakota, Texas, Utah, Washington, Wisconsin, and Wyoming. The multiple-race data for these areas werebridged to the single-race categories of the 1977 OMB standards for comparability with other areas; see http://www.cdc.gov/nchs and refer to "Detailedtechnical notes to the United States 2007 data—mortality." For explanation of asterisks preceding cause-of-death codes, see http://www.cdc.gov/nchs andrefer to "Detailed technical notes to the United States 2007 data - mortality"]_____________________________________________________________________________________________________________________________________________________________
Cause of death (Based on theInternational Classificationof Diseases, Tenth Revision, Second 40-44 45-49 50-54 55-59 60-64 65-69 70-74 75-79 80-84 85 yearsEdition, 2004), race, and sex years years years years years years years years years and over______________________________________________________________________________________________________________________________________________________________
Influenza and pneumonia (J09-J18)
All races 3/, both sexes............. 2.3 3.5 5.3 7.7 12.1 20.4 39.0 78.4 160.0 463.2 Male............................ 2.6 4.1 6.4 9.4 15.1 24.5 46.8 95.1 202.1 542.7 Female.......................... 1.9 2.9 4.2 6.0 9.4 16.8 32.5 66.0 133.5 425.5 White, both sexes................... 2.1 3.0 4.9 7.0 11.4 19.4 37.3 77.1 159.8 469.5 Male............................ 2.4 3.3 5.8 8.7 13.9 22.7 44.2 92.1 200.6 547.9 Female.......................... 1.9 2.6 4.0 5.4 9.0 16.4 31.6 65.8 133.8 432.2 Black, both sexes................... 3.7 7.3 9.4 14.5 20.6 32.2 57.7 95.9 171.3 402.2 Male............................ 4.9 10.0 12.3 17.6 28.7 44.7 78.9 133.7 229.5 475.9 Female.......................... 2.6 5.0 6.9 12.0 14.2 23.1 43.2 73.1 140.7 371.5
Influenza (J09-J11)
All races 3/, both sexes................ * * * * 0.1 * 0.3 0.4 0.8 2.5 Male............................ * * * * * * * * 1.0 3.0 Female.......................... * * * * * * * * 0.7 2.3 White, both sexes................... * * * * * * 0.3 0.4 0.9 2.8 Male............................ * * * * * * * * 1.1 3.3 Female.......................... * * * * * * * * 0.8 2.5 Black, both sexes................... * * * * * * * * * * Male............................ * * * * * * * * * * Female.......................... * * * * * * * * * *

19JUL10 Plate 2 of 2 Page 40
Worktable 210R. Death rates for 113 selected causes, alcohol-induced causes, drug-induced causes, and injury by firearms, by 5-year agegroups, race, and sex: United States, 2007
[Rates per 100,000 population in specified group. Rates based on populations estimated as of July 1, 2007. Race categories are consistentwith the 1977 Office of Management and Budget (OMB) standards. In 2007, multiple-race data were reported by California, Connecticut, Delaware, Districtof Columbia, Florida, Hawaii, Idaho, Kansas, Maine, Michigan, Minnesota, Montana, Nebraska, New Hampshire, New Jersey, New Mexico, New York, Ohio,Oklahoma, Oregon, Rhode Island, South Carolina, South Dakota, Texas, Utah, Washington, Wisconsin, and Wyoming. The multiple-race data for these areas werebridged to the single-race categories of the 1977 OMB standards for comparability with other areas; see http://www.cdc.gov/nchs and refer to "Detailedtechnical notes to the United States 2007 data—mortality." For explanation of asterisks preceding cause-of-death codes, see http://www.cdc.gov/nchs andrefer to "Detailed technical notes to the United States 2007 data - mortality"]_____________________________________________________________________________________________________________________________________________________________
Cause of death (Based on theInternational Classificationof Diseases, Tenth Revision, Second 40-44 45-49 50-54 55-59 60-64 65-69 70-74 75-79 80-84 85 yearsEdition, 2004), race, and sex years years years years years years years years years and over______________________________________________________________________________________________________________________________________________________________
Pneumonia (J12-J18)
All races 3/, both sexes............. 2.2 3.5 5.2 7.6 12.0 20.3 38.7 77.9 159.2 460.7 Male............................ 2.6 4.1 6.3 9.3 15.0 24.4 46.5 94.6 201.1 539.7 Female.......................... 1.8 2.9 4.1 5.9 9.3 16.7 32.2 65.6 132.8 423.2 White, both sexes................... 2.1 3.0 4.8 6.9 11.2 19.3 37.0 76.7 158.9 466.8 Male............................ 2.3 3.3 5.7 8.6 13.7 22.6 43.8 91.7 199.6 544.6 Female.......................... 1.8 2.6 3.9 5.3 8.9 16.3 31.4 65.4 132.9 429.7 Black, both sexes................... 3.7 7.3 9.3 14.4 20.5 32.1 57.6 95.6 171.3 401.9 Male............................ 4.9 10.0 12.3 17.4 28.7 44.7 78.6 133.2 229.5 475.9 Female.......................... 2.6 5.0 6.8 11.9 14.1 22.9 43.2 72.8 140.7 371.2
Other acute lower respiratory infections (J20-J22,U04)
All races 3/, both sexes................ * * * * * * * * 0.4 1.5 Male............................ * * * * * * * * * * Female.......................... * * * * * * * * * 1.7 White, both sexes................... * * * * * * * * 0.4 1.5 Male............................ * * * * * * * * * * Female.......................... * * * * * * * * * 1.8 Black, both sexes................... * * * * * * * * * * Male............................ * * * * * * * * * * Female.......................... * * * * * * * * * *

19JUL10 Plate 2 of 2 Page 41
Worktable 210R. Death rates for 113 selected causes, alcohol-induced causes, drug-induced causes, and injury by firearms, by 5-year agegroups, race, and sex: United States, 2007
[Rates per 100,000 population in specified group. Rates based on populations estimated as of July 1, 2007. Race categories are consistentwith the 1977 Office of Management and Budget (OMB) standards. In 2007, multiple-race data were reported by California, Connecticut, Delaware, Districtof Columbia, Florida, Hawaii, Idaho, Kansas, Maine, Michigan, Minnesota, Montana, Nebraska, New Hampshire, New Jersey, New Mexico, New York, Ohio,Oklahoma, Oregon, Rhode Island, South Carolina, South Dakota, Texas, Utah, Washington, Wisconsin, and Wyoming. The multiple-race data for these areas werebridged to the single-race categories of the 1977 OMB standards for comparability with other areas; see http://www.cdc.gov/nchs and refer to "Detailedtechnical notes to the United States 2007 data—mortality." For explanation of asterisks preceding cause-of-death codes, see http://www.cdc.gov/nchs andrefer to "Detailed technical notes to the United States 2007 data - mortality"]_____________________________________________________________________________________________________________________________________________________________
Cause of death (Based on theInternational Classificationof Diseases, Tenth Revision, Second 40-44 45-49 50-54 55-59 60-64 65-69 70-74 75-79 80-84 85 yearsEdition, 2004), race, and sex years years years years years years years years years and over______________________________________________________________________________________________________________________________________________________________
Acute bronchitis and bronchiolitis (J20-J21)
All races 3/, both sexes................ * * * * * * * * * 1.1 Male............................ * * * * * * * * * * Female.......................... * * * * * * * * * 1.3 White, both sexes................... * * * * * * * * * 1.2 Male............................ * * * * * * * * * * Female.......................... * * * * * * * * * 1.3 Black, both sexes................... * * * * * * * * * * Male............................ * * * * * * * * * * Female.......................... * * * * * * * * * *
Other and unspecified acute lower respiratory infections (J22,U04)
All races 3/, both sexes................ * * * * * * * * * 0.4 Male............................ * * * * * * * * * * Female.......................... * * * * * * * * * * White, both sexes................... * * * * * * * * * * Male............................ * * * * * * * * * * Female.......................... * * * * * * * * * * Black, both sexes................... * * * * * * * * * * Male............................ * * * * * * * * * * Female.......................... * * * * * * * * * *
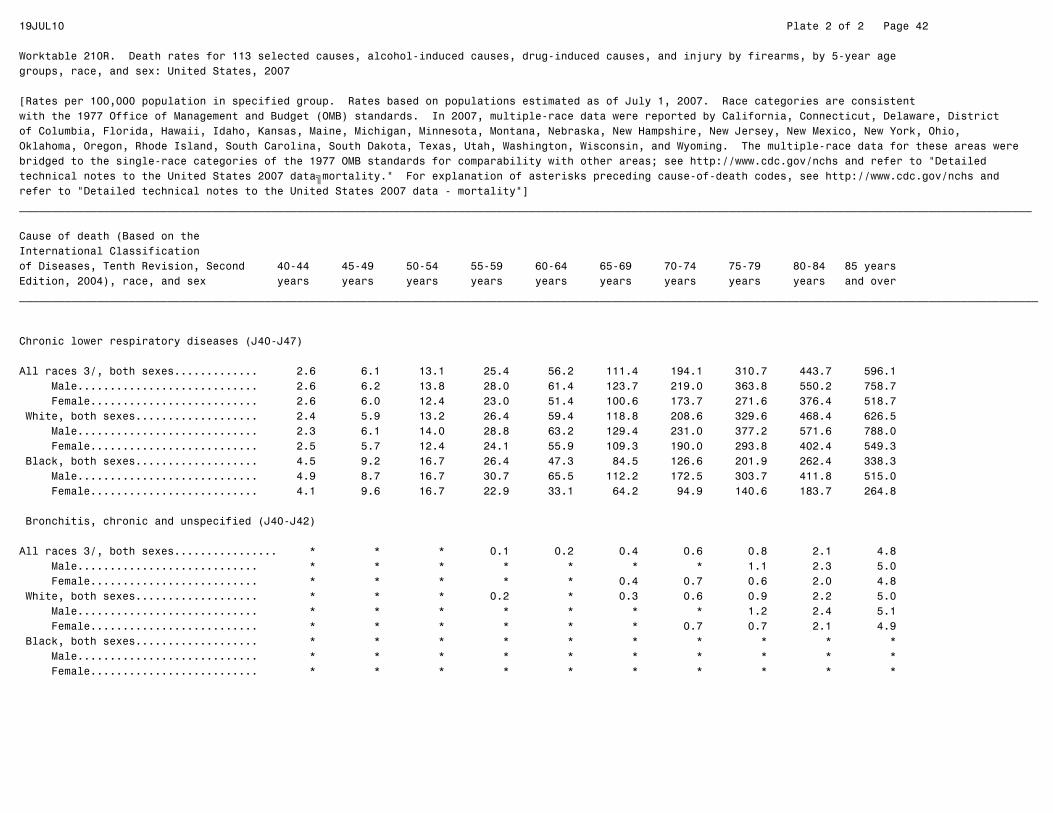
19JUL10 Plate 2 of 2 Page 42
Worktable 210R. Death rates for 113 selected causes, alcohol-induced causes, drug-induced causes, and injury by firearms, by 5-year agegroups, race, and sex: United States, 2007
[Rates per 100,000 population in specified group. Rates based on populations estimated as of July 1, 2007. Race categories are consistentwith the 1977 Office of Management and Budget (OMB) standards. In 2007, multiple-race data were reported by California, Connecticut, Delaware, Districtof Columbia, Florida, Hawaii, Idaho, Kansas, Maine, Michigan, Minnesota, Montana, Nebraska, New Hampshire, New Jersey, New Mexico, New York, Ohio,Oklahoma, Oregon, Rhode Island, South Carolina, South Dakota, Texas, Utah, Washington, Wisconsin, and Wyoming. The multiple-race data for these areas werebridged to the single-race categories of the 1977 OMB standards for comparability with other areas; see http://www.cdc.gov/nchs and refer to "Detailedtechnical notes to the United States 2007 data—mortality." For explanation of asterisks preceding cause-of-death codes, see http://www.cdc.gov/nchs andrefer to "Detailed technical notes to the United States 2007 data - mortality"]_____________________________________________________________________________________________________________________________________________________________
Cause of death (Based on theInternational Classificationof Diseases, Tenth Revision, Second 40-44 45-49 50-54 55-59 60-64 65-69 70-74 75-79 80-84 85 yearsEdition, 2004), race, and sex years years years years years years years years years and over______________________________________________________________________________________________________________________________________________________________
Chronic lower respiratory diseases (J40-J47)
All races 3/, both sexes............. 2.6 6.1 13.1 25.4 56.2 111.4 194.1 310.7 443.7 596.1 Male............................ 2.6 6.2 13.8 28.0 61.4 123.7 219.0 363.8 550.2 758.7 Female.......................... 2.6 6.0 12.4 23.0 51.4 100.6 173.7 271.6 376.4 518.7 White, both sexes................... 2.4 5.9 13.2 26.4 59.4 118.8 208.6 329.6 468.4 626.5 Male............................ 2.3 6.1 14.0 28.8 63.2 129.4 231.0 377.2 571.6 788.0 Female.......................... 2.5 5.7 12.4 24.1 55.9 109.3 190.0 293.8 402.4 549.3 Black, both sexes................... 4.5 9.2 16.7 26.4 47.3 84.5 126.6 201.9 262.4 338.3 Male............................ 4.9 8.7 16.7 30.7 65.5 112.2 172.5 303.7 411.8 515.0 Female.......................... 4.1 9.6 16.7 22.9 33.1 64.2 94.9 140.6 183.7 264.8
Bronchitis, chronic and unspecified (J40-J42)
All races 3/, both sexes................ * * * 0.1 0.2 0.4 0.6 0.8 2.1 4.8 Male............................ * * * * * * * 1.1 2.3 5.0 Female.......................... * * * * * 0.4 0.7 0.6 2.0 4.8 White, both sexes................... * * * 0.2 * 0.3 0.6 0.9 2.2 5.0 Male............................ * * * * * * * 1.2 2.4 5.1 Female.......................... * * * * * * 0.7 0.7 2.1 4.9 Black, both sexes................... * * * * * * * * * * Male............................ * * * * * * * * * * Female.......................... * * * * * * * * * *

19JUL10 Plate 2 of 2 Page 43
Worktable 210R. Death rates for 113 selected causes, alcohol-induced causes, drug-induced causes, and injury by firearms, by 5-year agegroups, race, and sex: United States, 2007
[Rates per 100,000 population in specified group. Rates based on populations estimated as of July 1, 2007. Race categories are consistentwith the 1977 Office of Management and Budget (OMB) standards. In 2007, multiple-race data were reported by California, Connecticut, Delaware, Districtof Columbia, Florida, Hawaii, Idaho, Kansas, Maine, Michigan, Minnesota, Montana, Nebraska, New Hampshire, New Jersey, New Mexico, New York, Ohio,Oklahoma, Oregon, Rhode Island, South Carolina, South Dakota, Texas, Utah, Washington, Wisconsin, and Wyoming. The multiple-race data for these areas werebridged to the single-race categories of the 1977 OMB standards for comparability with other areas; see http://www.cdc.gov/nchs and refer to "Detailedtechnical notes to the United States 2007 data—mortality." For explanation of asterisks preceding cause-of-death codes, see http://www.cdc.gov/nchs andrefer to "Detailed technical notes to the United States 2007 data - mortality"]_____________________________________________________________________________________________________________________________________________________________
Cause of death (Based on theInternational Classificationof Diseases, Tenth Revision, Second 40-44 45-49 50-54 55-59 60-64 65-69 70-74 75-79 80-84 85 yearsEdition, 2004), race, and sex years years years years years years years years years and over______________________________________________________________________________________________________________________________________________________________
Emphysema (J43)
All races 3/, both sexes............. 0.2 0.7 1.5 3.3 6.9 13.0 22.1 33.1 42.4 45.5 Male............................ 0.3 0.9 1.9 3.9 8.1 15.3 26.4 40.9 53.8 61.6 Female.......................... * 0.5 1.1 2.7 5.7 11.0 18.5 27.3 35.1 37.9 White, both sexes................... 0.2 0.7 1.6 3.5 7.3 14.0 24.0 35.0 44.9 48.2 Male............................ 0.3 0.9 2.0 4.1 8.3 16.0 28.3 42.1 55.9 64.0 Female.......................... * 0.5 1.2 3.0 6.3 12.1 20.4 29.6 37.9 40.6 Black, both sexes................... * 1.0 1.6 2.6 5.6 9.3 11.8 22.1 23.3 24.0 Male............................ * * 2.2 3.7 9.1 14.4 18.1 36.7 37.8 45.9 Female.......................... * * * * 2.8 5.6 7.5 13.3 15.6 14.8
Asthma (J45-J46)
All races 3/, both sexes............. 0.9 1.1 1.3 1.3 1.5 2.0 2.3 3.5 5.5 12.0 Male............................ 0.7 0.9 1.0 1.2 1.3 1.5 1.6 2.4 4.4 7.1 Female.......................... 1.0 1.4 1.6 1.5 1.7 2.4 3.0 4.2 6.3 14.2 White, both sexes................... 0.6 0.8 0.9 1.0 1.2 1.6 2.0 3.2 5.0 11.8 Male............................ 0.5 0.7 0.8 0.8 0.9 1.2 1.2 2.0 3.7 6.7 Female.......................... 0.8 0.9 1.1 1.1 1.5 2.1 2.6 4.1 5.8 14.2 Black, both sexes................... 2.5 3.7 4.1 4.3 4.3 4.5 5.9 5.2 8.1 11.7 Male............................ 2.3 2.6 3.2 4.0 4.9 5.0 * * * * Female.......................... 2.8 4.5 4.8 4.6 3.7 4.0 6.9 * 8.2 14.1

19JUL10 Plate 2 of 2 Page 44
Worktable 210R. Death rates for 113 selected causes, alcohol-induced causes, drug-induced causes, and injury by firearms, by 5-year agegroups, race, and sex: United States, 2007
[Rates per 100,000 population in specified group. Rates based on populations estimated as of July 1, 2007. Race categories are consistentwith the 1977 Office of Management and Budget (OMB) standards. In 2007, multiple-race data were reported by California, Connecticut, Delaware, Districtof Columbia, Florida, Hawaii, Idaho, Kansas, Maine, Michigan, Minnesota, Montana, Nebraska, New Hampshire, New Jersey, New Mexico, New York, Ohio,Oklahoma, Oregon, Rhode Island, South Carolina, South Dakota, Texas, Utah, Washington, Wisconsin, and Wyoming. The multiple-race data for these areas werebridged to the single-race categories of the 1977 OMB standards for comparability with other areas; see http://www.cdc.gov/nchs and refer to "Detailedtechnical notes to the United States 2007 data—mortality." For explanation of asterisks preceding cause-of-death codes, see http://www.cdc.gov/nchs andrefer to "Detailed technical notes to the United States 2007 data - mortality"]_____________________________________________________________________________________________________________________________________________________________
Cause of death (Based on theInternational Classificationof Diseases, Tenth Revision, Second 40-44 45-49 50-54 55-59 60-64 65-69 70-74 75-79 80-84 85 yearsEdition, 2004), race, and sex years years years years years years years years years and over______________________________________________________________________________________________________________________________________________________________
Other chronic lower respiratory diseases (J44,J47)
All races 3/, both sexes............. 1.4 4.2 10.2 20.7 47.7 96.1 169.1 273.4 393.6 533.8 Male............................ 1.5 4.3 10.8 22.8 51.9 106.5 190.7 319.4 489.7 684.9 Female.......................... 1.3 4.1 9.6 18.7 43.8 86.9 151.4 239.5 333.0 461.9 White, both sexes................... 1.5 4.3 10.6 21.8 50.8 102.8 182.1 290.5 416.3 561.6 Male............................ 1.5 4.4 11.2 23.8 53.9 111.9 201.1 331.9 509.6 712.3 Female.......................... 1.4 4.2 9.9 19.8 47.9 94.7 166.2 259.4 356.6 489.7 Black, both sexes................... 1.7 4.5 10.9 19.4 37.2 70.1 108.4 174.5 229.1 299.1 Male............................ 2.2 4.8 11.2 23.0 51.5 92.1 149.3 261.2 363.2 459.8 Female.......................... * 4.3 10.7 16.6 26.0 53.9 80.3 122.2 158.5 232.2
Pneumoconioses and chemical effects (J60-J66,J68)
All races 3/, both sexes................ * * * 0.1 0.2 0.5 1.5 2.2 3.9 4.9 Male............................ * * * 0.2 0.4 0.9 3.2 5.1 9.7 14.5 Female.......................... * * * * * * * * * * White, both sexes................... * * * 0.2 0.2 0.5 1.6 2.3 4.1 5.4 Male............................ * * * 0.3 0.5 1.0 3.5 5.3 10.3 15.8 Female.......................... * * * * * * * * * * Black, both sexes................... * * * * * * * * * * Male............................ * * * * * * * * * * Female.......................... * * * * * * * * * *
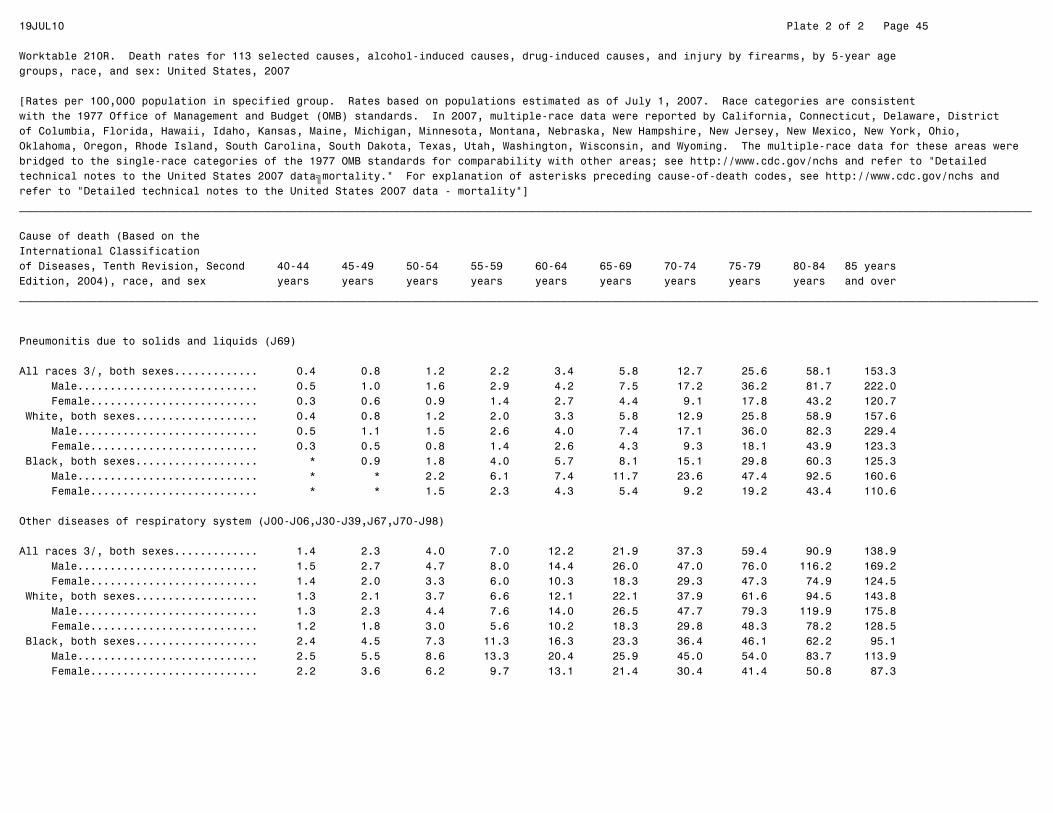
19JUL10 Plate 2 of 2 Page 45
Worktable 210R. Death rates for 113 selected causes, alcohol-induced causes, drug-induced causes, and injury by firearms, by 5-year agegroups, race, and sex: United States, 2007
[Rates per 100,000 population in specified group. Rates based on populations estimated as of July 1, 2007. Race categories are consistentwith the 1977 Office of Management and Budget (OMB) standards. In 2007, multiple-race data were reported by California, Connecticut, Delaware, Districtof Columbia, Florida, Hawaii, Idaho, Kansas, Maine, Michigan, Minnesota, Montana, Nebraska, New Hampshire, New Jersey, New Mexico, New York, Ohio,Oklahoma, Oregon, Rhode Island, South Carolina, South Dakota, Texas, Utah, Washington, Wisconsin, and Wyoming. The multiple-race data for these areas werebridged to the single-race categories of the 1977 OMB standards for comparability with other areas; see http://www.cdc.gov/nchs and refer to "Detailedtechnical notes to the United States 2007 data—mortality." For explanation of asterisks preceding cause-of-death codes, see http://www.cdc.gov/nchs andrefer to "Detailed technical notes to the United States 2007 data - mortality"]_____________________________________________________________________________________________________________________________________________________________
Cause of death (Based on theInternational Classificationof Diseases, Tenth Revision, Second 40-44 45-49 50-54 55-59 60-64 65-69 70-74 75-79 80-84 85 yearsEdition, 2004), race, and sex years years years years years years years years years and over______________________________________________________________________________________________________________________________________________________________
Pneumonitis due to solids and liquids (J69)
All races 3/, both sexes............. 0.4 0.8 1.2 2.2 3.4 5.8 12.7 25.6 58.1 153.3 Male............................ 0.5 1.0 1.6 2.9 4.2 7.5 17.2 36.2 81.7 222.0 Female.......................... 0.3 0.6 0.9 1.4 2.7 4.4 9.1 17.8 43.2 120.7 White, both sexes................... 0.4 0.8 1.2 2.0 3.3 5.8 12.9 25.8 58.9 157.6 Male............................ 0.5 1.1 1.5 2.6 4.0 7.4 17.1 36.0 82.3 229.4 Female.......................... 0.3 0.5 0.8 1.4 2.6 4.3 9.3 18.1 43.9 123.3 Black, both sexes................... * 0.9 1.8 4.0 5.7 8.1 15.1 29.8 60.3 125.3 Male............................ * * 2.2 6.1 7.4 11.7 23.6 47.4 92.5 160.6 Female.......................... * * 1.5 2.3 4.3 5.4 9.2 19.2 43.4 110.6
Other diseases of respiratory system (J00-J06,J30-J39,J67,J70-J98)
All races 3/, both sexes............. 1.4 2.3 4.0 7.0 12.2 21.9 37.3 59.4 90.9 138.9 Male............................ 1.5 2.7 4.7 8.0 14.4 26.0 47.0 76.0 116.2 169.2 Female.......................... 1.4 2.0 3.3 6.0 10.3 18.3 29.3 47.3 74.9 124.5 White, both sexes................... 1.3 2.1 3.7 6.6 12.1 22.1 37.9 61.6 94.5 143.8 Male............................ 1.3 2.3 4.4 7.6 14.0 26.5 47.7 79.3 119.9 175.8 Female.......................... 1.2 1.8 3.0 5.6 10.2 18.3 29.8 48.3 78.2 128.5 Black, both sexes................... 2.4 4.5 7.3 11.3 16.3 23.3 36.4 46.1 62.2 95.1 Male............................ 2.5 5.5 8.6 13.3 20.4 25.9 45.0 54.0 83.7 113.9 Female.......................... 2.2 3.6 6.2 9.7 13.1 21.4 30.4 41.4 50.8 87.3

19JUL10 Plate 2 of 2 Page 46
Worktable 210R. Death rates for 113 selected causes, alcohol-induced causes, drug-induced causes, and injury by firearms, by 5-year agegroups, race, and sex: United States, 2007
[Rates per 100,000 population in specified group. Rates based on populations estimated as of July 1, 2007. Race categories are consistentwith the 1977 Office of Management and Budget (OMB) standards. In 2007, multiple-race data were reported by California, Connecticut, Delaware, Districtof Columbia, Florida, Hawaii, Idaho, Kansas, Maine, Michigan, Minnesota, Montana, Nebraska, New Hampshire, New Jersey, New Mexico, New York, Ohio,Oklahoma, Oregon, Rhode Island, South Carolina, South Dakota, Texas, Utah, Washington, Wisconsin, and Wyoming. The multiple-race data for these areas werebridged to the single-race categories of the 1977 OMB standards for comparability with other areas; see http://www.cdc.gov/nchs and refer to "Detailedtechnical notes to the United States 2007 data—mortality." For explanation of asterisks preceding cause-of-death codes, see http://www.cdc.gov/nchs andrefer to "Detailed technical notes to the United States 2007 data - mortality"]_____________________________________________________________________________________________________________________________________________________________
Cause of death (Based on theInternational Classificationof Diseases, Tenth Revision, Second 40-44 45-49 50-54 55-59 60-64 65-69 70-74 75-79 80-84 85 yearsEdition, 2004), race, and sex years years years years years years years years years and over______________________________________________________________________________________________________________________________________________________________
Peptic ulcer (K25-K28)
All races 3/, both sexes............. 0.2 0.5 0.9 1.0 1.3 2.1 3.0 4.9 8.2 17.3 Male............................ 0.3 0.8 1.1 1.3 1.7 2.7 3.4 5.5 9.5 18.0 Female.......................... * 0.2 0.6 0.8 1.0 1.6 2.7 4.5 7.4 16.9 White, both sexes................... 0.2 0.4 0.8 1.0 1.2 2.1 3.1 4.8 8.3 17.7 Male............................ 0.3 0.6 1.0 1.2 1.5 2.6 3.3 5.3 9.5 18.1 Female.......................... * 0.3 0.5 0.8 0.9 1.6 2.9 4.5 7.5 17.5 Black, both sexes................... * 1.1 1.5 1.8 2.5 3.0 2.6 5.0 6.3 11.5 Male............................ * 2.0 1.9 2.7 3.3 4.6 * * * * Female.......................... * * * * * * * * * 11.0
Diseases of appendix (K35-K38)
All races 3/, both sexes................ * 0.1 0.1 0.2 0.2 0.3 0.6 0.7 1.0 1.5 Male............................ * * * 0.2 0.3 * 0.8 0.9 1.7 2.1 Female.......................... * * * * * * 0.5 0.6 0.6 1.2 White, both sexes................... * * * * 0.2 0.3 0.6 0.7 1.0 1.5 Male............................ * * * * * * 0.8 0.9 1.7 2.2 Female.......................... * * * * * * * 0.6 * 1.2 Black, both sexes................... * * * * * * * * * * Male............................ * * * * * * * * * * Female.......................... * * * * * * * * * *

19JUL10 Plate 2 of 2 Page 47
Worktable 210R. Death rates for 113 selected causes, alcohol-induced causes, drug-induced causes, and injury by firearms, by 5-year agegroups, race, and sex: United States, 2007
[Rates per 100,000 population in specified group. Rates based on populations estimated as of July 1, 2007. Race categories are consistentwith the 1977 Office of Management and Budget (OMB) standards. In 2007, multiple-race data were reported by California, Connecticut, Delaware, Districtof Columbia, Florida, Hawaii, Idaho, Kansas, Maine, Michigan, Minnesota, Montana, Nebraska, New Hampshire, New Jersey, New Mexico, New York, Ohio,Oklahoma, Oregon, Rhode Island, South Carolina, South Dakota, Texas, Utah, Washington, Wisconsin, and Wyoming. The multiple-race data for these areas werebridged to the single-race categories of the 1977 OMB standards for comparability with other areas; see http://www.cdc.gov/nchs and refer to "Detailedtechnical notes to the United States 2007 data—mortality." For explanation of asterisks preceding cause-of-death codes, see http://www.cdc.gov/nchs andrefer to "Detailed technical notes to the United States 2007 data - mortality"]_____________________________________________________________________________________________________________________________________________________________
Cause of death (Based on theInternational Classificationof Diseases, Tenth Revision, Second 40-44 45-49 50-54 55-59 60-64 65-69 70-74 75-79 80-84 85 yearsEdition, 2004), race, and sex years years years years years years years years years and over______________________________________________________________________________________________________________________________________________________________
Hernia (K40-K46)
All races 3/, both sexes............. 0.1 0.2 0.3 0.4 0.7 1.0 1.6 2.7 4.8 11.3 Male............................ * 0.2 0.3 0.5 0.7 0.7 1.9 2.7 4.8 12.0 Female.......................... * * 0.2 0.3 0.6 1.2 1.4 2.7 4.9 11.0 White, both sexes................... * 0.2 0.2 0.4 0.7 0.9 1.6 2.8 4.8 12.1 Male............................ * 0.2 0.2 0.4 0.7 0.7 1.9 2.6 4.6 12.6 Female.......................... * * * 0.4 0.7 1.1 1.4 2.9 4.9 11.8 Black, both sexes................... * * * * * * 2.5 * 6.8 6.0 Male............................ * * * * * * * * * * Female.......................... * * * * * * * * * *
Chronic liver disease and cirrhosis (K70,K73-K74)
All races 3/, both sexes............. 8.3 15.5 22.2 24.6 24.3 25.5 28.2 29.3 27.2 19.8 Male............................ 11.2 21.5 32.6 37.1 35.4 36.0 36.5 38.2 34.6 25.8 Female.......................... 5.4 9.6 12.2 12.9 14.1 16.3 21.4 22.7 22.6 17.0 White, both sexes................... 8.7 16.1 22.9 24.7 25.0 26.6 29.4 30.7 28.7 20.6 Male............................ 11.8 22.6 33.6 37.1 36.3 37.0 37.7 39.5 36.4 27.2 Female.......................... 5.6 9.7 12.5 12.8 14.4 17.3 22.5 24.2 23.7 17.5 Black, both sexes................... 5.6 12.4 20.4 27.4 23.3 21.5 22.5 18.0 11.4 9.7 Male............................ 7.4 15.7 31.1 42.9 36.4 36.4 34.1 31.0 13.5 * Female.......................... 4.1 9.4 11.3 14.6 13.1 10.6 14.4 10.1 10.3 9.9

19JUL10 Plate 2 of 2 Page 48
Worktable 210R. Death rates for 113 selected causes, alcohol-induced causes, drug-induced causes, and injury by firearms, by 5-year agegroups, race, and sex: United States, 2007
[Rates per 100,000 population in specified group. Rates based on populations estimated as of July 1, 2007. Race categories are consistentwith the 1977 Office of Management and Budget (OMB) standards. In 2007, multiple-race data were reported by California, Connecticut, Delaware, Districtof Columbia, Florida, Hawaii, Idaho, Kansas, Maine, Michigan, Minnesota, Montana, Nebraska, New Hampshire, New Jersey, New Mexico, New York, Ohio,Oklahoma, Oregon, Rhode Island, South Carolina, South Dakota, Texas, Utah, Washington, Wisconsin, and Wyoming. The multiple-race data for these areas werebridged to the single-race categories of the 1977 OMB standards for comparability with other areas; see http://www.cdc.gov/nchs and refer to "Detailedtechnical notes to the United States 2007 data—mortality." For explanation of asterisks preceding cause-of-death codes, see http://www.cdc.gov/nchs andrefer to "Detailed technical notes to the United States 2007 data - mortality"]_____________________________________________________________________________________________________________________________________________________________
Cause of death (Based on theInternational Classificationof Diseases, Tenth Revision, Second 40-44 45-49 50-54 55-59 60-64 65-69 70-74 75-79 80-84 85 yearsEdition, 2004), race, and sex years years years years years years years years years and over______________________________________________________________________________________________________________________________________________________________
Alcoholic liver disease (K70)
All races 3/, both sexes............. 5.8 10.1 13.4 13.7 12.5 10.8 9.2 6.9 4.3 2.1 Male............................ 7.8 14.2 20.2 21.5 20.1 17.9 15.7 12.2 7.9 4.7 Female.......................... 3.9 6.1 6.9 6.3 5.6 4.7 3.9 3.0 1.9 0.9 White, both sexes................... 6.1 10.6 14.1 14.2 12.9 11.2 9.4 7.2 4.5 2.2 Male............................ 8.2 15.0 21.1 22.3 20.6 18.2 15.8 12.5 8.3 4.9 Female.......................... 4.1 6.2 7.2 6.4 5.7 4.9 4.1 3.2 2.0 0.9 Black, both sexes................... 3.4 7.0 9.6 12.2 11.2 9.7 9.3 5.0 * * Male............................ 4.4 9.2 15.5 19.5 19.5 18.1 18.1 11.1 * * Female.......................... 2.6 5.0 4.6 6.2 4.8 3.5 * * * *
Other chronic liver disease and cirrhosis (K73-K74)
All races 3/, both sexes............. 2.5 5.4 8.8 10.9 11.8 14.7 18.9 22.4 23.0 17.7 Male............................ 3.4 7.3 12.5 15.6 15.3 18.2 20.7 26.0 26.7 21.0 Female.......................... 1.6 3.5 5.3 6.6 8.5 11.7 17.5 19.7 20.6 16.1 White, both sexes................... 2.6 5.5 8.8 10.6 12.1 15.4 20.0 23.6 24.2 18.4 Male............................ 3.6 7.6 12.5 14.9 15.7 18.8 21.8 27.0 28.1 22.3 Female.......................... 1.6 3.5 5.2 6.4 8.7 12.4 18.4 21.0 21.8 16.6 Black, both sexes................... 2.2 5.4 10.8 15.2 12.1 11.8 13.2 13.0 9.3 8.2 Male............................ 3.0 6.5 15.7 23.4 17.0 18.3 16.0 19.9 * * Female.......................... 1.6 4.4 6.7 8.4 8.3 7.1 11.3 8.8 8.9 8.8

19JUL10 Plate 2 of 2 Page 49
Worktable 210R. Death rates for 113 selected causes, alcohol-induced causes, drug-induced causes, and injury by firearms, by 5-year agegroups, race, and sex: United States, 2007
[Rates per 100,000 population in specified group. Rates based on populations estimated as of July 1, 2007. Race categories are consistentwith the 1977 Office of Management and Budget (OMB) standards. In 2007, multiple-race data were reported by California, Connecticut, Delaware, Districtof Columbia, Florida, Hawaii, Idaho, Kansas, Maine, Michigan, Minnesota, Montana, Nebraska, New Hampshire, New Jersey, New Mexico, New York, Ohio,Oklahoma, Oregon, Rhode Island, South Carolina, South Dakota, Texas, Utah, Washington, Wisconsin, and Wyoming. The multiple-race data for these areas werebridged to the single-race categories of the 1977 OMB standards for comparability with other areas; see http://www.cdc.gov/nchs and refer to "Detailedtechnical notes to the United States 2007 data—mortality." For explanation of asterisks preceding cause-of-death codes, see http://www.cdc.gov/nchs andrefer to "Detailed technical notes to the United States 2007 data - mortality"]_____________________________________________________________________________________________________________________________________________________________
Cause of death (Based on theInternational Classificationof Diseases, Tenth Revision, Second 40-44 45-49 50-54 55-59 60-64 65-69 70-74 75-79 80-84 85 yearsEdition, 2004), race, and sex years years years years years years years years years and over______________________________________________________________________________________________________________________________________________________________
Cholelithiasis and other disorders of gallbladder (K80-K82)
All races 3/, both sexes............. 0.2 0.2 0.4 0.6 0.8 1.9 3.2 5.7 10.4 23.3 Male............................ * 0.3 0.4 0.8 0.9 2.3 4.0 7.1 13.0 23.8 Female.......................... * 0.2 0.4 0.5 0.8 1.6 2.5 4.7 8.8 23.1 White, both sexes................... 0.1 0.2 0.3 0.6 0.8 1.9 3.2 5.6 10.5 24.0 Male............................ * 0.3 0.3 0.7 0.9 2.4 4.0 7.2 13.0 24.4 Female.......................... * * 0.3 0.4 0.7 1.5 2.5 4.3 8.9 23.8 Black, both sexes................... * * * 1.2 1.4 2.4 3.3 8.0 9.3 18.0 Male............................ * * * * * * * * 13.5 19.5 Female.......................... * * * * * * * 8.0 7.1 17.3
Nephritis, nephrotic syndrome and nephrosis (N00-N07,N17-N19,N25-N27)
All races 3/, both sexes............. 2.2 3.9 6.4 10.8 17.0 30.2 52.4 87.2 146.1 290.6 Male............................ 2.5 4.3 7.5 12.5 19.7 33.7 60.8 104.7 189.6 376.3 Female.......................... 1.8 3.4 5.4 9.2 14.5 27.1 45.5 74.3 118.6 249.9 White, both sexes................... 1.5 2.8 4.8 8.3 13.1 25.0 45.3 80.4 140.1 282.5 Male............................ 1.7 3.2 5.7 9.9 15.2 27.9 53.9 99.0 185.2 373.5 Female.......................... 1.3 2.3 3.9 6.8 11.0 22.4 38.1 66.4 111.2 239.0 Black, both sexes................... 6.8 12.1 19.5 32.2 54.4 81.2 123.9 174.1 235.8 437.1 Male............................ 8.6 13.2 23.0 37.0 65.6 96.6 137.5 199.6 278.1 493.8 Female.......................... 5.2 11.1 16.5 28.2 45.6 69.9 114.5 158.8 213.6 413.6
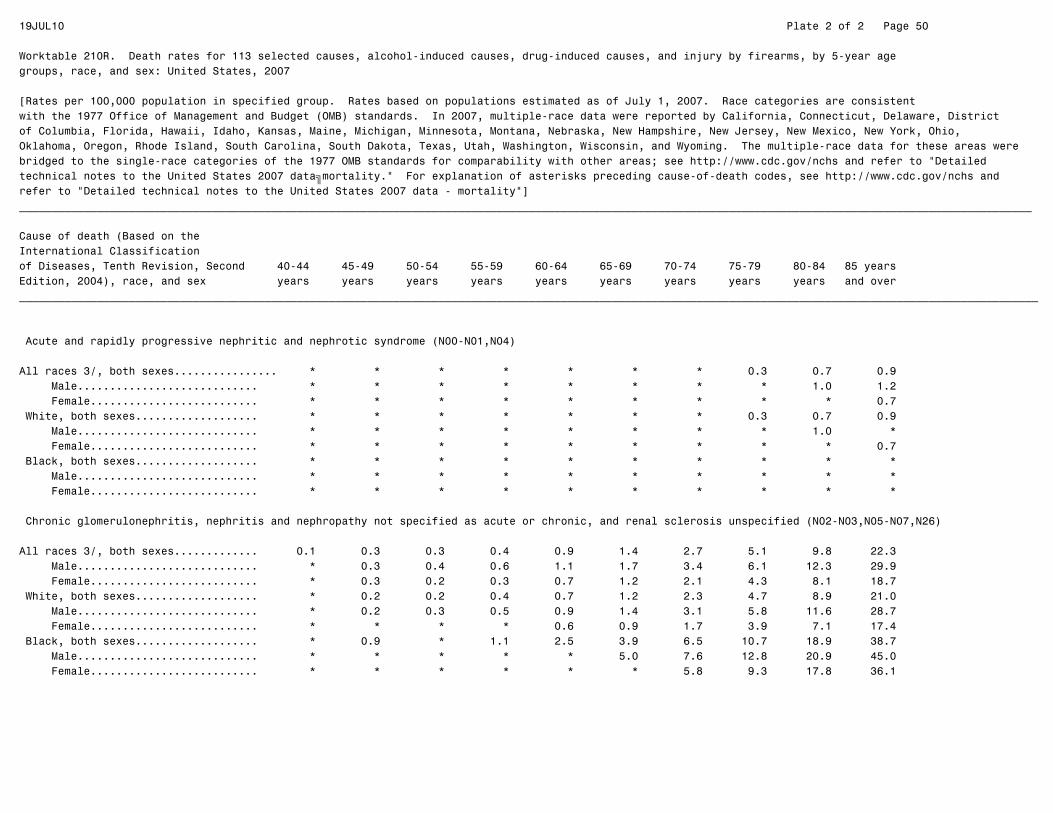
19JUL10 Plate 2 of 2 Page 50
Worktable 210R. Death rates for 113 selected causes, alcohol-induced causes, drug-induced causes, and injury by firearms, by 5-year agegroups, race, and sex: United States, 2007
[Rates per 100,000 population in specified group. Rates based on populations estimated as of July 1, 2007. Race categories are consistentwith the 1977 Office of Management and Budget (OMB) standards. In 2007, multiple-race data were reported by California, Connecticut, Delaware, Districtof Columbia, Florida, Hawaii, Idaho, Kansas, Maine, Michigan, Minnesota, Montana, Nebraska, New Hampshire, New Jersey, New Mexico, New York, Ohio,Oklahoma, Oregon, Rhode Island, South Carolina, South Dakota, Texas, Utah, Washington, Wisconsin, and Wyoming. The multiple-race data for these areas werebridged to the single-race categories of the 1977 OMB standards for comparability with other areas; see http://www.cdc.gov/nchs and refer to "Detailedtechnical notes to the United States 2007 data—mortality." For explanation of asterisks preceding cause-of-death codes, see http://www.cdc.gov/nchs andrefer to "Detailed technical notes to the United States 2007 data - mortality"]_____________________________________________________________________________________________________________________________________________________________
Cause of death (Based on theInternational Classificationof Diseases, Tenth Revision, Second 40-44 45-49 50-54 55-59 60-64 65-69 70-74 75-79 80-84 85 yearsEdition, 2004), race, and sex years years years years years years years years years and over______________________________________________________________________________________________________________________________________________________________
Acute and rapidly progressive nephritic and nephrotic syndrome (N00-N01,N04)
All races 3/, both sexes................ * * * * * * * 0.3 0.7 0.9 Male............................ * * * * * * * * 1.0 1.2 Female.......................... * * * * * * * * * 0.7 White, both sexes................... * * * * * * * 0.3 0.7 0.9 Male............................ * * * * * * * * 1.0 * Female.......................... * * * * * * * * * 0.7 Black, both sexes................... * * * * * * * * * * Male............................ * * * * * * * * * * Female.......................... * * * * * * * * * *
Chronic glomerulonephritis, nephritis and nephropathy not specified as acute or chronic, and renal sclerosis unspecified (N02-N03,N05-N07,N26)
All races 3/, both sexes............. 0.1 0.3 0.3 0.4 0.9 1.4 2.7 5.1 9.8 22.3 Male............................ * 0.3 0.4 0.6 1.1 1.7 3.4 6.1 12.3 29.9 Female.......................... * 0.3 0.2 0.3 0.7 1.2 2.1 4.3 8.1 18.7 White, both sexes................... * 0.2 0.2 0.4 0.7 1.2 2.3 4.7 8.9 21.0 Male............................ * 0.2 0.3 0.5 0.9 1.4 3.1 5.8 11.6 28.7 Female.......................... * * * * 0.6 0.9 1.7 3.9 7.1 17.4 Black, both sexes................... * 0.9 * 1.1 2.5 3.9 6.5 10.7 18.9 38.7 Male............................ * * * * * 5.0 7.6 12.8 20.9 45.0 Female.......................... * * * * * * 5.8 9.3 17.8 36.1
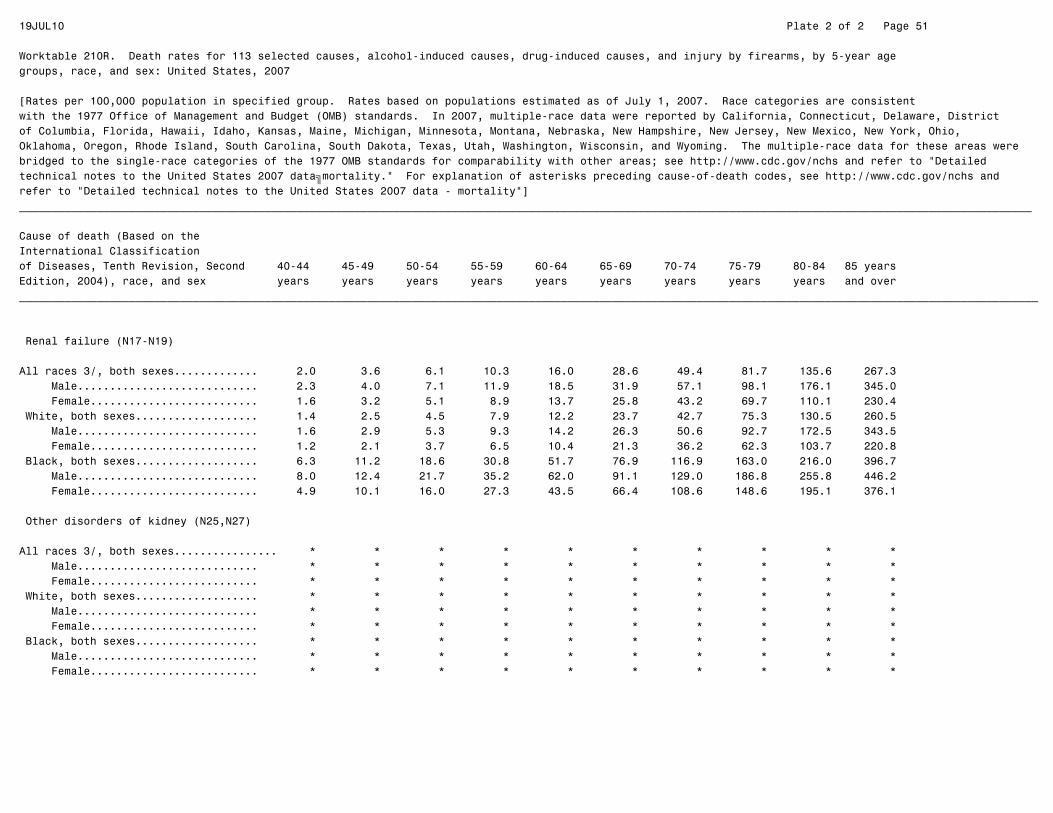
19JUL10 Plate 2 of 2 Page 51
Worktable 210R. Death rates for 113 selected causes, alcohol-induced causes, drug-induced causes, and injury by firearms, by 5-year agegroups, race, and sex: United States, 2007
[Rates per 100,000 population in specified group. Rates based on populations estimated as of July 1, 2007. Race categories are consistentwith the 1977 Office of Management and Budget (OMB) standards. In 2007, multiple-race data were reported by California, Connecticut, Delaware, Districtof Columbia, Florida, Hawaii, Idaho, Kansas, Maine, Michigan, Minnesota, Montana, Nebraska, New Hampshire, New Jersey, New Mexico, New York, Ohio,Oklahoma, Oregon, Rhode Island, South Carolina, South Dakota, Texas, Utah, Washington, Wisconsin, and Wyoming. The multiple-race data for these areas werebridged to the single-race categories of the 1977 OMB standards for comparability with other areas; see http://www.cdc.gov/nchs and refer to "Detailedtechnical notes to the United States 2007 data—mortality." For explanation of asterisks preceding cause-of-death codes, see http://www.cdc.gov/nchs andrefer to "Detailed technical notes to the United States 2007 data - mortality"]_____________________________________________________________________________________________________________________________________________________________
Cause of death (Based on theInternational Classificationof Diseases, Tenth Revision, Second 40-44 45-49 50-54 55-59 60-64 65-69 70-74 75-79 80-84 85 yearsEdition, 2004), race, and sex years years years years years years years years years and over______________________________________________________________________________________________________________________________________________________________
Renal failure (N17-N19)
All races 3/, both sexes............. 2.0 3.6 6.1 10.3 16.0 28.6 49.4 81.7 135.6 267.3 Male............................ 2.3 4.0 7.1 11.9 18.5 31.9 57.1 98.1 176.1 345.0 Female.......................... 1.6 3.2 5.1 8.9 13.7 25.8 43.2 69.7 110.1 230.4 White, both sexes................... 1.4 2.5 4.5 7.9 12.2 23.7 42.7 75.3 130.5 260.5 Male............................ 1.6 2.9 5.3 9.3 14.2 26.3 50.6 92.7 172.5 343.5 Female.......................... 1.2 2.1 3.7 6.5 10.4 21.3 36.2 62.3 103.7 220.8 Black, both sexes................... 6.3 11.2 18.6 30.8 51.7 76.9 116.9 163.0 216.0 396.7 Male............................ 8.0 12.4 21.7 35.2 62.0 91.1 129.0 186.8 255.8 446.2 Female.......................... 4.9 10.1 16.0 27.3 43.5 66.4 108.6 148.6 195.1 376.1
Other disorders of kidney (N25,N27)
All races 3/, both sexes................ * * * * * * * * * * Male............................ * * * * * * * * * * Female.......................... * * * * * * * * * * White, both sexes................... * * * * * * * * * * Male............................ * * * * * * * * * * Female.......................... * * * * * * * * * * Black, both sexes................... * * * * * * * * * * Male............................ * * * * * * * * * * Female.......................... * * * * * * * * * *
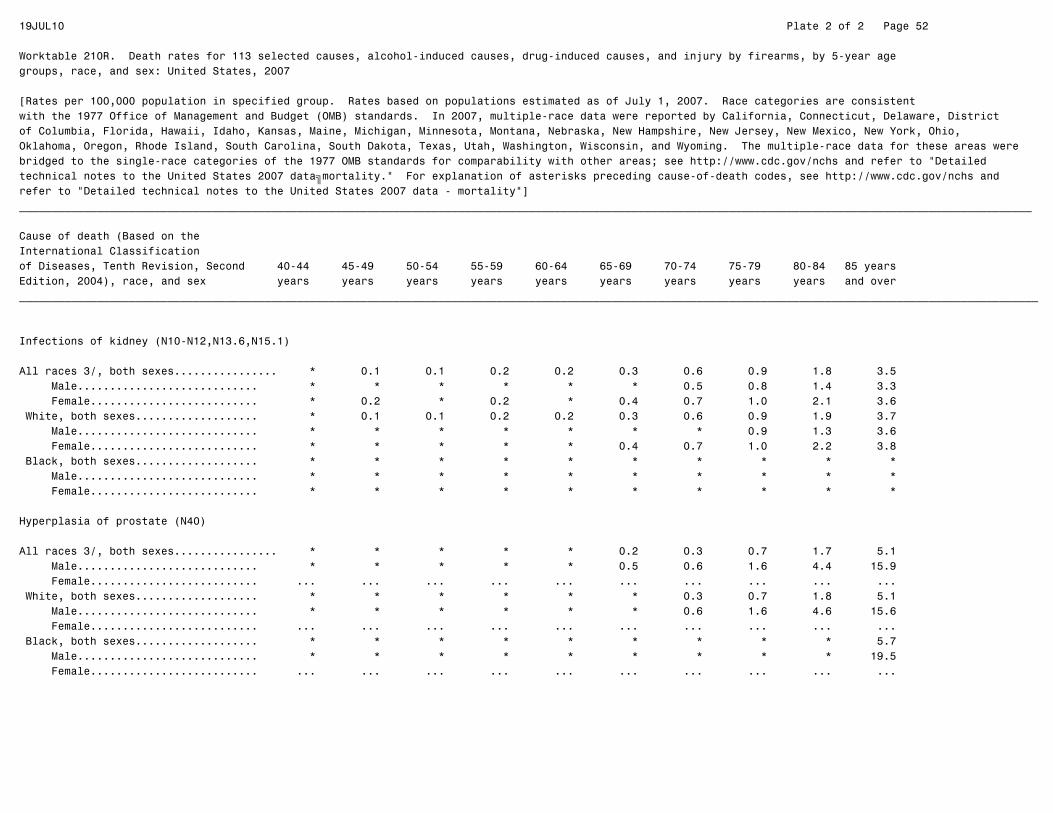
19JUL10 Plate 2 of 2 Page 52
Worktable 210R. Death rates for 113 selected causes, alcohol-induced causes, drug-induced causes, and injury by firearms, by 5-year agegroups, race, and sex: United States, 2007
[Rates per 100,000 population in specified group. Rates based on populations estimated as of July 1, 2007. Race categories are consistentwith the 1977 Office of Management and Budget (OMB) standards. In 2007, multiple-race data were reported by California, Connecticut, Delaware, Districtof Columbia, Florida, Hawaii, Idaho, Kansas, Maine, Michigan, Minnesota, Montana, Nebraska, New Hampshire, New Jersey, New Mexico, New York, Ohio,Oklahoma, Oregon, Rhode Island, South Carolina, South Dakota, Texas, Utah, Washington, Wisconsin, and Wyoming. The multiple-race data for these areas werebridged to the single-race categories of the 1977 OMB standards for comparability with other areas; see http://www.cdc.gov/nchs and refer to "Detailedtechnical notes to the United States 2007 data—mortality." For explanation of asterisks preceding cause-of-death codes, see http://www.cdc.gov/nchs andrefer to "Detailed technical notes to the United States 2007 data - mortality"]_____________________________________________________________________________________________________________________________________________________________
Cause of death (Based on theInternational Classificationof Diseases, Tenth Revision, Second 40-44 45-49 50-54 55-59 60-64 65-69 70-74 75-79 80-84 85 yearsEdition, 2004), race, and sex years years years years years years years years years and over______________________________________________________________________________________________________________________________________________________________
Infections of kidney (N10-N12,N13.6,N15.1)
All races 3/, both sexes................ * 0.1 0.1 0.2 0.2 0.3 0.6 0.9 1.8 3.5 Male............................ * * * * * * 0.5 0.8 1.4 3.3 Female.......................... * 0.2 * 0.2 * 0.4 0.7 1.0 2.1 3.6 White, both sexes................... * 0.1 0.1 0.2 0.2 0.3 0.6 0.9 1.9 3.7 Male............................ * * * * * * * 0.9 1.3 3.6 Female.......................... * * * * * 0.4 0.7 1.0 2.2 3.8 Black, both sexes................... * * * * * * * * * * Male............................ * * * * * * * * * * Female.......................... * * * * * * * * * *
Hyperplasia of prostate (N40)
All races 3/, both sexes................ * * * * * 0.2 0.3 0.7 1.7 5.1 Male............................ * * * * * 0.5 0.6 1.6 4.4 15.9 Female.......................... ... ... ... ... ... ... ... ... ... ... White, both sexes................... * * * * * * 0.3 0.7 1.8 5.1 Male............................ * * * * * * 0.6 1.6 4.6 15.6 Female.......................... ... ... ... ... ... ... ... ... ... ... Black, both sexes................... * * * * * * * * * 5.7 Male............................ * * * * * * * * * 19.5 Female.......................... ... ... ... ... ... ... ... ... ... ...
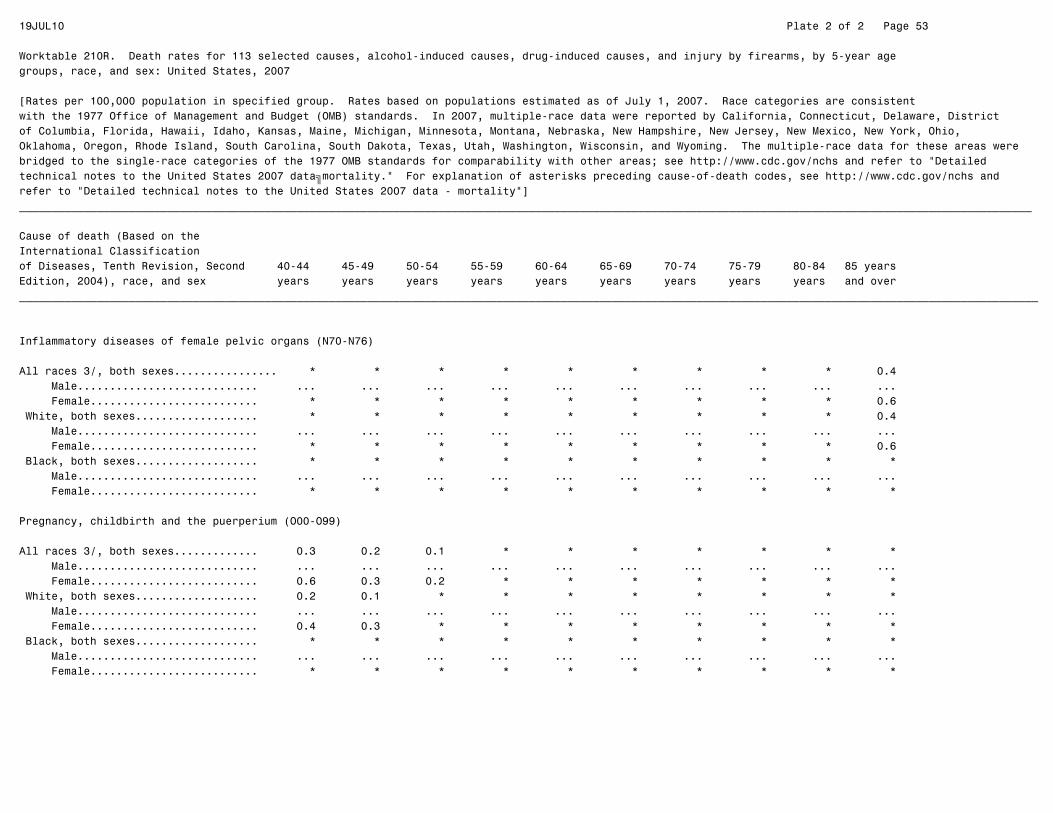
19JUL10 Plate 2 of 2 Page 53
Worktable 210R. Death rates for 113 selected causes, alcohol-induced causes, drug-induced causes, and injury by firearms, by 5-year agegroups, race, and sex: United States, 2007
[Rates per 100,000 population in specified group. Rates based on populations estimated as of July 1, 2007. Race categories are consistentwith the 1977 Office of Management and Budget (OMB) standards. In 2007, multiple-race data were reported by California, Connecticut, Delaware, Districtof Columbia, Florida, Hawaii, Idaho, Kansas, Maine, Michigan, Minnesota, Montana, Nebraska, New Hampshire, New Jersey, New Mexico, New York, Ohio,Oklahoma, Oregon, Rhode Island, South Carolina, South Dakota, Texas, Utah, Washington, Wisconsin, and Wyoming. The multiple-race data for these areas werebridged to the single-race categories of the 1977 OMB standards for comparability with other areas; see http://www.cdc.gov/nchs and refer to "Detailedtechnical notes to the United States 2007 data—mortality." For explanation of asterisks preceding cause-of-death codes, see http://www.cdc.gov/nchs andrefer to "Detailed technical notes to the United States 2007 data - mortality"]_____________________________________________________________________________________________________________________________________________________________
Cause of death (Based on theInternational Classificationof Diseases, Tenth Revision, Second 40-44 45-49 50-54 55-59 60-64 65-69 70-74 75-79 80-84 85 yearsEdition, 2004), race, and sex years years years years years years years years years and over______________________________________________________________________________________________________________________________________________________________
Inflammatory diseases of female pelvic organs (N70-N76)
All races 3/, both sexes................ * * * * * * * * * 0.4 Male............................ ... ... ... ... ... ... ... ... ... ... Female.......................... * * * * * * * * * 0.6 White, both sexes................... * * * * * * * * * 0.4 Male............................ ... ... ... ... ... ... ... ... ... ... Female.......................... * * * * * * * * * 0.6 Black, both sexes................... * * * * * * * * * * Male............................ ... ... ... ... ... ... ... ... ... ... Female.......................... * * * * * * * * * *
Pregnancy, childbirth and the puerperium (O00-O99)
All races 3/, both sexes............. 0.3 0.2 0.1 * * * * * * * Male............................ ... ... ... ... ... ... ... ... ... ... Female.......................... 0.6 0.3 0.2 * * * * * * * White, both sexes................... 0.2 0.1 * * * * * * * * Male............................ ... ... ... ... ... ... ... ... ... ... Female.......................... 0.4 0.3 * * * * * * * * Black, both sexes................... * * * * * * * * * * Male............................ ... ... ... ... ... ... ... ... ... ... Female.......................... * * * * * * * * * *

19JUL10 Plate 2 of 2 Page 54
Worktable 210R. Death rates for 113 selected causes, alcohol-induced causes, drug-induced causes, and injury by firearms, by 5-year agegroups, race, and sex: United States, 2007
[Rates per 100,000 population in specified group. Rates based on populations estimated as of July 1, 2007. Race categories are consistentwith the 1977 Office of Management and Budget (OMB) standards. In 2007, multiple-race data were reported by California, Connecticut, Delaware, Districtof Columbia, Florida, Hawaii, Idaho, Kansas, Maine, Michigan, Minnesota, Montana, Nebraska, New Hampshire, New Jersey, New Mexico, New York, Ohio,Oklahoma, Oregon, Rhode Island, South Carolina, South Dakota, Texas, Utah, Washington, Wisconsin, and Wyoming. The multiple-race data for these areas werebridged to the single-race categories of the 1977 OMB standards for comparability with other areas; see http://www.cdc.gov/nchs and refer to "Detailedtechnical notes to the United States 2007 data—mortality." For explanation of asterisks preceding cause-of-death codes, see http://www.cdc.gov/nchs andrefer to "Detailed technical notes to the United States 2007 data - mortality"]_____________________________________________________________________________________________________________________________________________________________
Cause of death (Based on theInternational Classificationof Diseases, Tenth Revision, Second 40-44 45-49 50-54 55-59 60-64 65-69 70-74 75-79 80-84 85 yearsEdition, 2004), race, and sex years years years years years years years years years and over______________________________________________________________________________________________________________________________________________________________
Pregnancy with abortive outcome (O00-O07)
All races 3/, both sexes................ * * * * * * * * * * Male............................ ... ... ... ... ... ... ... ... ... ... Female.......................... * * * * * * * * * * White, both sexes................... * * * * * * * * * * Male............................ ... ... ... ... ... ... ... ... ... ... Female.......................... * * * * * * * * * * Black, both sexes................... * * * * * * * * * * Male............................ ... ... ... ... ... ... ... ... ... ... Female.......................... * * * * * * * * * *
Other complications of pregnancy, childbirth and the puerperium (O10-O99)
All races 3/, both sexes............. 0.3 0.1 0.1 * * * * * * * Male............................ ... ... ... ... ... ... ... ... ... ... Female.......................... 0.6 0.3 0.2 * * * * * * * White, both sexes................... 0.2 0.1 * * * * * * * * Male............................ ... ... ... ... ... ... ... ... ... ... Female.......................... 0.4 0.3 * * * * * * * * Black, both sexes................... * * * * * * * * * * Male............................ ... ... ... ... ... ... ... ... ... ... Female.......................... * * * * * * * * * *

19JUL10 Plate 2 of 2 Page 55
Worktable 210R. Death rates for 113 selected causes, alcohol-induced causes, drug-induced causes, and injury by firearms, by 5-year agegroups, race, and sex: United States, 2007
[Rates per 100,000 population in specified group. Rates based on populations estimated as of July 1, 2007. Race categories are consistentwith the 1977 Office of Management and Budget (OMB) standards. In 2007, multiple-race data were reported by California, Connecticut, Delaware, Districtof Columbia, Florida, Hawaii, Idaho, Kansas, Maine, Michigan, Minnesota, Montana, Nebraska, New Hampshire, New Jersey, New Mexico, New York, Ohio,Oklahoma, Oregon, Rhode Island, South Carolina, South Dakota, Texas, Utah, Washington, Wisconsin, and Wyoming. The multiple-race data for these areas werebridged to the single-race categories of the 1977 OMB standards for comparability with other areas; see http://www.cdc.gov/nchs and refer to "Detailedtechnical notes to the United States 2007 data—mortality." For explanation of asterisks preceding cause-of-death codes, see http://www.cdc.gov/nchs andrefer to "Detailed technical notes to the United States 2007 data - mortality"]_____________________________________________________________________________________________________________________________________________________________
Cause of death (Based on theInternational Classificationof Diseases, Tenth Revision, Second 40-44 45-49 50-54 55-59 60-64 65-69 70-74 75-79 80-84 85 yearsEdition, 2004), race, and sex years years years years years years years years years and over______________________________________________________________________________________________________________________________________________________________
Certain conditions originating in the perinatal period (P00-P96)
All races 3/, both sexes................ * * * * * * * * * * Male............................ * * * * * * * * * * Female.......................... * * * * * * * * * * White, both sexes................... * * * * * * * * * * Male............................ * * * * * * * * * * Female.......................... * * * * * * * * * * Black, both sexes................... * * * * * * * * * * Male............................ * * * * * * * * * * Female.......................... * * * * * * * * * *
Congenital malformations, deformations and chromosomal abnormalities (Q00-Q99)
All races 3/, both sexes............. 1.3 1.4 1.7 2.1 2.2 1.8 1.7 2.6 3.8 4.8 Male............................ 1.3 1.6 1.7 2.4 2.4 2.0 1.8 3.0 3.8 5.0 Female.......................... 1.3 1.2 1.8 1.8 1.9 1.7 1.7 2.2 3.9 4.7 White, both sexes................... 1.3 1.4 1.8 2.2 2.3 1.8 1.7 2.7 3.8 4.9 Male............................ 1.3 1.6 1.8 2.5 2.6 2.0 1.8 3.1 3.8 5.1 Female.......................... 1.3 1.2 1.8 1.9 2.0 1.6 1.6 2.3 3.8 4.8 Black, both sexes................... 1.2 1.4 1.7 2.1 * * * * 4.9 * Male............................ * 1.9 * 2.7 * * * * * * Female.......................... * * 1.9 * * * * * * *

19JUL10 Plate 2 of 2 Page 56
Worktable 210R. Death rates for 113 selected causes, alcohol-induced causes, drug-induced causes, and injury by firearms, by 5-year agegroups, race, and sex: United States, 2007
[Rates per 100,000 population in specified group. Rates based on populations estimated as of July 1, 2007. Race categories are consistentwith the 1977 Office of Management and Budget (OMB) standards. In 2007, multiple-race data were reported by California, Connecticut, Delaware, Districtof Columbia, Florida, Hawaii, Idaho, Kansas, Maine, Michigan, Minnesota, Montana, Nebraska, New Hampshire, New Jersey, New Mexico, New York, Ohio,Oklahoma, Oregon, Rhode Island, South Carolina, South Dakota, Texas, Utah, Washington, Wisconsin, and Wyoming. The multiple-race data for these areas werebridged to the single-race categories of the 1977 OMB standards for comparability with other areas; see http://www.cdc.gov/nchs and refer to "Detailedtechnical notes to the United States 2007 data—mortality." For explanation of asterisks preceding cause-of-death codes, see http://www.cdc.gov/nchs andrefer to "Detailed technical notes to the United States 2007 data - mortality"]_____________________________________________________________________________________________________________________________________________________________
Cause of death (Based on theInternational Classificationof Diseases, Tenth Revision, Second 40-44 45-49 50-54 55-59 60-64 65-69 70-74 75-79 80-84 85 yearsEdition, 2004), race, and sex years years years years years years years years years and over______________________________________________________________________________________________________________________________________________________________
Symptoms, signs and abnormal clinical and laboratory findings, not elsewhere classified (R00-R99)
All races 3/, both sexes............. 3.8 4.6 5.5 6.4 7.4 10.0 16.6 30.4 63.2 251.4 Male............................ 4.8 5.8 7.0 8.3 9.6 12.0 20.0 33.2 63.6 197.6 Female.......................... 2.7 3.4 4.0 4.6 5.4 8.2 13.8 28.4 63.0 277.0 White, both sexes................... 3.6 4.2 5.0 5.9 7.0 9.3 16.3 30.2 63.2 256.8 Male............................ 4.7 5.2 6.2 7.6 9.1 11.2 19.6 32.6 63.7 201.3 Female.......................... 2.6 3.1 3.7 4.4 5.0 7.7 13.5 28.3 62.8 283.4 Black, both sexes................... 6.0 8.4 10.4 11.0 12.9 17.8 24.4 42.1 80.1 239.9 Male............................ 7.6 10.7 14.2 16.2 17.6 23.8 32.3 51.3 82.4 182.7 Female.......................... 4.5 6.3 7.1 6.7 9.2 13.3 19.0 36.6 78.9 263.7
All other diseases (Residual) (D65-E07,E15-E34,E65-F99,G04-G12,G23-G25,G31-H93,K00-K22,K29-K31,K50-K66,K71-K72,K75-K76,K83-M99,N13.0-N13.5, N13.7-N13.9,N14,N15.0,N15.8-N15.9,N20-N23,N28-N39,N41-N64,N80-N98)
All races 3/, both sexes............. 20.0 30.8 45.0 60.5 82.0 118.8 186.8 337.6 639.2 1,701.9 Male............................ 23.0 36.8 54.7 71.3 92.6 131.3 201.0 351.0 649.0 1,449.1 Female.......................... 17.1 25.0 35.7 50.3 72.2 107.8 175.3 327.7 633.0 1,822.1 White, both sexes................... 18.5 29.2 42.3 57.8 79.2 115.8 184.9 336.8 646.2 1,736.2 Male............................ 21.7 35.5 51.7 68.0 89.1 127.1 197.2 347.3 654.4 1,479.5 Female.......................... 15.2 22.8 33.1 48.0 69.9 105.8 174.6 328.9 641.0 1,858.7 Black, both sexes................... 34.8 49.3 75.0 97.7 127.4 172.4 245.7 423.0 699.6 1,629.2 Male............................ 37.3 55.3 90.5 119.2 153.2 208.8 286.2 482.1 753.4 1,363.2 Female.......................... 32.6 44.1 61.8 80.0 107.3 145.6 217.9 387.5 671.3 1,739.9

19JUL10 Plate 2 of 2 Page 57
Worktable 210R. Death rates for 113 selected causes, alcohol-induced causes, drug-induced causes, and injury by firearms, by 5-year agegroups, race, and sex: United States, 2007
[Rates per 100,000 population in specified group. Rates based on populations estimated as of July 1, 2007. Race categories are consistentwith the 1977 Office of Management and Budget (OMB) standards. In 2007, multiple-race data were reported by California, Connecticut, Delaware, Districtof Columbia, Florida, Hawaii, Idaho, Kansas, Maine, Michigan, Minnesota, Montana, Nebraska, New Hampshire, New Jersey, New Mexico, New York, Ohio,Oklahoma, Oregon, Rhode Island, South Carolina, South Dakota, Texas, Utah, Washington, Wisconsin, and Wyoming. The multiple-race data for these areas werebridged to the single-race categories of the 1977 OMB standards for comparability with other areas; see http://www.cdc.gov/nchs and refer to "Detailedtechnical notes to the United States 2007 data—mortality." For explanation of asterisks preceding cause-of-death codes, see http://www.cdc.gov/nchs andrefer to "Detailed technical notes to the United States 2007 data - mortality"]_____________________________________________________________________________________________________________________________________________________________
Cause of death (Based on theInternational Classificationof Diseases, Tenth Revision, Second 40-44 45-49 50-54 55-59 60-64 65-69 70-74 75-79 80-84 85 yearsEdition, 2004), race, and sex years years years years years years years years years and over______________________________________________________________________________________________________________________________________________________________
Accidents (unintentional injuries) (V01-X59,Y85-Y86)
All races 3/, both sexes............. 41.8 46.9 45.7 38.9 35.2 38.9 53.1 80.8 137.1 286.7 Male............................ 58.7 65.2 64.6 55.9 49.3 54.8 73.5 106.4 179.7 349.0 Female.......................... 25.0 29.0 27.5 23.0 22.3 25.1 36.4 62.0 110.3 257.0 White, both sexes................... 43.9 48.2 46.0 38.5 35.0 38.6 53.6 82.7 143.1 302.0 Male............................ 60.9 66.3 64.1 54.3 48.5 53.3 73.7 107.5 186.6 366.1 Female.......................... 26.7 30.2 28.2 23.2 22.4 25.5 36.9 64.1 115.2 271.4 Black, both sexes................... 39.6 49.2 55.5 50.6 42.9 46.0 53.9 67.9 82.9 154.0 Male............................ 60.8 74.6 85.2 81.6 69.1 76.9 81.0 103.6 110.7 198.0 Female.......................... 20.9 27.2 30.3 25.2 22.4 23.3 35.2 46.4 68.2 135.7
Transport accidents (V01-V99,Y85)
All races 3/, both sexes............. 15.9 16.7 16.1 15.4 14.1 15.2 18.1 21.3 25.0 24.1 Male............................ 23.5 25.1 24.4 23.1 20.5 22.3 26.3 31.5 37.1 41.7 Female.......................... 8.4 8.4 8.2 8.1 8.2 9.0 11.4 13.7 17.3 15.7 White, both sexes................... 16.3 17.0 16.4 15.5 14.2 15.4 18.1 21.6 25.4 24.6 Male............................ 23.8 25.4 24.5 23.1 20.3 22.3 26.2 31.5 37.2 41.9 Female.......................... 8.8 8.6 8.4 8.1 8.4 9.2 11.4 14.2 17.9 16.3 Black, both sexes................... 16.6 17.6 17.6 16.7 15.5 14.8 17.9 18.3 18.9 17.7 Male............................ 27.7 28.6 29.0 27.1 26.1 24.7 29.0 34.1 34.4 39.1 Female.......................... 6.9 8.0 8.0 8.2 7.2 7.4 10.2 8.8 10.7 8.8

19JUL10 Plate 2 of 2 Page 58
Worktable 210R. Death rates for 113 selected causes, alcohol-induced causes, drug-induced causes, and injury by firearms, by 5-year agegroups, race, and sex: United States, 2007
[Rates per 100,000 population in specified group. Rates based on populations estimated as of July 1, 2007. Race categories are consistentwith the 1977 Office of Management and Budget (OMB) standards. In 2007, multiple-race data were reported by California, Connecticut, Delaware, Districtof Columbia, Florida, Hawaii, Idaho, Kansas, Maine, Michigan, Minnesota, Montana, Nebraska, New Hampshire, New Jersey, New Mexico, New York, Ohio,Oklahoma, Oregon, Rhode Island, South Carolina, South Dakota, Texas, Utah, Washington, Wisconsin, and Wyoming. The multiple-race data for these areas werebridged to the single-race categories of the 1977 OMB standards for comparability with other areas; see http://www.cdc.gov/nchs and refer to "Detailedtechnical notes to the United States 2007 data—mortality." For explanation of asterisks preceding cause-of-death codes, see http://www.cdc.gov/nchs andrefer to "Detailed technical notes to the United States 2007 data - mortality"]_____________________________________________________________________________________________________________________________________________________________
Cause of death (Based on theInternational Classificationof Diseases, Tenth Revision, Second 40-44 45-49 50-54 55-59 60-64 65-69 70-74 75-79 80-84 85 yearsEdition, 2004), race, and sex years years years years years years years years years and over______________________________________________________________________________________________________________________________________________________________
Motor vehicle accidents (V02-V04,V09.0,V09.2,V12-V14,V19.0-V19.2,V19.4-V19.6,V20-V79,V80.3-V80.5,V81.0-V81.1,V82.0-V82.1,V83-V86,V87.0-V87.8, V88.0-V88.8,V89.0,V89.2)
All races 3/, both sexes............. 14.8 15.2 14.6 13.8 12.7 14.0 16.7 20.3 23.8 23.2 Male............................ 21.7 22.5 21.8 20.5 18.0 20.1 23.6 29.7 35.0 39.8 Female.......................... 7.9 8.0 7.6 7.6 7.8 8.7 11.0 13.4 16.8 15.2 White, both sexes................... 15.2 15.5 14.7 14.0 12.7 14.2 16.7 20.6 24.3 23.6 Male............................ 21.9 22.9 21.9 20.6 17.8 20.2 23.6 29.7 35.1 40.0 Female.......................... 8.3 8.2 7.7 7.6 7.9 8.8 10.9 13.9 17.4 15.8 Black, both sexes................... 15.6 15.9 16.2 15.1 14.2 13.7 16.4 17.3 17.9 17.5 Male............................ 25.9 25.4 26.3 24.0 23.6 22.7 25.7 31.9 32.4 39.1 Female.......................... 6.5 7.7 7.6 7.9 6.8 7.1 10.0 8.5 10.3 8.5
Other land transport accidents (V01,V05-V06,V09.1,V09.3-V09.9,V10-V11,V15-V18,V19.3,V19.8-V19.9,V80.0-V80.2,V80.6-V80.9,V81.2-V81.9, V82.2-V82.9,V87.9,V88.9,V89.1,V89.3,V89.9)
All races 3/, both sexes............. 0.5 0.5 0.5 0.4 0.4 0.4 0.4 0.4 0.6 * Male............................ 0.7 0.9 0.9 0.7 0.6 0.7 0.8 0.6 0.9 * Female.......................... * 0.2 * * * * * * * * White, both sexes................... 0.4 0.5 0.5 0.4 0.4 0.4 0.4 0.4 0.5 * Male............................ 0.7 0.9 0.9 0.6 0.6 0.7 0.8 * * * Female.......................... * * * * * * * * * * Black, both sexes................... * 0.7 * * * * * * * * Male............................ * * * * * * * * * * Female.......................... * * * * * * * * * *

19JUL10 Plate 2 of 2 Page 59
Worktable 210R. Death rates for 113 selected causes, alcohol-induced causes, drug-induced causes, and injury by firearms, by 5-year agegroups, race, and sex: United States, 2007
[Rates per 100,000 population in specified group. Rates based on populations estimated as of July 1, 2007. Race categories are consistentwith the 1977 Office of Management and Budget (OMB) standards. In 2007, multiple-race data were reported by California, Connecticut, Delaware, Districtof Columbia, Florida, Hawaii, Idaho, Kansas, Maine, Michigan, Minnesota, Montana, Nebraska, New Hampshire, New Jersey, New Mexico, New York, Ohio,Oklahoma, Oregon, Rhode Island, South Carolina, South Dakota, Texas, Utah, Washington, Wisconsin, and Wyoming. The multiple-race data for these areas werebridged to the single-race categories of the 1977 OMB standards for comparability with other areas; see http://www.cdc.gov/nchs and refer to "Detailedtechnical notes to the United States 2007 data—mortality." For explanation of asterisks preceding cause-of-death codes, see http://www.cdc.gov/nchs andrefer to "Detailed technical notes to the United States 2007 data - mortality"]_____________________________________________________________________________________________________________________________________________________________
Cause of death (Based on theInternational Classificationof Diseases, Tenth Revision, Second 40-44 45-49 50-54 55-59 60-64 65-69 70-74 75-79 80-84 85 yearsEdition, 2004), race, and sex years years years years years years years years years and over______________________________________________________________________________________________________________________________________________________________
Water, air and space, and other and unspecified transport accidents and their sequelae (V90-V99,Y85)
All races 3/, both sexes............. 0.7 0.9 1.1 1.1 1.1 0.8 1.0 0.6 0.6 0.6 Male............................ 1.1 1.6 1.7 1.9 1.8 1.5 1.9 1.2 1.2 1.1 Female.......................... 0.3 0.2 0.4 0.4 0.4 * * * * * White, both sexes................... 0.7 1.0 1.1 1.1 1.1 0.8 1.0 0.6 0.6 0.6 Male............................ 1.2 1.7 1.8 1.9 1.9 1.5 1.9 1.2 1.2 1.3 Female.......................... 0.3 0.3 0.5 0.4 0.4 * * * * * Black, both sexes................... * 0.9 * * * * * * * * Male............................ * 1.9 * * * * * * * * Female.......................... * * * * * * * * * *
Nontransport accidents (W00-X59,Y86)
All races 3/, both sexes............. 25.9 30.2 29.5 23.6 21.1 23.7 35.0 59.6 112.1 262.6 Male............................ 35.2 40.1 40.2 32.8 28.8 32.4 47.2 74.8 142.6 307.3 Female.......................... 16.6 20.5 19.4 14.9 14.0 16.0 25.0 48.3 92.9 241.4 White, both sexes................... 27.6 31.2 29.6 23.0 20.9 23.2 35.5 61.1 117.6 277.5 Male............................ 37.1 40.9 39.6 31.2 28.2 31.0 47.4 76.0 149.4 324.1 Female.......................... 17.9 21.6 19.8 15.1 14.0 16.3 25.6 49.9 97.3 255.2 Black, both sexes................... 22.9 31.6 37.9 33.9 27.4 31.3 36.0 49.6 64.0 136.3 Male............................ 33.1 46.0 56.2 54.5 43.0 52.2 52.0 69.5 76.3 158.9 Female.......................... 14.0 19.2 22.4 16.9 15.1 15.8 25.0 37.6 57.6 126.9
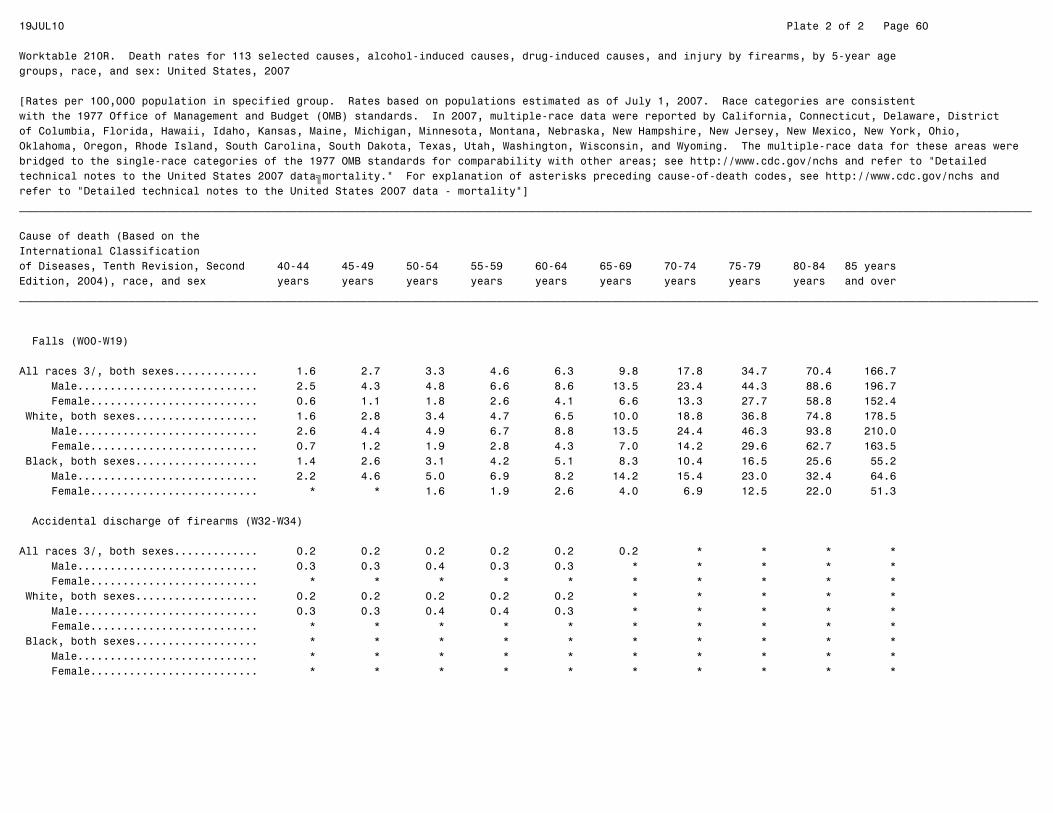
19JUL10 Plate 2 of 2 Page 60
Worktable 210R. Death rates for 113 selected causes, alcohol-induced causes, drug-induced causes, and injury by firearms, by 5-year agegroups, race, and sex: United States, 2007
[Rates per 100,000 population in specified group. Rates based on populations estimated as of July 1, 2007. Race categories are consistentwith the 1977 Office of Management and Budget (OMB) standards. In 2007, multiple-race data were reported by California, Connecticut, Delaware, Districtof Columbia, Florida, Hawaii, Idaho, Kansas, Maine, Michigan, Minnesota, Montana, Nebraska, New Hampshire, New Jersey, New Mexico, New York, Ohio,Oklahoma, Oregon, Rhode Island, South Carolina, South Dakota, Texas, Utah, Washington, Wisconsin, and Wyoming. The multiple-race data for these areas werebridged to the single-race categories of the 1977 OMB standards for comparability with other areas; see http://www.cdc.gov/nchs and refer to "Detailedtechnical notes to the United States 2007 data—mortality." For explanation of asterisks preceding cause-of-death codes, see http://www.cdc.gov/nchs andrefer to "Detailed technical notes to the United States 2007 data - mortality"]_____________________________________________________________________________________________________________________________________________________________
Cause of death (Based on theInternational Classificationof Diseases, Tenth Revision, Second 40-44 45-49 50-54 55-59 60-64 65-69 70-74 75-79 80-84 85 yearsEdition, 2004), race, and sex years years years years years years years years years and over______________________________________________________________________________________________________________________________________________________________
Falls (W00-W19)
All races 3/, both sexes............. 1.6 2.7 3.3 4.6 6.3 9.8 17.8 34.7 70.4 166.7 Male............................ 2.5 4.3 4.8 6.6 8.6 13.5 23.4 44.3 88.6 196.7 Female.......................... 0.6 1.1 1.8 2.6 4.1 6.6 13.3 27.7 58.8 152.4 White, both sexes................... 1.6 2.8 3.4 4.7 6.5 10.0 18.8 36.8 74.8 178.5 Male............................ 2.6 4.4 4.9 6.7 8.8 13.5 24.4 46.3 93.8 210.0 Female.......................... 0.7 1.2 1.9 2.8 4.3 7.0 14.2 29.6 62.7 163.5 Black, both sexes................... 1.4 2.6 3.1 4.2 5.1 8.3 10.4 16.5 25.6 55.2 Male............................ 2.2 4.6 5.0 6.9 8.2 14.2 15.4 23.0 32.4 64.6 Female.......................... * * 1.6 1.9 2.6 4.0 6.9 12.5 22.0 51.3
Accidental discharge of firearms (W32-W34)
All races 3/, both sexes............. 0.2 0.2 0.2 0.2 0.2 0.2 * * * * Male............................ 0.3 0.3 0.4 0.3 0.3 * * * * * Female.......................... * * * * * * * * * * White, both sexes................... 0.2 0.2 0.2 0.2 0.2 * * * * * Male............................ 0.3 0.3 0.4 0.4 0.3 * * * * * Female.......................... * * * * * * * * * * Black, both sexes................... * * * * * * * * * * Male............................ * * * * * * * * * * Female.......................... * * * * * * * * * *

19JUL10 Plate 2 of 2 Page 61
Worktable 210R. Death rates for 113 selected causes, alcohol-induced causes, drug-induced causes, and injury by firearms, by 5-year agegroups, race, and sex: United States, 2007
[Rates per 100,000 population in specified group. Rates based on populations estimated as of July 1, 2007. Race categories are consistentwith the 1977 Office of Management and Budget (OMB) standards. In 2007, multiple-race data were reported by California, Connecticut, Delaware, Districtof Columbia, Florida, Hawaii, Idaho, Kansas, Maine, Michigan, Minnesota, Montana, Nebraska, New Hampshire, New Jersey, New Mexico, New York, Ohio,Oklahoma, Oregon, Rhode Island, South Carolina, South Dakota, Texas, Utah, Washington, Wisconsin, and Wyoming. The multiple-race data for these areas werebridged to the single-race categories of the 1977 OMB standards for comparability with other areas; see http://www.cdc.gov/nchs and refer to "Detailedtechnical notes to the United States 2007 data—mortality." For explanation of asterisks preceding cause-of-death codes, see http://www.cdc.gov/nchs andrefer to "Detailed technical notes to the United States 2007 data - mortality"]_____________________________________________________________________________________________________________________________________________________________
Cause of death (Based on theInternational Classificationof Diseases, Tenth Revision, Second 40-44 45-49 50-54 55-59 60-64 65-69 70-74 75-79 80-84 85 yearsEdition, 2004), race, and sex years years years years years years years years years and over______________________________________________________________________________________________________________________________________________________________
Accidental drowning and submersion (W65-W74)
All races 3/, both sexes............. 1.1 1.1 1.1 0.9 1.1 0.9 1.1 1.4 1.4 1.6 Male............................ 1.7 1.7 1.8 1.4 1.9 1.5 1.9 2.1 2.4 3.0 Female.......................... 0.5 0.4 0.4 0.4 0.4 0.5 0.4 0.9 0.8 0.9 White, both sexes................... 1.1 1.1 1.2 0.9 1.1 0.9 1.0 1.4 1.5 1.6 Male............................ 1.7 1.7 1.9 1.3 1.8 1.5 1.8 2.0 2.6 3.2 Female.......................... 0.5 0.4 0.5 0.4 0.5 * * 0.9 0.8 0.9 Black, both sexes................... 0.8 1.0 1.0 1.0 * * * * * * Male............................ * 2.0 * * * * * * * * Female.......................... * * * * * * * * * *
Accidental exposure to smoke, fire and flames (X00-X09)
All races 3/, both sexes............. 0.9 1.0 1.2 1.3 1.7 2.0 2.4 2.7 4.1 4.9 Male............................ 1.2 1.3 1.6 1.9 2.4 2.7 3.0 3.2 5.1 6.5 Female.......................... 0.5 0.8 0.9 0.8 1.1 1.4 1.8 2.4 3.5 4.2 White, both sexes................... 0.8 0.9 1.2 1.2 1.6 1.8 2.1 2.4 3.8 4.1 Male............................ 1.0 1.1 1.5 1.7 2.2 2.3 2.6 2.9 4.6 5.3 Female.......................... 0.5 0.7 0.8 0.8 1.1 1.4 1.7 2.0 3.3 3.5 Black, both sexes................... 1.6 1.8 2.0 2.7 2.7 4.4 5.7 7.2 8.8 15.5 Male............................ 2.4 2.6 2.7 4.3 4.3 8.0 7.9 8.9 * 22.9 Female.......................... * * * * * * 4.2 6.1 7.1 12.4

19JUL10 Plate 2 of 2 Page 62
Worktable 210R. Death rates for 113 selected causes, alcohol-induced causes, drug-induced causes, and injury by firearms, by 5-year agegroups, race, and sex: United States, 2007
[Rates per 100,000 population in specified group. Rates based on populations estimated as of July 1, 2007. Race categories are consistentwith the 1977 Office of Management and Budget (OMB) standards. In 2007, multiple-race data were reported by California, Connecticut, Delaware, Districtof Columbia, Florida, Hawaii, Idaho, Kansas, Maine, Michigan, Minnesota, Montana, Nebraska, New Hampshire, New Jersey, New Mexico, New York, Ohio,Oklahoma, Oregon, Rhode Island, South Carolina, South Dakota, Texas, Utah, Washington, Wisconsin, and Wyoming. The multiple-race data for these areas werebridged to the single-race categories of the 1977 OMB standards for comparability with other areas; see http://www.cdc.gov/nchs and refer to "Detailedtechnical notes to the United States 2007 data—mortality." For explanation of asterisks preceding cause-of-death codes, see http://www.cdc.gov/nchs andrefer to "Detailed technical notes to the United States 2007 data - mortality"]_____________________________________________________________________________________________________________________________________________________________
Cause of death (Based on theInternational Classificationof Diseases, Tenth Revision, Second 40-44 45-49 50-54 55-59 60-64 65-69 70-74 75-79 80-84 85 yearsEdition, 2004), race, and sex years years years years years years years years years and over______________________________________________________________________________________________________________________________________________________________
Accidental poisoning and exposure to noxious substances (X40-X49)
All races 3/, both sexes............. 19.2 21.6 19.4 12.1 6.4 3.5 2.7 2.6 2.9 3.5 Male............................ 24.8 26.7 24.5 15.6 7.6 4.4 3.4 2.4 3.5 3.7 Female.......................... 13.8 16.6 14.5 8.7 5.3 2.6 2.1 2.7 2.5 3.4 White, both sexes................... 21.0 22.6 19.4 11.5 6.2 3.3 2.6 2.6 2.9 3.6 Male............................ 26.9 27.6 24.0 14.3 7.0 3.9 3.3 2.4 3.6 3.9 Female.......................... 15.0 17.6 14.9 8.9 5.4 2.8 2.1 2.8 2.5 3.4 Black, both sexes................... 15.2 21.5 25.9 19.5 10.4 6.2 3.9 3.5 * * Male............................ 19.9 29.1 37.1 31.3 16.3 11.2 6.0 * * * Female.......................... 11.1 14.9 16.4 9.8 5.7 * * * * *
Other and unspecified nontransport accidents and their sequelae (W20-W31,W35-W64,W75-W99,X10-X39,X50-X59,Y86)
All races 3/, both sexes............. 2.9 3.7 4.3 4.6 5.5 7.2 10.9 17.9 33.1 85.8 Male............................ 4.8 5.9 7.1 7.0 8.1 10.0 15.3 22.3 42.3 97.1 Female.......................... 1.1 1.6 1.7 2.3 3.1 4.8 7.3 14.6 27.3 80.4 White, both sexes................... 2.9 3.6 4.2 4.5 5.3 7.0 10.8 17.7 34.3 89.5 Male............................ 4.5 5.8 6.9 6.9 7.9 9.6 15.2 21.9 44.2 101.4 Female.......................... 1.2 1.5 1.7 2.1 2.8 4.7 7.1 14.5 28.0 83.8 Black, both sexes................... 3.8 4.6 5.8 6.4 8.1 11.2 14.7 21.5 26.8 60.9 Male............................ 6.8 7.6 9.6 9.7 12.0 16.9 19.9 31.4 29.0 67.1 Female.......................... * 2.0 2.6 3.8 5.0 6.9 11.0 15.5 25.6 58.3

19JUL10 Plate 2 of 2 Page 63
Worktable 210R. Death rates for 113 selected causes, alcohol-induced causes, drug-induced causes, and injury by firearms, by 5-year agegroups, race, and sex: United States, 2007
[Rates per 100,000 population in specified group. Rates based on populations estimated as of July 1, 2007. Race categories are consistentwith the 1977 Office of Management and Budget (OMB) standards. In 2007, multiple-race data were reported by California, Connecticut, Delaware, Districtof Columbia, Florida, Hawaii, Idaho, Kansas, Maine, Michigan, Minnesota, Montana, Nebraska, New Hampshire, New Jersey, New Mexico, New York, Ohio,Oklahoma, Oregon, Rhode Island, South Carolina, South Dakota, Texas, Utah, Washington, Wisconsin, and Wyoming. The multiple-race data for these areas werebridged to the single-race categories of the 1977 OMB standards for comparability with other areas; see http://www.cdc.gov/nchs and refer to "Detailedtechnical notes to the United States 2007 data—mortality." For explanation of asterisks preceding cause-of-death codes, see http://www.cdc.gov/nchs andrefer to "Detailed technical notes to the United States 2007 data - mortality"]_____________________________________________________________________________________________________________________________________________________________
Cause of death (Based on theInternational Classificationof Diseases, Tenth Revision, Second 40-44 45-49 50-54 55-59 60-64 65-69 70-74 75-79 80-84 85 yearsEdition, 2004), race, and sex years years years years years years years years years and over______________________________________________________________________________________________________________________________________________________________
Intentional self-harm (suicide) (*U03,X60-X84,Y87.0)
All races 3/, both sexes............. 16.8 17.7 17.7 16.2 14.6 12.9 12.3 16.4 16.1 15.6 Male............................ 25.5 26.9 27.0 25.0 23.3 22.4 22.7 33.2 35.9 41.8 Female.......................... 8.2 8.7 8.8 8.0 6.5 4.5 3.9 4.1 3.6 3.1 White, both sexes................... 19.0 20.2 20.0 18.3 16.0 14.2 13.6 17.7 17.3 16.9 Male............................ 28.5 30.4 30.1 27.9 25.5 24.5 24.8 35.6 38.7 45.4 Female.......................... 9.4 10.0 10.1 9.2 7.2 5.1 4.2 4.2 3.7 3.3 Black, both sexes................... 6.9 6.2 5.9 5.1 4.1 3.9 3.8 5.7 * * Male............................ 11.6 10.2 9.7 9.0 7.4 8.2 8.5 12.8 * * Female.......................... 2.8 2.6 2.7 1.8 * * * * * *
Intentional self-harm (suicide) by discharge of firearms (X72-X74)
All races 3/, both sexes............. 7.3 7.7 8.4 8.5 8.5 8.8 8.8 12.5 11.8 11.0 Male............................ 12.0 12.9 14.7 15.0 15.4 16.8 18.0 27.5 28.5 32.9 Female.......................... 2.6 2.6 2.4 2.3 2.3 1.7 1.4 1.5 1.2 0.6 White, both sexes................... 8.4 8.9 9.6 9.7 9.5 9.8 9.9 13.7 12.9 12.1 Male............................ 13.7 14.8 16.5 16.9 16.9 18.6 19.9 29.8 31.0 36.3 Female.......................... 3.1 3.0 2.8 2.7 2.6 2.0 1.5 1.6 1.3 0.6 Black, both sexes................... 2.7 2.5 2.8 2.4 2.6 2.5 2.5 4.5 * * Male............................ 5.0 4.5 5.1 4.8 5.3 5.7 * 10.6 * * Female.......................... * * * * * * * * * *
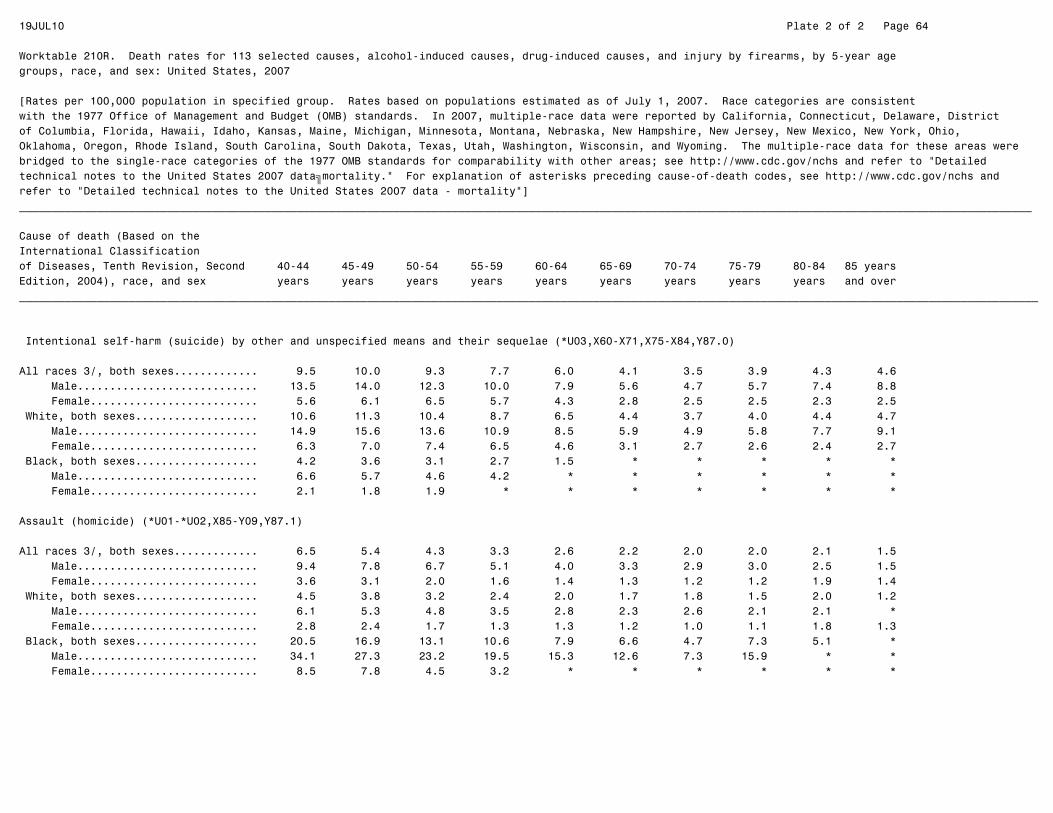
19JUL10 Plate 2 of 2 Page 64
Worktable 210R. Death rates for 113 selected causes, alcohol-induced causes, drug-induced causes, and injury by firearms, by 5-year agegroups, race, and sex: United States, 2007
[Rates per 100,000 population in specified group. Rates based on populations estimated as of July 1, 2007. Race categories are consistentwith the 1977 Office of Management and Budget (OMB) standards. In 2007, multiple-race data were reported by California, Connecticut, Delaware, Districtof Columbia, Florida, Hawaii, Idaho, Kansas, Maine, Michigan, Minnesota, Montana, Nebraska, New Hampshire, New Jersey, New Mexico, New York, Ohio,Oklahoma, Oregon, Rhode Island, South Carolina, South Dakota, Texas, Utah, Washington, Wisconsin, and Wyoming. The multiple-race data for these areas werebridged to the single-race categories of the 1977 OMB standards for comparability with other areas; see http://www.cdc.gov/nchs and refer to "Detailedtechnical notes to the United States 2007 data—mortality." For explanation of asterisks preceding cause-of-death codes, see http://www.cdc.gov/nchs andrefer to "Detailed technical notes to the United States 2007 data - mortality"]_____________________________________________________________________________________________________________________________________________________________
Cause of death (Based on theInternational Classificationof Diseases, Tenth Revision, Second 40-44 45-49 50-54 55-59 60-64 65-69 70-74 75-79 80-84 85 yearsEdition, 2004), race, and sex years years years years years years years years years and over______________________________________________________________________________________________________________________________________________________________
Intentional self-harm (suicide) by other and unspecified means and their sequelae (*U03,X60-X71,X75-X84,Y87.0)
All races 3/, both sexes............. 9.5 10.0 9.3 7.7 6.0 4.1 3.5 3.9 4.3 4.6 Male............................ 13.5 14.0 12.3 10.0 7.9 5.6 4.7 5.7 7.4 8.8 Female.......................... 5.6 6.1 6.5 5.7 4.3 2.8 2.5 2.5 2.3 2.5 White, both sexes................... 10.6 11.3 10.4 8.7 6.5 4.4 3.7 4.0 4.4 4.7 Male............................ 14.9 15.6 13.6 10.9 8.5 5.9 4.9 5.8 7.7 9.1 Female.......................... 6.3 7.0 7.4 6.5 4.6 3.1 2.7 2.6 2.4 2.7 Black, both sexes................... 4.2 3.6 3.1 2.7 1.5 * * * * * Male............................ 6.6 5.7 4.6 4.2 * * * * * * Female.......................... 2.1 1.8 1.9 * * * * * * *
Assault (homicide) (*U01-*U02,X85-Y09,Y87.1)
All races 3/, both sexes............. 6.5 5.4 4.3 3.3 2.6 2.2 2.0 2.0 2.1 1.5 Male............................ 9.4 7.8 6.7 5.1 4.0 3.3 2.9 3.0 2.5 1.5 Female.......................... 3.6 3.1 2.0 1.6 1.4 1.3 1.2 1.2 1.9 1.4 White, both sexes................... 4.5 3.8 3.2 2.4 2.0 1.7 1.8 1.5 2.0 1.2 Male............................ 6.1 5.3 4.8 3.5 2.8 2.3 2.6 2.1 2.1 * Female.......................... 2.8 2.4 1.7 1.3 1.3 1.2 1.0 1.1 1.8 1.3 Black, both sexes................... 20.5 16.9 13.1 10.6 7.9 6.6 4.7 7.3 5.1 * Male............................ 34.1 27.3 23.2 19.5 15.3 12.6 7.3 15.9 * * Female.......................... 8.5 7.8 4.5 3.2 * * * * * *
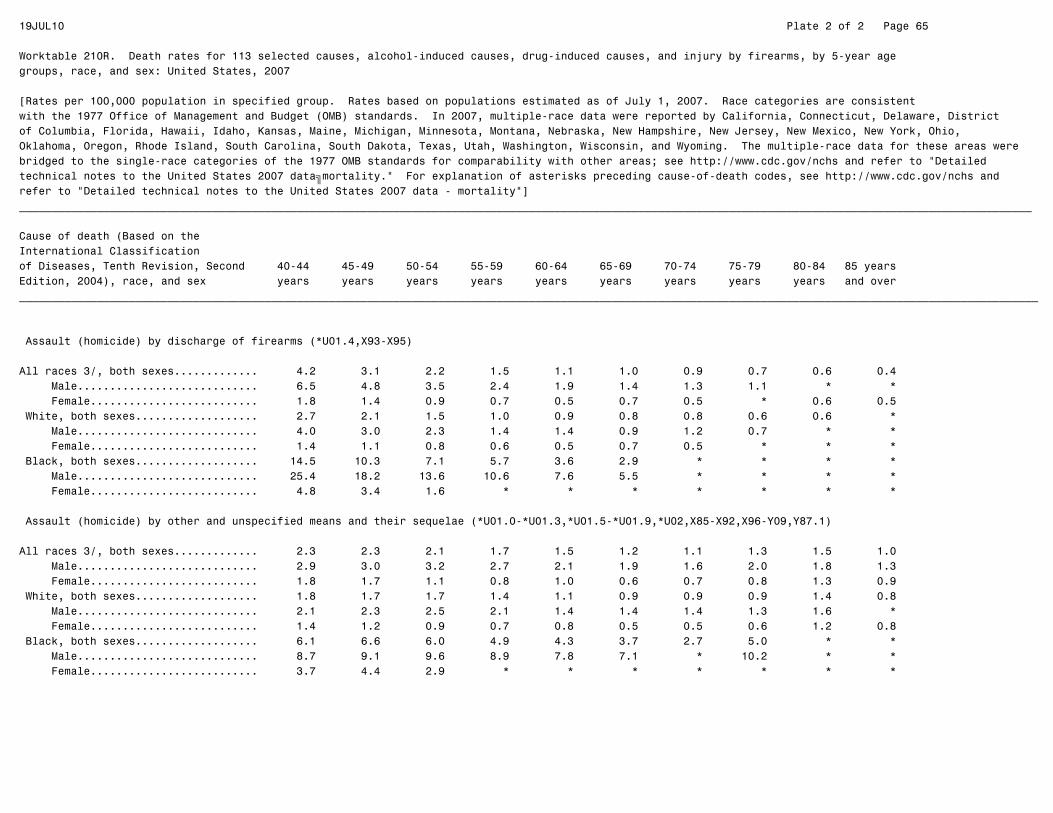
19JUL10 Plate 2 of 2 Page 65
Worktable 210R. Death rates for 113 selected causes, alcohol-induced causes, drug-induced causes, and injury by firearms, by 5-year agegroups, race, and sex: United States, 2007
[Rates per 100,000 population in specified group. Rates based on populations estimated as of July 1, 2007. Race categories are consistentwith the 1977 Office of Management and Budget (OMB) standards. In 2007, multiple-race data were reported by California, Connecticut, Delaware, Districtof Columbia, Florida, Hawaii, Idaho, Kansas, Maine, Michigan, Minnesota, Montana, Nebraska, New Hampshire, New Jersey, New Mexico, New York, Ohio,Oklahoma, Oregon, Rhode Island, South Carolina, South Dakota, Texas, Utah, Washington, Wisconsin, and Wyoming. The multiple-race data for these areas werebridged to the single-race categories of the 1977 OMB standards for comparability with other areas; see http://www.cdc.gov/nchs and refer to "Detailedtechnical notes to the United States 2007 data—mortality." For explanation of asterisks preceding cause-of-death codes, see http://www.cdc.gov/nchs andrefer to "Detailed technical notes to the United States 2007 data - mortality"]_____________________________________________________________________________________________________________________________________________________________
Cause of death (Based on theInternational Classificationof Diseases, Tenth Revision, Second 40-44 45-49 50-54 55-59 60-64 65-69 70-74 75-79 80-84 85 yearsEdition, 2004), race, and sex years years years years years years years years years and over______________________________________________________________________________________________________________________________________________________________
Assault (homicide) by discharge of firearms (*U01.4,X93-X95)
All races 3/, both sexes............. 4.2 3.1 2.2 1.5 1.1 1.0 0.9 0.7 0.6 0.4 Male............................ 6.5 4.8 3.5 2.4 1.9 1.4 1.3 1.1 * * Female.......................... 1.8 1.4 0.9 0.7 0.5 0.7 0.5 * 0.6 0.5 White, both sexes................... 2.7 2.1 1.5 1.0 0.9 0.8 0.8 0.6 0.6 * Male............................ 4.0 3.0 2.3 1.4 1.4 0.9 1.2 0.7 * * Female.......................... 1.4 1.1 0.8 0.6 0.5 0.7 0.5 * * * Black, both sexes................... 14.5 10.3 7.1 5.7 3.6 2.9 * * * * Male............................ 25.4 18.2 13.6 10.6 7.6 5.5 * * * * Female.......................... 4.8 3.4 1.6 * * * * * * *
Assault (homicide) by other and unspecified means and their sequelae (*U01.0-*U01.3,*U01.5-*U01.9,*U02,X85-X92,X96-Y09,Y87.1)
All races 3/, both sexes............. 2.3 2.3 2.1 1.7 1.5 1.2 1.1 1.3 1.5 1.0 Male............................ 2.9 3.0 3.2 2.7 2.1 1.9 1.6 2.0 1.8 1.3 Female.......................... 1.8 1.7 1.1 0.8 1.0 0.6 0.7 0.8 1.3 0.9 White, both sexes................... 1.8 1.7 1.7 1.4 1.1 0.9 0.9 0.9 1.4 0.8 Male............................ 2.1 2.3 2.5 2.1 1.4 1.4 1.4 1.3 1.6 * Female.......................... 1.4 1.2 0.9 0.7 0.8 0.5 0.5 0.6 1.2 0.8 Black, both sexes................... 6.1 6.6 6.0 4.9 4.3 3.7 2.7 5.0 * * Male............................ 8.7 9.1 9.6 8.9 7.8 7.1 * 10.2 * * Female.......................... 3.7 4.4 2.9 * * * * * * *

19JUL10 Plate 2 of 2 Page 66
Worktable 210R. Death rates for 113 selected causes, alcohol-induced causes, drug-induced causes, and injury by firearms, by 5-year agegroups, race, and sex: United States, 2007
[Rates per 100,000 population in specified group. Rates based on populations estimated as of July 1, 2007. Race categories are consistentwith the 1977 Office of Management and Budget (OMB) standards. In 2007, multiple-race data were reported by California, Connecticut, Delaware, Districtof Columbia, Florida, Hawaii, Idaho, Kansas, Maine, Michigan, Minnesota, Montana, Nebraska, New Hampshire, New Jersey, New Mexico, New York, Ohio,Oklahoma, Oregon, Rhode Island, South Carolina, South Dakota, Texas, Utah, Washington, Wisconsin, and Wyoming. The multiple-race data for these areas werebridged to the single-race categories of the 1977 OMB standards for comparability with other areas; see http://www.cdc.gov/nchs and refer to "Detailedtechnical notes to the United States 2007 data—mortality." For explanation of asterisks preceding cause-of-death codes, see http://www.cdc.gov/nchs andrefer to "Detailed technical notes to the United States 2007 data - mortality"]_____________________________________________________________________________________________________________________________________________________________
Cause of death (Based on theInternational Classificationof Diseases, Tenth Revision, Second 40-44 45-49 50-54 55-59 60-64 65-69 70-74 75-79 80-84 85 yearsEdition, 2004), race, and sex years years years years years years years years years and over______________________________________________________________________________________________________________________________________________________________
Legal intervention (Y35,Y89.0)
All races 3/, both sexes............. 0.2 0.2 0.1 * * * * * * * Male............................ 0.4 0.3 0.2 * * * * * * * Female.......................... * * * * * * * * * * White, both sexes................... 0.2 0.2 * * * * * * * * Male............................ 0.3 0.3 * * * * * * * * Female.......................... * * * * * * * * * * Black, both sexes................... * * * * * * * * * * Male............................ * * * * * * * * * * Female.......................... * * * * * * * * * *
Events of undetermined intent (Y10-Y34,Y87.2,Y89.9)
All races 3/, both sexes............. 3.2 3.5 3.3 2.2 1.4 1.0 0.9 0.9 1.2 1.3 Male............................ 3.9 4.0 3.9 2.7 1.7 1.3 1.1 1.3 1.7 1.6 Female.......................... 2.4 3.0 2.8 1.7 1.1 0.7 0.7 0.6 0.8 1.1 White, both sexes................... 3.3 3.5 3.3 2.1 1.3 1.0 0.8 0.9 1.0 1.3 Male............................ 3.9 3.9 3.7 2.5 1.6 1.2 1.0 1.1 1.4 1.7 Female.......................... 2.6 3.1 3.0 1.7 1.0 0.8 0.7 0.7 0.7 1.1 Black, both sexes................... 3.3 4.2 4.5 3.3 2.4 * * * * * Male............................ 5.0 5.5 6.7 5.5 3.5 * * * * * Female.......................... 1.9 3.0 2.6 * * * * * * *

19JUL10 Plate 2 of 2 Page 67
Worktable 210R. Death rates for 113 selected causes, alcohol-induced causes, drug-induced causes, and injury by firearms, by 5-year agegroups, race, and sex: United States, 2007
[Rates per 100,000 population in specified group. Rates based on populations estimated as of July 1, 2007. Race categories are consistentwith the 1977 Office of Management and Budget (OMB) standards. In 2007, multiple-race data were reported by California, Connecticut, Delaware, Districtof Columbia, Florida, Hawaii, Idaho, Kansas, Maine, Michigan, Minnesota, Montana, Nebraska, New Hampshire, New Jersey, New Mexico, New York, Ohio,Oklahoma, Oregon, Rhode Island, South Carolina, South Dakota, Texas, Utah, Washington, Wisconsin, and Wyoming. The multiple-race data for these areas werebridged to the single-race categories of the 1977 OMB standards for comparability with other areas; see http://www.cdc.gov/nchs and refer to "Detailedtechnical notes to the United States 2007 data—mortality." For explanation of asterisks preceding cause-of-death codes, see http://www.cdc.gov/nchs andrefer to "Detailed technical notes to the United States 2007 data - mortality"]_____________________________________________________________________________________________________________________________________________________________
Cause of death (Based on theInternational Classificationof Diseases, Tenth Revision, Second 40-44 45-49 50-54 55-59 60-64 65-69 70-74 75-79 80-84 85 yearsEdition, 2004), race, and sex years years years years years years years years years and over______________________________________________________________________________________________________________________________________________________________
Discharge of firearms, undetermined intent (Y22-Y24)
All races 3/, both sexes............. 0.1 * 0.1 0.1 * * * * * * Male............................ * * * * * * * * * * Female.......................... * * * * * * * * * * White, both sexes................... 0.1 * * * * * * * * * Male............................ * * * * * * * * * * Female.......................... * * * * * * * * * * Black, both sexes................... * * * * * * * * * * Male............................ * * * * * * * * * * Female.......................... * * * * * * * * * *
Other and unspecified events of undetermined intent and their sequelae (Y10-Y21,Y25-Y34,Y87.2,Y89.9)
All races 3/, both sexes............. 3.1 3.4 3.2 2.1 1.3 0.9 0.8 0.8 1.1 1.3 Male............................ 3.8 3.9 3.8 2.5 1.5 1.1 1.0 1.2 1.6 1.5 Female.......................... 2.4 3.0 2.7 1.6 1.1 0.7 0.6 0.6 0.8 1.1 White, both sexes................... 3.2 3.4 3.2 2.0 1.2 0.9 0.8 0.8 1.0 1.3 Male............................ 3.8 3.8 3.6 2.3 1.4 1.0 0.9 1.1 1.3 1.6 Female.......................... 2.6 3.1 2.9 1.7 1.0 0.7 0.6 0.6 0.7 1.1 Black, both sexes................... 3.3 4.1 4.3 3.2 2.3 * * * * * Male............................ 5.0 5.4 6.5 5.4 3.5 * * * * * Female.......................... 1.9 2.9 2.5 * * * * * * *

19JUL10 Plate 2 of 2 Page 68
Worktable 210R. Death rates for 113 selected causes, alcohol-induced causes, drug-induced causes, and injury by firearms, by 5-year agegroups, race, and sex: United States, 2007
[Rates per 100,000 population in specified group. Rates based on populations estimated as of July 1, 2007. Race categories are consistentwith the 1977 Office of Management and Budget (OMB) standards. In 2007, multiple-race data were reported by California, Connecticut, Delaware, Districtof Columbia, Florida, Hawaii, Idaho, Kansas, Maine, Michigan, Minnesota, Montana, Nebraska, New Hampshire, New Jersey, New Mexico, New York, Ohio,Oklahoma, Oregon, Rhode Island, South Carolina, South Dakota, Texas, Utah, Washington, Wisconsin, and Wyoming. The multiple-race data for these areas werebridged to the single-race categories of the 1977 OMB standards for comparability with other areas; see http://www.cdc.gov/nchs and refer to "Detailedtechnical notes to the United States 2007 data—mortality." For explanation of asterisks preceding cause-of-death codes, see http://www.cdc.gov/nchs andrefer to "Detailed technical notes to the United States 2007 data - mortality"]_____________________________________________________________________________________________________________________________________________________________
Cause of death (Based on theInternational Classificationof Diseases, Tenth Revision, Second 40-44 45-49 50-54 55-59 60-64 65-69 70-74 75-79 80-84 85 yearsEdition, 2004), race, and sex years years years years years years years years years and over______________________________________________________________________________________________________________________________________________________________
Operations of war and their sequelae (Y36,Y89.1)
All races 3/, both sexes................ * * * * * * * * * * Male............................ * * * * * * * * * * Female.......................... * * * * * * * * * * White, both sexes................... * * * * * * * * * * Male............................ * * * * * * * * * * Female.......................... * * * * * * * * * * Black, both sexes................... * * * * * * * * * * Male............................ * * * * * * * * * * Female.......................... * * * * * * * * * *
Complications of medical and surgical care (Y40-Y84,Y88)
All races 3/, both sexes............. 0.4 0.5 0.7 1.0 1.5 2.2 2.9 5.1 6.0 7.9 Male............................ 0.4 0.5 0.7 1.1 1.5 2.4 3.2 5.7 7.3 9.8 Female.......................... 0.4 0.4 0.7 0.9 1.5 2.0 2.7 4.6 5.2 6.9 White, both sexes................... 0.4 0.4 0.6 1.0 1.4 2.0 2.8 4.8 5.9 7.6 Male............................ 0.4 0.4 0.6 1.0 1.4 2.3 3.0 5.5 7.4 9.5 Female.......................... 0.4 0.4 0.6 0.9 1.4 1.8 2.6 4.2 4.9 6.7 Black, both sexes................... 0.7 0.8 1.5 1.6 2.7 4.1 5.2 9.2 8.1 12.2 Male............................ * * * 2.5 * * 6.9 11.1 * * Female.......................... * * 1.9 * 2.8 4.0 * 8.0 8.2 10.6

19JUL10 Plate 2 of 2 Page 69
Worktable 210R. Death rates for 113 selected causes, alcohol-induced causes, drug-induced causes, and injury by firearms, by 5-year agegroups, race, and sex: United States, 2007
[Rates per 100,000 population in specified group. Rates based on populations estimated as of July 1, 2007. Race categories are consistentwith the 1977 Office of Management and Budget (OMB) standards. In 2007, multiple-race data were reported by California, Connecticut, Delaware, Districtof Columbia, Florida, Hawaii, Idaho, Kansas, Maine, Michigan, Minnesota, Montana, Nebraska, New Hampshire, New Jersey, New Mexico, New York, Ohio,Oklahoma, Oregon, Rhode Island, South Carolina, South Dakota, Texas, Utah, Washington, Wisconsin, and Wyoming. The multiple-race data for these areas werebridged to the single-race categories of the 1977 OMB standards for comparability with other areas; see http://www.cdc.gov/nchs and refer to "Detailedtechnical notes to the United States 2007 data—mortality." For explanation of asterisks preceding cause-of-death codes, see http://www.cdc.gov/nchs andrefer to "Detailed technical notes to the United States 2007 data - mortality"]_____________________________________________________________________________________________________________________________________________________________
Cause of death (Based on theInternational Classificationof Diseases, Tenth Revision, Second 40-44 45-49 50-54 55-59 60-64 65-69 70-74 75-79 80-84 85 yearsEdition, 2004), race, and sex years years years years years years years years years and over______________________________________________________________________________________________________________________________________________________________
Alcohol-induced causes (E24.4,F10,G31.2,G62.1,G72.1,I42.6,K29.2,K70,K85.2,K86.0,R78.0,X45,X65,Y15) 4/
All races 3/, both sexes............. 9.7 16.2 20.5 20.8 19.4 16.8 13.8 11.3 7.6 4.6 Male............................ 13.6 23.5 31.6 33.4 31.5 28.2 24.2 20.4 14.1 9.6 Female.......................... 5.8 9.1 9.9 9.0 8.2 6.8 5.4 4.6 3.5 2.2 White, both sexes................... 10.2 16.9 21.3 21.3 19.5 17.0 14.0 11.4 7.8 4.6 Male............................ 14.2 24.4 32.5 34.0 31.5 28.1 23.9 20.1 14.5 9.8 Female.......................... 6.1 9.3 10.3 9.1 8.3 7.1 5.7 4.9 3.6 2.1 Black, both sexes................... 6.5 12.6 17.2 20.7 21.2 18.2 15.2 11.2 5.8 5.5 Male............................ 9.1 18.5 29.2 35.6 38.3 36.0 31.7 26.6 * * Female.......................... 4.2 7.5 7.1 8.5 7.9 5.2 * * * *
Drug-induced causes (D52.1,D59.0,D59.2,D61.1,D64.2,E06.4,E16.0,E23.1,E24.2,E27.3,E66.1,F11.0-F11.5,F11.7-F11.9,F12.0-F12.5,F12.7-F12.9,F13.0-F13.5,F13.7-F13.9,F14.0-F14.5,F14.7-F14.9,F15.0-F15.5,F15.7-F15.9,F16.0-F16.5,F16.7-F16.9,F17.0,F17.3-F17.5,F17.7-F17.9,F18.0-F18.5,F18.7-F18.9,F19.0-F19.5,F19.7-F19.9,G21.1,G24.0,G25.1,G25.4,G25.6,G44.4,G62.0,G72.0,I95.2,J70.2-J70.4,K85.3,L10.5,L27.0-L27.1,M10.2,M32.0,M80.4,M81.4,M83.5,M87.1,R50.2,R78.1-R78.5,X40-X44,X60-X64,X85,Y10-Y14) 4/
All races 3/, both sexes............. 24.8 28.0 25.7 17.0 9.3 5.3 3.9 3.8 4.0 4.8 Male............................ 30.3 32.9 30.4 20.5 10.5 6.0 4.4 3.4 4.4 5.5 Female.......................... 19.3 23.2 21.1 13.7 8.3 4.6 3.5 4.0 3.8 4.4 White, both sexes................... 26.9 29.4 25.9 16.6 9.2 5.2 4.1 3.9 4.2 5.0 Male............................ 32.7 34.1 29.7 18.8 9.9 5.4 4.5 3.5 4.6 5.8 Female.......................... 21.0 24.8 22.2 14.5 8.6 5.1 3.7 4.2 3.9 4.5 Black, both sexes................... 20.8 27.7 33.7 25.6 13.0 8.0 3.6 3.8 * * Male............................ 26.4 36.4 48.0 40.9 20.3 15.3 * * * * Female.......................... 15.8 20.1 21.5 13.0 7.4 * * * * *

19JUL10 Plate 2 of 2 Page 70
Worktable 210R. Death rates for 113 selected causes, alcohol-induced causes, drug-induced causes, and injury by firearms, by 5-year agegroups, race, and sex: United States, 2007
[Rates per 100,000 population in specified group. Rates based on populations estimated as of July 1, 2007. Race categories are consistentwith the 1977 Office of Management and Budget (OMB) standards. In 2007, multiple-race data were reported by California, Connecticut, Delaware, Districtof Columbia, Florida, Hawaii, Idaho, Kansas, Maine, Michigan, Minnesota, Montana, Nebraska, New Hampshire, New Jersey, New Mexico, New York, Ohio,Oklahoma, Oregon, Rhode Island, South Carolina, South Dakota, Texas, Utah, Washington, Wisconsin, and Wyoming. The multiple-race data for these areas werebridged to the single-race categories of the 1977 OMB standards for comparability with other areas; see http://www.cdc.gov/nchs and refer to "Detailedtechnical notes to the United States 2007 data—mortality." For explanation of asterisks preceding cause-of-death codes, see http://www.cdc.gov/nchs andrefer to "Detailed technical notes to the United States 2007 data - mortality"]_____________________________________________________________________________________________________________________________________________________________
Cause of death (Based on theInternational Classificationof Diseases, Tenth Revision, Second 40-44 45-49 50-54 55-59 60-64 65-69 70-74 75-79 80-84 85 yearsEdition, 2004), race, and sex years years years years years years years years years and over______________________________________________________________________________________________________________________________________________________________
Injury by firearms (*U01.4,W32-W34,X72-X74,X93-X95,Y22-Y24,Y35.0) 4/
All races 3/, both sexes............. 11.9 11.2 11.0 10.4 10.0 10.1 9.9 13.5 12.7 11.6 Male............................ 19.3 18.4 18.9 18.0 17.9 18.8 19.6 29.1 29.9 33.5 Female.......................... 4.6 4.1 3.4 3.2 2.8 2.5 2.0 2.0 1.9 1.1 White, both sexes................... 11.6 11.4 11.5 11.1 10.8 10.9 10.9 14.6 13.9 12.7 Male............................ 18.4 18.5 19.5 19.0 19.0 20.1 21.4 31.1 32.4 36.9 Female.......................... 4.7 4.3 3.7 3.4 3.1 2.7 2.1 2.1 2.0 1.1 Black, both sexes................... 17.5 13.2 10.3 8.3 6.4 5.6 4.8 7.0 * * Male............................ 31.2 23.3 19.4 15.9 13.2 11.5 10.0 16.8 * * Female.......................... 5.5 4.3 2.6 2.0 * * * * * *
_____________________________________________________________________________________________________________________________________________________________
* Figure does not meet standards of reliability or precision.0.0 Quantity more than zero but less than 0.05.... Category not applicable.1/ Figures for age not stated included in "All ages" but not distributed among age groups.2/ Death rates for "Under 1 year" (based on population estimates) differ from infant mortality rates (based on live births).3/ Includes races other than white and black.4/ Included in selected categories.
Source: CDC/NCHS, National Vital Statistics System, Mortality.