workshop overview objectives of workshop timeline description of the section
Post on 21-Dec-2015
221 views
TRANSCRIPT

Workshop Overview
Objectives of workshop
Timeline
Description of the Section

Primary Objective
Solicit a collection of strong proposals, submitted to the Core Program for the February 15 deadline that cover the key parameters and other parameters identified as priorities at the workshop and by the SSC.

Role of Workshop
●provide participants with information about the aspects of the cruise track that made it compelling, and ancillary information that will strengthen each proposal.
● help PIs identify how their proposal contributes to the project as a whole, and could not achieve its objectives without the measurement of other core parameters.
● provide as many opportunities as possible for participants to identify synergies with other groups that can be used to strengthen their proposals.
● provide information and seek feedback about data management, logistics, costs and infrastructural resources provided by the management grant so that participants will be develop realistic budgets and project management schemes.
● identify at the workshop what sampling plans are logistically feasible●get feedback from participants to help SSC set priorities
Important Considerations for choosing a section
• 1. High Impact Science, both as a part of the complete program, but also from that section alone (important to generate excitement and establish the program as a whole, both nationally and internationally.
• 2. Science product that underscore the value of multiple key parameters being measured on the same ship (see Science Plan).
• 3. Compliment International Efforts

Rationale
• Highly productive eastern boundary upwelling system
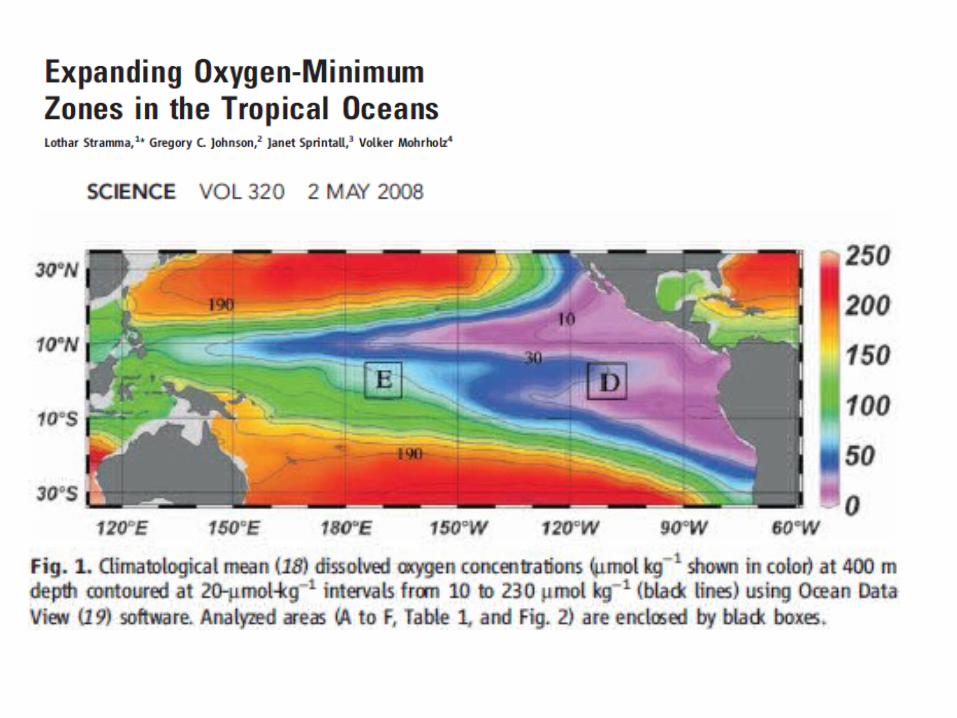
• Intense oxygen minimum zone; important in global N cycle
• OMZ expanding and shoaling over the last 40-50 y
• Largest hydrothermal plume in world’s oceans• SE Subtropical gyre one of world’s most
oligotrophic regimes

3 sub-programs within cruise
• Large lateral gradients in productivity and particle fluxes related to upwelling and inputs from continental margin
• Important oxygen minimum zone
• Most prominent hydrothermal plume in the world’s oceans
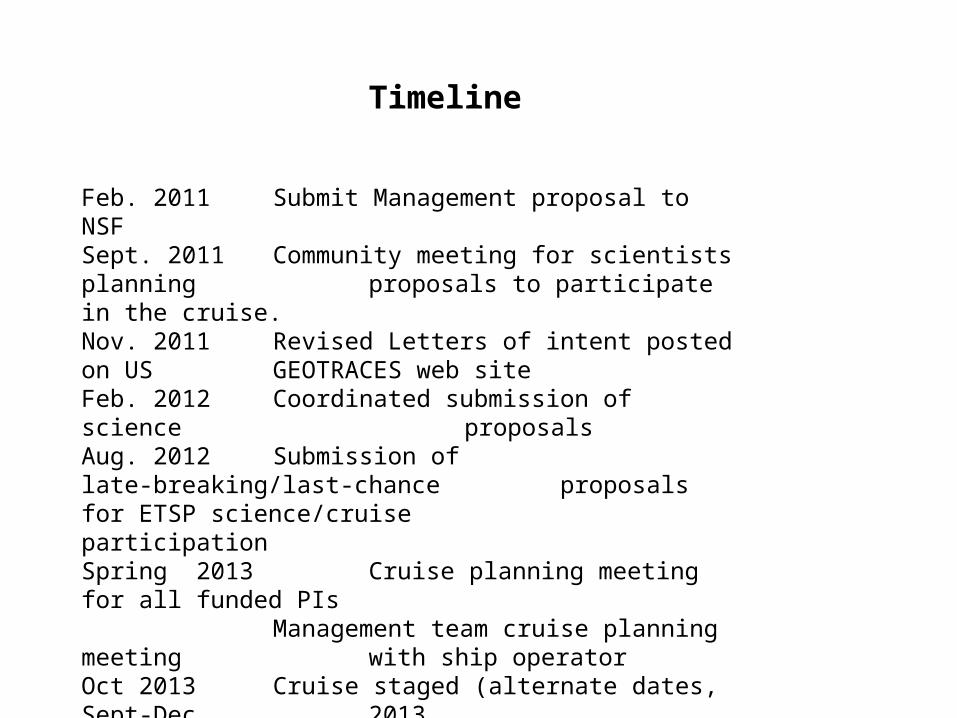
Timeline
Feb. 2011 Submit Management proposal to NSF Sept. 2011 Community meeting for scientists planning
proposals to participate in the cruise. Nov. 2011 Revised Letters of intent posted on US
GEOTRACES web site Feb. 2012 Coordinated submission of science
proposals Aug. 2012 Submission of late-breaking/last-chance
proposals for ETSP science/cruise participation
Spring 2013 Cruise planning meeting for all funded PIs Management team cruise planning meeting with ship operator
Oct 2013 Cruise staged (alternate dates, Sept-Dec 2013
Fall 2014 Post cruise workshop

Figure 1. Cruise track & deep stations

Figure 2. Section showing OMZ

Peruvian Time Series Stations Occupied by IMARPE

Figure 3 Cruise track showing 3He plume at 2500m
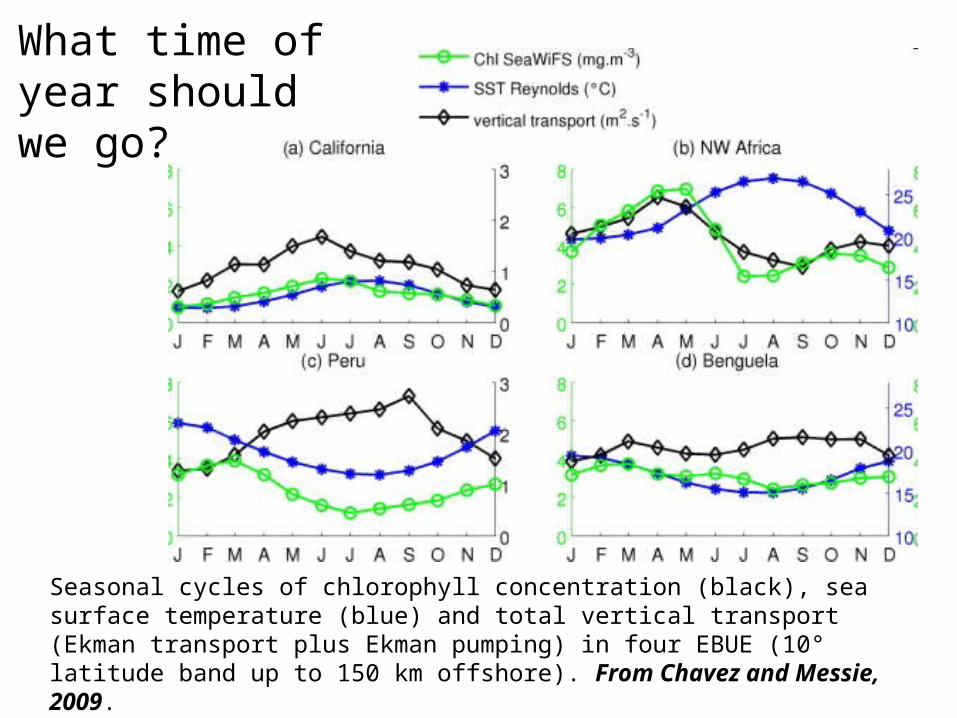
Seasonal cycles of chlorophyll concentration (black), sea surface temperature (blue) and total vertical transport (Ekman transport plus Ekman pumping) in four EBUE (10° latitude band up to 150 km offshore). From Chavez and Messie, 2009.
What time of year should we go?
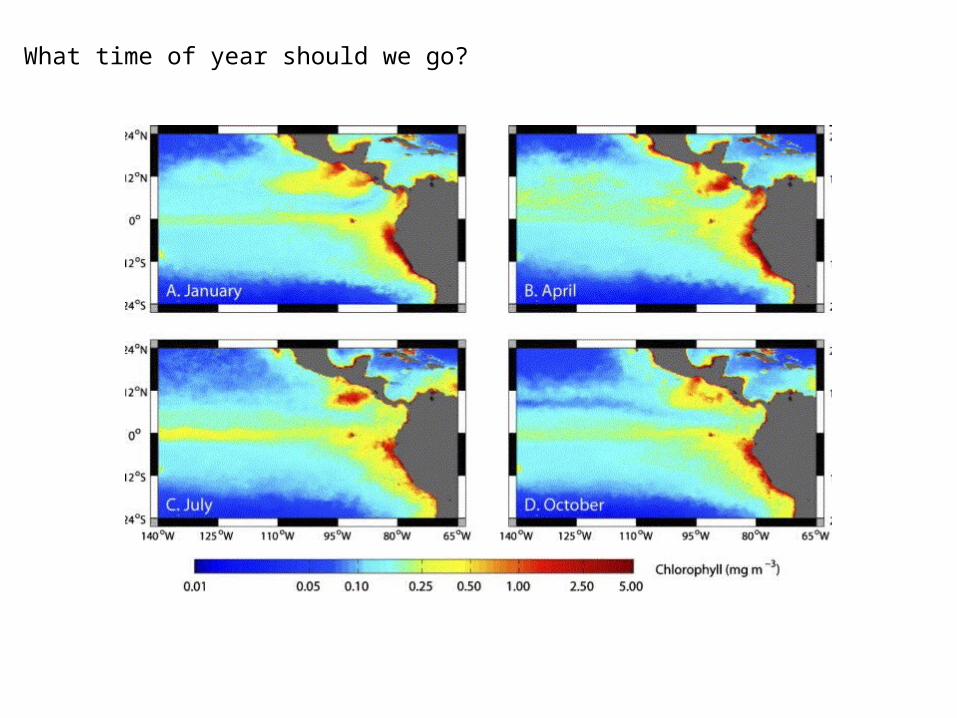
What time of year should we go?

Berelson and Capone deployed sediment traps Feb 2010 through March 2011
Depth = 3700m
Their data indicate highest fluxes during time of maximum wind-stress curl (i.e. Sept/Oct) – see their data at Ocean Sciences 2012 Meeting

Peru Upwelling of great importance because of high productivity and high fish catch
From Chavez et al., 2009)

N* at Sigma-theta 26.4 (~250 m)
Important for:•Global N budget•Oceanic N2O productionNitrate 15N (and 18O): •Uptake and Remineralization•Denitrification•Anammox•Nitrogen fixation
The nitrogen cycle along our cruise track
Figure Courtesy of Karen Casciotti
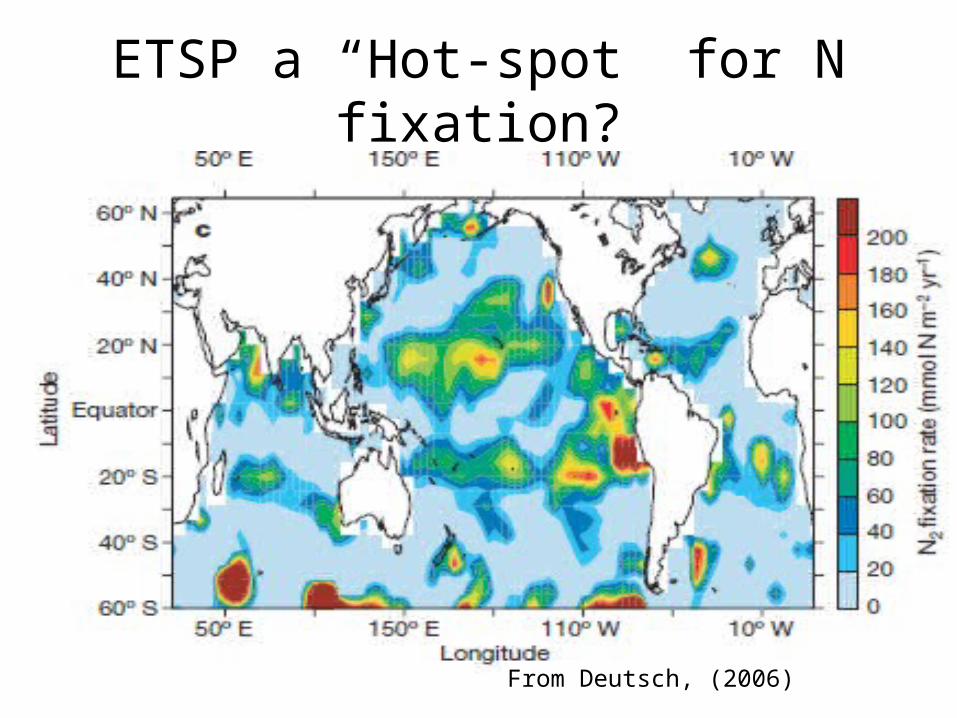
ETSP a “Hot-spot” for N fixation?
From Deutsch, (2006)

Linkage Between N cycle and other key parameters in GEOTRACES
• Each step in the N cycle are catalyzed by metalloenzmes requiring metals that are key parameters in the program
• There are large gradients of these metals within the cruise track

Courtesy of Bess Ward


Chile is world’s largest copper roducer•Copper smelting SO2emissions from Chile (1.5 TgSyr-1) comparable to total SO2emissions in Germany•90% of Chilean SO2 emissions from seven smelters!•Andes mountains prevents eastwardtransport
VOCALS Program

Conceptual Picture of an OMZ
Euphotic zone
Oxicline, high remineralization rates
Clear zone
Deep nitrite max.
Lower OMZ
Ventilated deep waters
O2
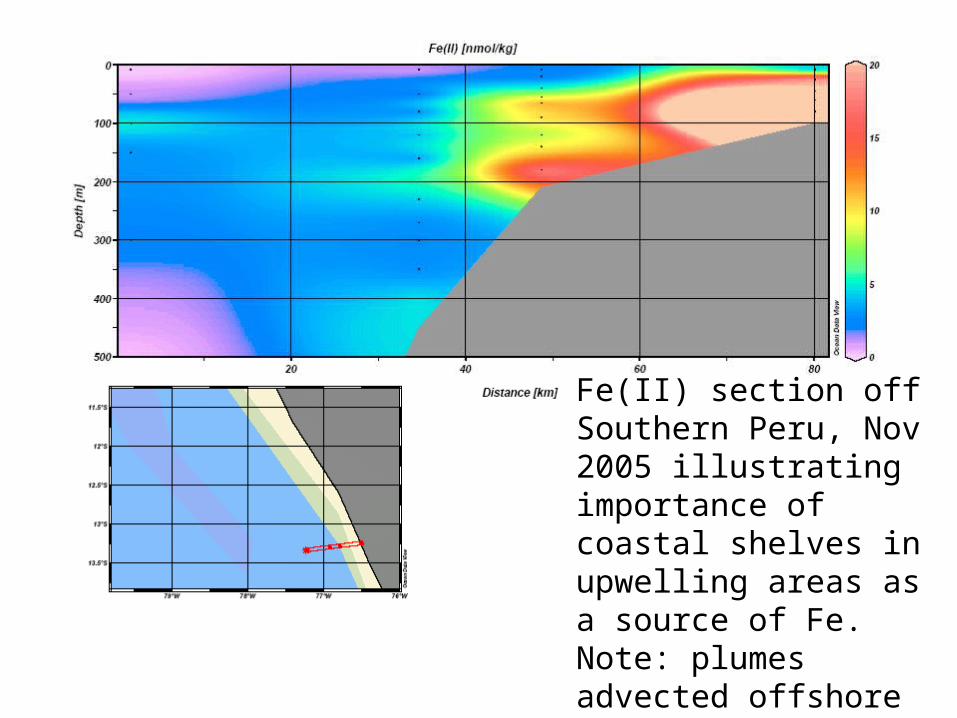
Fe(II) section off Southern Peru, Nov 2005 illustrating importance of coastal shelves in upwelling areas as a source of Fe. Note: plumes advected offshore associated with nitrite maxima.

Transect Station 19 to Station 23

Cruise to ETSP on RV Atlantis, Feb 2010, Doug Capone, Chief ScientistFe(II) and total dissolved Fe and Cu measured by Yoshiko Kondo

Zonal transect
10o S

Total dissolved Fe and Fe(II) , 10oS
Cruise to ETSP on RV Atlantis, Feb 2010, Doug Capone, Chief ScientistFe(II) and total dissolved Fe and Cu measured by Yoshiko Kondo

Zonal Transect 20oS
Cruise to ETSP on RV Atlantis, Feb 2010, Doug Capone, Chief ScientistFe(II) and total dissolved Fe and Cu measured by Yoshiko Kondo

Cruise to ETSP on RV Atlantis, Feb 2010, Doug Capone, Chief ScientistFe(II) and total dissolved Fe and Cu measured by Yoshiko Kondo

10oS
20oS
Cruise to ETSP on RV Atlantis, Feb 2010, Doug Capone, Chief ScientistFe(II) and total dissolved Fe and Cu measured by Yoshiko Kondo

Cruise to ETSP on RV Atlantis, Feb 2010, Doug Capone, Chief Scientist Fe(II) and total dissolved Fe and Cu measured by Yoshiko Kondo

Subsurface flow is complex, with many westward flowing filaments that can transport materials from
the shelf/slope offshore
Figure 4. Schematic middepth flow field at about 400 m depth. The mean climatological dissolved oxygen distribution at 400 m from WOA05 is included. Areas of high frequency of eddy occurrence are marked by dashed lines.(From Czeschel et al., 2010)

Dissolved Oxygen
State of the Art: Where phosphate was before MAGIC
Issues: Contamination problems surface analysis Slow response, poor detection limits for in situ sensors
Scope of the problem revealed in Revsbech et al. 2010 Indicating O2 essentially zero at the most intense region of the OMZ.
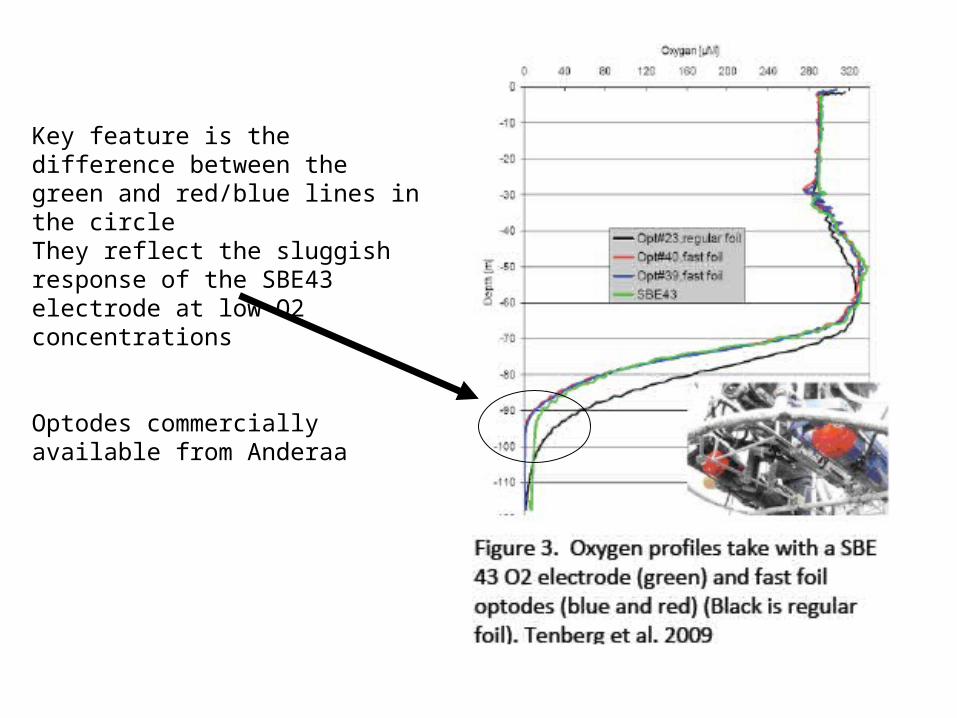
Key feature is the difference between the green and red/blue lines in the circleThey reflect the sluggish response of the SBE43 electrode at low O2 concentrations
Optodes commercially available from Anderaa