workshop on trade policy and trade indicators - cepal… · similar to cuode regarding the grouping...
TRANSCRIPT
Workshop on Trade Policy and Trade Indicators
Mariano AlvarezEconomic Affairs Officer
Zebulun KreiterEconomic Affairs Officer
Marcelo Pereira DolabellaConsultant
Economic Commission for Latin America and the Caribbean
Module 1.2

These are specific forms in which trade statistics arecollected. Several types exist and the use of one orthe other depends on their own characteristics and theaims of the analysis. The most prominentclassifications are:
• Harmonized System (HS)
• Standardized International Trade Classification (SITC)
• International Standardized Industrial Classification (ISIC)
• Broad Economic Categories (BEC)
• Trade Classification by Economic Use or Destination (CUODE)
• ECLAC’s Statistical Yearbook Basic Classification
INTERNATIONAL TRADE CLASSIFICATION

3
DEVELOPMENT OF MAIN TRADE CLASSIFICATIONS
HS SITC
Geneva nomenclature (1931) Minimum List of Commodities (1938)
Brussels Convention (1949) Standardized International Trade Classification (1950)
Brussels Tariff Nomenclature (1955) SITC, Revision 1 (1960)
Customs Cooperation Council Nomenclature (1974)
CCCN 2 (1978) SITC, Revision 2 (1976)
Harmonized System (1983)
HS (1988) SITC, Revision 3.1 (1986)
HS (1992) SITC, Revision 3.2 (1991)
HS (1996)
HS (2002) SITC, Revision 3.3 (2002)
HS (2007) SITC, Revision 4 (2008)
HS (2012)
HS (2017)
4
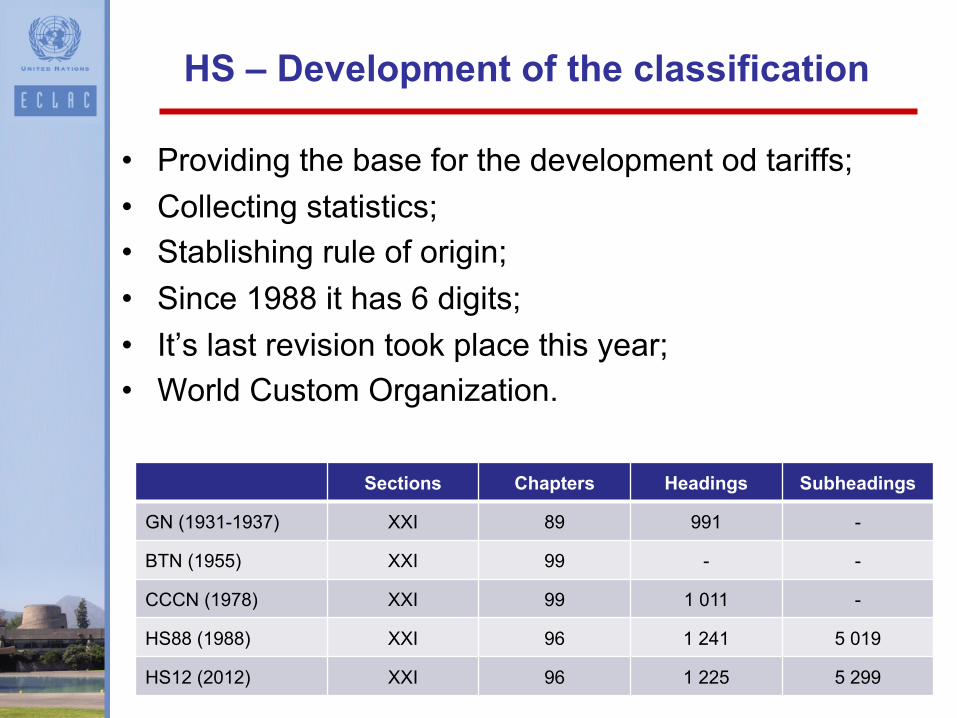
• Providing the base for the development od tariffs;• Collecting statistics;• Stablishing rule of origin;• Since 1988 it has 6 digits;• It’s last revision took place this year;• World Custom Organization.
HS – Development of the classification
Sections Chapters Headings Subheadings
GN (1931-1937) XXI 89 991 -
BTN (1955) XXI 99 - -
CCCN (1978) XXI 99 1 011 -
HS88 (1988) XXI 96 1 241 5 019
HS12 (2012) XXI 96 1 225 5 299
5
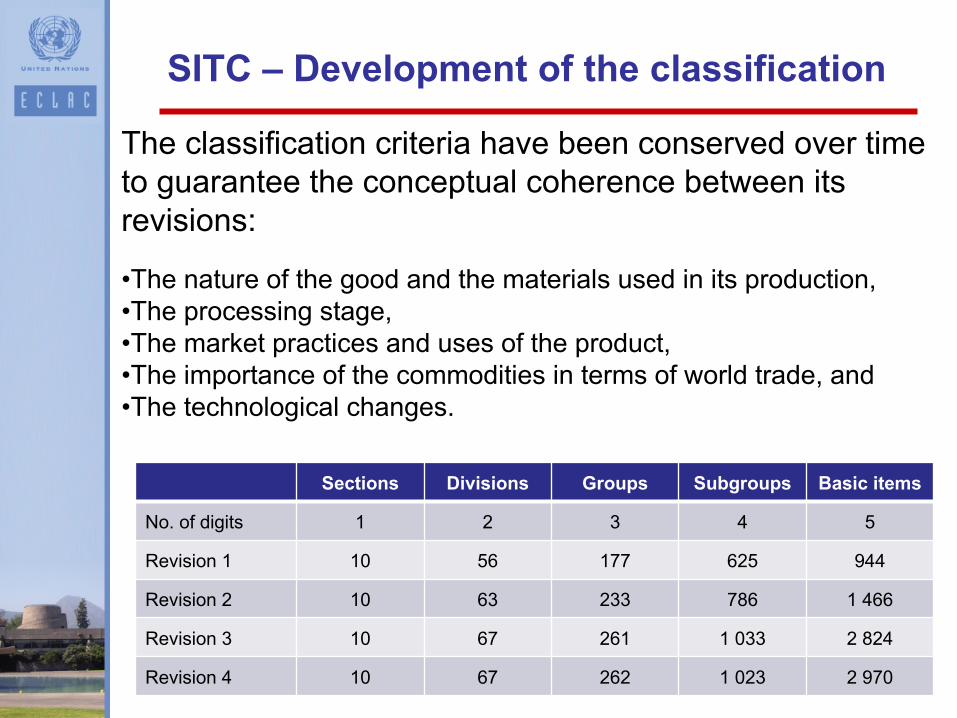
The classification criteria have been conserved over time to guarantee the conceptual coherence between its revisions:
•The nature of the good and the materials used in its production,•The processing stage,•The market practices and uses of the product,•The importance of the commodities in terms of world trade, and•The technological changes.
SITC – Development of the classification
Sections Divisions Groups Subgroups Basic items
No. of digits 1 2 3 4 5
Revision 1 10 56 177 625 944
Revision 2 10 63 233 786 1 466
Revision 3 10 67 261 1 033 2 824
Revision 4 10 67 262 1 023 2 970
• Since 1948 is used in statistics on population, production, employment and others.
• This is a classification by type of economic activity and not of goods and services.
• It aims on establishing a standardization of all productive economic activities.
• It is not possible to establish a biunivocal correspondence between activities and products and therefore it does not allow a measurement of production with any degree of detail.
• Several specialized organisms and programs of the United Nations have applied this classification their studies and publications (FAO, UNIDO, ILO, and UNESCO, among other).
• Its most recent revision is the 4th of 2008.
ISIC – Genesis and development

Developed by ECLAC to cover the need for aclassification for foreign trade statistics in broadeconomic categories whose structure would facilitate theeconomic analysis of international trade flows beforeand after the 1960s.
ECLAC currently uses global coverage classificationsdeveloped under the aegis of the United NationsStatistical Commission, namely the Classification ofBroad Economic Categories (BEC). This classification issimilar to CUODE regarding the grouping of the productstaking into account their final use and the processingstage, but it is homogeneous for all countries.
CUODE – Genesis and development
BEC and the CPC
• Broad Economic Classification– Distinguish between food, industrial supplies, capital goods,
and durable and non-durable consumer goods– It complements the data summarized by SITC– Rev.3 was published in 2008 and corresponds to SITC Rev. 3
• Central Product Classification– Includes services and the new technologies.– Its purpose is to satisfy the needs of detailed statistics of
production, consumption, and prices, capital, among others– It contains important information for the input-output tables
and the Balance of Payment– Version 2,1 was published in 2015, in accordance with HS12
and SITC Rev. 4

CONCORDANCE BETWEEN THE CLASSIFICATIONS
HS 02 CPC ISIC 3
SITC 3 BEC 3
SITC 2 BEC 1
ISIC 2
SITC 1 BEC

• Complete correlation– Classification of Pavitt (1984): large groups of industries,
taking into account different channels through which the firms of each group of sectors acquire and develop their technology; [SITC Rev.1]
– Classification by Technological Intensity; [SITC Rev.2]• Partial re-classification
– Classification of Information and Communication Technologies; [HS96]
– Classification by Environmentally Sensitive Goods; [SITC Rev. 1]
– Classification of Environmental Goods. [HS07]
SPECIFIC CLASSIFICATIONS
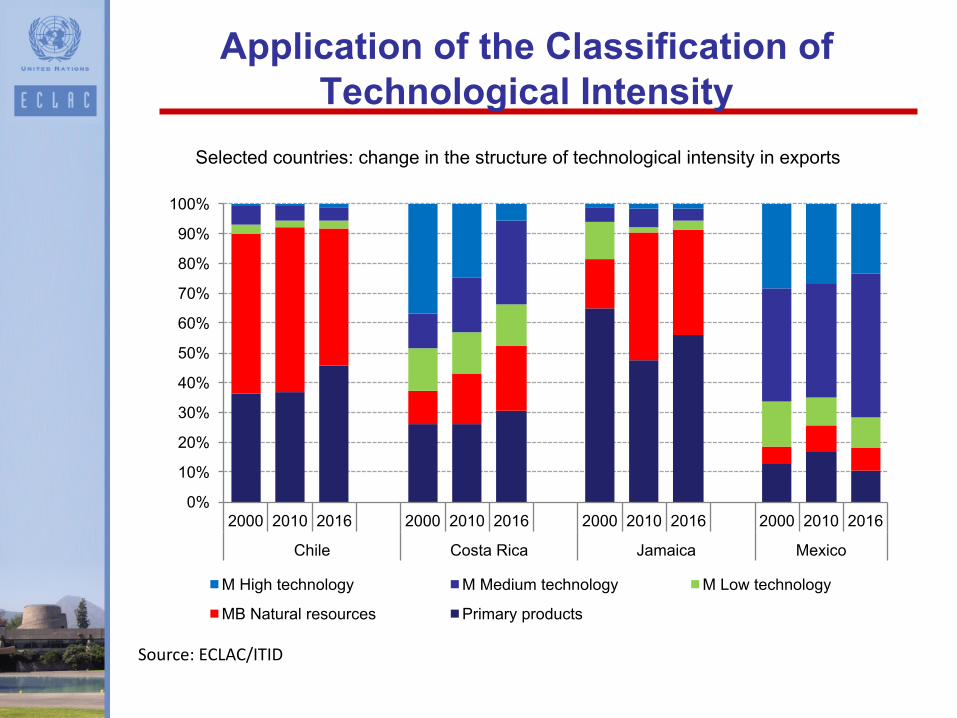
Selected countries: change in the structure of technological intensity in exports
Source:ECLAC/ITID
Application of the Classification of Technological Intensity
0%
10%
20%
30%
40%
50%
60%
70%
80%
90%
100%
2000 2010 2016 2000 2010 2016 2000 2010 2016 2000 2010 2016
Chile Costa Rica Jamaica Mexico
M High technology M Medium technology M Low technology
MB Natural resources Primary products
• How many enterprises export?• How many of those enterprises are new?• How many enterprises stopped exporting?• How many products does each enterprise export?• Have the enterprises diversified their exports?• To which countries does each enterprise export?• How many employees does each enterprise export?• How many of those employees are women?
TRADE AND INVESTMENT MICRODATA
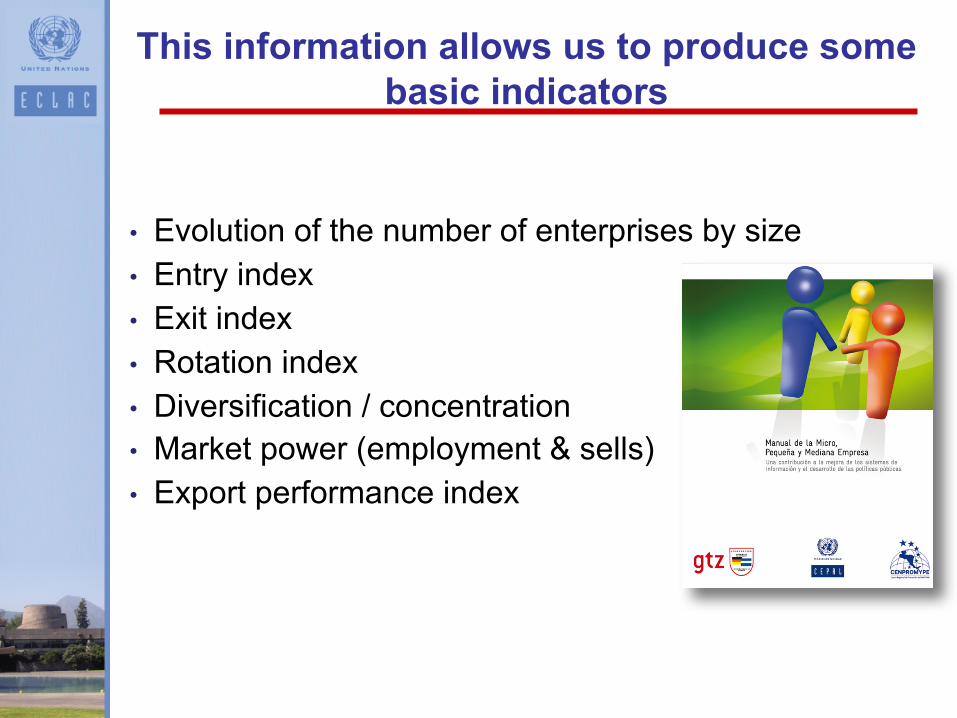
• Evolution of the number of enterprises by size• Entry index• Exit index• Rotation index• Diversification / concentration• Market power (employment & sells)• Export performance index
This information allows us to produce some basic indicators

§ Heterogeneity or poor quality§ Entry duplication due to typos. E.g.:
§ LAN; LAN AIRLINES; LANCHILE§ Security number or Tax Identification are always
preferred§ Typos in the data. E.g.:
§ These are more frequent in microdata than intraditional trade data;
Common problems while working with microdata

§ Lack of coordination among the different publicoffices that produce the information
§ Confidentiality /statistic secret;§ It’s potential is still not well known;§ Our experience in the region is that the
administrative registries are not use to it’s fullpotential;
§ The definition of SMEs are not always comparablebetween countries.
What are the barriers to the use of microdata?
