workshop brief: technologies and operational strategies ... and operational strategies for... ·...
TRANSCRIPT

1
Workshop brief:
Technologies and operational strategies for best practices in port clean air programs
A short International Council on Clean Transportation report
in advance of the International Workshop on Reducing Air Emissions from Shipping
Shanghai, China
December 13, 2012 1. Introduction
The International Council on Clean Transportation (ICCT), in collaboration with China Waterborne Transport Institute under Ministry of Transport and Vehicle Emission Control Center under Ministry of Environmental Protection, has organized an international workshop on reducing air emissions from shipping and ports to take place on December 13th, 2012 in Shanghai.1 The purpose of this workshop is to introduce best practices in addressing air pollutants from U.S. and European ports, highlight the challenges of air emissions from shipping, and identify opportunities for ports and regulators in China to improve air quality through cleaning up ships and marine fuel and reducing pollution from port-activities. This workshop brief is to provide background information on how to develop a port clean air program and implement vessel emissions reduction measures. This brief draws upon on the updated Air Quality Toolbox, a decision-making tool to help prioritize improved practices for port activities, and it also integrates China-specific information to provide further context for the ICCT Workshop. The original Air Quality Toolbox report was published in 2008, commissioned by the International Association of Ports and Harbors (IAPH) to quantify the associated air emissions from shipping and ports within local air basins.2 That report served as a tool to prioritize air emission reduction strategies in order to help achieve cleaner air in ports and the surrounding areas. Since the 2008 release of the original Air Quality Toolbox, extensive progress has been made in the scientific understanding of shipping inventory analysis, the health effects from ship-based emissions, and emission mitigation technologies. Among these advances, more and improved data based on increased operational experiences are available to assess air quality strategies. To help facilitate the ongoing and new efforts in reducing air emissions from shipping and ports, the ICCT funded Starcrest Consulting to update
1 See http://theicct.org/reducing-air-emissions-shipping 2 International Association of Ports and Harbors, IAPH Toolbox for port clean air programs, 2008
2
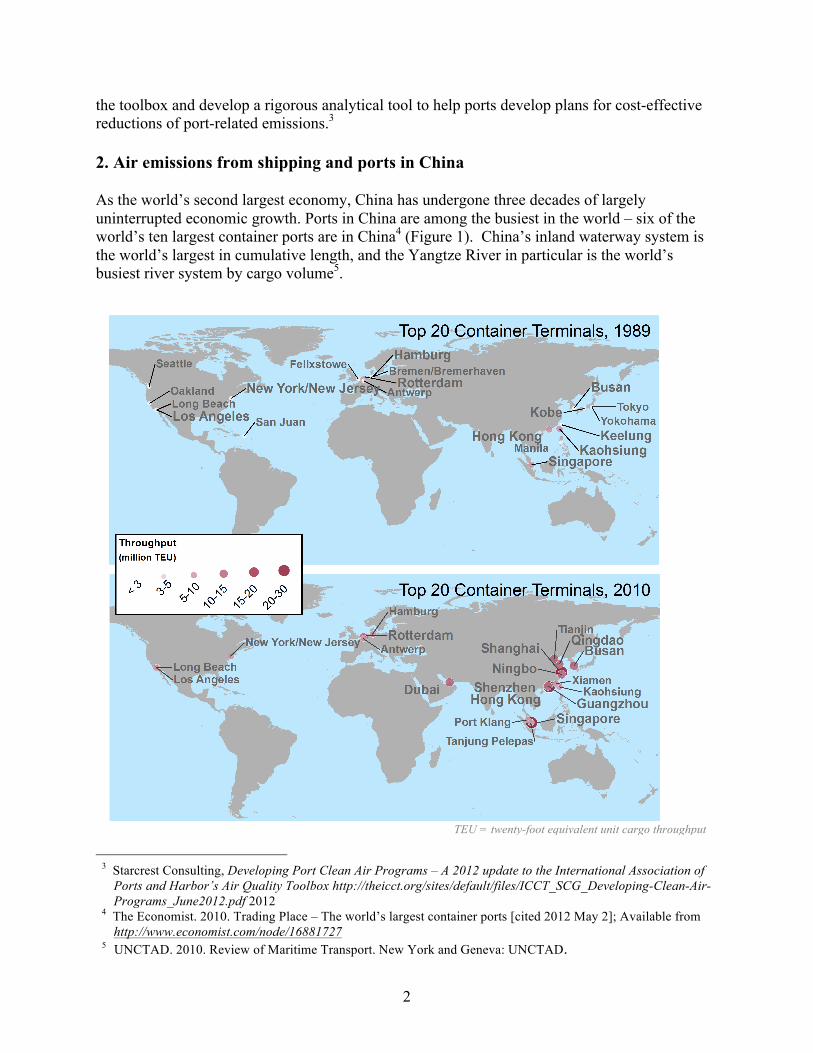
the toolbox and develop a rigorous analytical tool to help ports develop plans for cost-effective reductions of port-related emissions.3 2. Air emissions from shipping and ports in China As the world’s second largest economy, China has undergone three decades of largely uninterrupted economic growth. Ports in China are among the busiest in the world – six of the world’s ten largest container ports are in China4 (Figure 1). China’s inland waterway system is the world’s largest in cumulative length, and the Yangtze River in particular is the world’s busiest river system by cargo volume5.
TEU = twenty-foot equivalent unit cargo throughput
3 Starcrest Consulting, Developing Port Clean Air Programs – A 2012 update to the International Association of
Ports and Harbor’s Air Quality Toolbox http://theicct.org/sites/default/files/ICCT_SCG_Developing-Clean-Air-Programs_June2012.pdf 2012
4 The Economist. 2010. Trading Place – The world’s largest container ports [cited 2012 May 2]; Available from http://www.economist.com/node/16881727
5 UNCTAD. 2010. Review of Maritime Transport. New York and Geneva: UNCTAD.

3
Figure 1 Top 20 container terminals in the world for 1989 and 2010
Accompanying this sustained growth is increasingly acute air pollution, especially in urban areas. Driven by the growing public demand for cleaner air, the central government has taken steps toward establishing stronger metrics for monitoring and reporting air quality and controlling key air pollutants. In 2011, the central government stipulated reduction targets for oxides of nitrogen (NOX) for each province in the 12th Five-Year Plan (from 2011 through 2015), in addition to the sulfur dioxide (SO2) requirement that was established in the 11th Five-Year Plan (from 2006 through 2010). The NOX reduction targets amounts to a 10% reduction in total NOX emissions between 2010 and 2015 nationwide6. These economy-wide NOX targets incorporate increased future transportation activity; therefore these targets will require dramatic NOX emission reductions from the deployment of emission-reduction technologies. In addition, a stricter set of ambient air quality standards was adopted in 2012. The stricter air quality standards, first implemented in key cities and regions then rolled out nationwide in 2016, require all regions to substantially improve air quality. Major efforts are expected to focus on curbing fine particulate matter (PM2.5) and precursors of ozone (NOX and volatile organic compounds). While clean air action plans being developed by cities and regions now mainly target passenger vehicles and heavy-duty vehicles, shipping is also an significant source of PM2.5 and NOX emissions, especially for coastal and port regions in China. Research has found shipping accounts for 7% of global NOX emissions and 4% of global SOX emissions7; moreover, more than 70% of these emissions are emitted within 400 km within the coastal line, posing a greater threat to local environment8. Major shipping port cities in China also have found that shipping is a major and increasing source of air pollutant. For instance, the latest emissions inventory of Hong Kong found that shipping activities are now the city’s largest source of NOx and PM10 emissions, contributing to 32% of NOx, 48% of SO2, and 36% of PM10 emissions in 2010.9 Emissions from ships and port-related activities (including cargo handling equipment various vehicle types) are also found to be a major source of pollutants in Shanghai, accounting for 11.6% of SOX, 12.4% of NOX and 5.6% of PM2.5 emissions in 201010. The fact that the major international shipping and river trade hubs in China are in densely populated metropolitan areas means that emissions from shipping could pose substantial adverse impacts on urban air quality and public health. Policy makers in China are beginning to take action. Funded by the China Sustainable Energy Program, Beijing Institute of Technology is now conducting vessel testing to estimate emissions from ship activities in some China provinces. Shanghai and Hong Kong have completed their respective inventories on marine emissions. More recently Hong Kong has initiated a low sulfur
6 Ministry of Environmental Protection. MEP explains the national 12th Five-Year plan for environmental protection. 2012 [cited 2012 October 29]; Available from: http://english.mep.gov.cn/News_service/infocus/201202/t20120207_223194.htm
7 IMO. 2008. Prevention of Air Pollution from Ships [cited 2012 November 18]; Available from http://www.imo.org/blast/mainframe.asp?topic_id=233
8 Eyring, V., et al., Transport impacts on atmosphere and climate: Shipping. Atmospheric Environment, 2010. 44(37): p. 4735-4771.
9 Hong Kong Environmental Protection Department. 2012. Hong Kong Air Pollutant Emission Inventory. (http://www.epd.gov.hk/epd/english/environmentinhk/air/data/emission_inve.html, accessed Nov. 16, 2012)
10 Shanghai Environmental Monitoring Center, Study of Shanghai City port and vessel pollutant emission status and control measures, 2012.

4
fuel incentive scheme, the first of its kind in China. However, much more would need to be done for the dramatic goals for emission reduction established by the central government. The goal of this workshop brief is to introduce options for officials of ports and key regions and cities to consider when they start to develop plans for mitigating emissions from domestic and ocean-going vessels. The brief starts with introducing best practices for the design and launch of a comprehensive port clean air program that encompasses multiple measures for reducing emissions from ships and equipment and heavy-duty vehicles that operate at ports. The brief also describes and summarizes various operational and technical measures for curbing air pollution from ships. The best practice of implementing a port clean air program and the summation of emission mitigation measures are based upon the 2012 Air Quality Toolbox and experience learned from other transportation modes at the ICCT. 3. Establishing a port clean air program A port clean air program is a comprehensive strategy used to address air emissions from shipping and port operations. Such a program is generally established and implemented by a port authority with input from local air quality regulatory agencies. An effective plan sets up overarching emission-reduction targets for a port and develops a roadmap to achieve those targets. The program also must be periodically evaluated and revised after the initial implementation to ensure continued applicability. A port clean air program must be built on a firm foundation, where the port authorities and regulatory agencies are committed to the improvement of air quality in the region. Sufficient engagement from high-level national and regional regulators can provide political support and resources for the port clean air program and help overcome any potential resistance. Another important aspect of a port’s clean air program is to legitimize organizational changes and attract competent personnel to effectively execute the program. The appointment of a Clean Air Director is a critical step. Giving the director a high-level position in the port organization’s hierarchy demonstrates the upper management’s endorsement of the clean air program, endows the director with sufficient power to withstand pressure from other departments, attracts competent staff, and ensures smooth day-to-day operations related to the program. In addition, the participation from other stakeholders and regulatory agencies gives the clean air team more influence and authority over the air quality improvement in the port. Listening to inputs from customers, tenants, business partners, and other regulatory agencies would bring in different perspectives that benefits and legitimizes the clean air team’s action. The commitment and the endorsement from the upper level, a strong Clean Air Director and a competent clean air team, and collaboration from other stakeholders and regulatory agencies are paramount for a successful port clean air program. The design, implementation, evaluation, and revision of the program are built upon this foundation and require a systematic process. This process follows the Plan – Do – Check – Act (PDCA) cycle that emphasizes continual

5
improvement to the port clean air program, based on the International Organization for Standardization ISO 14000 Environmental Management System11. 3.1. Plan – Planning a clean air program The “Plan” stage is generally the most important part in the PDCA cycle. This stage has to be meticulously carried out, so that a port’s clean air program can be executed with clear targets, maximum flexibility, and minimal cost. The “Plan” stage should begin with the evaluation of other port clean air programs followed by the determination of emissions baseline and the prioritization of pollutants, the setting of goals, and the specification of technical approaches. Reviewing the experience and lessons from other ports is the start in the “Plan” stage. Many ports, chiefly in North America and Europe, have devised and implemented various port clean air programs and accumulated much useful experience and lessons. Learning their successes and setbacks will reduce the cost and shorten the learning curve for ports in China. It should be noted that during the review process, the clean air team has to take into consideration the managerial, structural, and operational differences among ports and separate port-specific experiences from general ones. For example, the regional and national gateway ports in North America operate as a regional monopoly by sharing the fairly large size of hinterlands. Most ports in China do not have such a large maneuvering room, and thus consider the competitiveness issue a more important concern. After reviewing the experience and lessons, the clean air team should begin to determine the emissions baseline and prioritize pollutants. Setting the baseline for each polluting source, such as ocean-going vessels, harbor craft, cargo handling equipment (CHE), trucks, and locomotives, would facilitate a more detailed reduction plan. A unique challenge to ports in China in this stage is the diversity of ship types and the scarcity of data. This can be partly tackled by in-port surveys and individual testing. Acquiring the data also needs collaboration from the transportation department, environmental department, and the classification society. The team also needs to consider which emissions should be included and prioritized. Like the U.S., China considers the following pollutants as “criteria air contaminants” and has developed national standards: ozone, particulate matter (10 micron, or PM10), PM2.5, sulfur dioxide, nitrogen dioxide, carbon monoxide, and lead. Prioritizing one emission that imposes the relatively higher risk to local air quality and human health becomes necessary. Recently, the risk of diesel particulate matter, especially PM2.5, became the dominant concern for many metropolitans in China. With an appropriate baseline, it is easier to set up an emission target in terms of percentage of emission baseline in a given year. The goal should be agreeable with the priority pollutant(s) and preferably set for the various operating modes for all the various equipment. The goal should also be set with a timeline and milestones, so that the effectiveness can be readily assessed. The target can also follow a national target to gain more political support. For example, the Port of Shanghai has set targets for energy consumption per cargo handling to decease by 8% by 2015 and CO2 emissions from cargo handling to decrease by 10% by 2015. Both targets are aligned with energy-saving mandates from China’s 12th Five Year Plan. Establishing a port clean air
11 ISO ISO 14000 – Environmental Management”, Available from http://www.iso.org/iso/iso14000

6
program, as described here, helps to connect the overarching target with the specific bottom-up actions needed to achieve the target. After establishing the goal and timeline, specific control measures need to be chosen. The reduction potential of these measures can be obtained from the review step or provided by technology providers. Ports should consider their own situation to select the most suitable technologies. Shore power, for example, works most effectively if a large portion of ships use liner-type service and that the energy comes from cleaner sources. However, shore power may not have significant cost effective advantages in ports where most ships make irregular calls or the port draws most electricity from coal-fired power plants that are within the air basin. Nor should the same technology necessarily be used for different modes without modification. For example, the operational measures, cost effectiveness, and maintenance can differ significantly when diesel particulate filters (DPFs) are applied to heavy-duty trucks and non-road applications such as CHE. 3.2. Do – Implementing strategies Built upon the emissions reduction plan in the last stage, the “Do” stage of a port clean air program constitutes communication aspect and a technical aspect. The communication aspect provides clear direction and resolves questions from inside and outside for the port’s clean air team. The technical aspect ensures appropriate strategies to be used. Effective communication lay out a clear picture why the change is needed and the goal of the change. It reduces the anxiety resulting from uncertainties about the overall program and reduces potential resistance. Moreover, an effective communication plan can resolve opposition before it becomes a significant impediment. For a systematic port clean air program that would affect almost everybody’s daily work, proper internal and external communication will coordinate actions within the team, motivate team members, reduce any potential resistance, and reduce concerns from other stakeholders. The implementation of new technology and operational strategies is vital to the success of a port clean air program. Despite a clear and deliberate plan made by the clean air team, applying specific techniques still presents unique challenges and requires substantial time and effort involving staff, customers, equipment manufacturers, and owners. Therefore, different implementation strategies should be evaluated, and proper procedures should be documented and followed. As policy makers have often undertaken throughout China, a pilot project is highly suggested in the port clean air program in order to provide experience, help develop a procedure manual, offer revisions to the plan, and help establish the viability of moving from a pilot to a full-scale plan. 3.3. Check – Measuring Results After the implementation of the “Do” stage, outcomes have to be measured and verified, and compared with the expected results. It is not uncommon that differences between expected and real-world results are observed. The source of deviation should be identified, and actions should

7
be taken to revise the expectation or improve procedures related to the use of the new technologies. In the “Check” stage, a sophisticated monitoring system is essential. The problems need to be tracked and recorded on time, so that they can be promptly addressed or program plans are revised in a timely manner. A monitoring system is thus essential. Of course, the frequency and precision of the monitoring need to be balanced with the cost and budget of implementing the monitoring system. A solid “Check” stage provides rich information for the next, the “Act” stage. 3.4. Act – Review the port clean air program and update regularly A port clean air program is a long-term, systematic effort, requiring continuous update and improvement. The goal of this stage is to monitor progress, plan for the future, and solidify success of a port’s clean air program. The results of this stage can also be used to motivate the morale of the clean air team and call for further support from external partners and stakeholders. A proper review of a port clean air program plays an important role in improving the program in the future. With the information from the “Check” stage, a thorough review should be carried out to inform the team and partners where the program should be improved. Importantly, after several years of implementing the clean air program, if some mistakes are found to be committed during these years, the emission inventory, saved emissions and other related information have to be revised retrospectively. Additionally, the relationship between the clean air team and other stakeholders need to be constructive. The review stage provides an opportunity to examine any potential friction with respect to outside partners in order to maintain strong collaborative relationships. Such a systematic review of a port clean air program also provides a venue to publicize the achievements of staff and recognize the contributions of partners. After a period of hard work, the recognition of effort, especially from a high level, will significantly boost the morale of the team. Besides, collaborative stakeholders are indispensable to the successful implementation of the port clean air program. The “Act” stage thus offers an opportunity to express the gratitude to outside partners. Furthermore, communicating the accomplishment with upper management and the general public will alleviate suspicions, enable further support, and facilitate the work next year. 4. Available technologies and operational strategies A successful port clean air program is dependent on the identification, evaluation, and use of appropriate technologies and operational strategies. During the “Plan” stage, a port’s clean air team needs to determine emission mitigation options and coordinate with different stakeholders to implement these measures. The team also needs to execute these measures, monitor their effectiveness, and adjust expectations in the “Do” and “Check” stages. Finally, the team has to review and reassess the air emission-reduction measures by the end of each cycle during the “Act” stage.

8
In their implementation of port clean air programs, ports in North America and Europe have accumulated much experience in using various mitigation options, and increasingly, ports throughout Asia are looking to deploy these same techniques. Table 1 below summarizes various options, lists applications and installation use, provides estimates for the reduction potential for various pollutants, and provides basic cost estimations of each option. Detailed below are four measures that have been chosen as examples due to their proven or potential emissions abatement performance. Three of them, Shore Power, Selective Catalytic Reduction, and Diesel Particulate Filter are technologies, each targeting the major pollutants (SOX, NOX, and PM). The other, vessel speed reduction, is an operational strategy that addresses all three major pollutants. It is noted that these areas are focused to reduce mobile emission (primarily marine vessels, but also applicable to trucks and various on-land port vehicles), whereas a comprehensive plan includes many other technologies as well as operational measures for ships and ports. 4.1. Vessel Speed Reduction The energy consumption of large marine engines varies dramatically with vessels’ speed. A small reduction of speed leads to a larger percentage decrease in energy and significantly lower emissions per distance traveled. Reducing vessel speed in the vicinity of populated areas around ports results in lower emission levels of almost all major air pollutants. Speed reduction, or slow steaming, requires minimum changes for marine engines. Some radar and communication devices may be updated to facilitate improved information about port navigation and thus help facilitate vessel speed changes near the port. Due to the minimal requirements in operational and engine parameters, speed reduction may lead to mitigation of air emissions with negative costs. However, the speed reduction zone has to be balanced with the trade-off of any impact on the supply chain and the possibility that a ship has to speed up during the rest of the trip in order to maintain the published schedule. The potential emission reduction from slow steaming depends on the extent of the reduction in speed, the fuel type, and the engine profile. Typically, a 10% reduction in speed results in a 15-20% reduction in fuel consumption per nautical mile. Viewing slow steaming as a powerful tool to reduce emissions, several ports in the U.S. have been encouraging ships to voluntarily reduce speed in an effort to reduce air emissions. The Voluntary Speed Reduction Programs at the ports of Los Angeles and Long Beach were so effective that both ports expanded the speed-reduction zone from 20 nautical miles to 40 nautical miles from the port. Under the program, carrier lines that achieve a 90 percent or better compliance rate in a 12-month period were eligible for a 15% reduced dockage rate (Green Rate) in the following year. 4.2. Shore Power Shore power enables ships at dock or in dry dock to use shore-side electricity to power electric systems on board, such as lighting, ventilation, communication, cargo pumps, and other critical equipment, while shutting down their auxiliary engines. The electricity comes from the local power grid through a substation at the port and is plugged to the specialized power connectors in the shore power system on the ship. The change to electricity eliminates the air emissions from the use of auxiliary engines in port.

9
Installing new shore power systems requires shore-side infrastructure and can be expensive, but can also result in major reductions in port emissions. The infrastructure is typically constituted with power connection to utility, underground vaults, power converter/transformer/switching equipment, and land for these facilities, receptacle pits, receptacles, cabling, synchronization equipment, and wharf infrastructure. Shipside infrastructure is also expensive, but the cost has been declining with more streamlined and standardized designs. The cost difference between the grid power, especially the high demand charges, and bunker is another key factor. Low price premium of electricity over HFO can provide a strong incentive to the use of the shore power. Shore power will substantially but not completely reduce SOX emissions – the steam generated by the on-board boiler is still needed for some ship’s operation at berth. Nevertheless, shore power has been widely used as a viable way to reduce ship-based local SOX emissions. The California Air Resource Board, for example, requires a fleet operator to reduce at-berth emissions from its vessels’ auxiliary engines at each California port by approximately 80 percent by 2020 either through connecting the vessel to shore power or through alternative control technique(s) that achieve equivalent emission reductions12. Major ports in Europe, such as Antwerp and Gothenburg, are also becoming receptive to the shore power13. Shore power is also being developed in some ports in China, such as Shanghai and Lianyungang. In response to the gradual penetration, the International Organization for Standardization has published a shore power standard (ISO/IEC/IEEE 80005-1:2012). It is expected that lowered cost resulting from the economy of scale and standardization will make the shore power more attractive. 4.3. Selective Catalytic Reduction Selective Catalytic Reduction (SCR) is an after-treatment technology that has exhibited dramatic and cost-effective results in reducing mobile source NOX emissions. The SCR unit is installed downstream of the engine and includes a reaction chamber, SCR catalyst, a reductant holding tank, a reductant dosing injection unit, an electronic control unit, and pumps. Ammonia, or more commonly for mobile sources a solution of 32% urea in water, is used as the reductant and is injected into the engine exhaust ahead of the SCR catalyst. When the injection or “dosing” unit releases the urea into the exhaust, the heat from the exhaust converts the urea to ammonia, which reduces nitrogen oxides in the exhaust to pure nitrogen (N2) and water across the SCR catalyst. Urea dosing must be carefully matched to engine operation – too little urea and NOX will not be reduced; too much urea and the exhaust will contain ammonia that has not been consumed across the catalyst (ammonia slip). Some systems include “open loop control” in which a pre-determined engine map is used to determine how much urea to inject based on engine speed and boost pressure. Other systems use “closed loop control” to achieve greater NOX reductions. These systems include NOX sensors after the SCR catalyst to adjust real-time urea dosing based on measured NOX levels. Some systems also include an oxidation catalyst after the SCR catalyst to capture any excess ammonia that “slips by” the catalyst – these are usually referred to as
12 California Air Resource Board (2008) At-berth Ocean-going Vessels Regulation website:
www.arb.ca.gov/ports/shorepower/shorepowerfactsheet.pdf 13 A list of ports that have been using the shore power is available at the World Ports Climate Initiative website:
http://www.ops.wpci.nl/ops-installed/ports-using-ops/
10
ammonia slip catalysts. In order to work effectively, SCR systems require a minimum exhaust temperature to convert urea into ammonia, which will vary based on system design. SCR catalyst conversion efficiency is greatly reduced when the exhaust temperature is too low. SCR systems are usually designed to turn off urea dosing if exhaust temperature falls below a predetermined minimum threshold. Closed-loop SCR systems can achieve greater than 90% reductions in NOX when operated under optimal conditions. The use of SCR systems in mobile sources started with marine engines, where the large size and steady-state operation of typical marine engines resemble those of stationary power diesel engines. SCR systems are now being more widely used for on-road heavy-duty vehicles in Europe to meet Euro IV standards and in the U.S. to meet EPA heavy-duty engine model year 2010 NOX limits. SCR is likely to be used by virtually all countries when they move to Euro IV and beyond requirements for heavy-duty vehicles, as well. SCR will find more widespread uses in new large ocean-going vessels built after 2016 when SCR technology is likely to be needed to meet IMO Tier III NOX standards for ships that operate within the North America Emission Control Area. 4.4. Diesel Particulate Filter The Diesel Particulate Filter (DPF) is an after-treatment device primarily targeting PM reduction. The filter is installed downstream of the engine and filters exhaust gas through a substrate containing channels in which solid particles are collected as the exhaust is forced through the porous channel walls. DPF technology includes passive and active systems. A passive DPF relies on the inherent heat in the engine exhaust, in conjunction with an oxidation catalyst, to oxidize the particulates collected in the filter to form gaseous products (a process termed as regeneration). Some engines and some duty cycles do not produce high enough exhaust temperature to consistently oxidize the particles collected in a passive DPF; for these applications an active DPF is required. An active DPF may include an oxidation catalyst, but it also incorporates a method to increase exhaust temperature as required to ensure filter regeneration. Methods to increase exhaust temperature include engine thermal management (i.e. retarded fuel injection timing, post injection of fuel, an air intake and/or exhaust throttle), injection of fuel into the exhaust across a catalyst, an external fuel burner, or an electric heating element. DPF systems that include an oxidation catalyst also reduce CO and VOC emissions. Engines equipped with passive DPFs that include an oxidation catalyst must be operated on diesel fuel with less than 50 ppm sulfur. Man Diesel successfully retrofitted a DPF in an ocean going vessel using diesel fuels with sulfur content as high as 500 ppm. The filter has to be cleaned every 700 hours14. Exhaust temperature data logging is often required to determine whether a particular piece or type of equipment has sufficient exhaust temperature in normal operation to utilize a passive DPF; if not, an active system should be used. Incomplete regeneration of particulates collected in the DPF filter increases engine backpressure. An exhaust backpressure sensor and dashboard-mounted indicator light should be installed to alert the operator to any problems so they can be corrected to prevent damage to the DPF or engine. The DPF filter element must be 14 Lauer P, 2012, First DPF at a Medium Speed 4-Stroke Diesel Engine on Board of an Ocean Going Vessel, 16th ETH Conference in non-Particles
11
cleaned periodically (usually on an annual basis) to remove inorganic ash that cannot be oxidized out of the filter. This ash is primarily derived from engine lubricating oil. When ultra-low sulfur fuels (<15 ppm) are used, the engine can use low-ash lube oil, which may extend the interval between required filter cleanings. The DPF can achieve up to 90% of PM reduction and 60-90% hydrocarbon (HC) and carbon monoxide (CO) reductions when ultra low sulfur fuel is used. Due to its effectiveness in emission control, DPF is widely used in on-highway heavy-duty diesel vehicles (HDV). In fact, the DPF plays an important role in meeting the Europe VI HDV standard and the U.S. EPA 2007 new heavy-duty engine standards. The DPF is also used as a viable option to reduce PM from shipping. For example, under the Rijnmond regional air quality action program, DPF was planned to be used to reduce PM for inland shipping. Because the high sulfur content in heavy fuel oil may poison the filter, DPF has limited applications in large ocean-going vessels. For these vessels, exhaust gas scrubbers are typically a more viable technology (see Table 1). Mitsui O.S.K. Line, Nippon Kaiji Kyokai, and Akasaka Diesels Ltd are paving new ground with the development and testing of a DPF on a large vessel on fuel containing 1% sulfur. In the future, the mandatory use of ultra low sulfur diesel for off-road applications will further open the door for DPF retrofits. It is clear that there are many technological and operational opportunities to bring forth major emission reductions at ports. Table 1 below summarizes various options, itemizes potential applications for use at ports, provides estimates for the reduction potential for various pollutants, and provides basic cost estimations of each option. Port clean air programs in North America and Europe have accumulated much experience in using various mitigation options, and increasingly ports throughout Asia are looking to deploy the same techniques.

12
Table 1 Technologies and operational measures to reduce air emissions from ports
Type Technology Name Application Potential Emissions Reduction
Cost (US$)
Gen
eral
Em
issi
ons C
ontr
ol T
echn
olog
ies Diesel Oxidative Catalysts
(DOC)
PM 20-30% HC 50-90% CO 70-90%
$1,000-2,000 (Truck, CHE) $3,000-4,000 (Marine)
Variable Cost (Locomotive) Closed Crankcase Ventilation (CCV)
PM 15-20% $700 ($48-50 filter replacement)
Diesel Particulate Filters (DPF)
PM up to 90% HC, CO 60-90%
$6-18K (Truck) up to $40K (Marine,
Locomotive)
Selective Catalytic Reduction (SCR)
NOX 70-90% $36K (Truck & CHE) $60K-120K (Marine)
Lean NOX Catalyst (LNC)
Moderate NOX Reductions
$14K (On-road) $40K (Off-road (limited))
Exhaust Gas Scrubbers
SOX 90-99% PM 60-80% $5M (Marine)
Shore Power
Net emissions reductions $1-15M
On-
Eng
ine
Mod
ifica
tion
Exhaust Gas Recirculation (EGR)
NOX 40-50% PM 70% (with
DPF)
$12K (Truck) $10M (Marine)
Engine Replacement, Repower, Rebuild, Refuel
NOX up to 90% PM up to 90% $0.5-1.5M
Slide Valves
PM 10-50% NOX 10-25% $1.5-16K (Marine)
Alte
rnat
ive
Fuel
s Ultra Low Sulphur Diesel (ULSD)
PM 5-15% SOX 99% Surcharge: $0.05-0.15/gal
Biodiesel Fuel (BXX)
PM 15-70% HC 10-40% CO 10-50%
Surcharge $0.25-0.40/gal
Emulsified Diesel Fuel (EDF)
NOX 10-20% PM 15-60% Surcharge $0.25-0.40/gal
Ope
ratio
nal
Stra
tegi
es Vessel Speed Reduction
(VSR)
Net reductions in NOX, PM, and other air
pollutants
Net negative cost over time (balance fuel savings and travel
time increase)
Landside Operational Improvements
Net emissions reductions
Multi-million/billion dollar improvements
Notes: = Trucks, = Cargo Handling Equipment, = Marine, and = Locomotive. 1 icon= Low or uncertain deployment, 2 icons= Emerging, 3 icons= More Widespread. The technology and operational emission reduction options are diverse, and the per cent emission reduction estimates represent the potential reduction from best practices in each area. The associated cost ranges are illustrative, based on the most common such alternatives; “K” = 1,000 USD, “M” = 1,000,000 USD. Cost estimates are based on Starcrest (2012) estimates from the Developing Port Clean Air Programs.

13
5. Conclusion Creating and implementing a port clean air program requires a systemic and comprehensive effort, requiring collaboration from all levels and sophisticated deployment of marine technologies and operational improvements. The challenge is especially profound for Chinese ports, which are facing diverse economic, structural, and operational environments. For example, the Port of Guangzhou has to address a relatively large amount of small inland vessels, while the large ocean-going vessels contribute to highest share of emissions to Shanghai. In addition, some ports, such as Shanghai and Qingdao have formed joint ventures to operate terminals, adding more complexity in coordinating the implementation of port clean air programs. Nevertheless, the reward of an effective port clean air program can be profound. Years of neglect and unregulated growth of air emissions means that there is plenty of low-hanging fruit to clean up ports. A wide range of the available actions exists, and a systematic plan to adopt a number of these measures and successfully implement them can achieve dramatic and cost-effective emission reductions and substantial environmental and human health benefits. The “Plan Do Check Act” cycle and the description of air emission mitigation strategies in this briefing offer a general illustration on how to devise, execute, evaluate, and adjust to successfully implement a port clean air program. China is now in a critical stage economically in transforming itself into a “scientific development” growth model. A strong port clean air program, along with the deployment of state-of-art emission-reduction technologies, will be a critical aspect of this transformation.