worksheet in 2211a city of st john s - final consolidated fs
TRANSCRIPT
Consolidated Financial Statements of CITY OF ST. JOHN’S December 31, 2011

CITY OF ST. JOHN’S December 31, 2011 Table of Contents PAGE Independent Auditor’s Report 1 Consolidated Statement of Operations and Accumulated Surplus 2 Consolidated Statement of Financial Position 3 Consolidated Statement of Changes in Net Debt 4 Consolidated Statement of Cash Flows 5 Notes to the Consolidated Financial Statements 6 - 21 Supplementary Schedules Consolidated Schedule of Tangible Capital Assets 22 Consolidated Schedule of Debenture Debt 23 Consolidated Schedule of Long-Term Debt 24 Consolidated Schedule of Mortgages – Urban Living Non-Profit Housing 25 Consolidated Schedule of Revenues 26 - 27 Consolidated Schedule of Expenditures 28 - 29
Deloitte & Touche LLP 10 Factory Lane Fort William Building St. John's NL A1C 6H5 Canada Tel: (709) 576-8480 Fax: (709) 576-8460 www.deloitte.ca
Independent Auditor's Report To His Worship the Mayor and Councillors, City of St. John’s We have audited the accompanying consolidated financial statements of the City of St. John’s which comprise the consolidated statement of financial position as at December 31, 2011 and the consolidated statement of operations and accumulated surplus, changes in net debt and cash flows for the year then ended, and a summary of significant accounting policies, attached schedules and other explanatory information. Management's Responsibility for the Financial Statements Management is responsible for the preparation and fair presentation of these consolidated financial statements in accordance with Canadian public sector accounting standards, and for such internal control as management determines is necessary to enable the preparation of financial statements that are free from material misstatement, whether due to fraud or error. Auditor's Responsibility Our responsibility is to express an opinion on these consolidated financial statements based on our audit. We conducted our audit in accordance with Canadian generally accepted auditing standards. Those standards require that we comply with ethical requirements and plan and perform the audit to obtain reasonable assurance about whether the consolidated financial statements are free from material misstatement. An audit involves performing procedures to obtain audit evidence about the amounts and disclosures in the consolidated financial statements. The procedures selected depend on the auditor's judgment, including the assessment of the risks of material misstatement of the consolidated financial statements, whether due to fraud or error. In making those risk assessments, the auditor considers internal control relevant to the entity's preparation and fair presentation of the consolidated financial statements in order to design audit procedures that are appropriate in the circumstances, but not for the purpose of expressing an opinion on the effectiveness of the entity's internal control. An audit also includes evaluating the appropriateness of accounting policies used and the reasonableness of accounting estimates made by management, as well as evaluating the overall presentation of the consolidated financial statements. We believe that the audit evidence we have obtained is sufficient and appropriate to provide a basis for our audit opinion. Opinion In our opinion, these consolidated financial statements present fairly, in all material respects, the financial position of the City of St. John’s as at December 31, 2011 and the results of its operations, changes in net debt and its cash flows for the year then ended in accordance with Canadian public sector accounting standards. Chartered Accountants November 26, 2012
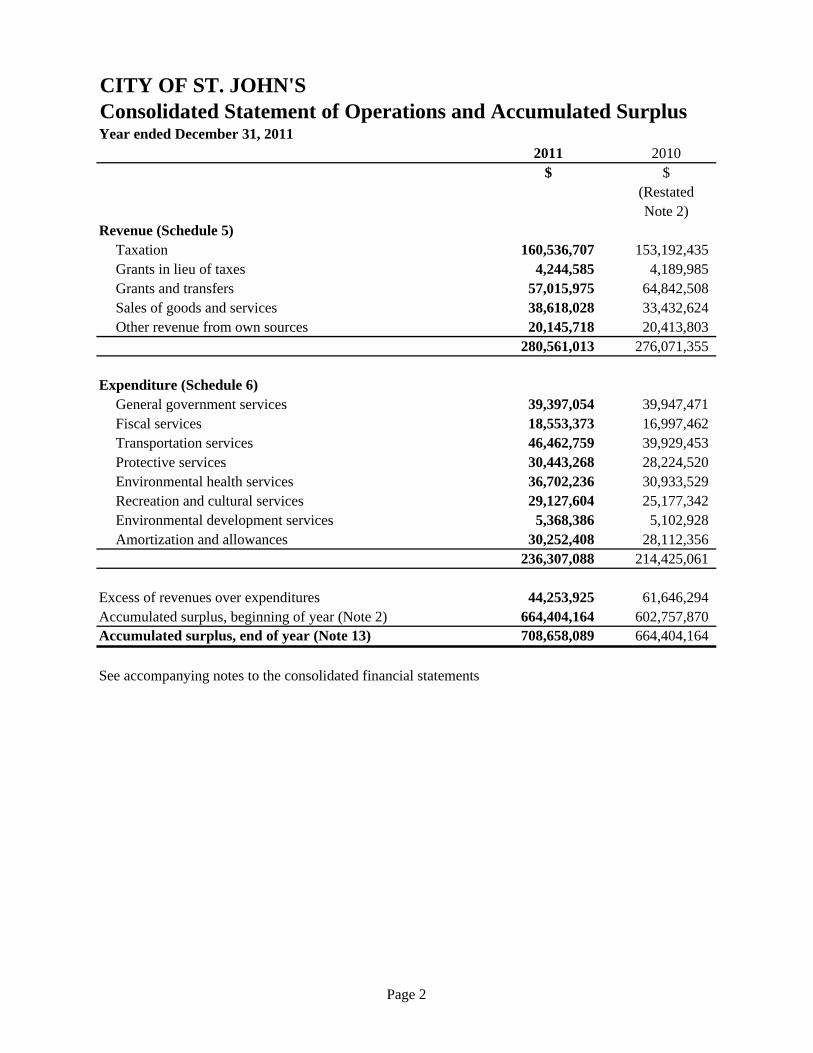
CITY OF ST. JOHN'SConsolidated Statement of Operations and Accumulated SurplusYear ended December 31, 2011
2011 2010$ $
(RestatedNote 2)
Revenue (Schedule 5)Taxation 160,536,707 153,192,435 Grants in lieu of taxes 4,244,585 4,189,985 Grants and transfers 57,015,975 64,842,508 Sales of goods and services 38,618,028 33,432,624 Other revenue from own sources 20,145,718 20,413,803
280,561,013 276,071,355
Expenditure (Schedule 6)General government services 39,397,054 39,947,471 Fiscal services 18,553,373 16,997,462 Transportation services 46,462,759 39,929,453 Protective services 30,443,268 28,224,520 Environmental health services 36,702,236 30,933,529 Recreation and cultural services 29,127,604 25,177,342 Environmental development services 5,368,386 5,102,928 Amortization and allowances 30,252,408 28,112,356
236,307,088 214,425,061
Excess of revenues over expenditures 44,253,925 61,646,294 Accumulated surplus, beginning of year (Note 2) 664,404,164 602,757,870 Accumulated surplus, end of year (Note 13) 708,658,089 664,404,164
See accompanying notes to the consolidated financial statements
Page 2

CITY OF ST. JOHN'SConsolidated Statement of Financial PositionAs at December 31, 2011
2011 2010$ $
(RestatedNote 2)
Financial assets Cash and cash equivalents (Note 3) 23,272,738 24,723,959
Short-term investments 14,253,025 - Accounts receivable - current (Note 4) 37,091,540 39,533,141 Accounts receivable - long-term (Note 5) 41,654,772 46,690,147 Investment in rental housing projects 340,872 370,835 Portfolio investments (Sinking funds) (Note 13 and Schedule 2) 75,642,202 73,424,249
192,255,149 184,742,331
Financial liabilitiesBank indebtedness (Note 15) - 11,490,127 Interim financing loan (Note 15) - 39,000,000
Payables and accruals (Note 7) 59,527,665 63,006,480 Employee benefits (Note 8) 129,803,919 119,474,498 Deferred credits 600,800 901,200 Debenture debt (Note 9) 286,500,000 225,512,000 Long-term debt (Note 10) 37,447,114 43,786,166 Trust funds payable 421,482 418,091
514,300,980 503,588,562
Net debt (322,045,831) (318,846,231)
Contingencies and commitments (Note 16)
Non-financial assets Tangible capital assets (Note 2, 6 and Schedule 1) 1,026,698,970 979,222,447 Inventory of materials and supplies 2,697,397 2,637,931
Prepaid expenditures 1,295,219 1,365,263 Unamortized bond discount 12,334 24,754
1,030,703,920 983,250,395 Accumulated surplus (Note 13) 708,658,089 664,404,164
See accompanying notes to the consolidated financial statements
On behalf of Council
_____________________________________ _____________________________________Mayor Director of Finance and City Treasurer
Page 3

CITY OF ST. JOHN'SConsolidated Statement of Change in Net DebtYear ended December 31, 2011
2011 2010$ $
(RestatedNote 2)
Excess of revenues over expenditures 44,253,925 61,646,294
Changes in tangible capital assets Acquisition of tangible capital assets (75,825,417) (109,804,447)
Net book value of tangible capital assets disposals/adjustments 23,975 78,999 Amortization of tangible capital assets 28,324,919 26,365,459 Increase in net book value of tangible capital assets (47,476,523) (83,359,989)
Changes in other non-financial assets Change in prepaid expenditures and unamortized bond discounts 82,464 117,206 Acquisition of inventory and supplies, net of usage (59,466) (129,032) Decrease (increase) in other non-financial assets 22,998 (11,826)
Increase in net debt (3,199,600) (21,725,521) Net debt, beginning of year (318,846,231) (297,120,710) Net debt, end of year (322,045,831) (318,846,231)
See accompanying notes to the consolidated financial statements
Page 4
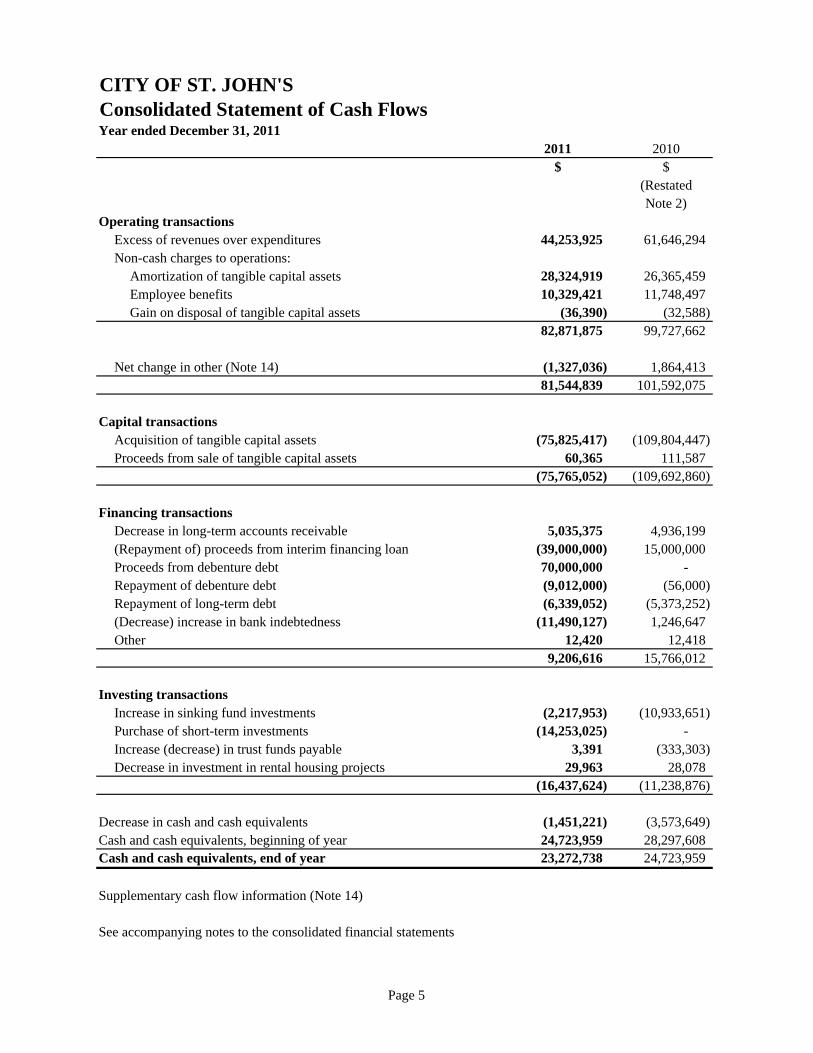
CITY OF ST. JOHN'SConsolidated Statement of Cash FlowsYear ended December 31, 2011
2011 2010$ $
(RestatedNote 2)
Operating transactions Excess of revenues over expenditures 44,253,925 61,646,294 Non-cash charges to operations:
Amortization of tangible capital assets 28,324,919 26,365,459 Employee benefits 10,329,421 11,748,497 Gain on disposal of tangible capital assets (36,390) (32,588)
82,871,875 99,727,662
Net change in other (Note 14) (1,327,036) 1,864,413 81,544,839 101,592,075
Capital transactions Acquisition of tangible capital assets (75,825,417) (109,804,447) Proceeds from sale of tangible capital assets 60,365 111,587
(75,765,052) (109,692,860)
Financing transactions Decrease in long-term accounts receivable 5,035,375 4,936,199
(Repayment of) proceeds from interim financing loan (39,000,000) 15,000,000 Proceeds from debenture debt 70,000,000 -
Repayment of debenture debt (9,012,000) (56,000) Repayment of long-term debt (6,339,052) (5,373,252) (Decrease) increase in bank indebtedness (11,490,127) 1,246,647
Other 12,420 12,418 9,206,616 15,766,012
Investing transactions Increase in sinking fund investments (2,217,953) (10,933,651)
Purchase of short-term investments (14,253,025) - Increase (decrease) in trust funds payable 3,391 (333,303)
Decrease in investment in rental housing projects 29,963 28,078 (16,437,624) (11,238,876)
Decrease in cash and cash equivalents (1,451,221) (3,573,649) Cash and cash equivalents, beginning of year 24,723,959 28,297,608 Cash and cash equivalents, end of year 23,272,738 24,723,959
Supplementary cash flow information (Note 14)
See accompanying notes to the consolidated financial statements
Page 5
CITY OF ST. JOHN’S Notes to the Consolidated Financial Statements December 31, 2011
Page 6
1. SIGNIFICANT ACCOUNTING POLICIES
The consolidated financial statements have been prepared in accordance with Canadian public sector accounting standards (“PSAS”) as recommended by the Public Sector Accounting Board (“PSAB”) of the Canadian Institute of Chartered Accountants and reflect the following significant accounting policies:
Basis of consolidation
The consolidated financial statements include all the accounts of the City of St. John’s (the “City”), St. John’s Transportation Commission and St. John’s Sports & Entertainment Ltd., which are wholly-owned and operated by the City. Any inter-company transactions have been eliminated on consolidation. Any internal revenue and expenses for the City’s Urban Living Non-Profit Housing Fund, Regional Fire Department, Regional Waste Water System, Robin Hood Bay Regional Waste Management Facility, and Regional Water Supply System have also been eliminated on consolidation.
Revenue recognition
Revenues are recognized as earned and when collection is reasonably assured. Property tax billings are prepared by the City based on the assessed values of the respective property. The tax rates are approved annually by Council. Government grants and transfers are recognized as revenue in the financial period in which events give rise to the transfer occurring, providing the transfers are authorized, any eligibility criteria have been met including performance and return requirements, and reasonable estimates of the amount can be determined.
Cash and cash equivalents
Cash and cash equivalents include cash on hand, balances with banks (net of overdrafts) and short-term deposits with original maturities of three months or less. Bank borrowings are considered to be financing activities.
Inventories
Inventories of material and supplies are carried at the lower of cost and net realizable value.
Investments in rental housing projects
Investments in rental housing projects are recorded at cost.
Short-term investments
Short-term investments are recorded at cost plus accumulated interest.

CITY OF ST. JOHN’S Notes to the Consolidated Financial Statements December 31, 2011
Page 7
1. SIGNIFICANT ACCOUNTING POLICIES (Continued)
Tangible capital assets
Tangible capital assets are recorded at cost which includes all amounts that are directly attributable to acquisition, construction, development or betterment of the asset. The cost, less residual value, of the tangible capital assets is amortized on a straight-line basis over their estimated useful lives as follows: Buildings 45 years Vehicles Transit buses 7-12 years Vehicles 7-20 years Computer hardware and software 5 years Other Machinery and equipment 15-20 years Water and waste plants and networks Underground networks 75 years Sewage treatment plants and lift stations 45 years Water pumping stations and reservoirs 45 years Flood stations and other infrastructure 45 years Transportation Roads 35 years Bridges and structures 50 years One-half of the annual amortization is charged in the year of acquisition and in the year of disposal. Assets under construction are not amortized until the asset is available for productive use.
Contribution of tangible capital assets
Contributions of tangible capital assets are recorded at fair value at the date of receipt. The contribution is recorded as revenue.
Leases
Leases are classified as capital or operating leases. Leases which transfer substantially all the benefits and risks incidental to ownership of property are accounted for as capital leases. All other leases are accounted for as operating leases and the related lease payments are charged to expense.
Bond discounts
Bond discounts are amortized and expensed over the term of the related bond issue.
Assessments
Assessments for water and sewer installations and street improvements are recorded on an accrual basis.

CITY OF ST. JOHN’S Notes to the Consolidated Financial Statements December 31, 2011
Page 8
1. SIGNIFICANT ACCOUNTING POLICIES (Continued)
Portfolio investments (Sinking funds)
Sinking funds established for the retirement of debentures are held and administered by a third party and accounted for in the City’s records on an accrual basis.
Reserve for snow and ice management
The City has established a snow and ice management reserve, to a maximum of $2,000,000, to accumulate funds to be used in years of severe winter conditions.
Reserve for Civic Centre financing
The City has established a Civic Centre financing reserve to accumulate its share of revenue received from the accommodations’ tax. The accommodations’ tax, which was legislated effective January 1, 1999, represents a three percent room levy on all fixed roof accommodations in the City of St. John’s. The funds in the reserve are used to reduce the debt related to the construction of the St. John’s Convention centre and to pay for capital improvements for the facility.
Solid waste landfill closure and post-closure costs
The liability for closure and post-closure care of the City’s Robin Hood Bay landfill is recognized as the landfill site’s capacity is used. Closure costs are included in annual operating costs as each section of the landfill site is filled and placed out of service. The present value of the estimated annual post-closure costs is being accrued over the remaining life of the landfill site.
Severance pay
The City accounts for severance pay on the accrual basis and the amount is calculated based upon accumulated unused sick leave or on years of service. The amount is payable when the employee ceases employment with the City.
Accrued pension benefits
The cost and obligation of pension benefits, earned by employees and members of Council, are actuarially determined using the accrued benefit method prorated on service and management’s best estimate of assumptions of future investment returns for funded plans, salary changes and retirement ages of employees. For the purpose of calculating the expected return on plan assets, those assets are valued at fair value. The discount rate used for determining the benefit obligation is the expected rate of return on plan assets or the City’s cost of borrowing. Past service costs resulting from plan amendments are recognized at the date of amendment. The excess of the net actuarial gain (loss) is amortized over the average remaining service period of active employees. The average remaining service period of the active employees covered by the employee plan is 14.7 years and 1.2 years for the Mayor and Councillors’ plan.

CITY OF ST. JOHN’S Notes to the Consolidated Financial Statements December 31, 2011
Page 9
1. SIGNIFICANT ACCOUNTING POLICIES (Continued)
Employee future benefits
The City provides post retirement benefits in the form of extended life and health coverage to employees. The cost and obligations of these benefits earned by employees are actuarially determined using the accrued benefit method prorated on service and management’s best estimate of assumptions and future claim rates and costs. There is no requirement to fund these future obligations on a current basis.
Use of estimates
In preparing the City’s financial statements in conformity with PSAS, management is required to make estimates and assumptions that affect the reported amounts of assets and liabilities, the disclosure of contingent assets and liabilities at the date of the financial statements, and reported amounts of revenue and expenses during the year. Actual results could differ from these estimates.
2. RESTATEMENT OF PREVIOUSLY ISSUED FINANCIAL STATEMENTS
The December 31, 2010 figures have been restated to record capital contributions from developers for 2007, 2008, 2009, and 2010. The restatement has resulted in an increase of accumulated surplus and tangible capital assets for 2009 and prior of $47,491,767 and for 2010 of $19,667,183.

CITY OF ST. JOHN’S Notes to the Consolidated Financial Statements December 31, 2011
Page 10
2. RESTATEMENT OF PREVIOUSLY ISSUED FINANCIAL STATEMENTS (Continued)
As perviouslyreported As re-stated
Dec. 31, 2010 Dec. 31, 2010 Restatement$ $ $
Statement of Operations andAccumulated Surplus
RevenueGrants and transfers 44,301,418 64,842,508 20,541,090
ExpenditureAmortization and allowances 27,238,449 28,112,356 873,907
Excess of revenue over expenditure 41,979,111 61,646,294 19,667,183 Accumulated surplus, beginning of year 555,266,103 602,757,870 47,491,767 Accumulated surplus, end of year 597,245,214 664,404,164 67,158,950
Statement of Financial PositionTangible capital assets (Note 6) 912,063,497 979,222,447 67,158,950 Accumulated surplus, end of year 597,245,214 664,404,164 67,158,950
Statement of Changes in Cash FlowsExcess of revenue over expenditure 41,979,111 61,646,294 19,667,183 Amortization of tangible capital assets 25,491,552 26,365,459 873,907 Acquisition of tangible capital assets (89,263,357) (109,804,447) 20,541,090
Statement of Changes in Net DebtExcess of revenue over expenditure 41,979,111 61,646,294 19,667,183 Changes in tangible capital assets
Acquisition of tangible capital assets (89,263,357) (109,804,447) (20,541,090) Amortization of tangible capital assets 25,491,552 26,365,459 873,907

CITY OF ST. JOHN’S Notes to the Consolidated Financial Statements December 31, 2011
Page 11
3. CASH AND CASH EQUIVALENTS
2011 2010$ $
Cash 10,890,245 - Restricted cash deposits:
Accommodation tax 717,826 728,498 Public Transit Fund 4,399,020 19,034,095 Robin Hood Bay post closure costs (Note 17) 3,622,775 2,400,000 Robin Hood Bay equipment replacement 1,417,902 850,741 Convention Centre Equipment replacement 300,000 - Northeast Avalon Regional Plan 329,833 313,202 Advance payments from developers 421,482 418,091 Urban living non-profit housing:
Tenants' security deposits 104,419 103,930 Replacement reserve fund 1,069,236 875,402
23,272,738 24,723,959 The Public Transit Fund consists of funds that have been received in advance of expenditure under the Federal Provincial Public Transit funding agreement signed October 23, 2007. The funds are being used to construct a modern transit depot. The City has agreements with Canada Mortgage and Housing Corporation (“CMHC”) and Newfoundland and Labrador Housing Corporation (“NLHC”) which stipulate that cash be set aside for a replacement reserve fund.
4. ACCOUNTS RECEIVABLE - CURRENT
2011 2010$ $
Taxes 6,322,672 7,283,172 Other governments 19,434,694 22,598,367 Other 11,334,174 9,651,602
37,091,540 39,533,141
CITY OF ST. JOHN’S Notes to the Consolidated Financial Statements December 31, 2011
Page 12
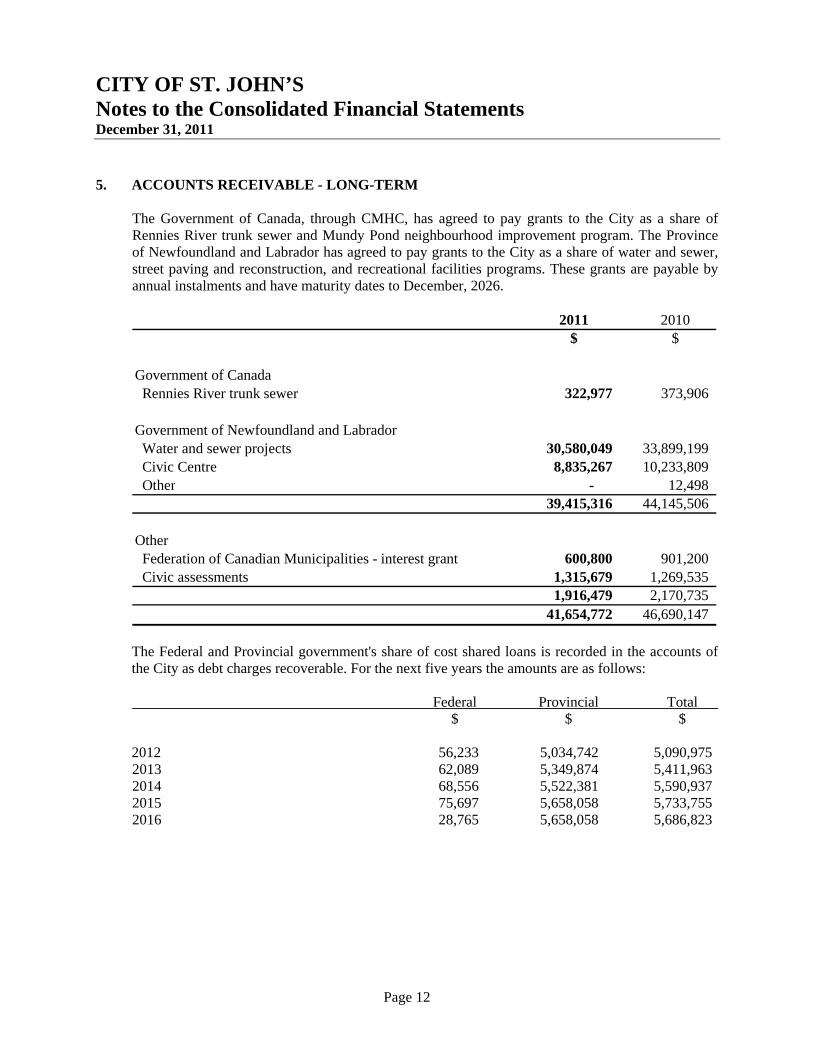
5. ACCOUNTS RECEIVABLE - LONG-TERM
The Government of Canada, through CMHC, has agreed to pay grants to the City as a share of Rennies River trunk sewer and Mundy Pond neighbourhood improvement program. The Province of Newfoundland and Labrador has agreed to pay grants to the City as a share of water and sewer, street paving and reconstruction, and recreational facilities programs. These grants are payable by annual instalments and have maturity dates to December, 2026.
2011 2010$ $
Government of Canada Rennies River trunk sewer 322,977 373,906
Government of Newfoundland and Labrador Water and sewer projects 30,580,049 33,899,199 Civic Centre 8,835,267 10,233,809 Other - 12,498
39,415,316 44,145,506
Other Federation of Canadian Municipalities - interest grant 600,800 901,200 Civic assessments 1,315,679 1,269,535
1,916,479 2,170,735 41,654,772 46,690,147
The Federal and Provincial government's share of cost shared loans is recorded in the accounts of the City as debt charges recoverable. For the next five years the amounts are as follows: Federal Provincial Total $ $ $ 2012 56,233 5,034,742 5,090,975 2013 62,089 5,349,874 5,411,963 2014 68,556 5,522,381 5,590,937 2015 75,697 5,658,058 5,733,755 2016 28,765 5,658,058 5,686,823
CITY OF ST. JOHN’S Notes to the Consolidated Financial Statements December 31, 2011
Page 13
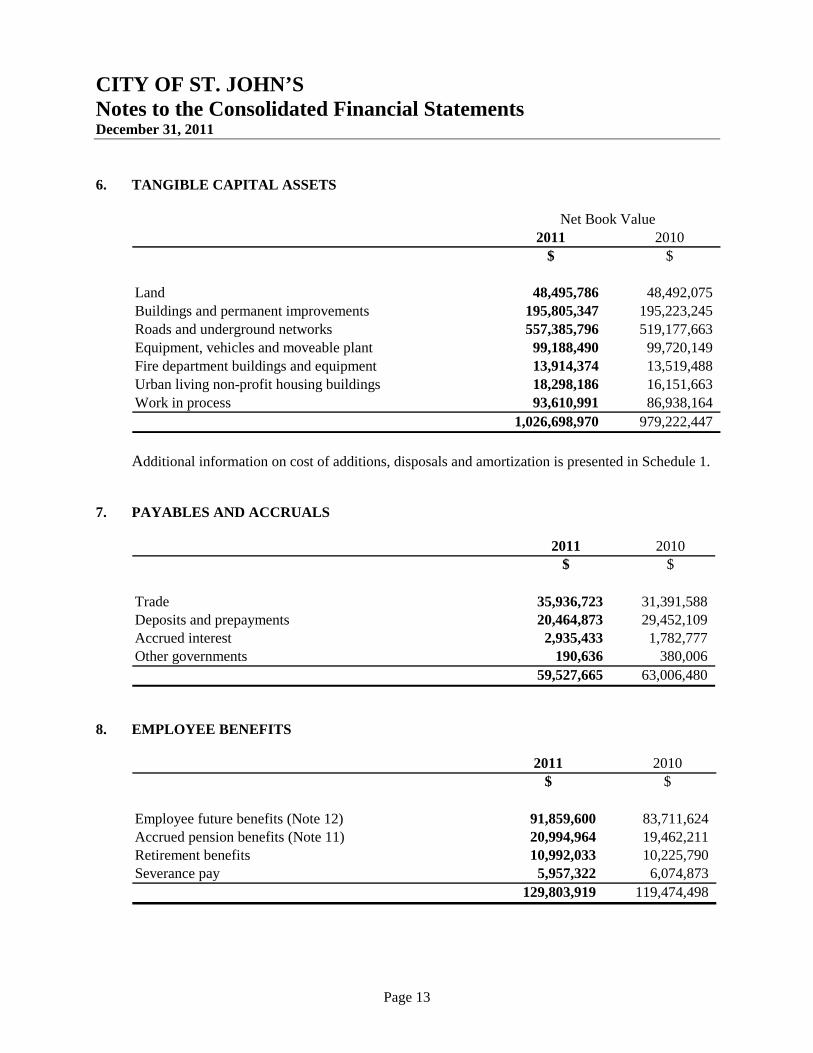
6. TANGIBLE CAPITAL ASSETS
2011 2010$ $
Land 48,495,786 48,492,075 Buildings and permanent improvements 195,805,347 195,223,245 Roads and underground networks 557,385,796 519,177,663 Equipment, vehicles and moveable plant 99,188,490 99,720,149 Fire department buildings and equipment 13,914,374 13,519,488 Urban living non-profit housing buildings 18,298,186 16,151,663 Work in process 93,610,991 86,938,164
1,026,698,970 979,222,447
Net Book Value
Additional information on cost of additions, disposals and amortization is presented in Schedule 1.
7. PAYABLES AND ACCRUALS
2011 2010$ $
Trade 35,936,723 31,391,588 Deposits and prepayments 20,464,873 29,452,109 Accrued interest 2,935,433 1,782,777 Other governments 190,636 380,006
59,527,665 63,006,480
8. EMPLOYEE BENEFITS
2011 2010$ $
Employee future benefits (Note 12) 91,859,600 83,711,624 Accrued pension benefits (Note 11) 20,994,964 19,462,211 Retirement benefits 10,992,033 10,225,790 Severance pay 5,957,322 6,074,873
129,803,919 119,474,498
CITY OF ST. JOHN’S Notes to the Consolidated Financial Statements December 31, 2011
Page 14
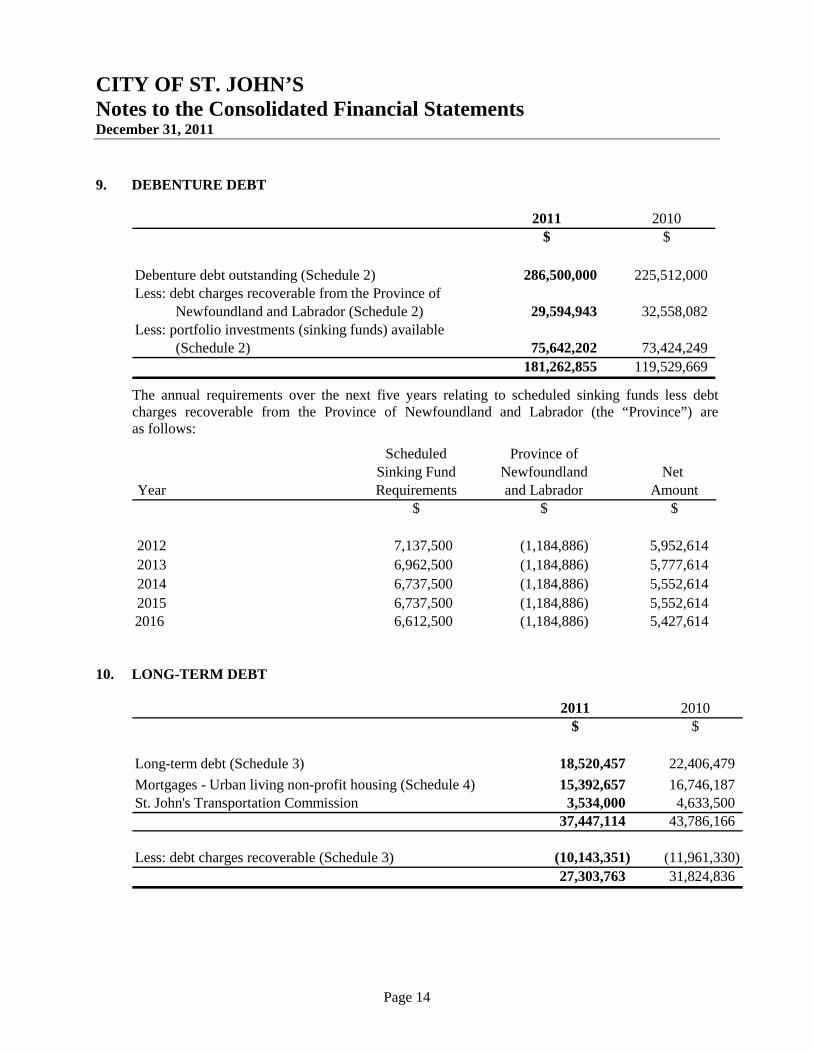
9. DEBENTURE DEBT
2011 2010$ $
Debenture debt outstanding (Schedule 2) 286,500,000 225,512,000 Less: debt charges recoverable from the Province of
Newfoundland and Labrador (Schedule 2) 29,594,943 32,558,082 Less: portfolio investments (sinking funds) available
(Schedule 2) 75,642,202 73,424,249 181,262,855 119,529,669
The annual requirements over the next five years relating to scheduled sinking funds less debt charges recoverable from the Province of Newfoundland and Labrador (the “Province”) are as follows:
Scheduled Province ofSinking Fund Newfoundland Net
Year Requirements and Labrador Amount$ $ $
2012 7,137,500 (1,184,886) 5,952,614 2013 6,962,500 (1,184,886) 5,777,614 2014 6,737,500 (1,184,886) 5,552,614 2015 6,737,500 (1,184,886) 5,552,614 2016 6,612,500 (1,184,886) 5,427,614
10. LONG-TERM DEBT
2011 2010$ $
Long-term debt (Schedule 3) 18,520,457 22,406,479 Mortgages - Urban living non-profit housing (Schedule 4) 15,392,657 16,746,187 St. John's Transportation Commission 3,534,000 4,633,500
37,447,114 43,786,166
Less: debt charges recoverable (Schedule 3) (10,143,351) (11,961,330) 27,303,763 31,824,836

CITY OF ST. JOHN’S Notes to the Consolidated Financial Statements December 31, 2011
Page 15
10. LONG-TERM DEBT (Continued)
Annual principal repayments over the next five years relating to retirement of long-term debt are as follows:
Province ofNon-Profit St. John's Newfoundland
Long-term Housing Transportation and Labrador NetYear Debt Mortgages Commission Share Amount
$ $ $ $ $
2012 4,020,511 1,402,504 3,534,000 (1,945,818) 7,011,197 2013 4,155,420 1,438,516 - (2,073,416) 3,520,5202014 4,128,524 1,475,528 - (2,046,904) 3,557,1482015 4,047,896 1,513,578 - (1,971,372) 3,590,1022016 2,103,861 1,552,684 - (2,074,202) 1,582,343Thereafter 64,244 8,009,846 - (31,638) 8,042,452
The Province’s portion of cost shared loans is recorded in the accounts of the City as debt charges recoverable in accounts receivable. Mortgages of the Urban Living Non-Profit Housing Fund are secured by specific rental properties situated in St. John’s and an assignment of rental income.
11. ACCRUED PENSION BENEFITS
2011 2010$ $
City of St. John's - Employees 17,815,679 16,197,436 City of St. John's - Mayor and Councillors 2,884,900 2,789,700 St. John's Transportation Commission 294,385 475,075
20,994,964 19,462,211
Pension plans
The City maintains a defined benefit plan which provides pension benefits to its employees. The City also maintains a supplementary retirement arrangement for the members of Council. Both plans provide benefits based on length of service and average earnings. An actuarial valuation of the plans was completed as at December 31, 2007 for the Mayor and Councillors, December 31, 2009 for the St. John’s Transportation Commission plans and December 31, 2010 for Employees plan as described below.
CITY OF ST. JOHN’S Notes to the Consolidated Financial Statements December 31, 2011
Page 16
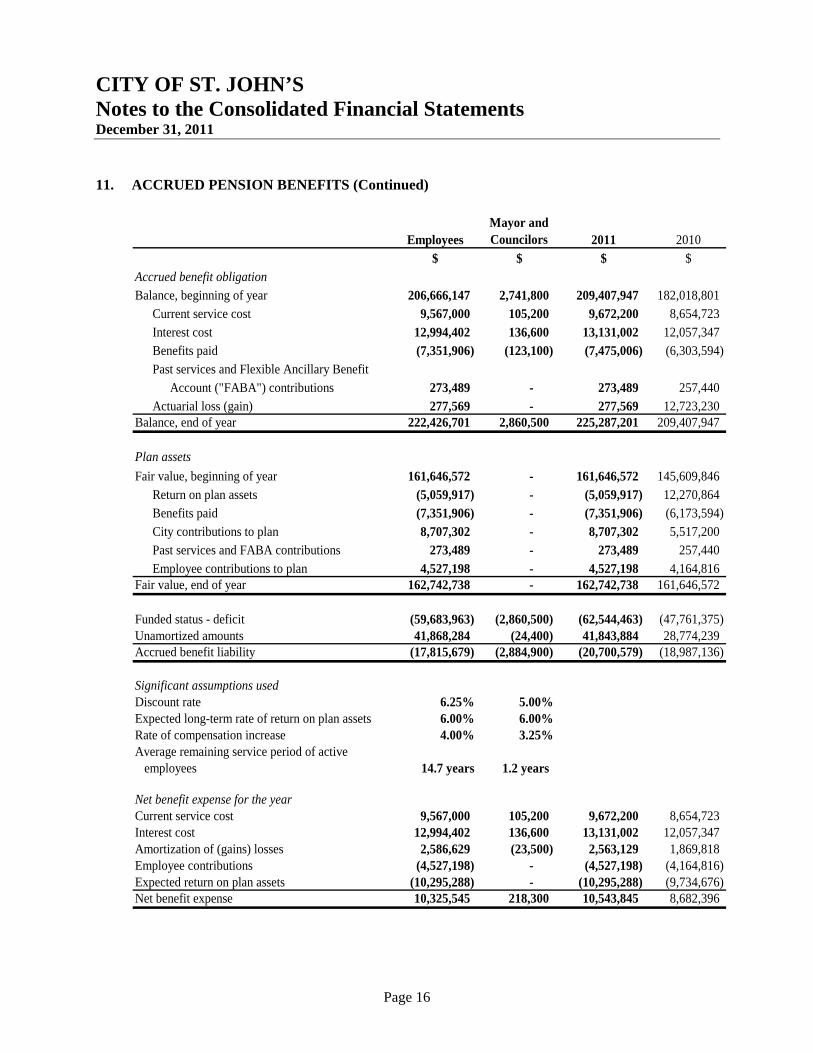
11. ACCRUED PENSION BENEFITS (Continued)
EmployeesMayor and Councilors 2011 2010
$ $ $ $Accrued benefit obligation
Balance, beginning of year 206,666,147 2,741,800 209,407,947 182,018,801 Current service cost 9,567,000 105,200 9,672,200 8,654,723 Interest cost 12,994,402 136,600 13,131,002 12,057,347 Benefits paid (7,351,906) (123,100) (7,475,006) (6,303,594) Past services and Flexible Ancillary Benefit
Account ("FABA") contributions 273,489 - 273,489 257,440 Actuarial loss (gain) 277,569 - 277,569 12,723,230
Balance, end of year 222,426,701 2,860,500 225,287,201 209,407,947
Plan assets
Fair value, beginning of year 161,646,572 - 161,646,572 145,609,846 Return on plan assets (5,059,917) - (5,059,917) 12,270,864 Benefits paid (7,351,906) - (7,351,906) (6,173,594) City contributions to plan 8,707,302 - 8,707,302 5,517,200 Past services and FABA contributions 273,489 - 273,489 257,440 Employee contributions to plan 4,527,198 - 4,527,198 4,164,816
Fair value, end of year 162,742,738 - 162,742,738 161,646,572
Funded status - deficit (59,683,963) (2,860,500) (62,544,463) (47,761,375) Unamortized amounts 41,868,284 (24,400) 41,843,884 28,774,239 Accrued benefit liability (17,815,679) (2,884,900) (20,700,579) (18,987,136)
Significant assumptions usedDiscount rate 6.25% 5.00%Expected long-term rate of return on plan assets 6.00% 6.00%Rate of compensation increase 4.00% 3.25%Average remaining service period of active
14.7 years 1.2 years
Net benefit expense for the yearCurrent service cost 9,567,000 105,200 9,672,200 8,654,723 Interest cost 12,994,402 136,600 13,131,002 12,057,347 Amortization of (gains) losses 2,586,629 (23,500) 2,563,129 1,869,818 Employee contributions (4,527,198) - (4,527,198) (4,164,816) Expected return on plan assets (10,295,288) - (10,295,288) (9,734,676) Net benefit expense 10,325,545 218,300 10,543,845 8,682,396
employees
CITY OF ST. JOHN’S Notes to the Consolidated Financial Statements December 31, 2011
Page 17
11. ACCRUED PENSION BENEFITS (Continued)
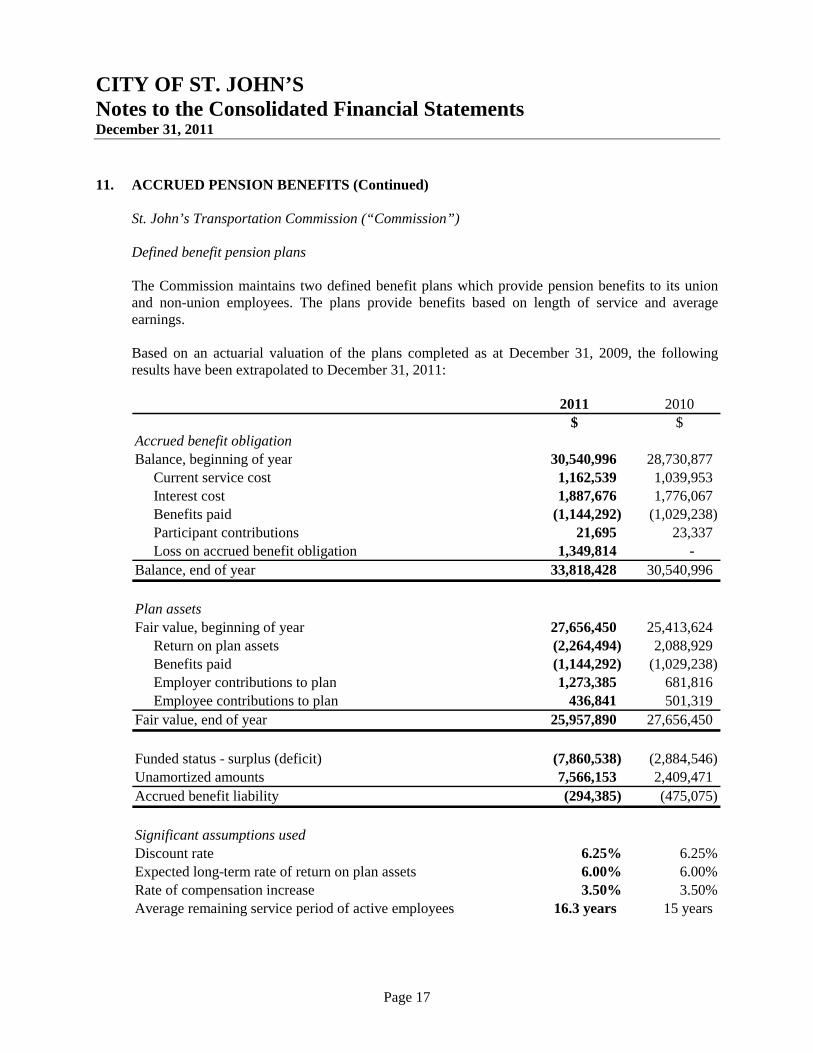
St. John’s Transportation Commission (“Commission”)
Defined benefit pension plans The Commission maintains two defined benefit plans which provide pension benefits to its union and non-union employees. The plans provide benefits based on length of service and average earnings. Based on an actuarial valuation of the plans completed as at December 31, 2009, the following results have been extrapolated to December 31, 2011:
2011 2010$ $
Accrued benefit obligationBalance, beginning of year 30,540,996 28,730,877
Current service cost 1,162,539 1,039,953 Interest cost 1,887,676 1,776,067 Benefits paid (1,144,292) (1,029,238) Participant contributions 21,695 23,337 Loss on accrued benefit obligation 1,349,814 -
Balance, end of year 33,818,428 30,540,996
Plan assetsFair value, beginning of year 27,656,450 25,413,624
Return on plan assets (2,264,494) 2,088,929 Benefits paid (1,144,292) (1,029,238) Employer contributions to plan 1,273,385 681,816 Employee contributions to plan 436,841 501,319
Fair value, end of year 25,957,890 27,656,450
Funded status - surplus (deficit) (7,860,538) (2,884,546) Unamortized amounts 7,566,153 2,409,471 Accrued benefit liability (294,385) (475,075)
Significant assumptions usedDiscount rate 6.25% 6.25%Expected long-term rate of return on plan assets 6.00% 6.00%Rate of compensation increase 3.50% 3.50%Average remaining service period of active employees 16.3 years 15 years

CITY OF ST. JOHN’S Notes to the Consolidated Financial Statements December 31, 2011
Page 18
11. ACCRUED PENSION BENEFITS (Continued)
2011 2010$ $
Net benefit expense for the year
Current service cost 1,162,539 1,039,953 Interest cost 1,887,676 1,776,067 Amortization of losses 183,089 217,527 Liability increase due to flexible contributions 21,695 23,337 Employee contributions (436,841) (501,319) Expected return on plan assets (1,725,463) (1,574,575) Net benefit expense 1,092,695 980,990
12. EMPLOYEE FUTURE BENEFITS Both the City and the Commission provide post-retirement health and life benefits to their retired employees. The actuarial valuation of the plan completed as at December 31, 2009, extrapolated to December 31, 2011 is presented below.
2010City Commission Total Total
$ $ $ $Accrued benefit obligationBalance, beginning of year 88,460,600 7,600,953 96,061,553 90,002,052
Current service cost 3,521,300 224,825 3,746,125 3,568,743 Interest cost 4,462,400 409,643 4,872,043 4,566,287 Estimated claims and
expenses (1,945,800) (254,778) (2,200,578) (2,075,529) Gain(loss) on benefits
obligation - (114,471) (114,471) - Balance, end of year 94,498,500 7,866,172 102,364,672 96,061,553
Funded status - deficit 94,498,500 7,866,172 102,364,672 96,061,553 Unamortized amounts (9,364,600) (1,140,472) (10,505,072) (12,349,929) Accrued benefit liability 85,133,900 6,725,700 91,859,600 83,711,624
2011
CITY OF ST. JOHN’S Notes to the Consolidated Financial Statements December 31, 2011
Page 19
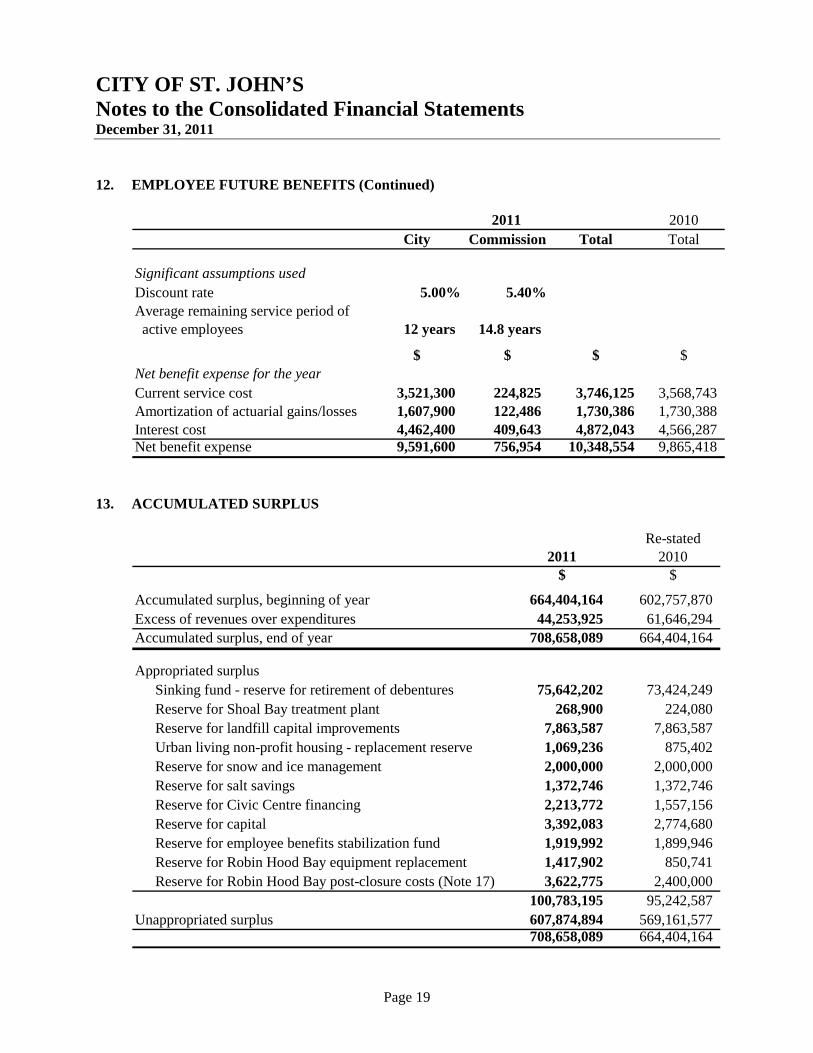
12. EMPLOYEE FUTURE BENEFITS (Continued)
2010City Commission Total Total
Significant assumptions usedDiscount rate 5.00% 5.40%Average remaining service period of active employees 12 years 14.8 years
$ $ $ $Net benefit expense for the yearCurrent service cost 3,521,300 224,825 3,746,125 3,568,743 Amortization of actuarial gains/losses 1,607,900 122,486 1,730,386 1,730,388 Interest cost 4,462,400 409,643 4,872,043 4,566,287 Net benefit expense 9,591,600 756,954 10,348,554 9,865,418
2011
13. ACCUMULATED SURPLUS
Re-stated2011 2010
$ $
Accumulated surplus, beginning of year 664,404,164 602,757,870 Excess of revenues over expenditures 44,253,925 61,646,294 Accumulated surplus, end of year 708,658,089 664,404,164
Appropriated surplus Sinking fund - reserve for retirement of debentures 75,642,202 73,424,249 Reserve for Shoal Bay treatment plant 268,900 224,080 Reserve for landfill capital improvements 7,863,587 7,863,587 Urban living non-profit housing - replacement reserve 1,069,236 875,402 Reserve for snow and ice management 2,000,000 2,000,000 Reserve for salt savings 1,372,746 1,372,746 Reserve for Civic Centre financing 2,213,772 1,557,156 Reserve for capital 3,392,083 2,774,680 Reserve for employee benefits stabilization fund 1,919,992 1,899,946 Reserve for Robin Hood Bay equipment replacement 1,417,902 850,741 Reserve for Robin Hood Bay post-closure costs (Note 17) 3,622,775 2,400,000
100,783,195 95,242,587 Unappropriated surplus 607,874,894 569,161,577
708,658,089 664,404,164
CITY OF ST. JOHN’S Notes to the Consolidated Financial Statements December 31, 2011
Page 20
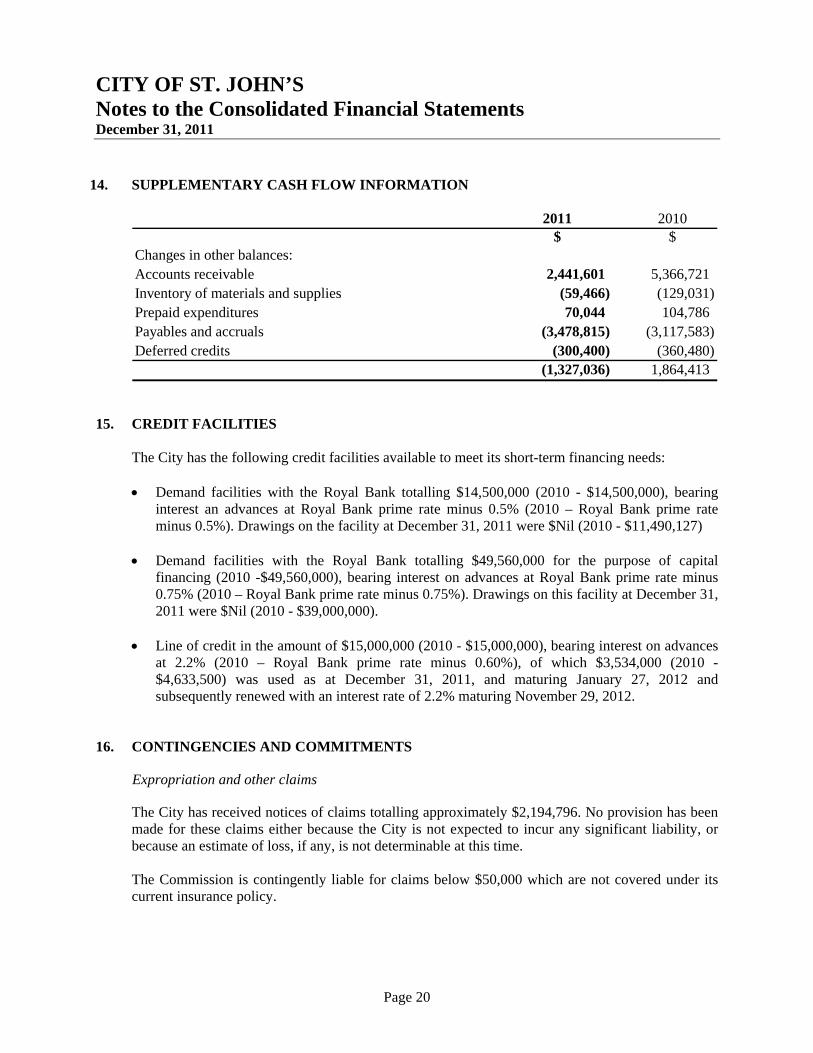
14. SUPPLEMENTARY CASH FLOW INFORMATION
2011 2010$ $
Changes in other balances:Accounts receivable 2,441,601 5,366,721 Inventory of materials and supplies (59,466) (129,031) Prepaid expenditures 70,044 104,786 Payables and accruals (3,478,815) (3,117,583) Deferred credits (300,400) (360,480)
(1,327,036) 1,864,413 15. CREDIT FACILITIES
The City has the following credit facilities available to meet its short-term financing needs: Demand facilities with the Royal Bank totalling $14,500,000 (2010 - $14,500,000), bearing
interest an advances at Royal Bank prime rate minus 0.5% (2010 – Royal Bank prime rate minus 0.5%). Drawings on the facility at December 31, 2011 were $Nil (2010 - $11,490,127)
Demand facilities with the Royal Bank totalling $49,560,000 for the purpose of capital
financing (2010 -$49,560,000), bearing interest on advances at Royal Bank prime rate minus 0.75% (2010 – Royal Bank prime rate minus 0.75%). Drawings on this facility at December 31, 2011 were $Nil (2010 - $39,000,000).
Line of credit in the amount of $15,000,000 (2010 - $15,000,000), bearing interest on advances
at 2.2% (2010 – Royal Bank prime rate minus 0.60%), of which $3,534,000 (2010 - $4,633,500) was used as at December 31, 2011, and maturing January 27, 2012 and subsequently renewed with an interest rate of 2.2% maturing November 29, 2012.
16. CONTINGENCIES AND COMMITMENTS
Expropriation and other claims
The City has received notices of claims totalling approximately $2,194,796. No provision has been made for these claims either because the City is not expected to incur any significant liability, or because an estimate of loss, if any, is not determinable at this time. The Commission is contingently liable for claims below $50,000 which are not covered under its current insurance policy.

CITY OF ST. JOHN’S Notes to the Consolidated Financial Statements December 31, 2011
Page 21
16. CONTINGENCIES AND COMMITMENTS (Continued)
Lease commitments
Under the terms of long-term operating leases on equipment, the City is required to make annual lease payments for the next five years as follows:
2012 2,888,885 2013 2,410,821 2014 1,576,486 2015 526,450 2016 476,280
Greenbelt Tennis Club
The City has guaranteed a loan of $150,000 for the replacement of an air supported structure.
17. ROBIN HOOD BAY CLOSURE AND POST-CLOSURE COSTS
The liability for closure and post-closure care of the Robin Hood Bay landfill is recognized as the landfill site’s capacity is used. Closure costs include the final cover and landscaping while post-closure costs include cap maintenance, groundwater and leachate monitoring, continued gas management operations, inspections and annual reports. The liability recognized in the consolidated financial statement is subject to measurement uncertainty. The recognized amounts are based on the City’s best information and judgement. Amounts could materially change in the long-term.
Estimated closure and post-closure costs over the next 37 years $47,000,000 Discount rate 5% Discounted cost $7,728,475 Expected year capacity will be reached 2049 Percent utilized 5% Liability based on the percentage utilized $579,636 The tipping fees charged by the City to all users, including the City itself, other municipalities and commercial users include a provision for closure and post-closure costs which is contributed to an interest-bearing reserve to accumulate the funds that will be required at each closure and post-closure phase. The balance in the reserve at December 31, 2011 was $ 3,622,775.

CITY OF ST. JOHN'S Schedule 1
Consolidated Schedule of Tangible Capital AssetsYear Ended December 31, 2011
Urban LivingBuildings & Roads & Equipment, Fire Department Non-profitPermanent Underground Vehicles & Buildings & Work in Housing 2011
Land Improvements Networks Moveable Plant Equipment Process Buildings Totals$ $ $ $ $ $ $ $
(RestatedNote 2)
CostBalance, beginning of year re-stated 48,492,075 243,172,912 664,879,645 159,563,877 19,665,970 86,938,164 30,922,838 1,253,635,481 Add: Additions during the year 3,711 6,813,127 49,873,418 8,226,742 1,257,500 74,981,936 2,978,092 144,134,526 Less: Disposals during the year - - - (1,192,455) (449,888) - - (1,642,343) Adjustments - - - - - (68,309,109) - (68,309,109) Balance, end of year 48,495,786 249,986,039 714,753,063 166,598,164 20,473,582 93,610,991 33,900,930 1,327,818,555
Accumulated amortizationBalance, beginning of year re-stated - 47,949,668 145,701,982 59,843,728 6,146,482 - 14,771,175 274,413,035 Add: Additions during the year - 6,231,024 11,665,285 8,734,426 862,613 - 831,571 28,324,919 Less: Disposals during the year - - - (1,168,480) (449,889) - - (1,618,369) Balance, end of year - 54,180,692 157,367,267 67,409,674 6,559,206 - 15,602,746 301,119,585 Net book value of tangible capital assets 48,495,786 195,805,347 557,385,796 99,188,490 13,914,376 93,610,991 18,298,184 1,026,698,970
Page 22
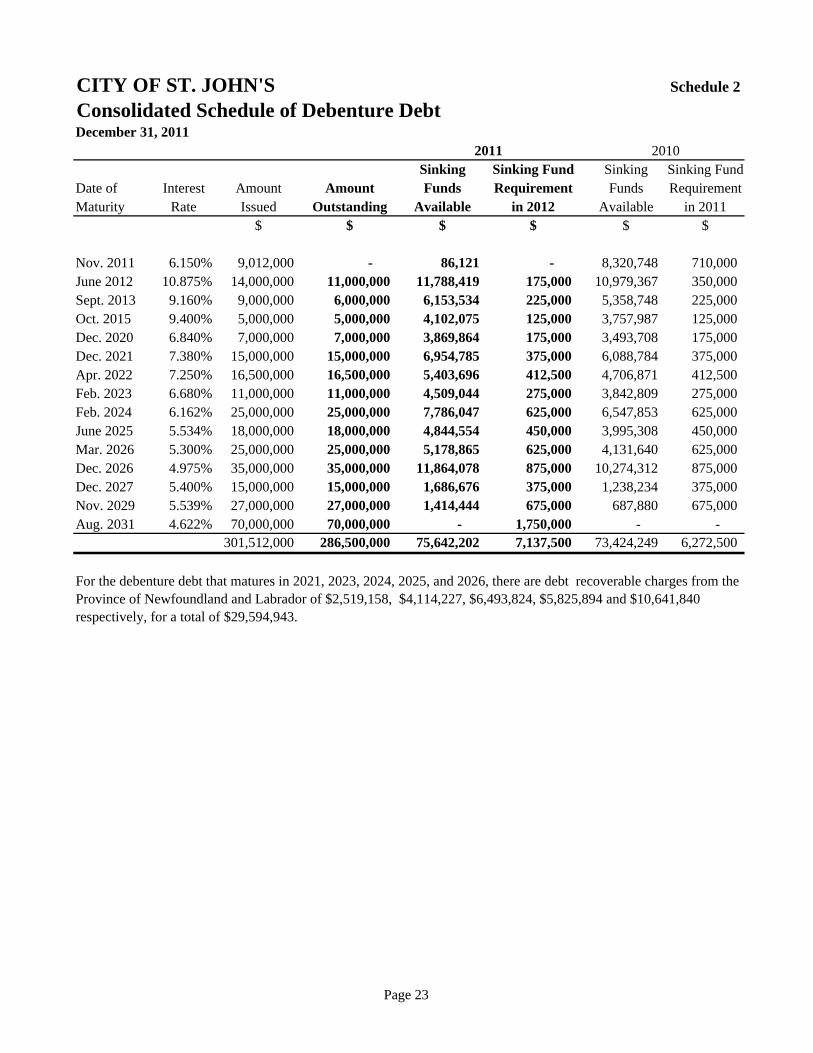
CITY OF ST. JOHN'S Schedule 2
Consolidated Schedule of Debenture DebtDecember 31, 2011
Sinking Sinking Fund Sinking Sinking FundDate of Interest Amount Amount Funds Requirement Funds RequirementMaturity Rate Issued Outstanding Available in 2012 Available in 2011
$ $ $ $ $ $
Nov. 2011 6.150% 9,012,000 - 86,121 - 8,320,748 710,000 June 2012 10.875% 14,000,000 11,000,000 11,788,419 175,000 10,979,367 350,000 Sept. 2013 9.160% 9,000,000 6,000,000 6,153,534 225,000 5,358,748 225,000 Oct. 2015 9.400% 5,000,000 5,000,000 4,102,075 125,000 3,757,987 125,000 Dec. 2020 6.840% 7,000,000 7,000,000 3,869,864 175,000 3,493,708 175,000 Dec. 2021 7.380% 15,000,000 15,000,000 6,954,785 375,000 6,088,784 375,000 Apr. 2022 7.250% 16,500,000 16,500,000 5,403,696 412,500 4,706,871 412,500 Feb. 2023 6.680% 11,000,000 11,000,000 4,509,044 275,000 3,842,809 275,000 Feb. 2024 6.162% 25,000,000 25,000,000 7,786,047 625,000 6,547,853 625,000 June 2025 5.534% 18,000,000 18,000,000 4,844,554 450,000 3,995,308 450,000 Mar. 2026 5.300% 25,000,000 25,000,000 5,178,865 625,000 4,131,640 625,000 Dec. 2026 4.975% 35,000,000 35,000,000 11,864,078 875,000 10,274,312 875,000 Dec. 2027 5.400% 15,000,000 15,000,000 1,686,676 375,000 1,238,234 375,000 Nov. 2029 5.539% 27,000,000 27,000,000 1,414,444 675,000 687,880 675,000 Aug. 2031 4.622% 70,000,000 70,000,000 - 1,750,000 - -
301,512,000 286,500,000 75,642,202 7,137,500 73,424,249 6,272,500
20102011
For the debenture debt that matures in 2021, 2023, 2024, 2025, and 2026, there are debt recoverable charges from the Province of Newfoundland and Labrador of $2,519,158, $4,114,227, $6,493,824, $5,825,894 and $10,641,840 respectively, for a total of $29,594,943.
Page 23
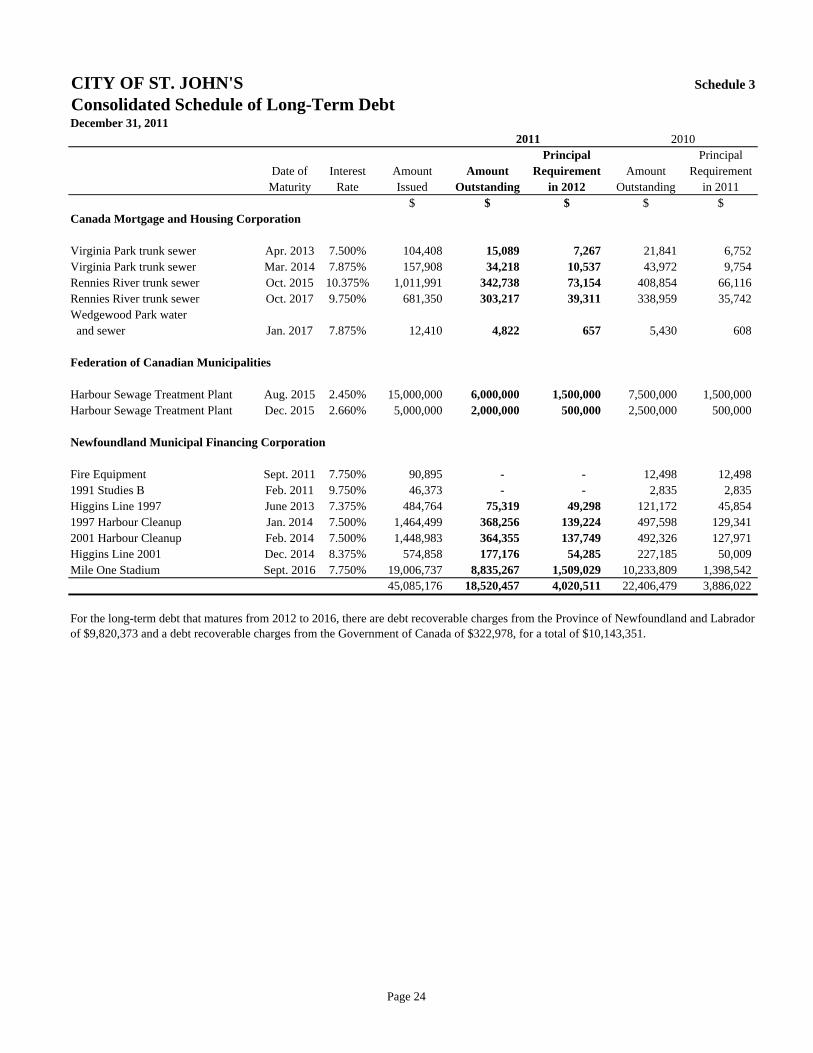
CITY OF ST. JOHN'S Schedule 3Consolidated Schedule of Long-Term DebtDecember 31, 2011
Principal PrincipalDate of Interest Amount Amount Requirement Amount RequirementMaturity Rate Issued Outstanding in 2012 Outstanding in 2011
$ $ $ $ $Canada Mortgage and Housing Corporation
Virginia Park trunk sewer Apr. 2013 7.500% 104,408 15,089 7,267 21,841 6,752 Virginia Park trunk sewer Mar. 2014 7.875% 157,908 34,218 10,537 43,972 9,754 Rennies River trunk sewer Oct. 2015 10.375% 1,011,991 342,738 73,154 408,854 66,116 Rennies River trunk sewer Oct. 2017 9.750% 681,350 303,217 39,311 338,959 35,742 Wedgewood Park water and sewer Jan. 2017 7.875% 12,410 4,822 657 5,430 608
Federation of Canadian Municipalities
Harbour Sewage Treatment Plant Aug. 2015 2.450% 15,000,000 6,000,000 1,500,000 7,500,000 1,500,000 Harbour Sewage Treatment Plant Dec. 2015 2.660% 5,000,000 2,000,000 500,000 2,500,000 500,000
Newfoundland Municipal Financing Corporation
Fire Equipment Sept. 2011 7.750% 90,895 - - 12,498 12,498 1991 Studies B Feb. 2011 9.750% 46,373 - - 2,835 2,835 Higgins Line 1997 June 2013 7.375% 484,764 75,319 49,298 121,172 45,854 1997 Harbour Cleanup Jan. 2014 7.500% 1,464,499 368,256 139,224 497,598 129,341 2001 Harbour Cleanup Feb. 2014 7.500% 1,448,983 364,355 137,749 492,326 127,971 Higgins Line 2001 Dec. 2014 8.375% 574,858 177,176 54,285 227,185 50,009 Mile One Stadium Sept. 2016 7.750% 19,006,737 8,835,267 1,509,029 10,233,809 1,398,542
45,085,176 18,520,457 4,020,511 22,406,479 3,886,022
20102011
For the long-term debt that matures from 2012 to 2016, there are debt recoverable charges from the Province of Newfoundland and Labrador of $9,820,373 and a debt recoverable charges from the Government of Canada of $322,978, for a total of $10,143,351.
Page 24

CITY OF ST. JOHN'S Schedule 4Consolidated Schedule of Mortgages - Urban Living
Non-Profit Housing December 31, 2011
2010Date of Interest Amount Amount Amount
Maturity Rate Issued Outstanding Outstanding$ $ $
Newfoundland & Labrador Housing Corporation
Hamlyn Road Aug. 1, 2022 2.140% 2,207,290 1,154,549 1,249,930 Infill 1987 Apr. 1, 2023 2.140% 2,070,285 1,138,008 1,225,842 Gear Street - Infill 1988 Sept. 1, 2025 2.140% 1,929,560 1,206,117 1,280,812 Brookfield Road Dec. 1, 2025 2.140% 2,203,600 1,386,738 1,470,850 Cochrane Street Nov. 1, 2027 4.630% 745,887 400,711 426,528 Infill 1990 Nov. 1, 2026 1.640% 1,628,008 1,030,482 1,079,504 Campbell Avenue Feb. 1, 2028 3.900% 968,952 661,382 690,280 Infill 1992 Dec. 1, 2028 2.140% 1,682,553 1,015,085 1,064,110
Canada Mortgage and Housing Corporation
Forest Road Jan. 1, 2018 3.900% 1,647,890 587,078 671,051 Cuckholds Cove Road Apr. 1, 2018 3.160% 804,200 291,078 331,979 Infill 1982 July 1, 2018 3.090% 651,550 246,948 280,287 Rawlins Cross Dec. 1, 2018 2.860% 1,249,485 494,428 557,388 Hamilton Avenue - Riverhead Towers Feb. 1, 2019 1.810% 3,736,230 1,458,837 1,647,816 Fahey's Row - Infill 1983 May 1, 2019 2.610% 962,163 414,987 465,081 Alexander Street - Hamilton Avenue June 1, 2019 2.610% 1,920,998 832,371 931,621 Carnell Street - Larkin Square Jan. 1, 2020 2.650% 1,910,065 887,202 984,419 Goodview Street - Carter's Hill Jan. 1, 2020 2.760% 1,406,630 661,962 734,119 Infill 1985 Apr. 1, 2021 2.260% 880,530 452,684 492,451 Carter's Hill - Sebastian Court Aug. 1, 2021 1.800% 2,031,175 1,072,010 1,162,119
30,637,051 15,392,657 16,746,187
Current portion 1,402,504 1,353,530
Mortgages are secured by specific rental properties situated in St. John's and assignment of rental income.
2011
Page 25
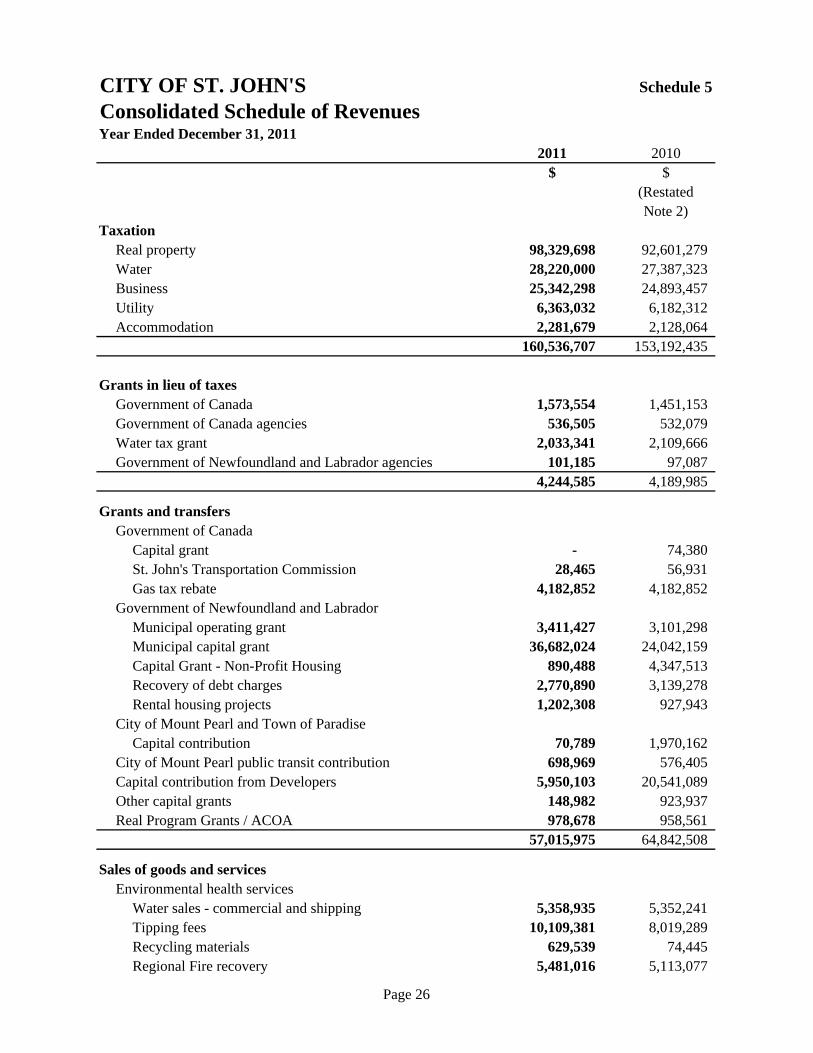
CITY OF ST. JOHN'S Schedule 5Consolidated Schedule of RevenuesYear Ended December 31, 2011
2011 2010$ $
(RestatedNote 2)
TaxationReal property 98,329,698 92,601,279 Water 28,220,000 27,387,323 Business 25,342,298 24,893,457 Utility 6,363,032 6,182,312 Accommodation 2,281,679 2,128,064
160,536,707 153,192,435
Grants in lieu of taxesGovernment of Canada 1,573,554 1,451,153 Government of Canada agencies 536,505 532,079 Water tax grant 2,033,341 2,109,666 Government of Newfoundland and Labrador agencies 101,185 97,087
4,244,585 4,189,985
Grants and transfersGovernment of Canada Capital grant - 74,380
St. John's Transportation Commission 28,465 56,931 Gas tax rebate 4,182,852 4,182,852 Government of Newfoundland and Labrador
Municipal operating grant 3,411,427 3,101,298 Municipal capital grant 36,682,024 24,042,159 Capital Grant - Non-Profit Housing 890,488 4,347,513 Recovery of debt charges 2,770,890 3,139,278 Rental housing projects 1,202,308 927,943
City of Mount Pearl and Town of ParadiseCapital contribution 70,789 1,970,162
City of Mount Pearl public transit contribution 698,969 576,405 Capital contribution from Developers 5,950,103 20,541,089 Other capital grants 148,982 923,937 Real Program Grants / ACOA 978,678 958,561
57,015,975 64,842,508
Sales of goods and servicesEnvironmental health services
Water sales - commercial and shipping 5,358,935 5,352,241 Tipping fees 10,109,381 8,019,289 Recycling materials 629,539 74,445 Regional Fire recovery 5,481,016 5,113,077
Page 26

CITY OF ST. JOHN'S Schedule 5 (continued)Consolidated Schedule of RevenuesYear Ended December 31, 2011
2011 2010$ $
(RestatedSales of goods and services (continued) Note 2)
Environmental health services (continued)Regional Water recovery 3,299,858 3,195,756 Regional Waste Water recovery 228,660 356,549 Other 193,575 183,566
General government services 655,298 388,150 Transportation services
Parking meters 1,695,879 1,420,428 Parking permits 249,374 231,367 Other 21,154 15,008
Third party charges 468,539 424,804 Sale of land 373,969 357,409 Gain on disposal of equipment 36,390 32,588 Recreation, parks and tourism 1,411,748 1,265,124 St. John's Sports & Entertainment Ltd. 6,848,770 5,553,254 Railway Coastal Museum 296,843 306,697 Other general services 1,259,100 1,142,872
38,618,028 33,432,624
Other revenue from own sourcesInterest on tax arrears 1,858,717 1,652,431 Interest earned on portfolio investments 3,542,292 3,301,990 Interest savings, Green Municipal Infrastructure Fund 300,400 360,480 Fines 1,769,345 1,830,841 Construction and other permits 3,423,803 4,449,607 Interest earned 649,505 109,317 Business and amusement licenses 148,288 142,192 Rents, concessions and franchises 57,341 33,685 Apartment rentals 2,737,267 2,683,305 St. John's Transportation Commission
Passenger fares 4,656,393 4,670,766 Charters 97,664 69,522 Transit advertising 278,927 311,305 Sundry 79,690 58,914
Civic assessments 180,023 321,314 Sub - division assessments 366,063 418,134
20,145,718 20,413,803 Total revenue 280,561,013 276,071,355
Page 27

CITY OF ST. JOHN'S Schedule 6Consolidated Schedule of ExpendituresYear Ended December 31, 2011
2011 2010$ $
(RestatedNote 2)
General government servicesLegislative 813,213 895,872 General government 18,892,508 18,535,431 Engineering services 6,947,101 5,869,908 Pensions and employee benefits 1,922,600 3,702,345 Employee future benefits 10,243,036 10,357,181 Other general government 578,596 586,734
39,397,054 39,947,471
Fiscal servicesDebenture debt charges
Interest 15,373,563 14,077,031 Amortization 12,420 12,420
Long-term debt interest 1,478,776 1,790,479 Non-Profit Housing mortgage interest 435,882 495,836 St. John's Transportation Commission interest 90,246 81,887 Interest on temporary bank loans 804,831 506,014 Other debt charges 357,655 33,795
18,553,373 16,997,462
Transportation servicesRoad transport
Administration 3,009,697 2,832,731 Fleet services 746,822 (118,475) Snow clearing 13,503,047 11,199,747 Streets, roads and sidewalks 5,378,075 4,293,544 Maintenance depot 1,689,140 1,443,359 Traffic services 1,321,152 1,318,977 Street cleaning 165,326 158,070
Street lighting 3,883,473 3,765,755 St. John's Transportation Commission 14,633,201 13,531,592 St. John's Para-Transit System 2,047,182 1,431,223 Parking meters 85,644 72,930
46,462,759 39,929,453
Page 28

CITY OF ST. JOHN'S Schedule 6 (continued)Consolidated Schedule of ExpendituresYear Ended December 31, 2011
2011 2010$ $
(RestatedNote 2)
Protective servicesFire protection 23,528,729 21,587,462 Protective inspections 3,565,791 3,438,896 Traffic enforcement 2,257,096 2,233,702 Animal and pest control 1,091,652 964,460
30,443,268 28,224,520
Environmental health servicesWater supply and distribution 13,427,106 12,487,572 Regional Water system 4,530,981 4,207,135 Regional Waste Water system 2,563,708 2,286,750 Regional Robin Hood Bay landfill 11,756,746 8,106,253 Garbage, waste collection and disposal 3,890,991 3,344,330 Sewage collection and disposal 532,704 501,489
36,702,236 30,933,529
Recreation and cultural servicesParks and open spaces 9,637,004 8,497,750 Recreation 8,976,976 6,997,337 St. John's Sports & Entertainment Ltd. 7,399,417 6,109,265 Railway Coastal Museum 416,144 452,778 Destination St. John's 984,159 938,652 Other recreation and cultural services 1,713,904 2,181,560
29,127,604 25,177,342
Environmental development servicesEnvironmental planning and zoning 1,142,482 1,156,569 Housing and real estate 2,222,049 2,161,679 Other environmental development services 2,003,855 1,784,680
5,368,386 5,102,928
Amortization and allowancesAllowance for uncollectible accounts 1,896,953 1,629,499 Allowance for obsolete inventory 30,536 117,398 Amortization 28,324,919 26,365,459
30,252,408 28,112,356 Total expenditures 236,307,088 214,425,061
Page 29