workplace injury claim suppression: final report - wsib · prism economics and analysis 1 workplace...
TRANSCRIPT

Prism Economics and Analysis 0
Workplace Injury Claim Suppression: Final Report
Prepared for Workplace Safety and Insurance Board
2013
April 2013

Prism Economics and Analysis 1
Workplace Injury Claim Suppression: Final Report
Contents
Executive Summary 2
1. Introduction 6
2. Literature Review 11
Bibliography 45
3. Jurisdiction Scan 54
4. Review of Enforcement Files 64
5. Review of No‐Lost‐Time Files 78
6. Review of Abandoned Lost‐Time Files 94
7. Conclusions 109
Research Team 111

Prism Economics and Analysis 2
Executive Summary
Scope and Purpose of Research:
The purpose of this research assignment was to review evidence on the incidence and risk of employer claim suppression.
For the purpose of this research, ‘claim suppression’ means actions taken by an employer to induce a worker not to report an injury or illness or alternatively to under-report the severity of an injury or illness or the amount of lost time attributable to that injury or illness. The inducement may be coercive, i.e., the inducement may involve an actual or perceived threat of sanctions. Alternatively the inducement may be accommodating, i.e., the employer may offer the worker benefits in lieu of workers’ compensation, if full WSIB benefits, especially lost time benefits, are not claimed.
It is important to distinguish ‘claim suppression’ from two broader occurrences, namely employer under-reporting and worker under-claiming. All claim suppression involves employer under-reporting and worker under-claiming. However, both employer under-reporting and worker under-claiming can occur without an employer inducing a worker to under-claim. It is important to bear in mind when reviewing the findings of this report that inducement to under-claim is the defining characteristic of actual or attempted ‘claim suppression’.
This report summarizes five research undertakings. These are: (1) a review of the relevant research literature, (2) a scan of policy and practice in other Canadian jurisdictions, (3) an analysis of 100 randomly selected enforcement files where charges were laid against employers, (4) an analysis of 2,707 randomly selected no-lost-time claims from 2011, and (5) an analysis of 3,340 randomly selected abandoned lost-time claims from 1991 to 2011. The purpose of the file analysis was to identify anomalies in the file records which are suggestive of a risk of claim suppression, though not necessarily proof that claim suppression occurred.
Key Conclusions:
The most important conclusion to be drawn from the research is that claim suppression appears to be a real problem. It is unlikely that claim suppression is restricted to a small number of anecdotal cases. Although plausible estimates of employer under-reporting and worker under-claiming can be derived from the research literature, we do not have sufficient evidence to credibly gauge the magnitude of claim suppression nor to be definitive in which industries claim suppression may be more evident. There is no strong evidence to support credible inferences on the motivation for claim suppression. Indeed, it is unlikely that conventional research methods could ever generate valid estimates of the incidence of claim suppression or incontestable accounts of the motivation for claim suppression. By its very nature, claim suppression is a practice that those who engage in it seek to conceal. Estimates based on indisputable

Prism Economics and Analysis 3
evidence would likely to be too conservative, while estimates based on less rigorous evidence could over-estimate the incidence of claim suppression. Summary of Research Findings:
Worker Under-Claiming: Based on the research literature, 20% is a plausible estimate of the proportion of likely compensable, work-related injuries or illness for which workers do not submit claims. Both higher and lower estimates can be supported. However, there is more support for a 20% estimate. The research literature suggests employer inducement is sometimes a factor. However, other factors behind worker under-claiming include: avoiding a reputation for carelessness, perceptions about the time required to claim compensation benefits, uncertainty about eligibility, perceptions that the injury or illness is not severe, and preference for other forms for income support, such as sick leave plans or wage continuation. Employer Under-Reporting: Under-reporting comprises both non-reporting and misreporting. Non-reporting occurs when an employer fails to file the statutorily required report of an injury or incident. Misreporting involves reporting an injury or illness as a no-lost-time incident when, in fact, the injury or illness involved lost time or lost earnings. The research literature suggests that employer non-reporting is around 8%. However, the methodology used to develop this estimate may have an under-estimation bias. Estimates of employer misreporting range from 3-4% at the low end to 10% at the high end. Claim Suppression: There are no strong estimates of the proportion of employer under-reporting which entails claim suppression. One study suggests 7% of employers may discourage full reporting of work-related injuries or incidents. Approximately half of the enforcement files examined as part of this study contained evidence of employer behaviour that was intended to induce workers not to report a work-related injury or illness to the WSIB. In about a fifth of these files the inducement involved overt threats or sanctions. In the remaining files with evidence of inducement, the inducement did not involve threats or sanctions. In these cases, inducement variously took the form of (1) appeals to loyalty, (2) shared involvement in the underground economy, (3) continuation of wages in lieu of WSIB benefits, and (4) misinformation as to eligibility for WSIB benefits. There were also instances of peer pressure not to report an injury or illness that was sometimes motivated by the potential loss of a group-based incentive to remain accident free. Employer Motivation for Suppressing Claims: The WSIB’s enforcement files were the only source examined by this study which might provide evidence for inferring employer motivation in suppressing claims. The file evidence, however, is quite limited on motivation. As a result, no strong conclusions can be drawn. However, it is noteworthy that almost half of the randomly selected enforcement files pertained to employers that had not registered with the WSIB. At least for these employers, a general aversion to compliance appears to be more important than any particular

Prism Economics and Analysis 4
motivation such as avoiding inspections, gaming the experience rating system, or protecting a business reputation. Inducement to Suppress Claims In approximately half of the enforcement files examined, there was evidence of employer behaviour that was intended to induce workers not to report a work-related injury or illness to the WSIB. In about a fifth of the files with evidence of inducement, overt threats or sanctions were documented. However, in more than three-quarters of the files, the inducement did not involve documented threats or sanctions. In those files, inducement took the form of appeals to loyalty, shared involvement in income tax evasion (remuneration in cash), continuation of wages in lieu of WSIB benefits and misinformation as to eligibility for WSIB benefits. There were also instances of peer pressure not to report an injury or illness, sometimes motivated by the potential loss of a group-based incentive to remain accident free. The most common form of employer inducement appears to be wage continuation.
No-Lost-Time Files: The research project examined 2,707 randomly selected no-lost-time claims from 2011 for file evidence that could suggest a risk that the claim actually involved lost-time, but had been reported as a no-lost-time incident. The flags used in the analysis suggest a risk of misrepresentation in the range of 5-10%. This is consistent with the earlier research literature. However, the 5-10% finding of misrepresentation risk is not a definitive finding since it was not practical to follow up on these files to determine the actual circumstances. Nevertheless, the research does suggest certain flags which the WSIB could incorporate into its risk management strategy. It may also be germane that many of the possible misrepresentations involved only a few days of lost time. This may raise a policy question as to when WSIB lost earnings benefits should commence. Abandoned Lost-Time Claim Files: The project examined 3,340 Abandoned Lost-Time Claims. Of these, 10 % were subsequently excluded from the analysis because there was evidence in the files that the claimants were pursuing benefits under another insurance policy or benefit regime. In three-quarters of the files, employers submitted a Form 7. This indicates that there was a high level of reporting compliance, at least in regard to the submission of Form 7s. By contrast, a Form 6 was found in fewer than 20% of the files. This could reflect either claim suppression or widespread under-claiming that is unrelated to claim suppression. A potentially relevant finding is that 11.6% of the Abandoned Lost-Time Claim Files indicated more than 5 calendar days of lost time while 5.2% indicated more than two calendar weeks of lost time. On its face, this raises questions about why the claims were abandoned when the amount of lost time was certainly material. Again, however, it must be stressed that the analysis only suggests a risk of claim suppression. The analysis does not constitute proof of claim suppression. Possible Patterns: The file analysis suggests that non-supervisory ‘blue-collar’ workers are by far the most likely type of employee to be the claimant in a file where there are flags that suggest a material risk of claim suppression.

Prism Economics and Analysis 5
There is some evidence that certain industries may exhibit a higher risk of under-reporting and possibly claim suppression. However, this evidence is tentative. Canadian Jurisdiction Scan: The jurisdiction scan consisted of interviews with officials in 8 jurisdictions covering 9 systems, supplemented by web research of statutory provisions. Claim suppression has been addressed in some jurisdictions through specific statutory provisions that prohibit discouraging a worker from filing a claim for compensation benefits. However, there is no evidence that these provisions figure in enforcement strategy. None of the jurisdictions canvassed has undertaken any systematic research into claim suppression, although Manitoba is planning to do so. Virtually all jurisdictions rely on administrative penalties, rather than prosecutions. In this regard, Ontario is distinctive. One jurisdiction appears to have been notably successful in achieving prompt reporting by medical practitioners within less than a day of seeing the patient. This prompt reporting by medical practitioners may, in itself, be a deterrent to employer under-reporting and an encouragement to workers to claim the benefits to which they are entitled. .
■

Prism Economics and Analysis 6
Introduction 1
Purpose of Research
The purpose of the research summarized in this report to gauge the nature and possible frequency of claim suppression in Ontario’s workers’ compensation system.
For purposes of this research ‘claim suppression’ means employers’ inducement of workers not to report or, if reporting, to under-report work-related injuries or illness that would likely have been compensable under the Workplace Safety and Insurance Act.
The specific research objectives were to:
estimate the prevalence and root cause(s) of claim suppression,
identify linkages (if any) to employer incentive programs,
estimate the cost and impact of suppressed claims on the compensation system and on the workers affected,
describe the nature and severity of the injuries which are most commonly the subject of claim suppression, to the extent that suppression occurs,
describe trends, where they may be evident, in relation to industries, the employment and demographic characteristics of affected workers and changes over time,
profile, to the extent supported by evidence, the workers that are most affected by claim suppression and the employers most likely to engage in this practice .
Methodology
The research activities undertaken in support of these objectives were:
1. a review of the research literature on under-reporting of work-related injuries and under-claiming of workers’ compensation benefits;
2. a scan of other Canadian jurisdictions to identify any research, policy measures or statutory provisions that bear directly or indirectly on employer induced claim suppression;
3. a review of 100 randomly selected WSIB enforcement files to identify patterns pertaining to claim suppression. This review was restricted to cases in which the employers were either convicted of infractions under the Workplace Safety and Insurance Act or settled with the WSIB. Settlements, it should be noted, typically involved an admission of guilt on some, if not all of the charges;

Prism Economics and Analysis 7
4. an analysis of 2,707 randomly selected no-lost-time claims from 2011 to identify the incidence of anomalies or other ‘flags’ in the files which could be indicative of a risk of claim suppression;
5. a similar analysis of 3,340 randomly selected abandoned lost-time claims from 1991 to 2011 to identify the incidence of anomalies in the files which could be indicative of a risk of claim suppression.
Conceptual Framework
It is important to distinguish ‘claim suppression’ from two broader occurrences: employer ‘under-reporting’ of workplace injuries or illnesses and worker ‘under-claiming’ for workplace injuries or illnesses that would likely have been compensable. ‘Under-reporting’ refers to employers either not reporting a work-related injury or illness or misreporting such an injury or illness. Anecdotal evidence suggests that misreporting most commonly involves reporting a lost-time injury or illness as a no-lost-time injury or illness. Both types of ‘under-reporting’ are contrary to employers’ obligations under the Workplace Safety and Insurance Act.
Related to misreporting, but conceptually different, is providing modified work arrangements to avoid lost-time when those arrangements are inconsistent with the Workplace Safety and Insurance Board’s (WSIB) policy on early and safe return to work. Inappropriate return to work raises different research issues from those associated with claim suppression. Research into the appropriateness of modified work arrangements puts the focus on the return to work circumstances, not on whether or how the incident was reported. When work arrangements are at issue, the employer’s report on the injury or illness and the amount of time or earnings that were lost (if any) may be accurate. By contrast, a defining characteristic of claim suppression is that it involves a failure to report an injury or illness or a misreporting of an injury or illness, especially in regard to lost-time and lost earnings. Claim suppression necessarily entails a contradiction between what actually happened and what was (or was not) reported to the WSIB. The second defining characteristic of claim suppression is that it involves actions which are directed against a worker to induce him or her not to submit a claim or to claim lesser benefits than he or she would otherwise be entitled to claim. The suppressive actions intended to induce under-claiming may be overt or subtle. Overt actions would include: sanctions or threats of sanctions, the loss of group-based incentives for keeping a workplace accident free, or providing misinformation. Subtle actions to induce worker under-claiming would include appeals to loyalty that do not involve threats and/or offers to continue wages or cover medical costs. There are four important clarifications of employer induced claim suppression that should also be noted. First, employer under-reporting need not be associated with inducements to suppress a claim. An employer may fail to submit a report of an injury or illness while concurrently the affected worker may elect not to submit a claim for reasons unrelated to the employer. Consequently, employer-induced claim suppression is not coterminous with employer under-reporting. Employer-induced claim suppression is a subset of employer under-reporting. Second, an employer may be wholly compliant with its reporting requirements and a worker may still elect not to submit a claim for reasons unrelated to the employer. Under-claiming as a result of employer-induced claim suppression is therefore a subset of worker under-claiming. Third, some employer-induced claim suppression activities may not be successful. An employer may have engaged in

Prism Economics and Analysis 8
actions that were intended to induce his or her employee not to submit a claim, but the claim may have been submitted notwithstanding the inducements. And finally, a worker’s fear of sanctions or other adverse repercussions may not be warranted. For all of these reasons, while claim suppression can be defined with precision, the phenomenon cannot be measured with precision. Any measurement of claim suppression necessarily will be accompanied with some degree of uncertainty Claims that involved employer-induced suppression fall into two categories. The first category comprises suppressed claims for which there is some documentation in the WSIB’s files. There are three types of suppressed claims for which there could be some documentation in the WSIB’s files. The first type comprises claims that were reported by employers as no-lost-time claims, but for which the file evidence indicates lost-time. The second type is claims that were reported as no-lost time claims, but the nature of the injury is incongruent with no lost time. The third type is a lost-time claim that would likely have been allowed, based on the file evidence, but was abandoned by the worker. None of these anomalies in the files should be interpreted as definitive evidence of claim suppression. There could be an explanation for apparent lost time. An injury that might appear to be incongruent with no lost time may not have entailed lost time. And finally, abandonment of a claim by a worker does not, in itself, necessarily imply employer inducement. A second category of suppressed claims comprises those injuries and illnesses which never come to the attention of the WSIB through any of its reporting channels and for which there is therefore no documentary evidence. Table No. 1 on the following page illustrates the conceptual framework

Prism Economics and Analysis 9
Table No. 1 Illustration of Conceptual Framework

Prism Economics and Analysis 10
Organization of Report
Chapter Two presents the results of the literature review. This review canvassed, as far as we are aware, all of the empirical research in Canada on employer under-reporting, worker under-claiming and employer-induced claim suppression. Research that used quantitative methods was reviewed more thoroughly than research which was essentially anecdotal. Research literature from outside Canada (notably the United States and Australia) was considered. However, less emphasis was put on findings from this literature owing to significant differences in the design and operation of workers’ compensation, differences in the systems of occupational health and safety surveillance, and differences in rates of unionization. Chapter Three summarizes the results of interviews with officials in 8 Canadian jurisdictions covering 9 workers’ compensation systems. These interviews were supplemented by web research of statutory provisions. Chapter Four reports on the review of 100 randomly selected WSIB enforcement files. Chapter Five summarizes the analysis of 2,707 randomly selected no-lost-time claims from 2011. Chapter Six summarizes the analysis of 3,340 randomly selected abandoned lost-time claims from 1991 to 2011. Chapter Seven presents the conclusions that can be drawn from the research that has been undertaken thus far in the project. Chapter Seven also describes the next steps in the project. Chapters Two through Six commence with a summary of the main findings presented in the chapter.
■

Prism Economics and Analysis 11
Literature Review 2
Chapter Summary
The purpose of the literature review is to summarize research findings on the magnitude of under-reporting and under-claiming, the role of employer inducement in under-claiming, the motivations of workers and employers for under-reporting or under-claiming, and the characteristics of employers and workers that correlate with under-reporting or under-claiming.
Key Findings from the Research Literature
The most important conclusions to be drawn from the research literature are:
1. a plausible estimate can be developed for the worker non-submission rate. However, this estimate must be qualified by acknowledging that (a) one or more of the survey sources may be dated, (b) the number of relevant observations is often not robust , and (c) there is not precise concordance between the surveyed work force and the covered work force and between surveyed injuries and diseases and injuries and diseases which employers are statutorily obliged to report;
2. a plausible estimate can also be developed for the employer non-reporting rate. However, the surveys on which this estimate is based are likely to have an under-estimation bias;
3. a weak estimate can also be developed for the employer misreporting rate, i.e., characterizing lost-time injuries as entailing no lost time. One of the survey sources on which this estimate is based is dated and reliant on a small sample. The other draws inferences from the severity of the injury, but does not verify that the injury, in fact, entailed lost time;
4. although there is survey and other evidence that addresses some aspects of employer induced claim suppression, there is insufficient evidence to support a plausible estimate for the rate of employer-induced claim suppression.
Worker Non‐Claiming Rate
Based on limited survey findings, the worker non-claiming rate could be as high as 40%, including both lost-time and no-lost-time injuries. There is more support for an estimate of 20%, although this also could be high. In the first place, some of the research supporting this estimate may be dated, having

Prism Economics and Analysis 12
been undertaken, in one case, more than 20 years ago. And second, the concordance between the covered work force and the surveyed work force was not precise. Some of the surveyed workers may not have claimed benefits because they were not covered by Ontario’s workers’ compensation system.
There is limited evidence suggesting that close to a third of abandoned claims involved lost-time injuries that would likely have been compensable. However, the survey on which this finding is based is dated, having been conducted more than 20 years ago, and also reliant on a small sample.
Employer Non‐Reporting and Misreporting Rates
Data from two surveys suggest a rate of 7-8% for employer non-reporting. However, this estimate may understate the problem. There are a number of reasons for this qualification:
1. one survey, which was based on employee interviews, did not include some industries where the under-reporting problem may be more prevalent;
2. a second survey canvassed 1,000 employers. One would be expect some respondents in an employer survey to under-state the incidence of under-reporting since the surveyor was asking the respondent to acknowledge unlawful conduct;
3. the employer survey needs to be re-weighted to reflect the industry distribution of injuries rather than the industry distribution of covered workers.
Misreporting is distinct from non-reporting. Studies of no-lost-time claims suggest that somewhere between 3% and 9.5% of these claims may have involved lost time. The survey which suggests the higher estimate is dated and relies on a small sample.
Employer‐Induced Claim Suppression
The survey evidence is too limited to support any plausible estimate of employer-induced claim suppression, as distinct from under-reporting. Among the factors that complicate an estimate of employer induced claim suppression is whether certain employer practices should be interpreted as an inducement to suppress claims. For example, should all wage continuation practices be treated as evidence of inducement? Should all group incentives to remain accident-free be considered an inducement to under-claim? And should all workers’ perceptions of threats be considered evidence of claim suppression intent, even when those perceptions are not shared by a majority of workers? Further, how much responsibility should be assigned to employers for workers’ lack of knowledge about their coverage and how to claim benefits? Estimates of employer inducement to suppress claims will vary depending on how these questions are answered.

Prism Economics and Analysis 13
Some aspects of the employer inducement phenomenon are addressed by surveys. These suggest that:
around 13% of employers may offer wage continuation in lieu of workers’ compensation benefits;
5-6% of employees may perceive threats to their employment security if they file a compensation claim or may perceive peer pressure not to submit a claim;
around one third of workers may lack information or be confused about whether injuries are covered by workers’ compensation, although this proportion is highly variable across different demographic groups.
Nevertheless, even taking these findings into account (some are based on out-of-province sources or dated surveys), it is not feasible to develop even a weak estimate, let alone a credible estimate, of the incidence of employer induced claim suppression.
Risk Factors
There is moderate evidence that non-submission rates are higher among younger workers and workers with high school or lower educational attainment. Higher non-submission rates are also found in workplaces with 25 or fewer employees. While industry correlations were not explored by the research literature, these factors suggest that manufacturing, road transportation, food services and construction are likely to have higher rates of worker non-submission. These higher non-submission rates may imply a higher risk of employer claim suppression. However, that conclusion cannot be drawn from the available evidence. Studies of immigrant workers and agricultural workers also suggest a higher rate of worker non-submission. Again, this may be associated with a greater risk of employer claim suppression, but there is no evidence to support the hypothesis.
Lack of knowledge of rights to benefits or how to claim benefits is an important factor in the worker non-submission rate. Around one-third of workers interviewed by way of follow-up to WCB surveys had a poor understanding of their rights and obligations. The 2007-2008 Enquête québécoise found that more than half of non-submitters in Quebec thought that musculo-skeletal disease was not covered by their workers’ compensation system. Workers’ confusion about their rights and how to exercise those rights are enabling factors that facilitate employer claim suppression. However, the actual relationship between workers’ lack of knowledge of their rights and actual claim suppression by employers is not discernible from the current research findings.

Prism Economics and Analysis 14
Interpretive Issues and Research Gaps
The foregoing review of the research literature points to both interpretive issues and research gaps. The interpretive issues are important because they shape how data is understood. These interpretive issues include:
Is all wage continuation prima facie evidence of inducement?
Should a worker’s perception of a threat to his or her employment be taken at face value? Or should this perception be qualified if it is not shared by a majority of workers in that workplace?
Should all accident-free incentive programs be deemed inducements not to report injuries? How should incentives to managers be interpreted?
How should worker loyalty as a motivation not to claim for an injury be interpreted?
How should workers’ lack of knowledge of their rights or lack of knowledge about how to claim those rights be interpreted? Is it an employer’s responsibility to provide information on benefit rights and submission procedures?
The review of the research literature indicates several significant gaps in evidence and analysis. While there are plausible estimates of worker under-claiming and employer under-reporting, there is no evidence to support a credible estimate of the role of employer induced claim suppression. Even if the research focus is limited to worker under-claiming and employer under-reporting, it would be useful to have greater insight into the demographics of workers who forego benefits and the characteristics of employers that under-report. It is also important to better understand how the costs of under-claiming are borne. To what extent are these costs borne by employers (through wage continuation and benefit plans)?, by workers (through wage loss)?, by the public health system?, the welfare system?, EI?, or CPP? Finally, it would also be useful to know what file-based evidence might suggest a risk of claim suppression. Such information could be useful in shaping administrative strategies to counter claim suppression.
Literature Review
Introduction
The purpose of the literature review is to summarize research findings on:
the magnitude of unreported or misreported health and safety incidents,

Prism Economics and Analysis 15
the proportion of those of unreported or misreported incidents that is attributable to employer inducement to suppress or understate workers compensation claims,
the motivations on the part of workers and employers for understating or suppressing claims, and
the employer, industry, and work force characteristics that correlate with under-reporting or suppressing claims.
Organization of Review
Part I of this review examines the research literature that estimates the magnitude of under-reporting of health and safety incidents or which enables inferences to be drawn on the approximate magnitude of under-reporting by comparing the number of estimated incidents with administrative data on reported incidents. This section begins by reviewing the various data sources that are relevant to estimating the relationship between reported claims and actual incidents. The section then reviews specific studies and summarizes the broad findings of researchers. The Canadian literature is reviewed in detail. The findings from U.S. and other studies are noted. However, owing to differences in coverage and administration, less weight is assigned to non-Canadian findings.
Part II of this report reviews the research literature’s findings on employer inducement to suppress or misrepresent claims and the factors that correlate with worker under-reporting of injuries. As will be evident from this review, there is relatively little empirical research on the magnitude of employer-induced claim suppression and even less on the factors which motivate it.
Part III summarizes the gaps in the current research findings.
Part I: Estimates of the Magnitude of
Worker Under‐Claiming and Employer Under‐Reporting
Claims Data versus Other Measures of Occupational Injury or Illness:
Most jurisdictions require employers to report instances of occupational injury or illness to either or both of the workers’ compensation authorities or occupational health and safety authorities. In Ontario, employers’ reporting obligations are found in both the Workplace Safety and Insurance Act and the Occupational Health and Safety Act.1 In the United States, employers are required to record
1 Workplace Safety and Insurance Act, sec. 21(1) and sec. 77 and the Occupational Health and Safety Act, sec.
51-53 and also related regulations.

Prism Economics and Analysis 16
serious injuries or illnesses in prescribed recording forms established by the Occupational Health and Safety Administration pursuant to regulation 29 CFR 1904 (‘OSHA logs’). Concurrent with administrative reporting, the statistical agencies in most jurisdictions also track the incidence of occupational injuries and diseases using surveys.
In Canada, in addition to workers’ compensation claims data, there are three other data sources. The first of these is the Canadian Community Health Survey (CCHS), together with its predecessor, the National Population Health Survey (NPHS) - both administered by Statistics Canada.2 The second statistical source is Statistics Canada’s longitudinal Survey of Labour and Income Dynamics (SLID).3 SLID, however, is limited to work-related injuries causing a work absence of more than a week. Finally, data can also be derived from the hospital emergency department reports to the National Ambulatory Care Reporting System (NACRS).4 NACRS was established by the Canadian Institute for Health Information. In 2000, Ontario mandated the reporting of all emergency department visits to NACRS. Additional statistical sources consist of ad hoc surveys undertaken by researchers.
In the U.S., the principal survey instrument is the Survey of Occupational Injuries and Illnesses (SOII) administered by the Bureau of Labor Statistics. Additional information is also collected through the Behavioral Risk Factor Surveillance System surveys administered by the U.S. Centers for Disease Control and Prevention (CDC). From time to time, some of these surveys include questions on occupational injury or illness and claiming for workers’ compensation benefits. Other states have administered ad hoc surveys. Data relevant to occupational disease and disabilities can also be taken from the National Health Information Survey administered by the National Center for Health Statistics (NCHS) which is part of the CDC.
Comparisons of data derived from statutorily mandated administrative reports can be compared with incidence trends indicated by survey data. Caution must be applied when making these comparisons as there are significant differences in the population included in surveys and the work force covered by workers’ compensation. In Ontario, for example, prior to recent amendments, the workers’ compensation system applied to an estimated 65-70% of workers.5 In the United States, some classes of employers are exempted from the obligation to maintain OSHA logs. As well, in some states
2 CCHS is described at: http://www23.statcan.gc.ca/imdb/p2SV.pl?Function=getSurvey&SDDS= 3226&lang=en&db=imdb&adm=8&dis=2. 3 SLID is described at: http://www23.statcan.gc.ca/imdb/p2SV.pl?Function=getSurvey&SDDS= 3889&lang=en&db=imdb&adm=8&dis=2. 4 NACRS is described at: http://www.cihi.ca/CIHI-ext-portal/internet/en/document/types+of+care/hospital+care/ emergency+care/services_nacrs. 5 Peter M. Smith, Cameron A. Mustard and Jennifer I. Payne, “Methods for estimating the labour force insured
by the Ontario Workplace Safety and Insurance Board: 1990-2000,” Public Health Agency of Canada 25, no. 3/4 (2004): 27-37,. See Table 4. Smith et al. estimate the coverage rate at 65% for 2000. The WSIB estimates an employed work force coverage rate of 71.6% in 2011. See: Workplace Safety and Insurance Board, By the Numbers: 2011 WSIB Statistical Report - Schedule 1 and Schedule 2, http://www.wsibstatistics.ca/, accessed December 15, 2012..

Prism Economics and Analysis 17
(notably Texas), workers’ compensation insurance (and therefore reporting of claims-related incidents) is voluntary.
This review examines relevant Canadian studies in detail. In the United States, there are significant differences in both the design and management of workers’ compensation and occupational health and safety, as well as in labour standards and the protection of collection bargaining. Owing to these differences, it is unclear to what degree conclusions drawn from U.S. studies can be applied to Canadian conditions. This review, therefore, synthesizes the principal findings of the U.S. literature, but does not report these findings in comparable detail.
Canadian Studies Estimating or Reporting Estimates of the Magnitude of Under‐Reporting and Under‐Claiming
The following studies report or summarize empirical research on the magnitude of under-reporting health and safety incidents or estimate the magnitude of actual incidents and permit an estimate of under-reporting to be drawn through comparisons with administrative data:
1. Workers Compensation Board (Ontario), Research and Evaluation Branch, “Workplace Accident Reporting Practices Study: Main Report” (1992)
2. Harry Shannon and Graham Lowe, “How Many Injured Workers do not file Claims for Workers’ Compensation Benefits?”, American Journal of Industrial Medicine, vol. 42, pp 467-473 (2002)
3. Cameron Mustard and Donald Cole, Harry Shannon, Jason Pole, Terry Sullivan, and Richard Allingham, “Declining Trends in Work-Related Morbidity and Disability,1993–1998: A Comparison of Survey Estimates and Compensation Insurance Claims” American Journal of Public Health, August 2003, vol.93, no. 8 (2003)
4. Peter Smith and Cynthia Chen, Sheilah Hogg-Johnson, Linda Kacur, Cameron Mustard, and Emile Tompa, “Changes in the events and nature of injury associated with no-lost-time claim reports in Ontario between 1991 and 2006: examining the role of firm-level incentives” working paper (c 2011)
5. Institute for Work and Health and IBM Business Consulting Services, “Assessing the Effects of Experience Rating in Ontario: Case Studies in Three Economic Sectors” (2005)
6. Ipsos Reid, 2008 Consumer Satisfaction Survey (WSIB). Relevant sections provided by WSIB.
7. Morneau Sobeco, Recommendations for Experience Rating , (October 28, 2008), prepared for the Workplace Safety and Insurance Board
8. Peter M. Smith and Agnieszka A. Kosny and Cameron A. Mustard, “Differences in Access to Wage Replacement Benefits for Absences Due to Work-Related Injury or Illness in Canada”, American Journal Of Industrial Medicine (2009)

Prism Economics and Analysis 18
9. Cameron A. Mustard and Andrea Chambers, Christopher McLeod, Amber Bielecky and Peter Smith, “Comparison of data sources for the surveillance of work injury,” Occupational Environmental Medicine (2012), pp. 1-8.
10. Aaron Thompson, “The consequences of underreporting workers’ compensation claims”, Canadian Medical Association Journal, vol. 176, no. 3, pp 343-4 (2007)
11. Kathryn Wilkins, and Susan G. Mackenzie, “Work Injuries”, Health Reports, vol. 18, no. 3 (August 2007) Statistics Canada Cat. No. 82-003
12. H. Alamgir and M. Koehoorn, A. Ostry, E. Tompa, and P.A. Demers, “How many work-related injuries requiring hospitalization in British Columbia are claimed for workers' compensation?”, American Journal of Industrial Medicine, vol. 49, no. 6, pp 443-51 (June, 2006)
13. Susan Stock and Nektaria Nicolakakis, Hicham Raïq, Karen Messing and Alice Turcot, “Reporting of Non-traumatic Work-related Musculoskeletal Disorders to Workers’ Compensation: Results of a 2007-2008 Population Survey”, Presentation to Canadian Association for Research on Work and Health, 2012 (Vancouver, B.C.)
1. Workers’ Compensation Board (Ontario) (1992)6
In 1992, the Research and Evaluation Branch of the Ontario Workers’ Compensation Board (WCB) undertook a survey-based study of injury reporting. Table No. 2 lists the five surveys that comprised the study and indicates the number of respondents in each survey:
Table No. 2
Surveys conducted by Research and Evaluation Branch Ontario Workers’ Compensation Board, 1992
Survey No. of Valid
Responses
Covered Labour Force Survey N = 200
Lost-Time Claimant Survey N = 255
No-Lost-Time Claimant Survey N = 109
Adjusted N = 105
Abandoned Claimants Survey N = 101
Adjusted N = 75
Employer Survey N = 1,103
Covered Labour Force Survey
6 Workers Compensation Board (Ontario), Research and Evaluation Branch., “Workplace Accident Reporting
Practices Study: Main Report” (1992)

Prism Economics and Analysis 19
Of the 200 persons who participated in the Covered Labour Force Survey, 10 reported at least 1 workplace accident in the previous 12 months that would likely have been eligible for WCB benefits. The implied injury rate among the covered work force was therefore 5.0%. All of these respondents indicated that their accident had been reported to their employer. The status of the accidents reported in the survey was as follows:
Table No. 3 Covered Work Force Survey
Research and Evaluation Branch, 1992 Ontario Workers’ Compensation Board
Survey Lost-Time
Injuries No -Lost-Time
Injuries Total
No. of respondents reporting injuries in the previous 12 months
7 4 11
No. of injuries likely eligible for WCB benefits 7 3 10
No. of injuries leading to WCB claims 6 2 8
No. of likely eligible injuries with no WCB claim 1 1 2
Implied non-submission rate 1/7=14% 1/3=33% 2/10=20%
The estimated non-submission rates were 14% (1 out of 7) for lost-time injuries, 33% (1 our of 3) for no lost-time injuries and 20% (2 out of 10) for total injuries. However, on its own, owing to the small number of observations, the survey cannot support robust conclusions.
Lost-Time Claimant Survey
The Lost-Time Claimant Survey interviewed 255 randomly selected persons who had filed lost-time claims with the WCB in 1991. The survey identified 12 respondents out of 255 (4.7%) who had experienced another work-related accident in the previous 12 months for which there was no corresponding WCB claim. Of these 12 incidents, 1 involved self-reported lost-time.
Respondent recall appeared to differ from WCB records. Although 12 respondents had accidents for which there was no claim, 5 incorrectly reported in the survey that they had filed a claim and received benefits.
As with the Covered Labour Force Survey, the number of observations is too few to support robust conclusions. The survey results also signal a methodology challenge which is the reliability of respondent recall and the need for verification where this is practical.
No-Lost-Time Claimant Survey
No-lost-time claimants were surveyed to ascertain the extent to which their injuries may have entailed unreported lost time. Of the 105 valid responses, 10 (9.5%) reported that their no-lost-time claim had

Prism Economics and Analysis 20
actually involved lost time. Table No. 4 summarises the survey results. The earlier caution again applies, namely that the survey sample and the number of relevant observations was too small to support strong conclusions, independent of other confirmatory evidence.
Table No. 4 No-Lost-Time Claimants Survey
Research and Evaluation Branch, 1992 Ontario Workers’ Compensation Board
Survey Lost-Time
Injuries
Percent of Valid Sample
No. of respondents (net of deletions) 105 n/a
No. of respondents reporting lost time 10 9.5%
5 or fewer days of lost time 7 6.7%
more than 5 days of lost time 3 2.9%
Received no income support from employer 3 2.9%
Received full wages 5 4.8%
Received partial wages 2 1.9%
In interview follow-up, none of the respondents suggested overt intimidation. However, a number of the comments suggest inducement may have been a factor. For example, “I don’t know. I got paid, other than that I don’t know what’s going on” or “company policy - company chose to pay regular salary rather than report to the WCB.”
Abandoned Claimants Survey
The Abandoned Claimants Survey interviewed 75 persons who had a work-related injury for which they had seen a doctor and who submitted, but later abandoned, a WCB claim. The survey data suggest that around 29% of these abandoned claims involved lost time for which half of the respondents received no income support from their employer. Two of 41 abandoned no-lost-time claims (4.9%) involved reduced earnings. Table No. 5 summarizes the survey results.

Prism Economics and Analysis 21
Table No. 5 Abandoned Claimants Survey
Research and Evaluation Branch, 1992 Ontario Workers’ Compensation Board
Survey Lost-Time
Injuries Percent of
Valid Sample
No. of valid respondents 75 n/a
No. of respondents reporting lost time 22 29.3%
1-5 days of lost time 14 18.7%
more than 5 days of lost time 8 10.6%
Income replacement status of 22 respondents who reported lost time
Received no income support from employer 13 17.3%
Received full wages 5 6.7%
Received partial wages 2 2.7%
Received WCB benefits (no WCB record of benefits) 2 2.7%
No. of respondents reporting no lost time 41 54.6%
Returned to regular job (similar duties) Same Wages Different Wages
1 0
1.3% 1.3%
Returned to regular job (different duties) Same Wages Lower Wages
8 2
10.7% 2.7%
Did not return to job 11 14.7%
Employer Survey
The Employer Survey found that more than 90% of employers correctly understood their reporting obligations, except for accidents that involved only first aid. The survey also found that 13.6% of respondents would allow a worker to use a few sick days rather than file a WCB claim. Re-weighting of the survey results to mirror the size and industry distribution of employers raised this estimate to 20.1%. It is notable that the willingness of employers to allow sick leave days to substitute for WCB benefits was inverse to size, i.e., small employers were more likely to allow this practice than larger employers who appeared to be more knowledgeable of legal requirements.
When asked why employees did not file WCB claims, the most significant reasons given were perceived threat to job security (20%), income support from a sick leave or wage indemnity plan (20%), and pressure from co-workers (10%).

Prism Economics and Analysis 22
Conclusion
The picture that emerges suggests that non-submission could be in the range of 20%. Other survey findings suggest that misreporting could be material and could be in the range of 9.5% for no-lost-time claims. Survey findings also suggest that a significant proportion of abandoned claims - perhaps 29% - could involve lost time for which no benefit claims are pursued. There is no evidence in the surveys of overt employer intimidation. However, there are suggestions that more subtle forms of employer inducement could be relevant. These include: providing wage coverage in lieu of WCB benefits, possibly encouraging (or at least not countering) peer pressure, and perceived threats to job security. Owing to the small sample sizes, however, no individual survey undertaken by the WCB supports strong conclusions, when taken on its own. These survey results must be considered along side other research findings that are corroborative of the WCB survey results.
2. Shannon and Lowe (2002)7
Shannon and Lowe report the results of a 2000 population survey which identified employed persons (i.e., self-employed persons were excluded) who had experienced an injury that would likely have been eligible for workers’ compensation benefits. Eligibility was based on modified work arrangements, medical treatment and/or lost-time. The analysis was restricted to current employment, thereby enabling a substantial concordance with workers’ compensation coverage based on industry. The analysis was national. The survey was based on 2,500 respondents from an initial sample pool of 17,361.
The survey identified 143 cases that met the employment, injury and coverage tests. This implies an incident rate of approximately 5.7% among the covered work force. Of the 143 likely compensable injuries, 40% were not submitted as claims for workers’ compensation benefits. The survey results were reported as statistically reliable at a 95% level of confidence within a +/- 8% range, i.e., non-submission may have fallen within a range of 32% to 48%. The Ontario rate of non-submission was 48%, although this was based only on 63 observations. It should be noted that worker non-submission does not necessarily imply that the employer failed to report the incident.
The Shannon and Lowe study is among the most rigorous studies to use a population survey to gauge the extent of non-reporting of occupation injuries and disease to the workers’ compensation system. The study is widely cited in both the scholarly literature and by injured workers’ advocates. The 5.7% implied rate of workplace injuries is approximately comparable to other studies.
It should be noted, however, that the estimated 40% rate of non-submission does not shed light on the degree to which employer inducement may be a factor. Moreover, even though the survey sample was large (2,500), the survey identified only 143 instances of likely compensable occupational injuries. Although the survey is often cited as finding a 40% rate of under-reporting, it should be noted that the
7 Harry Shannon and Graham Lowe, “How Many Injured Workers do not file Claims for Workers’ Compensation
Benefits?” American Journal of Industrial Medicine 42 (2002): 467-473.

Prism Economics and Analysis 23
correct statistical presentation of the results is a range of 32% to 48%. The finding also refers to non-submission rates rather than non-reporting. Finally, the survey was undertaken in 2000. Some jurisdictions, including Ontario, have augmented their enforcement efforts since 2000 and also changed requirements for coverage. In Ontario, ‘independent operators’ who are widespread in the construction and transportation industries must now be covered. This statutory change potentially closes off a device used by some employers for purporting to exclude their workers from WSIB coverage and related reporting obligations.
3. Mustard, Cole et al. (2003)8
Mustard, Cole et al. compared WSIB lost-time claims for the period 1993 to 1998 with data from Statistics Canada’s Survey of Labour Income Dynamics (SLID) and the National Population Health Survey (NPHS). The SLID comparisons are the most relevant. SLID estimated work-related injuries that entailed a work absence of one week or longer. The researchers derived similar estimates from WSIB administrative data. The following table compares the incidence rate per 1,000 workers from the two data sources.
Table No. 6 Comparison of WSIB Accepted Lost-Time Claims with
Estimates from the Survey of Labour and Income Dynamics 9
Incidence Rate per 1,000 Workers 1993 1994 1995 1996 1997 1998 Weighted Average
WSIB: Lost-time claims greater than 7 days (per 1,000)
13.7 12.8 11.6 9.8 9.0 8.3 10.9
SLID: Work-related illness/ injuries causing an absence from work of 7 days or more (per 1000)
17.0 15.2 13.2 11.8 11.8 11.5 13.4
Difference 19.4% 15.8% 12.1% 16.9% 23.7% 27.8% 19.0%
Both data sources are expressed as incidence rates per 1,000 workers. The average difference in incidence rates over the period, 1993-1998, was 19.0%. That is to say, on a trend basis, the incidence rate of the injuries or illness which caused an absence from work of more than seven days was 19.0% higher than the incidence rate reflected in the WSIB lost-time claims.
The comparison of SLID data with WSIB claims suggests that the non-submission rate for WSIB claims for work-related injuries or illnesses causing an absence of seven days or more may be approximately 19%. However, there are important qualifications that apply to this 19.0%. First, the SLID universe is all workers. The WSIB universe is covered work force. If the SLID universe has a higher injury rate
8 Cameron Mustard et al., “Declining Trends in Work-Related Morbidity and Disability,1993–1998: A
Comparison of Survey Estimates and Compensation Insurance Claims,” American Journal of Public Health 93, no. 8 (August 2003).
9 ibid., based on Table No. 2, 1285.

Prism Economics and Analysis 24
than the WSIB universe, then the data comparison over-estimates under-reporting. However, if (as is more likely) the SLID universe has a lower injury rate, then the comparison under-estimates the non-submission rate. A second factor that should be noted is that these data are taken from the 1990s. Labour market conditions in the 1990s were generally weaker and this may have encouraged a greater incidence of under-reporting (both employer-induced and other). As well, administrative and statutory changes since the 1990s may have altered conditions from those that were observed in the 1990s. Third, there is significant variability in the estimated under-reporting across the six years examined. There is no obvious reason why under-reporting should vary so sharply over a six year period. Which estimate should one rely on - the high estimate (27.8%), the low estimate (12.1%) or the weighted average (19.0%)? The implication is that the estimated non-submission rates should be viewed with caution.
4. Smith, Chen et al. (c2011)10
Smith, Chen et al. extracted information from 9,250 WSIB no-lost-time claims over four different time periods: 1991, 1996, 2000 and 2005. The authors report that, “somewhat surprisingly almost 6% of our sample of claims were situations where the consequence of the injury was quite severe, resulting in fractures, dislocations, nerve damage, spinal cord injuries, concussions or multiple injuries.” Even after excluding fractures to fingers, the researchers found that 3-4% of no-lost-time claims involved “injuries where we would expect that return to work the day after injury, even to a non-demanding occupation, would be challenging. Extrapolating this percentage to the number of no-lost-time claims submitted to the WSIB in 2008 (N = 163,315), this would equate to between 4,900 and 6,500 no-lost-time claims where the nature and event leading to injury seems incongruent with the fact no time was taken off work.” These findings are supportive of the methodology used in the broader research project of which this literature review is a part. That methodology includes an examination of a random sample of no-lost-time claims to identify anomalies that are suggestive (though not necessarily indicative) that the claim may have entailed lost time.
An additional finding of relevance by Smith et al. is that there was no change across sampling years in the incidence rate of claims for which reporting no-lost-time would be highly problematic. Consequently, their findings provide no support to the hypothesis that the expansion of experience rating after 1991 increased the propensity of employers to represent lost-time claims as no-lost-time claims.
10 Peter Smith et al., “Changes in the events and nature of injury associated with no-lost-time claim reports in
Ontario between 1991 and 2006: examining the role of firm-level incentives,” 2011, Institute of Work and Health, Issue Briefing, www.iwh.on.ca/system/files/.../open_plenary_2010-10-12_smith.pdf, accessed December 13, 2012.

Prism Economics and Analysis 25
5. Institute for Work and Health and IBM Consulting Services (2005) 11
In 2005, the Institute for Work and Health and IBM Consulting Services administered 160 interviews with employees (union and on-union) and managers across 80 firms in healthcare, transportation and manufacturing. All firms had either rebates or surcharges under the NEER experience rating program. The employers selected for interview were also representative of small, medium and large firms. It should be noted, that from the original sample panel, only one third of firms agreed to participate in the interview survey. There may have been self-selection biases in those that chose not to participate. Within the sampled workplaces, interviews were conducted with the management and employee co-chairs of the joint health and safety committee.
The study broadly concluded that NEER is influencing safer policies and practices – with nearly three-quarters of managers across all three sectors stating so (73%). Moreover, it received candid qualitative feedback from managers across all industries stating that if NEER had not existed, “we would not be as focused on prevention and health and safety as we are now.”12 At the same time, 7% of the 72 interviewed employees indicated that they were discouraged from reporting work-related injuries or illness to the WSIB. This proportion did not appear to be affected by whether the firm was in a rebate or surcharge position under NEER.
It should be noted that the 7% of employee respondents who indicated that they were discouraged from reporting work-related injuries or incidents represented only 5 observations. At the same time, it may be significant that these 7% were employees in the one third of companies that agreed to participate in the interview survey. It is possible that the proportion would have been higher among non-participants.
6. Ipsos Reid, 2008 Consumer Satisfaction Survey (WSIB)13
The WSIB contracts with Ipsos Reid to undertake employer and injured worker surveys to gauge consumer satisfaction with its operations. The 2008 survey asked employers (n=1,000) various questions about reporting. Table No. 7 summarizes the responses.
11Institute for Work and Health and IBM Business Consulting Services, “Assessing the Effects of Experience
Rating in Ontario: Case Studies in Three Economic Sectors,” June 2005, http://www.iwh.on.ca/system/files/documents/neer_case_studies_2005.pdf.
12 Ibid., 20
13 Ipsos Reid, WSIB CSAT Report 2008 (selected slides) provided by WSIB, on file with author.

Prism Economics and Analysis 26
Figure No. 7 Employers’ Responses to Questions regarding
Reporting Injuries to the WSIB Ipsos Reid Survey, 2008 (WSIB)
(n=1,000)
Strongly Agree
Somewhat Agree
Don't Know
Somewhat Disagree
Strongly Disagree
Some employers are not fully reporting their WSIB claims
18% 37% 24% 13% 8%
Employees in my organization do not always report injuries to their supervisor
12% 21% 3% 13% 51%
My organization does not always report injuries to the WSIB
3% 5% 2% 8% 82%
Some employers who should be registered with the WSIB are not registered and paying their fair share*
30% 35% 15% 14% 7%
*Sums to more than 100% owing to rounding
As can be seen from the above table, 8% of employer respondents reported that they ‘strongly agreed’ or ‘agreed’ with the statement, ‘my organization does not always report injuries to the WSIB’. A more substantial 55% strongly agreed or somewhat agreed that ‘some employers are not fully reporting their WSIB claims.’
7. Morneau Sobeco (2008) 14
The Institute for Work and Health / IBM Consulting Services Study cited earlier and the Ipsos Reid survey results (cited above) both figured into the analysis by Morneau Sobeco in their 2008 review of experience rating. Based on this evidence, their report concluded that, “one of the potential unintended consequences of the Experience Rating program is that some employers may achieve improved performance by not reporting injuries.”15 Morneau Sobeco estimated that under-reporting could account for up to 25,000 claims. Moreover, this estimate does not include lost-time claims that are reported as no-lost-time injuries or inappropriate, modified work arrangements that are inconsistent with the WSIB’s early and safe return to work policy.
14 Morneau Sobeco, Recommendations for Experience Rating , October 28, 2008, prepared for the Workplace
Safety and Insurance Board, http://www.wsib.on.ca/files/Content/Downloadable%20FileExperienceRatingReport/MorneauSobecoReport.pdf.
15 ibid., 9.

Prism Economics and Analysis 27
8. Smith, Kosny and Mustard (2009)16
Smith, Kosny and Mustard use longitudinal SLID data over a series of five panels from 1993 to 2005. Reported instances of work-related injuries or illnesses causing an absence from work of more than seven days were linked to income tax data to determine if worker’s compensation benefits were received. Only observations with both a work-related injury and income tax data showing post-injury income were included in the analysis. In total, there were 3,352 valid observations. The key findings were:
49% did not receive workers’ compensation earnings loss benefits,
55% of respondents who did not receive workers’ compensation earning loss benefits received pay from their employer,
35% of respondents who received workers’ compensation earnings loss benefits also received pay from their employer.
For Ontario, there were 915 valid observations. Of these, 47% reported receiving workers’ compensation earnings loss benefits.
The authors point to three factors that could qualify their analysis. First, workers’ compensation benefits are not taxable. Therefore, some recipients may not have reported the income. Second, some workers identified by SLID (around 25-35%) would have been employed in non-covered industries or would have been self-employed. And third, some workers may have been maintained on payroll with benefits being paid to their employer. (This practice is allowed in some jurisdictions, though not in Ontario.)
Deriving an under-claiming estimate from these data is challenging owing to the possibility that some workers did not report non-taxable workers’ compensation benefits or were not covered by the workers’ compensation system in the first place.
9. Mustard, Chambers et al. (2012) 17
Mustard, Chambers et al. compare WSIB lost-time claims with the incidence of workers reporting to hospital emergency departments with a work-related injury. The analysis covers the period 2004-2008. Emergency Rooms (ERs) are required to code for work-relatedness. The researchers compared these cases with WSIB records to determine the degree of concordance. When all emergency department, work-related injuries were compared to WSIB lost-time claims, approximately a third of cases (32.3%) were not reflected in WSIB lost-time claims. When the comparison was restricted to factures or concussions (in both the ER and WSIB data series), the degree of concordance was 99.8%.
16 Peter M. Smith et al., “Differences in Access to Wage Replacement Benefits for Absences Due to Work-
Related Injury or Illness in Canada,” American Journal Of Industrial Medicine Medicine 52, no. 4 (2009): 341. 17 Cameron A. Mustard et al., “Comparison of data sources for the surveillance of work injury,” Occupational
Environmental Medicine 69, no. 5 (2012): 1.

Prism Economics and Analysis 28
The comparison of ER and WSIB data should be read with caution. ER records include cases that did not entail lost time. They also include workers in uncovered industries or workers who were self-employed. Consequently, robust conclusions cannot be drawn. The same caveats would apply to the more restricted comparison, so the high degree of concordance in that comparison is puzzling. Nevertheless, the high degree of concordance between ER records and WSIB lost time claims for cases involving factures and concussions may indicate a higher rate of compliance with reporting obligations when injuries require emergency department treatment.
10. Thomson (2007)18 / Ontario Medical Association19
Thomson cites a survey of Ontario physicians which found that that 208 of 384 (54%) work-related injuries were inappropriately billed to the public health care system and not to workers’ compensation boards.20
In submissions to the Standing Committee on Resources Development, the Ontario Medical Association reported on a survey of its members which asked whether, in the previous six months, a patient had requested that they not report to the Workers’ Compensation Board an apparent work-related injury. Of those who responded, 51% indicated that they had encountered such a request, while 47% reported that they had not.
The statistical reliability of these surveys cannot be confirmed. However, their results are supportive of other evidence indicating potentially significant employee under-reporting of work-related injuries or illnesses. No inference can be drawn from these survey data of the motivation for this under-reporting. Nor can inferences be drawn as to whether the subject physicians acceded to their patient’s request or reported the injury or illness to the WSIB.
11. Wilkins and Mackenzie (2007) 21
Using data from the 2003 Canadian Community Health Survey (cycle 2.1) (CCHS), Wilkins and Mackenzie estimate that, on a national basis, the rate of activity-limiting22, work-related injury was
18 A. Thompson, “The consequences of underreporting workers’ compensation claims,” Canadian Medical
Association Journal, 176, no. 3 (2007): 343. 19 A report of the survey is found in Ontario, Legislative Assembly, Standing Committee on Resources
Development, Hansard, September 8, 1994 where the OMA is making submissions on Bill 165, an Act to amend the Workers’ Compensation Act and the Occupational Health and Safety Act.
20 The cited survey is reported in: B. Murphy, “Cost shifting in health care: a pilot study explores the
relationships between cost shifting, repetitive strain injury, the Workplace Safety and Insurance Board of Ontario, and publicly funded health care, ” Ph.d. diss., York University (Toronto), 2003.
21 Kathryn Wilkins and Susan G. Mackenzie, “Work Injuries,” Health Reports, 18, no. 3 (August 2007): Statistics Canada Cat. No. 82-003.

Prism Economics and Analysis 29
3.8%. This finding can be compared to WSIB administrative data, although the authors do not make that comparison.
In 2003, the WSIB estimates that it covered 4,531,471 workers. Applying the CCHS injury rate to the covered work force in 2003 implies an expected incidence of 172,195. In fact this would underestimate the expected incidence, since the CCHS excluded repetitive strain injuries as work-related injuries.23 For 2003, the WSIB reported 95,196 accepted lost-time claims.24 These injuries were presumptively “activity-limiting” in the CCHS definition. What cannot be established is what proportion of the remaining expected injuries (76,999) may have been captured as no-lost-time claims. It is likely that at least some of the incidents occurred on the last day of a shift with normal work resuming after a break of two days or more. Many of these injuries would have met the activity limitation definition, but would not have required lost time. Overall, while the comparison of CCHS data with WSIB data suggests the possibility of under-claiming, the comparison does not a support robust conclusion.
12. Alamgir et al. (2006)25
Alamgir et al. compared work-related hospitalizations in British Columbia to workers’ compensation claim records for a cohort of workers in saw mills for the period 1989-1998. They find that, “compensation data underreport serious and acute injuries by about 10%, even in a population actively working in a large unionized industry…”26 A large sample of observations that extended beyond the saw-mill industry calculated underreporting at 15%. Underreporting was greater among non-whites and older workers.
22 An ‘activity-limiting injury’ is defined as an “injury [that was] the result of an incident that occurred in the past
12 months that was severe enough to limit normal daily activities for at least one day–for example, a broken bone, a sprain, a bad cut, a burn or a poisoning.”
23 Wilkins and Mackenzie report: “CCHS interviewers instructed respondents to report injuries that were ‘serious
enough to limit your normal activities.’ Occupational injury was defined as a ‘yes’ response to the question, ‘(Not counting repetitive strain injuries), were you injured in the past 12 months?’ together with the response ‘working at a job or business’ to the question, ‘Thinking about the most serious injury, what type of activity were you doing when you were injured?’” [emphasis added] ibid., 3
24 WSIB data are derived from: WSIB, By the Numbers: 2011 WSIB Statistical Report - Schedule 1 and Schedule
2. 25H. Alamgir et al., “How many work-related injuries requiring hospitalization in British Columbia are claimed
for workers' compensation?” American Journal of Industrial Medicine, 49, no. 6 (June, 2006): 443. 26 ibid., 448.

Prism Economics and Analysis 30
13. Stock et al. (2012)27
Stock et al. examined data from the 2007-2008 Enquête québécoise sur des conditions de travail, d'emploi et de SST (Quebec Survey of Working and Employment Conditions and Occupational Health and Safety) which is sponsored by a consortium of Quebec ministries and agencies. Their analysis focused on persons who had lost working time as a result of a musculo-skeletal injury or disease, which the survey respondents perceived as entirely related to work and who were employed in non-managerial occupations (n=3,855). There were a total of 160 observations (4.1% of the sample). The vast majority of these 160 persons (80.4%) did not submit a claim for workers’ compensation benefits. Indeed, even among those who lost more than two weeks of work, 63.0% did not submit claims.
14. Non‐Canadian Studies
United States
Spieler and Burton review more than 20 empirical studies that compare the incidence of occupational disease and injury using survey data to incidence estimates based on employer-mandated OSHA logs or workers’ compensation claims. They conclude that:
“irrespective of the methodology or data source, these studies consistently demonstrate that workers’ compensation claims actually filed are substantially lower than the number of legitimate claims that would have been expected based on other data sources. [These studies] also indicate that other reporting systems, including OSHA logs, significantly underreport the incidence of workplace injuries as well.”28
Similar conclusions are reached by Pransky et al.29 This same conclusion is set out in Hidden Tragedy: Underreporting of Workplace Injuries and Illnesses - the Majority Staff Report of the U.S. House of Representatives’ Committee on Education and Labor. The report concludes:
“the BLS annual survey [the Survey of Occupational Injuries and Illnesses, SOII] may fail to report nearly 70 percent of lost-work time
27Susan Stock et al., “Reporting of Non-traumatic Work-related Musculoskeletal Disorders to Workers’
Compensation: Results of a 2007-2008 Population Survey,”(Presentation to Canadian Association for Research on Work and Health, Vancouver B.C., 2012).
28 Emily A. Spieler and John F. Burton Jr., “The Lack of Correspondence Between Work-Related Disability and
Receipt of Workers’ Compensation Benefits,” American Journal Of Industrial Medicine 55 (2012): 495. 29 G. Pransky et al., “Under-reporting of work-related disorders in the workplace: A case study and review of the
literature,” Ergonomics. 42, no. 1, (1999) 171.

Prism Economics and Analysis 31
injuries and illnesses… Simply put, SOII cannot be trusted as a gauge of the safety of American workplaces.”30
The central conclusion that emerges from all of these studies and reports, and from the studies which they review, is that, in the United States, OSHA logs, workers’ compensation data and the annual Survey of Occupational Injuries and Illnesses (SOII) all seriously under-estimate the incidence of occupational injuries and illnesses. The second conclusion that is supported by some, though not all of the studies, is that OSHA logs, workers’ compensation data, and SOII may significantly over-state reductions in the trend of occupational injuries and illnesses, and for some industries and pathologies may even get the direction of change wrong.
The relevance of U.S. findings is doubtful. Most American states deliver workers’ compensation either through the private sector or a mixed private/public model. Only three states have systems comparable to the publicly run systems in Canada. As well, in most U.S. states, there is waiting period (usually one week) before benefit entitlement commences. Two studies suggest that benefit levels in the U.S., and therefore the incentive of American workers to claim workers’ compensation, have been declining.31 Unlike in Canada, there is divided jurisdiction. States are responsible for workers’ compensation in most industries, while the federal government is responsible for health and safety management under the Occupational Safety and Health Act. Also, unlike in the United States, there have been no broad criticisms of the reliability of Statistics Canada’s estimates of occupational injuries and related work absences in either the Survey of Labour and Income Dynamics or the Canadian Community Health Survey. For all of these reasons, it is inappropriate to port over to Canada U.S. findings on rates of non-submission of workers’ compensation claims.
Australia
Safe Work Australia was established by the Australian Government to improve work health and safety and workers’ compensation arrangements across Australia. A recent study commissioned by Safe Work Australia compares data on workplace injuries that caused lost time of one week or more in the health and community services industry. The study compared data on workers compensation claims with data from the Work-Related Injuries Survey (WRIS) which is administered by the Australian Bureau of Statistics. The comparison found that in 2005-06, the incidence rate suggested by WRIS was 28 per 1,000 workers, while the incidence rate suggested by claims data was 16 per 1,000 workers. The implication is that around 40% of apparently compensable injuries were not associated with worker’s compensation claims.
30 U.S. House of Representatives, Committee on Education and Labor, Hidden Tragedy: Underreporting of
Workplace Injuries and Illnesses, Majority Staff Report, (Washington: Government Printing Office, June 2008). The report summarizes 13 studies published in peer-reviewed journals.
31 Spieler and Burton, op. cit., figure 3, 503, “Workers Compensation Compensability Index. 1985-1999” and
John F. Burton, “Trends in Social Security Disability Insurance and Workers’ Compensation,” (presentation to National Academy of Social Insurance, Washington, D.C., November 18, 2009).

Prism Economics and Analysis 32
A comparison of data on an all industries basis in 2009-10 indicates that the incidence rate of workers’ compensation claims for injuries causing a work absence of more than one week was 13.8 per 1,000 workers. The total incidence rate reported by survey data was 53 per 1,000. However, only 17% of these incidents (14.3 per 1,000) involved more than one week of lost time. The inference is that the compensation system covered more than 96% of incidents.32 As noted in the discussion of Mustard et al. (2003) a similar analysis for Ontario does not show the same high level of correspondence between survey data and claims data for injuries causing an absence from work of one week or longer.
●
The foregoing review of research on under-claiming and under-reporting points to the likelihood of trends that are material, but offers only limited guidance on their magnitude:
Only two work force surveys have been done. Both may be dated and both are based on a limited number of observations. A WCB survey (n= 200) suggests a non-submission rate of around 20%. The survey reported by Shannon and Lowe (n=2,500) finds a non-submission rate of 40% (48% in Ontario). In both surveys the number of relevant observations is small: 2 in the WCB survey and 143 in the larger survey.
Evidence from a comparison of the Survey of Income and Labour Dynamics with WSIB claims data suggests that the non-submission rate that could be around 19% (Mustard, Cole et al.) However, there is considerable year-on-year variance to estimates derived from this procedure which suggests caution in drawing conclusions.
An interview-based survey of employees in three industries found that 7% were discouraged from reporting work-related injuries or illness to the WSIB (Institute for Work and Health and IBM Consulting Services). However, the 7% estimate represented only 5 observations. On the other hand, the estimate does not include industries that are more likely to be involved in suppressing claims, e.g., construction and food services.
An Ipsos-Reid survey of employers (n=1,000) found that that 8% of respondents ‘strongly agreed’ or ‘agreed’ with the statement, ‘my organization does not always report injuries to the WSIB’ which is consistent with the proportion of employees indicating that they are discouraged from reporting work-related injuries.
A WCB survey of abandoned claimants (n= 75) found that 29% of the abandoned claims involved lost time.
32 Australian Bureau of Statistics, Australian Social Trends, “Work and Health”, cat. no. 4102.0, June 2011, last
modified December 13, 2011, http://www.abs.gov.au/AUSSTATS/[email protected]/Lookup/4102.0Main+Features20Jun+2011.
.

Prism Economics and Analysis 33
A WCB survey of lost time claimants (n=225) found 12 respondents (4.7%) who had experienced another work-related accident in the previous 12 months for which there was no corresponding WCB claim.
Two studies of misreporting come to approximately similar conclusions. A WCB survey of 105 claimants who submitted no-lost-time claims found that 10 of these claimants (9.5%) had experienced lost time which would likely have been compensable. Smith, Chen et al. report that in a review of 9,250 WSIB no-lost-time claims, they found that the injuries in 3-4% of the claims were incongruous with the no-lost-time status of the claim. This proportion increased to 6% when fractures to fingers were included.
Based on these research findings, it can be concluded that the non-submission rate could be as high as 40%, but there is more support for an estimate of 20%. However, this also could be an over-estimation. Other surveys suggest a lower rate, i.e., 7-8%. However, these surveys may understate the problem. The interviewed-based employee survey did not include industries where the under-reporting problem is likely to be more prevalent. As well, there may also have been a selection bias in the employers that allowed their workplaces to participate in the survey. (Two thirds of those invited, declined to participate). The employer survey may also understate the under-reporting problem since the surveyor was asking respondents to acknowledge unlawful conduct. The 7-8% estimate should therefore be interpreted as a lower boundary.
Studies of no-lost-time claims suggest that somewhere between 3-4% and 9.5% of these claims may have entailed lost time. There is also (admittedly limited) evidence suggesting that a significant proportion of abandoned claims pertain to lost-time injuries that would have been compensable.
Part II: Employer Inducement to Suppress Claims and
Factors affecting Under‐Reporting
The previous section examined research findings on the non-submission of claims and the misrepresentation of claims, particularly the misrepresentation of lost-time injuries as no-lost-time claims. There are many reasons why an incident would not lead to a claim or a claim might be misrepresented. Employer inducement is clearly one of the explanations. However, employer inducement is not the only possible explanation. Indeed, the admittedly limited research literature suggests that, while material, employer inducement may not account for the preponderance of non-submissions or under-reporting. This section reviews research findings on the factors that affect under-reporting, including employer inducement to suppress claims.

Prism Economics and Analysis 34
1. Employer‐Induced Claim Suppression
Anecdotal evidence of employer-induced claim suppression was presented in the course of the public hearings that were part of the WSIB’s funding review [‘Arthurs Report]. 33 The report of the funding review refers to “some 50 first- and second-hand accounts of workers victimized by employers intent on avoiding surcharges or claiming rebates [under the experience rating system].” The report comments that “while the evidence of abuse tendered by workers’ representatives during the hearings had the ring of truth, it was of course anecdotal, uncorroborated… and not statistical.” The report concluded that “there is no way of telling whether these incidents represent most or all cases of abuse (as employers contend) or merely the tip of the iceberg (as workers believe).”34
Employer inducement can be either overt or subtle. Overt inducement consists of threats and sanctions. Subtle inducement can take four forms: (1) appeals to loyalty, (2) willingness to pay wages and medical benefits in lieu of a workers’ compensation claim, (3) group-based incentive programs that foster peer pressure to suppress reports of injuries, and (4) perceptions that an injury will diminish prospects for promotion or increase the risk of lay-off. The last of these is challenging from a research perspective because perceptions may be exaggerated, unfounded or not shared by a majority of workers. There are three survey-based studies which shed some light on the possible magnitude of employer-induced claim suppression:
In reviewing Quebec’s 2007-2008 Enquête québécoise sur des conditions de travail, d'emploi et de SST, Stock et al found that 5.5% of those who did not submit a claim for a work-related musculo-skeletal injury indicated that “filing a workers’ compensation claim is forbidden by the employer or fear[ed] that it may be viewed negatively by the employer or co-workers”.35 The survey also found that employers had maintained pay for 13.1% of workers who lost time owing to musculo-skeletal injuries.
Hogg-Johnson found in a 1996 survey of workers at a large company (n=1,203) that 6.4% of non-reporters feared layoff, unemployment or harassment. 36 This fear was presumably real on the part of those who reported it. The key question, however, is whether the fear was well founded. The survey also asked whether respondents agreed
33 Harry Arthurs, Funding Fairness: A Report on Ontario’s Workplace Safety and Insurance System, (Toronto:
Queen’s Printer, 2012). 34 Ibid., 79-81. 35 Susan Stock et al., “Reporting of Non-traumatic Work-related Musculoskeletal Disorders to Workers’
Compensation: Results of a 2007-2008 Population Survey,” Presentation to Canadian Association for Research on Work and Health, Vancouver B.C., 2012).
36 Hogg-Johnson et al., “Reporting Work-Related Musculoskeletal Disorders to the Workplace: factors associated
with reporting among newspaper workers,” Working Paper #173 (Toronto: Institute for Work and Health, December 2001).

Prism Economics and Analysis 35
or disagreed with the statement that ‘management encouraged reporting [musculo-skeletal pain]’. The survey found that 55.6% of workers agreed with the statement while 15.0% disagreed. Clearly there was considerable difference across the employer’s work force in how they perceived management’s attitude. This suggests that those who feared sanctions may have been motivated by exaggerated fears or may have been more vulnerable to employer sanction, for reasons that are not evident from the survey.
The WCB survey of abandoned claimants found that around 20% of those who provided reasons for not reporting injuries ‘did not want to hurt the employer’s business’. 37 The implication is that the workers were aware that a reported injury had negative repercussions for their employer which (for an unspecified reason) they wished to avoid.
The WCB employer survey found that 13.6% of employer respondents would allow a worker to use a few sick days rather than file a WCB claim. Re-weighting of the results to mirror the size and industry distribution of employers raised this estimate to 20.1%. Small employers were more likely to allow this practice than larger employers.
The national survey reported by Shannon and Lowe found that the availability of paid sick leave plans as an alternative to workers’ compensation benefits did not affect submission rates.38 This finding is counter-intuitive. It also contrasts with strong findings in the U.S. research literature.
Lippel undertook an interview-based study of the effects of claims management practices on injured workers in Quebec. She reports the case of an employee of a subcontractor who stated that “his employer forbids CSST [i.e., workers’ compensation] claims and tells workers that a clause of his subcontracting agreement prohibits CSST claims.” She continues: “regardless of the legitimacy of the employer’s position, the worker and his colleagues were convinced that they could lose their jobs and that the employer could lose his contracts if claims are filed with the CSST.”39 This, of course, is a single case, based on an interview.
2. Knowledge of Rights and Obligations
WCB researchers also explored with employer and worker survey participants their understanding of rights and obligations. The WCB found that more than 90% of employers correctly understood their reporting obligations, except for accidents that involved only first aid. Around one-third of workers
37 Workers Compensation Board (Ontario), Research and Evaluation Branch., “Workplace Accident Reporting
Practices Study: Main Report” (Toronto: 1992). 38 Harry Shannony and Graham Lowe, “How Many Injured Workers do not file Claims for Workers’
Compnesation Benefits?” American Journal of Industrial Medicine, 42 (2002): 467. 39 Katherine Lippel et al., “Managing Claims or Caring for Claimants: The effects of the compensation process
on the health of injured workers,” Research Report (Montreal: Service aux collectivités of UQAM, 2007).

Prism Economics and Analysis 36
interviewed by way of follow-up to the WCB surveys had a poor understanding of their rights and obligations.
Stock et al. found that, in Quebec, 53.5% of non-submitters thought that musculo-skeletal disease was not covered by the workers’ compensation system. It is not clear whether their employer encouraged this misperception or was unaware of it. The survey also found that 15.4% of non-submitters lacked information on the process of submitting a claim.
3. Perceived Lack of Severity of Problem
The WCB surveys found that the leading reason that workers did not submit a claim was that they did not believe the injury was sufficiently serious to warrant a claim. Stock et al. report that 19.7% of non-submitters did not believe their symptoms were sufficiently severe. However, this reason was less important than lack of knowledge of coverage (see below). The survey reported by Hogg-Johnson also found that perceived lack of severity was an important factor in no reporting musculo-skeletal pain.
4. Immigrant Workers and Agricultural Workers
Various researchers into the labour market experience of immigrant workers have found that these workers are more likely to be employed in occupations and industries with higher incidence rates of occupation injury and disease. They are also less likely to receive workers’ compensation benefits.40 Kosny et al. offer an explanation for this pattern based on interviews with 14 social service and advocacy providers and 28 immigrant workers who had experienced a work-related injury.41 The picture that emerges from these interviews has three important features. First, recent immigrant workers are likely to be fearful of job loss owing to their financial precariousness. They may conceal an injury for fear of being blamed for carelessness or fear of being terminated. Second, recent immigrant workers are unlikely to be informed of their rights or to know how to go about claiming
40 P.M. Smith and C. Mustard, “The unequal distribution of occupational health and safety risks among
immigrants to Canada compared to Canadian-born labour market participants: 1993-2005,” Safety Science 48, no. 10 (2010): 1296-1303.
P.M. Smith and C. Mustard, “Comparing the risk of work-related injuries between immigrants to Canada and Canadian-born labour market participants,” Occupational and Environmental Medicine, 66 (2009): 361.
S. Premji et al., “Are immigrants, ethnic and linguistic minorities over-represented in jobs with a high level of compensated risk? Results from a Montreal, Canada study using census and workers’ compensation data,” American Journal of Industrial Medicine 53, no. 9 (2008): 875-885.
P. Smith, A.A. Kosny and C.A. Mustard, “Difference in access to wage replacement benefits for absences due to work-related injury or illness in Canada,” American Journal of Industrial Medicine, 52, no. 4 (2009): 341.
41 Agnieszka Kosney et al., Delicate Dances: Immigrant Workers’ Experiences of Injury Reporting and Claim
Filing (Toronto: Institute for Work and Health, April 2011).

Prism Economics and Analysis 37
workers’ compensation benefits. And third, the employers of recent immigrants may take advantage of both economic need and lack of awareness of rights to suppress injury reports to the workers’ compensation system.
Hennerby examines the employment conditions of agricultural workers in Canada, many of whom work under the Temporary Foreign Worker program.42 He reports research findings that show higher rates of occupational injury and disease and low rates of incidence reporting and compensation benefits. Fear of employer sanction, the need to continue working, and lack of awareness of rights appear to be the primary factors accounting for under-reporting by employees. In addition to being relevant it is own right, Hennerby’s study may also be important in identifying temporary foreign workers as a category of vulnerable workers whose importance has increased. Data from Citizenship and Immigration Canada indicate that the annual December 1st count of temporary foreign workers in Canada in 2001 was 64,907. By 2011, this had increased to 170,753.43
5. Demographic and Employment Factors
The national survey reported by Shannon and Lowe found above average non-submission rates for four categories of respondents:
(1) workers in organizations with 25 or fewer employees,
(2) workers who were 25 years or age or younger,
(3) full-time workers, and
(4) workers whose educational attainment was less than high school completion.
Unionization had only a modest, positive effect on submission rates. This contrasts with U.S. research findings which report a strong union effect on claiming rates.
6. Experience Rating:
Experience rating of workers’ compensation premiums is not the primary focus of this literature review. However, as noted in the Arthurs Report, critics of experience rating argue that the incentives inherent in experience rating operate in the background and are responsible for a high proportion of under-reporting of injuries, misreporting of lost-time injuries as no-lost-time injuries, and forcing workers to return to work in jobs that are inconsistent with the WSIB’s policy on safe and early return
42 Jenna Hennebry, Permanently Temporary: Agricultural Migrant Workers and Their Integration in Canada,
IRPP Study No. 26, (Montreal: Institute for Research on Public Policy, February 2012). 43 CIC data are available at: http://www.cic.gc.ca/english/resources/statistics/facts2011/index.asp

Prism Economics and Analysis 38
to work. Ison offers a systemic critique of experience rating which includes the propensity to suppress claims.44
The Ontario Federation of Labour (OFL), for example, argues that “premium costs can be reduced by covering up or misreporting accidents, by forcing workers back to work before they are ready, by paying sick employees wages rather than have them receive benefits, or by simply contesting all claims, including the most well-documented and well-founded cases.” 45 Their report, The Perils of Experience Rating, summarizes a number of case studies showing that some employers received NEER rebates notwithstanding concurrent and documented safety infractions. The case studies do not specifically address claim suppression. The OFL’s view is shared by the Manitoba Federation of Labour (MFL) which released a study in 2010 of claims suppression based on publicly solicited, anecdotal evidence.46 The MFL reports that 150 persons responded to this invitation. The MFL drew on these reported incidents to support its belief that experience rating fostered significant claim suppression. The MFL report also criticized workplace safety programs that rely on financial and other incentives to maintain an accident-free workplace. Finally, the Experience Rating Group, which brings together representatives from numerous injured worker advocacy groups has been strongly critical of experience rating.47
Morneau Sheppel reviewed recent studies of the impact of experience rating for the WSIB Funding Review.48 Their review concludes that “all well-designed incentive programs create both an incentive for positive behaviour and a risk of negative behaviour.” Morneau Sheppel point to the previously noted research undertaken by the Institute for Work and Health / IBM Consulting Services. That study found that nearly three-quarters of managers attributed a positive impact on their health and safety practices to experience rating. However, as noted earlier, the study also found that 7% of employees indicated that they had been discouraged from reporting all occupational injuries. Hyatt and Thomason point out that the influences of experience rating operate along two channels: investment in improved
44 Terrence Ison, Compensation Systems for Injury and Disease: The Policy Choices, (Toronto: Butterworths,
1994): Chapter 10 “Revenue and Finance” 45 Ontario Federation of Labour, The Perils of Experience Rating Exposed, October 2007, Injured Workers
Online, http://www.injuredworkersonline.org/Documents/Perils_Experience_Rating.pdf. 46 Manitoba Federation of Labour, An Investigation into the Incidence of WCB Claims Suppression, June, 24
2010, http://mfl.ca/content/investigation-incidence-wcb-claims-suppression. 47 Marion E. Endicott, “Squeezing The Worker: How Experience Rating Works,” Industrial Accident Victims’
Group of Ontario, September, 1996, http://www.injuredworkersonline.org/Documents/Squeezing_the_Worker.pdf.
Experience Rating Working Group, “Experience Rating: An addiction looking for a rationale?” Submission to the WSIB/WCB Funding Review, April 5, 2011, http://www.injuredworkersonline.org/Documents/WSIBFR_ER_Group_Submission_April_2011.pdf
48 Morneau Shepell, Background and Analysis Report: WSIB Funding Review, December 2011, http://www.wsibfundingreview.ca/finalreportpdfs/Morneau%20Shepell%20Background%20and%20Analysis%20Report.pdf

Prism Economics and Analysis 39
health and safety performance and claims management. 49 These are not mutually exclusive. Employers can invest in both improved health and safety performance and in claims management. Hyatt and Thomason describe as legitimate claims management, measures to accelerate safe and early return to work and contesting claims that are improper. Illegitimate claims management includes excessive contesting of claims to deter workers from filing claims, forcing workers back to work contrary to the principles of safe and early return to work, and suppression or misreporting of claims. Hyatt and Kralj provide evidence for higher rates of employer contesting of claims when experience rating operates. However, they do not imply that these higher rates of claims contesting are necessarily evidence of illegitimate claims management. It is possible that, in the absence of experience rating, there is insufficient contesting of claims on the part of employers since they are not affected by the acceptance of a claim by the compensation system.50 There are no Canadian studies which explicitly endeavour to link under-reporting or misreporting to experience rating.
7. U.S. and Other Non‐Canadian Studies:
The U.S. House of Representatives Committee on Education and Labour report, Hidden Tragedy: Underreporting of Workplace Injuries and Illnesses, cites a number of factors identified in the peer-reviewed, research literature that may be considered dimensions of employer inducement. These include:
direct intimidation through the threat of job loss, re-assignment to a lower paying job, denial of overtime, denial of promotions and harassment,
discouraging appropriate medical attention,
using sick leave programs to provide replacement income during absences caused by a work-related injury,
safety incentive programs that provide financial or other material incentives to workers to maintain an accident-free workplace,
financial incentives to managers to maintain an accident-free workplace,
threats of drug-testing for employees who report an accident, 49Douglas E. Hyatt and Terry Thomason, “Evidence on the Efficacy of Experience Rating in British Columbia,”
for Royal Commission on Workers’ Compensation in British Columbia, May 1998, http://www.qp.gov.bc.ca/rcwc/research/hyatt-thomason-experience.pdf
Boris Kralj, “Employer responses to workers' compensation insurance experience rating.” Relations Industrielles. 49, no.1 (1994): 41.
T. Thomason and S. Pozzebon, “Determinants of Firm Workplace Health and Safety and Claims Management Practices,” Industrial and Labor Relations Review, 52, no. 2 (2002): 286.
50 Douglas E. Hyatt and Boris Kralj, “The impact of workers' compensation experience rating on employer
appeals activity,” Industrial Relations 34, no. 1 (1995): 95.

Prism Economics and Analysis 40
representing persons who are employees, in the substantive sense, as sub-contractors so as to nominally avoid responsibility for their health and safety,
contracting out work where workers are at greater risk of injury or disease so as to formally shift responsibility for their health and safety.
The report also recognizes other factors, unrelated to employer inducement. These reflect an individual worker’s sense of duty, the complexity of the workers compensation system, underestimating the severity of an injury or the risk of deterioration, and lack of understanding of rights.
Fear of Inspection
Welch et al. describe potentially important employer motivations for under-reporting that are unrelated to workers’ compensation.51 These include the desire to avoid inspections which are often targeted, based on reported incidents.
Contracting
Kochan et al. report that contracting out of unsafe work is a management response in the U.S. petrochemical industry.52 Their findings also show that contractors tend to employ workers who are younger, have less experience with their employer and have lower educational attainments - all factors which correlate with higher incidence of occupational injury.
Based on Australian conditions, Mayhew et al. also argues that extended chains of sub-contracting, most notable in the construction industry, have an adverse impact on health and safety performance and on access to compensation benefits.53
In the construction industry, companies may need to have below average reported injury rates to be qualified bidders on some projects. This factor was noted in the study by Lippel cited earlier.
Reputational Factors / Claim Processing
Galizzi et al. studied workers in two hospitals and three nursing homes. They found that 13.5% had experienced work-related injury (n=480), but that somewhat more than a third of these (37%) were not
51 Laura Welch et al., “Is The Apparent Decrease In Injury And Illness Rates In Construction The Result Of
Changes In Reporting?” International Journal of Occupational and Environmental Health 13 (2007): 39. 52T. Kochan et al., “Human resource strategies and contingent workers: the case of safety and health in the
petrochemical industry,” Human Resource Management 33, no. 1 (1994): 55. 53 C. Mayhew, M. Quinlan and L. Bennett, “The Effects of Subcontracting/ Outsourcing on Occupational Health
and Safety,” Industrial Relations Research Centre Monograph, (Sydney: University of New South Wales, 1966).

Prism Economics and Analysis 41
reported. 54 There is no direct evidence of employer inducement in their findings. The most important factors were the time associated with filing a report, concern that filing a report would limit medical care options, and reputational costs. Reputation was an important factor both in relation to fellow workers and also in relation to the employer. A perception that an injury arose from carelessness was considered to have potentially negative consequences for future assignments and promotions as well as a worker’s standing among his or her fellow workers. It is possible that reputational considerations may be more significant in health care workplaces where there is a professional ethic of diligence that is incongruent with injuries that may arise from inattention.
Employer Size
Dong et al. found that, in the U.S. construction industry, small employers were more likely to under-report injuries than large employers.55 Similarly, the WCB employer survey cited earlier found that the propensity of employers to use sick plans to support wages, in lieu of workers’ compensation benefits, was inverse to size.
Incentive-based Safety Programs
Pransky et al. undertook a case study of a manufacturing company that employed 8,200 workers across three plants. Their study focused only on repetitive strain injuries (RSIs). 56 Although less than 5% of workers had officially reported a work-related injury or illness during the past year, over 85% experienced work-related symptoms, 50% had persistent work-related problems, and 30% reported either lost time from work or work restrictions because of their ailment. Their study confirms factors that other studies found relevant to under-reporting, including fear of discipline, fear of re-assignment, and fear of lost overtime or promotion. The study also found that safety incentives have an indirect, but significant, negative influence on proper reporting of workplace injuries. They report that, “all [plant and safety managers] agreed that under-reporting was the ultimate consequence of corporate safety policies and disincentives, not [employer] fear of OSHA enforcement actions.”57
Precarious Employment
Precarious employment comprises employment conditions that are characterized by a high degree of contingency. This includes some (but not all) part-time employment, contract employment, casual employment, and some (but not all) self-employment. The magnitude of precarious employment is
54 Monica Galizzi et al., “Injured Workers’ Underreporting in the Health Care Industry: An Analysis using
Quantitative, Qualitative, and Observational Data,” Industrial Relations: A Journal of Economy and Society, 49, no.1 (2009): 22.
55 Xiuwen S. Dong et al., “Injury Underreporting Among Small Establishments in the Construction Industry,”
American Journal Of Industrial Medicine 54 (2011): 339. 56 op. cit. Note 29. 57 Ibid., 176.

Prism Economics and Analysis 42
difficult to measure since it does not coincide precisely with part-time employment, self-employment or duration of employment. Contract employees, for example, can be employed for long periods of time without the security of tenure associated with permanent employment. Precarious employment is commonly associated with below average wages relative to educational attainment and occupation, and few or no benefits. Though difficult to measure, the phenomenon of precarious employment is undoubtedly real and may have increased as large organizations reduced the size of their permanent labour force. Several studies describe the increased health and safety risk of workers who are employed precariously and the likelihood of lower reporting of injuries involving these workers.58
‘Precarious employment’ is a difficult concept to utilize as an indicator of greater risk of claim suppression. In the first place, precarious employment is challenging to measure. Second, the idea that precarious employment is linked to claim suppression is premised on the economic vulnerability of those who are employed precariously. This vulnerability is a function of broader labour market conditions. In weak labour markets, those who are employed precariously may be fearful of dismissal or disinclined to quit, owing to the difficulty of finding another job. However, when labour markets are more buoyant, ‘lousy jobs’ are plentiful and the costs of dismissal or quitting are significantly lower. For these reasons, precariousness cannot be separated from the broader labour market context. This view is supported by Shannon and Lowe who found (contrary to the expectations of the precarious employment explanation) that temporary workers and part-time workers had higher rates of submitting workers’ compensation claims than did permanently employed and full-time workers.59
Unionization
Morse et al find a strong union influence on workers’ compensation claiming behaviour in a study of U.S. workers. 60 In general, they found that unionized workers were 5.7 times more likely to claim workers’ compensation benefits. Their study, it should be noted, compared claiming behaviour among union and non-union workers across broadly-defined economic sectors, e.g., manufacturing or services, not specific industries. It is possible that higher claiming behaviour among unionized workers partly reflects greater exposure to risk and injury which may have been one of the factors prompting
58 F.G. Benavides et al., “Associations between temporary employment and occupational injury: what are the
mechanisms?” Occupational and Environmental Medicine, 63 (2006): 416.
Elsa Underhill and Michael Quinlan, “How Precarious Employment affects Health and Safety at Work”, Relations Industrielles, 66, no. 3 (2011): 397-421.
M. Quinlan and C. Mayhew, “Precarious employment and workers' compensation,” International Journal of Law and Psychiatry, 22, no. 5-6 (1999): 491.
C. Mayhew and M. Quinlan, “The effects of changing patterns of employment on reporting occupational injuries and making workers’ compensation claims,” (Paper presented at International Commission on Occupational Health (ICOH), Singapore, August 2000).
59 op. cit. Note 7, Table 2, 479 60T. Morse et al., “The relationship of unions to prevalence and claim filing for work-related upper-extremity
musculoskeletal disorders,” American Journal of Industrial Medicine 44 (2003): 83.

Prism Economics and Analysis 43
unionization in the first place. Nevertheless, the finding is robust across all broadly-defined sectors and occupational groups. Hirsch et al. report similar findings, also pertaining to U.S. workers.61
The finding of a strong union influence on claiming behaviour is not supported by the limited research in Canada. As noted earlier, Shannon and Lowe found that union status was not a significant predictor of reporting an occupational injury. This conclusion is confirmed by Smith, Kosny and Mustard and also the WCB survey-based study. Both of which were reported in the previous section of this review.
●
The limited survey evidence suggests that overt employer inducement to suppress claims, in the form of actual threats or sanctions is unlikely to be systemic or widespread, though it does occur. Perceived threats to job security or promotion prospects are more common, although it is difficult to gauge the degree to which these perceptions are well founded. Employees can found their fears on experience with other employers, or in the case of recent immigrants, on experiences that they bring with them. One large workplace survey found that only a minority of employees perceived their employer as discouraging reports of musculo-skeletal pain, while more than three times as many did not share this perception.
Subtle forms of inducement are likely to be more significant than overt inducement. These include appeals to loyalty, incentive plans to remain accident free, and maintaining pay or paying medical costs in lieu of workers’ compensation benefits. There is evidence from two surveys (one in Ontario and one in Quebec) that around 13% of employers may provide wage continuation in place of workers’ compensation benefits for lost earnings.
It is important, however, to put employer inducement - whether overt or subtle - in context. Survey evidence suggests that other factors may be as important or more important in explaining under-reporting. These include lack of knowledge of rights to benefits or how to claim benefits. There is moderate evidence that under-reporting is more pronounced among younger workers and workers with high school or lower educational attainment. As well, under-reporting appears to be more common in workplaces with 25 or fewer employees. While industry correlations were not explored by the research literature, these factors suggest that manufacturing, road transportation, food services and construction are likely to have a higher incidence of under-reporting.
61 B.T. Hirsch, D. Macpherson and J. M. DuMond, “Workers’ compensation recipiency in union and non-union
workplaces,” Industrial and Labor Relations Review 50 (1997): 213.

Prism Economics and Analysis 44
Part III: Research Gaps
The research literature documents an under-reporting problem that encompasses both non-reporting of injuries and misreporting. The evidence on the magnitude of non-reporting is far from definitive, although it does support plausible estimates. Survey evidence addresses some aspects of employer-induced claim suppression, but does not support even a weak, let alone a credible, estimate of the phenomenon. There are also interpretive issues which can have an important effect on how data is understood:
Is all wage continuation prima facie evidence of inducement to suppress compensation claims?
Should a worker’s perception of a threat to his or her employment be taken at face value? Or should this perception be qualified if it is not shared by a majority of workers in that workplace?
Should all accident-free incentive programs be deemed inducements not to report injuries? How should incentives to managers be interpreted?
How should worker loyalty as a motivation not to claim for an injury be interpreted?
How should workers’ lack of knowledge of their rights or lack of knowledge about how to claim those rights be interpreted? Is it an employer’s responsibility to provide information on benefit rights and submission procedures?
After reviewing the research literature’s findings on under-reporting and employer-induced claim suppression, we are left with significant gaps in evidence and analysis. There is a basis for plausible estimates of worker under-claiming and employer under-reporting. However, there is a dearth of quantitative evidence to support a credible estimate of the role of employer induced claim suppression.
Even if the research focus were limited to worker under-claiming and employer under-reporting, it would still be useful to have greater insight into the demographics of workers who forego benefits and the characteristics of employers that under-report. It may also be important to better understand how the costs of under-claiming are borne. To what extent are these costs borne by employers, through wage continuation and benefit plans, or by workers, through wage loss? To what degree does the public health system absorb costs that should be covered by the compensation system? To what degree are the costs of replacing lost earnings borne by the welfare system, EI or CPP? Finally, it would also be useful to know what file-based evidence might suggest a risk of claim suppression. Such information could be useful in shaping administrative strategies to counter claim suppression.
■

Prism Economics and Analysis 45
Bibliography
Alamgir, H., M. Koehoorn, A. Ostry, E. Tompa, and P.A. Demers. “How many work-related injuries requiring hospitalization in British Columbia are claimed for workers' compensation?” American Journal of Industrial Medicine, 49, no. 6 (June, 2006):443-51.
Association of Workers Compensation Boards of Canada. “Summary of Experience Rating Programs in Canada.”2012. http://www.awcbc.org/common/assets/assessment/experience_rating.pdf. Accessed December 14, 2012.
Arthurs, Harry. Funding Fairness: A Report on Ontario’s Workplace Safety and Insurance System. Toronto: Queen’s Printer, 2012.
Australian Bureau of Statistics. Australian Social Trends, “Work and Health.” cat. no. 4102.0, June 2011. Last modified December 13, 2011. http://www.abs.gov.au/AUSSTATS/[email protected]/Lookup/4102.0Main+Features20Jun+2011.
Aversa, Terri. “Experience Rating: Prevention of Injuries or Managing Injured Workers?” April 6, 2009. http://www.injuredworkersonline.org/Documents/Experience_Rating_Apr06.pdf
Azaroff, L.S., C. Levenstein and D.H. Wegman. “Occupational Injury and Illness Surveillance: Conceptual Filters Explain Underreporting.” American Journal of Public Health 92 (Pt. 9) (2002):1421-29. http://www.ncbi.nlm.nih.gov/pmc/articles/PMC1447253/.
Barth, P.S. and H.A. Hunt. Workers’ compensation and work-related illnesses and diseases. Cambridge MA: MIT Press, 1980.
Benavides, F.G., J. Benach, C. Muntaner, G.L. Delclos, N. Catot and M. Amable. “Associations between temporary employment and occupational injury: what are the mechanisms?” Occupational and Environmental Medicine, 63 (2006):416-421.
Biddle, J. and K. Roberts. “Claiming behavior in workers’ compensation.” Journal of Risk Insurance 70 (2003):59–780.
Biddle, J., K. Roberts, K.D. Rosenman and E.M.Welch. “What percentage of workers with work-related illnesses receive workers’ compensation benefits?” Journal of Occupational and Environmental Medicine 40, no. 4 (1998):325–331.
Billette, Jean-Michel and Teresa Janz. “Injuries in Canada: Insights from the Canadian Community Health Survey”, Statistics Canada Catalogue No. 82-624-X. http://www.statcan.gc.ca/pub/82-624-x/2011001/article/11506-eng.htm.

Prism Economics and Analysis 46
Boden, Leslie I. and Emily A. Spieler. “The Relationship between Workplace Injuries and Workers’ Compensation Claims: The Importance of System Design.” Accessed November 15, 2012, http://workerscomphub.org/sites/default/files/resource-files/ he%20Relationship%20Between%20Workplace%20Injuries%20and%20Workers%27%20Compensation%20Claims%20The%20Importance%20of%20System%20Design.pdf.
Bonauto, D.K., J.Z. Fan, T.W. Largo, K.D. Rosenman, M.K. Green, J.K.Walters, B.L. Materna, J. Flattery, T. St. Louis, L. Yu, S. Fang, L.K. Davis, D.J. Valiante, K.R. Cummings, J.J. Hellsten, S.L. Prosperie. “Proportion of workers who were work-injured and payment by workers’ compensation systems—10 States, 2007.” Morbity and Mortality Weekly Report 59, no. 29 (2010):897–900.
Burton, John F. “Trends in Social Security Disability Insurance and Workers’ Compensation.” Presentation to National Academy of Social Insurance, Washington, D.C., November 18, 2009.
Breslin, Curtis, Jessica Polzer, Ellen MacEachen, Barbara Morrongiello and Harry Shannon. “Workplace injury or ‘part of the job?’: Toward a gendered understanding of injuries and complaints among young workers. Social Science and Medicine 64 (2007):782-793.
Bruser, D. “Hiding injuries rewards companies.” The Toronto Star. June 29, 2008, http://www.thestar.com/News/GTA/article/451322 .
Campolieti, M., Douglas Hyatt, and Terry Thomason. “Experience rating, work injuries and benefit costs - Some new evidence.” Relations Industrielles. 61, no. 1 (2006):118-145.
Canadian Agricultural Injury Reporting. “Agricultural Fatalities and Hospitalizations in Ontario 1990-2008.” 2011. http://www.cair-sbac.ca/wp-content/uploads/2012/03/12-0814_Agricultural-fatalities-in-Ontario-FULL-REPORT-FINAL.pdf. Accessed December 16, 2012.
Dong, Xiuwen S., Alissa Fujimoto, Knut Ringen, Erich Stafford, James W. Platner, Janie L. Gittleman, and Xuanwen Wang. “Injury Underreporting Among Small Establishments in the Construction Industry.” American Journal Of Industrial Medicine 54 (2011):339–349.
Douphrate, David Irvin. Analysis of Agriculture Injuries Using Workers' Compensation Data. Accessed December 15, 2012. http://www.docstoc.com/docs/47006958/analysis-of-agriculture-injuries-using-workers-compensation-data
Eakin, J.M., J. Clarke and E. MacEachen. (2002). Return to work in small workplaces: Sociological perspective on workplace experience with Ontario’s “early and safe” strategy. (2002) Report on Research Funded by the Research Advisory Council of the Ontario Workplace Safety and Insurance Board. Accessed December 12, 2012. http://www.cspdm.ca/upload/267.
Endicott, Marion E. “Squeezing The Worker: How Experience Rating Works.” Industrial Accident Victims’ Group of Ontario. September, 1996. http://www.injuredworkersonline.org/Documents/Squeezing_the_Worker.pdf.

Prism Economics and Analysis 47
Experience Rating Working Group. “Experience Rating: An addiction looking for a rationale?” Submission to the WSIB/WCB Funding Review. April 5, 2011. http://www.injuredworkersonline.org/Documents/WSIBFR_ER_Group_Submission_April_2011.pdf.
Fan Z.J., D.K. Bonauto, M.P. Foley and B.A. Silverstein. “Underreporting of work-related injury or illness to workers' compensation: individual and industry factors.” Journal of Occupational and Environmental Medicine 48, no. 9 (2006):914-22.
Galizzi, Monica, Petra Miesmaa, Laura Punnett, Craig Slatin and the Phase In Healthcare Research Team. “Injured Workers’ Underreporting In The Health Care Industry: An Analysis Using Quantitative, Qualitative, And Observational Data”, Industrial Relations: A Journal of Economy and Society 49, no. 1 (2009): 22–43.
Giammarino, Ron and Gerald Garvey. “The Economic Role and Impact of Workers’ Compensation.” Prepared for Royal Commission on Workers’ Compensation in British Columbia. April 8, 1998. http://www.qp.gov.bc.ca/rcwc/research/giammarino-garvey.pdf.
Gilmore Research Group. “Survey of Injured Workers: Claim Suppression and Direction of Care.” Prepared for State of Washington, Department of Labor and Industries. June 2007. http://www.lni.wa.gov/ClaimsIns/Files/DataStatistics/DataAnalysis/SurveyInjuredWrkrs.pdf.
Gunderson, Morley and Douglas Hyatt. eds. Workers’ Compensation; Foundations for Reform. Toronto: University of Toronto Press, 2000.
Harcourt, Michael, Helen Lamm and Sondra Harcourt. “The Impact of Workers’ Compensation Experience-Rating on Discriminatory Hiring Practices.” Journal of Economic Issues 41, no. 3 (2007):681-699.
Hennebry, Jenna. Permanently Temporary: Agricultural Migrant Workers and Their Integration in Canada, IRPP Study No. 26, Montreal: Institute for Research on Public Policy, February 2012.
Hirsch, B.T., D. Macpherson and J.M. DuMond. “Workers’ compensation recipiency in union and non-union workplaces.” Industrial and Labor Relations Review. 50 (1997):213–236.
Hogg-Johnson, Sheila, Michael Manno, Donald Cole and the Worksite Upper Extremity Research Group. “Reporting Work-Related Musculoskeletal Disorders to the Workplace: factors associated with reporting among newspaper workers.” Working Paper #173, Toronto: Institute for Work and Health, December 2001.
Hopkins, A. Making Safety Work: Getting management commitment to occupational health and safety. St. Leonard's, NSW, Australia: Allen and Unwin, 1995.
Hopkins, Andrew. “Does Compensation have a Role in Prevention.” In Occupational Injury Risk, Prevention and Intervention, edited by Ann Williamson and Anne-Marie Feyer, chapter 20, Boca Raton, FL, USA: CRC Press, 1998.

Prism Economics and Analysis 48
Hyatt, Douglas E. and Boris Kralj. “The impact of workers' compensation experience rating on employer appeals activity.” Industrial Relations 34 no.1 (1995):95-106.
Hyatt, Douglas E. and Terry Thomason. “Evidence on the Efficacy of Experience Rating in British Columbia.” for Royal Commission on Workers’ Compensation in British Columbia. May 1998. http://www.qp.gov.bc.ca/rcwc/research/hyatt-thomason-experience.pdf.
Injured Workers Online. “Fact Sheet: Experience Rating.” November, 2010. http://www.injuredworkersonline.org/Documents/fact_sheet_on_ExperienceRating_2010.pdf. Accessed December 16, 2012.
Institute for Work and Health and IBM Business Consulting Services. “Assessing the Effects of Experience Rating in Ontario: Case Studies in Three Economic Sectors.” June 2005. http://www.iwh.on.ca/system/files/documents/neer_case_studies_2005.pdf.
Ipsos Reid, WSIB CSAT Report 2008 (selected slides) provided by WSIB, on file with author.
Ison, Terrence. Compensation Systems for Injury and Disease: The Policy Choices. Toronto: Butterworths, 1994.
Kochan, T, M. Smith, M. Well and J. Rebitzer. “Human resource strategies and contingent workers: the case of safety and health in the petrochemical industry.” Human Resource Management 33, no. 1 (1994):55-77.
Kosny, Agnieszka, Marni Lifshen, Ellen MacEachen, Peter Smith, Gul Joya Jafri, Cynthia Neilson, Diana Pugliese and John Shields. Delicate Dances: Immigrant Workers’ Experiences of Injury Reporting and Claim Filing. Toronto: Institute for Work and Health, April 2011.
Kralj, Boris. “Employer responses to workers' compensation insurance experience rating.” Relations Industrielles 49 no. 1 (1994):41-60.
Landen D.D. and S. Hendricks. “Effect of recall on reporting of at-work injuries.” Public Health Reports 110 no. 3 (1995):350-4.
Lakdawalla, Darius N., Robert T. Reville and Seth A. Seabury. “How Does Health Insurance Affect Workers’ Compensation Filing?” Working Paper Wr-205-1-ICJ, Rand Institute for Civil Justice, April 2005.
Lippel, Katherine, Marie-Claire Lefebvre, Chantal Schmidt and Joseph Caron. “Managing Claims or Caring for Claimants: The effects of the compensation process on the health of injured workers.” Research Report Montreal: Service aux collectivités of UQAM, 2007.
Lippel, K. “Workers describe the effect of the workers’ compensation process on their health: A Québec study.” International Journal of Law and Psychiatry 30 (2007):427-443.
Lippel K. “Compensation for musculoskeletal disorders in Quebec: Systematic discrimination against women workers?” Internation Journal of Health Services 33, no. 2 (2003):253-81.

Prism Economics and Analysis 49
Maier M. and D. Reinke. “Workplace injuries and workers’ compensation claim filing: Results from the 2002 Oregon population survey.” Last modified March 3, 2004. State of Oregon Deeparment of consumer and business services. http://www.cbs.state.or.us/imd/rasums/resalert/workers’compensationresults.html.
Manitoba Federation of Labour. “An Investigation into the Incidence of WCB Claims Suppression.” June 24, 2010. http://mfl.ca/content/investigation-incidence-wcb-claims-suppression.
Mayhew, C. and M. Quinlan. “The effects of changing patterns of employment on reporting occupational injuries and making workers’ compensation claims.” Paper presented at International Commission on Occupational Health, Singapore, August 2000.
Mayhew, C., M. Quinlan and L. Bennett. The Effects of Subcontracting/ Outsourcing on Occupational Health and Safety, Industrial Relations Research Centre Monograph, Sydney: University of New South Wales, 1996.
Morneau Sobeco. Recommendations for Experience Rating. October 28, 2008 prepared for the Workplace Safety and Insurance Board. http://www.wsib.on.ca/files/Content/Downloadable%20FileExperienceRatingReport/MorneauSobecoReport.pdf.
Morneau Shepell. Background and Analysis Report: WSIB Funding Review. December 2011 http://www.wsibfundingreview.ca/finalreportpdfs/Morneau%20Shepell%20Background%20and%20Analysis%20Report.pdf.
Morris, J. “Injury experience of temporary workers in a manufacturing setting: factors that increase vulnerability.” The American Association of Occupational Health Nurses 47 no. 10 (1999):470-47.
Morro, Maria Mercedes S. “Injured Immigrant Women Workers and Compensation Policy.” Master of Social Work thesis, McMaster University, 2012.
Morse, T., C. Dillon, E. Kenta-Bibi, J. Weber, U. Diva, N. Warren and M.Grey. “Trends in work-related musculoskeletal disorder reports by year, type, and industrial sector: a capture-recapture analysis.” American Journal of Industrial Medicine 48 (2005):40-49.
Murphy, B. “Cost shifting in health care: a pilot study explores the relationships between cost shifting, repetitive strain injury, the Workplace Safety and Insurance Board of Ontario, and publicly funded health care.” Ph.d. diss., York University (Toronto), 2003.
Morse, T., L. Punnett, N. Warren, C. Dillon and A. Warren. “The relationship of unions to prevalence and claim filing for work-related upper-extremity musculoskeletal disorders.” American Journal of Industrial Medicine. 44 (2003):83–93.
Mustard, Cam, Donald Cole, Harry Shannon, Jason Pole, Terry Sullivan, and Richard Allingham. “Declining Trends in Work-Related Morbidity and Disability,1993–1998: A Comparison of

Prism Economics and Analysis 50
Survey Estimates and Compensation Insurance Claims.” American Journal of Public Health 93, no. 8 (2003):1283-1286.
Mustard, Cameron A., Andrea Chambers, Christopher McLeod, Amber Bielecky and Peter Smith. “Comparison of data sources for the surveillance of work injury.” Occupational Environmental Medicine 69, no. 5 (2012):1-8.
New Zealand Parliament. “Experience Rating: Summary of the Literature” undated, unidentified. http://www.parliament.nz/mi-NZ/PB/SC/Documents/Evidence/6/6/8/ 49SCTIR_EVI_00DBSCH_FIN_10284_1_A168758-Experience-Rating-Systems.htm. Accessed December 16, 2012.
Nigam, Rishka, Susan Knight, Karla Armenti and David Skinner. “Using the 2008 NH Behavioral Risk Factor Surveillance System (BRFSS) to estimate the number of work-related injuries with associated payer”. New Hampshire Behavioral Risk Factor Surveillance System, Issue Brief, Department of Health and Human Services, Division of Public Health Service, Bureau of Public Health Statistics and Informatics, State of New Hampshire. June 2011. http://www.dhhs.nh.gov/DPHS/HSDM/brfss/documents/wrinjuries2011.pdf. Accessed December 12, 2012.
Office of Chief Actuary. Brief Summary of Canadian Workers’ Compensation System. International Actuarial Association. June 2010. http://www.actuaries.org/CTTEES_SOCSEC/Documents/Canada_Workers_Comp.pdf
Ontario Federation of Labour. “The Perils of Experience Rating Exposed.” October 2007. http://www.injuredworkersonline.org/Documents/Perils_Experience_Rating.pdf.
Ontario Medical Association, “Submission [regarding Bill 165, an Act to amend the Workers’
Compensation Act and the Occupational Health and Safety Act”, Ontario, Legislative Assembly, Standing Committee on Resources Development, Hansard (September 8,1994).
Ontario Workers’ Compensation Board, Research and Evaluation Branch. “Workplace Accident Reporting Practices Study: Main Report.” (Toronto: 1992)
Pransky, G., T. Snyder, A. Dembe and J. Himmelstein. “Under-reporting of work-related disorders in the workplace: A case study and review of the literature.” Ergonomics 42, no. 1 (1999):171–182.
Premji, S., O. Duguay, K. Messing and K. Lippel. “Are immigrants, ethnic and linguistic minorities over-represented in jobs with a high level of compensated risk? Results from a Montreal, Canada study using census and workers’ compensation data.” American Journal of Industrial Medicine 53, no. 9 (2008):875-885.
Quinlan, M. and C. Mayhew, “Precarious employment and workers' compensation.” International Journal of Law and Pyschiatry 22, no. 5-6 (1999):491-520.
Reno, Virginia, Cecili Thompson Williams, and Ishita Sengupta. “Workers' Compensation, Social Security Disability Insurance, and the Offset: A Fact Sheet.” Social Security Bulletin, Vol. 65

Prism Economics and Analysis 51
No. 4, 2003/2004, U.S. Social Security Administration: Office of Policy. http://www.ssa.gov/policy/docs/ssb/v65n4/v65n4p3.html. Accessed December 15, 2012.
Rosenman, K.D., A. Kalush, M.J. Reilly, J.C. Gardiner, M. Reeves and Z. Luo. “How much work-related injury and illness is missed by the current national injury surveillance system.” Journal of Occupational and Environmental Medicine 49 (2006):357-365.
Rosenman K.D., J.C. Gardiner, J. Wang, J. Biddle, A. Hogan, M.J. Reilly, K. Roberts, E. Welch. 2000. “Why most workers with occupational repetitive trauma do not file for workers’ compensation.” Journal of Occupational and Environmental Medicine 42, no. 1 (2000):25–34.
Scherzer, Teresa, Reiner Rugulies and Niklas Krause. “Work-related Pain and Injury and Barriers to Workers’ Compensation among Las Vegas Hotel Room Cleaners.” American Journal of Public Health 95, no. 3 (March 2005):483-488.
Shannon, Harry and Graham Lowe. “How Many Injured Workers do not File Claims for Workers’ Compnesation Benefits?” American Journal of Industrial Medicine. 42 (2002):467-473.
Shannon, Harry. “Firm Level Organization Practices.” Prepared for Royal Commission on Workers’ Compensation in British Columbia. June 20, 1998. http://www.qp.gov.bc.ca/rcwc/research/shannon-practices.pdf
Smith Peter M., Cameron A. Mustard and Jennifer I. Payne, “Methods for estimating the labour force insured by the Ontario Workplace Safety and Insurance Board: 1990-2000.” Public Health Agency of Canada 25, no. 3/4 (2004). http://www.phac-aspc.gc.ca/publicat/cdic-mcbc/25-3/e-eng.php.
Smith, Peter, Cynthia Chen, Sheilah Hogg-Johnson, Linda Kacur, Cameron Mustard, and Emile Tompa. “Changes in the events and nature of injury associated with no-lost-time claim reports in Ontario between 1991 and 2006: examining the role of firm-level incentives.” 2011 Institute of Work and Health. Issue Briefing. www.iwh.on.ca/system/files/.../open_plenary_2010-10-12_smith.pdf. Accessed December 13, 2012.
Smith, P. M., and C. Mustard. “The unequal distribution of occupational health and safety risks among immigrants to Canada compared to Canadian-born labour market participants: 1993-2005.” Safety Science 48, no. 10 (2010):1296-1303.
Smith, P.M. and C. Mustard. “Comparing the risk of work-related injuries between immigrants to Canada and Canadian-born labour market participants.” Occupational and Environmental Medicine 66 (2009):361-367.
Smith, P., A.A. Kosny and C.A. Mustard. “Difference in access to wage replacement benefits for absences due to work-related injury or illness in Canada.” American Journal of Industrial Medicine 52, no. 4 (2004):341-349.

Prism Economics and Analysis 52
Spieler, Emily A. and John F. Burton Jr. “The Lack of Correspondence Between Work-Related Disability and Receipt of Workers’ Compensation Benefits.” American Journal Of Industrial Medicine 55 (2012):487–505.
State of Oregon, Department of Consumer and Business Services, “Workplace Injuries and Workers’ Compensation Claim Filing: Results from the 2006 Oregon Population Survey.” (October 2008) http://www.cbs.state.or.us/imd/rasums/resalert/RA31/2006/RA31.pdf.
Stock, Susan, Nektaria Nicolakakis, Hicham Raïq, Karen Messing and Alice Turcot. “Reporting of Non-traumatic Work-related Musculoskeletal Disorders to Workers’ Compensation: Results of a 2007-2008 Population Survey.” Presentation to Canadian Association for Research on Work and Health, Vancouver B.C., 2012.
Thompson A.“The consequences of underreporting workers’ compensation claims.” Canadian Medical Association Journal 176, no. 3 (2007):343-4.
Thomason, T., and S. Pozzebon. “Determinants of Firm Workplace Health and Safety and Claims Management Practices.” Industrial and Labor Relations Review 52, no. 2 (2002):286-307. (2002).
Tompa, Emile and Miao Fang. “The Impact of Experience Rating and Firm Size Dynamics on Occupational Health and Safety Performance. Last updated February 3, 2011. http://www.iwh.on.ca/system/files/wsib/Experience_Rating_Tompa_IWH_rev_2011-02-03.pdf.
Tompa, E.M., S. Trevithick, C.B. McLeod. “A systematic review of the prevention incentives of insurance and regulatory mechanisms for occupational health and safety.” Scandinavian Journal of Work Environmental Health 33, no. 2 (2007):85-95.
Underhill, Elsa, and Michael Quinlan. “How Precarious Employment affects Health and Safety at Work.” Relations Industrielles 66, no. 3 (2011):397-421.
U.S. House of Representatives, Committee on Education and Labor. Hidden Tragedy: Underreporting of Workplace Injuries and Illnesses. Majority Staff Report, Washington, Government Printing Office, June 2008.
Walker, Alan. Workplace Health: Changes and Challenges. SIPP Briefing Note, Issue 23. Saskatchewan Institute of Public Policy. June 2008. http://www.uregina.ca/sipp/documents/pdf/BN_23_Walker_online.pdf. Accessed December 15, 2012.
Weiler, Paul C. Reshaping Workers Compensation for Ontario. Toronto: Queen’s Printer, 1980.
Weiler, Paul C. Protecting the Worker from Disability: Challenges for the Eighties. Toronto: Queen’s Printer, 1983.

Prism Economics and Analysis 53
Welch, Laura S., Xiuwen Dong, Francoise Carre and Knut Ringen. “Is The Apparent Decrease In Injury And Illness Rates In Construction The Result Of Changes In Reporting?” International Journal of Occupational and Environmental Health. 13 (2007):39–45.
Wilkins, Kathryn and Susan G. Mackenzie. “Work Injuries.” Health Reports, 18, no. 3 (August 2007): Statistics Canada Cat. No. 82-003.
Workplace Safety and Insurance Appeals Tribunal. Decision 894/89. November 1, 1989 14 WCATR 194.
WorksafeBC. “Claims Avoidance - Discussion Paper.” March 2000. http://www.worksafebc.com/regulation_and_policy/archived_information/policy_discussion_papers/pdf/discusspaper.pdf. Accessed December 14, 2012.
WorksafeBC. “Claims Avoidance: Attempting to Prevent Reporting.” January 19, 2001. http://www.worksafebc.com/regulation_and_policy/archived_information/policy_discussion_papers/pdf/dispapca.pdf. Accessed December 14, 2012.
Workplace Safety and Insurance Board. Chronology and History of WSIB’s Incentive Programs. January 2011. http://www.wsib.on.ca/files/Content/FundingReviewFRChronologyHistory/ExperienceRatingChronologyHistory.pdf. Accessed December 17, 2012.
Workplace Safety and Insurance Board. By the Numbers: 2011 WSIB Statistical Report - Schedule 1 and Schedule 2. http://www.wsibstatistics.ca/. Accessed December 15, 2012.

Prism Economics and Analysis 54
Jurisdiction Scan 3
Chapter Summary
This chapter describes summarizes the results of interviews conducted with 8 of the other 12 Canadian jurisdictions. (Nunavut’s workers’ compensation is managed by the Northwest Territories.)
Several points of interest arise from this jurisdictional scan:
1. Most jurisdictions do not rely on prosecutions as a deterrent to claim suppression owing to the cost of conducting a prosecution and to the difficulty of proving wilful misconduct. The norm is reliance on administrative penalties which would typically be substantially lower than the fines set out in the statute.
2. In some jurisdictions, the legislation contains explicit prohibitions against employer inducement to suppress a claim. This prohibition is in addition to other prohibitions against failing to submit reports or submitting false information.
3. No jurisdiction has undertaken empirical research into the extent, nature or motivation for employer-induced suppression of claims, although Manitoba is planning to undertake such research.
4. Most jurisdictions have not rigorously considered the relationship (or lack thereof) between employer-induced claim suppression and experience rating.
5. Newfoundland and Labrador has instituted incentives for prompt receipt of medical reports. These reports are typically received by the Newfoundland WCB before a worker submits a claim or an employer submits an incident report. The knowledge that medical reports will likely have already been received by the WCB may discourage employers from under-reporting or inducing their employees not to claim benefits.
6. Most jurisdictions rely on worker complaints to trigger an investigation and on claims officers’ suspicions.
■

Prism Economics and Analysis 55
Jurisdiction Scan
Introduction:
This chapter summarizes the results of interviews conducted with 8 of the other 12 Canadian jurisdictions. (Nunavut’s workers’ compensation is managed by the Northwest Territories). The focus of the interviews was on regulatory and policy aspects of employer-induced claim suppression. A copy of the interview questions is reproduced as Appendix A.
The following table indicates the jurisdictions covered in this interim report.
Table No. 8 Jurisdictions Interviewed
Jurisdiction Status
British Columbia interviewed
Alberta interviewed
Saskatchewan research only
Manitoba interviewed
Quebec interviewed
New Brunswick research only
Nova Scotia interviewed
Prince Edward Island research only
Newfoundland interviewed
Yukon Territory interviewed
Northwest Territories interviewed
Nunavut Territory covered by NWT
The purpose of the interviews and research was to ascertain:
whether other jurisdictions have identified employer-induced claim suppression as an administrative or regulatory challenge,
if so, what administrative or regulatory procedures are used to address claim suppression,
whether there has been any research undertaken on claim suppression either by the workers’ compensation board or by third parties,
whether claim suppression was factored in as a risk when designing experience rating, and
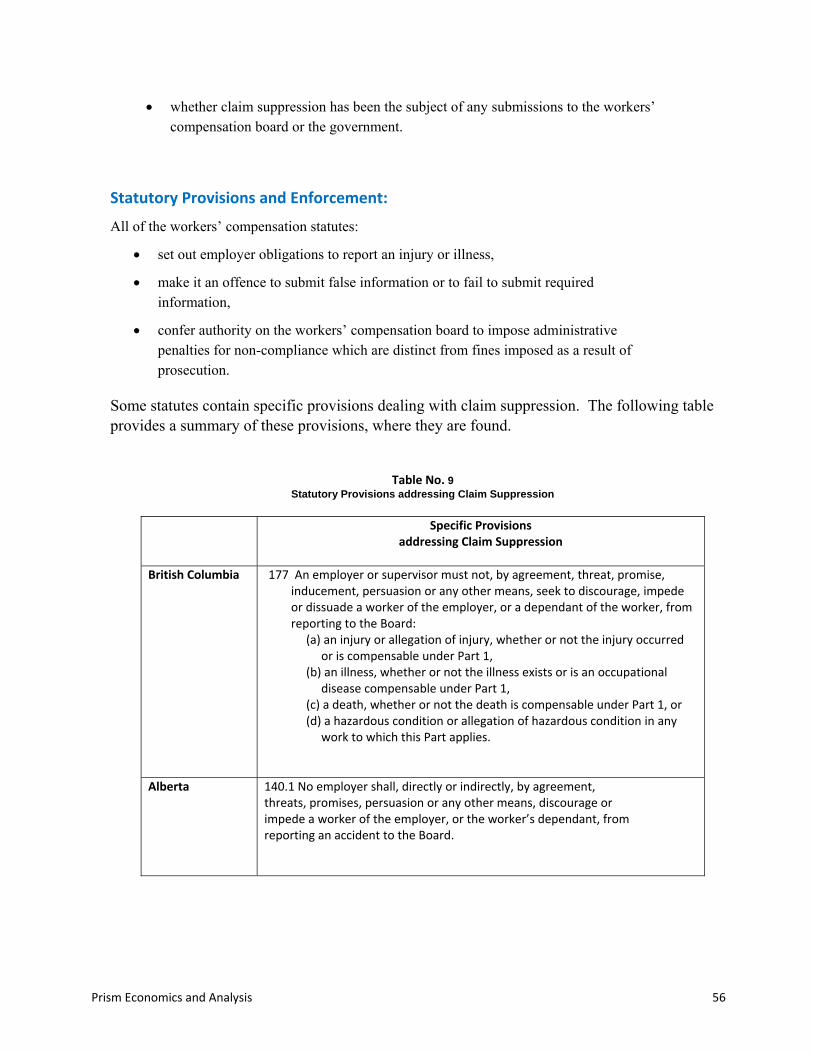
Prism Economics and Analysis 56
whether claim suppression has been the subject of any submissions to the workers’ compensation board or the government.
Statutory Provisions and Enforcement:
All of the workers’ compensation statutes:
set out employer obligations to report an injury or illness,
make it an offence to submit false information or to fail to submit required information,
confer authority on the workers’ compensation board to impose administrative penalties for non-compliance which are distinct from fines imposed as a result of prosecution.
Some statutes contain specific provisions dealing with claim suppression. The following table provides a summary of these provisions, where they are found.
Table No. 9 Statutory Provisions addressing Claim Suppression
Specific Provisionsaddressing Claim Suppression
British Columbia 177 An employer or supervisor must not, by agreement, threat, promise, inducement, persuasion or any other means, seek to discourage, impede or dissuade a worker of the employer, or a dependant of the worker, from reporting to the Board:
(a) an injury or allegation of injury, whether or not the injury occurred or is compensable under Part 1,
(b) an illness, whether or not the illness exists or is an occupational disease compensable under Part 1,
(c) a death, whether or not the death is compensable under Part 1, or (d) a hazardous condition or allegation of hazardous condition in any
work to which this Part applies.
Alberta 140.1 No employer shall, directly or indirectly, by agreement, threats, promises, persuasion or any other means, discourage or impede a worker of the employer, or the worker’s dependant, from reporting an accident to the Board.

Prism Economics and Analysis 57
Saskatchewan No specific provisions.
Manitoba 19.1 No employer or person acting on behalf of an employer shall attempt to compel or induce a worker by intimidation, coercion, promise, the imposition of a pecuniary or other penalty, threat, including a threat of dismissal, or by any other means, not to apply for or pursue an application that has been made for or receive compensation under this Part.
Ontario No specific provisions.
Quebec No specific provisions.
Newfoundland and Labrador
No specific provisions.
Nova Scotia 88 No employer shall, directly or indirectly,…
(e) influence or attempt to influence a worker not to claim or receive compensation pursuant to this Part; or
(f) discipline or discriminate against a worker who reports an accident or makes a claim for or receives compensation pursuant to this Act.
New Brunswick 42.1(2) No employer shall dismiss, suspend, lay off, penalize, discipline or discriminate against a worker because the worker suffered a personal injury by accident in respect of which the worker is, in the opinion of the Commission, entitled to make application for compensation under this Part, from the date of the personal injury
P.E.I. No specific provision.
Yukon 112 It is an offence under this Act for any person to discourage a worker from making a claim for compensation when the worker has or may have suffered a work‐related injury.
N.W.T. 149. No employer shall make an agreement with a worker to waive or to forego any compensation to which the worker or his or her spouse, child or dependants might become entitled.
150. (1) No employer or person acting on behalf of an employer shall prevent, discourage or inhibit, or attempt to prevent, discourage or inhibit, by interference, intimidation or otherwise, a person from making a claim for compensation.
Nunavut 83 (2) Every employer, and every person acting on behalf of an employer, who prevents or attempts to prevent a worker from filing a claim for compensation under this Act is guilty of an offence.
Most jurisdictions indicated that they rely on administrative penalties rather than prosecutions. Prosecutions, if they are conducted, are undertaken by the Attorney-General.

Prism Economics and Analysis 58
Research and Consultations undertaken by Boards:
None of the compensation boards has undertaken research on employer inducement to suppress claims, although Manitoba is planning to do so.
In 2000, WorkSafeBC circulated a paper entitled “Claims Avoidance - Consultation Paper”. The paper suggested a definition for claims avoidance and also proposed enforcement strategies.
In 2005, the Manitoba statute was reviewed following consultations with stakeholders. Among other changes the review led to an amendment which incorporated the current sec. 19.1 which specifically targets employer inducement. (See the preceding table).
In 2011, the Manitoba Federation of Labour (MFL) made a submission on employer iinduced claim suppression. The submission also criticized employer-sponsored, group-based incentive programs to remain accident-free. (The MFL submission was referenced in the literature review). In November 2012, the Manitoba government announced “an external review of the Worker’ Compensation Board’s (WCB’s) process for setting employer premiums, which will look for ways to strengthen employer incentives for more effective injury prevention while targeting the illegal practice of claim suppression.”62
No other jurisdiction reported any formal submissions on employer inducement to suppress claims.
Employer Inducement and the Design of Experience Rating:
Alberta indicated that employer inducement was considered as a factor when their experience rating system was re-designed. Newfoundland and Labrador indicated that penalties were reconfigured to address employers who engaged in claim suppression and who also obtained a refund under the experience rating system. Newfoundland and Labrador also indicated that the design of their system (a range system) was less vulnerable to being ‘gamed’ by employers who suppress claims.
No other jurisdiction indicated that claim suppression behaviour was explicitly taken into account when designing or reviewing experience rating. (Yukon Territory does not experience rate premiums.)
Inappropriate Modified Work Arrangements:
All jurisdictions rely on a complaint by a worker to trigger a review of modified work arrangements.
62 Government of Manitoba - News Release: November 2, 2012

Prism Economics and Analysis 59
Channels which Trigger Investigations of Alleged Claim Suppression:
Most jurisdictions rely on a worker complaint or a union complaint. Several jurisdictions maintain ‘action lines’ that an individual can use to anonymously provide the board with information about alleged claim suppression. All jurisdictions also rely on claims officers/adjudicators to refer a matter for investigation.
In British Columbia, investigations are often triggered by medical practitioners’ comments indicating that the reason for delay in filing a report is employer pressure not to report the injury.
In Newfoundland and Labrador medical practitioners are paid on a scale which declines as the duration of time increases between seeing a patient and filing a report. As a result, the vast majority of medical reports are filed within eight hours and are typically the first document to be received pertaining to an injury or illness. The board then follows up with the worker and the employer if their forms are not filed within a reasonable period of time. The result of the process is that employers and workers are aware that a medical report will be submitted. Consequently, it is believed that there is less likelihood that an employer will attempt to suppress a claim by failing to file a report on the injury or that a worker will fail to file a claim.
Automated Processing of Claims:
As in Ontario, B.C. and Alberta have instituted automated processing for no-lost-time claims. Alberta described the design of its system as geared to screening out fraudulent claims rather than detecting lost-time claims that were being misrepresented as no-lost-time claims. The other jurisdictions have not instituted automated processing.
Abandoned Claims:
No jurisdiction classifies claims as abandoned. Rather all jurisdictions endeavour to close a claim either by accepting it or rejecting it. In B.C., the majority of abandoned claims are formally withdrawn by workers, usually by phoning WorkSafeBC. The claims manager will inquire as to the reasons for withdrawing the claim. If the reasons appear suspicious, the matter may be referred for investigation. Most jurisdictions indicated that they attempt to contact both the worker and the employer before rejecting a claim because of insufficient information.
Conclusions:
Several points of interest arise from this review of policy and practices in other jurisdictions:

Prism Economics and Analysis 60
1. Most jurisdictions do not rely on prosecutions as a deterrent to claim suppression owing to the cost of conducting a prosecution and to the difficulty proving wilful misconduct. Prosecutions, if they are conducted, are handled by the government, rather than the compensation board. The norm is reliance on administrative penalties which are typically much lower than the fines set out in statute.
2. In some jurisdictions, the legislation contains explicit prohibitions against employer inducement to suppress a claim. This prohibition is in addition to prohibitions against failing to submit reports or submitting false information.
3. No jurisdiction has undertaken empirical research into the extent, nature or motivation for employer-induced suppression of claims, although Manitoba is planning to undertake such research.
4. Most jurisdictions have not rigorously considered the relationship (or lack thereof) between employer-induced claim suppression and experience rating.
5. Newfoundland and Labrador relies on incentives to encourage prompt receipt of medical reports. It was indicated that medical reports are typically received by the board before a worker submits a claim or an employer submits an incident report. The knowledge that medical reports will likely have already been received may discourage employers from under-reporting or inducing their employees not to claim benefits.
6. Most jurisdictions rely on worker complaints to trigger an investigation and on claims officers’ suspicions.
■

Prism Economics and Analysis 61
Appendix
Questions asked of Workers’ Compensation Administrators
regarding Employer‐Induced Claim Suppression

Prism Economics and Analysis 62
Questions asked of Workers Compensation Administrators
regarding Employer‐Induced Claim Suppression
Definition Employer-induced claim suppression is action by an employer that induces or is intended to induce an employee not to claim benefits to which he or she may be entitled under workers’ compensation legislation. Claim suppression does not include contesting a claim. Claim suppression would entail one or more of the following:
1. an employer deliberately failing to file required reports or forms concerning an injury or incident with the apparent intent of suppressing information on an injury or illness,
2. an employer deliberately under-stating the severity of an injury or illness in reports to the workers’ compensation agency,
3. an employer reporting to the workers’ compensation agency that an injury or illness entailed no lost time when, in fact, there was lost time,
4. an employer inducing or attempting to induce an employee not to file a claim for benefits,
5. an employer inducing or attempting to induce an employee to understate the severity of an injury or illness,
6. an employer inducing or attempting to induce an employee to report no lost time when, in fact, there was lost time,
7. an employer sanctioning or otherwise retaliating against an employee for submitting a claim or for claiming lost time,
8. an employee having a reasonable perception, based on other incidents, actual threats or implied threats, that he or she would be sanctioned or would be the subject of retaliation if a claim were submitted or for claiming lost time,
9. an employer providing return to work with modified duties when these duties are demonstrably inappropriate in light of the injury and the worker’s normal duties.

Prism Economics and Analysis 63
Questions 1. What provisions in your workers’ compensation legislation, regulations and/or policies would your
enforcement division rely on to prosecute or otherwise pursue employers for claim suppression activity? Please provide specific references to provisions in legislation, regulations and/or policies. Has your workers’ compensation agency undertaken prosecutions of employers or applied administrative penalties to employers for claim suppression? Is there any summary data on the enforcement activity?
2. Has your workers’ compensation agency received any submissions or representations from stakeholders (e.g., employer organizations, unions, injured worker organizations, legal clinics, etc.) on claim suppression? Please provide details and, if possible, copies of submissions (or references to the proponent) if those submissions are in public domain. Has your workers’ compensation agency engaged in any stakeholder consultations on claim suppression? Were there any accompanying discussion papers that you could share with us? Has your workers’ compensation agency undertaken any research into claim suppression to identify its nature, motivations and incidence? Would you be able to share this research?
3. Are you aware of any other organizations in your province or territory that have undertaken research into claim suppression to identify its nature, motivations and incidence? Would you be able to share this research or provide a contact to the sponsoring organization or the researcher? Is your workers’ compensation agency currently contemplating any research, consultations or policy initiatives on claim suppression?
4. Was the risk of employer instigated claim suppression considered in the course of designing experience rating systems? If so, is there any public domain documentation as to how the risk of employer instigated claim suppression was appraised?
5. What is the procedure under which demonstrably inappropriate modified work duties would come to the attention of the workers’ compensation agency?
6. If instances of employer claim suppression have come to the attention of your workers’ compensation agency, what are the most common channels or source of this information?
7. Does your workers’ compensation agency use electronic processing applications to handle certain types of claims? By electronic processing applications, we mean software applications that do all of the processing for certain types of claims, such that no staff person at the agency ever reviews the file.
8. Does your workers’ compensation agency follow up on abandoned claims? If so, what is the nature of the follow-up?

Prism Economics and Analysis 64
Review of Enforcement Files 4
Chapter Summary
This chaptert describes an analysis of 100 randomly selected enforcement files maintained by the Regulatory Affairs branch of the Workplace Safety and Insurance Board. The subject employers in these files were all charged with various alleged infractions of employer obligations under the Workplace Safety and Insurance Act. The objective of the analysis described in this chapter was to identify patterns of behaviour that reflected employer induced claim suppression.
The following table summarizes the claim suppression behaviour documented in the files.
How were Claims Suppressed (Possible Observations: 100)
No.
Continuation of Wages / Employer-Paid Benefits 21
Misled Worker as to Eligibility for WSIB Benefits 22
Misled Worker that Form 7 was Filed when It was Not Filed 7
Encouraged, but did not threaten Worker not to file a Form 6 12
Encouraged, but did not threaten Worker to withdraw a Form 6 3
Threatened Worker if a Form 6 were filed 8
Threatened Worker if a Form 6 were not withdrawn 3
Peer Pressure applied to not file Form 6 or withdraw Form 6 8
No Form 7 Filed 84
Failure to Report Material Change 7
Delay in Reporting 28
Of the 100 files examined, 48 contained evidence of employer behaviours that were directly aimed at preventing or discouraging a worker from filing a claim. This may under-estimate the proportion of employers that engaged in such actions towards their workers, since some of the more subtle forms of inducement may not have been documented in the file. In addition, to inducing their employees not to report injuries or illnesses, the employers who were the subject of these files also engaged in other illegal activities to conceal injuries or illnesses. The most common of these behaviours was the failure

Prism Economics and Analysis 65
to submit a Form 7 or a notice of material change in a worker’s circumstances. Approximately one quarter of the subject employers submitted a Form 7 indicating no-lost-time when there was actual lost time.
The files suggest that overt threats and sanctions were less common than subtle forms of inducement. The files contain evidence that only 9 employers engaged in overt threats, while 39 engaged only in more subtle forms of inducement that did not involve overt threats.
Peer pressure was a factor in 8 of the files and was often related to a group incentive plan to remain accident free.
In 21 of the files, employers provided wages or benefits as part of their strategy to induce workers not to claim workers’ compensation benefits or report the injury.
The overwhelming majority of the workers who are affected by claim suppression are employed in non-supervisory, ‘blue collar’ occupations.
The files do not provide any conclusive evidence on employer motivation for claim suppression. However, the large number of employers that failed to register with the WSIB (49 out of 100) may imply that a general aversion to compliance is a stronger motivation for under-reporting than any other factor.
The construction industry and the food services industry were disproportionately represented in the files. This may suggest a higher risk of claim suppression behaviour in these industries. However, the total number of files was not sufficiently large to draw a robust conclusion on industry patterns.
■
Review of Enforcement Files
Introduction:
This chapter describes an analysis of 100 randomly selected enforcement files maintained by the Regulatory Affairs branch of the Workplace Safety and Insurance Board. All of these files pertained to charges that were laid against employers for various alleged infractions of employer obligations under the Workplace Safety and Insurance Act. The sampled files constituted approximately one quarter of the enforcement files in which charges had been laid. Not all charges proceeded to trial. Some of these charges led to convictions, guilty pleas or settlements. Other charges were withdrawn. However, all of

Prism Economics and Analysis 66
the subject employers in these files were either convicted, or registered a guilty plea, or negotiated a settlement on some or all of the charges. All of the files were selected from the period 1996 to 2012.
Overall there were 338 workers referenced in the 100 sampled files. It is possible that more workers were affected by the employer conduct which was the subject of the investigation. However, the investigators focused on the information from these 338 workers in preparing their case against the subject employers.
The objective of the analysis is to identify patterns of employer behaviour related to suppression of likely eligible claims for workers’ compensation benefits (both medical benefits and lost time). The analysis also seeks to identify patterns involving:
the charges laid against employers,
what triggered the investigation that led to charges being laid.
the industry distribution of employers who were the subject of these enforcement files,
the size of the subject employers,
the nature of the claim suppression activity (e.g., overt threats, misinformation, subtle inducement, failure to submit a Form 7, misrepresentation of injury in a Form 7, failure to register with the WSIB, etc.),
the characteristics of the workers affected by employer claim suppression (occupation, age, gender, etc.),
the nature of the injuries experienced by the affected workers,
the duration of work time lost by the affected workers,
the approximate magnitude of the cost to the affected workers, and
whether third party claims managers were involved.
The files were selected randomly by WSIB staff based on criteria provided by Prism Economics and Analysis. Files were reviewed by two researchers experienced in investigation and worker representation. One was a former state-level assistant attorney-general in the United States. The second was a former union representative. While reviewing the files, both researchers were able to obtain support from a senior WSIB staff member to assist in explaining administrative records or to provide advice on navigating the sometimes extensive file records. To ensure compliance with the WSIB’s privacy obligations, all research was undertaken in a secure room. No notes were taken which would identify a particular employer or worker. Notes were entered into text files and then re-entered into an Access database to facilitate pattern analysis.

Prism Economics and Analysis 67
Charges Laid and Disposition of Charges:
Table No. 10 summarizes the sections of the Workplace Safety Insurance Act under which charges were laid against employers. It is especially noteworthy that in 45 of the cases, the employer had failed to register with the WSIB.
Table No. 10 Types of Charges Laid against Employer
(Possible Observations: 100)
Alleged Infractions: Sections of Workplace Safety and Insurance Act No.
Sec 149.1: employer false statement in claim 29
Sec 149.3: employer false report re material change in circumstance 12
Sec 152.3: failure to report within 3 day/10 days 61
Sec 151.1: failure to register with WSIB 45
Sec 151.2: failure to require a sub-contractor to register and be in good standing
2
Sec 151.3: failure to file annual statement or misrepresentation 0
No. of Sections under which Charges were Laid
One Section 29
Two Sections 63
Three Sections 8
Total 100
Figure No. 11 summarizes the disposition of the cases. The total in Figure No. 11 is less than the total in Figure No. 10 because as part of a settlement or plea bargain, some charges were withdrawn.
Table No. 11 Disposition of Charges Laid against Employer
(Possible Observations: 100)
Disposition of Charges No.
Guilty Plea 86
Plea Bargain 22
Settlement 2
Trial and Conviction 9
Table No. 12 indicates the status of the individuals against whom charges were laid. In many instances charges were laid against the company as well as individuals or only against the company. More than one individual may have been charged in a subject company.

Prism Economics and Analysis 68
Table No. 12 Status of Individuals against whom Charges Laid
(Possible Observations: 100)
Status of Individuals Charges No.
Employer / Officer / Director 85
Senior Manager 1
Supervisor 2
Administrator 3
Third Party Administrator 0
Triggers for Investigation and Subsequent Charges:
Figure No. 13 summarizes the triggering event that led to the investigation and subsequent charges where the file contained a record of the triggering event.
Table No. 13 Event that Triggered Investigation and Subsequent Charges
(Multiple Triggers Possible)
Triggering Event No.
WSIB Staff Referral (often associated with another Trigger) 67
Form 8 Filed / No Employer Registration Found 27
Form 7 Filed / No Employer Registration Found 0
Form 6 Filed / No Employer Registration Found 5
Clearance Certificate Request / No Employer Registration Found 1
Persistent Late Filing of Form 7s 7
Persistent Late Filing of Contribution Payments 4
Suspicious Pattern of Claim Withdrawals 1
Worker Complaint 9
Union Complaint 2
Action Line Referral 18
Legal Clinic / Office of Worker Adviser 0
Other 15
Profile of Employers:
Table No. 14 summarizes the industry distribution of the employers and also shows this distribution in relation to approximate industry distribution of the covered work force allowed lost-time claims.

Prism Economics and Analysis 69
Table No. 14 Industry Distribution of Employers
(Possible Observations: 100)
Industry % of Files
Approx. % of Covered Work
Force
Approx % of Allowed
Lost-Time Claims
Construction 37% 7.1% 9.7%
Restaurant / Bar / Food Service / Hotel and Motel 22% 3.0% 2.7%
Manufacturing and Related 14% 25.7% 18.4%
Trucking / Warehouse / Transportation 4% 5.7% 11.1%
Auto Repair and Related 3% 3.2% 4.5%
Farming 2% 1.2% 2.2%
Health Care 1% 11.2% 15.6%
Utilities 1% 2.2% 0.9%
Mining / Forestry 2% 0.9% 1.1%
Services: 14% 35.2% 39.9%
Retail 7%
Employment Agencies 3%
Waste Management / Recycling 2%
Miscellaneous Services 2%
100%
The most notable asymmetries are:
the construction industry and the food services industry (including hotel and motel)
are markedly over-represented in the enforcement files in relation to their share of the covered work force and to their share of accepted lost time claims. These two sectors accounted for 59% of enforcement files compared to 10.1% of the covered work force and 12.4% of accepted lost-time claims;
the number of files involving the manufacturing sector is moderately less than the manufacturing sector’s share of accepted lost time claims and more significantly less than its share of the covered work force;
there are notably fewer files involving trucking, warehousing and transportation than might have been suggested by the sector’s share of accepted lost time claims;
there is only 1 health care sector file which is substantially less than that sector’s share of both the covered work force and accepted lost time claims.
The inference from the industry distribution of enforcement files is that the construction industry and the food services industry may have a higher risk of claim suppression.

Prism Economics and Analysis 70
Table No. 15 shows that only 12 of the files contained information that indicated the employer was unionized. It is possible that other employers were unionized, but there was no information concerning a union in the file.
Table No. 15 Union / Non-Union Status of Employers
Based on File Information (Possible Observations: 100)
Union / Non-Union Status (Based on File
Information) No.
Union 12
Non-Union 34
No Information in File 54
100
Table No. 13 indicated that 9 investigations were triggered by worker complaints. Only 1 of those workers was unionized, based on the file information. However, this could under-estimate the role of unions if other workplaces were unionized but there was no reference to this in the files. There was no evidence in the files that third party claims managers play a role in the employer’s conduct. Table No 16 shows that 49 of the 100 employers were not registered with the WSIB at the time of the investigation. Of the 12 unionized employers, 2 were not registered with the WSIB.
Table No. 16 WSIB Registration Status of Employers
(Possible Observations: 100)
WSIB Registration Status No.
Registered 51
Not Registered 49
100
Table No. 17 shows the distribution of unregistered employers across industries.

Prism Economics and Analysis 71
Table No. 17 Industry Distribution of Unregistered Employers
Industry
No. of Unregistered Employers
No. of Files
in this Industry
Construction 17 37
Restaurant / Bar / Food Service / Hotel and Motel 17 22
Manufacturing and Related 1 14
Trucking / Warehouse / Transportation 4 4
Auto Repair and Related 1 3
Farming 2 2
Health Care 1
Utilities 1
Mining / Forestry 2
Services: 14
Retail 4 7
Employment Agencies 1 3
Waste Management / Recycling 2
Miscellaneous Services 2 2
49 100
It is noteworthy that:
virtually all manufacturing , mining and forestry employers that were investigated and charged were registered. Indeed only 1 of 16 subject employers was not registered,
more than two-thirds of the investigated restaurant/bar/ food service/ hotel and motel employers were not registered,
half of the investigated construction employers were not registered,
all 4 of the investigated employers in trucking/warehousing/ transportation were unregistered.
The high proportion of construction and transportation employers that were not registered may be related to the high incidence of ‘independent operators’ in these industries and a belief on the part of some of these employers that engaging ‘independent operators’ allowed them to operate without registering with the WSIB.

Prism Economics and Analysis 72
Profile of Affected Workers:
The files contained information on 338 workers who were interviewed as part of the investigations. Virtually all of these workers were non-supervisory, ‘blue collar workers’ or workers engaged in non-supervisory roles in the service sector. Of the 338 interviewed workers, only 12 (3.5%) were self-described supervisors, managers, forepersons or co-ordinators. Table No. 18 summarizes the amount of lost-time indicated in the files. Table No. 19 shows that the average number of days lost among those workers for whom there was information was 20.6 (or 19.3 days if an outlier is removed).
Table No. 18 Amount of Lost Time Experienced by Workers
Whose Circumstances were documented in Files
Amount of Lost-Time Indicated No. of Workers
% of Workers for which there was
Information
% of All Workers
who Lost Time
% of All Workers
No Lost Time 97 33.2% n/a 28.7%
1 - 5 Days of Lost Time 95 32.5% 48.7% 28.1%
6 - 10 Days of Lost Time 26 8.9% 13.3% 7.7%
10 - 15 Days of Lost Time 24 8.2% 12.3% 7.1%
16 - 20 Days of Lost Time 3 1.0% 1.5% 0.9%
More than 20 Days of Lost Time 47 16.1% 24.1% 13.9%
No Information 46 n/a 13.6%
Total (rounded) 338 100.0% 100.0% 100.0%
Table No. 19 Average Number of Days of Lost Time of Those Who Lost Time
(195 Observations)
Mean Average
Average No. of Days of Lost Time 20.6
Average No. of Days of Lost Time (Outlier Removed) 19.3
The total amount of lost-time identified in the 100 files was 4,026 days. Based on the current average daily wage for hourly-rated workers (approximately $131) in Ontario, this would amount to the equivalent of around $527,400 in foregone earnings attributable to injuries which would not have been compensated in the absence of enforcement measures. It is also possible that there were more workers than were noted in the files who benefited from these enforcement activities. Other patterns indicated in the enforcement files are summarized in Table No. 20:

Prism Economics and Analysis 73
Table No. 20 Various Characteristics of Workers who were Documented in the Files
(338 Possible Observations)
Characteristics No. of Workers
% of Workers for whom Information
was Available
% of All
Workers
Gender
Male 268 80.0% 79.3%
Female 67 20.0% 19.8%
No Information 3 0.9%
Language
English* 323 97.0% 95.6%
French 1 0.3% 0.3%
Other 9 2.7% 2.7%
No Information / Unclear 5 1.4%
Employment Status
Full-Time 297 92.2% 87.9%
Part-Time 25 7.8% 7.4%
No Information 16 4.7%
Permanent 295 94.6% 87.3%
Not Permanent 17 5.4% 5.0%
No Information 26 7.7%
Return to Work Status
Returned to Work 288 89.7% 85.2%
Did not Return to Work 33 10.3% 9.8%
No Information 17 5.0%
*The high proportion of workers who communicated with investigators in English may be a reflection of the language preference of the investigators. It should not be inferred that 97.9% of the interviewed workers were necessarily fluent in English
The age distribution of the workers for whom there is information in the files is indicated in Table No. 21 and compared to the age distribution for the work force as a whole.

Prism Economics and Analysis 74
Table No. 21 Age Distribution of Workers who were Documented in the Files
Age No. of
Workers % of
Workers for which there was
Information
% of Total
Work Force
% of Allowed
Lost Claims
<25 34 22.8% 16.0% 11%
26-35 34 22.8% 19.9% 45%
36-45 47 31.5% 25.0%
46-55 26 17.4% 23.8% 13%
56-65 8 5.4% 12.6% 28%
>65 0 0.0% 2.7% 3%
No. Information 189
Total 338 100.0% 100.0% 100%
The average age of the workers in the files was 36.4 years. This compares to approximately 39.3 in the 2006 Census.
Nature of Claim Suppression:
Table No. 22 summarizes what was suppressed by the employers who were the subject of the investigations in these files.
Table No. 22
What was Suppressed (Possible Observations: 100)
No.
No Form 7 Filed 84
Lost Time Injury reported as No Lost time 23
Failure to File Material Change Notice reporting Lost Time
7
Understating Amount of Lost Time 7
Understating Amount of Lost Earnings 9
Modified Work Arrangement were Demonstrably Inconsistent with WSIB Policy on Safe and Early Return to Work and Meaningful Employment
14
Other 15

Prism Economics and Analysis 75
Table No. 23 summarizes how claims were suppressed based on the documentation in the enforcement files. It is noteworthy that overt threats were documented in only a minority of cases. In total, only 9 files contain evidence of overt threats. Overt inducement appears to be less common than more subtle forms of inducement to suppress claims.
Table No. 23 How were Claims Suppressed (Possible Observations: 100)
No.
Overt Inducement:
Threatened Worker if a Form 6 were filed 8
Threatened Worker if a Form 6 were not withdrawn 3
Subtle Inducement:
Misled Worker as to Eligibility for WSIB Benefits 22
Misled Worker that Form 7 was Filed when It was Not Filed 7
Continuation of Wages / Employer-Paid Benefits 21
Misled Worker as to Eligibility for WSIB Benefits 22
Encouraged, but did not threaten Worker not to file a Form 6 12
Encouraged, but did not threaten Worker to withdraw a Form 6 3
Peer Pressure applied to not file Form 6 or withdraw Form 6 8
No Form 7 Filed 84
Failure to Report Material Change 7
Delay in Reporting 28
Table No. 24 summarizes the information from the files on continuation of wages or benefits in lieu of workers’ compensation benefits.
Table No. 24 Continuation of Wage or Benefits
(Possible Observations 100)
No.
Wages and/or Benefits provided by Employer 21
No Wages or Benefits provided by Employer 66
No Information 13
Total 100
With only a few exceptions, the enforcement files do not contain reliable information that would enable a motive for claim suppression to be inferred without qualifications.

Prism Economics and Analysis 76
A general disposition to non-compliance is the most common feature of the sampled files. This characterization applies to the 49 employers that did not register and to 14 other employers that, although registered, appear to have had a de facto policy of not reporting injuries.
Employer Inducement:
A broad definition of employer inducement to suppress a claim would include any of the behaviours in Table No. 23. On that definition, all the subject employers engaged in employer induced claim suppression. This report, however, defines inducement as behaviours which were intended to prevent or discourage a worker from filing a claim. On that basis, failure to file a Form 7, failure to file notice of material change or delay in reporting would not constitute inducement, although it may accompany inducement. On the narrower definition used in this report, 48 of the files contain evidence of employer behaviours that were directly aimed at preventing or discouraging a worker from filing a claim. This may under-estimate the proportion of employers that engaged in such actions towards their workers, since some of the more subtle forms of inducement may not have been documented in the file.
Conclusions:
The foregoing analysis of enforcement files suggests the following conclusions:
1. Employer inducement is a material factor in under-reporting: 48 of the files contained evidence of employer behaviour that was intended to prevent or discourage a worker from filing a claim. The actual proportion of employers who engaged in such behaviour could have been higher, although there is no documentation in the files to support a higher estimate.
2. Overt threats and sanctions are less common than subtle forms of inducement. The files contain evidence that only 9 employers engaged in overt threats, while 39 engaged only in more subtle forms of inducement that did not entail overt threats.
3. Peer pressure was a factor in 8 of the files and was often related to a group incentive plan to remain accident free.
4. The WSIB’s Action Line is an important channel for bringing non-compliance to the attention of the WSIB. In this analysis, 18 of the 100 investigations were triggered in whole or in part by an Action Line referral.
5. Overall, 29 of the investigations were initiated in whole or in part as a result of a referral from the WSIB’s Action Line or a complaint by a worker or a trade union. By inference, if investigations were initiated solely on the basis of a complaint, approximately 70% of these cases would not have been investigated. Internal WSIB

Prism Economics and Analysis 77
procedures that track suspicious or anomalous reporting (or non-reporting) are clearly important to an overall enforcement strategy.
6. The files support the conclusion drawn from the literature review that the overwhelming majority of the workers who are affected by claim suppression are employed in non-supervisory, ‘blue collar’ occupations. While there is no evidence in the files on either educational attainment or immigration status, it is likely that there is be a strong correspondence with workers whose educational attainment is high school or less or who are recent immigrants.
7. The fact that 49 of the 100 files pertain to employers that failed to register with the WSIB may imply that a general aversion to compliance is a stronger motivation for under-reporting than any other factor. Since these employers were not registered with the WSIB, clearly the WSIB’s experience rating system was not a factor in their non-compliant conduct.
8. The files suggest that construction and food services may be higher risk industries.
9. The files indicate that various types of anomalies are the most common trigger for an investigation. The most common anomaly is a Form 6 or Form 8, but no corresponding employer registration with the WSIB.
■

Prism Economics and Analysis 78
Review of No‐Lost‐Time Files 5
Chapter Summary
This chapter describes an analysis of 2,707 randomly selected claims files classified by the WSIB as No-Lost-Time (NLT) claims. The objective of the analysis was to determine whether there were anomalies or other ‘flags’ in the files that suggest a material risk that some claims should have been submitted and treated as lost-time claims. It should be noted that these ‘flags’ are untested indicators of misreporting risk. As well the sampled files were pre-screened, based on injury, to increase the likelihood of a risk flag being identified. Notwithstanding these qualifications, the ‘flags’ suggest controls that the WSIB could apply as part of its overall risk management strategy. Subsequent administrative follow-up will determine the robustness of the proposed ‘flags’ as actual indicators of misreporting risk.
The files were pre-screened to generate a subset of claims for which the indicated injury was to the head only, the back only, the shoulder only or involved multiple injuries. The purpose of pre-screening the files in this way was to increase the efficiency of the sample for purposes of generating a pool of survey candidates. As a result of this pre-screening, the survey sample is not representative of the universe of NLT claims.
The following tables summarize the incidence of different ‘risk flags’. The flags are not mutually exclusive and therefore cannot be summed.
Table A Incidence of ‘Risk Flags’ involving References or Likely References to Lost-Time
References or Likely References to Lost-Time No. % of Total
Flag #1: Lost-Time indicated in Form 6 or 7 157 5.8%
Flag #2: Unable to Return to Work indicated in Form 8 or FAF 190 7.0%
Flag #3: Any reference to lost time or inability to return to work in Forms 6, 7, 8, FAF, Progress Reports or other documentation in the file
397 14.7%

Prism Economics and Analysis 79
Table B Incidence of ‘Risk Flags’ involving a Possible Incongruity between The Severity of the Injury and the No-Lost-Time Status of the Claim
Severity of Injury Indicators No. % of Total
Flag #4: Emergency Department visit indicated in Form 6 or 7 773 28.6%
Flag #5: Hospital admission indicated in Form 6 or 7 46 1.7%
Flag #6: Ambulance indicated in Form 6 or 7 48 1.8%
Flag #7: Pain Scale ranking of 7-10 175 6.5%
Flag #8: Pain Scale ranking of 8-10 94 3.5%
Flag #9: Multiple injuries indicated in Form 6, 7 or 8 864 31.9%
Flag #10: Researcher’s assessment that severity of injury was likely incongruent with no-lost-time
133 4.9%
Table C Incidence of Other ‘Risk Flags’
Other Potential Risk Indicators No. % of Total
Flag #11: No Form 7 58 2.1%
Flag #12: Length of File 111 4.1%
Flag #13: Researcher found significant contradictions in the file 505 18.7%
The flags involving actual references in the claims files to lost time are the strongest indicators of a risk that the claim should have been reported and treated as a lost-time claim. However, it should not be assumed that a reference in the file to lost time is necessarily evidence of misrepresentation. For example, the lost time could refer to scheduled time off. A medical report indicating that the worker was unable to return to work may have been submitted without knowledge of the modified work arrangements offered by the employer. The incidence of the risk flags should not, therefore, be used as a proxy for misreporting. The flags pertaining to the severity of the injury are inherently ambiguous. No clear cut conclusions can be drawn from these flags. However, the flags do suggest a risk of misreporting. Injuries that involved a hospital admission (as opposed to an emergency room visit), the use of an ambulance, or a pain scale ranking of 8 or higher are more likely to be associated with lost-time than with no lost time. The absence of a Form 7, could suggest that the employer was seeking to suppress the claim, although other explanations are also possible. Finally, when interpreting the results of this analysis, it should be borne in mind that the sample was pre-screened to increase the likelihood of identifying risk files. Notwithstanding these caveats, the research does suggest a material risk of misreporting based on anomalies or other flags in the claims files.
■

Prism Economics and Analysis 80
Review of No Lost Time Files
Introduction
This chapter summarizes an analysis of 2,707 claims files from 2011 which were classified by the WSIB as No-Lost-Time (NLT) claims. The objective of the analysis was to determine whether there were markers in the files that could reasonably be interpreted as indicating a risk that the claim pertained to a lost-time injury or illness, notwithstanding that the claim had been submitted and classed as a no-lost-time claim. It must be stressed that identifying a file as a ‘risk file’ does not imply an assessment that misrepresentation actually occurred. The ‘flags’ are untested indicators of misreporting risk. Nevertheless the ‘flags’ do suggest that there is a material risk of misreporting, although the actual incidence of misreporting cannot be inferred from this analysis. The ‘flags’ suggest controls that the WSIB could apply as part of its overall risk management strategy. Subsequent administrative follow-up, based on these flags, will then determine the robustness of the ‘flags’ as actual indicators of misreporting risk.
Methodology
The 2011 NLT claims files were first screened to generate a subset of claims for which the indicated injury was to the head only, back only, shoulder only or involved multiple injuries. The purpose of pre-screening the files in this way was to increase the likelihood of identifying files in which a lost-time injury or illness was reported as a no-lost-time incident. The files that met the pre-screening criteria represented 37.5% of NLT files in 2011. One of the consequences of pre-screening the sample is that the incidence of risk identified in the analysis is not necessarily representative of the universe of NLT claims.
From the subset of pre-screened files, 3,000 files were randomly selected by the WSIB, based on criteria recommended by Prism Economics and Analysis. To protect privacy, WSIB staff redacted personal identifiers of claimants and also the name of the claimants’ employer. These redaction procedures were approved by the WSIB’s privacy officer. Each file was then assigned a new code so that the Prism Economics’ researchers would not know the file’s actual WSIB code. The redacted and recoded files were then reviewed by the Prism Economics researchers. Data from the files were captured in an Access database. The data capture template was also approved by the WSIB’s privacy officer. Up to 117 data characteristics were captured from each file depending on the contents of the file. Each file was then reviewed in terms of certain risk factors.
Some files were deleted from the initial sample of 3,000 owing to inadvertent duplication of redacted files or misclassification of the file as a no-lost-time claim. The usable sample was 2,707 files.

Prism Economics and Analysis 81
Characteristics of Files
Table No. 25 shows the WSIB’s disposition of the files.
Table No. 25 Disposition of Sampled NLT Files by WSIB
Disposition by WSIB No. %
Accepted: No Modified Work 1,237 45.7%
Accepted: Modified Work 1,167 43.1%
Other Accepted 9 0.3%
Rejected 282 10.4%
Cannot be determined from file 12 0.4%
Total 2,707 99.9%
Table No. 26 indicates the WSIB forms that were present in the files.
Table No. 26 Forms Present in Sampled NLT Files
No. %
Files with Form 6, 7 and 8
Form 6 in File 1,118 41.3%
Form 7 in File 2,649 97.9%
Form 8 in File 1,942 71.7%
No. of Forms (6, 7, and 8) in Files
No Forms in File 21 0.8%
One Form in File 522 19.3%
Two Forms in File 1,305 48.2%
Three Forms in File 859 31.7%
2,707 100.0%
One Form Only in File
Form 6 Only 15 2.9%
Form 7 Only 501 96.0%
Form 8 Only 6 1.1%
Two Forms in File
Forms 6 and 7 in File 228 17.5%
Forms 6 and 8 in File 16 1.2%
Forms 7 and 8 in File 1,061 81.3%
Other Forms in Files
26 - Practitioner's Progress Report 331 12.2%
41 - Worker's Progress Report 268 9.9%
42 - Employer's Progress Report 310 11.5%
Functional Abilities Form 982 36.3%
REO6 - Worker's Continuity Report 23 0.8%

Prism Economics and Analysis 82
Table No. 27 cross-tabs the disposition of claims by the number of forms present. As can be seen, only a minority of accepted claims had all three forms present in the file.
Table No. 27
Disposition of Claims compared with Presence of Forms 6, 7 and 8 in Sampled NLT Files
Accepted: Modified
Work
Accepted: No Modified Work
Rejected Accepted: Other or
Cannot be Determined
Number
No Forms Present 4 7 1 9
1 Form Present 145 317 53 7
2 Forms Present 610 577 115 3
3 Forms Present 408 336 113 2
1,167 1,237 282 21
Percentage
No Forms Present 0.1% 0.3% 0.0% 0.3%
1 Form Present 5.4% 11.7% 2.0% 0.3%
2 Forms Present 22.5% 21.3% 4.2% 0.1%
3 Forms Present 15.1% 12.4% 4.2% 0.1%
Of the 2,707 claims, 188 contained an employer Direction of Authorization to a regulated paralegal representative. This implies that in about 7% of the cases, a third-party claims manager had been engaged by the employer.
Demographic and Labour Market Characteristics of Claimants
The gender distribution of the sampled NLT files was 58.8% men and 41.2% women, with 14 files not having any gender identification. The average age of male claimants was 44.4; the average age of female claimants was 42.4. Table No. 28 summarizes the age distribution of the claimants in the NLT files and compares this to the employed labour force in Ontario for 2011. Relative to the labour force, NLT claimants are over-represented in the 45-54 and 55-64 age cohorts.

Prism Economics and Analysis 83
Table No. 28 Age Distribution of Claimants
in Sampled NLT Files compared with Employed Labour Force in Ontario
Age Category No. % of
Valid % of Total
Ontario ELF
<25 239 9.0% 8.8% 13.4%
25 - 34 512 19.2% 18.9% 20.4%
35-44 585 22.0% 21.6% 21.7%
45-54 769 28.9% 28.4% 24.4%
55-64 491 18.5% 18.1% 14.0%
65+ 65 2.4% 2.4% 6.2%
Total 2,661 100.0% 98.2% 100.1%
Missing 46 1.7%
Total (% rounded) 2,707 100.0%
Nine-five percent of NLT claimants with a Form 6 in the file stated their preferred language of communication as English. Almost half of all claimants (48.3%) were members of a trade union.
Table No. 29 indicates the employment status of the claimants.
Table No. 29 Employment Status of Claimants
in Sampled NLT Files
Employment Status of Claimants No. % of
Valid % of Total
Permanent Employees:
Full-Time 1,911 73.6% 70.6%
Part-Time 313 12.1% 11.6%
Other (Casual, Contract, Student, etc.) 372 14.3% 13.7%
2,596 100.0%
Not answered 111 4.1%
2,707 100.0%
Table No. 30 summarizes the rate group indicated.

Prism Economics and Analysis 84
Table No. 30 Rate Group Status of Employers
in Sampled NLT Files
Description Rate Groups
No. Percent of
Identified
Percent of Total
Logging, Wood/Pulp and Paper Mills, Corrugated Boxes 30-41 11 0.6% 0.4%
Mining and Related 110-134 31 1.6% 1.1%
Farming, Fishing and Related 159-184 9 0.5% 0.3%
Landscaping 190 3 0.2% 0.1%
Food Processing and Manufacturing 207-542 605 31.8% 22.3%
Transportation and Warehousing 551-590 111 5.8% 4.1%
Retail, Wholesale 604 - 685 326 17.1% 12.0%
Waste Materials Recycling 689 8 0.4% 0.3%
Construction 704 - 764 165 8.7% 6.1%
School Boards, Education Facilities 810-817 37 1.9% 1.4%
Power and Utilities 830-838 29 1.5% 1.1%
Local Government 845 25 1.3% 0.9%
Health Care, Community Services and Related 851-861 315 16.5% 11.6%
Miscellaneous Services (ex Restaurant, Catering and Hotel) 875-983 155 8.1% 5.7%
Restaurant, Catering and Hotel 919-921 74 3.9% 2.7%
Sub-Total (rounded %) 1,904 100.0% 70.3%
No Rate Group Indicated 716 26.4%
No Form 7 58 2.1%
Unclear Rate Group or No Longer in Use Rate Group 29 1.1%
Total (% rounded) 2,707 100.0%
Injury and Incident Information
Of those files that contained a Form 6, 88.7% indicated that the employer had been advised of the incident which led to the claim. Where the employer had not been advised, reasons were generally given. As these reasons are text variables, they have not been analyzed, but will be reviewed when the panel of claimants to be surveyed is determined.
Table No. 31 summarizes data on the area of the body injured. Certain areas of the body were selected as being more likely to be associated with serious injury. Only information on these types of injuries was collected in detail.

Prism Economics and Analysis 85
Table No. 31 Areas of Body Injured - Claimants in Sampled NLT Files
(Body Areas associated with Severe Injury only)
Area of Body Injured (Areas Most Commonly Associated
with Severe Injuries)
No. % of Total
Head/Face/Eyes/Ears/Teeth/Neck 286 10.6%
Chest/Abdomen/Pelvis 40 1.5%
Back 481 17.8%
Shoulder 141 5.2%
Limb 366 13.5%
Multiple Injuries 864 31.9%
Overall, of 2,707 files, 1,093 (40.4%) involved injuries to areas of the body associated with serious injury.
Table No. 32 shows the distribution of medical reports that indicated a pain scale ranking. As can be seen, about 6.5% of total claims had evidence of a pain scale ranking of 7 or higher. Return to work on the day following the incident would be challenging for these individuals.
Table No. 32
Pain Scale Ranking where Indicated for Claimants in Sampled NLT Files
Pain Scale No. % of Valid
% of Total
0 to 6 222 55.9% 8.2%
7 to 10 175 44.1% 6.5%
8 to 10 94 23.7% 3.5%
Total Files with Pain Scale Information 397 100.0%
Missing 2,310 85.3%
Total 2,707 100.0%
Table No. 33 shows the pain scale rating in related to the area of injury where the records provided this information Only 10.7% of the sampled files provide information on both areas of body injured and pain rating.

Prism Economics and Analysis 86
Table No. 33 Pain Scale Ranking where Indicated for Claimants
in Sampled NLT Files
Total Pain Scale
1- 7 7-10 8-10
Head/Face/Eyes/Ears/Teeth/Neck 45 56% 44% 29%
Chest/Abdomen/Pelvis 9 56% 44% 33%
Back 82 55% 45% 26%
Shoulder 76 45% 55% 29%
Limb 59 53% 47% 27%
Other 18 61% 39% 22%
Total 289
No. of Body Areas Injured
One 293 55% 45% 23%
Two 77 57% 43% 32%
Three 24 46% 54% 13%
Total 394
Table No. 34 shows where claimants received medical attention, if this was indicated on either the Form 6 or Form 7. As can be seen, 9.1% of all NLT claims were associated with a visit to the Emergency Department of a hospital.
Table No. 34 Where Claimants received Medical Treatment
in Sampled NLT Files
Where Medical Treatment was Received No. % of Total
First Aid 342 12.6%
Nursing Station 119 4.4%
Emergency 773 28.6%
Admitted to Hospital 46 1.7%
Ambulance 48 1.8%
Professional Health Office 1274 47.1%
Clinic 578 21.4%
Post‐Injury Circumstances
Table No. 35 summarizes evidence from the files on status of the worker on the day following the incident.

Prism Economics and Analysis 87
Table No. 35 Status of Claimant on Day Following the Incident
Status of Claimant on Day Following Incident No. % of
Total
No Answer 1,636 60.4%
Lost job due to inability to use hands 1 <0.1%
Lost Time and/or Pay 96 3.5%
No Time Off 1 0.0%
Returned to Modified Duties / No Lost Time or Earnings 479 17.7%
Returned to Regular Job / No Lost Time or Earnings 493 18.2%
Both Regular and Modified Duties 1 0.0%
Total 2,707 99.8%
On the basis of the file information at least 97 claimants (3.6%) should have been classed as lost-time claimants, presuming that their claim was based on a valid, work-related incident. As will be described below, other file evidence would support a somewhat higher estimate for the proportion of claimants who probably experienced lost time.
Table No. 36 summarizes data from Form 8s. The analysis indicates that 4.8% of all files included a Form 8 in which the practitioner indicated that the individual was ‘unable to return to work’. In some cases, medical practitioners are unaware of an employer’s offer of modified duties and make their medical assessment on the basis of the employee’s regular duties. It is possible, therefore, that this 4.8% measure overstates the extent of injuries in NLT files which rendered the claimant medically unable to return to work.
Table No. 36 Medical Assessments from Form 8s
Form 8 - Medical Assessment No. % of Total
Regular Duties (sometimes with limitations) 581 21.5%
Modified Duties 1,292 47.7%
Unable to Return to Work 131 4.8%
Limitations (Regular or Modified not specified) 3 0.1%
Not Answered 697 25.7%
Unclear 3 0.1%
2,707 99.9%
An analysis of FAFs indicates that there are 84 FAFs (3.1% of all files) indicating that the individual was unable to return to work. There were 48 files with Form 41’s (Worker’s Progress Report) indicating lost time and lost pay (1.8% of all files). In fact, there were 23 such indications in the Form 42s (Employer’s Progress Report) contained in the files. Table No. 37 summarizes this information.

Prism Economics and Analysis 88
Table No. 37 Post-Injury Status, based on Forms 41 and 42
(Worker / Employer Progress Reports)
Form 41 Worker’s Progress
Report
Form 42 Employer’s Progress
Report
No. % of
Valid No. % of
Valid
No. of Forms 268 310
No Lost Time or Pay 224 82.4% 294 92.7%
Lost Time or Pay, but Returned to Work 40 14.7% 20 6.3%
Lost Time of Pay, did not Return to Work 8 2.9% 3 0.9%
Total* 272 100.0% 317 99.9%
*sums do not match no. of forms owing to multiple submissions in some files
Table No. 38 summarizes reports of lost time from Forms 6 and 7. The data from these forms indicates that 5.8% of files had evidence in Forms 6 and 7 of lost time. Lost time was computed by comparing the date of the incident and the date of the return to work. For this purpose, the researchers assumed a standard Monday-Friday work week and took account of statutory holidays. The lost-time estimates are indicative, but not precise. Non-statutory holidays, shift work schedules, overtime days and vacation may have accounted for some of the estimated lost work days.
Table No. 38
Evidence of Lost Time in Forms 6 and 7 Based on Duration between Incident and Return to Work Dates
(Assumptions: Monday-Friday Work Week with Statutory Holidays only)
No. % of
Total
Form 6 only indicates lost time 106 3.9%
Form 7 only indicates lost time 37 1.4%
Forms 6 and 7 indicate lost time 14 0.5%
Total 157 5.8%
Proposed Risk Flags
The following markers in the files are proposed as ‘risk flags’, i.e., possible indicators that the claim involved lost-time, notwithstanding that the claim was submitted as a no-lost-time claim and treated as such by the WSIB. Whether these ‘risk flags’ are efficient indicators of claim misrepresentation can only be determined by comparing results from a survey of NLT claimants with the incidence of the ‘risk flags’.
The proposed risk flags are:

Prism Economics and Analysis 89
Risk Flags related to Lost-Time Indicators
1. Lost-time indicated in Form 6 or 7 2. Lost Time suggested by Form 8 or FAF (unable to return to work) 3. Any reference to lost time in inability to return to work in Forms 6,
7, 8, FAF, Progress Reports or other documentation in the file.
Risk Flags related to Severity of Injury Indicators
4. Emergency Department visit indicated in Form 6 or 7 5. Hospital admission indicated in Form 6 or 7 6. Ambulance indicated in Form 6 or 7 7. Pain Scale ranking of 7-10 8. Pain Scale ranking of 8-10 9. Multiple Injuries 10. Researcher’s assessment that severity of injury was likely
incongruent with no-lost-time
Risk Flags related to Other Indicators:
11. No Form 7 filed 12. Length of file (suggestive of complexity that may be incongruent
with no-lost-time) 13. Researcher found significant contradictions in the file
Table No. 39 summarizes the incidence of ‘risk flags’ involving references or likely references to lost time or inability to return to work. It should be noted that some of these files involve an interruption of work during the Monday to Friday normal work week. This was taken as a risk indicator of lost-time. However, workers in seven-day operations (e.g., hospitals) could have their two consecutive days off during the Monday to Friday period. The interruption of work in these circumstances would not imply lost working time. There is therefore an over-estimation bias in these risk flags, though they may nevertheless ultimately prove to be efficient risk indicators
Table No. 39
Incidence of ‘Risk Flags’ involving References or Likely References to Lost-Time
References or Likely References to Lost-Time No. % of Total
Flag #1: Lost-Time indicated in Form 6 or 7 157 5.8%
Flag #2: Unable to Return to Work indicated in Form 8 or FAF 282 10.4%
Flag #3: Any reference to lost time or inability to return to work in Forms 6, 7, 8, FAF, Progress Reports or other documentation in the file
397 14.7%

Prism Economics and Analysis 90
Table No. 40 summarizes the incidence of ‘risk flags’ related to the severity of injuries.
Table No. 40 Incidence of ‘Risk Flags’ involving References or Likely References to Lost-Time
Severity of Injury Indicators No. % of Total
Flag #4: Emergency Department visit indicated in Form 6 or 7 773 28.6%
Flag #5: Hospital admission indicated in Form 6 or 7 46 1.7%
Flag #6: Ambulance indicated in Form 6 or 7 48 1.8%
Flag #7: Pain Scale ranking of 7-10 175 6.5%
Flag #8: Pain Scale ranking of 8-10 94 3.5%
Flag #9: Multiple injuries indicated in Form 6, 7 or 8 864 31.9%
Flag #10: Researcher’s assessment that severity of injury was likely incongruent with no-lost-time
133 4.9%
Table No. 41 summarises the incidence of the other ‘risk flags’.
Table No. 41 Incidence of Other ‘Risk Flags’
Other Potential Risk Indicators No. % of Total
Flag #11: No Form 7 58 2.1%
Flag #12: Length of File 111 4.1%
Flag #13: Researcher found significant contradictions in the file 505 18.7%
In addition to the ‘risk flags’ the analysis also tracked the use of third party claims administrators. Overall, 188 files (6.9%) indicated that the employer had authorized a Law Society regulated entity to represents its interests in the claim.
Table No. 18 explores correlations of indicators which may indicate a higher degree of risk.

Prism Economics and Analysis 91
Table No. 42 Correlations of ‘Risk Flags’
Correlations No. % of Total
Flag #3: Any reference to lost time or inability to return to work in Forms 6, 7, 8, FAF, Progress Reports or other documentation in the file and Flag #7: Pain Scale ranking of 7-10
36 1.3%
Flag #3: Any reference to lost time or inability to return to work in Forms 6, 7, 8, FAF, Progress Reports or other documentation in the file and Flag #13: Researcher found significant contradictions in the file
118 4.4%
Flag #3: Any reference to lost time or inability to return to work in Forms 6, 7, 8, FAF, Progress Reports or other documentation in the file and Flag #9: Multiple injuries indicated in Form 6, 7 or 8
29 1.1%
Flag #3: Any reference to lost time or inability to return to work in Forms 6, 7, 8, FAF, Progress Reports or other documentation in the file and Flag #4: Emergency Department visit indicated in Form 6 or 7
137 5.1%
Table No. 43 correlates the incidence of the risk flags by industry. Table No. 43 also indicates the use of Law Society of Upper Canada (LSUC) regulated entities to represent an employer. It should be noted that the correlations in Table No. 43 are approximate because usable rate code information was only available for 70% of the files.
Table No. 43
Correlation of ‘Risk Flags’ by Industry
Flag No. 1 2 3 4 5 6 7
Average Incidence of Flag 5.8% 10.4% 14.7% 28.6% 1.7% 1.8% 6.5%
Logging, Wood/Pulp and Paper Mills, Corrugated Boxes 9.1% 18.2% 27.3% 36.4% 9.1% 0.0% 18.2%
Mining and Related 6.5% 12.9% 16.1% 41.9% 3.2% 6.5% 9.7%
Farming, Fishing and Related 0.0% 0.0% 0.0% 44.4% 0.0% 0.0% 0.0%
Landscaping 0.0% 0.0% 0.0% 100.0% 0.0% 0.0% 0.0%
Food Processing and Manufacturing 5.5% 11.2% 14.9% 30.1% 1.5% 1.3% 5.8%
Transportation and Warehousing 9.0% 14.4% 19.8% 27.0% 0.9% 0.9% 3.6%
Retail, Wholesale 4.3% 11.7% 14.4% 28.2% 0.9% 2.5% 8.9%
Waste Materials Recycling 12.5% 12.5% 25.0% 37.5% 0.0% 0.0% 12.5%
Construction 6.1% 17.6% 22.4% 36.4% 1.8% 2.4% 9.1%
School Boards, Education Facilities 0.0% 5.4% 5.4% 27.0% 2.7% 2.7% 5.4%
Power and Utilities 3.4% 17.2% 20.7% 44.8% 3.4% 0.0% 3.4%
Local Government 4.0% 4.0% 8.0% 40.0% 0.0% 4.0% 0.0%
Health Care, Community Services and Related 5.4% 9.8% 13.7% 29.2% 0.0% 0.3% 8.3%
Miscellaneous Services (ex Restaurant, Catering and Hotel) 9.0% 5.8% 14.2% 29.0% 2.6% 1.3% 5.8%
Restaurant, Catering and Hotel 9.5% 12.2% 17.6% 24.3% 1.4% 2.7% 6.8%

Prism Economics and Analysis 92
The following patterns may be relevant:
The sample identified the risk flag incidence in three industries groups as being above average on more than half of the flags: (1) logging, wood/pulp and paper mills, corrugated boxes, (2) mining and related, and (3) waste materials recycling.
Focusing only on the three lost-time risk flags, the analysis suggests potentially higher risk in seven industry groups: (1) logging, wood/pulp and paper mills, corrugated boxes, (2) mining and related, (3) transportation and warehousing, (4) waste materials recycling, (5) construction, (6) power and utilities, and (6) restaurant, catering and hotel.
On almost all risk flags, the manufacturing sector (including food processing) was either below average or quite close to the average incidence.
It is to be stressed that these findings are only hypotheses. They have not been confirmed by survey evidence.
Inappropriate Return to Work
The primary focus of this research is on the potential misrepresentation of a lost-time claim as a no-lost-time claim. A secondary focus was on the appropriateness of the return to work arrangements.
Flag No. 8 9 10 11 12 13 LSUC Entity
Average Incidence of Flag 3.5% 31.9% 4.9% 2.1% 4.1% 18.7% 6.9%
Logging, Wood/Pulp and Paper Mills, Corrugated Boxes 0.0% 36.4% 18.2% 0.0% 0.0% 0.0% 0.0%
Mining and Related 9.7% 22.6% 22.6% 3.2% 3.2% 29.0% 3.2%
Farming, Fishing and Related 0.0% 55.6% 0.0% 0.0% 11.1% 33.3% 11.1%
Landscaping 0.0% 0.0% 33.3% 0.0% 0.0% 66.7% 0.0%
Food Processing and Manufacturing 3.1% 30.4% 5.5% 0.8% 4.5% 16.9% 6.1%
Transportation and Warehousing 3.6% 27.0% 5.4% 0.0% 6.3% 16.2% 9.0%
Retail, Wholesale 4.0% 26.7% 4.3% 0.0% 3.1% 15.6% 22.4%
Waste Materials Recycling 12.5% 37.5% 0.0% 0.0% 25.0% 37.5% 12.5%
Construction 3.6% 24.8% 6.7% 1.2% 1.8% 20.0% 7.3%
School Boards, Education Facilities 5.4% 35.1% 2.7% 0.0% 0.0% 18.9% 2.7%
Power and Utilities 3.4% 37.9% 13.8% 0.0% 20.7% 17.2% 6.9%
Local Government 0.0% 16.0% 0.0% 0.0% 0.0% 16.0% 0.0%
Health Care, Community Services and Related 3.2% 45.1% 3.5% 1.6% 3.5% 18.4% 3.8%
Miscellaneous Services (ex Restaurant, Catering and Hotel) 3.2% 31.6% 3.9% 1.9% 4.5% 23.2% 4.5%
Restaurant, Catering and Hotel 5.4% 31.1% 0.0% 0.0% 1.4% 18.9% 13.5%

Prism Economics and Analysis 93
Most files, however, did not describe the return to work arrangements in sufficient detail to support a useful assessment of the appropriateness of those arrangements.
Conclusions
The key finding from this analysis of NLT claims is that a significant proportion of these files have flags which are suggestive of a risk that the claim may have been misrepresented. However, no definitive conclusions can be drawn from the data. It should also be borne in mind that the sample was pre-screened to increase the likelihood of identifying files which might contain a risk flag. That being said, it is nevertheless noteworthy that 5.8% of the files had indications of lost time in the Form 6 or Form 7 and that 7.0% of the files had Form 8s or FAFs which indicated that the worker was unable to return to work. Additionally, there is evidence that is suggestive that some of the injuries may have been incongruent. For example, 3.5% of the files had a medical practitioner’s report indicating a pain scale rating of 8 or higher. As well, 1.8% of the files indicated that the worker was taken to hospital in an ambulance. Finally, 2.1% of the files were missing a Form 7. None of this evidence, of course, is conclusive. However, the findings are suggestive of a risk that a lost-time injury or illness was misreported as a no-lost-time incident.
■

Prism Economics and Analysis 94
Review of Abandoned Lost‐Time Files 6
Chapter Summary
This chapter describes an analysis of 3,340 randomly selected claims files classified by the WSIB as Abandoned Lost-Time Claims. The files were drawn from the period 1991 to 2011, with greater weight given to more recent years. The objective of the analysis was to determine whether there are markers in the files that may indicate a risk that the abandonment of the claim occurred as a result of employer inducement. Identifying a file as a ‘risk file’ does not imply an assessment that employer inducement occurred, only that there is a risk that inducement may have occurred.
The principal findings from the analysis were:
1. Approximately half of the files had one of the risk flags. Around a third of the files had one of the stronger risk flags.
2. Approximately 10% of the claims were properly abandoned, in that the worker was pursuing benefits under another insurance or benefit regime.
3. In approximately one quarter of the files the employer had not filed a From 7. The proportion of files without a Form 7 increased significantly after 2008.
4. A Form 6 was found in only 17.6% of the files. Any number of hypotheses can be suggested to explain this low proportion. Claim suppression is one these hypotheses. So also is under-claiming for reasons unrelated to claim suppression.
5. In 5.2% of the files there was evidence of more than two calendar weeks of lost time.
The following table summarizes the incidence of the risk flags.

Prism Economics and Analysis 95
Risk Flags suggestive of Employer Inducement to Abandon the Claim
(N=3016)
Status
No. % of Total Files
Suggested as a
Stronger Flag
Risk Flags related Absence of Form 7
Absence of Form 7 805 26.7%
Incomplete Form 7 77 2.6%
Absence of Form 7/ Form 8 Present 711 23.6% ◄
Absence of Form 7/ Form 6 Present 72 2.4% ◄
Risk Flags related to Duration of Lost Time
1-5 Calendar Days Lost 799 26.5%
>5 Calendar Days Lost 350 11.6%
>14 Calendar Days Lost 157 5.2% ◄
1 or More Calendar Days Lost 1,049 34.8%
Risk Flags related to Source of Health Care
Emergency Room 402 13.3%
Admitted to Hospital 35 1.2% ◄
Ambulance 91 3.0% ◄
Risk Flags related to Other Indicators
Worker Formally Withdraws Claim 364 12.1%
Employer continuation of earnings 474 15.7% ◄
Severity of Injury (Researcher Assessment) 148 4.9% ◄
Adjudicator Notes 107 3.5% ◄
■
Review of Abandoned Lost‐Time Files
Introduction
This chapter describes an analysis of 3,340 abandoned lost-time claims from the period 1991 to 2011. The objective of the analysis was to determine whether there were markers in the files that may indicate a risk that the abandonment of the claim occurred as a result of employer inducement.
To protect privacy, WSIB staff redacted personal identifiers of claimants and also the name of the claimants’ employer. These redaction procedures were approved by the WSIB’s privacy officer. Each

Prism Economics and Analysis 96
file was then assigned a new code so that the Prism Economics’ researchers would not know the file’s actual WSIB code. The redacted and recoded files were then reviewed by the Prism Economics researchers. Data from the files were captured in an Access database. The data capture template was also approved by the WSIB’s privacy officer.
It must be stressed that identifying a file as a ‘risk file’ does not imply a determination that employer inducement occurred. Nor does identifying a file as a ‘risk file’ necessarily imply that the claim would have been accepted by the WSIB had the worker pursued the claim.
Gross Sample and Adjusted Sample
The sampling procedure was based on a random sample of files stratified by year. The stratification was weighted to more recent years. Table No. 44 summarizes the sample based on the year the file was opened and the year of the incident.
Table No. 44 Abandoned Lost-Time Claims:
Description of Sample in Terms of Year File was Opened and Year of Incident
Year File
Was Opened Target Sample
Year of Incident
No. of Files
Percent of Total
1991 100 Pre 1991-1991 98 2.9%
1993 100 1992-93 99 3.0%
1995 100 1994-95 100 3.0%
1997 100 1996-97 99 3.0%
1999 100 1998-99 102 3.1%
2000 150 2000 159 4.8%
2001 150 2001 142 4.3%
2002 150 2002 153 4.6%
2003 150 2003 151 4.5%
2004 150 2004 137 4.1%
2005 150 2005 144 4.3%
2006 150 2006 149 4.5%
2007 150 2007 152 4.6%
2008 150 2008 157 4.7%
2009 500 2009 503 15.1%
2010 500 2010 493 14.8%
2011 500 2011 479 14.3%
2012 1 0.0%
No information 22 0.7%
3350 3,340 100.0%
One of the reasons that a file was properly abandoned is that the claimant pursued benefits from another party. The most common example is when the work-related injury involved a motor vehicle

Prism Economics and Analysis 97
accident. In other instances, a worker may be pursuing benefits with another compensation board or under another statutory benefit regime. Table No. 45 shows that just under 10% of the gross sample were abandoned because benefits were being pursued under a third party insurance or benefit regime.
Table No. 45
Indication of a Third Party Insurer or Other Benefit Regime in Gross Sample of Abandoned Lost-Time Claims
File Evidence of Third Party Insurer No. % of Total
Code 64 Rejection (Out of province/Third party accident but worker fails to return election form)
273 8.2%
Other evidence in file of a third party insurer 51 1.5%
Total 324 9.7%
Claims that were abandoned because the claimant was pursuing benefits from a third party insurer or other benefit regime were properly abandoned. There is no reason to doubt the prima facie explanation for the claim being abandoned. For this reason, these files were excluded from the subsequent analysis. The remaining sample was therefore 3,016 files as summarized in Table No. 46. These 3,016 files are referred to hereafter as ‘the adjusted sample’.
Table No. 46 Gross and Adjusted Sample of Abandoned Lost-Time Claims
No.
Gross Sample (per Table No. 44) 3.340
Files indicating a Third Party Insurer or Benefit Regime (per Table No 45) 324
Adjusted Sample 3,016
Figure No 47 shows the industry distribution of the adjusted sample.

Prism Economics and Analysis 98
Table No. 47 Industry Distribution of Adjusted Sample of Abandoned Lost-Time Claims
Industry Group Rate
Groups No. Percent
of Identified
Files
Percent of Total
Files
Logging, Wood/Pulp and Paper Mills, Corrugated Boxes 30-41 5 0.4% 0.2%
Mining and Related 110-134 9 0.7% 0.3%
Farming, Fishing and Related 159-184 19 1.4% 0.6%
Landscaping 190 2 0.1% 0.1%
Food Processing and Manufacturing 207-542 389 28.3% 12.9%
Transportation and Warehousing 551-590 88 6.4% 2.9%
Retail, Wholesale 604 - 685 302 21.9% 10.0%
Waste Materials Recycling 689 4 0.3% 0.1%
Construction 704 - 764 60 4.4% 2.0%
School Boards, Education Facilities 810-817 31 2.3% 1.0%
Power and Utilities 830-838 8 0.6% 0.3%
Local Government 845 14 1.0% 0.5%
Health Care, Community Services and Related 851-861 182 13.2% 6.0%
Miscellaneous Services (ex Restaurant, Catering and Hotel) 875-983 165 12.0% 5.5%
Restaurant, Catering and Hotel 919-921 98 7.1% 3.2%
Sub-Total 1,376 100.0% 45.6%
No Rate Group Indicated 804 26.7%
No Form 7 805 26.7%
Unclear Rate Group or No Longer in Use Rate Group 31 1.0%
Total 3,016 100.0%
Reasons for Rejecting Claims
Table No. 48 summarizes the administrative reasons for rejecting the claim. As can be seen, almost three-quarters of the claims were rejected because the worker claimant failed to provide the required information to support the claim (rejection codes 62 and 63).

Prism Economics and Analysis 99
Table No. 48 Administrative Reasons for Rejecting Claims Abandoned Lost-Time Claims (Gross Sample)
(N=3,340)
Administrative Reason for Rejecting Claim (Code and Description)
No. % of Total
60: Employer has no knowledge of the accident and the worker fails to respond to the WSIB’s request for information.
26 0.8%
61: Employer has no record of individual working for their firm and worker fails to respond to the WSIB’s request for information
14 0.4%
62: Insufficient evidence that the worker has received health care and worker fails to respond to the WSIB’s request for information
728 21.8%
63: Worker’s report of injury/disease or reply outstanding 1457 43.6%
64: Out of province/Third party accident but worker fails to return election form
273 8.2%
65: Worker withdraws claim. 384 11.5%
85: Claim not filed within six months 13 0.4%
86: Denied on WBS, check Survivors Update (SVUP). 1 0.0%
87: Modified work beyond seven days; no health care. 0 0.0%
Other 444 13.3%
Not Coded 26 0.8%
Total 3,340 100.0%
Forms Present in Abandoned Claim Files
Table No. 49 summarizes the files that were present in the abandoned claim records.

Prism Economics and Analysis 100
Table No. 49 Forms Present in Adjusted Sample of Abandoned Lost-Time Claim Files
(N=3,016)
Forms Present in Files
Files with Form 6, 7 and 8
Form 6 in File (Worker Report) 532 17.6%
Form 7 in File (Employer Report) 2,211 73.3%
Form 8 in File (Medical Practitioners Report) 1,370 45.4%
One Form Only in File
Form 6 Only (Worker Report) 29 1.0%
Form 7 Only (Employer Report) 1,277 42.3%
Form 8 Only (Medical Practitioners Report) 668 22.1%
File Combinations
Form 6 and Form 7 460 15.3%
Form 6 and Form 8 298 9.9%
Form 7 and Form 8 659 21.9%
Other Forms in Files
26 - Practitioner's Progress Report 11 0.4%
41 - Worker's Progress Report 7 0.2%
42 - Employer's Progress Report 20 0.7%
Functional Abilities Form 291 9.6%
REO6 - Worker's Continuity Report 2 0.1%
Direction of Authorization 139 4.6%
More than 80% of the files were lacking a Form 6 (worker report). This is consistent with the rejection reasons which indicate that roughly three-quarters of the claims lacked supporting information from the worker claimant. More than a quarter (26.7%) of the files lacked a Form 7 (employer report).
Table No. 50 shows the concurrence of forms.

Prism Economics and Analysis 101
Table No. 50 Concurrence of Forms
in Adjusted Sample of Abandoned Lost-Time Claim Files (N=3,016)
Forms Present in File No. % of
Files with Form 8
% of Total Files
Form 8 / No Form 7 (Employer Report) 711 51.9% 23.6%
Form 8 with Form 7 (Employer Report) 659 48.1% 21.9%
Total 1,370 100.0% 45.4%
Form 6 / No Form 7 72 2.4%
Form 8 / No Form 6 (Worker Report) 1,142 83.4% 37.9%
Form 8 with Form 6 (Worker Report) 228 16.6% 7.6%
Total 1,370 100.0% 45.4%
Only Form 8 Present 668 22.1%
It may be noteworthy that:
In approximately a quarter of the files (23.6%), there was a Form 8 indicating that the worker had seen a medical practitioner, but there was no Form 7 submitted by the employer.
In more than a third of the files (37.9%) there was a Form 8, but no corresponding Form 6 submitted by the worker.
In more than a fifth of the files (22.1%) there was a From 8, but neither a Form 6 nor a Form 7.
Table No. 51 shows the percentage of files that had a Form 7 (employer report) in relation to the year of the incident. The data suggest that this proportion increased until 2007-2008 when in peaked at 90%. After 2008, the proportion of files with a Form 7 declined significantly.

Prism Economics and Analysis 102
Table No. 51 Percent of Files with a Form 7
Based on Year of Incident (N=2,997)*
Year of Incident
Percent of Files with a Form 7
Pre 1991-1991 59.6%
1992-93 61.3%
1994-95 79.8%
1996-97 77.4%
1998-99 77.8%
2000 78.8%
2001 73.3%
2002 83.6%
2003 82.6%
2004 83.2%
2005 87.0%
2006 86.5%
2007 90.1%
2008 89.0%
2009 67.8%
2010 62.3%
2011 64.8%
*excludes 19 files for which the year of the incident could not be identified
Phone Communication with Workers
Table No. 52 shows the evidence recorded in the file of attempts by the claims adjudicator to communicate with the worker by phone. It should be noted that there may have been attempts to communicate with the worker that were not recorded in the file. Also, a message may have been left to which a worker responded in some other fashion.
Table No. 52
Actual Phone Communication and Attempted Phone Communication with Workers
(N=3,016)
Status of Attempt to Communicate with Workers
No. % of Total Files
Successful 644 21.4%
Unsuccessful 679 22.5%
No information 1,693 56.1%
3,016 100.0%

Prism Economics and Analysis 103
Table No. 53 shows communication and attempted communication, based on Forms that were in the file. This is relevant since these forms provide contact information.
Table No. 53
Actual Phone Communication and Attempted Phone Communication with Workers
based on Forms Present in Files
No. of Potential
Files
Successful Communication
Unsuccessful Communication
No Information
Form 6 available 532 189 116 227
Only Form 7 available 1,277 279 322 676
Only Form 8 available 688 64 73 531
Table No. 54 indicates the number of unsuccessful attempts to communicate with a worker by phone that were noted in the file. Other unsuccessful attempts may have been made which were not recorded in the file. Overall, the files indicate an attempt to communicate by phone in 22.5% of the cases.
Table No. 54 No. of Attempts to Communicate with Workers by Phone
Where Communication was Unsuccessful (N=679)
No. of Attempts No. % of
Unsuccessful Communication
Files
One 246 36.2%
Two 82 12.1%
Three 144 21.2%
Four or More 11 1.6%
Sub-Total 483 71.1%
File indicated communication attempt, but did not provide information on number of attempts
196 36.2%
Total 679 100.0%
Phone Communication with Employers
Table No.55 shows the evidence recorded in the file of attempts by the claims adjudicator to communicate with the employer by phone. It should be noted that there may have been attempts to communicate with the employer that were not recorded in the file. Also, a message may have been left to which the employer responded in some other fashion.

Prism Economics and Analysis 104
Table No. 55 Actual Phone Communication and Attempted Phone Communication
with Employers (N=3016)
Status of Attempt to Communicate with Employers
No. % of Total Files
Successful 753 25.0%
Unsuccessful 242 8.0%
No information 2,021 67.0%
3,016 100.0%
Lost‐Time indicated in Claims Files
Table No.56 shows the number of calendar days between the date of an injury (or onset of disease symptoms) and the date of return to work. In many cases, more than 1 day’s difference will imply lost working time. However, it cannot be assumed that this is always the case. A Friday injury and a Monday return to work would not entail lost time, but there would be two calendar days between the date of the injury and the date of the return to work. Also, statutory holidays may have intervened. Consequently the calendar days estimate may over-state actual lost time.
Table No. 56 Calendar Days between Date of Injury
and Return to Work (N=3016)
No. of Days between Date of Injury
and Date of Return to Work No. of Files
% of Files with
Complete Information
% of Total Files
No Lost time (same day or next day return) 366 24.2% 12.1%
1 Calendar Day Lost 257 17.0% 8.5%
1-5 Calendar Days Lost 799 52.7% 26.5%
>5 Calendar Days Lost 350 23.1% 11.6%
>14 Calendar Days Lost 157 10.4% 5.2%
1 or more Calendar Days Lost 1,049 69.2% 34.8% All Files with information on both the Date of Injury and the Return to Work 1,515 50.2%
No Information or Incomplete Information 1,501
49.8%
Total 3,016
100.0%

Prism Economics and Analysis 105
Claims Administrators
Authorization for representation by a third party regulated by the Law Society of Upper Canada (LSUC) was indicated in 112 files. The preponderance of these authorizations referred to incidents that occurred in 2009-2011. In these three years, there were 97 authorizations that pertained to 1,352 files (7.2%). Table No. 57 shows the proportion of files by industry group in which an LSUC entity was authorized to represent the employer and the employer’s rate group was also identified. This proportion significantly understates the likely use of LSUC authorized entities since the sample includes all files (going back to 1991), while the use of using LSUC authorized entities is comparatively recent.
Table No. 57 No. of Files in Each Industry Group
Indicating an LSUC Entity was Designated to Represent the Employer (N=1,376)
Industry Group Rate
Groups No. of Files
LSUC Entities No. %
Logging, Wood/Pulp and Paper Mills, Corrugated Boxes 30-41 5 0 0.0%
Mining and Related 110-134 9 0 0.0%
Farming, Fishing and Related 159-184 19 0 0.0%
Landscaping 190 2 0 0.0%
Food Processing and Manufacturing 207-542 389 7 1.8%
Transportation and Warehousing 551-590 88 6 6.8%
Retail, Wholesale 604 - 685 302 51 16.9%
Waste Materials Recycling 689 4 0 0.0%
Construction 704 - 764 60 1 1.7%
School Boards, Education Facilities 810-817 31 0 0.0%
Power and Utilities 830-838 8 0 0.0%
Local Government 845 14 1 7.1%
Health Care, Community Services and Related 851-861 182 12 6.6%
Miscellaneous Services (ex Restaurant, Catering and Hotel) 875-983 165 10 6.1%
Restaurant, Catering and Hotel 919-921 98 7 7.1%
Total 1,376 95 6.9%
Earnings Continuation
Table No. 58 shows that there was significant evidence of earnings continuation in almost 16.0% of the files.

Prism Economics and Analysis 106
Table No. 58 Evidence of Wage Continuation from Files
(N=3016)
Status
No. % of Total Files
Full continuation of wages 362 12.0%
Partial continuation of wage 19 0.6%
Sick Leave Plan 82 2.7%
Short-Term Indemnity Plan 9 0.3%
Earnings maintained by Vacation 22 0.7%
Earnings maintained by Other Entitlements 5 0.2%
Earnings maintained by LTD 3 0.1%
Files with One or More Type of Income Continuation 474 15.7%
Earnings maintained by EI 9 0.3%
Earnings maintained by Other Means (unspecified) 21 0.7%
For those files for which the number of lost calendar days can be computed, approximately 30% of the files indicate that the workers’ earnings were continued by either partial or full wage continuation, a sick leave plan or a short-term indemnity plan.
Risk Flags
Table No. 59 summarizes the incidence of ‘risk flags’. Overall approximately 48% of the files exhibited one or more risk flags, although only 35% exhibited one of the stronger risk flags.

Prism Economics and Analysis 107
Table No. 59 Risk Flags suggestive of Employer Inducement
(N=3016)
Status
No. % of Total Files
Suggested as a
Stronger Flag
Risk Flags related Absence of Form 7
Absence of Form 7 805 26.7%
Incomplete Form 7 77 2.6%
Absence of Form 7/ Form 8 Present 711 23.6% ◄
Absence of Form 7/ Form 6 Present 72 2.4% ◄
Risk Flags related to Duration of Lost Time
1-5 Calendar Days Lost 799 26.5%
>5 Calendar Days Lost 350 11.6%
>14 Calendar Days Lost 157 5.2% ◄
1 or More Calendar Days Lost 1,049 34.8%
Risk Flags related to Source of Health Care
Emergency Room 402 13.3%
Admitted to Hospital 35 1.2% ◄
Ambulance 91 3.0% ◄
Risk Flags related to Other Indicators
Worker Formally Withdraws Claim 364 12.1%
Employer continuation of earnings 474 15.7% ◄
Severity of Injury (Researcher Assessment) 148 4.9% ◄
Adjudicator Notes 107 3.5% ◄
Conclusions
There are a number of findings from this analysis of abandoned lost-time claims:
1. Approximately 10% of the claims were properly abandoned, in that the worker was pursuing benefits under another insurance or benefit regime. The actual proportion of properly abandoned claims may be higher - indeed, possibly much higher. However, based on evidence of a third party insurer or benefit regime, a minimum estimate of properly abandoned claims is 10%.
2. In almost three-quarters of the files, there was a Form 7. Employers were therefore compliant with their reporting obligation in at least three-quarters of the sample ALT files. Conversely, there is a risk of non-compliance in approximately one-quarter of the files. This may be an over-estimate, since some of the claims may have been abandoned because the worker was not covered by the WSIB or the injury or illness

Prism Economics and Analysis 108
was not work-related. In neither of these circumstances would the employer have been obliged to file a Form 7.
3. A Form 6 was found in only 17.6% of the files. Any number of hypotheses can be suggested to explain this low proportion. Claim suppression is one these hypotheses. So also is under-claiming for reasons unrelated to claim suppression.
4. The lost time indicated in the abandoned claims was sometimes significant. In 5.2% of the files, there was evidence of more than 14 calendar days between the date of the injury or illness and return to work.
5. The proportion of files with a Form 7 declined significantly after 2008. This could be a sampling issue or it could reflect a potentially troubling pattern of an increase in non-reporting by employers.
6. In 15.7% of the files there was evidence of full or partial wage continuation that may have contravened WSIB policy and may have substituted for WSIB benefits.
It is to be stressed that robust conclusions about the risk of claim suppression cannot be drawn from an analysis of the files alone. The flags discussed in this chapter are only suggestive of risk. However, the evidence from the files does suggest a risk that some abandoned lost-time claims may have involved claim suppression, rather than under-claiming that was unrelated to claim suppression.
■

Prism Economics and Analysis 109
Conclusions 7
Principal Conclusions:
It is important to distinguish employer claim suppression from the broader occurrence of employer under-reporting and worker under-claiming. Claim suppression refers to actions taken by an employer to induce a worker not to report an injury or illness or to under-report its severity and the duration of any lost working time or earnings. Claim suppression is always associated with actual (or intended) employer under-reporting and with worker under-claiming. However, not all under-reporting by employers or under-claiming by workers involves claim suppression.
Specific Findings:
1. The most important conclusion to be drawn from the research undertaken in this project is that claim suppression appears to be a real problem. Claim suppression does not appear to be restricted to a small number of anecdotal cases. This conclusion is based on: (1) findings from a review of empirical research literature, (2) an analysis of 100 randomly selected WSIB enforcement files, (3) an analysis of the incidence of risk flags in 2,707 randomly selected no lost time claims (pre-screened for more severe injuries), and (4) an analysis of the incidence of risk flags in 3,340 abandoned lost-time claims.
2. We cannot infer the motivation for claim suppression from the documentation in the enforcement files or the claims files. However, it may be significant that of the 100 enforcement files that were examined, 49 involved non-registration with the WSIB. General non-compliance was clearly as important, or more important, than any single motivation, such as gaming the experience rating system, fear of inspection or concern for reputation. No other jurisdiction, as yet, has explored whether there is a link between experience rating and claim suppression.
3. Based on the analysis of no-lost-time (NLT) files, there are credible flags that suggest a risk of misrepresentation in the 5-10% range. The risk flags may suggest control procedures that the WSIB could implement as part of its overall strategy to ensure that workers receive the benefits which are promised by the Workplace Safety and Insurance Act.
4. The most common form of employer inducement appears to be wage continuation. For short-term absences from work (one week or less), this may raise a policy issue. Many of the potential misrepresentations identified in the analysis of NLT files involved only a few days of lost time. Some jurisdictions in Canada allow or expect an employer to maintain wages for the initial few days of work absence. In the U.S., compensation benefits often begin after 7 days absence from

Prism Economics and Analysis 110
work. This could suggest that the WSIB may wish to review whether benefits should commence later than the first day after the incident and whether employers should be liable for wage continuation prior to the commencement of benefits.
5. There were troubling findings in the abandoned lost-time (ALT) claims that suggest a risk of claim suppression. Roughly one abandoned claim in twenty (5.2%) involved more than 14 calendar days of lost time. These files excluded claims that were withdrawn or rejected because the claimant was pursuing benefits under a third party insurance policy or another benefits regime. In itself, this finding of significant non-compensated lost time does not prove claim suppression. However, the finding may suggest that there are suppressed claims ‘hiding’ among the abandoned lost-time claims. Again, the risk flags may suggest control procedures that would reduce the likelihood of a worker losing benefits to which he or she may be entitled.
6. More than 90% of the workers in the flagged NLT and ALT files were in non-supervisory, ‘blue collar’ occupations. Construction and food services are disproportionately represented in the enforcement files. This could suggest that workers in non-supervisory, ‘blue collar’ occupations and in construction and food services are at greater risk of losing benefits to which they are entitled as a result of claim suppression.
7. In approximately half of the enforcement files examined, there was evidence of employer behaviour that was intended to induce workers not to report a work-related injury or illness to the WSIB. In about a fifth of the files with evidence of inducement, overt threats or sanctions were documented. However, in more than three-quarters of the files, the inducement did not involve documented threats or sanctions. In those files, inducement took the form of appeals to loyalty, shared involvement in income tax evasion (remuneration in cash), continuation of wages in lieu of WSIB benefits and misinformation as to eligibility for WSIB benefits. There were also instances of peer pressure not to report an injury or illness, sometimes motivated by the potential loss of a group-based incentive to remain accident free
8. Ontario is unique in enforcing employers’ statutory obligations through prosecutions. Other jurisdictions rely entirely, or almost entirely, on administrative penalties, which also typically involve lower financial penalties. The statutes in some jurisdictions explicitly prohibit employers from discouraging workers’ claims, although there is no evidence of any prosecution activity under these provisions. Nor does the current Ontario statute appear to be deficient in providing a legal basis for prosecuting employers who suppress claims. Potentially of interest to the WSIB is the administrative system in Newfoundland and Labrador. The compensation system in Newfoundland and Labrador appears to have designed a remuneration scale for medical practitioner reports such that these reports are typically received before employer or work reports. The fact that medical reports are almost certain to be submitted promptly may be a deterrent to claim suppression.
■

Prism Economics and Analysis 111
Research Team
Research Director: John O’Grady
Project Manager: Fernando Traficante
Assistant Project Manager: Maja Rusinowska
Advisors: Douglas Hyatt
Cameron Mustard
Researchers: Farheen Alim
Karen Cantoni
Pieter Goubert
Joshua Marcum
Arash Masoumi
Shaima Sattar
Martin Simic