workflow simulation for operational decision support … · workflow simulation for operational...
TRANSCRIPT

Workflow Simulation for Operational DecisionSupport Using Design, Historic and State
Information
A. Rozinat1, M. T. Wynn2, W. M. P. van der Aalst1,2, A. H. M. ter Hofstede2,and C. J. Fidge2
1 Information Systems Group, Eindhoven University of Technology,P.O. Box 513, NL-5600 MB, Eindhoven, The Netherlands.
{a.rozinat,w.m.p.v.d.aalst}@tue.nl2 Business Process Management Group, Queensland University of Technology,
GPO Box 2434, Brisbane QLD 4001, Australia.{m.wynn,a.terhofstede,c.fidge}@qut.edu.au
Abstract. Simulation is widely used as a tool for analyzing businessprocesses but is mostly focused on examining rather abstract steady-statesituations. Such analyses are helpful for the initial design of a businessprocess but are less suitable for operational decision making and contin-uous improvement. Here we describe a simulation system for operationaldecision support in the context of workflow management. To do this weexploit not only the workflow’s design, but also logged data describingthe system’s observed historic behavior, and information extracted aboutthe current state of the workflow. Making use of actual data capturingthe current state and historic information allows our simulations to ac-curately predict potential near-future behaviors for different scenarios.The approach is supported by a practical toolset which combines and ex-tends the workflow management system YAWL and the process miningframework ProM.
Keywords: Workflow Management, Process Mining, Short-term Simulation.
1 Introduction
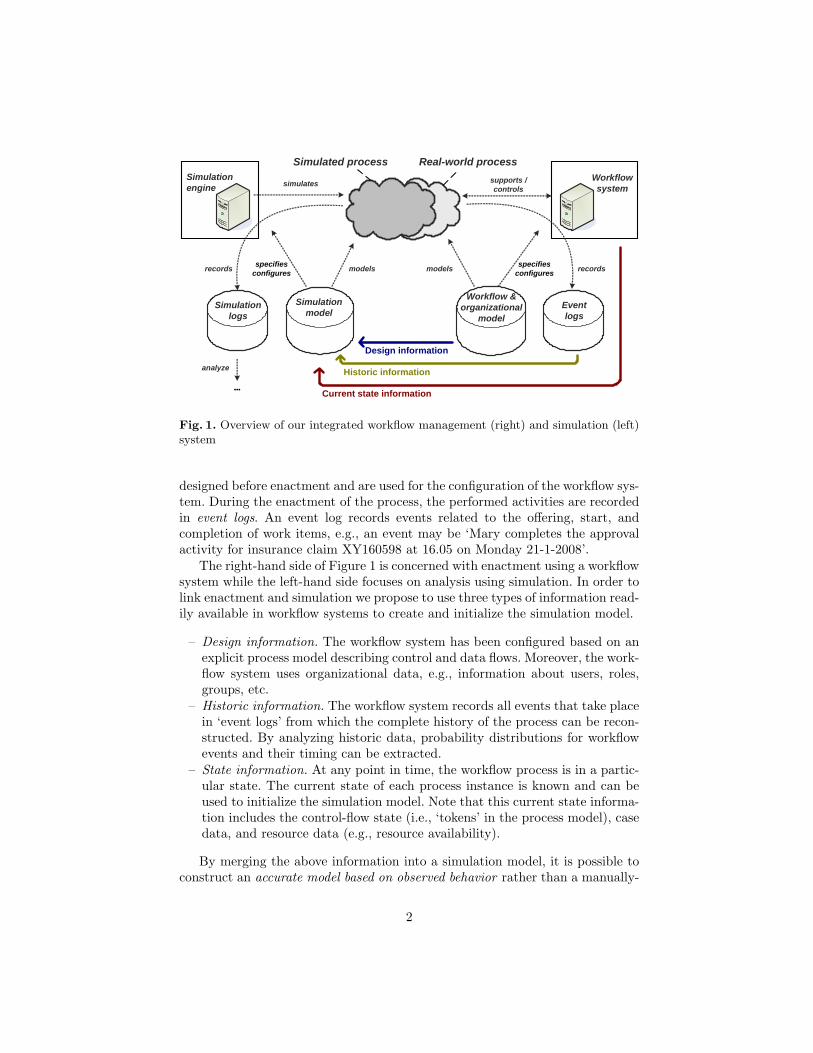
Business process simulation is a powerful tool for process analysis and improve-ment. One of the main challenges is to create simulation models that accuratelyreflect the real-world process of interest. Moreover, we do not want to use simu-lation just for answering strategic questions but also for tactical and even oper-ational decision making. To achieve this, different sources of simulation-relevantinformation need to be leveraged. In this paper, we present a new way of creatinga simulation model for a business process supported by a workflow managementsystem, in which we integrate design, historic, and state information.
Figure 1 illustrates our approach. We consider the setting of a workflowsystem that supports some real-world process based on a workflow and orga-nizational model. Note that the workflow and organizational models have been
Workflow & organizational
modelEventlogs
Workflowsystem
records
supports /controls
Current state information
models
Simulationmodel
specifies configures
Simulation logs
Simulationengine
records
simulates
models
Historic information
Design information
analyze
Simulated process Real-world process
specifies configures
Fig. 1. Overview of our integrated workflow management (right) and simulation (left)system
designed before enactment and are used for the configuration of the workflow sys-tem. During the enactment of the process, the performed activities are recordedin event logs. An event log records events related to the offering, start, andcompletion of work items, e.g., an event may be ‘Mary completes the approvalactivity for insurance claim XY160598 at 16.05 on Monday 21-1-2008’.
The right-hand side of Figure 1 is concerned with enactment using a workflowsystem while the left-hand side focuses on analysis using simulation. In order tolink enactment and simulation we propose to use three types of information read-ily available in workflow systems to create and initialize the simulation model.
– Design information. The workflow system has been configured based on anexplicit process model describing control and data flows. Moreover, the work-flow system uses organizational data, e.g., information about users, roles,groups, etc.
– Historic information. The workflow system records all events that take placein ‘event logs’ from which the complete history of the process can be recon-structed. By analyzing historic data, probability distributions for workflowevents and their timing can be extracted.
– State information. At any point in time, the workflow process is in a partic-ular state. The current state of each process instance is known and can beused to initialize the simulation model. Note that this current state informa-tion includes the control-flow state (i.e., ‘tokens’ in the process model), casedata, and resource data (e.g., resource availability).
By merging the above information into a simulation model, it is possible toconstruct an accurate model based on observed behavior rather than a manually-
2

constructed model which approximates the workflow’s anticipated behavior. More-over, the state information supports a ‘fast forward’ capability, in which simula-tion can be used to explore different scenarios with respect to their effect in thenear future. In this way, simulation can be used for operational decision making.
Based on this approach, the system design in Figure 1 allows different simu-lation experiments to be conducted. For the ‘as-is’ situation, the simulated andreal-world processes should overlap as much as possible, i.e., the two process‘clouds’ in Figure 1 coincide. For the ‘to-be’ situation, the observed differencesbetween the simulated and real-world processes can be explored and quantified.In our implementation we ensure that the simulation logs have the same formatas the event logs recorded by the workflow system. In this way we can use thesame tools to analyze both simulated and real-world processes.
To do this, we need state-of-the art process mining techniques to analyze thesimulation and event logs and to generate the simulation model. To demonstratethe applicability of our approach, we have implemented the system shown in Fig-ure 1 using ProM [1] and YAWL [2]. YAWL is used as the workflow managementsystem and has been extended to provide high-quality design, historic, and stateinformation. The process mining framework ProM has been extended to mergethe three types of information into a single simulation model. Moreover, ProMis also used to analyze and compare the logs in various ways.
The paper is organized as follows. Related work is reviewed in Section 2.Section 3 describes the approach proposed. Section 4 presents a running example,which is then used in Section 5 to explain the implementation realized usingYAWL and ProM. Section 6 concludes the paper by discussing the three maininnovations presented in this paper.
2 Related Work
Our work combines aspects of workflow management, simulation, and processmining. Some of the most relevant contributions from these broad areas arereviewed below.
Prominent literature on workflow management [6, 13, 19] focuses on enact-ment, and research on workflow analysis usually focuses on verification, ratherthan simulation. Conversely, publications on simulation typically concentrate onstatistical aspects [11, 16, 12] or on a specific simulation language [10]. Severalauthors have used simulation or queuing techniques to address business processredesign questions [4, 5, 14], and most mature workflow management systemsprovide a simulation component [7, 8]. However, none of these systems uses his-toric and state information to learn from the past and to enable operationaldecision making. We are not aware of any toolset that is able to extract thecurrent state from an operational workflow management system and use this asthe starting point for transient analysis.
In earlier work we first introduced the notion of using historic and state in-formation to construct and calibrate simulation models [15, 20], and used Protos,ExSpect, and COSA to realize the concept of short-term simulation [15]. How-
3

ever, this research did not produce a practical publicly available implementationand did not use process mining techniques.
Process mining aims at the analysis of event logs [3]. It is typically used toconstruct a static model that is presented to the user to reflect on the process.Previously we showed that process mining can be used to generate simulationmodels [17], but design and state information were not used in that work.
3 Approach
A crucial element of the approach in Figure 1 is that the design, historic andstate information provided by the workflow system are used as the basis forsimulation. Table 1 describes this information in more detail.
Table 1. Process characteristics and the data sources from which they are obtained
Design information Historic information State information(obtained from the workflowand organization modelused to configure theworkflow system)
(extracted from event logscontaining information onthe actual execution ofcases)
(based on informationabout cases currently beingenacted using the workflowsystem)
• control and data flow(activities and causalities)
• data value rangedistributions
• progress state of cases(state markers)
• organizational model(roles, resources, etc.)
• execution timedistributions
• data values for runningcases
• initial data values • case arrival rate • busy resources• roles per task • availability patterns of
resources• run times for cases
The design information is static, i.e., this is the specification of the processand supporting organization that is provided at design time. This informationis used to create the structure of the simulation model. The historic and stateinformation are dynamic, i.e., each event adds to the history of the processand changes the current state. Historic information is aggregated and is usedto set parameters in the simulation model. For instance, the arrival rate andprocessing times are derived by aggregating historic data, e.g., the (weighted)average over the last 100 cases is used to fit a probability distribution. Typically,these simulation parameters are not very sensitive to individual changes. Forexample, the average processing time typically changes only gradually over along period. The current state, however, is highly sensitive to change. Individualevents directly influence the current state and must be directly incorporated intothe initial state of the simulation. Therefore, design information can be treatedas static, while historic information evolves gradually, and state information ishighly dynamic.
To realize the approach illustrated in Figure 1 we need to merge design,historic and state information into a single simulation model. The design infor-
4

mation is used to construct the structure of the simulation model. The historicinformation is used to set parameters of the model (e.g., fit distributions). Thestate information is used to initialize the simulation model. Following this, tradi-tional simulation techniques can be used. For example, using a random generatorand replication, an arbitrary number of independent simulation experiments canbe conducted. Then statistical methods can be employed to estimate differentperformance indicators and compute confidence intervals for these estimates.
By modifying the simulation model, various ‘what-if’ scenarios can be investi-gated. For example, one can add or remove resources, skip activities, etc. and seewhat the effect is. Because the simulation experiments for these scenarios startfrom the current state of the actual system, they provide a kind of ‘fast-forwardbutton’ showing what will happen in the near future, to support operational de-cision making. For instance, based on the predicted system behavior, a managermay decide to hire more personnel or stop accepting new cases.
Importantly, the simulations yield simulation logs in the same format as theevent logs. This allows process mining techniques to be used to view the real-world processes and the simulated processes in a unified way. Moreover, bothcan be compared to highlight deviations, etc.
4 Running Example
Consider the credit card application process expressed as a YAWL workflowmodel in Figure 2. The process starts when an applicant submits an application.Upon receiving an application, a credit clerk checks whether it is complete. Ifnot, the clerk requests additional information and waits until this information isreceived before proceeding. For a complete application, the clerk performs furtherchecks to validate the applicant’s income and credit history. Different checks areperformed depending on whether the requested loan is large (e.g. greater than$500) or small. The validated application is then passed on to a manager todecide whether to accept or reject the application. In the case of acceptance, theapplicant is notified of the decision and a credit card is produced and delivered tothe applicant. For a rejected application, the applicant is notified of the decisionand the process ends.
Fig. 2. A credit application process modeled in YAWL
5
Here we assume that this example workflow has been running for a while. InYAWL but also any other workflow system the following runtime statistics canbe gathered about the long-term behavior of this process.
– Case arrival rate: 100 applications per week– Throughput time: 4 working days on average
With respect to resources, there are eight members of staff available, whichinclude three capable of acting as ‘managers’ and seven capable of acting as‘clerks’. (One person can have more than one role.)
Further assume that due to a successful Christmas promotion advertised inNovember, the number of credit card applications per week has temporarilydoubled to 200. The promotion period is now over and we expect the rate todecrease to 100 applications per week again. However, as a result of the increasedinterest, the system now has a backlog of 150 applications in various stages ofprocessing, some of which have been in the system for more than a week. Sinceit is essential that most applications are processed before the holiday season,which begins in a fortnight from now (the ‘time horizon’ of interest), manage-ment would like to perform simulation experiments from the current state (‘fastforward’) to determine whether or not the backlog can be cleared in time.
5 Realization through YAWL and ProM
We now use the example introduced in Section 4 to describe our proof-of-conceptimplementation supporting the approach depicted in Figure 1. The realizationis based on the YAWL workflow environment [2] and the process mining frame-work ProM [1]. We focus on the new capabilities that have been added to thesesystems, and briefly explain the main steps that need to be performed3.
5.1 Extracting Simulation-Relevant Information
The information contained in the workflow specification is supplemented withhistorical data obtained from the event logs and data from the organizationalmodel database. This was achieved by implementing two new functions in theworkflow engine to export historical data from the logs for a particular specifi-cation and to export the organizational model (i.e., information about roles andresources).
In the YAWL workflow system, event logs are created whenever an activityis enabled, started, completed or cancelled, together with the time when thisevent occurred and with the actor who was involved. Logs are also kept for datavalues that have been entered and used throughout the system. Therefore, wecan retrieve historical data about process instances that have finished execution.
3 A detailed description of how to generate a simulation model including operationaldecision support is provided in our technical report [18]. The example files and theProM framework can be downloaded from http://www.processmining.org.
6
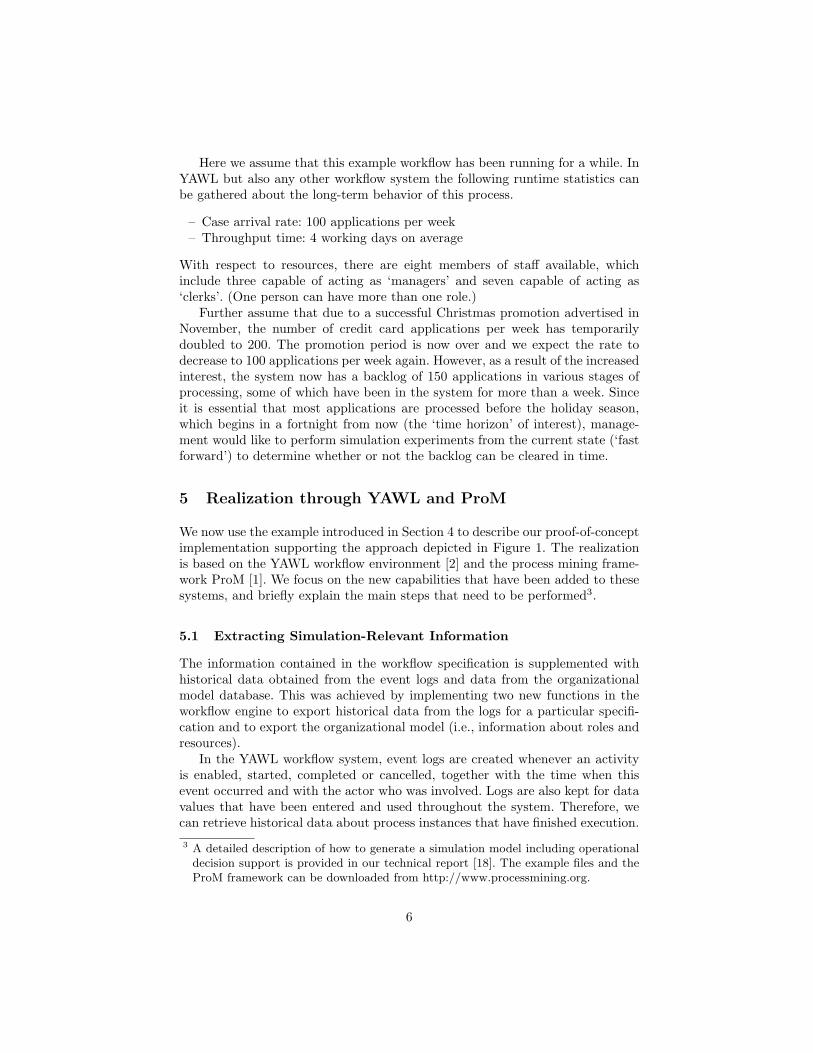
In this work we assume that the simulation experiments are being carried out on‘as-is’ process models for which historical data is available. A function has beencreated which extracts the historical data for a specification from the workflowengine and exports audit trail entries in the M ining XML (MXML) log format.Some sample data for the credit application example is shown in Figure 3(a).This historical data is used for mining information about case arrival rates anddistribution functions for the data values used in future simulation experiments.
<Process> <ProcessInstance id="5"> <AuditTrailEntry> <Data> <Attribute name="loanAmt">550</Attribute> </Data> <WorkflowModelElement>
receive_application_3 </WorkflowModelElement> <EventType>complete</EventType> <Timestamp>
2008-02-29T15:20:01.050+01:00 </Timestamp> <Originator>MoeW</Originator> </AuditTrailEntry>
... </ProcessInstance>
...</Process>
(a) A log entry for the completion of ac-tivity ‘receive application’ carried out byresource MoeW with loan amount $550
<OrgModel> <OrgEntity> <EntityID>1</EntityID> <EntityName>manager</EntityName> <EntityType>Role</EntityType> </OrgEntity> <OrgEntity> <EntityID>2</EntityID> <EntityName>clerk</EntityName> <EntityType>Role</EntityType> </OrgEntity> ... <Resource> <ResourceID>PA-529f00b8-0339</ResourceID> <ResourceName>JonesA</ResourceName> <HasEntity>2</HasEntity> </Resource>
...</OrgModel>
(b) An excerpt from an organizationalmodel with roles and resources, where re-source JonesA has role ‘clerk’
Fig. 3. Part of an organizational model and historical data extracted from the workflowengine
Similarly, the YAWL workflow system gives access to the organizationalmodel through a function which extracts all available role and resource datain an organization and exports this information in the XML format requiredby ProM. Some sample data with the roles of clerk and manager are shown inFigure 3(b). This information is used to identify available roles and resourcesthat are relevant for a given specification.
5.2 Generating the Simulation Model
From the (1) extracted workflow specification, (2) the newly extracted organi-zational model, and (3) the event log file, we can now generate a simulationmodel that reflects the process as it is currently enacted. The direct usage ofdesign information avoids mistakes that are likely to be introduced when modelsare constructed manually, and the automated extraction of data from event logsallows the calibration of the model based on actually observed parameters.
To generate the model, four basic steps need to be performed within ProM(a sample screenshot is shown for each phase in Figures 4 and 5):
7

1. The YAWL model, the organizational model, and the event log need to beimported from YAWL and analyzed.
2. Simulation-relevant information from the organizational model and log anal-ysis needs to be integrated into the YAWL model.
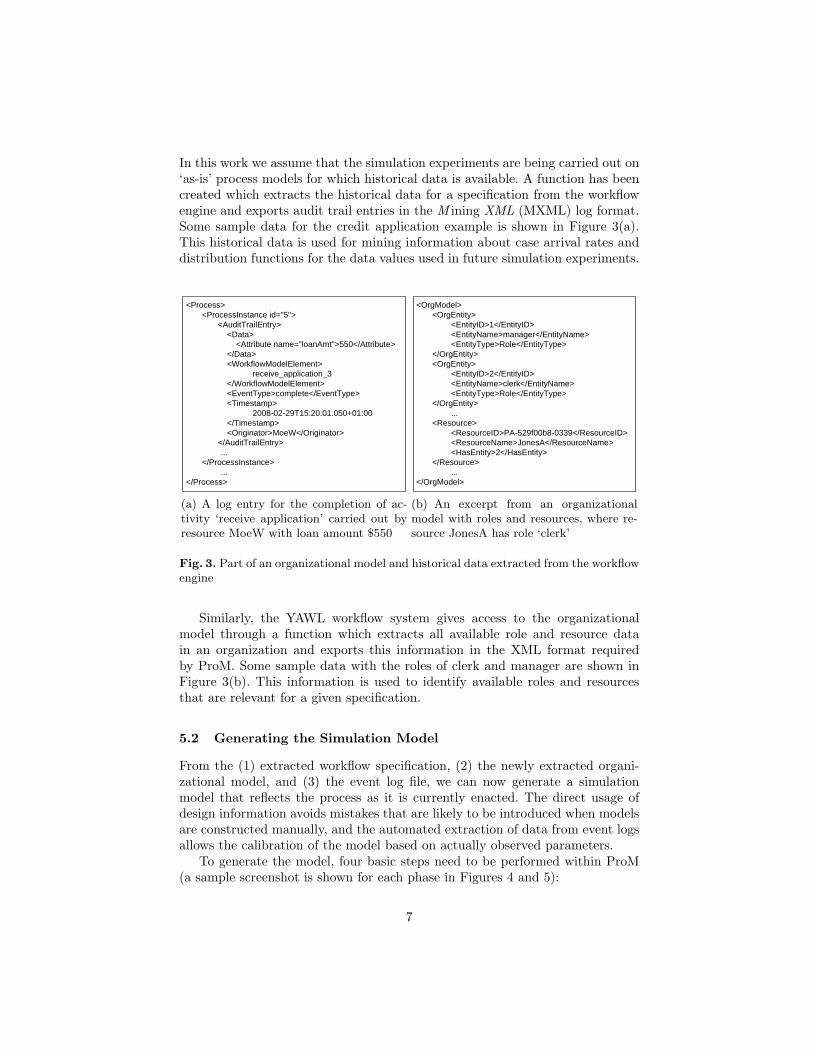
3. The integrated YAWL model must be converted into a Petri net model (be-cause our simulation tool is based on Coloured Petri Nets).
4. Finally, the integrated and converted model can be exported as a ColouredPetri Net (CPN) model for simulation.
(a) Data is imported from different sources. Here the organizationalmodel import is shown
(b) The organizational model and the information obtained fromthe log analysis are integrated into the imported YAWL model
Fig. 4. Phase 1 : The workflow and organizational model are imported and integratedwith the information obtained from event log analysis
We can then use the CPN Tools system [9] to simulate the generated model.However, to produce useful results we do not want to start from an empty initial
8
(a) The integrated YAWL model is translated into a Petri net whilepreserving all the simulation-relevant information
(b) After importing, merging, and converting the data, a simulationmodel including current state support can be generated
Fig. 5. Phase 2 : To enable the export to CPN Tools, the YAWL model is first convertedinto a Petri net. Then, a CPN model of the process is generated
state. Instead we load the current state of the actual YAWL system into theCPN Tools for simulation.
5.3 Loading the Current State
To carry out simulation experiments for operational decision making purposes(the ‘fast forward’ approach), it is essential to include the current state of theworkflow system. This allows us to make use of the data values for the currentcases as well as the status of the work items for current cases within the sim-ulation experiments. A new function has been created to extract current stateinformation of a running workflow from the YAWL system and to export thisinformation as a CPN Tools input file (see Figure 6).
9

fun getInitialCaseData() = [(41, {loanAmt = 1500,completeApp = false,decideApp = false}),
(40, {loanAmt = 0,completeApp = false,decideApp = false}),
(39, {loanAmt = 500,completeApp = false,decideApp = false})];
fun getNextCaseID() = 42;
fun getInitialTokensExePlace(pname:STRING) = case pname of
"TASK_check_for_completeness_4`E"=>[(41,"-154","JonesA")] | _ => empty;
fun getInitialTokens(pname:STRING) = case pname of
"Process`COND_c2_15"=>[(39,"-43200")] | "Overview`Start"=>[(40,"-155")] | _ => empty;
fun getBusyResources() = ["JonesA"];
fun getCurrentTimeStamp() = “1205203218”;
fun getTimeUnit() = “Sec”;
Fig. 6. CPN Tools input file with initial state information. Several cases are in differentstates in the system. For example, application No. 41 is currently being checked byJonesA for completeness, and has a run time of 154 secs, i.e., ca. 2.57 mins
The following information is obtained about the current state and is intro-duced as the initial state of a simulation run.
– All the running cases of a given workflow and their marking.– All the data values associated with each case.– Information about enabled work items.– Information about executing work items and the resources used.– The date and time at which the current state file is generated.
When the empty initial state file of the generated simulation model is replacedwith the file depicted in Figure 6, tokens are created in the CPN model thatreflect the current system status (see Figure 7). For example, among the threeCase data tokens is the data associated with application No. 41. The resourceJonesA is currently performing a check activity on this case and hence, it doesnot appear in the list of free resources.
We now follow the scenario described in Section 4 for simulation experiments,i.e., due to a promotion 150 cases are in the system. We load the state filecontaining these 150 cases into the model and perform simulation experimentsfor the coming two weeks. We also add more resources to the model and observehow this influences the backlog and the throughput times for processing creditcard applications within this time horizon.
5.4 Analyzing the Simulation Logs
We simulate the process from the generated CPN model for four different sce-narios:
1. An empty initial state. (‘empty’ in Figure 8)2. After loading the current state file with the 150 applications that are cur-
rently in the system and no modifications to the model, i.e., the ‘as-is’ situ-ation. (‘as is’ in Figure 8)
3. After loading the current state file but adding four extra resources (twohaving the role ‘manager’ and three having the role ‘clerk’), i.e., a possible‘to-be’ situation to help clear the backlog more quickly. (‘to be A’ in Figure 8)
10
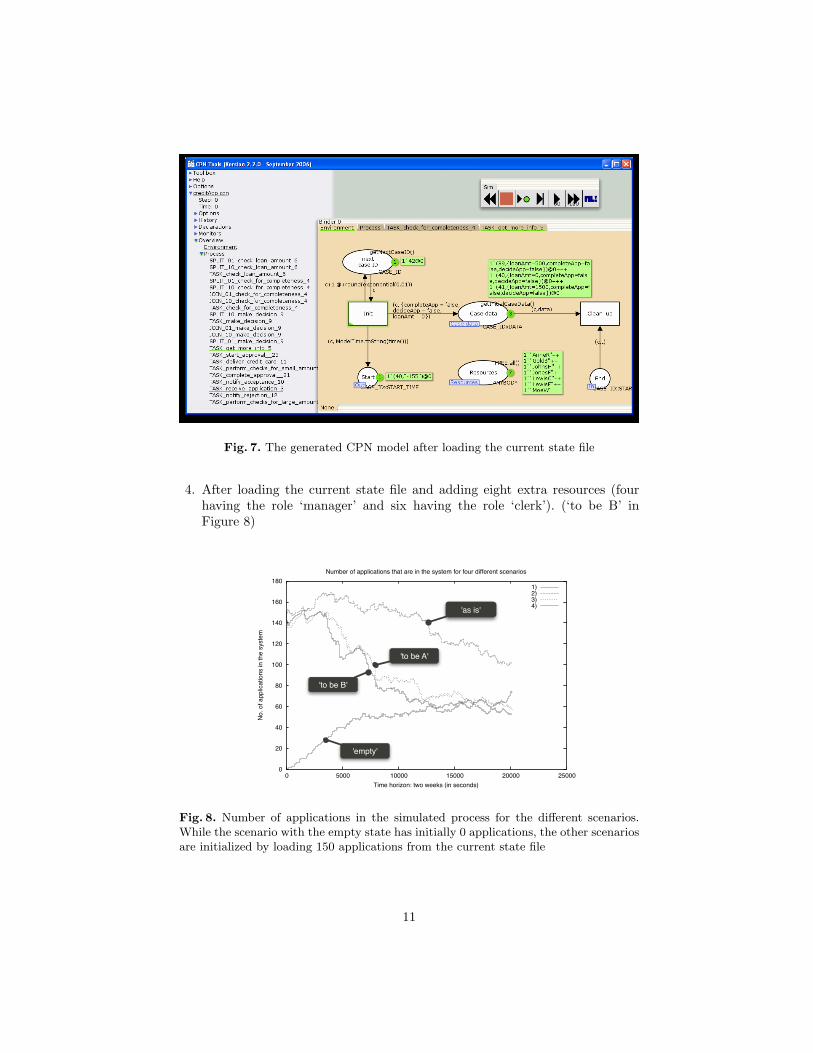
Fig. 7. The generated CPN model after loading the current state file
4. After loading the current state file and adding eight extra resources (fourhaving the role ‘manager’ and six having the role ‘clerk’). (‘to be B’ inFigure 8)
0
20
40
60
80
100
120
140
160
180
0 5000 10000 15000 20000 25000
No. of applic
ations in the s
yste
m
Time horizon: two weeks (in seconds)
Number of applications that are in the system for four different scenarios
1)2)3)4)
'as is'
'to be A'
'to be B'
'empty'
Fig. 8. Number of applications in the simulated process for the different scenarios.While the scenario with the empty state has initially 0 applications, the other scenariosare initialized by loading 150 applications from the current state file
11
5000
5500
6000
6500
7000
7500
8000
8500
9000
0 1 2 3 4 5
Co
nfid
en
ce
In
terv
al
Simulation Scenarios
95 % Confidence Intervals Average Throughput Time in Minfor the Four Simulation Scenarios (50 Replications each)
Confidence Intervals
'as is'
5.88 days
'to be A'
4.91 days
'empty'
3.86 days
'to be B'
4.72 days
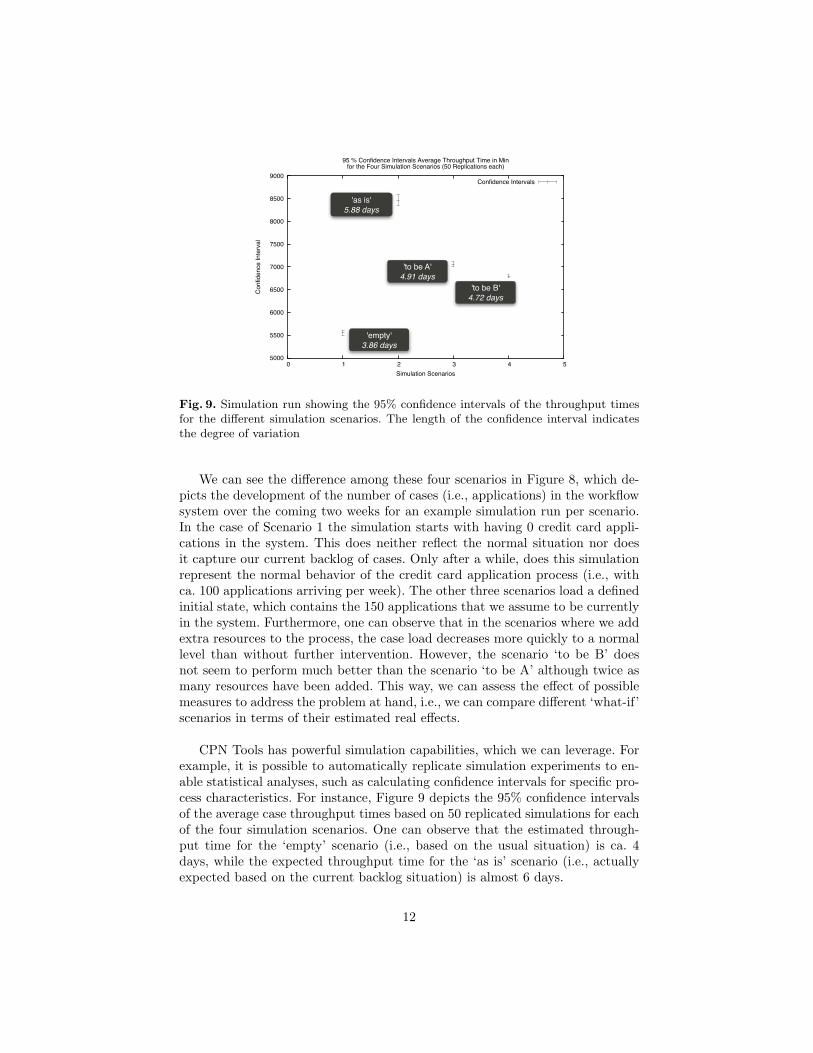
Fig. 9. Simulation run showing the 95% confidence intervals of the throughput timesfor the different simulation scenarios. The length of the confidence interval indicatesthe degree of variation
We can see the difference among these four scenarios in Figure 8, which de-picts the development of the number of cases (i.e., applications) in the workflowsystem over the coming two weeks for an example simulation run per scenario.In the case of Scenario 1 the simulation starts with having 0 credit card appli-cations in the system. This does neither reflect the normal situation nor doesit capture our current backlog of cases. Only after a while, does this simulationrepresent the normal behavior of the credit card application process (i.e., withca. 100 applications arriving per week). The other three scenarios load a definedinitial state, which contains the 150 applications that we assume to be currentlyin the system. Furthermore, one can observe that in the scenarios where we addextra resources to the process, the case load decreases more quickly to a normallevel than without further intervention. However, the scenario ‘to be B’ doesnot seem to perform much better than the scenario ‘to be A’ although twice asmany resources have been added. This way, we can assess the effect of possiblemeasures to address the problem at hand, i.e., we can compare different ‘what-if’scenarios in terms of their estimated real effects.
CPN Tools has powerful simulation capabilities, which we can leverage. Forexample, it is possible to automatically replicate simulation experiments to en-able statistical analyses, such as calculating confidence intervals for specific pro-cess characteristics. For instance, Figure 9 depicts the 95% confidence intervalsof the average case throughput times based on 50 replicated simulations for eachof the four simulation scenarios. One can observe that the estimated through-put time for the ‘empty’ scenario (i.e., based on the usual situation) is ca. 4days, while the expected throughput time for the ‘as is’ scenario (i.e., actuallyexpected based on the current backlog situation) is almost 6 days.
12
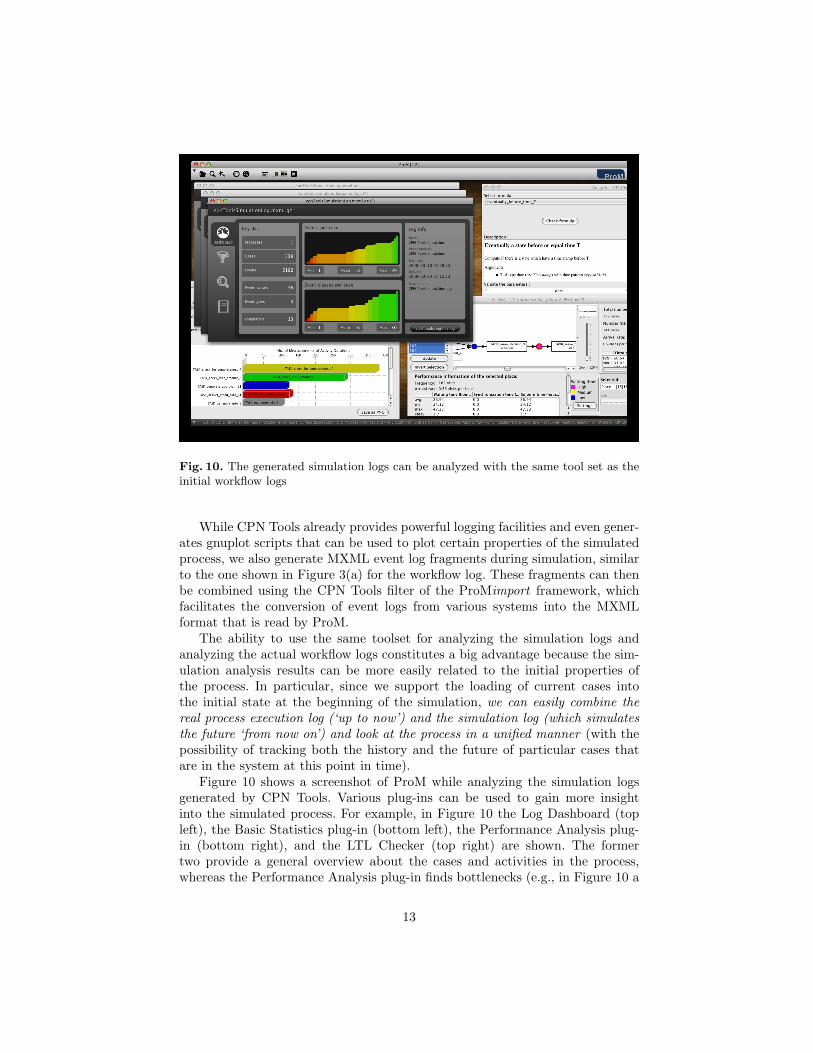
Fig. 10. The generated simulation logs can be analyzed with the same tool set as theinitial workflow logs
While CPN Tools already provides powerful logging facilities and even gener-ates gnuplot scripts that can be used to plot certain properties of the simulatedprocess, we also generate MXML event log fragments during simulation, similarto the one shown in Figure 3(a) for the workflow log. These fragments can thenbe combined using the CPN Tools filter of the ProMimport framework, whichfacilitates the conversion of event logs from various systems into the MXMLformat that is read by ProM.
The ability to use the same toolset for analyzing the simulation logs andanalyzing the actual workflow logs constitutes a big advantage because the sim-ulation analysis results can be more easily related to the initial properties ofthe process. In particular, since we support the loading of current cases intothe initial state at the beginning of the simulation, we can easily combine thereal process execution log (‘up to now’) and the simulation log (which simulatesthe future ‘from now on’) and look at the process in a unified manner (with thepossibility of tracking both the history and the future of particular cases thatare in the system at this point in time).
Figure 10 shows a screenshot of ProM while analyzing the simulation logsgenerated by CPN Tools. Various plug-ins can be used to gain more insightinto the simulated process. For example, in Figure 10 the Log Dashboard (topleft), the Basic Statistics plug-in (bottom left), the Performance Analysis plug-in (bottom right), and the LTL Checker (top right) are shown. The formertwo provide a general overview about the cases and activities in the process,whereas the Performance Analysis plug-in finds bottlenecks (e.g., in Figure 10 a
13

bottleneck for starting the activity ‘Make decision’ is highlighted), and the LTLChecker can be used to verify specific properties of interest (e.g., “How manycases could be processed until they are in the stage where a decision can be madein under 3 days?”).
6 Discussion
In this paper we presented an innovative way to link workflow systems, simu-lation, and process mining. By combining these ingredients it becomes possibleto analyze and improve business processes in a consistent way. The approachis feasible, as demonstrated by our implementation using YAWL and ProM. Toconclude, we would like to discuss the three main challenges that have beenaddressed in this research.
6.1 Faithful Simulation Models
Although the principle of simulation is easy to grasp, it takes time and expertiseto build a good simulation model. In practice, simulation models are often flawedbecause of incorrect input data and a naıve representation of reality. In mostsimulation models it is assumed that resources are completely dedicated to thesimulated processes and are eager to start working on newly arriving cases. Inreality this is not the case and as a result the simulation model fails to capturethe behavior of resources accurately. Moreover, in manually constructed modelssteps in the processes are often forgotten. Hence simulation models are usuallytoo optimistic and describe a behavior quite different from reality. To compensatefor this, artificial delays are added to the model to calibrate it and as a resultits predictive value and trustworthiness are limited. In the context of workflowsystems, this can be partly circumvented by using the workflow design (theprocess as it is enforced by the system) and historic data. The approach presentedin this paper allows for a direct coupling of the real process and the simulationmodel. However, the generated CPN models in this paper can be improved by abetter modeling of resource behavior. Moreover, the process mining techniquesthat extract characteristic properties of resources need to be improved to createtruly faithful simulation models.
6.2 Short-term Simulation
Although most workflow management systems offer a simulation component,simulation is rarely used for operational decision making and process improve-ment. One of the reasons is the inability of traditional tools to capture the realprocess (see above). However, another, perhaps more important, reason is thatexisting simulation tools aim at strategic decisions. Existing simulation modelsstart in an arbitrary initial state (without any cases in the pipeline) and thensimulate the process for a long period to make statements about the steady-statebehavior. However, this steady-state behavior does not exist (the environment
14

of the process changes continuously) and is thus considered irrelevant by themanager. Moreover, the really interesting questions are related to the near fu-ture. Therefore, the ‘fast-forward button’ provided by short-term simulation is amore useful option. Because of the use of the current state and historic data,the predictions are more valuable, i.e., of higher quality and easier to interpretand apply. The approach and toolset presented in this paper allow for short-term simulation. In the current implementation the coupling between YAWLand ProM is not well-integrated, e.g., the translation of insights from simulationto concrete actions in the workflow system can be improved. Further research isneeded to provide a seamless, but generic, integration.
6.3 Viewing Real and Simulated Processes in a Unified Manner
Both simulation tools and management information systems (e.g., BI tools)present information about processes. It is remarkable that, although both aretypically used to analyze the same process, the results are presented in com-pletely different ways using completely different tools. This may be explainedby the fact that for a simulated process different data is available than for thereal-world process. However, the emergence of process mining techniques allowsfor a unification of both views. Process mining can be used to extract much moredetailed and dynamic data from processes than traditional data warehousing andbusiness intelligence tools. Moreover, it is easy to extend simulation tools withthe ability to record event data similar to the real-life process. Hence, processmining can be used to view both simulated and real processes. As a result, it iseasier to both compare and to interpret ‘what-if’ scenarios.
Acknowledgements. This research was supported by the IOP program of theDutch Ministry of Economic Affairs and by Australian Research Council grantDP0773012. The authors would like to especially thank Marlon Dumas, MichaelAdams, Eric Verbeek, Ronny Mans, and also Christian Gunther, Minseok Song,Lindsay Bradford, and Chun Ouyang plus the review team for their valuablesupport in implementing the approach for YAWL and ProM.
References
1. W.M.P. van der Aalst, B.F. van Dongen, C.W. Gunther, R.S. Mans, A.K. Alvesde Medeiros, A. Rozinat, V. Rubin, M. Song, H.M.W. Verbeek, and A.J.M.M.Weijters. ProM 4.0: Comprehensive Support for Real Process Analysis. In J. Kleijnand A. Yakovlev, editors, Application and Theory of Petri Nets and Other Models ofConcurrency (ICATPN 2007), volume 4546 of Lecture Notes in Computer Science,pages 484–494. Springer-Verlag, Berlin, 2007.
2. W.M.P. van der Aalst and A.H.M. ter Hofstede. YAWL: Yet Another WorkflowLanguage. Information Systems, 30(4):245–275, 2005.
3. W.M.P. van der Aalst, H.A. Reijers, A.J.M.M. Weijters, B.F. van Dongen, A.K.Alves de Medeiros, M. Song, and H.M.W. Verbeek. Business Process Mining: AnIndustrial Application. Information Systems, 32(5):713–732, 2007.
15

4. R. Ardhaldjian and M. Fahner. Using simulation in the business process reengi-neering effort. Industrial engineering, pages 60–61, July 1994.
5. J.A. Buzacott. Commonalities in Reengineered Business Processes: Models andIssues. Management Science, 42(5):768–782, 1996.
6. M. Dumas, W.M.P. van der Aalst, and A.H.M. ter Hofstede. Process-Aware Infor-mation Systems: Bridging People and Software through Process Technology. Wiley& Sons, 2005.
7. C. Hall and P. Harmon. A Detailed Analysis of Enterprise Architecture, ProcessModeling, and Simulation Tools. Technical report 2.0, BPTrends, September 2006.
8. M. Jansen-Vullers and M. Netjes. Business process simulation – a tool sur-vey. In Workshop and Tutorial on Practical Use of Coloured Petri Netsand the CPN Tools, Aarhus, Denmark, October 2006. Published online at:http://www.daimi.au.dk/CPnets/workshop06/.
9. K. Jensen, L.M. Kristensen, and L. Wells. Coloured Petri Nets and CPN Toolsfor Modelling and Validation of Concurrent Systems. International Journal onSoftware Tools for Technology Transfer, 9(3-4):213–254, 2007.
10. D.W. Kelton, R. Sadowski, and D. Sturrock. Simulation with Arena. McGraw-Hill,New York, 2003.
11. J. Kleijnen and W. van Groenendaal. Simulation: a statistical perspective. JohnWiley and Sons, New York, 1992.
12. M. Laugna and J. Marklund. Business Process Modeling, Simulation, and Design.Prentice Hall, Upper Saddle River, New Jersey, 2005.
13. F. Leymann and D. Roller. Production Workflow: Concepts and Techniques.Prentice-Hall PTR, Upper Saddle River, New Jersey, USA, 1999.
14. H. Reijers. Design and Control of Workflow Processes: Business Process Manage-ment for the Service Industry, volume 2617 of Lecture Notes in Computer Science.Springer-Verlag, Berlin, 2003.
15. H.A. Reijers and W.M.P. van der Aalst. Short-Term Simulation: Bridging the Gapbetween Operational Control and Strategic Decision Making. In M.H. Hamza,editor, Proceedings of the IASTED International Conference on Modelling andSimulation, pages 417–421. IASTED/Acta Press, Anaheim, USA, 1999.
16. S.M. Ross. A course in simulation. Macmillan, New York, 1990.17. A. Rozinat, R.S. Mans, M. Song, and W.M.P. van der Aalst. Discovering Col-
ored Petri Nets From Event Logs. International Journal on Software Tools forTechnology Transfer, 10(1):57–74, 2008.
18. A. Rozinat, M. Wynn, W.M.P. van der Aalst, A.H.M. ter Hofstede, and C. Fidge.Workflow Simulation for Operational Decision Support using YAWL and ProM.BPM Center Report BPM-08-04, BPMcenter.org, 2008.
19. Mathias Weske. Business Process Management: Concepts, Languages, Architec-tures. Springer-Verlag, Berlin, Heidelberg, 2007.
20. M.T. Wynn, M. Dumas, C.J. Fidge, A.H.M. ter Hofstede, and W.M.P. van derAalst. Business Process Simulation for Operational Decision Support. In A.H.M.ter Hofstede, B. Benatallah, and H.-Y. Paik, editors, BPM 2007 Workshops, volume4928 of Lecture Notes in Computer Science, pages 66–77. Springer-Verlag, 2008.
16