working with smartart - pearson ukcatalogue.pearsoned.co.uk/samplechapter/0789736071.pdf · 206...
TRANSCRIPT
12CHAPTER
In this chapter by Geetesh Bajaj
Working with SmartArt
Understanding SmartArt 206
Adding SmartArt to a Presentation 206
Formatting SmartArt 208
Sample SmartArt Variants 211
Common SmartArt Procedures 212
Working with Organization Charts 216
Troubleshooting 219
17_0789736071_ch12.qxd 11/17/06 3:27 PM Page 205

206 Chapter 12 Working with SmartArt
Understanding SmartArtSome of the coolest improvements in PowerPoint 2007 are related to the overhaul of its dia-gramming features, which let you add much more than detailed diagrams and organizationcharts to presentations. Collectively, all the diagrams available in PowerPoint are now calledSmartArt.
With SmartArt, you can
� Show all sorts of relationships using diagrams
� Change between SmartArt graphic types so that you can determine which SmartArtvariant works best for you
� Change the colors and effects of your SmartArt graphic so that they use the sameTheme Colors as your presentation
� Customize the look of the SmartArt graphic further by editing individual shape ele-ments contained within the SmartArt
So why should you want to use SmartArt when you can use just plain bulleted text? Thereare many advantages to using SmartArt:
� SmartArt lets you visually represent a variety of concepts and ideas that might not worktoo well with just text.
� SmartArt looks coordinated with your presentation, and you can match it with the lookof your presentation.
� You can change your bulleted text to SmartArt with one click.
� You can change between SmartArt variations, and you can also customize an existingSmartArt type. This quick change lets you explore visual options that were never avail-able before.
Adding SmartArt to a PresentationThe fastest way to add SmartArt to your presentation is to apply a slide layout that containsa placeholder for SmartArt. To do so, click the down arrow below the New Slide button inthe Home tab of the ribbon, and then choose any of the Content layouts from the fly-outLayout Gallery.
➔ To learn more about how slide layouts affect your presentation, see “Understanding Slide Layouts” inChapter 2, “Creating a Basic Presentation,” p. 30.
If you chose any of the layouts that includes a Content placeholder, click the Insert SmartArtGraphic button in the placeholder. The Choose a SmartArt Graphic dialog box opens (seeFigure 12.1).
You can also insert SmartArt by clicking the SmartArt button in the Insert tab of the ribbon.
12
17_0789736071_ch12.qxd 11/17/06 3:27 PM Page 206
207Adding SmartArt to a Presentation
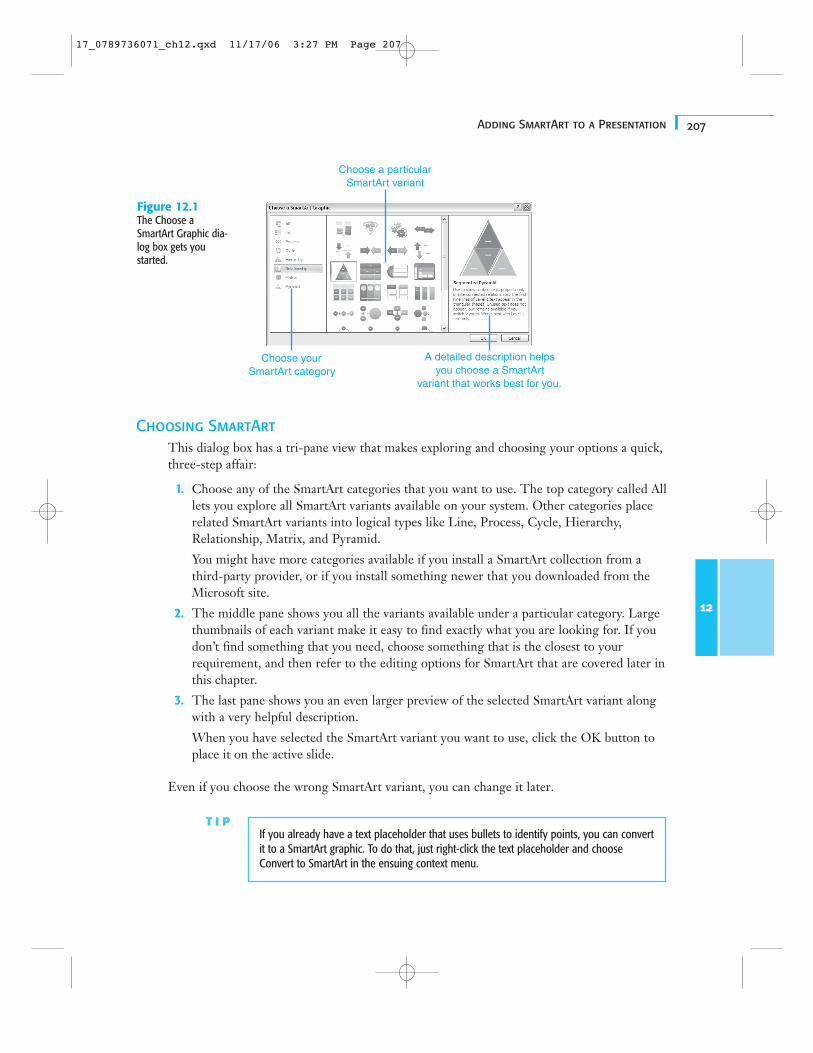
Choosing SmartArtThis dialog box has a tri-pane view that makes exploring and choosing your options a quick,three-step affair:
1. Choose any of the SmartArt categories that you want to use. The top category called Alllets you explore all SmartArt variants available on your system. Other categories placerelated SmartArt variants into logical types like Line, Process, Cycle, Hierarchy,Relationship, Matrix, and Pyramid.
You might have more categories available if you install a SmartArt collection from athird-party provider, or if you install something newer that you downloaded from theMicrosoft site.
2. The middle pane shows you all the variants available under a particular category. Largethumbnails of each variant make it easy to find exactly what you are looking for. If youdon’t find something that you need, choose something that is the closest to yourrequirement, and then refer to the editing options for SmartArt that are covered later inthis chapter.
3. The last pane shows you an even larger preview of the selected SmartArt variant alongwith a very helpful description.
When you have selected the SmartArt variant you want to use, click the OK button toplace it on the active slide.
Even if you choose the wrong SmartArt variant, you can change it later.
12
Choose yourSmartArt category
Choose a particularSmartArt variant
A detailed description helpsyou choose a SmartArt
variant that works best for you.
Figure 12.1The Choose aSmartArt Graphic dia-log box gets youstarted.
T I PIf you already have a text placeholder that uses bullets to identify points, you can convertit to a SmartArt graphic. To do that, just right-click the text placeholder and chooseConvert to SmartArt in the ensuing context menu.
17_0789736071_ch12.qxd 11/17/06 3:27 PM Page 207
208 Chapter 12 Working with SmartArt
Can’t find the right diagram? See “Expanding Diagram Choices” in the “Troubleshooting” sec-tion near the end of this chapter.
Formatting SmartArtAfter you place SmartArt on your slide, you need to format it to fulfill your requirements:
� You might want to add or edit text.
� You might want to change the theme colors or apply a style to the shapes.
� You might want to add or remove shapes within the SmartArt.
� You might want to realign or resize the SmartArt.
� You might want to change to another SmartArt variant.
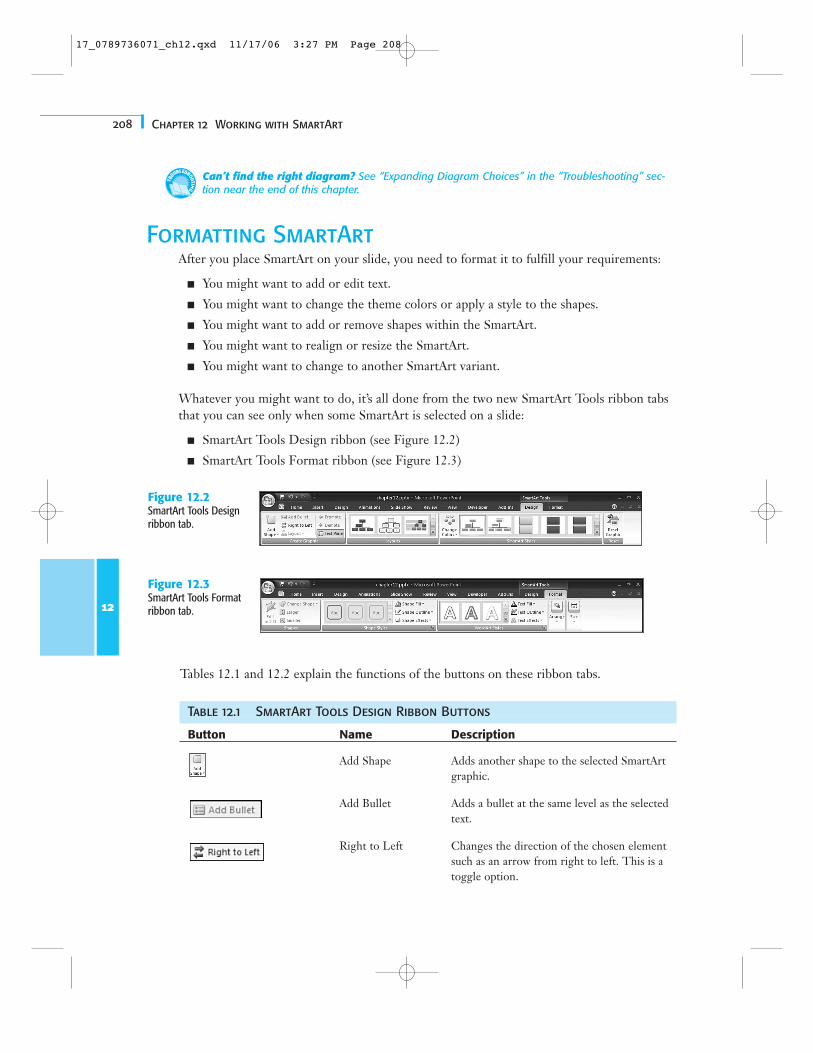
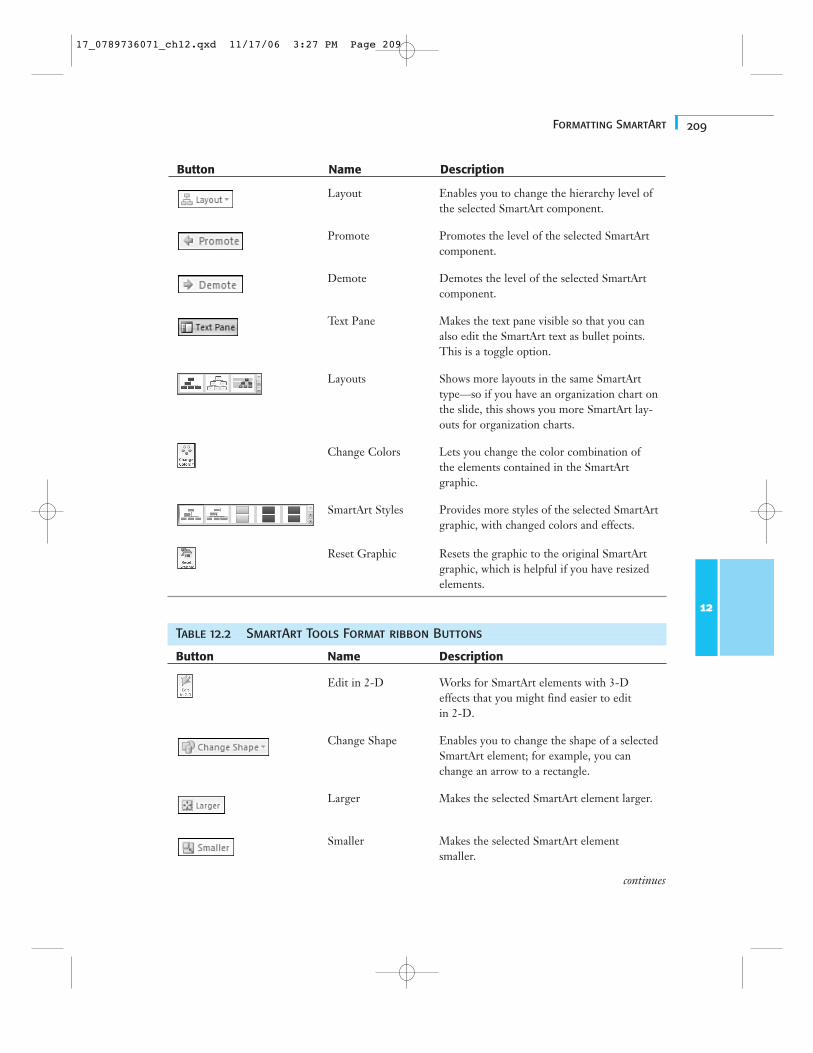
Whatever you might want to do, it’s all done from the two new SmartArt Tools ribbon tabsthat you can see only when some SmartArt is selected on a slide:
� SmartArt Tools Design ribbon (see Figure 12.2)
� SmartArt Tools Format ribbon (see Figure 12.3)
12
Figure 12.2SmartArt Tools Designribbon tab.
Figure 12.3SmartArt Tools Formatribbon tab.
Tables 12.1 and 12.2 explain the functions of the buttons on these ribbon tabs.
Table 12.1 SmartArt Tools Design Ribbon Buttons
Button Name Description
Add Shape Adds another shape to the selected SmartArtgraphic.
Add Bullet Adds a bullet at the same level as the selectedtext.
Right to Left Changes the direction of the chosen elementsuch as an arrow from right to left. This is atoggle option.
17_0789736071_ch12.qxd 11/17/06 3:27 PM Page 208
209Formatting SmartArt
Layout Enables you to change the hierarchy level ofthe selected SmartArt component.
Promote Promotes the level of the selected SmartArtcomponent.
Demote Demotes the level of the selected SmartArtcomponent.
Text Pane Makes the text pane visible so that you canalso edit the SmartArt text as bullet points.This is a toggle option.
Layouts Shows more layouts in the same SmartArttype—so if you have an organization chart onthe slide, this shows you more SmartArt lay-outs for organization charts.
Change Colors Lets you change the color combination ofthe elements contained in the SmartArtgraphic.
SmartArt Styles Provides more styles of the selected SmartArtgraphic, with changed colors and effects.
Reset Graphic Resets the graphic to the original SmartArtgraphic, which is helpful if you have resizedelements.
Table 12.2 SmartArt Tools Format ribbon Buttons
Button Name Description
Edit in 2-D Works for SmartArt elements with 3-Deffects that you might find easier to editin 2-D.
Change Shape Enables you to change the shape of a selectedSmartArt element; for example, you canchange an arrow to a rectangle.
Larger Makes the selected SmartArt element larger.
Smaller Makes the selected SmartArt elementsmaller.
12
continues
Button Name Description
17_0789736071_ch12.qxd 11/17/06 3:27 PM Page 209
210 Chapter 12 Working with SmartArt
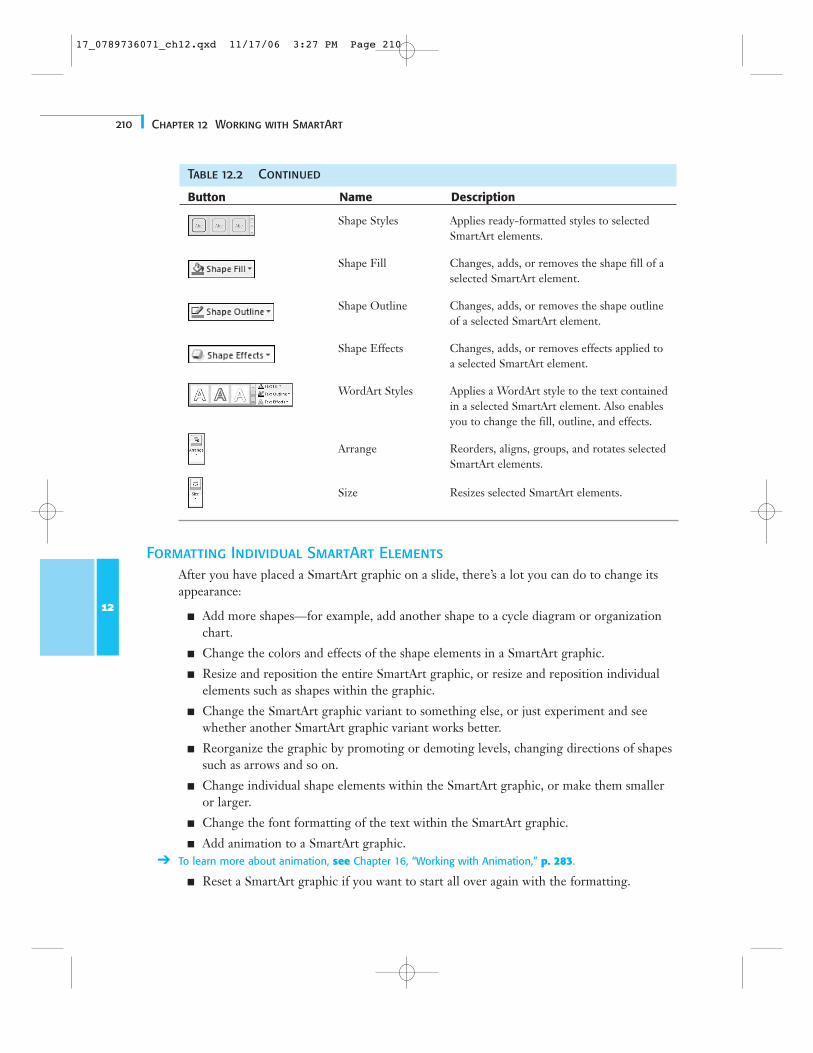
Shape Styles Applies ready-formatted styles to selectedSmartArt elements.
Shape Fill Changes, adds, or removes the shape fill of aselected SmartArt element.
Shape Outline Changes, adds, or removes the shape outlineof a selected SmartArt element.
Shape Effects Changes, adds, or removes effects applied toa selected SmartArt element.
WordArt Styles Applies a WordArt style to the text containedin a selected SmartArt element. Also enablesyou to change the fill, outline, and effects.
Arrange Reorders, aligns, groups, and rotates selectedSmartArt elements.
Size Resizes selected SmartArt elements.
Formatting Individual SmartArt ElementsAfter you have placed a SmartArt graphic on a slide, there’s a lot you can do to change itsappearance:
� Add more shapes—for example, add another shape to a cycle diagram or organizationchart.
� Change the colors and effects of the shape elements in a SmartArt graphic.
� Resize and reposition the entire SmartArt graphic, or resize and reposition individualelements such as shapes within the graphic.
� Change the SmartArt graphic variant to something else, or just experiment and seewhether another SmartArt graphic variant works better.
� Reorganize the graphic by promoting or demoting levels, changing directions of shapessuch as arrows and so on.
� Change individual shape elements within the SmartArt graphic, or make them smalleror larger.
� Change the font formatting of the text within the SmartArt graphic.
� Add animation to a SmartArt graphic.➔ To learn more about animation, see Chapter 16, “Working with Animation,” p. 283.
� Reset a SmartArt graphic if you want to start all over again with the formatting.
12
Table 12.2 Continued
Button Name Description
17_0789736071_ch12.qxd 11/17/06 3:27 PM Page 210
211Sample SmartArt Variants
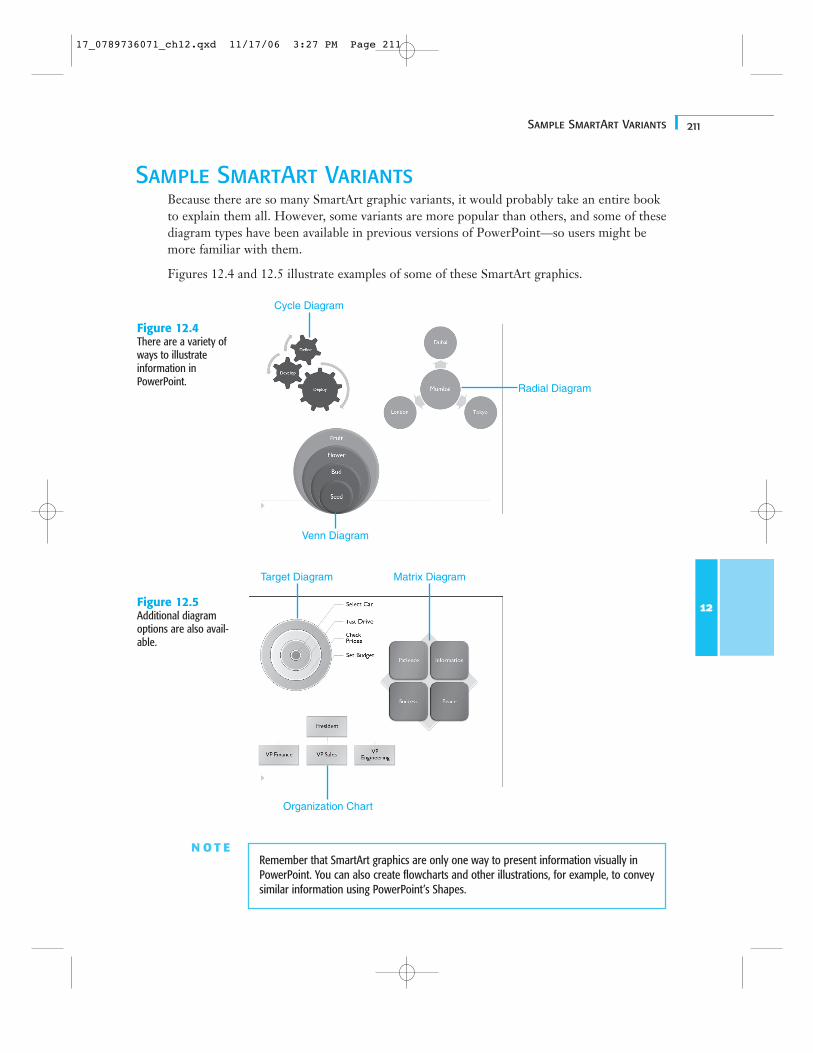
Sample SmartArt VariantsBecause there are so many SmartArt graphic variants, it would probably take an entire bookto explain them all. However, some variants are more popular than others, and some of thesediagram types have been available in previous versions of PowerPoint—so users might bemore familiar with them.
Figures 12.4 and 12.5 illustrate examples of some of these SmartArt graphics.
12
N O T ERemember that SmartArt graphics are only one way to present information visually inPowerPoint. You can also create flowcharts and other illustrations, for example, to conveysimilar information using PowerPoint’s Shapes.
Cycle Diagram
Radial Diagram
Venn Diagram
Figure 12.4There are a variety ofways to illustrateinformation inPowerPoint.
Target Diagram
Organization Chart
Matrix Diagram
Figure 12.5Additional diagramoptions are also avail-able.
17_0789736071_ch12.qxd 11/17/06 3:27 PM Page 211
212 Chapter 12 Working with SmartArt
➔ To learn how to use Shapes to create flowcharts or other diagrams, see“Inserting Shapes” in Chapter 15, “Working with Shapes and Objects,” p. 260.
Common SmartArt ProceduresAlthough different SmartArt variants might look as different as chalk and cheese, they worksimilarly for several common procedures such as adding text, changing colors, resizing,adding effects, and deleting shape elements or the entire SmartArt graphic. All also have theconvenient text pane that makes text editing almost as easy as typing in bulleted text.
Adding and Editing Text in Your SmartArtYou can add or edit the text on the shape elements in all SmartArt graphics by using theseprocedures:
� Click on the existing placeholder text on the shape element, or start typing if you have ashape without text. Or just select the text in the shape and type to replace the text.
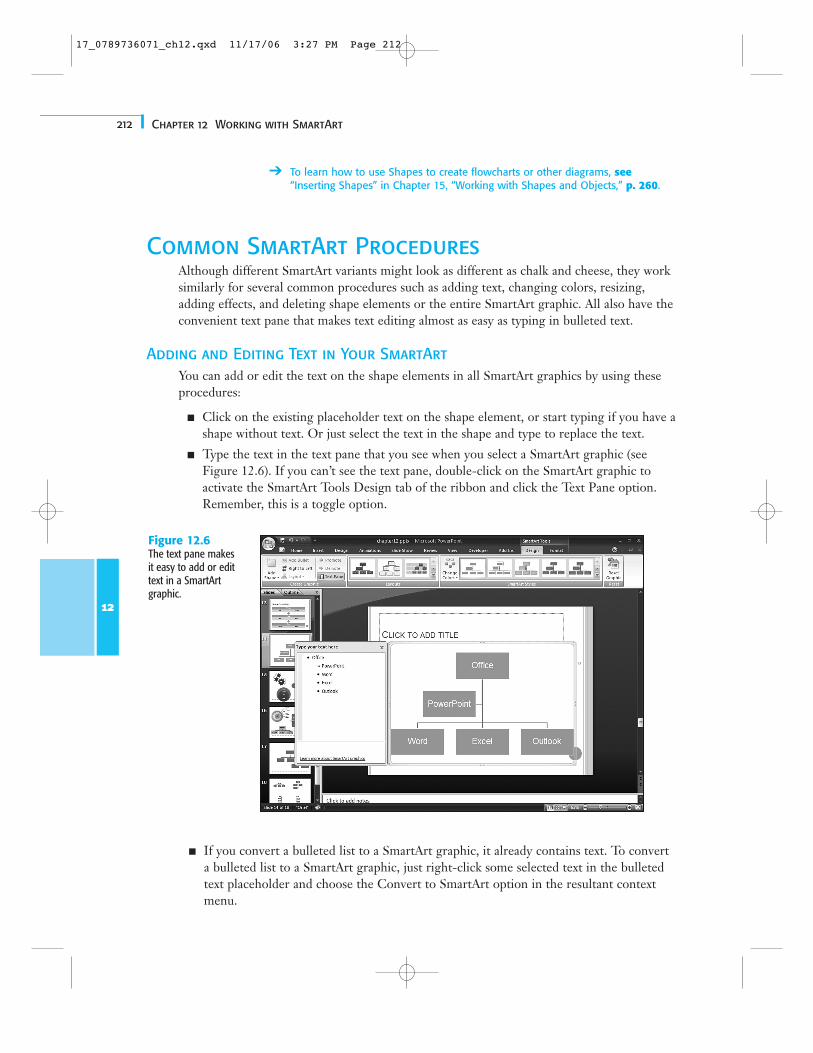
� Type the text in the text pane that you see when you select a SmartArt graphic (seeFigure 12.6). If you can’t see the text pane, double-click on the SmartArt graphic toactivate the SmartArt Tools Design tab of the ribbon and click the Text Pane option.Remember, this is a toggle option.
12
Figure 12.6The text pane makesit easy to add or edittext in a SmartArtgraphic.
� If you convert a bulleted list to a SmartArt graphic, it already contains text. To converta bulleted list to a SmartArt graphic, just right-click some selected text in the bulletedtext placeholder and choose the Convert to SmartArt option in the resultant contextmenu.
17_0789736071_ch12.qxd 11/17/06 3:27 PM Page 212
213Common SmartArt Procedures
You can format the text contained inside a SmartArt graphic in several ways, sometimes withdifferent results:
� Select some text, and right-click to summon the mini toolbar that contains font format-ting options. In this mini-toolbar, it’s easy to apply boldface, a new font, and so on.
� Select some text, and make sure your Home ribbon is active. You can find all the for-matting options in the font area. If you want even more options, click the dialoglauncher arrow in the Font area to bring up the Font dialog box, which provides moreoptions.
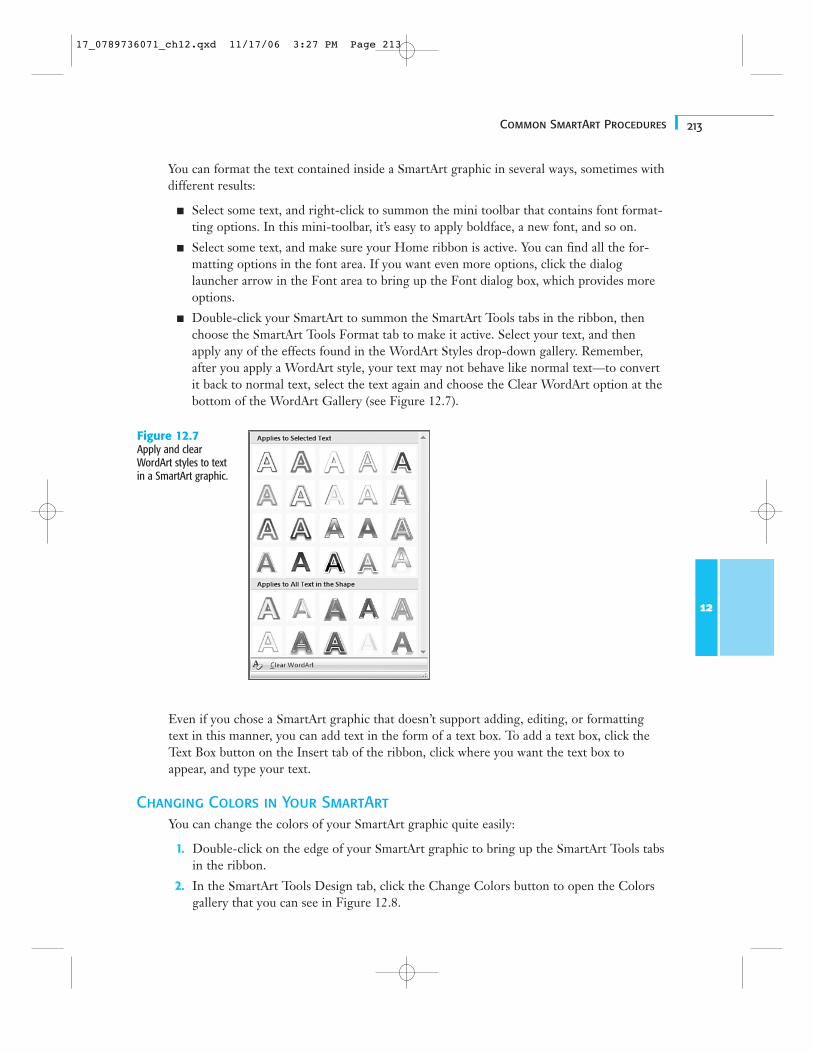
� Double-click your SmartArt to summon the SmartArt Tools tabs in the ribbon, thenchoose the SmartArt Tools Format tab to make it active. Select your text, and thenapply any of the effects found in the WordArt Styles drop-down gallery. Remember,after you apply a WordArt style, your text may not behave like normal text—to convertit back to normal text, select the text again and choose the Clear WordArt option at thebottom of the WordArt Gallery (see Figure 12.7).
12
Figure 12.7Apply and clearWordArt styles to textin a SmartArt graphic.
Even if you chose a SmartArt graphic that doesn’t support adding, editing, or formattingtext in this manner, you can add text in the form of a text box. To add a text box, click theText Box button on the Insert tab of the ribbon, click where you want the text box toappear, and type your text.
Changing Colors in Your SmartArtYou can change the colors of your SmartArt graphic quite easily:
1. Double-click on the edge of your SmartArt graphic to bring up the SmartArt Tools tabsin the ribbon.
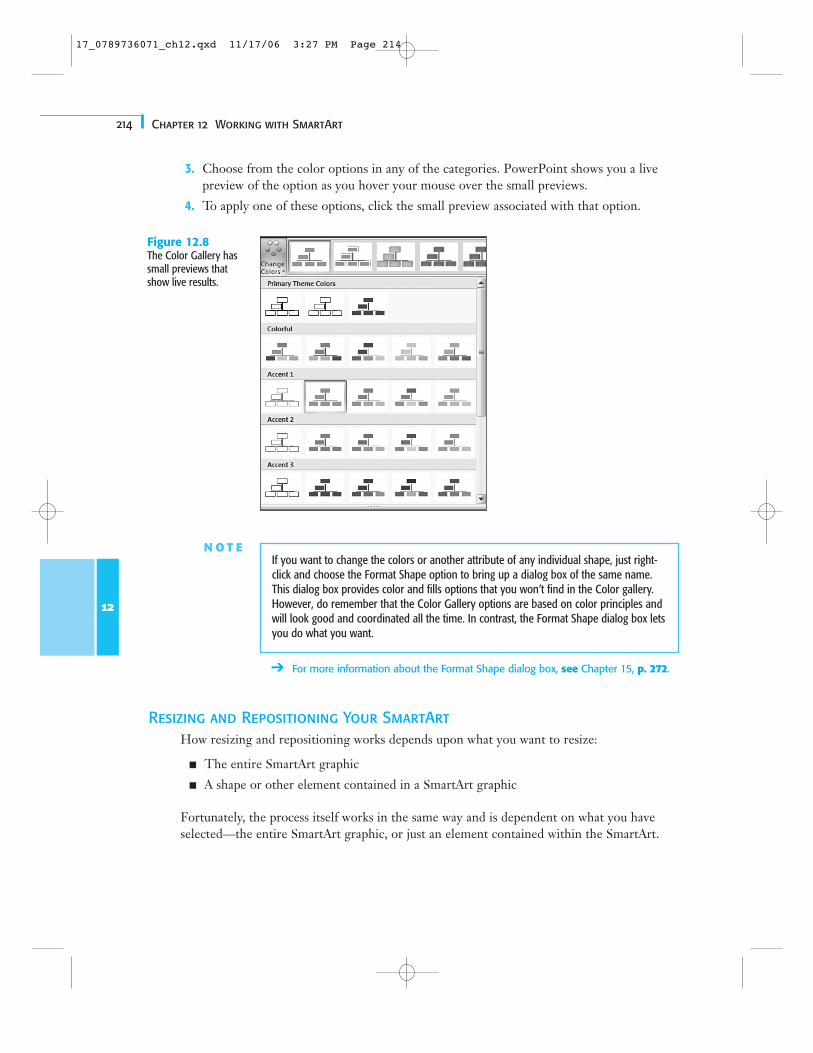
2. In the SmartArt Tools Design tab, click the Change Colors button to open the Colorsgallery that you can see in Figure 12.8.
17_0789736071_ch12.qxd 11/17/06 3:27 PM Page 213
➔ For more information about the Format Shape dialog box, see Chapter 15, p. 272.
Resizing and Repositioning Your SmartArtHow resizing and repositioning works depends upon what you want to resize:
� The entire SmartArt graphic
� A shape or other element contained in a SmartArt graphic
Fortunately, the process itself works in the same way and is dependent on what you haveselected—the entire SmartArt graphic, or just an element contained within the SmartArt.
214 Chapter 12 Working with SmartArt
3. Choose from the color options in any of the categories. PowerPoint shows you a livepreview of the option as you hover your mouse over the small previews.
4. To apply one of these options, click the small preview associated with that option.
12
Figure 12.8The Color Gallery hassmall previews thatshow live results.
N O T EIf you want to change the colors or another attribute of any individual shape, just right-click and choose the Format Shape option to bring up a dialog box of the same name.This dialog box provides color and fills options that you won’t find in the Color gallery.However, do remember that the Color Gallery options are based on color principles andwill look good and coordinated all the time. In contrast, the Format Shape dialog box letsyou do what you want.
17_0789736071_ch12.qxd 11/17/06 3:27 PM Page 214
215Common SmartArt Procedures
12
Resize
To resize, you can
� Select and drag the handles surrounding the selection.
� Double-click the selection to summon the SmartArt Tools tabs in the ribbon. Select theSmart Art Tools Format tab, and click on the Size button so that you can type in figuresfor an exact size you require.
Reposition
Follow these guidelines to reposition:
� To reposition, you need to select and drag it to a new position.
� If you want to reposition an element within a SmartArt graphic, be aware that you can-not reposition it to an area outside the area of the SmartArt graphic.
� Also, some elements, when repositioned, change more than just their position; theychange their relationships to other elements. For example, repositioning a shape in anorganization chart might change the hierarchy, as well.
Adding EffectsIf you have seen the flat diagrams of earlier PowerPoint versions, and wished you couldmake them look a little more spectacular, then you’ll love all the effects that you can applyto SmartArt now.
However, you cannot select the entire SmartArt graphic and apply an effect. The effects youuse in PowerPoint are Shape Effects that can only be applied to individual shape elementswithin a SmartArt graphic.
Follow these steps to apply, change, or remove an effect:
1. Select the shape inside the SmartArt graphic to which you want to apply a Shape Effect.
You can also select multiple shapes by Ctrl-clicking, and you might also want to selectall the shapes within a SmartArt graphic.
You can also select lines such as connectors within a SmartDraw graphic because theseare also shapes.
2. Selecting these shapes activates the SmartArt Tools tabs in the ribbon—click theSmartDraw Tools Format tab to make it active.
3. Now you can either open the Shape Styles drop-down gallery and choose a preseteffect, or click the Shape Effects button to find a Preset as well as several other sub-menus, which in turn contain even more galleries that let you play with all sorts ofeffects.
PowerPoint shows you a live preview of all the effects as you hover your cursor over theoptions. When you like a particular effect, just click to apply it to the selected shapes.
17_0789736071_ch12.qxd 11/17/06 3:27 PM Page 215
216 Chapter 12 Working with SmartArt
12
Deleting a SmartArt GraphicTo delete a SmartArt graphic, select it and press the Delete key. If you end up deleting just apart of the SmartArt graphic, and you wanted to delete the entire SmartArt, then select theframe around the SmartArt graphic and press the Delete key again.
The Content placeholder might appear, depending on whether the SmartArt was insertedfrom a layout or through the SmartArt button on the Insert ribbon.
If you want to create another SmartArt, you can start over from here, accessing the Choosea SmartArt Graphic dialog box by clicking the placeholder or the SmartArt button on theInsert tab of the ribbon.
Working with Organization ChartsAlthough an Organization Chart is actually just another SmartArt graphic, it has particularnuances that make it a class apart, and completely different from other SmartArt variants.
Indeed, special applications are available that create only organization charts. You might notneed to invest in a specialized application, though, because PowerPoint’s implementation ofthis graphic type is quite complete.
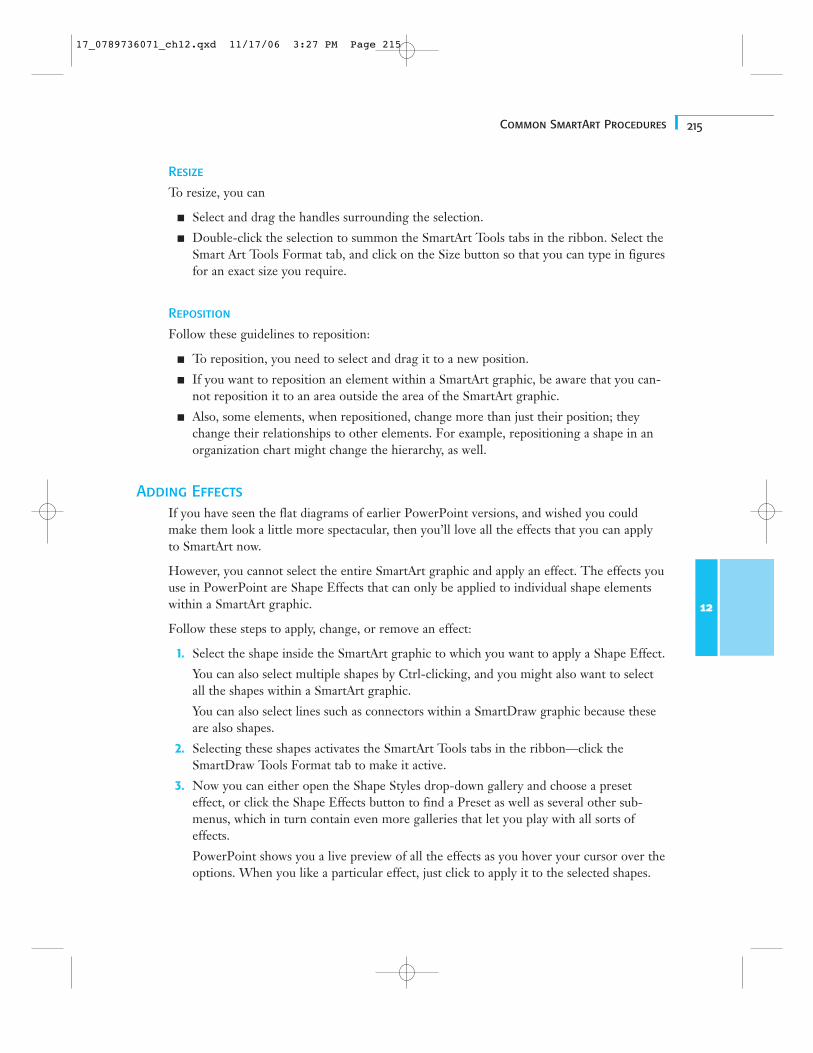
To add an organization chart, choose one of the Organization Charts available in theHierarchy category of the Choose a SmartArt Graphic dialog box that you can see in Figure12.9 and click OK.
➔ For a refresher on how to open this dialog box, see “Adding SmartArt to a Presentation” earlier in thischapter, p. 206.
Figure 12.9Choose the Hierarchycategory for someOrganization Chartsamples.
T I PIt’s best to design your organization chart on paper first, particularly if you’re not familiarwith this application. This lets you focus on creating the chart rather than on content.
N O T ERemember, you can always click the Undo button on the Quick Access Toolbar to undoyour last action.
17_0789736071_ch12.qxd 11/17/06 3:27 PM Page 216
217Working with Organization Charts
12
PowerPoint inserts an organization chart SmartArt in to your presentation and activates theSmartArt Tools tabs in the ribbon. Also, the SmartArt Tools Design tab becomes active, andthe normally grayed out Layout button in the Create Graphic group of the tab becomeslive.
Now that you have placed an organization chart, you’ll notice that there’s either no text or atext placeholder on all the shapes that invites you to type in some text. You might also wantto add more shapes (boxes) to the organization chart and change its layout.
Inserting More ShapesTo add more shapes (boxes) to your organization chart, do either of the following:
� Select a shape and click the Add Shape button on the SmartArt Tools Design ribbon.
� Select a shape, right-click, and select the Add Shape option in the resultant contextmenu.
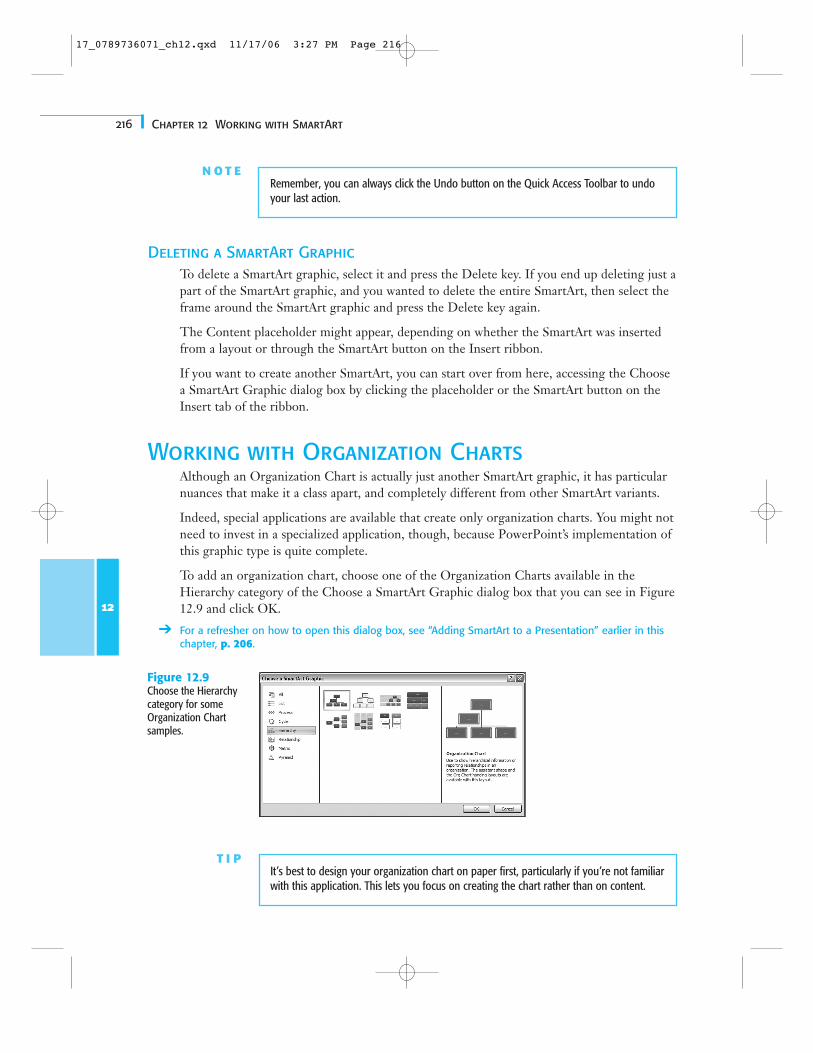
In either case, you’ll see the Add Shape menu that you can see in Figure 12.10.
Figure 12.10Add a shape to yourorganization chart.
Unlike previous versions of PowerPoint that made you choose between a sub-ordinate, co-worker, or assistant shape, this version of PowerPoint makes it super simple by providingyou with options that don’t require you to get very familiar with org-charting terminology.You need to choose from
� Add Shape After
� Add Shape Before
� Add Shape Above
� Add Shape Below
� Add Assistant
You will choose a different option depending on where you want to place a new shape:
� On the same level: The first four options add a shape in relation to the position of theselected shape on the right, left, top, or bottom. All these shapes are on the same level.
17_0789736071_ch12.qxd 11/17/06 3:27 PM Page 217
218 Chapter 12 Working with SmartArt
� On a lower level: The Add Assistant option places a shape which is hierarchal lowerthan the selected shape.
� On a higher level: This is not required because every organization chart has at leastone shape on the highest level. If you need more shapes on this level, select the highestshape, and add another shape at the same level. However these shapes aren’t connectedto the original shape.
Changing the LayoutYou can change the layout of the assistants (hierarchal, lower shapes) in your organizationchart, again in relation to a selected shape within the organization chart.
Follow these steps to change the layout of the assistants:
1. Select the shape that is at a level higher than the assistants.
2. In the SmartArt Tools Design tab of the ribbon, click the Layout button to see themenu that you can see in Figure 12.11.
12
Figure 12.11Change the layout ofthe assistants.
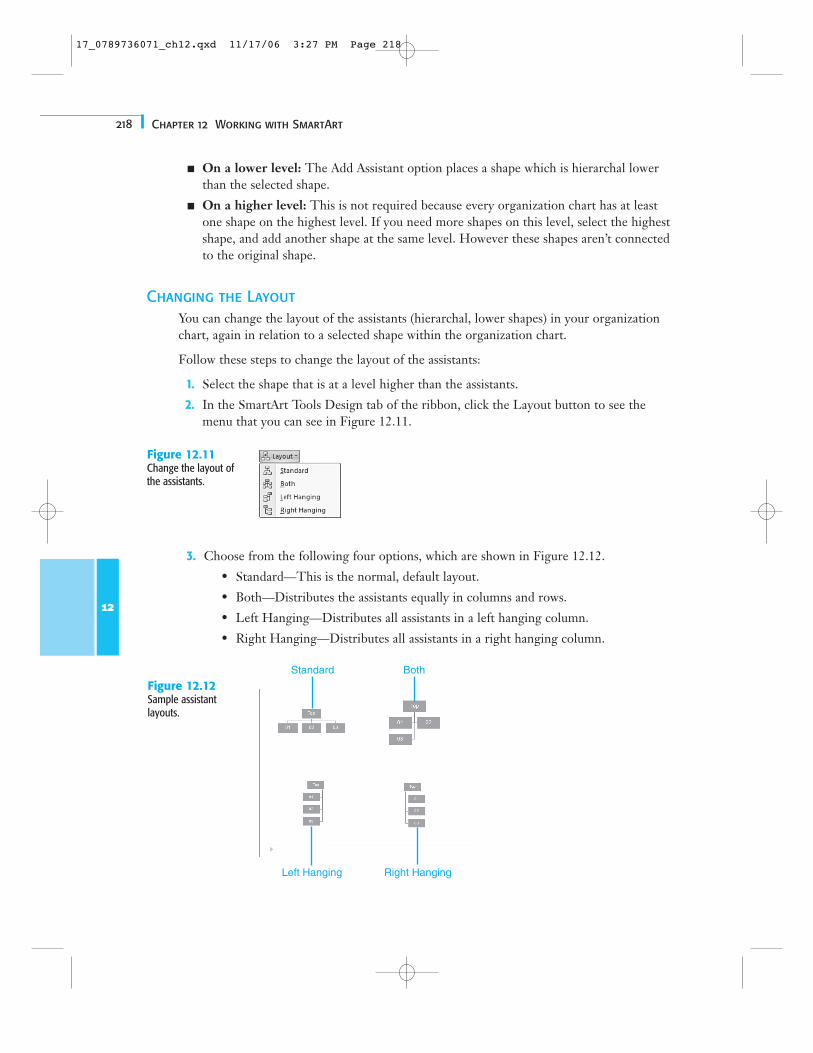
3. Choose from the following four options, which are shown in Figure 12.12.
• Standard—This is the normal, default layout.
• Both—Distributes the assistants equally in columns and rows.
• Left Hanging—Distributes all assistants in a left hanging column.
• Right Hanging—Distributes all assistants in a right hanging column.
Standard Both
Left Hanging Right Hanging
Figure 12.12Sample assistant layouts.
17_0789736071_ch12.qxd 11/17/06 3:27 PM Page 218

219Troubleshooting
Whichever of these options you choose, all assistants remain linked to the original shape.Figure 12.12 shows you samples of all the four layouts.
N O T ETo change the level of a selected shape in your organization chart, click the Promote andDemote buttons in the SmartArt Tools Design tab of the ribbon.
Formatting Your Organization ChartYou can format an organization chart just as you format any other SmartArt graphic. Forexample, you can reposition it, change its colors, modify line width, and so on. You’ll pri-marily do this by using the options explained earlier in this chapter for other SmartArtgraphic variants, or through the Format dialog box (right-click and choose Format Shapefrom the menu).
➔ For more information about formatting SmartArt graphics, see “Formatting SmartArt” and “CommomSmartArt Procedures,” earlier in this chapter, p. 208 and 212.
➔ For more information about the Format dialog box and the Drawing toolbar, see Chapter 15, p. 272.
Is your organization chart is a mess? See “Fixing a Problem Organization Chart” in the“Troubleshooting” section near the end of this chapter.
You can also animate your organization chart for extra emphasis.
➔ To learn more about animation in PowerPoint, see Chapter 16, p. 283.
C A U T I O NRemember to consider readability and visual clarity when you modify an organizationchart’s defaults. Some formatting can enhance a chart’s appearance, but too much for-matting can make it confusing or—worse—unreadable.
TroubleshootingFixing a Problem Organization Chart
I tried creating an organization chart for the first time, and it’s a real mess. Do I have to delete theentire slide?
No, just delete the organization chart itself. From there, you can begin again. If you see aContent placeholder, click the Insert SmartArt button. If you see nothing, click theSmartArt button on the Insert tab of the ribbon. In each case, the Choose a SmartArtGraphic dialog box appears.
17_0789736071_ch12.qxd 11/17/06 3:27 PM Page 219

220 Chapter 12 Working with SmartArt
Expanding Diagram Choices
I can’t create the graphic I want with the SmartArt choices.
Remember that you can apply style options in the Shape Styles and Shape Effects galleries.If those options aren’t enough, you can create a diagram yourself from the shapes in theInsert tab of the ribbon. You can also manually design an illustration with PowerPoint’sdrawing tools. As a last resort, create your diagram in another program (such as Visio,SmartDraw, or Illustrator) and then insert it.
Also, Microsoft has allowed third-party providers to create more SmartArt graphics. Intime, this will mean that there will be tons of new SmartArt graphics, and you might evenget a particular style created for yourself.
17_0789736071_ch12.qxd 11/17/06 3:27 PM Page 220