working papers in economics no 666 - gupea: home · workers in non-mining sectors due to backward...
TRANSCRIPT

Department of Economics
School of Business, Economics and Law at University of Gothenburg
Vasagatan 1, PO Box 640, SE 405 30 Göteborg, Sweden
+46 31 786 0000, +46 31 786 1326 (fax)
www.handels.gu.se [email protected]
WORKING PAPERS IN ECONOMICS
No 666
Gold mining and education:
a long-run resource curse in Africa?
Pelle Ahlerup, Thushyanthan Baskaran, and Arne Bigsten
June 2016
ISSN 1403-2473 (print) ISSN 1403-2465 (online)

Gold mining and education:
a long-run resource curse in Africa?
Pelle Ahlerup†, Thushyanthan Baskaran∗††, and Arne Bigsten†††
†University of Gothenburg ††University of Siegen †††University of Gothenburg
Abstract
We provide micro-level evidence on an important channel through which mineral
resources may adversely affect development in the long-run: lower educational attain-
ment. Combining Afrobarometer survey data with geocoded data on the discovery
and shutdown dates of of gold mines, we show that respondents who had a gold mine
within their district when they were in adolescence have significantly lower educa-
tional attainment. These results are robust to the omission of individual countries,
different definitions of adulthood, the use of alternative data from the Development
and Health Surveys (DHS), and buffer-based approaches to define neighborhood.
Regarding mechanisms, we conclude that the educational costs of mines are likely
due to households making myopic educational decisions when employment in gold
mining is an alternative. We explore and rule out competing mechanism such as
endogenous migration, a lower provision of public goods by the government, and a
higher propensity for violent conflicts in gold mining districts.
Keywords: Education, mineral resources, gold mining, survey data, Africa
JEL codes: H70, O10, D74
∗Corresponding author: Thushyanthan Baskaran, Department of Economics, University of Siegen,Holderlinstr. 3, 57076 Siegen, Germany, Tel: +49(0)-271-740-3642, email: [email protected].

1 Introduction
Since the turn of the century, the mineral resource sector has been booming in many African
countries (AfDB et al., 2013; Chuhan-Pole et al., 2013). This growing importance of mineral
resources will likely reshape the structure of African economies for the foreseeable future.
It is, however, unclear what the resource boom portends for Africa’s economic development
and its inhabitant’s well-being. On the one hand, mineral resources and the income they
may deliver can have immediate positive effects. People can find employment and earn,
compared to the available alternatives such as subsistence agriculture, relatively high wages
(Hilson, 2016). Fiscally constrained governments might receive additional revenues, which
they can use to fund essential public goods and generally better the living conditions of
their citizens (Calder, 2014).
On the other hand, an influential literature argues that mineral resources are a curse
rather than a blessing for developing countries (van der Ploeg, 2011). Mineral resource
booms may lead to exchange rate adjustments that work to make non-resource sectors
less competitive, an effect termed the “Dutch Disease” (Corden, 1984). The existence of
mineral resources has also been associated with political economy mechanisms that have
adverse effects: resources can be a tempting target for predatory political groups and lead
to corruption (Leite and Weidmann, 2002; Knutsen et al., 2016) and political instability,
including violent conflicts (Lujala et al., 2005; Ross, 2004b). Further adverse effects include
heightened volatility in public revenues (Humphreys et al., 2007) and a reduced need for
rulers to bargain with their citizens over taxation and thus less democracy and worse
governance (Baskaran and Bigsten, 2013; Ross, 2004a).
In this paper, we contribute to the discussion on the benefits and drawbacks of mineral
resources and, more specifically, to the debate on the implications of resource booms in
Africa by focusing on the production of gold. One important feature of gold production
1

is the disproportionate importance of small-scale, artisinal operations (Hilson, 2016). The
ability to profitably extract gold in small-scale operations implies that children and young
adults can easily find employment in gold mining. Families may hence neglect the education
of their children and instead allow or even encourage them to work. Thus, one subtle curse
of gold, one that could only be observable in the long-run, may be lower educational
attainment.
In line with this hypothesis, we provide micro-level evidence that men and women have
lower levels of education as adults if they had a gold mine in their neighborhood when they
were in adolescence. We also offer suggestive evidence for the mechanism discussed above,
i. e. that the lower educational attainment comes about because families in gold mining
districts encourage their children to work, by ruling out other transmission channels, no-
tably a lower provision of public goods in mining districts by the government, endogenous
migration, and a higher propensity of conflicts. Various extensions confirm this interpre-
tation further. In particular, we show that smaller gold mines have a more adverse effect
on educational attainment than larger mines and that mineral resources other than gold
have no significant effect on educational attainment. These results suggest that gold affects
educational attainment negatively because of its amenability to small-scale activities.
Finally, our results indicate that respondents who had mines in their neighborhood
during their youth face as adults no better and possibly even worse economic conditions
than respondents without any gold mines. This particular result implies that in the long-
run, the negative educational effects of gold mining are not outweighed by persistently
higher incomes. Overall, our findings indicate that the presence of mines may induce
children or their parents to make life choices that are myopic and do not pay off in the
long-run. These broader implications of gold mines should be taken into account to properly
assess the benefits and drawbacks of the mineral resource boom in Africa.
2

To explore individuals’ educational attainment during adolescence in mining and non-
mining districts, we match data on the location and dates of operation of gold mines to
survey data on educational attainment from the 4th wave of the Afrobarometer surveys
at the district level. Using a sample of 18 countries and controlling for country, region,
ethnic group and cohort fixed effects, we identify a significantly negative effect of the
presence of a gold mine in the district of a respondent when she was in adolescence on
educational attainment. This effect is robust to the omission of individual countries, to
different definitions of adolescence, to the use of the Development and Health Surveys
(DHS) as an alternative source of data on educational attainment and to a buffer-based
definition of neighborhood (rather than one based on administrative districts), and in a
number of further robustness tests.
As indicated, our findings contribute to an influential literature on the drawbacks and
benefits of mineral resources.1 A substantial body of anecdotal evidence suggest that min-
eral resources do not necessarily lead to higher incomes and may, in fact, have depressing
consequences. Bevan et al. (1999), for example, show that despite a large increase in oil
revenues, income has stagnated and poverty has increased in Nigeria until the turn of the
century. Growth and poverty reduction were similarly disappointing in many other re-
source rich countries (Stokke, 2008). On the other hand, Botswana is often cited as one
prime example where natural resources can be beneficial: even as 40% of its GDP is due
to diamonds, it has managed to generate high growth rates since 1965 and to invest a
substantial share of its national income for public education (Sarraf and Jiwanji, 2001).
Another positive example is the United Arab Emirates, where hydrocarbon wealth has led
to better infrastructure and an expansion of various public goods and services (Fasano,
2002).
1For theoretical work on the effect of mineral resources, see e. g. Auty (2001) and Hodler (2006).
3

Anecdotal evidence on whether mineral resources are a curse or a blessing is thus con-
tradictory. More systematic evidence is offered by a large literature that explores their
consequences at the cross-country level. The seminal work by Sachs and Warner (1995)
suggests that natural resources tend to depress economic growth. On the other hand, Bhat-
tacharyya and Hodler (2009) and Mehlum et al. (2006) find that mineral resources have pos-
itive economic effects if pre-existing institutions are “producer friendly”. Brunnschweiler
and Bulte (2008) argue that commonly used measures for resource abundance conflate
abundance with dependence. Using ostensibly more accurate measures for resource abun-
dance than the previous literature, they find that natural resources have a positive effect
on institutional quality and growth. James (2015) finds that the resource curse is a “sta-
tistical mirage”: a slow-growing resource sector disproportionately affects overall growth
in resource-dependent countries and may show up as a negative growth effect of natural
resources in statistical analyses.
A related literature explores various transmission channels through which natural re-
sources may depress long-run growth. Collier and Hoeffler (2004, 2005) suggest that min-
eral resources increase the propensity of conflicts. Jensen and Wantchekon (2004) find
that resource wealth and the level of democracy are negatively correlated. Finally, Gyl-
fason (2001), arguably the study that is most closely related to our work, observers that
resource-rich countries tend to neglect education: public expenditures as share of national
income for education as well as gross secondary-school enrollment is lower in these coun-
tries.
One problematic aspect of of the above literature is that it relies on cross-country varia-
tion. Given the heterogeneity across countries, it is unclear whether this literature is able
to identify a causal effect. A new but relatively small literature hence uses micro-level data
and exploits within-country variation. In the context of this literature, Tolonen (2014) finds
with geocoded data on mines and survey data from the Demographic and Health Surveys
4

that the opening of large, industrial-scale gold mines improves gender equality. Knutsen
et al. (2016) find that the opening of mines increases bribe payments using Afrobarometer
data. Aragon and Rud (2013) conclude that mines increase incomes even for unskilled
workers in non-mining sectors due to backward linkages and thus have positive spillovers
across sectors. Loayza et al. (2013) identify similarly positive effects on local incomes of
mining. On the other hand, Berman et al. (2014) find with georeferenced data on both
mining activities and violent conflicts that mining significantly increases the probability
of conflicts. Wilson (2012) finds that mines have adverse local health effects in Zambian
cities.
This paper is also related to the literature on the determinants of educational attain-
ment. At the most basic level, individuals’ educational attainment in equilibrium can be
modeled as the outcome of a comparison between the opportunity costs of acquiring further
education and its expected returns (Becker, 1964, 1965). In practice, opportunity costs or
expected returns have been found to depend on the cognitive skills of a child (Bacolod and
Ranjan, 2008; Sawada and Lokshin, 2009), the age of school entry (Angrist and Krueger,
1992), family or community background (Tansel, 2002), school and class characteristics
(Altonji et al., 2005; Angrist and Lavy, 1999; Dee, 2005), and government policies (Duflo,
2004; Hanushek and Woessmann, 2006). Our findings suggests that available employment
opportunities for children are another important determinant of educational attainment.
Even if the higher income in mining districts enables households to invest in the educa-
tion of their children, the employment opportunities offered by gold miens seem to be
sufficiently large for the substitution effect to outweigh the income effect.
The reminder of this paper is structured as follows. The next section provides some
background on gold mining and its potential implications for educational attainment. Sec-
tion 3 describes the data. In Section 4 we introduce our empirical framework. Section 5
5

collects the main results and various extensions. We discuss the robustness of our results
in Section 6 and potential mechanisms in Section 7. Section 9 concludes.
2 Background
2.1 The process of gold mining
Gold is one of the world’s most economically important and versatile minerals. It can be
used for jewelery, for coinage, in electronics, and various other industrial applications. This
broad range of uses makes gold a highly valued commodity. At the same time, its rarity2
ensures that gold mining can be a profitable even for small-scale operations.
Gold is extracted from various ores that contain small if not minuscule amounts of gold
particles. Depending on the characteristics of a particular gold deposit, i. e., an expanse
of ores with a significant concentration of gold, different extraction methods are employed.
Some gold mines are exploited predominantly with capital intensive methods. In open pit
mines, for example, the ore is excavated from the hard rock with dynamite. The ore is
then transported with large trucks to be processed further using chemicals such as cyanide
to separate the gold particles from other materials.
Gold can also be mined with more labor intensive methods. In particular, miners involved
in placer mining use simple tools such as pans or sluices to extract gold from alluvial
deposits at, e. g., stream beds. This method relies on the fact that gold particles are
heavier than the host rocks and thus can be washed out.
Given that gold can be extracted with such relatively simple methods, small-scale (artisi-
nal) mining activities are particularly common around gold mines. In fact, even large and
capital-intensive mines provide opportunities for small-scale mining. For example, lower
grade ore is often discarded and used as mine fill by mining companies. The fill can be
2The concentration of gold in one ton of earth is about 0.005 grams (Eugene and Mujumdar, 2009).
6

further mined by artisinal miners. The amenability of gold mines to small-scale activities is
a notable feature given the importance of this form of mining in Africa and, more generally,
in the developing world. It is estimated that about 13 million people are directly involved
in small-scale mining globally; another 80-100 million depend in some indirect fashion on
this type of mining (Hentschel et al., 2003). A significant fraction of the small-scale miners
are engaged in the extraction of gold (Hilson, 2016).
2.2 The effect of gold mining on education
On the one hand, gold mines, as any type of mineral resources, can have a positive effect
on educational attainment by increasing household incomes. The higher incomes that can
be earned in the mining sector (compared to e. g. agriculture) should enable households
to keep their children in school (Weber-Fahr et al., 2002). On the other hand, gold mining
can have adverse effects on educational attainment through various channels. One obvious,
and as shown below, presumably the most relevant channel in our context, is that parents
may prefer to send their children to work for subsistence rather than to school. The
children themselves may also prefer to earn money immediately rather than to invest in
their education, possibly because they perceive the returns to education to be too uncertain.
Even if large mining companies do not employ children or untrained youth, the importance
of (often informal) small-scale mining for the excavation of gold implies that it is reasonably
easy for children to find employment in the production of gold.
Children are known to work either directly in the mines or in ancillary roles. Children
as young as three are employed to wash gold; from six years onward they may break
rocks; from 12 years onward they can work underground and do the same work as adults
(Hentschel et al., 2003). Ancillary roles include activities such as suppling provisions and
tools to the miners. These ancillary roles are assumed by both boys and girls. Thus, the
mining sector is not necessarily dominated by men even if work in the mines consist of hard
7

manual labor (ILO, 2007; Tolonen, 2014). In fact, in some countries women constitute the
majority in the mining sector; for example, Hentschel et al. (2003) note that 75% of the
workforce in the artisinal mining sector of Guinea are women. Young women and girls may
also be have opportunities for employment in sectors that are connected to gold mining
through forward or backward linkages, i. e. because of local multiplier effects of gold mines
(Moretti, 2010). Thus, any negative effect of mining on education could be observable for
both genders.
In addition to children and young adults working in mines and connected sectors rather
than attaining education, three possibly important alternative channels through which gold
mines may appear to have adverse effects on education are the following. First, the gov-
ernment may provide fewer educational facilities in mining districts; it may anticipate that
people living in mining districts have sufficient economic opportunities anyway and there-
fore are less in need of educational resources. Second, any negative relationship between
gold mines and education may be due to endogenous migration of less educated workers to
mining districts.3 That is, gold mining districts may have a higher share of less educated
inhabitants, not because inhabitants choose to acquire less education but because less ed-
ucated individuals are more likely to migrate into gold mining districts. Third, gold mines
may increase the likelihood of political conflicts and violence (Collier and Hoeffler, 2004,
2005; Berman et al., 2014). For example, conflicts may disrupt the education of children
by displacing their families. We explore these alternative channels below.
3It is, of course, also possible that migrants into mining districts are more educated than the locals(Loayza and Rigolini, 2016).
8

3 Data
3.1 Afrobarometer
To analyze the effect of gold mining on educational attainment, we rely on the fourth
wave of the Afrobarometer survey, which is an “independent, nonpartisan research project
that measures the social, political, and economic atmosphere in Africa”. The fourth wave
was conducted in 2008 and 2009 and covers altogether 20 sub-Saharan African countries.
Since we focus within-regional variation in the regressions, we drop two countries, Lesotho
and Cape Verde, from the sample given their small geographical size. Our final sample
thus includes 18 countries from all regions of Africa.4 The total number of observations is
24,866.5
We use the following question from the Afrobarometer to measure educational attain-
ment:
What is the highest level of education you have completed? (Q89).6
We code the different stages of educational attainment using discrete values ranging form
0 to 9.7
In Figure 1, we plot the distribution of the educational attainment of the 24,866 respon-
dents included in our sample. The median respondent has some but incomplete secondary
education. There is also a substantial fraction of respondents who have only primary ed-
ucation or no education at all. Figure 2 describes the age distribution of respondents.
4The countries are: Benin, Botswana, Burkina Faso, Ghana, Kenya, Liberia, Madagascar, Malawi,Mali, Mozambique, Namibia, Nigeria, Senegal, South Africa, Tanzania, Uganda, Zambia, Zimbabwe.
5This number is slightly lower than the full sample of 27,713 respondents. In addition to the droppingof Lesotho and Cape Verde, we also lose observations because of missing information on some respondent’seducational attainment, age, and because we are not able to match two districts in the Afrobarometer tothe shapefile data; see below for more information on this.
6Possible answers are: no formal schooling, informal schooling only (including Koranic schooling),some primary schooling, primary school completed, some secondary school/ high school, secondary schoolcompleted/high school completed, post-secondary qualifications, other than university e.g. a diploma ordegree from polytechnic or college, some university, university completed, post-graduate.
7We also use some further questions form the Afrobarometer. We describe these in the relevant sections.
9

The age distribution is interesting because we will subsequently relate gold mines during
adolescence to educational attainment. It is obvious from Figure 1 that the minimum age
to be eligible for participation in the survey is 18 years. Most respondents are nevertheless
quite young. The median respondent is 32 years old. There are, however, also some very
old respondents in the sample.
The 4th of the Afrobarometer also provides information on the geographical location of
a respondent. That is, we know her country, her “region”, which is the name used by the
Afrobarometer for the first-level administrative tier, and her “district”, which is the name
for the second-level administrative tier.
We use the information on the district to define the “neighborhood” of a respondent to
which we match the presence of gold mines during her adolescence. One drawback of this
definition is that districts can have different sizes8 and thus gold mines that are equally
far away from the actual location of a respondent may not always be classified in the same
way. Another drawback is that administrative borders may change. Thus, mines that are
classified as close according to contemporaneous borders because they are located in the
same district in which a respondent currently lives may have been in a different district
when the respondent was young. Related to this issue, the Afrobarometer only notes the
current district of a respondent, not the district when the respondent was young.
Despite these drawbacks, a definition of neighborhood based on district is useful. First,
even if districts can cover areas of different sizes, they are generally reasonably small and
capture the concept of neighborhood well. Second, administrative boundaries provide a
natural and “objective” measure of closeness. Third, there is considerable persistence in ad-
ministrative boundaries. Given that most respondents in the Afrobarometer are relatively
young, any border changes over time should affect only a small fraction of respondents. Fi-
8The minimum land are covered by a district in our sample is 2.4 km2 (Katutura East in the regionof Khomas, Namibia) while the maximum is 335,000 km2 (Tombouctou in Timbuktu, Mali). The mediandistrict area is 2,012 km2. Compare this to the area of Los Angeles county, which is 12,305 km2.
10

nally, educational facilities are likely planned and operated based on administrative bound-
aries such as districts.
3.2 Data on gold mines
We match the Afrobarometer data with data on the location (as indicated by longitude
and latitude coordinates) and dates of operation of a large share of current and historical
gold mines of commercial interest in Africa. This data is from MinEx Consulting, which
is a private mining consulting company. MinEx estimates that its data covers 99% of all
giant-sized deposits, 95% of all major deposits, 70% of the moderate deposits and 50% of
the minor deposits.9
Subfigure (a) of Figure 3 shows the location of the 359 gold mines included in our
dataset.10 There is clearly substantial variation across countries in the presence of gold
mines: some have many while others have none. In countries with gold mines, there is
also considerable variation at the within-country level.11 Subfigure (b) shows mines in a
particular region, Mashonaland West in Zimbabwe, and the district borders.
We project the latitude and longitude coordinates of the mines that were in operation in
a given year onto a district-level map (shapefile) of the countries included in our sample.12
We then match the mines data to the Afrobarometer data. Specifically, we calculate the
9The thresholds are: Minor ≥ 0.03 Moz (millions of ounces), Moderate ≥ 0.32 Moz, Major ≥ 2.24 MozAu, Giant ≥ 11.18 Moz Au, Supergiant ≥ 80.00 Moz Au.
10The original MinEx data has a larger coverage of mines. When constructing the dataset for thisstudy, we omit mines that are in countries not in our sample (except in one robustness test; see below fordetails). Of all mines noted in the MinEx data for the countries in our sample, we include those that havebeen discovered and not yet shut down as of 2015. (We include all discovered mines even if they havenot formally been started up because (informal) small scale mining might take place even before formalmining activities begin). We drop mines where we do not know the discovery year(i. e. mines for whichdiscovery year is missing in the MinEx data) and all mines where we know that they are closed as of 2015but do not know the exact closing date (i. e. mines for which shutdown year is missing). In other words,we include all discovered mines where it is not unambiguously clear that they have been shut down andassume that they were still in operation as of 2015.
11The mines also vary considerably in their size: of the 359 mines in our sample, 10.8% are classifed asminor, 28.4% as moderate, 31.8% as major, 24.8% as giant, and 4.2% as supergiant.
12The shapefile data is from the GADM database (www.gadm.org), version 2.5, July 2015.
11
year in which a particular respondent was 12 years old based on the Afrobarometer data
and then match the number of operating mines (and their various characteristics) in her
district in that year. We generally define an age of 12 years as adolescence of a respondent
(we explore the robustness of our results to other definitions of adolescence below).
The district names in the Afrobarometer and the names used in the shapefile to project
the mines coordinates are often different. Hence, to match both data sources, we use a
Google Maps routine to retrieve “characteristic” (as assessed by the Google Maps) longi-
tude and latitude coordinates for the district names in the Afrobarometer. We then project
these coordinates onto the shapefile and thus match the Afrobarometer district names with
the names used in the shapefiles. Visual inspection indicates that most matches are ac-
curate.13 Overall, of the 1,697 unique districts in the Afrobarometer, we include 1,669
districts in our regressions.
4 Empirical framework
We estimate specifications that relate educational attainment to the presence of mines
during adolescence. Our baseline model is:
yi,T = βGold minei,t + γr + γe + γt + εi,T , (1)
where yi,T is educational attainment of respondent i in the year T when the Afrobarometer
survey was taken. As educational attainment is a categorical dependent variable, we rely
13We found only one error. In the case of Mabule district in the Barolong region, Botswana, thegeocodes from Google Maps would have put the district in a different country than as indicated in theAfrobarometer (the problem was that there was a border town in South Africa with the same name as adistrict in Botswana; ostensibly, Google Maps confused the district in Botswana with the town in SouthAfrica). We drop this district from the sample. There was also one case where we could not matchdistricts in the Afrobarometer to the shapefile because of missing geocodes. Finally, some names in theshapefiles cannot be matched to the Afrobarometer districts due to border changes between the time ofthe Afrobarometer surveys and the date our shapefiles were drawn up (July 2015). We omit any mineslocated in district affected by such changes.
12

on ordered probit in the baseline regressions. In subsequent models, however, we use OLS
for simplicity (after confirming that the ordered probit and OLS results are similar).
Gold mine i,t is a dummy that is 1 if the district of a respondent had at least one gold mine
when she was 12, and 0 else. γr are region fixed effects (which when included encompass
the country fixed effects), γe are ethnic group fixed effects, and γt are time dummies for
the year of adolescence of a respondent (cohort fixed effects). Such cohort fixed effects are
important to account for the systematically increasing educational attainment over time,
i. e. younger respondents are more likely to be better educated due to general societal
trends. εi,T is the error term. We rely on heteroscedasticity-robust standard errors for
inference. We also cluster standard errors at the district level as this is the level at which
treatment varies in our context (Bertrand et al., 2004).
We hence identify the effect of gold mines in adolescence on contemporaneous educational
attainment while holding regional, ethnic group, and cohort effects constant. In particular,
by including region fixed effects we are able to control for any geographical features that
may be systematically related to educational outcomes and the presence of gold mines.
This is important because gold mines may be less likely to be discovered or relatively
unprofitable if they are located in remote areas. At the same time, educational attainment
in such regions may be lower for other reasons, for example because countries invest less
in education in regions that are remote. Similarly, ethnic group fixed effects account for
any systematic correlation between the education levels of different ethnicities and the
suitability of their settlement area for mineral resources or their propensity to migrate
toward mining districts.14 By accounting for such region- and ethnic-group specific features
through appropriate fixed effects, we can credibly relate gold mines during adolescence to
contemporaneous educational outcomes
14Note that we include separate dummies for respondents with non-standard responses, e. g. for thosewho do not know their ethnicities, refused to answer, etc. The results are similar if we drop these obser-vations.
13

One underlying assumption in this empirical design is that respondents in districts with
gold mines were more likely to work in the mining sector (and possibly in sectors connected
with the mining sector through upward or downward linkages when they were young).
While there is no data on employment histories in the Afrobarometer, this assumption is
plausible. Given the high level of spatial disaggregation by which we define neighborhood
and the importance of mines for the local economy in Africa, it is likely that at least some of
the respondents who had a mine in their district during adolescence worked in the mining
sector.
5 Baseline results
5.1 Main effects
Table 1 collects the baseline results. In model (I), we include country fixed effects. In
model (II), we replace the county fixed effects with region fixed effects (which encompass
the country fixed effects). Model (III) finally adds ethnic group fixed effects. All models
include cohort fixed effects. These first three models are estimated with ordered probit. In
model (IV), we re-estimate model (III) with OLS.
Overall, we find that the presence of (at least) one mine in one’s district during adoles-
cence reduces educational attainment by 0.11 points in the ordered probit regression. The
estimate is statistically significant at the 1% level. The OLS coefficient estimate, while not
directly comparable with the ordered probit estimates, is qualitatively similar and indicates
that mines reduce educational attainment on average by 0.21 points. One interpretation
of the magnitude of this estimate is, for example, that the presence of a mine leads one
in five respondents who would have otherwise completed secondary education to drop out
and end up with only some incomplete secondary education.
14

5.2 Extensions
5.2.1 Transition to higher educational stages
While the specifications reported in Table 1 estimate an average effect across all educa-
tional stages, gold mines presumably affect some stages more adversely than others. More
specifically, it is unlikely that the presence of gold mines at the age of 12 dissuades an
individual, who is otherwise able and qualified, from entering tertiary education or deters
university graduates from pursuing post-graduate studies. The economic opportunities
that gold mines offer may be more attractive for children and their parents at lower stages
of education; gold mines may have a more adverse effect on transition probabilities at these
stages. Moreover, an analysis of transition probabilities arguably allows for a meaningful
quantitative interpretation of the estimation results.
Hence, we estimate the following variants of Equation 1. Rather than a continuous
variable, we specify a binary dependent variable that is one if a respondent has achieved a
certain level of education and 0 else. First, we construct a dummy that is 1 if a respondent
has at least some informal (e. g. Koranic) schooling and 0 else and re-estimate equation
1 with this dummy as dependent variable. Next, we construct a dummy that is one if a
respondent has at least some formal primary education and 0 else and again re-estimate
Equation 1 with this dummy as dependent variable. We adopt this approach for all further
stages of education. These models allow us to asses at which educational stages gold mining
matters most.
The results are collected in Figure 4. They indicate that gold mining matters most
during the period between primary and secondary education. Specifically, gold mines have
the most adverse effect on the likelihood that a respondent attempts to pursue or completes
secondary education: the probability is about 6 percent lower. Gold mines have, however,
also large negative effects on the likelihood that primary education is completed or that
15

post-secondary (but not university) education is taken up. On the other hand, gold mines
do not affect the propensity of transitioning to university or post-graduate education.15
5.2.2 Gender-specific effects of gold mines
As discussed in Section 2.2, gold mines may adversely affect the educational attainment of
men and women in a similar fashion given that mining is not exclusively a male activity. On
the other hand, while the gap is narrowing, educational attainment of women is generally
lower in Africa. Thus, gold mining might carry a relatively smaller educational cost for
women: i. e., they may receive less education anyways and working in gold mining may
overall be preferable to, for example, agricultural employment.16
To explore possible gender-specific effects, we append Equation 1 with a dummy for
female respondents and an interaction between the female dummy and the gold mines
dummy. The sign and significance of the interaction effect indicates whether the education
of men or women is affected more adversely by gold mines during adolescence. The results
are collected in model (I) of Table 2. We find that the dummy for female respondents is
significantly negative, reflecting the fact that there still remains a gender gap in educational
attainment in Africa. However, the interaction effect is insignificant, which suggests that
the educational cost of gold mining affects men and women equally.
5.2.3 The size of gold mines
Another important question is whether the educational cost of gold mines is mostly confined
to smaller mines. Answering this question is important because it helps us to understand
further why gold mines have adverse educational effects (it is thus related to the question
15Note that these results are not an artifact of defining adolescence at age 12. We get similar results ifwe use older ages, e. g. 18, to define adolescence. These results are available upon request.
16In fact, Tolonen (2014) finds that gold mines improve gender equality in Africa. Kotsdam and Tolonen(2016) also show that mine openings cause a shift in the employment pattern, with women switching fromthe agricultural to the service sector.
16

of transmission channels which we explore in more detail further below). Specifically, given
the importance of artisinal mining for the excavation of gold and the relatively low level
of governmental monitoring of these activities, children and young adults may easily find
employment in smaller gold mines as artisinal miners. Larger gold mines, in contrast, are
likely exploited by corporations, which may be scrutinized more heavily; the corporations
themselves may also prefer to hire a better trained and older workforce. If the susceptibility
of gold to small-scale mining is the reason for why gold mines have adverse educational
effects, this would validate the interpretation that the direct employment opportunities
offered by gold mines are an important reason for their adverse effect on educational
attainment.
To explore whether the educational impact of gold mining varies according to the size
of a mine, we report in model (II) of Table 2 estimates for dummy variables indicating
“smaller” (mines that are classified either as minor or moderate) and “larger” gold mines
(mines that are classified as either major, giant, or supergiant).17 We generally find that
the adverse effect of gold mining is particularly pronounced for smaller mines. This result
suggests that the amenability of gold to artisinal small-scale mining is an important reason
why gold mines affect educational attainment negatively. We also observe a negative,
albeit smaller and insignificant, coefficient estimates for larger mines. This negative yet
smaller effect for larger mines is consistent with the interpretation that the employment
opportunities in gold mining are responsible for the lower educational attainment. First,
artisinal mining takes place at larger mines as well, for example if discarded minefill is
further exploited by artisinal miners. Moreover, there may also be indirect effects on
children in districts with large gold mines due to employment opportunities in sectors that
are connected to the mining sector through forward and backward linkages.
17Note that since a district can have multiple mines, both dummies can simultaneously be one for agiven respondent.
17

5.2.4 The price of gold, frictions in educational choices, and income and sub-
stitution effects
To further understand the relationship between gold mining and educational outcomes,
we explore the impact of the price of gold on educational attainment. On the one hand,
if the gold price is high, gold mining should become more attractive relative to going to
school in mining districts. Wages in the mining sector should increase and artisinal miners
should be able to sell their produce for a higher price. On the other hand, the income
effect may also outweigh the substitution effect. That is, an increase in the price of gold
may raise household income sufficiently for parents to be able to forgo the extra income
from sending their children to work, allowing them instead to send their children to school.
Alternatively, educational choices may be subject to frictions. Once parents have decided
to send their children to work rather than to school, the current price of gold, and thus
any variation in the returns to gold mining, may not matter much at the margin.
We explore this question by extending Equation 1 with a continuous variable measuring
the price of gold when a respondent was in adolescence18 and an interaction effect between
gold mines and the price of gold. The results are collected in model (II) of Table 2 and
suggest that the contemporaneous price of gold is unimportant for educational attainment.
That is, the interaction effect between gold mines and the price of gold is insignificant. The
main effect for the presence of gold mines continues to be negative and of the same order of
magnitude as in the baseline regressions.19 These results suggest that educational choices
are either subject to some frictions and the income effect following an increase in gold
prices does not outweigh the substitution effect.
18The data is from the World Bank’s Commodity Price Data Database, Feb. 04, 2016.19The significance levels on the main effect by themselves are not informative about whether gold mines
have a significant effect as the marginal effect of gold mines and the associated standard errors changewith the value of for the gold price.
18

5.2.5 Other mineral resources
To understand the baseline results further, we explore the effect of minerals other than gold
on educational attainment. The discussion in Section 2 suggests that, in general, mineral
resources may have either a negative or a positive effects on educational attainment: the
income effect likely works to increase households’ demand for the education of their children
while the substitution effect incentivizes households to send their children to work in the
mining sector.
For gold mines, we offered a number of reasons why the substitution effect could outweigh
the income effect – in particular, that children can find employment in the gold mining
sector with relative ease given the amenability of gold mining to artisinal methods. For
other types of mines, the overall effect may be different. If a mineral resource is produced
with capital-intensive methods and can therefore only be exploited by large corporations,
children may be unable to find employment in the relevant mines.
To explore this issue, we report in Table 3 regression results similar to the baseline
specifications but with three alternative dummy variables. The first dummy variable, Only
non-gold mines, is one when a respondent had a non-gold mine but no gold mine in her
district during adolescence.20 The second variable, At least one non-gold mine, is one if a
respondent had at least one non-gold mine in her district at adolescence (irrespective of the
number of any additional gold mines). Finally, Exclusively gold mine is one if a respondent
only had gold mines but no other types of mines in her district during adolescence. The first
two dummy variables thus allow us to explore the effect of non-gold mines on educational
attainment while the third enables us to confirm that it is indeed gold rather than other
mineral resources that is responsible for the baseline results.
20We consider the following minerals: Andalusite, Asbestos, Barium, Calcium, Chromium, Cobalt, Cop-per, Diamonds, Flourine, Fluorite, Gold, Graphite, Lead, Manganese, Mercury, Mineral Sands, Molyb-denum, Nickel, Niobium, PGE, Platinum, Rare Earths, Ruby, Sapphire, Silver, Sulphur, Tantalum, Tin,Tungsten, Uranium, Vermiculite, Zinc, Zircon.
19

We find that the first two dummies are positive and statistically insignificant. This
suggests that non-gold mines have no adverse effect on educational attainment. In contrast,
respondents who only had a gold mine in their district during adolescence have lower
educational attainment. Overall, these results provide further evidence that the negative
effect of mining is specific to gold and comes about because its production is amenable to
artisinal methods.
6 Robustness
6.1 Different years of adolescence
The baseline results suggest gold mines have a negative effect on educational attainment.
However, these results may simply be a statistical artifact due to our particular definition
of adolescence, which we assumed to be at age 12. To confirm that the results are robust
to different definitions of adolescence, we re-estimate model (IV) in Table 1 after matching
the number of mines at age 1 to 50. That is, we explore the presence of mines at age 1,
2, ..., 50 on educational attainment at the time the 4th wave of the Afrobarometer was
conducted.21
We plot the coefficient estimates for these 50 models in Figure 5. This figure confirms
that the baseline results are not a artifact of defining adolescence at the age of 12. In fact,
the presence of mines at age 1 up to age 37 years result in a similarly negative coefficient
estimate. Only when we focus on very old respondent, we begin to observe insignificant
coefficient estimates.
The explanation for why the coefficient remains stable for an adolescence year as young
as 1 – even though at this age no educational decisions should be made – and up to an age
21Respondents that are younger in 2008/9 than the age defined as adolescence year are not included inthe sample used for a particular regression.
20

of 37 – even though it is likely that no further investments in education are undertaken at
this age – is that mines are persistent. A mine that has existed when a respondent was 12
generally continues to exist when she was 37. More specifically, around 84% of respondents
that had a mine in their district when they were young also had a mine in 2007, i. e. shortly
before the Afrobarometer surveys were taken. In line with this interpretation, we show
below (in Section 6.3) that respondents who had no mines in their district only after they
had passed adolescence do not have lower educational than a generic respondent.
6.2 Dropping countries
Another concern with the baseline estimates is that they are driven by one particular
country. According to Figure 3, gold mines seem to be particularly prevalent in a few
countries, for example South Africa, Botswana, and Ghana. Even though we rely on
within-region variation for identification, our estimates could be driven by a particular
country, limiting the external validity of our findings. To address this concern, we re-
estimate our preferred model (model IV in Table 1) after dropping in turn each country
otherwise included in the sample.
The results are collected in Figure 6. This figure collects the 18 coefficient estimates
and 95% confidence interval after dropping each of the countries in turn. The coefficient
estimates are remarkably stable. Dropping Burkina Faso, Mali, or Uganda increases the
coefficient slightly, but it remains significantly negative. Overall, these results suggest that
the baseline results are not only due to one country.
6.3 Placebo tests
One further strategy to validate that the effect of gold mines on educational attainment
found in the baseline regressions is not spurious is placebo tests. In this section, we imple-
21

ment two types of placebo tests. First, we explore educational attainment of respondents
whose districts had no mines when they were in adolescence but which bordered districts
with mines. If the baseline estimates are biased due to omitted variables, we should ob-
serve a similarly low level of educational attainment for such respondents if any omitted
variables are spatially correlated.22
We construct a dummy variable that is one for respondents who had no mines in their
district when they were in adolescence but whose district bordered a mining district. We
ignore country borders when identifying neighboring mines (i. e. we include mines in neigh-
boring district that are in another country) and also consider mines in African countries
that are otherwise not included in our sample because they are not covered in by the
Afrobarometer (i. e., mines just across the border).
We relate this dummy variable to educational attainment by estimating variants of Equa-
tion 1. Model (I) of Table 4 only includes the dummy for mines in neighboring districts
during adolescence and is estimated with a sample that includes only respondents who
had no mines in their districts during adolescence. This model thus compares the educa-
tional attainment of respondents without any mines during adolescence in their own and
in neighboring districts with the attainment of respondents who had no mines in their own
district but had a mine in at least one neighboring district. Model (II) includes all districts
and controls both for the dummy for mines in one’s own district and the dummy for mines
in neighboring districts during adolescence. Both sets of models indicate that educational
attainment of respondents in non-mining districts that neighbor mining districts is not
significantly different than of respondents in generic non-mining districts. This suggests
that our baseline results are not due to (spatially-correlated) omitted variables.23
22Note that lower educational attainment in non-mining districts that border mining districts maynot necessarily be due to omitted variables. It is also possible that mines have spillovers across districtboundaries.
23A fortiori, these results also suggest that mines have no significant spillovers across district boundaries.This is in line with the results in Loayza and Rigolini (2016), who find that the effects of mines are highlylocal.
22
The second placebo test explores whether respondents who had no gold mines in their
district during adolescence but have mines in 2007, i. e. shortly before the Afrobarometer
survey was conducted, have lower educational attainment than respondents that neither
had a mine during adolescence nor in 2007. If there are unobserved district-specific vari-
ables that are systematically related to the prevalence of mines and educational attainment
within a district, respondents who only had a mine in their district in 2007 (i. e. after they
had passed adolescence) should still have lower educational attainment than respondents
that had no mines in their district during their adolescence nor in 2007.
We hence construct a dummy variable that is 1 if a respondent has a mine in 2007 but not
during her adolescence and relate it to her educational attainment. The results are collected
in models (III) and (IV) of Table 4. Model (III) only includes this dummy and is estimated
with a sample that omits all respondents who had gold mines in their adolescence. We
find no significant effect of “current” gold mines (i. e. in 2007) on educational attainment.
Model (IV) is estimated with the full sample and includes both the dummy for mines in
adolescence and in 2007. As before, we find that respondents with gold mines in their
adolescence have lower educational attainment. Respondents who have only currently a
gold mine in their district, on the other hand, do not display lower educational attainment.
6.4 Replication with Development and Health Surveys data
In this section, we validate the baseline results further by estimating Equation 1 with
data from a different source than Afrobarometer. Specifically, we use data on educational
attainment of women and men from the Development and Health Surveys (DHS).
One difference between the DHS and the Afrobarometer is that the DHS does not record
the district of a respondent. Instead, it provides geocodes for the location of a respondent’s
sampling cluster.24 We construct buffers with a radius of 30 km around each sampling
24There are, however, some minor and random displacements to protect the anonymity of respondents.
23

cluster and match the mining data to the buffers. We define a respondent as affected by a
gold mine if there was a gold mine within 30 km of the sampling cluster of a respondent
when that respondent was in adolescence. A radius of 30km translates to an area of about
2800 km2, which is roughly similar to the median area of the districts in the Afrobarometer
(about 2,012 km2). The DHS data hence allows us to check whether the results are robust
(i) to the use of a data source other than the Afrobarometer and (ii) to a different definition
of neighborhood than one based on district boundaries.
We attempted to replicate the Afrobarometer sample as closely as possible and thus limit
the DHS data to those countries that are also covered by the 4th wave of the Afrobarom-
eter. However, the DHS sample covers only 16 of these countries; it does not provide data
for two countries that are included in the Afrobarometer (South Africa and Botswana).
The DHS provides information on respondent’s who are aged less than 18 years. As some
of these respondents may be still in school, we drop them from the sample (recall that
the Afrobarometer also only includes respondents above 18). Educational attainment is
coded in the DHS into six categories, ranging from no education, incomplete primary edu-
cation, complete primary education, incomplete secondary education, complete secondary
education, and higher education.
The results are collected in Table 5. The specifications replicate those of the baseline
models reported in Table 1. Specifically, Model (I)-(III) are estimated with ordered probit
while model (IV) is estimated with OLS. Model (I) only includes country fixed effects,
model (II) replaces the country fixed effects with region fixed effects, i. e. the region in
which a DHS respondent lives, and model (III) additionally includes ethnic group fixed
effects as noted in the DHS. Model (IV) also includes region and ethnic group fixed effects.
While quantitative comparisons are difficult given the different scaling of the educational
attainment variable, the results are qualitatively similar to the those from the baseline
24

regressions. We find that gold mines during adolescence have a significantly negative effect
on educational attainment of adults.
7 Mechanisms
The results reported above suggest that mining has a negative effect on educational attain-
ment. As argued, the most important channel is likely that respondents decide to work in
the mining sector and in turn neglect their education. However, there are further channels
that may also be important. In this section, we explore three alternative channels and
asses to what extent they can explain the baseline findings.
7.1 Gold mines and contemporaneous public goods
Besides respondents preferring to work and thus dropping out of school, gold mines may
have a negative effect on educational attainment because the government provides fewer
public goods, in particular schools, in mining districts. We explore the importance of this
alternative transmission channel by relating the presence of gold mines around 2007, i. e.
shortly before the 4th wave of the Afrobarometer was taken, to the presence of public goods
in 2008/9. If governments provide fewer public goods, notably schools, to districts with
mines, we should observe a negative correlation between whether a district had a mine
around 2007 and public goods provision. The results are collected in Table 6. Overall,
there is no evidence that contemporaneous public goods provision is lower in districts with
gold mines. Districts with gold mines are neither more or less likely to have a school, a
health clinic, a sewage system, an electricity grid, or a post office.
Another test for this transmission channel is to control for the presence of public goods
during adolescence. However, the Afrobarometer does not provide such data and thus
we cannot implement this strategy. As an alternative, we control for contemporaneous
25

public goods provision in a respondent’s district. Contemporaneous public goods may
be a good proxy for public goods during adolescence if there is some persistence in their
provision. Thus, we include in model (V) of Table 6, the public goods as covariates and
estimate the baseline model with the full sample. However, one problematic feature of this
model is that the full sample includes individuals that are very old. Contemporaneous
public goods may be an imperfect proxy for public goods during adolescence particularly
for these respondents. Therefore, we report in model (VI) estimates where we limit the
sample to the set of respondents that were in adolescence after 1997, i. e. to those where
were 12 years old at most 10 years before the surveys were taken.
The results from model (V) and (VI) in Table 6 indicate that there is a strong correlation
between the presence of public goods, notably schools, in a respondents neighborhood and
her educational attainment. However, the inclusion of the variable measuring whether pub-
lic goods were present does not attenuate the negative coefficient estimate for gold mines.
These results suggest that the negative effect of gold mines is not due to underinvestments
by the government.
7.2 Endogenous migration
Another potentially important channel is that individuals who are in search of employment
migrate to mining sectors. It is possible that migrants are relatively less educated than the
natives. If this would be the case, then we may observe a negative relationship between
mines and the educational attainment of some respondents not because mines lead children
to drop out of school, but rather because they attract relatively uneducated individuals
from other regions.
The Afrobarometer provides no information on whether a respondent migrated to her
district. However, we can explore this issue by matching the self-described ethnic group of
a responded from the Afrobarometer to data on the native homelands of African ethnicities
26

according to Murdock (1959).25 The idea is that respondents who belong to one of the
native groups of the district are less likely to have migrated due to the presence of mines
while respondents with a non-native ethnicity are more likely to have done so. Thus, by
focusing on whether a respondent belongs to the native ethnic group we can rule out, to
some extent, this alternative interpretation.26
Table 7 collects regression results that operationalize this strategy. In model (I), we only
add to model (IV) in Table 1 a dummy for whether a respondent’s ethnicity matches with
one of the native groups of her district (termed ethnic homeland). As before, we find that
gold mines have a negative effect on educational attainment. Interestingly, we also observe
that natives are relatively less educated than respondents who are not natives to a district.
In model (II), we include an interaction of the dummy for gold mines with the one for ethnic
homeland. This allows us to explore whether gold mines have a larger effect on the eduction
of non-natives. Such a larger effect would be consistent with endogenous migration of less
educated non-natives to mining districts. However, we observe the opposite. While the
interaction effect is insignificant, it is negative. This suggest that gold mines, if at all,
affect the educational attainment of natives more adversely than that of non-natives.
Model (IV) and (V) re-estimate the baseline model with subsamples of natives and
non-natives. The idea is to explore whether the adverse effect of mines are higher among
natives or non-natives. We find that mines reduce educational attainment by 0.315 points
for natives but by only 0.129 points for non-natives. These results are consistent with those
of model (II): mines affect the educational attainment of natives more adversely. Overall,
these findings indicate that endogenous migration is likely not responsible for the negative
effect of mining on educational attainment.
25We rely on shapefile data provided by Nunn and Wantchekon (2011) and match ethnic group namesin Murdock (1959) to the in Afrobarometer using data provided by Deconinck and Verpoorten (2013).
26We acknowledge that this strategy does not rule out endogenous migration at very low levels ofgeography, i. e. that relatively uneducated natives migrate within their homeland from non-mining tomining districts.
27

7.3 Mineral resources, conflicts, and education
As discussed previously, a large literature argues that mineral resources facilitate civil wars
and other forms of violent conflicts (Collier and Hoeffler, 2004, 2005; Berman et al., 2014).
Resources may be a tempting target for predatory political groups. They may also enable
rebels or the state to fund violent campaigns. In turn, it is likely that violent conflicts
cause disruptions to the education of children. Hence, any negative relationship between
gold mining and educational attainment may not come about because children prefer to
work in sectors related to mining, but because the presence of gold deposits facilitates
conflicts.
To explore this channel, we match geocoded data on violent conflicts to the Afrobarom-
eter data. We use the 6th version of the ACLED (Armed Conflict Location and Event
Data Project) dataset. This dataset provides information on “the dates and locations of
all reported political violence and protest events in over 60 developing countries” from 1997
to 2015. We project all battles and the number of fatalities recorded in the dataset on a
district-level shapefile covering the countries in our sample.27 We then note whether the
district of a given respondent experienced at least one battle when she was in adolescence
(aged 12) as well as the total number of fatalities in that year.
We then explore the relationship between gold mining, conflicts, and educational attain-
ment by estimating variants of Equation 1 in Table 1. The results are collected in Table
8. Since the ACLED data begins only in 1997, we have no information on conflicts for
respondent who were in adolescence before this year. Hence, older respondents are dropped
in the regressions reported in Table 8 and the final sample is substantially smaller than in
the baseline regressions.
27As noted in the description of the dataset, the ACLED also collects information on conflict-relatedevents other than battles, for example protests, the setting up of bases by warring parties, etc. We omitthese non-battle related events when defining the conflict variable.
28

In model (I), we explore whether respondents where more likely to experience a conflict in
their district during their adolescence when there was a gold mine in the same district. The
purpose of this model is to establish whether conflicts are more likely in districts with gold
mines. In model (II), we explore, as in the baseline regressions, the relationship between
gold mines during adolescence and educational attainment, but additionally control for
any conflicts in the year of adolescence. If the negative effect of gold mines on educational
attainment is in effect due to the higher propensity of conflicts in mining districts, the
effect of gold mines on education should become insignificant once we explicitly control for
conflicts. In model (III), we extend model (II) and additionally control for the intensity of
a conflict by including the number of fatalities in a respondent’s year of adolescence.
The results indicate that there is no significant relationship between gold mines and the
incidence of conflicts (model I). In line with this result, we find that the negative effect of
gold mines on educational attainment remains negative if we control for conflicts (model
II) and their intensity (model III). We also observe a negative but insignificant effect of
conflicts on educational attainment. Overall, these results imply that the negative effect
of gold mines found in the baseline regressions is not due a higher incidence of conflicts.
8 Long-run effect of gold mines on economic outcomes
To complement our previous findings regarding educational attainment, we explore in this
section whether respondents in mining-districts are at least economically better off in the
long-run than respondents in non-mining districts even if they have lower educational
attainment. That is, if the income from gold mining is sufficiently large or persistent,
working in the mining sector or related sectors rather than acquiring further education
may be the financially dominant strategy even in the long-run.
29

In order to explore this issue, we relate the dummy for gold mines during adolescence
to contemporaneous economic conditions of a respondent. Specifically, we explore how
an Afrobarometer respondent who had gold mines in her district during adolescence (i)
assesses her current living conditions relative to other co-nationals, (ii) how she assesses her
living conditions as such, and (iii) how she assesses the present economic conditions in her
country. The results are collected in Table 9. We find that respondents with mines during
adolescence do not view their living conditions as worse than that of other co-nationals
(model I). However, it is likely that respondents think of their immediate neighborhood,
i. e. other inhabitants of their district, when asked to compare their living conditions to co-
nationals. Hence, their assessment of their absolute living conditions is more informative.
Indeed, we find in model (II) that respondents with mines during adolescence are more
likely to assess their current living conditions as unsatisfactory; the estimate is negative
and almost significant.
In line with this result, we also find that respondents who had mines in their districts
during their adolescence perceive the current economic conditions in their country as worse
than other respondents in the same country (model III). While the Afrobarometer question
explored in model (III) relates to country-level developments, the response is presumably
informed by what respondents experience in their immediate neighborhood. Overall, these
results suggest that in the long-run, respondents with gold mines in their youth do not
fare better economically than generic respondents. In fact, the long-run effects of gold
mines seems to be negative. The lower level of educational attainment and any broader
long-run costs that insufficient education may have is not compensated by better economic
conditions during adulthood.
30

9 Conclusion
There is a ongoing debate on whether mineral resources help or hinder development. Skep-
tics tend to point toward adverse terms of trade effects and heightened political instability
as potentially negative effects. More optimistic observers emphasize the ability of the min-
eral resource sector to generate income and thereby to lift some of the poorest countries out
of poverty. This paper contributes to this debate by documenting that mineral resources,
specifically gold mines, have adverse effects on educational attainment and, even if they
may increase incomes in the short-run, do not persistently improve economic conditions.
These results suggest that while mineral resource booms may very well be a boon for
Africa, there are definitely some costs as well. Governments should thus adopt policies
that mitigate the negative consequences on educational attainment (and possibly also on
other socio-demographic outcomes). It appears that child labor in the mining sector, even
if it may appear to children and their parents as more useful than going to school, does not
pay off in the long-run. Besides the obvious humanitarian arguments against child labor,
this economic rationale should provide further incentives to outlaw this practice.
Our results indicate furthermore that especially small-scale and artisinal mining, which is
prevalent in gold production, is not an economic activity that can provide poor households
with sustainable income. This is an important results given that some observers view
it as a particularly promising form of mining, one that is decentralized and can ensure
subsistence for low income households in developing countries (Economist, 2016; Hilson,
2016). Indeed, many African governments have recently adopted measures to discourage
this type of mining. While these measures have provoked criticism and more often than
not were adopted for suspect reasons, our findings indicate that such policies may have
some, even if unintended, merits.
31

One important limitation of our study is the available data. For example, the evidence we
provide for the main transmission channel, that the employment opportunities offered by
gold mines incentivize parents to neglect the education of their children, is mostly indirect
and circumstantial, i. e. by ruling out competing channels. The reason why we cannot
provide more direct evidence is that there is no detailed data available on educational and
employment histories for Africa. One avenue for future research in this area would be to
address such data limitations. In particular, collecting survey data data on how individuals
progress through the various educational stages and transition to employment may lead to
further important insights.
Acknowledgments
Funding by Sida-SAREC within the project Fiscal Capacity and Democracy in Developing
Countries is gratefully acknowledged.
32

References
AfDB, OECD, UNDP, and ECA (2013). African Economic Outlook: structural transfor-
mation and natural resources.
Altonji, J., T. Elder, and C. Taber (2005). Selection on observed and unobserved variables:
assessing the effectiveness of Catholic schools. Journal of Political Economy 113, 151–
184.
Angrist, J. D. and A. B. Krueger (1992). The effect of age at school entry on educational
attainment: an application of instrumental variables with moments from two samples.
Journal of the American Statistical Association 87, 328–336.
Angrist, J. D. and V. Lavy (1999). Using Maimonides’ rule to estimate the effect of class
size on scholastic achievement. Quarterly Journal of Economics 114, 533–575.
Aragon, F. M. and J. P. Rud (2013). Natural resources and local communities: evidence
from a Peruvian gold mine. American Economic Journal: Economic Policy 5, 1–25.
Auty, R. (2001). The political economy of resource-driven growth. European Economic
Review 45, 839–846.
Bacolod, M. P. and P. Ranjan (2008). Why children work, attend school, or stay idle:
the roles of ability and household wealth. Economic Development and Cultural Change,
791–828.
Baskaran, T. and A. Bigsten (2013). Fiscal capacity and government accountability in
sub-Saharan Africa. World Development 45, 92–107.
Becker, G. S. (1964). Human capital: a theoretical and empirical analysis with special
reference to education. New York: Columbia University Press.
33

Becker, G. S. (1965). A theory of the allocation of time. Economic Journal 75, 493–517.
Berman, N., M. Couttenier, D. Rohner, and M. Thoenig (2014). The mine is mine! How
minerals fuel conflicts in Africa. CEPR Discussion Paper no 10089.
Bertrand, M., E. Duflo, and S. Mullainathan (2004). How much should we trust differences-
in-differences estimates? Quarterly Journal of Economics 119, 249–274.
Bevan, D., P. Collier, and W. Gunning (1999). The political economy of poverty, equity,
and growth: Nigeria and Indonesia. Oxford: Oxford University Press.
Bhattacharyya, S. and R. Hodler (2009). Natural resources, democracy and corruption.
European Economic Review 54, 608–621.
Brunnschweiler, C. N. and E. H. Bulte (2008). The resource curse revisited and revised: a
tale of paradoxes and red herrings. Journal of Environmental Economics and Manage-
ment 55, 248–264.
Calder, J. (2014). Administering fiscal regimes for extractive industries : a handbook.
Washington, D.C.: IMF.
Chuhan-Pole, P., L. Christiaensen, M. Angwafo, M. Buitano, A. Dennis, V. Korman,
A. Sanoh, and X. Ye (2013, April, Vol. 7). Africa’s pulse. World Bank.
Collier, P. and A. Hoeffler (2004). Greed and grievance in civil war. Oxford Economic
Papers 56, 563–595.
Collier, P. and A. Hoeffler (2005). Resource rents, governance and conflict. Journal of
Conflict Resolution 49, 625–633.
Corden, W. M. (1984). Booming sector and dutch disease economics: survey and consoli-
dation. Oxford Economic Paper 36, 359–380.
34

Deconinck, K. and M. Verpoorten (2013). Narrow and scientific replication of ”‘the slave
trade and the origins of mistrust in Africa”’. Journal of Applied Econometrics 28, 166–
169.
Dee, T. S. (2005). A teacher like me: does race, ethnicity, or gender matter? American
Economic Review 95, 158–165.
Duflo, E. (2004). The medium run effects of educational expansion: Evidence from a
large school construction program in Indonesia. Journal of Development Economics 74,
163–197.
Economist (2016). In praise of small miners. Online publication, retrieved on
16th May 2016 (http://www.economist.com/news/middle-east-and-africa/
21698262-boom-artisanal-mining-offers-lessons-development-praise-small-miners).
Eugene, W. W. L. and A. S. Mujumdar (2009). Gold extraction and the recovery processes.
Technical report, National University of Singapore, M3TC Report.
Fasano, U. (2002). With open economy and sound policies, U.A.E has turned oil “curse”
into a blessing. IMF Survey. October 21, p. 330-332.
Gylfason, T. (2001). Natural resources, education, and economic development. European
Economic Review 45, 847–859.
Hanushek, E. A. and L. Woessmann (2006). Does educational tracking affect performance
and inequality? Differences-in-differences evidence across countries. Economic Jour-
nal 116, C63–C76.
Hentschel, T., F. Hruschka, and M. Priester (2003). Artisinal and small-scale mining:
challenges and opportunities. Technical report, International Institute for Environment
and Development and World Bank Buisness Council for Sustainable Development.
35

Hilson, G. (2016). Artisanal and small-scale mining and agriculture: exploring their links
in rural sub-Saharan Africa. iied Issue Paper March 2016.
Hodler, R. (2006). The curse of natural resources in fractionalized countries. European
Economic Review 50, 1367–1386.
Humphreys, M., J. D. Sachs, and J. E. Stiglitz (2007). Escaping the resource curse, Chapter
Introduction: what is the problem with natural resource wealth? New York: Columbia
University Press.
ILO (2007). Girls in mining: research findings from Ghana, Niger, Peru and the United
Republic of Tanzania. International Labour Organization Working Paper.
James, A. (2015). The resource curse: a statistical mirage. Journal of Development
Economics 114, 55–63.
Jensen, N. and L. Wantchekon (2004). Resource wealth and political regimes in Africa.
Comparative Political Studies 37, 816–841.
Knutsen, C. H., A. Kotsadam, E. H. Olsen, and T. Wig (2016). Mining and local corruption
in Africa. American Journal of Political Science (forthcoming).
Kotsdam, A. and A. Tolonen (2016). African mining, gender, and local employment. World
Development 83, 325–339.
Leite, C. and J. Weidmann (2002). Does mother nature corrupt? Natural resources,
corruption, and economic growth. In G. T. Abed and S. Gupta (Eds.), Governance,
corruption, and economic performance, pp. 159–196. Washington, D. C.: International
Monetary Fund.
Loayza, N., A. Mier y Teran, and J. Rigolini (2013). Poverty, inequality, and the local
natural resource curse. IZA discussion paper 7226.
36

Loayza, N. and J. Rigolini (2016). The local impact of mining on poverty and inequality:
evidence from the commodity boom in Peru. World Development 84, 219–234.
Lujala, P., N. P. Gleditsch, and E. Gilmore (2005). A diamond curse? Civil war and a
lootable resource. Journal of Conflict Resolution 49, 538–562.
Mehlum, H., K. Moene, and R. Torvik (2006). Institutions and the resource curse. Eco-
nomic Journal 116, 1–20.
Moretti, E. (2010). Local multipliers. American Economic Review (Papers & Proceed-
ings) 100, 373–377.
Murdock, G. P. (1959). Africa: Its people and their culture history. New York: McGraw-
Hill.
Nunn, N. and L. Wantchekon (2011). The slave trade and the origins of mistrust in Africa.
American Economic Review 101, 3221–3252.
Ross, M. L. (2004a). Does taxation lead to representation. British Journal of Political
Science 34 (2), 229–249.
Ross, M. L. (2004b). What do we know about natural resources and civil war? Journal of
Peace Research 41, 337–356.
Sachs, J. D. and A. M. Warner (1995). Natural resource abundance and economic growth.
Mimeo (Harvard University).
Sarraf, M. and M. Jiwanji (2001). Beating the resource curse: the case of Botswana. World
Bank Environmental Economics Series.
Sawada, Y. and M. Lokshin (2009). Obstacles to school progression in rural Pakistan: An
analysis of gender and sibling rivalry using field survey data. Journal of Development
Economics 88, 335–347.
37

Stokke, H. E. (2008). Resource boom, productivity growth and real exchange rate dynamics
– a dynamic general equilibrium analysis of South Africa. Economic Modellin 25, 148–
160.
Tansel, A. (2002). Determinants of school attainment of boys and girls in Turkey: indi-
vidual, household and community factors. Economics of Education Review 21, 455–470.
Tolonen, A. (2014). Local industrial shocks, female empowerment and infant health: evi-
dence from Africa’s gold mining industry. Mimeo (University of Gothenburg).
van der Ploeg, F. (2011). Natural resources: curse or blessing? Journal of Economic
Literature 49, 366–420.
Weber-Fahr, M., J. E. Strongman, R. Kunanayagam, G. McMahon, and C. Sheldon (2002).
Mining. In J. Klugman (Ed.), A sourcebook for poverty reduction strategies, Chapter 25.
Washington, D.C.: World Bank.
Wilson, N. (2012). Economic booms and risky sexual behavior: evidence from Zambian
copper mining cities. Journal of Health Economics 31, 797–812.
38

Table 1: Gold mines during adolescence and educationaloutcomes, baseline results
(I) (II) (III) (VI)
Gold mine -0.133*** -0.083* -0.119** -0.213***
(0.045) (0.048) (0.047) (0.072)
Estimation method Orderedprobit
Orderedprobit
Orderedprobit
OLS
Cohort FE Yes Yes Yes Yes
Country FE Yes Yes Yes Yes
Region FE No Yes Yes Yes
Ethnic group FE No No Yes Yes
Countries 18 18 18 18
Districts 1669 1669 1669 1669
N 24866 24866 24866 24866
Notes: This table shows ordered probit and OLS regression results that relate a categorical variablemeasuring educational outcomes of an Afrobarometer respondent against a dummy for whetherthere was a gold mine in the respondent’s district when she was in adolescence (at age 12).Education is classified from no formal or informal education (0) to post-graduate (9). Model (I)-(III) are estimated with ordered probit. Model (IV) is estimated with OLS. Standard errors inparentheses. Standard errors are clustered at the district level and robust to heteroscedasticity.Stars indicate significance levels at 10% (*), 5% (**) and 1%(***).
39

Table 2: Gold mines during adolescence and ed-ucational outcomes, heterogeneous ef-fects
(I) (II) (III)
Gold mine -0.219*** -0.264
(0.082) (0.170)
Female -0.598***
(0.022)
Gold mine × Female 0.022
(0.096)
Small mine -0.328***
(0.107)
At least major mine -0.102
(0.073)
Gold mine × Price 0.010
(0.040)
Estimation method
Cohort FE Yes Yes Yes
Country FE Yes Yes Yes
Region FE Yes Yes Yes
Ethnic group FE Yes Yes Yes
Countries 18 18 18
Regions 1669 1669 1669
N 24866 24866 23188
Notes: This table shows OLS regressions that relate a categorical variable mea-suring educational outcomes of an Afrobarometer respondent to a dummyvariable for whether there was a gold mine in the respondent’s district whenshe was in adolescence (at age 12). We allow for heterogeneous effects ofmines according to whether a respondent is a woman or a man (model I),according to the size of a mine (model II), and according to the price of gold(model III). Education is classified from no formal or informal education (0)to post-graduate (9). Standard errors in parentheses. Standard errors areclustered at the district level and robust to heteroscedasticity. Stars indicatesignificance levels at 10% (*), 5% (**) and 1%(***).

Table 3: Gold mines during adolescence and educa-tional outcomes, mineral resources otherthan gold
(I) (II) (III)
Only non-gold mines 0.110
(0.093)
At least one non-gold mine 0.108
(0.084)
Exclusively gold mine -0.261***
(0.077)
Estimation method OLS OLS OLS
Cohort FE Yes Yes Yes
Country FE Yes Yes Yes
Region FE Yes Yes Yes
Ethnic group FE Yes Yes Yes
Countries 18 18 18
Districts 1669 1669 1669
N 24866 24866 24866
Notes: This table shows OLS regression results that relate a categorical variable mea-suring educational outcomes of an Afrobarometer respondent against a dummy forwhether there was a mine for a mineral resource other than gold in the respondent’sdistrict when she was in adolescence (at age 12). Education is classified from noformal or informal education (0) to post-graduate (9). Model (I) include. Model(IV) uses a mining dummy that is one for districts where gold and other mineralsmay be produced at the same time. Model (II) uses a mining dummy that is oneonly for mining districts where gold is not produced at the same time. Model (III)uses a dummy that is one only for mining districts where gold but no other min-erals are produced. Standard errors are clustered at the district level and robustto heteroscedasticity. Stars indicate significance levels at 10% (*), 5% (**) and1%(***).

Table 4: Gold mines during adolescence and educational outcomes,Placebo tests
Gold mine neighboringdistrict
Current gold mines
(I) (II) (III) (IV)
Gold mine -0.220*** -0.221***
(0.078) (0.076)
Gold mine in neighboring district -0.009 -0.014
(0.067) (0.065)
Current gold mine -0.040 -0.044
(0.097) (0.090)
Sample Restricted Full Restricted Full
Estimation method OLS OLS OLS OLS
Cohort FE Yes Yes Yes Yes
Country FE Yes Yes Yes Yes
Region FE Yes Yes Yes Yes
Ethnic group FE Yes Yes Yes Yes
Countries 18 18 18 18
Regions 1631 1669 1631 1669
N 23912 24866 23912 24866
Notes: This table shows two sets of placebo regressions. All models are estimated with OLS. The dependentvariable is always educational attainment of an Afrobarometer respondent. Model (I)-(II) include dummiesthat are one if there was no gold mine in the respondent’s own district but in a neighboring district duringher adolesence. Model (III)-(IV) include a dummy that is one if there is in 2007 a mine in a respondent’sdistrict but not during adolescence. Model (I) and (III) omit observations that had mines in their districtsduring adolesence. Model (II) and (IV) are estimated with the full sample and additionally include thedummy for whether there was a gold mine in a respondent’s district during her adolecence. Standard errorsin parentheses. Standard errors are clustered at the district level and robust to heteroscedasticity. Starsindicate significance levels at 10% (*), 5% (**) and 1%(***).

Table
5:Goldminesduringadolesc
enceandeducationaloutcomes,
resu
ltswithDevelopmentand
Healt
hSurveysdata
(I)
(II)
(III
)(V
I)(V
)
Gold
min
e-0
.064**
-0.0
56*
-0.0
83**
-0.0
92**
-0.1
32***
(0.0
27)
(0.0
29)
(0.0
38)
(0.0
37)
(0.0
45)
Est
imati
on
met
hod
Ord
ered
pro
bit
Ord
ered
pro
bit
Ord
ered
pro
bit
OL
SO
LS
Coh
ort
FE
Yes
Yes
Yes
Yes
Yes
Cou
ntr
yF
EY
esY
esY
esY
esY
es
Reg
ion
FE
No
Yes
Yes
Yes
Yes
Eth
nic
gro
up
FE
No
No
Yes
No
Yes
Cou
ntr
ies
16
16
12
16
12
Dis
tric
ts9975
9975
7950
9975
7950
N320391
320391
259790
320391
259790
Note
s:T
his
tab
lesh
ow
sord
ered
pro
bit
an
dO
LS
regre
ssio
nre
sult
sth
at
rela
tea
cate
gori
cal
vari
ab
lem
easu
rin
ged
uca
tion
alou
tcom
esof
aD
evel
op
men
tan
dH
ealt
hS
urv
eys
(DH
S)
resp
on
den
tagain
sta
du
mm
yfo
rw
het
her
ther
ew
as
agold
min
ew
ith
ina
rad
ius
of30
km
ofa
resp
on
den
t’s
sam
pli
ng
clu
ster
wh
ensh
ew
as
inad
ole
scen
ce(a
tage
12).
We
use
data
from
the
DH
Ssu
rvey
sco
ver
ing
16
sub
-Sah
ara
nA
fric
an
cou
ntr
ies.
Res
pon
den
tsb
elow
18
yea
rare
dro
pp
ed.
Ed
uca
tion
iscl
ass
ifed
from
no
edu
cati
on
(0)
toh
igh
ered
uca
tion
(5).
Mod
el(I
)-(I
II)
are
esti
mate
dw
ith
ord
ered
pro
bit
.M
od
el(I
V)
ises
tim
ate
dw
ith
OL
S.
Sta
nd
ard
erro
rsin
pare
nth
eses
.S
tan
dard
erro
rsare
clu
ster
edat
the
level
of
sam
plin
gcl
ust
ers
an
dare
rob
ust
toh
eter
osc
edast
icit
y.S
tars
ind
icate
sign
ifica
nce
level
sat
10%
(*),
5%
(**)
an
d1%
(***).
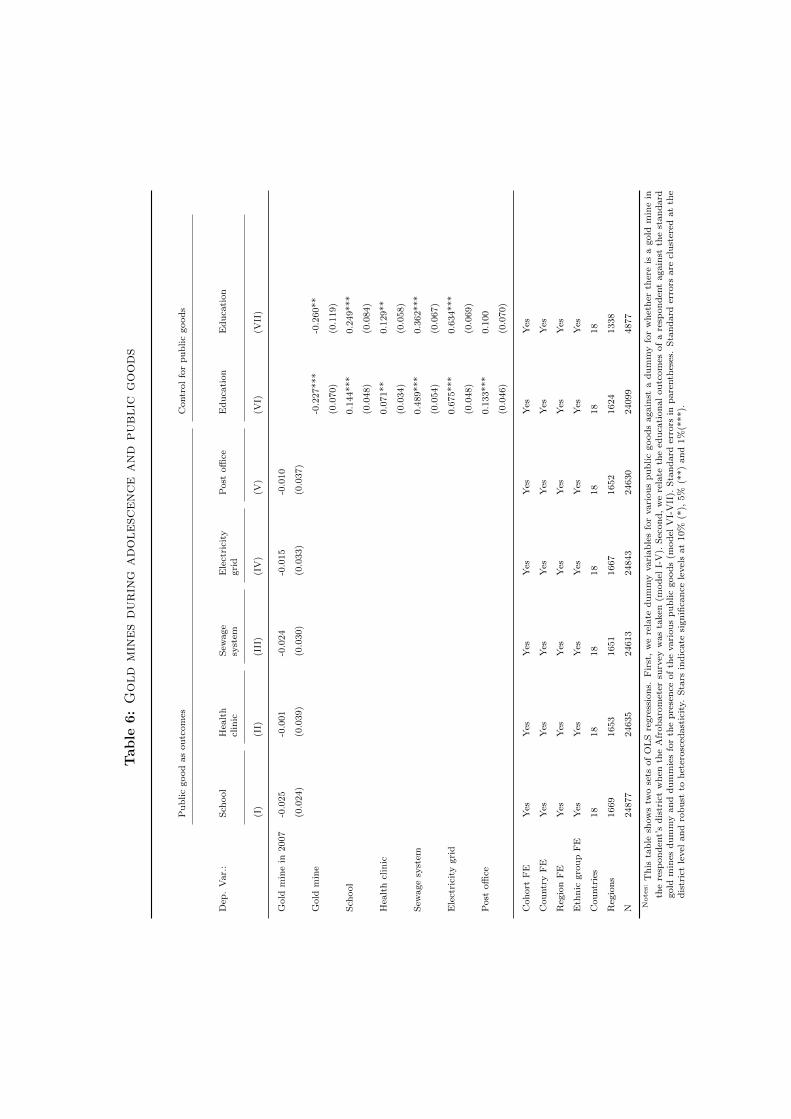
Tab
le6:Gold
minesduring
adolesc
enceand
public
goods
Pu
bli
cgood
as
ou
tcom
esC
ontr
ol
for
pu
bli
cgood
s
Dep
.V
ar.
:S
chool
Hea
lth
clin
icS
ewage
syst
emE
lect
rici
tygri
dP
ost
offi
ceE
du
cati
on
Edu
cati
on
(I)
(II)
(III
)(I
V)
(V)
(VI)
(VII
)
Gold
min
ein
2007
-0.0
25
-0.0
01
-0.0
24
-0.0
15
-0.0
10
(0.0
24)
(0.0
39)
(0.0
30)
(0.0
33)
(0.0
37)
Gold
min
e-0
.227***
-0.2
60**
(0.0
70)
(0.1
19)
Sch
ool
0.1
44***
0.2
49***
(0.0
48)
(0.0
84)
Hea
lth
clin
ic0.0
71**
0.1
29**
(0.0
34)
(0.0
58)
Sew
age
syst
em0.4
89***
0.3
62***
(0.0
54)
(0.0
67)
Ele
ctri
city
gri
d0.6
75***
0.6
34***
(0.0
48)
(0.0
69)
Post
offi
ce0.1
33***
0.1
00
(0.0
46)
(0.0
70)
Coh
ort
FE
Yes
Yes
Yes
Yes
Yes
Yes
Yes
Cou
ntr
yF
EY
esY
esY
esY
esY
esY
esY
es
Reg
ion
FE
Yes
Yes
Yes
Yes
Yes
Yes
Yes
Eth
nic
gro
up
FE
Yes
Yes
Yes
Yes
Yes
Yes
Yes
Cou
ntr
ies
18
18
18
18
18
18
18
Reg
ion
s1669
1653
1651
1667
1652
1624
1338
N24877
24635
24613
24843
24630
24099
4877
Note
s:T
his
tab
lesh
ow
stw
ose
tsof
OL
Sre
gre
ssio
ns.
Fir
st,
we
rela
ted
um
my
vari
ab
les
for
vari
ou
sp
ub
lic
good
sagain
sta
du
mm
yfo
rw
het
her
ther
eis
agold
min
ein
the
resp
on
den
t’s
dis
tric
tw
hen
the
Afr
ob
aro
met
ersu
rvey
was
taken
(mod
elI-
V).
Sec
on
d,
we
rela
teth
eed
uca
tion
al
ou
tcom
esof
are
spon
den
tagain
stth
est
an
dard
gold
min
esd
um
my
an
ddu
mm
ies
for
the
pre
sen
ceof
the
vari
ou
sp
ub
lic
good
s(m
od
elV
I-V
II).
Sta
nd
ard
erro
rsin
pare
nth
eses
.S
tan
dard
erro
rsare
clu
ster
edat
the
dis
tric
tle
vel
an
dro
bu
stto
het
erosc
edast
icit
y.S
tars
ind
icate
sign
ifica
nce
level
sat
10%
(*),
5%
(**)
an
d1%
(***).

Tab
le7:Gold
minesduring
adolesc
enceand
educationaloutcomes,
ethnic
home-
lands
Fu
llsa
mp
leN
ati
ve
gro
up
sam
ple
Non
-nati
ve
gro
up
sam
ple
(I)
(II)
(III
)(V
I)
Gold
min
e-0
.243***
-0.2
00**
-0.3
25***
-0.1
79*
(0.0
73)
(0.0
94)
(0.0
99)
(0.0
98)
Eth
nic
hom
elan
d-0
.246***
-0.2
44***
(0.0
43)
(0.0
43)
Eth
nic
hom
elan
d×
Gold
min
e-0
.075
(0.1
27)
Est
imati
on
met
hod
OL
SO
LS
OL
SO
LS
Coh
ort
FE
Yes
Yes
Yes
Yes
Cou
ntr
yF
EY
esY
esY
esY
es
Reg
ion
FE
Yes
Yes
Yes
Yes
Eth
nic
gro
up
FE
Yes
Yes
Yes
Yes
Cou
ntr
ies
18
18
18
18
Reg
ion
s1639
1639
1311
1183
N22946
22946
13863
9083
Note
s:T
his
tab
lesh
ow
sord
ered
pro
bit
an
dO
LS
regre
ssio
nre
sult
sth
at
rela
tea
cate
gori
cal
vari
ab
lem
easu
rin
ged
uca
tion
al
ou
tcom
esof
an
Afr
ob
aro
met
erre
spon
den
tagain
sta
du
mm
yfo
rw
het
her
ther
ew
as
agold
min
ein
the
resp
on
den
t’s
dis
tric
tw
hen
she
was
inad
ole
scen
ce(a
tage
12).
We
acc
ou
nt
for
wh
eth
era
resp
on
den
tli
ves
wit
hin
the
trad
itio
nalh
om
elan
dof
her
eth
nic
gro
up
(an
dth
us
has
likel
yn
ot
mig
rate
dd
ue
toth
ep
rece
nce
of
am
ine)
inth
ese
regre
ssio
ns.
Ed
uca
tion
iscl
ass
ifed
from
no
form
al
or
info
rmal
edu
cati
on
(0)
top
ost
-gra
du
ate
(9).
Mod
el(I
)-(I
II)
are
esti
mate
dw
ith
ord
ered
pro
bit
.M
od
el(I
V)
ises
tim
ate
dw
ith
OL
S.
Sta
nd
ard
erro
rsin
pare
nth
eses
.S
tan
dard
erro
rsare
clu
ster
edat
the
dis
tric
tle
vel
an
dro
bu
stto
het
erosc
edast
icit
y.S
tars
ind
icate
signifi
cance
level
sat
10%
(*),
5%
(**)
an
d1%
(***).

Table 8: Gold mines during adolescence and ed-ucational outcomes, conflicts as an al-ternative transmission channel
Dep. Var.: Conflict Education Education
(I) (II) (III)
Gold mine 0.026 -0.246* -0.246*
(0.022) (0.135) (0.135)
Conflict -0.085 -0.084
(0.080) (0.080)
Fatalities -0.108
(1.066)
Estimation method OLS OLS OLS
Cohort FE Yes Yes Yes
Country FE Yes Yes Yes
Region FE Yes Yes Yes
Ethnic group FE Yes Yes Yes
Countries 18 18 18
Districts 1380 1380 1380
N 5091 5087 5087
Notes: This table shows OLS regression results that relate the incidence of con-flicts (model I) and educational attainment of an Afrobarometer respondent(model II-III) against a dummy for whether there was a gold mine in therespondent’s district when she was in adolescence (at age 12). Model (II)controls for the incidence of conflicts and model (III) additionally for fatal-ities. Education is classified from no formal or informal education (0) topost-graduate (9). Standard errors in parentheses. Standard errors are clus-tered at the district level and robust to heteroscedasticity. Stars indicatesignificance levels at 10% (*), 5% (**) and 1%(***).
46

Table 9: Mineral resources during adolescenceand contemporaneous economic out-comes
Own Liv-ing condi-tions (rela-tive)
Own Liv-ing condi-tions (ab-solute)
Country-leveleconomicconditions
(I) (II) (III)
Gold mine 0.012 -0.075 -0.113*
(0.053) (0.055) (0.058)
Cohort FE Yes Yes Yes
Country FE Yes Yes Yes
Region FE Yes Yes Yes
Ethnic group FE Yes Yes Yes
Countries 18 18 18
Districts 1669 1669 1669
N 24096 24791 24457
Notes: This table shows OLS regressions that relate binary variables for theeconomic conditions of a respondent against a dummy for whether there wasa gold mine in the respondent’s district when she was in adolescence (atage 12). Specifically, we explore how a respondent perceives her own livingconditions relative to other co-nationals, her own living conditions as such,and the present economic conditions in the country if she had a mine duringher adolescence. how she perceives her own current economic conditions. WeStandard errors in parentheses. Standard errors are clustered at the districtlevel and robust to heteroscedasticity. Stars indicate significance levels at10% (*), 5% (**) and 1%(***).

0 5 10 15 20Percent
Post-graduate
University completed
Some university
Post-secondary
Secondary completed
Some secondary
Primary completed
Some primary
Informal
NoneEd
ucat
ion
Figure 1: Educational attainment of Afrobarometer respondents
0.2
.4.6
.81
Prob
abilit
y <=
age
_of_
resp
onde
nt
20 25 30 35 40 45 50 55 60 65 70 75 80 85 90 95 100 105 110Age of respondents
Figure 2: Age distribution of Afrobarometer respondents

Lege
nd Gold
mine
sCo
untrie
sRe
gions
Distric
ts
(a)
Africa
Gold
mine
sMa
shon
aland
Wes
t Reg
ionDis
tricts
(b)
Mash
onaland
West
Region,Zim
babwe
Fig
ure
3:
Loca
tion
ofm
ines
inth
eco
untr
ies
incl
uded
inth
esa
mple
and
ina
par
ticu
lar
regi
on.
Th
isfi
gu
resh
ow
sth
elo
cati
on
of
(his
tori
cal
an
dcu
rren
t)m
ines
inth
eco
untr
ies
incl
ud
edin
ou
rsa
mp
le(s
ub
figu
rea)
an
din
Mash
on
ala
nd
Wes
tR
egio
n,
Zim
babw
e(s
ub
figu
reb
).

Info
rmal
sch
oolin
g
Som
e pr
imar
y
Prim
ary
com
plet
ed
Som
e se
cond
ary
Seco
ndar
y co
mpl
eted
Post
-sec
onda
ry
Som
e un
iver
sity
Uni
vers
ity c
ompl
eted
Post
-gra
duat
exo
-.1-.0
75-.0
5-.0
250
.025
.05
Effe
ct o
n ed
ucat
ion
Coefficent 90% CI
Figure 4: Effect on different educational stages. This figure shows coefficient estimates for the effect ofgold mines on the probability of transition from one educational stage on the next.
50

1 2 3 4 5 6 7 89 10 11 12 13
14 15 16 17 18 19 20 21 22 23 24 25 26 2728 29 30
31 3233
3435
36 3738
3940
4142 43 44 4546 47
4849
50
-.4-.2
0.2
Effe
ct o
n ed
ucat
ion
0 5 10 15 20 25 30 35 40 45 50Age
Coefficent 90% CI
Figure 5: Coefficients at different adolescence years. This figure shows coefficient estimates for differentages as thresholds for adolescence.
Beni
nBo
tsw
ana
Burk
ina
Faso
Gha
naKe
nya
Libe
riaM
adag
asca
rM
alaw
iM
ali
Moz
ambi
que
Nam
ibia
Nig
eria
Sene
gal
Sout
h Af
rica
Tanz
ania
Uga
nda
Zam
bia
Zim
babw
e
-.3-.2
-.10
.1
Effe
ct o
n ed
ucat
ion
Country
Coefficent 90% CI
Figure 6: Coefficients without individual countries. This figure shows coefficient estimates after drop-ping individual countries

Table
A.1
:DefinitionofVariables
Lab
elD
escr
ipti
on
Sou
rce
Ed
uca
tion
Ed
uca
tion
al
att
ain
men
t,9
dis
tin
ctst
ages
,ra
nges
from
non
eto
post
-gra
du
ate
.A
frob
aro
met
er4th
wave.
Gold
min
eD
um
my
=1
ifle
ast
on
egold
min
ein
on
e’s
dis
tric
tat
age
12.
Ow
nco
nst
ruct
ion
base
don
data
from
Min
Ex.
Gold
min
ein
nei
ghb
or-
ing
dis
tric
tD
um
my
=1
ifgold
min
ein
at
least
on
en
eighb
ori
ng
dis
tric
tat
age
12
&n
ogold
min
ein
on
e’s
ow
nd
istr
ict.
Ow
nco
nst
ruct
ion
base
don
data
from
Min
Ex.
On
lyn
on
-gold
min
esD
um
my
=1
ifon
lyn
on
-gold
min
esin
on
e’s
dis
tric
tat
age
12
Ow
nco
nst
ruct
ion
base
don
data
from
Min
Ex.
At
least
on
en
on
-gold
min
eD
um
my
=1
ifat
least
on
en
on
-gold
min
ein
on
e’s
dis
tric
tat
age
12
Ow
nco
nst
ruct
ion
base
don
data
from
Min
Ex.
Excl
usi
vel
ygold
min
eD
um
my
=1
ifon
lygold
min
eson
e’s
dis
tric
tat
age
12
Ow
nco
nst
ruct
ion
base
don
data
from
Min
Ex.
Cu
rren
tgold
min
eG
old
min
ein
2007
(sh
ort
lyb
efore
the
4th
wave
of
the
Afr
ob
aro
m-
eter
surv
eyw
as
con
du
cted
).O
wn
con
stru
ctio
nb
ase
don
data
from
Min
Ex.
Fem
ale
Du
mm
y=
1if
fem
ale
resp
on
den
t.A
frob
aro
met
er4th
wave.
Eth
nic
hom
elan
dD
um
my=
1if
dis
tric
tof
are
spon
den
tover
lap
sw
ith
the
trad
itio
nal
sett
lem
ent
are
aof
the
resp
on
den
t’s
eth
nic
gro
up
.O
wn
con
stru
ctio
nu
sin
gd
ata
from
Afr
ob
aro
met
er4th
wave,
Mu
r-d
ock
(1959),
Nu
nn
an
dW
antc
hek
on
(2011),
an
dD
econ
inck
an
dV
erp
oort
en(2
013).
Sm
all
min
eD
um
my=
1if
gold
min
eis
class
ified
eith
eras
min
or
(≥0.0
3M
oz
Au
)or
mod
erate
(≥0.3
2M
oz
Au
&<
2.2
4M
oz
Au
)O
wn
con
stru
ctio
nb
ase
don
data
form
Min
Ex.
At
least
ma
jor
min
eD
um
my=
1if
min
eis
at
least
class
ified
as
ma
jor
(≥2.2
4M
oz
Au
)O
wn
con
stru
ctio
nb
ase
don
data
form
Min
Ex.
Gold
Pri
ceP
rice
of
gold
inyea
rt.
Worl
dB
an
kco
mm
od
ity
pri
ced
ata
(Th
eP
ink
Sh
eet,
Feb
ruary
2016).
Sch
ool
Du
mm
y=
1if
ther
eis
asc
hool
inth
esa
mp
lin
gu
nit
/en
um
erati
on
are
aof
are
spon
den
t.A
frob
aro
met
er4th
wave.
Hea
lth
clin
icD
um
my=
1if
ther
eis
acc
ess
toa
hea
lth
clin
icin
the
sam
plin
gu
nit
/en
um
erati
on
are
aof
are
spon
den
t.A
frob
aro
met
er4th
wave.
Sew
age
syst
emD
um
my=
1if
ther
eis
acc
ess
toa
sew
age
syst
emin
the
sam
pli
ng
un
it/
enu
mer
ati
on
are
aof
are
spon
den
t.A
frob
aro
met
er4th
wave.
Ele
ctri
city
gri
dD
um
my=
1if
ther
eis
acc
ess
toa
elec
tric
ity
gri
din
the
sam
pli
ng
un
it/
enu
mer
ati
on
are
a.
Afr
ob
aro
met
er4th
wave.
Cel
lp
hon
ese
rvic
eD
um
my=
1if
ther
eis
cell
ph
on
ese
rvic
ein
the
sam
plin
gu
nit
/en
um
erati
on
are
a.
Afr
ob
aro
met
er4th
wave.

Table
A.2
:Summarystatistics
Variable
Obs
Mean
SD
Min
Max
Ed
uca
tion
24866
3.1
93
2.0
28
0.0
00
9.0
00
Gold
min
e24866
0.0
38
0.1
92
0.0
00
1.0
00
Gold
min
ein
nei
ghb
ori
ng
dis
tric
t24866
0.1
24
0.3
30
0.0
00
1.0
00
Cu
rren
tgold
min
e24866
0.0
36
0.1
85
0.0
00
1.0
00
On
lyn
on
-gold
min
es24866
0.0
61
0.2
40
0.0
00
1.0
00
At
least
on
en
on
-gold
min
e24866
0.0
70
0.2
55
0.0
00
1.0
00
Excl
usi
vel
ygold
min
e24866
0.0
30
0.1
69
0.0
00
1.0
00
Fem
ale
24866
0.4
97
0.5
00
0.0
00
1.0
00
Eth
nic
hom
elan
d24866
0.5
58
0.4
97
0.0
00
1.0
00
Sm
all
min
e24866
0.0
16
0.1
27
0.0
00
1.0
00
At
least
ma
jor
min
e24866
0.0
26
0.1
58
0.0
00
1.0
00
Gold
Pri
ce23188
0.1
58
0.8
43
0.0
00
9.3
20
Sch
ool
24839
0.8
94
0.3
08
0.0
00
1.0
00
Hea
lth
clin
ic24599
0.6
44
0.4
79
0.0
00
1.0
00
Sew
age
syst
em24576
0.2
42
0.4
28
0.0
00
1.0
00
Ele
ctri
city
gri
d24805
0.5
50
0.4
98
0.0
00
1.0
00
Post
offi
ce24593
0.2
65
0.4
41
0.0
00
1.0
00
Th
ista
ble
pro
vix
od
essu
mm
ary
stati
stic
son
the
Afr
ob
aro
met
erre
spon
den
tsin
clu
ded
inth
esa
mp
le.