working paper series - university of rhode island diffusion, ... we also expect a “location...
TRANSCRIPT

College of Business Administration
University of Rhode Island
2004/2005 No. 10
This working paper series is intended tofacilitate discussion and encourage the
exchange of ideas. Inclusion here does notpreclude publication elsewhere.
It is the original work of the author(s) andsubject to copyright regulations.
WORKING PAPER SERIESencouraging creative research
Office of the DeanCollege of Business AdministrationBallentine Hall7 Lippitt RoadKingston, RI 02881401-874-2337www.cba.uri.edu
William A. Orme
Nir Kshetri, John P. Burkett and Nikhilesh Dholakia
International Heterogeneity in Internet Diffusion:Evidence from Global Country-Level Data

International Heterogeneity in Internet Diffusion: Evidence from Global Country-Level Data
Nir Kshetri University of North Carolina at Greensboro
John P. Burkett University of Rhode Island
Nikhilesh Dholakia University of Rhode Island
Working Paper December 2004
1

International Heterogeneity in Internet Diffusion: Evidence from Global Country-Level Data
Abstract Global diffusion of technology products has been a very important but highly underresearched subject. To fill the research gap, we estimate Griliches' diffusion model (GDF), which is nonlinear in parameters, and another model which is linear in parameters both using panel data to analyze the determinants of global diffusion of the Internet in a range of developing and developed countries. The analysis indicates that income and political freedom variables influence the penetration rate and diffusion speed of the Internet. Telecom investment as a proportion of GDP has a significant effect on Internet penetration in the TSCS model linear in parameters. We also found that the random effect TSCS model is more appropriate than the fixed effect model to study the global diffusion of the Internet. Keywords: TSCS model, Griliches diffusion function, Internet, multicountry, authoritarianism.
Introduction For firms operating in today’s global environment, an integration of the spatial dimension
in diffusion research would help evaluate alternative strategies across geographically
dispersed national markets (Mahajan et al. 1990, Putsis et al. 1997). Very few studies on
innovation diffusion, however, have focused outside the U.S. and still fewer have
considered two or more countries simultaneously (Gatignon et al. 1989). Thus we
understand far less about the factors influencing and shaping cross-country diffusion
patterns than we do about single-country diffusion patterns (Putsis et al. 1997).
The few available studies on multicountry diffusion are based mainly in the
developed OECD countries1. Their findings indicate that economic, political and cultural
variables such as cosmopolitanism, mobility, and sex roles (Gatignon et al. 1989); media
availability (Tellefsen and Takada 1999); adoption time and cross country mixing (Ganesh
et al. 1997, Putsis et al. 1997, Takada and Jain 1991); income, education, and availability
of related infrastructures (Hargittai 1999); competition and penetration rates of related
2

technologies (Gruber and Verboven 2001); heterogeneity of social system (Dekimpe,
Parker and Sarvary 2000); and type of political regime (Buchner 1988) influence the
diffusion patterns of innovations.
There is a considerable gap in the existing literature on diffusion and adoption of
innovations. First, recent findings of studies on Internet diffusion patterns in some
developing countries have put the implicit assumptions of the “normal process” of
development of the Internet to a “severe test” (Mueller 1999). Thus, the generalizability of
the studies conducted in OECD countries to developing countries is questionable.
Second, in developing countries, relatively little research exists on consumption
patterns in general (Ger and Belk 1996) and diffusion of innovations in particular. Given
the importance of the roles developing countries are likely to play in international relations
(Andreasen 1990, Shuja 2001) and global e-commerce (Bruce 2000, Mueller 1999) in the
future, studies on the relevance of Internet to such countries are needed. Arnold and
Quelch (1998) have argued that Internet, as a marketing medium, has a potential to add
higher value in developing countries than in developed countries. A focus on the
developing world – home to 80% of humanity – is also an antidote to the tendency in the
business discipline of becoming “increasingly isolated and of marginal relevance”
(Lehmann 1999).
Third, there is little work simultaneously comparing the diffusion and adoption
phenomena in developing and developed countries. Only by confronting existing diffusion
theories with countries at various stages of economic development can the theories of
innovation diffusion be subjected to tests more radical than those feasible with data on
more advanced countries only.
3

Fourth, there is little research that addresses the diffusion of the Internet, the fastest
diffusing innovation to date. The Internet’s several unique characteristics – the ability to
store information at different virtual locations at very low cost, the availability of powerful
and inexpensive means of searching, organizing, and disseminating information;
interactivity; the ability to provide excellent perceptual experiences; the ability to serve as
a transaction, servicing, support and physical distribution medium; the relatively low entry
and establishment costs (Peterson et al. 1997) – make it a unique marketing medium.
This paper attempts to fill these research gaps by analyzing the Internet diffusion
data in a range of developing and developed countries. The remainder of the paper: (a)
briefly discusses the purpose of our modeling exercise; (b) integrates theories from various
perspectives to develop some testable propositions; (c) describes data sources; (d)
describes the methodology used; and (e) discusses analysis, findings and limitations.
Purpose of the modeling exercise The primary purpose of modeling in this paper is causal inference rather than prediction.
The hypotheses in the following section are stated in ceteris paribus conditions. Since our
objective is causal interference, the ceteris paribus conditions should exclude variables that
are likely to transmit the influence of the treatment variables to the dependent variables and
should include all confounding variables (Gelman et al. 1995). The dependent variables
are the number of Internet hosts per 1000 people and the number of Internet users per
1,000 people.
The treatment variables used in the model include income, political freedom and
telecom investment. We excluded variables such as telephone penetration and personal
computer penetration in the model because these variables are likely to transmit the
4

influence of treatment variables (such as income, freedom condition, telecom investment,
etc.) on the dependent variables.
Theory and hypotheses In this section, we develop several testable propositions that represent the effects of
demand and supply side variables2 on Internet diffusion, a country being the unit of
analysis. The variables of interest are Internet penetration, Internet diffusion speed, and
location effect. In fact, Internet penetration is a function of diffusion speed and location
effects.
We operationalize Internet penetration with two separate but interrelated variables:
the number of Internet users per 1000 people (IUPK) and number of Internet hosts3 per
1000 people (IHPK). Diffusion speed and location effects will be represented by
parameters of the Griliches (1957) model (see equation 1 below).
Table 1 presents how theoretical variables are operationalized and table 2 presents
the mechanisms by which the operational variables are likely to influence the diffusion of
the Internet. Next we discuss the effects of several explanatory variables individually.
Income One of the variables most likely to characterize innovators is high income (Gatignon and
Robertson 1985, Rogers 1983). On the supply side, income is a key factor influencing
“demand and cost conditions” of technological leadership (Beise 2001). On the demand
side, high income arguably allows potential adopters to afford greater economic sacrifice
to adopt the innovation (Dekimpe et al. 2000). In an international context, it can be argued
that an economy’s standard of living and the level of economic development influence the
adoption timing as well as diffusion speed (Antonelli 1993, Gatignon and Robertson 1985,
Helson et al. 1993, Dekimpe et al. 2000, Gruber and Verboven 2001). Empirical evidence
5

also supports this argument (e.g., Dekimpe et al. 2000, Kshetri 2001b, Kshetri and Cheung
2002, Kshetri and Dholakia 2002b). At the aggregate level, we propose that ceteris
paribus4:
H1a: The Internet penetration level in an economy is positively related to its income. H1b: The diffusion speed of the Internet in an economy is positively related to its income.
We also expect a “location effect” of the income variable. We hypothesize that
richer economies are likely to introduce an advanced technology such as the Internet
earlier than poorer countries. Since telephone and PCs have reached virtually all countries
in the world, the incremental cost to connect to the Internet is relatively low. Income level
determines the types of economic activities that require Internet use as well as the
existence of critical mass of users required for Internet service providers.
Some other variables discussed later in this section, such as political freedom
status, influence Internet penetration and diffusion speed, they are likely to have relatively
minor effect on the time of first introduction. Authoritarian regimes, for instance, are not
necessarily slow in introducing the Internet but they are less willing to open the Internet to
the public. Thus we propose that:
H1c: The income variable has a positive “location effect” (that is countries with higher income are likely to introduce the Internet sooner than countries with lower income).
Compatibility with the social system (freedom condition) Drawing on past research (e.g., Rogers 1983), Gatignon and Robertson (1985) propose that
the diffusion rate of an innovation is positively related to the innovation’s compatibility
with social system values. The Internet – “the greatest democratizer the world has ever
6

seen” (Pitroda 1993) – is more compatible with countries having democratic political
structures than authoritarian ones.
Theoretical and empirical evidence suggests that authoritarian governments have
distastes and unfavorable attitude towards interpersonal means of communications such as
telephone and the Internet (e.g., Groth and Hunt 1985; Kshetri 2001a, b; Kshetri and
Dholakia 2001). Groth and Hunt (1985) argue that Marxist governments allocate relatively
smaller proportion of resources for the development of interpersonal communications
means. For instance, Stalin vetoed Trotsky’s proposal to develop modern telephone system
in Russia commenting that:
It will unmake our work. No greater instrument for counterrevolution and conspiracy can be imagined (Boettinger 1977, p.206).
Likewise, Buchner (1988), in a comparison of the diffusion of telephone and
television in Marxist and non-Marxist European nations, found that the penetration rates of
telephones in comparison to television were much lower in the former than in the latter.
The highest of the ratios of the number of telephones to number of televisions among
Marxist nations was smaller than the lowest of the ratios among non-Marxist nations.
To take an example specific to the Internet, an official of the Zhejiang Provincial
government in China commented that Internet ads contain “distorted, misleading and even
illegal information” and have “greatly endangered customers' interests” (Chinese
Education and Research Network 2001). Chinese Ministry of Information Industry (MII)
and the State Press and Publication Administration issued new set of regulations in July,
2002, which threaten to fine or close down Internet publishers and portals disobeying
content guidelines. Portals and search engines not following the guidelines such as Google
and Altavista have been banned in China since 2002 (Singer 2002).
7

Apart from controls on Internet ads and portals, there are also broader measures of
Internet control in authoritarian regimes. The Chinese government in 2002, for instance,
closed 150,000 Internet cafes and required the remaining cafes to install software that
prevents access to up to 500,000 banned sites (BBC News 2002). Likewise, a Harvard Law
School study found that government sponsored proxy servers in Saudi Arabia filter and
block sexually explicit contents (Hermida 2002). Internet control measures in authoritarian
regimes have reduced the attractiveness of Internet use.
One of the dimensions of the social value system indicative of compatibility with
the interpersonal means of communications, such as the Internet, is, thus, the political
rights or freedom status in the country. Thus,
H2a: Internet penetration is positively related to the political rights or freedom. H2b: Internet diffusion speed is positively related to the political rights or freedom.
Priority setting The diffusion pattern of telecom-related products such as the Internet is also a function of
the level of priority set for the telecom sector (National Academy of Science 1985) and
focus of national industrial and technological policies on fostering and strengthening this
sector (Beise 2001, p. 263).
The proportion of GDP spent in the telecom sector can be taken as a proxy of the
level of priority. Put differently, relatively higher investment in the telecom sector is an
indication of the higher level of priority set for this sector. Moreover, whereas most other
supply related variables are highly correlated with income, telecom investment as a
proportion of GDP has no significant correlation with the income variable (Table 8).
8

Table 1: Definitions and explanations of theoretical and operational variables Theoretical variable Definition Operational variable Explanation of operational
variable Income level Total value at market
prices of goods and services produced in an economy.
Per capita Gross National Product (GNPPC)
Sum of the total value of consumption expenditure, total value of investment expenditure, government purchases of goods and services and net exports of goods and services divided by the population.
Freedom condition “Rights to free expression, to organize or demonstrate, as well as rights to a degree of autonomy such as is provided by freedom of religion, education, travel, and other personal rights’’ (Gastil 1986–87, p. 7).
Political freedom condition (PFD)
The average of political right index and civil liberty index from Freedom House (2001).
Priority set for telecom sector
The degree of attention and consideration given to telecom sector compared to other sectors in an economy.
Telecom investment (TELINV)
Percentage of GDP invested in telecom sector in an economy.
Population size The degree of bigness or smallness of an economy measured by the population.
Population (POP) The number of people living in an economy.
Population density The quality of being dense of the population in an economy.
Population density (PODE)
Number of people per unit area in an economy.
Source: Branson (1992), Longman dictionary (1987), UNDP (2001) and authors’ research. The supply condition resulted from the level of priority set for the telecom sector is
likely to influence the penetration of a technology as well as its diffusion speed by
influencing the characteristics of the technology, its price structure as well as the allocation
of resources (Robertson and Gatignon 1986). First, economic theory suggests that higher
supply leads to lower price. The lower price, in turn, accelerates the diffusion rate. For
example, Jain and Rao (1990) found that lower price positively influenced purchasing
decision of consumer durables. Second, suppliers influence the diffusion pattern by making
an innovation more or less attractive (Robertson and Gatignon 1986).
9

Third, supply conditions influence the shape of diffusion curves. For instance,
Simon and Sebastian (1987) argue that the diffusion curve experiences slow growing and
fast declining (that is, negatively skewed) pattern under conditions of supply restriction. In
an empirical study of the diffusion of the telephone in Israel under the condition of supply
restriction, Jain et al. (1991) found negatively skewed diffusion pattern. The next
propositions are:
H3a: Internet penetration level is positively related to the level of priority set for the telecom sector.
H3b: Internet diffusion speed is positively related to the level of priority set for the
telecom sector.
Population size Population size influences the diffusion of a technology in several ways. First, the market
size, which is an important factor technology suppliers take into account in assessing the
profitability of a market, is positively related to the population size. Second, network
externality effects of technologies, such as the Internet, are likely to be higher for more
populous economies. The discussion in this paragraph is summarized as:
H4a: Internet penetration level is positively related to the population size. H4b: Internet diffusion speed is positively related to the population size. H4c: The location effect is positively related to the population size.
Population density Population density influences the diffusion of innovations and more so for communications
technologies such as the Internet. First, higher population density results in lower costs to
wire a country. For instance, high population density is one of the important factors
contributing to Hong Kong’s rapid Internet development (Kshetri and Dholakia 2002a).
Second, higher population density facilitates interaction between adopters and potential
10

adopters thereby influencing diffusion process positively. Such interaction results in a
higher coefficient of imitation or the “coefficient of external influence” (Bass 1969).
Therefore, we propose:
H5a: Internet penetration level is positively related to population density. H5b: Internet diffusion speed is positively related to population density.
Table 2: Effect of various operational variables on Internet diffusion and adoption
Operational variable Effect on diffusion and adoption of the Internet Income level (GNPPC) Higher income means greater ability to afford economic sacrifice to
adopt the Internet. Political freedom condition (PFD)
Internet is more compatible with greater freedom.
Priority or Telecom investment (TELINV)
Influences availability, price structure and quality of Internet services and indicates priority setting.
Population size (POP) Influences the economies of scale and market size. Population density
(PODE) Influences the level of interaction between adopters and potential adopters and suppliers’ cost to provide Internet services.
Data sources Data related to the dependent and explanatory variables were collected from various
sources discussed below.
Euromonitor Publications The data related to GNP, telephone penetration, telephone investment, exchange rate,
Internet hosts and Internet users and populations for the year 1992-99 were obtained from
Euromonitor (2001a, b). GNPPC (GNP per capita) figures for 1992-99 were obtained by
dividing GNP by the populations for the corresponding years. Euromonitor obtains most of
these data from market research firms, national government and various organizations
under the United Nations (UN) systems.
UN System and the World Bank Telephone penetration, Internet hosts and Internet user data for 1999 to 2001 were obtained
from International Telecommunications Union, an agency in the United Nations system.
11

Statistical data related to telecommunications are collected and processed by the
Telecommunication Development Bureau (BDT) from replies received to ITU
questionnaires sent to telecommunication ministries, regulators and operating companies.
As such the data provided by ITU are considered to be the most authoritative source of
data about the evolution of the public telecommunications sector available anywhere (ITU
2001).
GNPPC for the year 2000 were obtained from the World Bank. Euromonitor
(2001a, b) had some observations missing on the income variable. The income data for
some economies for different subsets of the period 1992-99 are obtained from UNCTAD
(1999) and UNDP (2001).
Freedom House Data related to political freedom (PFD) were obtained from Freedom House (2000). PFD
is taken as the average of two variables: political rights (PR) and civil liberty (CL). Both
PR and CL vary from 1 to 7, the higher values indicating lower freedom.
Political Rights (PR) index takes into account factors such as the existence of the
provision of free and fair elections; people’s right to organize in different political parties
or other competitive political groupings of their choice; freedom from domination by the
military, foreign powers, totalitarian parties, religious hierarchies, economic oligarchies, or
any other powerful group; ability of cultural, ethnic, religious, and other minority groups to
have reasonable self-determination, etc.
Civil Liberties (CL) index takes into account such factors as the existence of the
Freedom of Expression and Belief; Association and Organizational Rights; Rule of Law
and Human Rights; Personal Autonomy and Economic Rights; etc.
12

Central Intelligence Agency (CIA) Data related to area, number of Internet users for the year 2000 and the number of Internet
service providers were obtained from the World Fact Book 2001 of the CIA (2001).
Table 3: Applying Jocelyn’s go/no go framework to evaluate the data and the sources used in this study
Question Euromonitor UN System Freedom house
CIA Other sources
Do the data help to answer the questions
set out in the problem definition?
Yes Yes Yes Yes Yes
Do the data apply to the population of
interest?
Yes Yes Yes Yes Yes
Do the data apply to the time period of
interest?
Yes Yes Yes Yes Yes
Can the units and classifications
presented apply?
Yes, for most of the data. For others (e.g., telecom investment) some transformations were applied.
Yes Yes Yes, for most of the data. For others some transformations were applied.
Yes
If possible, go to the original source of the
data
Some of the data were verified from original sources.
Too costly and time consuming to verify all UN data from original sources (national governments).
This is the original source for political freedom data.
Too costly and time consuming to verify all data from original sources.
Too costly and time consuming to verify from original sources.
Is the cost of data acquisition worth it?
The publications are available in university libraries.
Freely available online.
Freely available online.
Freely available online.
Freely available online.
Is there a possibility of bias?
No No No No No
Can the accuracy of the data collection be
verified?
Gives reference to the original sources.
Collected from national governments.
Partly Partly No
Source: Joselyn (1977) and author’s research
Other sources Data on the first introduction of the Internet were obtained from Goldstein (2000) and
various other sources. Data for some of the economies on several variables for different
13

subsets of the period 1992-20005, which were missing from the sources mentioned above
were also obtained from Statistical Abstracts of the U.S. (1997, 1998, 1999, 2000, 2001).
There are five major constraints related to international secondary data: accuracy,
age, reliability, lumping and comparability (Kotabe and Helsen 2001). Kotabe (2002)
argues that Euromonitor, despite its reliance on various sources, addresses most of the
constraints. Other dataset used in this study have also been used in past studies and are
considered to be reliable. For instance, data from the publications of the UN system have
been used by Hill and Dhanda (1999), Tellefsen and Takada (1999), etc. Similarly,
political freedom data from Freedom House have been used in past studies (e.g., Barro
1999, Diamond 1992, and Goldsmith 1999).
Qualitative and quantitative assessment suggested by Malhotra et al. (1998) and
go/no-go framework suggested by Joselyn (1977) were used to evaluate the data from
various sources (Table 3).
Methodology We estimate Griliches' diffusion model (GDF), which is nonlinear in parameters, and
another model which is linear in parameters (say, linear time-series cross section (LTSCS)
model), both using panel data.
Griliches Diffusion Function Griliches diffusion function tests the effects of several explanatory variables on “diffusion
speed” (Gruber and Verboven 2001) and location effect for the period 1994-99.
To test the effects of the explanatory variables on diffusion speed and location
effect, a version of Griliches (1957) logistic model (1) was estimated by using nonlinear
14

least square (NLS) technique6. Let yit denote the total number of adopters and y*it the total
number of potential adopters of the Internet in the country i at time t. Then,
yit = y*it
1+ exp(-ait - bitt) (1),
where ait is the location or timing variable that shifts the S-shaped diffusion function
forwards or backwards and bit is a measure of diffusion speed. For an economy, t measures
the number of years the Internet is being used. It is clear from equation (1) that as t →∝, y
it → y*it. Furthermore, the proportion of potential adopters that have adopted the Internet at
a point of time, yit
yit* , is positively related to location effect (ait) and diffusion speed (bit). ait
and bit in equation (1) are specified as linear functions of several demand and supply
variables as given below:
ait= α0 +α1GNPPC + α4POP (2)
bit= β0+ β1GNPPC+β2PFD + β3TELNV+ β4POP + β5PODE7 (3)
Equation (1) is then estimated by adding error term (Gruber and Verboven 2001).
For the number of Internet hosts per thousand people (IHPK) as the dependent variable,
y*it was taken as a constant proportion (λ) of the number of telephones per 1000 people.
Telephone penetration was taken as the saturation level of potential adopters for various
reasons. First, a telephone is almost a prerequisite to be connected to the Internet and hence
the number of telephone represents the maximum number of computer systems connected
to the Internet8. Second, although PC penetration seems to be a more obvious saturation
level for IHPK, time-series data on PC penetration are not available for most of the
economies for the given period. Third, although the number of Internet users per 1000
15

people (IUPK) has a more obvious saturation level, namely 1000, the model with IUPK as
the dependent variable failed to converge for all combinations of explanatory variables.
Time-series cross-section models linear in parameters (LTSCS Models) The Griliches model, however, has some limitations in the context of global data on
Internet diffusion. First, because of the unavailability of relevant data on explanatory and
dependent variables (mainly the time of introduction of the Internet in a country) we could
include only 21 countries in this model. Second, because of the lack of relevant data many
developing countries could not be included in the model. Third, the non-linear least square
(NLS) technique used to estimate the parameters of the model does not guarantee
convergence and hence does not ensure the estimation of best values of the parameters
(Greene 1999, SAS Institute 1999).
To overcome some of the limitations of Griliches diffusion function, we estimated
LTSCS models for the same period, that is, 1994-99. We take Internet penetration level as
measured by the number of Internet hosts per 1000 people and the number of Internet users
per 1000 people as the dependent variables in the LTSCS models. Complete data were
available for 51 economies to estimate the LTSCS models. Although Internet penetration is
a function of diffusion speed and location effect (estimated by the Griliches diffusion
function), the outcomes of the two models may slightly differ for various reasons. First, we
have included 51 economies (Table 4) in the LTSCS models as compared to 21 economies
in the Griliches function. Second, the LTSCS models do not consider the time of
introduction of the Internet. Third, there is no problem of convergence in LTSCS models
and hence we have included additional variables that could not be included in the Griliches
function.
16

Table 4: List of economies used in LTSCS and Griliches models Country Country Country
1 Algeria *18 Greece 35 Panama *2 Argentina *19 India 36 Philippines *3 Australia 20 Indonesia 37 Romania *4 Austria 21 Iran *38 Singapore *5 Belgium *22 Ireland *39 South Africa *6 Brazil *23 Israel *40 Spain 7 Bulgaria *24 Italy 41 Sweden
*8 Canada 25 Jamaica *42 Switzerland *9 Chile 26 Jordan 43 Thailand 10 China 27 Kenya 44 Tunisia 11 Costa Rica 28 Malaysia *45 Turkey 12 Denmark *29 Morocco *46 United Kingdom 13 Ecuador 30 Namibia 47 Uruguay 14 Egypt *31 Netherlands *48 USA 15 El Salvador 32 New Zealand 49 Venezuela 16 France 33 Norway 50 Zambia
*17 Germany 34 Pakistan 51 Zimbabwe Note: All countries (51) used in the linear TSCS models. * indicates economies used in Griliches models (21 countries). LTSCS models are designed to overcome the limitations of usual linear models.
When pooling data, it is highly likely that one or more assumptions of the usual linear
model may be violated. Fomby et al. (1984, p. 337) point out several such possibilities.
First, the error terms in a pooled model may be “heteroskedastic, autocorrelated and may
exhibit contemporaneous correlation” which make generalized least square technique
inappropriate. Second, the parameters of the data generating process may differ from
observation to observation. The reactions of different individuals may be different to
changes in explanatory variables and the reactions may also change over time. LTSCS
models allow for differences in behavior over cross sectional units as well as the
differences in behavior over time for a given cross section. In this way, such models are
likely to be consistent with the way the data were generated (Fomby et al. 1984). Problems
related to such models include the selection of the most efficient estimation procedures and
testing of hypotheses about the parameters.
17

The following LTSCS models were employed:
),5(21000
),4(21000
11 itkitkitititkitkitit xK
kIUPKitIUPKitx
K
kIHPKitIHPKit εββεββ +∑
==
−+∑
==
−++
where, IHPKit is the number of Internet hosts per 1000 people, IUPKit is the number of
Internet users per 1000 people, β1it is the dummy variable for the ith country for the tth time
period and βkit (k ≥ 2) are the slopes. Xkit (k ≥ 2) is the value of the factor Xk for the ith
country in time t.
Several factors need to be taken into account in selecting the appropriate model.
The first is the choice between fixed and random effect models. For the fixed effect (or
dummy variable) model, the intercept term β1it in (4) and (5) above can be written as
β1it = αi + τt (6),
where αi are the country “dummies” and τt are the time “dummies”. The dummy variable
model, however, eliminates a major portion of the variation among explained as well as
explanatory variables if the between-country and between-time period variation is large
(Maddala 1971), a likely occurrence in Internet diffusion data. Additional problems
include a loss in a substantial number of degrees of freedom and a lack of meaningful
interpretation of the dummy variables (Maddala 1971).
These problems can be overcome by treating αi and τt as random in which case
only two parameters, the mean and the variance of the α's (and similarly for τ's), are
estimated instead of N+T parameters in dummy variable models, where N is the number of
cross-sections and T is the number of time periods. The procedure of treating αi and τt as
random can be rationalized by arguing that the dummy variables do in effect represent
18

some ignorance – just like εit. Maddala argues that this type of ignorance, or “specific
ignorance,” can be treated in the same manner as εit. Then the residual can be written as:
uit = αi + τt+ εit (7).
In TSCS models, two considerations, logical and statistical, may determine the
choice of specification—fixed vs. random (Hausman 1978). The logical consideration is
whether β1it can be considered random and drawn from an independently and identically
distributed (IID) distribution (Hausman 1978, p. 1263). The statistical consideration is
whether the β1it’s satisfy “di Finnetti’s exchangeability criterion” (p. 1263), a necessary
and sufficient condition for random sampling. If these conditions are satisfied, then the
random model can be more appropriate than the fixed model. To empirically test the
statistical consideration, we estimated the fixed effect model9 for 51 cross-sections for
which “complete” data for the period 1994-99 were available. Then we calculated the
correlation between the country specific fixed effects and time specific fixed effects with
other country-specific factors or regressors (Table 5).
Table 5: Pearsonian correlations between country and time specific fixed effects with regressors
Variable Pearsonian correlation coefficient with country specific fixed effect (p-value)
Pearsonian correlation coefficient with time specific fixed effect (p-value)
Population (POP) 0.087 (0.546) 0.518 (0.371) Per capita GNP (GNPPC) 0.281 (0.048) -0.334 (0.582)
Telecom investment (TELINV)
-0.051 (0.726) 0.985 (0.002)
Political freedom (PFD) -0.151 (0.295) -0.891 (0.042) Population density
(PODE) 0.052 (0.719)
19

As table 5 indicates, of the 9 Pearsonian correlation coefficients, only one is
significant at 1% level. Since most of the Pearsonian correlation coefficients were
insignificant, it became clear that random effect LTSCS models are more appropriate for
the given data set than fixed effect LTSCS models.
After knowing the appropriateness of the random effect LTSCS models over fixed
effect ones, the next step is to select the most appropriate random effect model. In the
pooled data on Internet diffusion, it is reasonable to expect heteroskedasticity [i.e. E(uit2) =
σii], contemporaneous correlation or spatial heterogeneity [i.e. E(uitujt) = σij] (Anselin
1987), and autoregression [i.e. uit = ρiui,t-1+eit]. The three most commonly used estimation
procedures for random effect TSCS models are Fuller-Battese, Da Silva and Parks. The
Fuller-Battese (Fuller and Battese 1974) takes only heteroskedasticity into account while
Da Silva (1975) considers heteroskedasticity and autoregression. The Parks (1967)
method, on the other hand, takes heteroskedasticity, autoregression as well as
contemporaneous correlation into account (See Appendix 1).
Data Analysis, Discussion and Limitations We estimated the following models for the global country-level data:
1. GDF (Dependent variable: Diffusion speed and location effect)
2. LTSCS models for the period 1994-99 (Dependent variable: Penetration rate)
Estimation of Griliches Logistic Model The dependent variable for this analysis was Internet hosts per 1000 (IHPK). Twenty one
countries (table 4) were considered covering the years 1994 to 1999. Table 6 provides the
results of the estimation of Griliches diffusion function for 21 developing and developed
economies. We have presented the results only for the combinations of variables for which
the model converged.
20
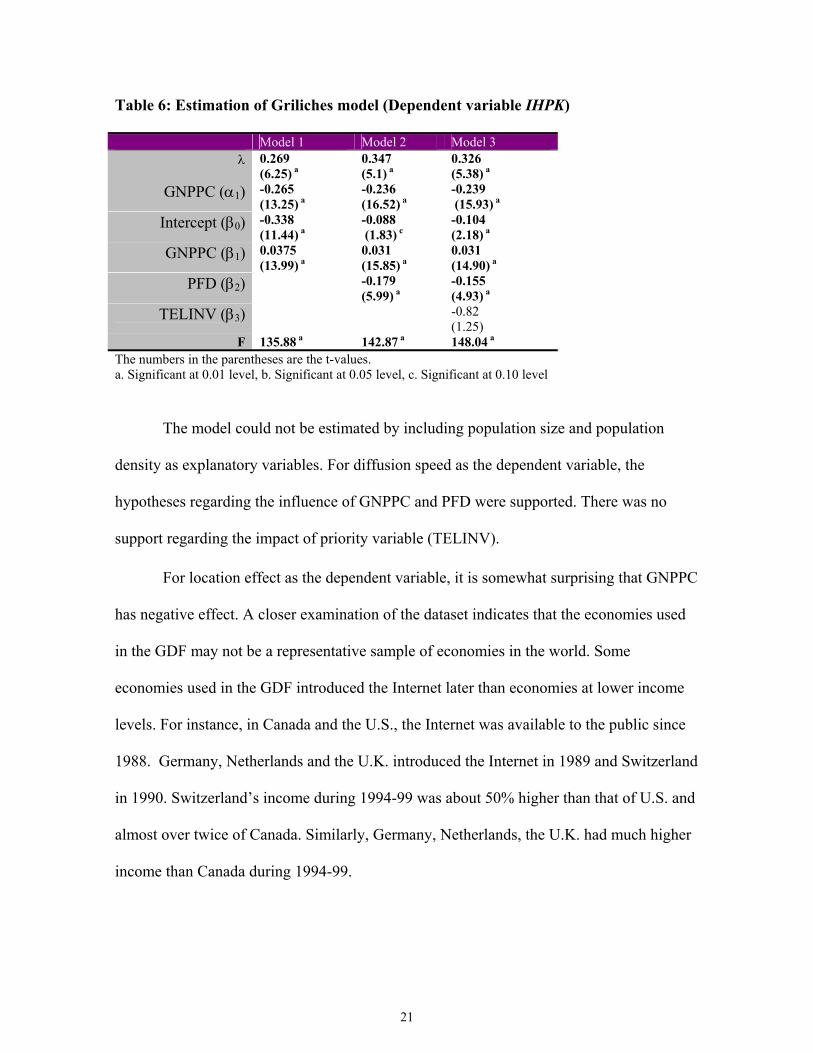
Table 6: Estimation of Griliches model (Dependent variable IHPK)
Model 1 Model 2 Model 3 λ 0.269
(6.25) a 0.347 (5.1) a
0.326 (5.38) a
GNPPC (α1) -0.265 (13.25) a
-0.236 (16.52) a
-0.239 (15.93) a
Intercept (β0) -0.338 (11.44) a
-0.088 (1.83) c
-0.104 (2.18) a
GNPPC (β1) 0.0375 (13.99) a
0.031 (15.85) a
0.031 (14.90) a
PFD (β2) -0.179 (5.99) a
-0.155 (4.93) a
TELINV (β3) -0.82 (1.25)
F 135.88 a 142.87 a 148.04 a The numbers in the parentheses are the t-values. a. Significant at 0.01 level, b. Significant at 0.05 level, c. Significant at 0.10 level
The model could not be estimated by including population size and population
density as explanatory variables. For diffusion speed as the dependent variable, the
hypotheses regarding the influence of GNPPC and PFD were supported. There was no
support regarding the impact of priority variable (TELINV).
For location effect as the dependent variable, it is somewhat surprising that GNPPC
has negative effect. A closer examination of the dataset indicates that the economies used
in the GDF may not be a representative sample of economies in the world. Some
economies used in the GDF introduced the Internet later than economies at lower income
levels. For instance, in Canada and the U.S., the Internet was available to the public since
1988. Germany, Netherlands and the U.K. introduced the Internet in 1989 and Switzerland
in 1990. Switzerland’s income during 1994-99 was about 50% higher than that of U.S. and
almost over twice of Canada. Similarly, Germany, Netherlands, the U.K. had much higher
income than Canada during 1994-99.
21

LTSCS Analyses The dependent variable for this analysis was Internet Penetration rate, and the period
covered was 1994 to 1999. In the TSCS model, we used per capita GNP (GNPPC),
population density (PODE), population size (POP), political freedom (PFD) and telecom
investment as a proportion of GDP (TELINV) as the explanatory variables.
Table7a: TSCS analysis (Dependent variable: lnIHPKit
IHPKit−1000
) for 51 economies
(1994-99) Model 1 Model 2 Model 3 Model 4 Intercept -0.40 (-0.10) -1.26 (-0.36) 0.13 (0.03) 0.79 (0.20) GNPPC 1.42 (4.32) 1.56 (6.24) 1.12 (4.61) 1.32 (4.78)
PFD -1.33 (-6.39) -1.21 (-4.76) TELINV 0.256 (6.53) 0.17 (2.39)b
POP -0.19 (-0.54) 0.02 (0.01) -0.06 (-0.18) -0.08 (-0.22) PODE 0.21 (1.51) 0.22 (1.83)c 0.19 (0.13) 0.09 (0.52)
R2 0.72 0.85 0.83 0.79
Table 7b: TSCS analysis (Dependent variable: lnIUPKit
IUPKit−1000
) for 51 economies
(1994-99) Model 1 Model 2 Model 3 Intercept -4.08 (-1.90)b -3.90 (-2.64)a -3.13 (-1.96)c GNPPC 1.69 (10.17)a 1.89 (25.6)a 1.31 (13.39)a
PFD -1.95 (-15.91)a TELINV 0.19 (7.61)a
POP -0.07 (-0.38) 0.02 (2.15)a 0.12 (0.79) PODE 0.24 (1.90)c 0.16 (1.39) 0.11 (3.24)a
R2 0.98 0.99 0.98 The numbers in the parentheses are the t-values. a. Significant at 0.01 level b. Significant at 0.05 level c. Significant at 0.10 level (Note: All regressors are the natural logarithmic transformations of the original variables).
Table 7a and table 7b present the results of LTSCS models with IUPK and IHPK as
the dependent variables. As tables 6; 7a and 7b indicate income and political freedom
variables influence the penetration rate and diffusion speed of the Internet. Telecom
22

investment as a proportion of GDP has a significant effect on Internet penetration in the
LTSCS model but not in the GDF. Population and population density, on the other hand,
gave mixed results. We also found that the random effect LTSCS model is more
appropriate than the fixed effect model to study the global diffusion of the Internet.
Table 8: Correlation Matrix for 1999 data PFD TELINV POP PODE
GNPPC -0.73a -0.03 0.01 0.18b PFD -0.12 0.30a -0.10
TELINV -0.25c -0.02 POP -0.03
a. Significant at 0.01 level b. Significant at 0.05 level c. Significant at 0.10 level
Although the data set used in this paper has a distinct advantage in the sense that it
represents real “action” rather than attitude or intention as used in most studies, there are
some limitations as well. First, the accuracy of the data on Internet users, which were
obtained by government surveys, may vary widely across economies.
Second, despite our attempt to include more developing countries, we could include
only a few especially in the Griliches diffusion function indicating a possible bias of the
findings towards developed countries. Third, it is difficult to find country specific
explanatory variables that have significant effect on Internet diffusion and at the same time
not correlated with the income variable.
In this paper, we mainly focused on the factors influencing the diffusion of the
Internet. When data on e-commerce transactions become available for several economies,
TSCS models with e-commerce transactions as the dependent variable would provide
valuable insights into the factors that are likely to influence the commercial uses of the
Internet.
23

Finally, international agencies concerned with the diffusion of information and
communications technologies (ICTs) should place higher emphasis on collecting relevant
time series data on various factors that are related to the diffusion dynamics.
24

Appendix 1: Parks Method
E(uit2) = σii (heteroskedasticity)
E(uitujt) = σij (contemporaneous correlation)
uit = ρiui,t-1+εit (autoregression)
where,
E(εit) = 0
E(ui,t-1εjt) = 0
E(εitεjt) = φij
E(εitεjs) = 0 (s ≠ t)
E(ui0) = 0
E(ui0uj0) = σij = φij
1-ρiρj
The model assumed first order autoregressive with contemporaneous correlation
between cross sections. The covariance matrix of u is
E(uu’) =V=
σ11P11 σ12P12………..σ1NP1N
σ21P21 σ22P22 ………..σ2NP2N
……………….…………………………
σN1PN1 σN2PN2………..σNNPNN
Where,
25

Pij =
1 ρj ρj
2 ………ρJT-1
ρi 1 ρj ………ρJT-2
ρi2 ρi 1 ………ρJ
T-3
……………………… ρi
T-1 ρiT-2 ρi
T-3 …1
V is estimated by using two-stage procedure, and β is then estimated by using
generalized least square (GLS). The first step in estimating V entails the use of ordinary
least square (OLS) and then obtain the fitted residuals, as follows:
u = y - X β OLS
Estimation of ρ i
A consistent estimator of the first-order autoregressive parameter is obtained as follows:
ρ i = ( i = 1,2 ………,N. )ˆ(/)ˆˆ 21,
21,
2uuu ti
T
ttiit
T
t−
=
−
=∑∑
The autoregressive character of the data can be removed (asymptotically) by the usual
transformation of taking weighted differences. That is for i= 1, ….., N.
yi1 )ˆ1( 2ρ i− = k
p
kkiX β∑
=11 )ˆ1( 2ρ i− +ui1 )ˆ1( 2ρ i−
yi1- yρ i i,t-1 = + uβρ kktiitk Xip
kX )ˆ
1( ,1, −−∑
=it - ui,t-1 , t = 2, ……,T
which can be written as
yit* = + i = 1, 2, ……,N; t = 1,2, ….,T. β kitk
p
kX∑
= 1* uit
*
It should be noted that the transformed model has not lost any observation.
26

Estimation of V
u* = y - X β *
OLS
from which the consistent estimator of σij is calculated.
sij = )ˆˆ1(
ˆ
ρρφ
ji
ij
−
where,
φ ij =
1T-P ∑
=
T
tuu jtit
1**
EGLS then proceeds in the usual manner:
yVXXVXpˆ'ˆ 1'ˆ 11
)( −−−=β
where V is the derived consistent estimator of V. For computational purposes, is
obtained directly from the transformed model,
β p
yXXX TTp II )ˆ()ˆ( *11 *'1*')(*'ˆ ⊗−
⊗=−−
φφβ
The procedure is equivalent to Zellner’s two-stage methodology applied to the transformed
model (Zellner 1962).
Parks demonstrates that his estimator is consistent and asymptotically, normally distributed
with
Var ( )( ˆ 1')ˆ1
XVXp−=
−
β
27

28
References Andreasen, A. 1990. Cultural Interpretation: A Critical Consumer Research Issue for the
1990s," In M.E. Goldberg and R.W. Pollay (Eds.) Advances in Consumer Research, 17, 847-49, Provo, UT: Association for Consumer Research.
Anselin, L., 1987. Spatial Econometrics: Methods and Models, Boston: Kluwer Academic Publisher.
Antonelli, C. 1993. Investment and Adoption in Advanced Telecommunications, J. of Econ. Behavior and Org. 20 (February), 227-45.
Arnold, D. J., J.A Quelch. 1998. New Strategies in Emerging Markets, Sloan Management Review, Fall, 7-20.
Barro, R. J. 1999. Determinants of Democracy. J. of Political Economy. 107(6), s158-s183.
Bass, F. M. 1969. A New Product Growth for Model Consumer Durables. Management Sci. 15 (5), 215-227.
BBC News, 2002. Behind China's Internet Red Firewall.bbc.com, 3 September, http://news.bbc.co.uk/2/hi/technology/2234154.stm.
Beise, M. 2001. Lead markets: Country-specific success factors of the global diffusion of innovations, Heidelberg: Physica-Verlag.
Boettinger, H. M. 1977. Our Sixth and a Half Sense, Ithiel De Sola Pool (Eds.) The Social Impact of the Telephone, MA: MIT Press, 200-7.
Buchner, B. J., 1988. Social control and diffusion of modern telecommunications technologies: A cross-national study. American Sociological Review, 53 (June), 446-53.
Branson, W.H. 1992. Macroeconomic Theory and Policy, New Delhi: Universal Book Stall.
Bruce, J.2000. Brazilian Recovery Attracts Investment, Global Finance, 14 (7), 65-67
Chinese Education and Research Network, 2001. Zhejiang to regulate Internet banners. http://www.edu.cn/20010101/22583.shtml.
CIA. 2001. World Fact Book 2001, Central Intelligence Agency, http://www.odci.gov/cia/publications/factbook/
Da Silva, J.G.C. 1975. The Analysis of Cross-Sectional Time Series Data, Ph.D. dissertation, Department of Statistics, North Carolina State University.
Dekimpe, M. G., P. M. Parker, M. Sarvary. 2000. Global Diffusion of Technological Innovations: A Coupled-Hazard Approach, J. of Marketing Research, XXXVII (February), 47-59.
Diamond, L. 1992. Economic Development and Democracy Reconsidered, American Behavioral Scientist, 35(4/5), 450-99.
Euromonitor. 2001a. European Marketing Data and Statistics: London.
Euromonitor. 2001b. International Marketing Data and Statistics: London.

29
Fomby, T. B., R. C. Hill, S.R. Johnson. 1984. Advanced Econometric Methods, Springer-Verlag: New York.
Freedom House. 2000. Annual Survey of Freedom Country Ratings: 1972-73 to 1999-00, The Freedom House.
Fuller, W.A., G.E. Battese. 1974. Estimation of Linear Models with Crossed-Error Structure, J. of Econometrics, 2, 67-78
Ganesh, J., V. Kumar, V. Subramaniam. 1997. Learning Effect in Multinational Diffusion of Consumer Durables: An Exploratory Investigation, J. of the Academy of Marketing Sci. 25 (3), 214-228.
Gastil, R. D. 1986, 1987.Freedom in the World. Westport, Conn.: Greenwood.
Gatignon, H., J. Eliasherg, T. Robertson.1989. Modeling Multinational Diffusion Patterns: An Efficient Methodology, Marketing Science, 8 (3), 231-247.
Gatignon, H., T. Robertson 1985. A Propositional Inventory for New Diffusion Research, Journal of Consumer Research, 11 (March), 849-867.
Gelman, A., J. B. Carlin, H. S. Stern, D. B. Rubin 1995, Bayesian Data Analysis, London: Chapman and Hall.
Ger, G., R.W. Belk.1996. I'd Like to Buy the World a Coke: Consumptionscapes of the "Less Affluent World", Journal of Consumer Policy, 19 (3), 271-304.
Goldsmith, A. A.1999. Slapping the Grasping Hand: Correlates of Political Corruption in Emerging Markets, American Journal of Economics & Sociology, 58(4), 865-83.
Goldstein, D. 2000. History of the Internet, online at: http://www.nic.at/english/geschichte.html.
Greene, W.H. 1999. Econometric Analysis, 4th Ed., NJ: Prentice Hall.
Griliches, Z. 1957. Hybrid Corn: An Exploration in the Economies of Technological Change, Econometrica, 25, 501-22.
Groth, A., W. R. Hunt. 1985. Marxist-Leninist Communications Systems in Comparative Perspective, Coexistence, 22, 123-36.
Gruber, H., F. Verboven 2001. The Diffusion of Mobile Telecommunications Services in the European Union, European Economic Review, 45, 677-588.
Hargittai, E. 1999. Weaving the Western Web: Explaining Differences in Internet Connectivity among OECD Countries," Telecommunications Policy, 23, 701-18.
Hausman, J. 1978. Specification Tests in Econometrics, Econometrica, November,
Helsen, K., K. Jedidi, W. S. DeSarbo. 1993. A New Approach to Country Segmentation Utilizing Multinational Diffusion Patterns, J. of Marketing, 67 (October), 60-71.
Hermida, A., 2002. Saudis Block 2,000 Websites. bbc.co.uk, July 31, http://news.bbc.co.uk/2/hi/technology/2153312.stm.
Hill, R. P., K. K. Dhanda. 1999. Gender Inequity and Quality of Life: A Macromarketing Perspective, J. of Macromarketing, 19 (2), 140-152

30
Jain, D., R. C. Rao. 1990. Effects of Price on the Demand for Durables: Modeling, Estimation, and Finding, Journal of Business and Economic Statistics, 8 (2), 163-170.
Jain, D., V. Mahajan, E. Muller.1991. Innovation Diffusion in the Presence of Supply Restrictions, Marketing Science, 10 (1), 83-90.
Joselyn, R. W. 1977. Designing the Marketing Research Project. New York: Mason-Charter.
Kotabe, M., 2002. Using Euromonitor Database in International Marketing Research. Academy of Marketing Sci. J., 30(2), 172-175.
Kotabe, M., Helsen, K., 2001. Global Marketing Management. 2nd ed, New York: John Wiley.
Kshetri, N. 2001a. The Dynamics of Government Regulation and E-Commerce Development: A Comparison of Malaysia and Singapore, Proceedings of the 23rd Annual Conference of Pacific Telecommunications Council, Hawaii, January 14-18, 2001.
Kshetri, N. 2001b. Determinants of the Locus of Global E-Commerce,” Electronic Markets, 11(4), 250-7.
Kshetri, N., M. K. Cheung. 2002. What Factors are Driving China's Mobile Diffusion?, Electronic Markets,12(1), 122-6.
Kshetri, N., N. Dholakia. 2001. Impact of Cultural and Political Factors on the Adoption of Digital Signatures in Asia, Proceedings of the Americas’ Conference on Information Systems, Boston, MA, August 2-5.
Kshetri, N., N. Dholakia. 2002a. Internet and E-Commerce Development in Asian Tigers: A Comparison of Chinese Taipei and Hong Kong, Proceedings of the 24th Annual Conference of the pacific Telecommunications Council, Honolulu, HI, January 13-17.
Kshetri, N., N. Dholakia. 2002b. Determinants of the Global Diffusion of B2B E-Commerce," Electronic Markets, 12(2), 120-9.
Lehmann, D. R. 1999. Section I: How Do Customers and Consumers Really Behave?, Journal of Marketing, 63 (Special Issue), 14-18.
Maddala, G.S. 1971. The Use of Variance Components Models in Pooling Cross Section and Time Series Data, Econometrica, 39 (2), 341-58.
Mahajan, V. E. Muller, F. M. Bass. 1990. New Product Diffusion Models in Marketing: A Review and Directions for Research, J. of Marketing, 54 (January), 1-26.
Malhotra, N. K., M. Peterson, S. B. Kleiser. 1998. Assessing the Reliability and Validity of International Secondary Data Used to Design Competitive Strategies for Global Marketing, Research in Marketing, 14, 185-228.
Mueller, M. 1999. Emerging Internet Infrastructures Worldwide, Communications of the ACM, 42 (6), 28-30.
National Academy of Science. 1995. Allocating Federal Funds for Science and Technology, Washington, D.C.: National Academy press.

31
Parks, R.W. 1967. Efficient Estimation of a System or Regression Equations When Disturbances are Both Serially and Contemporaneously Correlated, J. of the American Statistical Association, 62, 500-509.
Peterson, R. A, S. Balasubramanian, B. J. Bronnenberg. 1997. Exploring the Implications of the Internet for Consumer Marketing, Academy of Marketing Sci. J. 25(4), 329-346.
Pitroda, S. 1993. Development, Democracy, and the Village Telephone, Harvard Bus. Rev. 71 (November/December).
Putsis, W. P., S. Balasubramanian, E. H. Kaplan, S. K. Sen. 1997. Mixing Behavior in Cross-Country Diffusion, Marketing Sci, 16 (4), 354-69.
Robertson, T. S., H. Gatignon. 1986. Competitive Effects on Technology Diffusion, J. of Marketing, 50 (3), 1-12.
Rogers, E.M. 1983. The Diffusion of Innovations, 3rd edn. Free Press, New York.
SAS Institute Inc. 1999, SAS/ETS User's Guide, Version 8, Cary, NC: SAS Institute Inc.
Shuja, S.M. 2001. Post-Cold War International Relations: Trends and Portents, Contemporary Review, February, 82-86.
Simon, H., K. Sebastian. 1987. Diffusion and Advertising: The German Telephone Campaign, Management Science, 33 (April), 451-466.
Singer, M., 2002. Google blocked in China, Siliconvalley.internet.com, September 3,
http://siliconvalley.internet.com/news/article.php/1455921.
Statistical Abstract of the U.S. (1997, 1998, 1999, 2000, 2001).
Takada, H., D. Jain. 1991. Cross-National Analysis of Diffusion of Consumer Durable Goods in Pacific Rim Countries, J. of Marketing, 55 (April), 48-54.
Tellefsen, T., H. Takada. 1999. The Relationship Between Mass Media Availability and the Multicountry Diffusion of Consumer Products, J. of International Marketing, 7 (1), 77-96.
UNCTAD. 1999. The Least Developed Countries 1999 Report, The United Nations Conference on Trade and Development, Geneva.
UNDP. 2001. Human Development Report, New York: United Nations Development Program, http://www.undp.org/hdr2001/completenew.pdf, accessed 11 July 2001.
Zellner, A. 1962. An Efficient Method of Estimating Seemingly Unrelated Regression and Tests for Aggregation Bias, J. of the Ame. Stat. Association, 57, 348-368.
Endnotes 1 OECD stands for the Organization for Economic Cooperation and Development, the body that represents about 30 advanced, democratically governed economies of the world. The work by Dekimpe, Parker and Sarvary (2000) is an exception. They consider the diffusion of digital mobile technology in 162 countries. However, the study focuses only on the introduction of the mobile technology and not on the penetration level in individual countries.
32
2 These variables influence Internet diffusion by shifting the Internet demand curve forward or backward, thereby producing income effect, compatibility effect, skill effect, distance effect, etc. 3An Internet host is “a computer system connected to the Internet—either a single terminal directly connected or a computer that allows multiple users to access network services through it” (UNDP 2001). 4 All the hypotheses are stated on a ceteris paribus – other things being equal – basis. The phrase “Ceteris paribus” is implicit at the beginning of each hypothesis statement, and has not been explicitly stated. 5 We used only the period 1994-99 in the estimation TSCS models and the GDF because of the unavailability of data on explanatory and/or dependent variables for several economies. 6 Gruber and Verboven (2001) used equation (1) to estimate mobile telecom diffusion in the European Union countries. 7 We could not estimate β4, β5, and α4 because of convergence problems in the Griliches model. 8 Although a significant proportion of users these days access the Internet via non-dial up channels such as broadband, such means were very limited until 1999. So we used, telephone penetration as the upper limit for Internet penetration. 9 Even if random effects specification is found more appropriate on logical ground, one may still estimate fixed effects models. The fixed effect estimators are based on a particular sample which treats them as fixed in the sample (Hausman 1978).

Our responsibility is to provide strong academic programs that instill excellence,confidence and strong leadership skills in our graduates. Our aim is to (1)promote critical and independent thinking, (2) foster personal responsibility and(3) develop students whose performance and commitment mark them as leaderscontributing to the business community and society. The College will serve as acenter for business scholarship, creative research and outreach activities to thecitizens and institutions of the State of Rhode Island as well as the regional,national and international communities.
Mission
The creation of this working paper serieshas been funded by an endowmentestablished by William A. Orme, URICollege of Business Administration,Class of 1949 and former head of theGeneral Electric Foundation. This workingpaper series is intended to permit facultymembers to obtain feedback on researchactivities before the research is submitted toacademic and professional journals andprofessional associations for presentations.
An award is presented annually for the mostoutstanding paper submitted.
Founded in 1892, the University of Rhode Island is one of eight land, urban, and sea grantuniversities in the United States. The 1,200-acre rural campus is lessthan ten miles from Narragansett Bay and highlights its traditions ofnatural resource, marine and urban related research. There are over14,000 undergraduate and graduate students enrolled in seven degree-granting colleges representing 48 states and the District of Columbia.More than 500 international students represent 59 different countries.Eighteen percent of the freshman class graduated in the top ten percentof their high school classes. The teaching and research faculty numbersover 600 and the University offers 101 undergraduate programs and 86advanced degree programs. URI students have received Rhodes,
Fulbright, Truman, Goldwater, and Udall scholarships. There are over 80,000 active alumnae.
The University of Rhode Island started to offer undergraduate businessadministration courses in 1923. In 1962, the MBA program was introduced and the PhDprogram began in the mid 1980s. The College of Business Administration is accredited byThe AACSB International - The Association to Advance Collegiate Schools of Business in1969. The College of Business enrolls over 1400 undergraduate students and more than 300graduate students.
Ballentine HallQuadrangle
Univ. of Rhode IslandKingston, Rhode Island