working paper series - igier.unibocconi.it · available, thus restricting research on this topic to...
TRANSCRIPT

Institutional Members: CEPR, NBER and Università Bocconi
WORKING PAPER SERIES
Secondary Buyouts
Stefano Bonini
Working Paper n. 441
This Version: May, 2012
IGIER – Università Bocconi, Via Guglielmo Röntgen 1, 20136 Milano –Italy http://www.igier.unibocconi.it
The opinions expressed in the working papers are those of the authors alone, and not those of the Institute, which takes non institutional policy position, nor those of CEPR, NBER or Università Bocconi.
Secondary Buyouts
Stefano Bonini*Bocconi University
Via Roentgen 1, 20136, Milan, [email protected]
+39025836.3612
This draft: May 2012
JEL Codes: G01, G24, G34Keywords: Secondary buyout, Private Equity, Financial Crisis* * I thank Viral Acharya, David Yermack, Samuel Lee, Cem Demiroglu, Maurizio Dal-
locchio, Ludovic Phalippou and seminar participants at the NYU Pollack Center for Law &
Business, the 2010 EFM Symposium on Entrepreneurial Finance and Venture Capital, and
the 2011 FMA Conference for helpful comments and suggestions. I am indebted to Elio
Battaglia, Martina Domeniconi and Andrea Gagliardi for their excellent research assistance.
I thank S&P LCD and Mergermarket for providing the data. This paper was conceived while
the author was a Visiting Associate Professor at NYU Stern. The ideas expressed in this paper
are those of the author and do not necessarily re�ect the position of the author�s institutions.
Any errors that remain are my own.
Abstract
In this paper, we show that secondary buyouts (SBOs) do not generate a signi�cant
improvement in the operating performance of target companies. We collect deal-level infor-
mation on 2,911 buyouts between 1998 and 2008 and gather detailed �rm-level �nancial and
accounting information on 163 companies targeted by two consecutive leveraged acquisitions
in the period 1998-2008. We show that �rst-round buyers generate a large and signi�cant ab-
normal improvement in operating performance and e¢ ciency. In contrast, SBO investors do
not show statistically signi�cant evidence of incremental contribution to the performance of
target companies whereas they increasing leverage and squeeze-out. Returns to PE investors
are signi�cantly lower in secondary transactions and are mostly determined by large dividend
payments. Market-wide SBO activity is signi�cantly determined by favorable debt market
conditions and PE reputation. Additionally, large and high-value deals are more likely to be
exited through an SBO. We test a possible collusive motive for this class of deals, �nding
some support for this conjecture.
"How well investors are being served by secondary buyouts is [un]clear [...] the risk ofoverpayment in a secondary buyout is great. Once a business has been spruced up by
one owner, there should be less value to be created by the next"*
"We have sold the company because we had extracted all the value a private equityinvestor could generate"**
"Investors have grumbled about secondary buyouts [...] because the transaction costsin buying and selling companies made it expensive for investors in private equityfunds [...] If secondary buyout companies turn out to be more vulnerable tobankruptcy �lings than other types of deals, the groans will grow louder"***1
Introduction
Following the substantial growth of the Private Equity (PE) industry in the 80s and 90s,
several theoretical and empirical contributions have attempted to explain the economic
sources of returns of buyout transactions and the impact of PE investors on acquired
companies.2 However, established theories have been challenged by the recent surge of
a family of deals known as secondary buyouts (SBOs). Secondary buyouts are leveraged
buyouts in which both the buyer and the seller are private equity �rms. Second-round
acquirers provide a new ownership structure including, typically, a new set of private
equity �nanciers while the original �nanciers and possibly some of the management
exit (Cumming et al. 2007). SBOs have historically been almost exclusively con�ned
to distressed transactions, as successful deals would be exited through IPOs or trade
sales, but in the six years leading up to the collapse of the buyout market, PE investors
increasingly sought exit by selling initial buyouts to other PE �rms in secondary lever-
aged buyouts that increased from 3% of all exits to above 30%. However, the economic
rationale of this spectacular growth and the e¤ects of SBOs on the operating perfor-
mance of target companies are unclear. In particular, the increasingly popular wisdom
is that secondary buyouts have a limited association with operational improvements and
are mainly motivated by temporary market conditions, collusion and investor-speci�c
characteristics. Surprisingly, empirical evidence on this issue is almost non-existent.
Previous research focuses on the US market, where data on private companies are not
1*"Circular Logic", The Economist, 2/27/2010; **Andrea Bonomi, Investindustrial Private EquityCEO, Ducati sale to Audi press release, 4/19/2012; ***"A Troubling Sign for Secondary Private-EquityBuyouts?", The Wall Street Journal 3/6/2009.
2See Wright et al. (2009) for a detailed review.
3

available, thus restricting research on this topic to public-to-private transactions, which
account for less than 6% of all LBO transactions, as reported by Stromberg (2008).
In this paper, we contribute to the literature in several ways. First, we provide
previously unavailable evidence on the di¤erential changes in operating performance in
companies targeted by two consecutive LBOs. Secondly, we obtain our results track-
ing the operating performance of 163 companies3 targeted by two consecutive buyouts,
from one year before the �rst buyout to two years after the second buyout. To the best
of our knowledge, this is the only study that directly adopts a panel data approach,
which allows the direct measurement of operating e¢ ciency changes between buyout
rounds for the same company. We believe that this approach outperforms a typical
peer sample approach, as it enables the isolation of the true di¤erential e¤ect of �rst-
round buyers from second-round investors, thus providing cleaner and less equivocal
inferences than alternative methodologies such as industry/size matching or propensity
score matching.4 Finally, we investigate alternative motivation for SBO deals speci�-
cally addressing credit market conditions and collusion that seem to have signi�cantly
shifted the investment logic of PE �rms.
Our �ndings show that follow-up deals create little, if any, di¤erential value. In
particular, we robustly show that most of the latent value is extracted by the �rst-
round investor and that limited or no operating value is created by second-round in-
vestors. Returns to PE investors are accordingly much greater for primary buyers and
are mainly driven by the growth in operating performance, which translates to higher
exit values. In contrast, secondary deal returns rely heavily on dividend payout and
appear to present higher default risk. These results suggest that PE investors increas-
ingly viewed SBOs as a "shortcut" to generate positive returns and maximize their
follow-up fundraising. Because SBO target companies have proven to be solid cash �ow
generators able to cope with the stringent requirements of PE owners, investing in such
companies, despite the limited room for incremental growth, can be a rational portfo-
lio diversi�cation strategy, where more risky �rst-round investments are balanced by a
signi�cant fraction of less risky deals. This diversi�cation strategy can be substantially
stimulated by favorable market conditions and could potentially translate into collu-
sive practices. In a set of probit regressions, we show that deal value and investment
3This is equivalent to 326 stand-alone deals because each company must be target to two consecutivebuyouts to be included in the sample.
4Wang (2011) focuses on the same topic but employs propensity score matching. Although theexercise is technically sound, the results remain questionable, as they cannot rule out the possibilitythat �rst-round deals did not experience a second round transaction, which raises endogeneity concerns.
4
duration positively a¤ect the likelihood of observing an SBO. More interestingly, the
increase in the market debt multiple and the decrease in the cost of leveraged �nance
strongly increase the probability of exiting a primary deal through a secondary sale.
The reputation of the secondary syndicate is a crucial factor in SBOs, con�rming the
results of Demiroglu and James (2010) This suggests that the market believes that the
higher risk of SBOs given by limited expected value creation is partially o¤set by the
superior screening and monitoring skills of highly reputable PE investors. A �nal set of
tests of the existence of collusion in the PE industry provide support for the conjecture
that the role of SBOs in diversi�cation is facilitated by some form of "reciprocity": PE
managers buy from each other in secondary deals to maximize their invested capital and
sustain returns, thus arguably increasing the likelihood of further future fundraising.
The paper is organized as follows. The �rst section reviews the literature contribu-
tions on leveraged buyouts and discusses the implications for SBOs. Section 2 presents
the data Section 3 introduces the methodology and documents the operating perfor-
mance of SBO companies. Section 4 examines the investor performance. Section 5
explores alternative determinants of the SBO activity, and Section 6 concludes.
1 Buyouts and secondary buyout theoretical moti-
vations
Only a few studies have addressed the theoretical and empirical characteristics of SBOs.
Cumming et al. (2007) and Wright et al. (2009), using data collected by the Center for
Management Buyout Research at Nottingham University, believe that secondary buy-
outs have become an important driver of buyout activity in terms of both the number
of deals and the transaction value. Levis (2008) using data from the British Venture
Capital Association and Price Waterhouse Coopers, shows that between 1998 and 2006,
secondary buyouts accounted for 4% of exits and 10.8% of the total value divested by
the private equity industry in the UK. Using data from Capital IQ, Stromberg (2007)
shows that secondary buyouts represented 20% of global leveraged buyout (LBO) ac-
tivity in terms of enterprise value transacted between 1970-2007 and 24% of exits over
the same period. A stream of research has examined secondary buyouts as an exit
route. Nikoskelainen and Wright (2007) document that secondary buyout exits in the
UK have a median index-adjusted IRR of 2.0%, which is signi�cantly lower than that
5

of IPOs and trade sales exit routes.
Despite the increasing dissemination of such transactions, no studies have been
conducted on the e¤ect of secondary buyouts on the operating performance of target
companies. Wright et al. (2009) and Cumming et al. (2007) identify secondary buyouts
as a research area that presents several unresolved issues. Both contributions empha-
size that no empirical evidence is available on the e¤ects of such transactions on target
companies and that the economic rationale of secondary buyout is puzzling. In fact,
SBOs have been explained (with limitations) by borrowing from broader existing theo-
ries on LBOs. However, it is doubtful that these theories can satisfactorily explain SBO
activity. Following Palepu (1990) and Kaplan and Stromberg (2009) we identify three
main theories motivating leveraged acquisitions: value creation, mispricing exploitation
and value transfers from other players.
1.1 Value Creation
There is a large stream of literature investigating the e¤ect of private equity investors
on the performance of target companies (Cumming et al. (2007) and Kaplan and
Stromberg (2009) provide comprehensive surveys). Several theoretical and empirical
contributions have explored how leveraged buyout investors increase the performance
of portfolio companies. A commonly shared view is that a PE investor generates returns
by one or more of the following strategies: improving incentive alignment between man-
agers and shareholders; reducing agency costs due to increased leverage, as predicted
by Jensen�s (1986) Free Cash Flow (FCF) hypothesis; and active monitoring of oper-
ations by investors, lenders and board members. As suggested by Jensen (1989a) and
Jensen (1993), these three factors interact to provide companies undergoing an LBO
with strong tools to improve operating cash �ows and investment returns. High �-
nancial leverage prevents managers from investing in unpro�table or wasteful projects
or seeking private bene�ts, whereas management equity-based compensation makes it
suboptimal for managers to seek short-term increases in cash �ows to pay down debt
at the expense of long-term value. Further, active ownership by investors guarantees
the e¤ective monitoring of management decisions and strategies.
Several studies have attempted to provide empirical evidence of value creation in
LBOs. Kaplan�s (1989a) seminal contribution shows that PE-backed companies out-
perform their industry peers by approximately 20% in terms of return on assets and
return on sales in the three years after the buyout. Lehn and Poulsen (1989) provide
6

evidence to support the FCF hypothesis and show that the likelihood of a company�s
going private is inversely related to its growth in sales and directly related to the level of
undistributed cash �ows. Muscarella and Vetsuypens (1990) �nd that targets of reverse
LBOs experience a signi�cant increase in operating productivity and margins, resulting
from restructuring activities. Their results are con�rmed by Smith (1990), who shows
that improvements are noteworthy because they are not generated through substan-
tial employee layo¤s or cuts in R&D, maintenance or advertising expenses. Similarly,
Bull (1989) �nds an increase of operating productivity and higher rates of new-product
development for PE-backed companies. Lichtenberg and Siegel (1990) observe that
plant productivity, measured as the total factor productivity of LBO targets, increases
from 2.0% above the industry average in the pre-buyout period to 8.3% following the
buyout. Similarly, Harris et al. (2005) compare the plant productivity of targets of
UK MBOs with the productivity of comparable �rms. PE-backed companies show a
substantial increase in productivity after the buyout and signi�cant outperformance
relative to comparable �rms. Several studies have focused on the most recent wave of
buyout transactions. Desbieres and Schatt (2002), using a French sample of MBOs,
observe a signi�cant decrease in return on equity, return on investment and margin
ratios in the years following the buyout. Acharya et al. (2012) provide evidence for UK
transactions, showing a signi�cant abnormal increase in EBITDA margins compared to
industry peers as a result of active monitoring by buyout professionals and improved
corporate governance. However, Guo et al. (2011), in a follow-up to Kaplan�s (1989a)
study, show that median operating performance by US PE-backed companies is not
signi�cantly di¤erent from the performance of benchmark �rms matched on industry
and pre-buyout characteristics.
1.1.1 Value creation and Secondary buyouts
It is doubtful whether value creation theories explain the recent surge in secondary
buyout activity. Under the null hypothesis that the �rst private equity investor has been
e¤ective in mitigating agency problems by implementing enhanced governance practices,
engaging in active management monitoring and reducing free cash �ows, it is unclear
how a second, back-to-back �nancial sponsor can continue to create value by exploiting
these same mechanisms. As argued in Wright et al. (2009), resolution of agency
problems is likely to generate a steep one-o¤ change in performance. As a consequence,
secondary buyouts can be expected to generate little, if any, incremental improvements
7

in operating performance. In such cases, real operating growth can only be achieved
through the implementation of new investments and strategies, as conjectured by Jensen
(1993). This opportunity can take various forms, such as international expansion,
industry consolidation, changes in strategy or the introduction of a new management
team to engineer operational growth. Anecdotal evidence of secondary buyouts in which
a private equity investor buys a company to lead expansion supports this argument.
Absent a radical project, there should be no or very limited motivation for a �nancial
investor to step in as a secondary buyer, as the residual growth should be priced into
the transaction, heavily reducing the secondary buyer�s pro�tability.5 In this paper,
we test these conjectures providing previously unavailable cross-sectional evidence on
value creation in SBOs.
1.2 Mispricing
Private equity investors are sophisticated agents that may be able to detect temporary
market anomalies. In such a case, pro�table investment opportunities may stem from
buying targets low and selling them high, exploiting the expansion of sector valuation
multiples accompanied with high leverage to multiply returns to equity after paying
down debt commitments with cash �ows generated by the target operations. Guo
et al. (2011) show that industry- or market-related changes in multiples account on
average for 12.0% of the returns on the capital invested in the buyout. Phalippou
and Zollo (2005) show that private equity funds�performance covaries positively with
market and business cycles, suggesting that a substantial share of returns is due to
market conditions. Following an e¢ cient markets argument, it is di¢ cult to expect this
strategy to be e¤ective for second-round buyouts if they are not accompanied with some
degree of operational improvement. However, as suggested in Kaplan and Stromberg
(2009), private equity might bene�t from market frictions that cause a segmentation of
equity and debt markets, which leads to a mispricing of debt markets relative to equity
markets. Enhanced access to cheap debt relative to costly equity allows PE investors
to exploit arbitrage opportunities and generate abnormal returns by increasing leverage
ratios.
Mispricing can also occur if PE investors can buy the target at a discount to fair
value by exploiting information asymmetry between pre-buyout investors and managers
5This can be the case of "forced exits " due to fund constraints such as the end of the life of thefund.
8

involved in the buyout, in essence transferring some of this value from existing share-
holders to acquirers. For example, Bargeron et al. (2007) �nd that, controlling for other
factors, public target shareholders receive a 63% higher premium from public bidders
compared to private equity acquirers. However, such evidence may also be explained by
superior negotiating abilities by PE investors or market timing, as discussed by Kaplan
and Stromberg (2009).
1.2.1 Mispricing and Secondary buyouts
Secondary buyouts may reasonably be determined by segmentation in the market for
acquisition �nance. Theoretically, the SBO acquirer should be unlikely to buy the
target company at a signi�cant discount to fair value, as the �rst-round PE investor
rationally strives to sell the target as close to market value as possible. This result has
been supported by Wang (2011), who shows that the seller�s likelihood of achieving
the target objective is positively correlated with the PE�s sophistication, the absence of
information asymmetry between managers and shareholders once the �rst buyout has
taken place and the increased level of competitiveness in the PE industry. Additionally,
the �rst PE investor will pursue optimal timing in exits by o¤-loading its portfolio when
industry multiples are close to the expected peak levels. However, the timing of exits by
PE investors is arguably also in�uenced by the need to pay out limited partners when
funds are close to the end of their life. This leaves an opportunity for secondary buyout
investors to exploit market-timing opportunities. As we have argued, such a route to
returns can be particularly viable in a growing market and an environment of low debt
costs, which enable the exploitation of the relative mispricing of debt and equity.
The attractiveness of this strategy is enhanced by the positive track record of po-
tential targets that have already been proven able to cope with high levels of leverage.
Additionally, managers have already gained signi�cant expertise in dealing with pri-
vate equity investors, and enhanced governance and monitoring systems are already in
place. Secondary buyouts thus present follow-up PE buyers with a less risky and more
predictable alternative to �rst-round acquisitions. This argument is consistent with the
evidence that the volume of secondary buyouts calculated as a percentage of total value
transacted in buyouts has reached its peak at 26% in 2006-07, in correspondence with
the recent credit boom. With respect to the risk pro�le of SBOs, Stromberg (2007) pro-
vides evidence that secondary buyouts are signi�cantly more likely to lead to successful
exits than public-to-private and private-to-private deals. Following these arguments, in
9

this paper we investigate the relationship between deal multiples, the cost of debt and
SBO volume.
1.3 Collusion
Private equity funds are generally set-up as closed-end structures with a �nite invest-
ment and, more importantly, divestment horizon.6 Additionally, they are repeated
players in the market who base their chances of raising new funds on past performance
records. On the one hand, adverse market conditions may a¤ect the likelihood of exiting
portfolio investments and generate the need for forced exits. This may have a perverse
e¤ect on realized returns and jeopardize current or future fundraising. On the other
hand, failing to invest committed capital reduces returns and sends negative signals to
limited partners that decrease the likelihood of further fundraising. These factors may
generate an incentive to collude with other market players in a quid pro quo logic, where
one fund agrees to buy a company from another fund to facilitate exit and/or boost
returns. The selling fund will then be expected to support the buying fund in the future
in a similar fashion. SBOs are a natural testing ground because if a collusive practice
exists, we should observe funds with higher reputation and a multi-fund history to swap
companies between each other more frequently than younger and less reputable funds.
Additionally, transaction values should be higher and more expensive. Research on
collusive practices by PE funds has essentially focused on consortium bidding in LBOs,
a di¤erent type of collusive practice where PE funds team up in deals (especially larger
ones) to, allegedly, reduce competitive auctioning that would push the price up. O¢ cer
et al. (2010) �nd support for the collusion hypothesis, whereas Boone and Mulherin
(2011) do not �nd conclusive evidence on the existence of a collusion-driven explanation
for consortium formation. Their results appear to be aligned with preliminary rulings
by judges (e.g., UDC Massachusetts, 2011) that have investigated club deals following
a formal investigation by the Department of Justice. The type of collusion that we
conjecture in our paper, however, has proven even harder to isolate. The only two
papers attempting some investigation on this possible motivation are Sousa (2011) and
Wang (2011), whose results are unfortunately inconclusive.
6See: Bonini (2012)
10

1.4 Value Transfers
Finally, a stream of research has focused on value transfers to PE investors from other
players involved in the buyout to private equity investors. In particular, the extant
literature has focused on transfers from employees of target companies, governments
and taxpayers. On the one hand, the hypothesis of value transfer from employees has
found very weak supporting evidence, as shown by Kaplan and Stromberg (2009). On
the other hand, LBOs usually generate signi�cant tax shields due to increased leverage
and higher tax-deductible interest payments, which may intuitively motivate repeated
buyouts. However, as shown in Kaplan (1989b) and Renneboog et al. (2007), expected
tax savings are highly correlated with premiums paid to shareholders at the moment
of the buyout. This evidence suggests that tax bene�ts of increased debt are largely
embedded in the price paid to existing equity holders, thus leaving very limited room for
tax-driven returns to second-round PE investors. In the light of these contributions, we
reject the hypothesis that tax savings are a signi�cant di¤erential factor in explaining
the impressive growth in SBO activity.
2 Data and Methodology
2.1 Sample Selection and Description
Most SBO activity targets private-to-private transactions, thus preventing a focus on
the US market, as US private companies are not required to disclose �nancial infor-
mation. Unlike in the US, European companies have relatively stringent disclosure
requirements. Accordingly, we collect information from the Mergermarket database on
LBOs in the European market from 1998 to 2008 that disclose information regarding at
least one of the following items: revenue, EBIT, or EBITDA transaction multiple; total
absolute deal consideration; total debt funding; months held in the portfolio of the ini-
tial PE buyer; and exit type. This search strategy returns 2,911 transactions, of which
1,107 have been exited through an SBO and 1,804 have been exited through a trade
sale. In the following, we will refer to this sample as to the Global SBO sample, which
we will use for exit determinants and robustness tests. We complement these data with
information on the industry-wide SBO volume, loan spreads, industry multiples, and
debt and equity volumes from Standard and Poor�s Leverage Commentary Data (S&P
LCD). On the subsample of 1,107 deals exited through an SBO, we apply a second
11

�lter, keeping only deals where we have information guaranteeing the identity of the
second-round buyer as a PE investor. This selection process reduces the sample to 723
companies and 1,513 �rst- and second-round deals. The number of deals is larger than
twice the number of companies, as we record in this sample a few tertiary deals, i.e.,
third-round buyouts. We denote the �rst buyout as LBO1 and the secondary buyout as
LBO2. To perform a robust analysis of the SBOs�operating performance, we exclude
from this sample observations where:
� the full set of �nancial statements from the Bureau VanDijck-Amadeus database
was not continuously available from one year before the �rst LBO to two years
after the second LBO;
� the company was incorporated in countries other than Western Europe (the UK,Ireland, Denmark, Norway, Sweden, Finland, Germany, Belgium, Luxembourg,
the Netherlands, France, Spain, Portugal, Italy, and Greece);
� the company was operating in the �nancial sector.
These criteria were introduced to focus on companies active in relatively comparable
economic and accounting environments. A crucial methodological issue is the selection
of the performance window. Ideally, we should try and collect data on as many �scal
years as possible following both buyouts. Because we select only consecutive deals, we
know by construction the duration of the �rst-round investment, whose �nancial data we
can track over the entire holding period, conditional on data availability. In contrast, for
second-round investments, we face severe constraints because of the unavoidable delays
in the data providers�collection process. In fact, �nancial statements for any given year
are �led with local authorities the next �scal year. At the end of the �ling year, data
providers collect and process information that becomes available to database users one
year later. As a consequence, �nancial information is available at an approximately
two-year delay. For example, 2005 �nancial statements are �led in 2006 and made
available in 2007. This severely reduces the number of observations for which we have
data more than two years away from the SBO. Although this limits inferences on long-
term performance, it does enable the comparison of the di¤erential e¤ects of �rst-round
versus second-round investors. Furthermore, the extant literature on LBO performance
(see Kaplan, 1989a; Kaplan and Stromberg, 2009; Guo et al., 2011) provides strong
evidence that most of the performance change is achieved during the �rst 2 years,
12
including the acquisition year, which allows con�dence in the economic signi�cance of
the results.
The �nal sample is given by 326 deals on 163 European companies in 11 countries7
that have been acquired by a PE investor in an initial buyout and exited through an
immediately adjacent SBO transaction over the period 1999 to 2007. We will refer to
this sub sample as the restricted SBO sample. As reported in the following methodology
section, our operating performance metrics are computed as abnormal performance
measures by adjusting target company yearly data for mean and median �gures of a
sample of peers selected from publicly traded �rms in the same country, industry and
year. We perform industry matching by selecting comparable �rms in the same 4-digit
SIC code, which is taken from the Compustat Global Dataset. If the extraction returns
fewer than 10 �rms, we step down to 3-digit or 2-digit matching. Because comparable
�gures are a¤ected by extreme observations, following Barber and Lyon (1996), we
Winsorize data at the 1st and 99th percentiles of the observations for every accounting
ratio for each year.
2.2 Summary Statistics
2.2.1 Deals statistics
Table 1 reports summary statistics for the full sample of 2,911 deals. The EBITDA
multiple for the whole sample is a staggering 43.48, but its median is 10.42, which
indicates the existence of misreported �gures, extreme observations or both. The aver-
age deal value is 277 mil/USD, and the total debt funding is 387 mil/USD. The latter
�gure appears to be at odds with a lower average deal value but is driven essentially
by a much lower number of deals disclosing information on debt contribution: although
we have deal-value data for 1,998 deals, we only have information on debt funding for
173 deals. Finally, the holding period for portfolio companies is slightly less than 3.5
years on average and has a median of approximately 3 years, which is consistent with
empirical and anecdotal evidence on PE investors seeking the quick turnover of their
investment portfolio.
INSERT TABLE 1 AND 2 HERE7The countries included in the �nal sample are: Belgium, Denmark, Finland, France, Germany,
Sweden, Switzerland, Netherlands, Norway, Spain, United Kingdom.
13
Breaking down the sample by exit type provides some additional intuitions. First, we
notice that SBO deals show signi�cantly lower median EBITDA multiples and revenue
multiples: EBIT multiples are fractionally higher in terms of medians, but the di¤erence
is not signi�cant. Interestingly, deal value is signi�cantly higher in terms of both means
and median �gures, and SBOs appear to be almost twice as large as all other exit routes.
Almost all disclosed information on debt funding comes from SBO deals and shows
no signi�cant di¤erence between the two sub-samples. With regard to the investment-
holding period, SBO deals appear to be held slightly longer than deals divested through
a trade sale. The interpretation of these results is not straightforward. On the one hand,
it appears that �rst-round PE buyers are better o¤ selecting a traditional trade sale in
terms of both proceeds and portfolio turnaround velocity; on the other hand, the higher
deal size and the extreme (and signi�cant) EBITDA multiple values indicate that SBOs
may strategically be used by PE funds and debt providers to manage their investment
portfolios.
Table 2 restricts the analysis to the 163 companies for which we have detailed
�nancial and accounting data. Panel A reports deal-level �gures.
Multiples and debt funding �gures are closely aligned with those in the global sam-
ple. Although deal values are approximately 18% larger both on average and in terms
of median values, deal durations are approximately 6 months shorter on average. Panel
B reports summary statistics for 8 �rm-level �nancial items in the �rst LBO. Figures
suggest that PEs target relatively small companies (although the sample shows a non-
negligible skewness toward larger deals) with an average turnover of 189 mil/USD and a
median of 46.2. Companies show average and median EBITDA/Sales ratios well above
10% and a relatively low level of debt, rendering them ideal targets for a PE investor.
3 The operating performance of target companies
3.1 Methodology
We assess the operating performance of the target companies over the investment pe-
riod, according to a set of di¤erent measures:
1) Operating Margin Ratios
� EBIT / S = Earnings before Interest and Taxes / Sales
14

� EBITDA / S = Earnings before Interest, Taxes, Depreciation, and Amortization/ Sales
2) Turnover Ratios
� S/EA = Sales / Economic Assets
3) Return on Investment Ratios
� EBIT / EA = Earnings before Interest and Taxes / Economic Assets
� EBITDA / EA = Earnings before Interest,Taxes, Depreciation, and Amortization/ Economic Assets8
4) Return on Equity Ratios
� NI / E = Income before Extraordinary Items / Total Shareholders�Funds
� CFO / E = Cash Flows from Operations9 / Total Shareholders�Funds
5) Liquidity Ratios
� CA / CL = Current Assets / Current Liabilities
� CASH / CL = Cash and Cash Equivalents / Current Liabilities
6) Capital Structure Ratio
� FD / EA = Financial Debt / Economic Assets
� FD / EBITDA = Financial Debt / Earnings Before Interest, Taxes, Depreciation,and Amortization
8Following the approach of Penman (2007), Economic Assets (EA) is de�ned as: Total Assets -Cash and Equivalents �Trade and other Operating Creditors = Total Shareholders Funds + LongTerm Liabilities + Total Debt included in Current Liabilities
9Measured by: Net Income + Extraordinary Items + Depreciation and Amortisation �Change inWorking Capital
15

These indicators return a comprehensive view of the e¤ects of buyouts on several
areas of the targets�operating performance. For each of these measures, we develop two
alternative speci�cations to check the robustness of results. In the �rst speci�cation,
we follow Barber and Lyon�s (1996) approach and compute a set of abnormal perfor-
mance indicators to detect the level of abnormal operating performance of sample �rms
compared to their industry peers. Formally, we estimate the following:
Absolute abnormal performance indicator
Yi;s = (xi �ms) (1)
where xi is the ratio x for �rm i, operating in sector s, and ms is the ratio x median
for industry s. This indicator is calculated for the following points in time: one year
before the �rst buyout (LBO1-1), one year after the �rst buyout (LBO1+1), one year
before the second buyout (LBO2-1) and one and two years after the second buyout
(LBO2+1; LBO2+2)
Abnormal performance percentage change indicator
Similarly to the abnormal performance absolute change, we construct a measure
using percentage changes instead of absolute changes:
�%Yis = (�%xi ��%ms) (2)
This indicator is computed over three periods: from LBO1-1 to LBO1+1, from
LBO2-1 to LBO2+1.and from LBO2-1 to LBO2+2.
The choice of these variables follows Barber and Lyon�s (1996) recommendations for
calculating abnormal operating performance and is consistent with the methodology
used in other studies on value creation in LBOs (see Kaplan (1989a) and Guo et al.
(2011)).
The statistical signi�cance of the abnormal performance indicators is tested against
the null hypothesis of no superior performance of the target companies as opposed to
the sample peers.
In the second speci�cation, we control for within-industry variations, as suggested
by Desbrieres and Schatt (2002). However, given the negative skewness of the distri-
bution of performance for the sample of comparable �rms, we calculate the median
industry performance instead of the average, as suggested by Barber and Lyon (1996).
16

Desbrieres and Schatt�s (2002) methodology di¤ers from that used by earlier studies,
as it takes into account within-industry variations of performance ratios, weighting de-
viations of performance from the sector mean (median) conditional on the volatility
of the measure for the whole industry. As a consequence, abnormal performance in a
highly volatile industry is weighted less than abnormal performance in a low-volatility
industry. Formally, we calculate the following measures:
Industry volatility-adjusted absolute abnormal ratio
Wis =(xi �ms)
�s(3)
where xi is the ratio x for �rm i, operating in sector s, andms and �s are the median
and standard deviation of ratio x for industry s. This indicator is calculated for the
following points in time: one year before the �rst buyout (LBO1-1), one year after the
�rst buyout (LBO1+1), one year before the second buyout (LBO2-1) and one and two
years after the second buyout (LBO2+1; LBO2+2).
Industry volatility-adjusted abnormal percentage change ratio
We evaluate the change in operating performance of targets of secondary buyouts
compared to companies operating in the same industry, correcting for intra-sector vari-
ations by estimating the following:
�%Wis =(�%xi ��%ms)
��%s(4)
where �%x is the percentage change in ratio x for �rm i operating in industry s and
�%ms and ��%s are the median and standard deviation of indicator x for industry
s, respectively. Similar to the absolute abnormal performance change indicator, this
metric is computed over three periods: from LBO1-1 to LBO1+1, from LBO2-1 to
LBO2+1.and from LBO2-1 to LBO2+2.
The statistical signi�cance of industry volatility-adjusted measures is tested by a
parametric t-test based on normalized and centered values. To control for extreme
observations in our sample, we also perform a non-parametric Wilcoxon signed-rank
test on the median performance estimates against the null hypothesis of no change.
17

3.2 Results
Figure 1 reports a graphical summary of the results that captures a striking superior
performance of �rst round deals under all performance metrics.
INSERT FIGURE 1 HERE
In the following paragraphs we analyze each of these metrics individually.
3.2.1 Operating Margins Ratios
Table 3 shows results for two alternative measures of operating margin performance.
The absolute performance of both EBIT/S and EBITDA/S indicates that the operating
margins of target �rms are higher than those of public comparable companies for the
entire period of analysis.
INSERT TABLE 3 HERE
After the �rst buyout, the abnormal operating margin for PE-backed companies
increases from 2.63% to 4.89% for EBIT/S and from 3.01% to 4.55% for EBITDA/S
and remains stable up to the sale of the company. However, in the second round,
investor margins decrease and ultimately revert to the industry average, as shown by
the insigni�cance of the results for the second year after the second buyout. Examining
industry volatility-adjusted measures, we notice a similar pattern, although incremental
margins are larger for both buyout rounds, and the reversal is less dramatic. These
results suggest that target companies were already outperforming industry peers and
that PE backing strengthens this characteristic. However, under the �rst buyer, the
EBIT/S measure more than doubles, and the EBITDA/S measure increases by 50%,
whereas the contribution of secondary buyers is positive only immediately after the
purchase and then becomes negative.
The negligible di¤erential e¤ect of SBO investors on target companies is very well
captured by the change measure. Both ratios show a large and substantially signi�-
cant change in performance under the �rst-round buyer and a much smaller or even
negative change under second-round buyers. In particular, the EBIT/S measure (both
in percentage- and industry volatility-adjusted terms) presents a small and insigni�-
cant change in means. The changes are signi�cant in terms of median values but are
18

obviously well below the �rst-round �gure. This result is mirrored by the EBITDA/S
measure, which captures very well how the extra performance of target �rms, which
is large and strongly signi�cant for �rst-round buyers, diminishes quickly under the
secondary investor.
These results have an important implication that SBO investors select well-performing
companies but cannot provide any incremental growth, as almost all the latent value
has already been extracted by the �rst investor.
3.2.2 Turnover Ratio
The turnover analysis, reported in Table 4, provides interesting insights into the e¤ects
of PE activity. First-round investors target companies that are largely e¤ective in ex-
ploiting their asset base, as measured by the large and statistically signi�cant average
and median di¤erences with the industry peer sample. Adjusting for industry volatility,
as is commonly recommended to account for systematic industry characteristics, con-
�rms the target companies�superior use of their assets. This evidence is also consistent
among second-round acquisitions. However, we can observe a signi�cantly decreasing
trend in this ratio. Target companies are certainly market leaders and have an inherent
capacity of exceeding the performance of their peers, but the contribution of the new
ownership to this superiority reduces over time.
INSERT TABLE 4 HERE
Changes in ratios provide extra support for this view, showing that the raw percent-
age change is positive and signi�cant for the �rst buyout and positive but considerably
smaller and limitedly signi�cant for the second buyout. Industry volatility-adjusted
�gures show that the limited signi�cance for second-round deals disappears and that
the sales performance of SBO target companies is not distinguishable from that of their
peers.
This aggregate picture is consistent with the previous conclusion that most of the
incremental growth is spurred by the �rst-round buyer.
3.2.3 Return on Investment Ratios
Table 5 shows that target companies experience positive abnormal returns in all periods
from one year before the �rst buyout to two years after the second buyout. Superior
19
returns on operating activities compared with industry peers are statistically signi�cant
for both EBITDA/EA and EBIT/EA. All of the measures exhibit a pattern similar to
that of the operating performance measures: the average abnormal return on investment
jumps signi�cantly following the �rst LBO. In particular, the average abnormal return
on operating assets increases from 21.46% to 43.63% after the �rst year and 45.27% at
the end of the holding period when EBITDA/EA is considered. However, despite being
above the industry average, the yearly �gures drop sharply after the second buyout.
The same pattern can be observed for the EBIT/EA �gures, which jump from 20.16%
to 41.31% and remain at a remarkably similar value of 41.95% immediately before
the sale of the portfolio company. Adjusting for industry volatility does not a¤ect
the interpretation: target companies were already highly pro�table, con�rming PE
investors�superior skill at selecting target companies. However, return on investment
measures strongly decrease for the second-round buyout. These results, paired with
those on operating performance, indicate clearly that the return to investment is closely
correlated with the possibility of improving the operating e¢ ciency of the company.
INSERT TABLE 5 HERE
The analysis of change in performance ratios only show signi�cant outperformance
in returns on economic assets for the �rst-round LBOs. This result is consistent with
theoretical arguments and empirical evidence presented in Kaplan (1989a), Bull (1989)
and Guo et al. (2011). Target companies experience statistically signi�cant abnormal
increases in performance of 95.90% and 116.73% as measured by EBITDA/EA and
EBIT/EA, respectively. Industry volatility-adjusted �gures are similarly robust and
large (57.78% and 108.63%). In contrast, and consistent with our conjectures, secondary
buyouts show small and erratically signi�cant changes. For the raw EBITDA/EA
change measure, we have essentially no signi�cant results for up to 2 years after the
second buyout. However, it appears that there is some long-term positive e¤ect when
adjusting for industry volatility. This result is not supported by the �gures for the
EBIT/EA measure, which show limited signi�cance soon after the purchase and then
become insigni�cant in means and marginally signi�cant in medians. These results re-
quire careful interpretation: on the one hand, there is strong support for the view that
second-round investors�contribution is small or even null. On the other hand, the weak
recovery in performance metrics over longer time horizons may indicate that secondary
20

buyers do not have room for large improvements, as most of the value has been already
extracted, but do engage in a weakly successful exercise of carefully tuning the company
to exploit the smallest sources of returns.
3.2.4 Return on Equity Ratios
Table 6 presents results for measures of equity performance. Superior pro�tability
compared to industry peers, measured as NI/E, is statistically signi�cant at the 1% level
in both raw and industry-adjusted tests, with signi�cant increases found under both PE
owners. The indicator CF/E yields similarly signi�cant results after the �rst-round deal,
but �gures become less homogeneous under the second-round investor. This evidence
is consistent with improved returns on equity due to the e¤ect of increased leverage.
This result is not necessarily related with an improvement in operating performance, as
shown by Penman (2007),10 although previous analysis on operating performance and
return on investment suggests so.
INSERT TABLE 6 HERE
The change in ratios shows a large abnormal increase in pro�tability for LBO1.
Return on equity under the �rst-round investor increases by 140.78% for NI/E and
170.04% for CF/E; adjusting for sector-volatility, we obtain abnormal changes of 31.15%
and 139.95%, respectively. The SBO �gures are smaller, less signi�cant or both, with
the exception of the unadjusted CF/E indicator when measured in the shorter time
frame. However, extending this window and adjusting for industry volatility yields a
drop in size and signi�cance, that suggests once again that second-round buyers have
signi�cant constraints against generating value in terms of both operating performance
and shareholder value. However, equity returns may be generated through a number
of possible channels. We will formally address this issue in section 4.
3.2.5 Liquidity Ratios
Table 7 indicates that buyout targets have liquidity levels aligned with those of their
peers before the �rst deal, as measured by both the current ratio (CA/CL) and the
10Consider the relation ROE=RNOA+(FD/EA)*(ROA-NBC), where ROE=NI/E as de�ned in sec-tion 3.1;, RNOA=EBIT/EA as de�ned in section 3.1 and NBC is Net Borrowing Costs. A positiveincrease in ROE can be driven, ceteris paribus, by an increase of RNOA or an increase in FD/EA,provided that RNOA>NBC.
21

acid ratio (Cash/CL).
INSERT TABLE 7 HERE
Whereas the �rst ratio decreases after the buyout, the second ratio increases, sug-
gesting that professional investors intervene in the working capital structure of the
target company by tailoring the structure of accounts payable and receivable and opti-
mizing inventories, thus generating growth in cash over CL, which is captured by the
second measure. This change is more pronounced following the �rst buyout than follow-
ing the second one. However, yearly data are marginally signi�cant over time and do
not provide unequivocal interpretations. Changes in ratios are more homogeneous and
provide some hint that second-round buyers tend to squeeze out their target companies,
most likely to support a heavier �nancial structure and increase returns.
Whereas the changes in the current ratio are above the industry average in both
absolute and industry volatility-adjusted terms, the acid tests show that the �rst-round
buyer generates a signi�cant amount of extra cash, whereas the second-round buyer do
so to a much lesser extent. Because the measures are computed for the same company
but under di¤erent owners, this appears to suggest a change in the cash management
policy of the new owner rather than a structural break in the cash generation potential
of the target company.
3.2.6 Capital Structure Ratio
The previous tests show that the performance of target companies does not improve
signi�cantly following an SBO. Absent any noticeable value creation, the surge in SBOs
may be interpreted as the rational response to the increased availability of leverage
�nancing at constant or reduced prices. We should be able to detect this e¤ect in two
ways: �rst, at the �rm level, we should observe a signi�cant shift in the capital structure
of target companies. Second, at the market level, we should observe an increase in the
number of SBOs controlling for more favorable buyout and credit market conditions.
We test the �rst expected e¤ect by adopting the same approach using accounting ratios
that we developed for the operating performance tests. In section 5, we will examine
the second e¤ect through a market-wide regression approach.
In Table 8, we report results for the Capital Structure ratios de�ned in Section 3.1
22

INSERT TABLE 8 HERE
The yearly �gures are rather mixed. SBO target companies show a level of leverage
that is not signi�cantly di¤erent from that of their industry peers at LBO1-1 for both
ratios, con�rming the anecdotal evidence that buyout targets have unexploited leverage
slack. The average abnormal leverage increases weakly following the �rst buyout but
more signi�cantly following the second buyout. For both rounds, we notice a jump
in leverage as measured by the debt multiple over EBITDA in the year following the
buyout, which may be due to the typical approach of BO �rms of collapsing the in-
vestment vehicle into the target company after the closing of the transaction. When
adjusting for industry volatility, the results are very mildly signi�cant. In particular, for
the FD/EA ratio, there is almost no evidence of above-average leverage for �rst-round
deals and a very weakly higher mean leverage for second-round deals. With regard to
the debt multiple ratio, there is no evidence of above-average leverage for second-round
deals and some evidence for �rst-round deals. Overall, the yearly �gures are confusing
and do not allow any meaningful inferences to be drawn. Turning to changes in ratios
reported in panel B, we have more consistent results. Whereas �rst-time buyouts show
higher but not signi�cant leverage ratios, second-round deals are signi�cantly more
leveraged both in means and medians, and for the debt multiple ratios, the results
also hold when adjusting for industry volatility. Because we have previously shown
that EBITDA growth is limited, this evidence suggests that SBOs stretch the target
company�s capital structure with increasing levels of debt.
4 Investor performance
In the previous section, we showed that secondary deals hardly generate any improve-
ment in operating performance. This lack of operational performance growth may have
opposite e¤ects on investors�performance. On the one hand, investors�returns may be
smaller or negative, as the return would be largely driven by exploiting the cash gener-
ation capacity of the target company, the stability or growth of exit multiples and the
relatively short holding period. On the other hand, because investors are likely aware
of the limited room for improvement, they are more likely to select companies that are
inherently robust cash generators, with a solid market position and a proven capacity to
sustain high debt burdens and meet �nancial investors�requirements. This selectivity
23

may ultimately result in smaller but more predictable positive returns and low default
rates. In this section, we test this conjecture by comparing �rst- and second-round
returns to private equity investors and by investigating default rates.
4.1 Returns
The most common approach to estimating returns to investors is computing the project�s
IRR. However, both academics (Phalippou, 2008) and practitioners (McKinsey, 2004)
warned against the use of standard IRR, as its multiple drawbacks are likely to produce
biased estimates of returns. In particular, two commonly accepted caveats concern the
treatment of interim dividend reinvestment and the reliability of pooled data. Phalippou
(2008) proposes the adoption of a modi�ed IRR methodology that explicitly addresses
these issues. Following his approach, we compute returns as follows:
MIRR = n
sCash_FlowsOutlay
� 1 (5)
where:
n= holding period expressed in number of years from the investment announcement
date to the exit announcement date
Outlay=All equity investments11 by the fund (initial investment plus any additional
equity contribution)
CashF lows= The sum of all cash �ows to investors during the holding period given
by:
� dividends and distributed reserves capitalized at a reinvestment rate equal to areasonable hurdle rate. Phalippou (2008) suggests 8% to be an acceptable median
value for the market.
� Exit proceeds net of the Net Financial Position at the exit date
Since our measurement is subject to a subjective adjustment due to the hurdle
rate choice and to potential missing data on additional disbursement to investors, we
compute two separate MIRR measures:
� Equity MIRR that incorporates interim cash �ows
11All equity �gures are adjusted by outstanding shareholder loans (if any).
24

� Enterprise Value MIRR that doesn�t incorporate interim cash �ows and includes
only entry and exit values without adjusting for the Net Financial position at
entry and exit.
In our exercise, we face additional complexity due to the di¤erence in exits between
�rst- and second-round investments. In fact, we have by construction actual exit val-
ues (when available) for �rst-round deals, whereas for second-round deals, we may fail
to have realized exits. This requires the estimation of exit values and, accordingly,
the computation of estimated MIRR for unrealized investments. We estimate MIRR
for unrealized investments by calculating an exit value, given by the last available
EBITDA, multiplied by the same-year EBITDA multiple, obtained from Damodaran
and Bloomberg, minus the most recent net �nancial position �gure prior to the es-
timated exit date. If the value of the NFP exceeds the EV, thus yielding a zero or
negative equity value, we set the exit value at zero, assuming a complete write-o¤ by
the �nancial investor.
All measures are adjusted for shareholder loan extension and repayments if possible
and are pro-rated for the investor�s equity stake. The tests are run on pairs of �rst-
and second-round buyouts on the same company.
Table 9 reports the results of a set of di¤erence tests.
INSERT TABLE 9 HERE
The limited growth in operating performance has a signi�cant e¤ect in returns to
investors in terms of both Equity and EV MIRR. The di¤erences are signi�cant for
means and medians well above the 1% level for all measures, with the exception of the
di¤erence in equity returns between the full set of �rst-round returns and the subset
of actual exits. However, this lack of signi�cance cannot be interpreted as a signal of
homogeneity between the two rounds of investment, as the structure of returns di¤ers
substantially between the two deals. The bottom part of panel A shows that the
contribution of interim cash �ows to the overall equity return grows by almost 150%
on the whole sample and by a staggering 400% when comparing �rst-round deals with
actual exits. This evidence indicates that investors in SBO deals rely more heavily on
cash disbursements to build their returns. Figures computed at the enterprise value
level support this interpretation, showing that �rst-round returns are consistently and
25
signi�cantly higher than those recorded in secondary transactions. In particular, �rst-
round EVs are 2.5 times greater on average and twice as large in terms of medians when
realized exits are considered. The di¤erence becomes signi�cantly more pronounced
when unrealized exits are included, which, at the time of the analysis, showed negative
returns. The negative sign of unrealized exits may appear at odds with the positive
mean and median values of the Equity MIRR for the same subsample. However, the
result is not surprising because the methodology of calculating the EV MIRR does
not incorporate interim cash �ows into the computation. This reinforces the view that
returns for second-round deals are largely driven by interim payouts to investors, which
do not generate an increase in enterprise value, rather than by operating performance
improvement, which would translate in a measurable increase in EV. These results
may suggest an increased likelihood of default for portfolio companies. Although it is
inappropriate to compare �rst-round and second-round buyouts�default rates, as �rst-
round buyouts by construction cannot include defaults, we can compare the default rates
of SBO deals with the �gures for the global sample. In the realized exits subsample, we
document four cases of complete write-o¤s. This �gure increases to ten cases, or 11.49%,
when including unrealized exits. However, this default rate is not signi�cantly di¤erent
from the 12.97% rate observed in the global sample of 2,911 buyout deals for which we
could locate updated information on the current status of the target companies.
5 Alternative Motivations of Secondary buyouts
In the previous section, we showed that the operating performance of SBO target com-
panies improves marginally under second-round PE ownership. Accounting returns to
investors are insigni�cantly di¤erent from those of the peer group. Equity returns from
a PE investor�s perspective are positive but signi�cantly lower and, more importantly,
largely driven by interim cash �ows. Debt levels increase, and there is evidence of liq-
uidity squeeze-out under a second-round PE owner. These results cast doubt on the
economic rationale underlying a secondary acquisition. In this section, we attempt to
assess the alternative motivations of SBO outlined in section 1.1.
5.1 Mispricing
SBO transactions may be a rational response to relative mispricing in debt and equity
markets that allow outperforming portfolio returns. Signals of mispricing can be an
26

increasing debt supply, a decreasing cost of �nancing or an increase in deal values. In
such a case, PE investors may �nd it optimal to invest in companies with limited or
no growth but signi�cant cash �ow generation, as borrowing at abnormally low risk-
adjusted rates in sectors experiencing temporary overheating allow for a relatively low-
risk capital allocation. In this environment, investors will increasingly steer away from
�rst-round LBOs, as "�ipping" companies through SBOs provides a more predictable
and pro�table short-term source of returns. This behavior should be more common
among higher-quality PE investors because, as shown by Demiroglu and James (2010),
PE reputation acts as a substitute for bank monitoring and control, which facilitates
access to debt �nancing for high-reputation investors. We address this hypothesis by
running a battery of probit regressions on the global LBO sample of 2,911 transactions
divested through an SBO or a trade sale (TS). The dependent variable takes the value
of 1 if the deal has been exited through an SBO and 0 otherwise. The independent
variables are as follows: revenue multiple, the total absolute deal consideration, the
number of months held in the portfolio of the initial PE buyer, the LBOmarket leverage,
measured as the average Debt over EBITDA multiple and the debt spread recorded in
the LBO market by the S&P LCD service. For months held and debt spread, we
also introduce a squared term because the duration and especially the �nancing costs
are likely to have non-linear e¤ects on the propensity of exiting. Finally, we model
PE reputation as follows: �rst, because most deals are syndicated, we identify all
individual investors involved in the purchase and sale syndicates, and we rank each
investor according to Private Equity International�s PEI 300 ranking. In particular, we
assign a value of 1 to investors ranked among the top 50 investors worldwide or among
the top 25 European investors to account for di¤erent geographical relevance, and zero
otherwise. Second, we calculate a cumulative ranking score for the syndicate as the
sum of the rankings of the syndicate members. Third, we de�ne a syndicate (buying or
selling) to be a top syndicate if the majority of its members are top ranked.
INSERT TABLE 10 HERE
The results reported in Table 10 support our previous �ndings and provide inter-
esting additional evidence. Univariate regressions show a negative parameter for the
revenue multiple, which appears to indicate that very overpriced deals are less likely to
�nd an exit through an SBO. Deal value is positively related with the likelihood of exit-
ing through an SBO, providing additional support for a strategic interpretation of SBOs.
27

First, when deals are large, �nding an appropriate exit can be a more lengthy process
that may a¤ect returns. Sponsor-to-Sponsor transactions can alleviate the problem
by facilitating exits from large deals; duration, as shown in Sousa (2011), is positively
related with the likelihood of exit through an SBO, suggesting that because duration
negatively a¤ects returns, when a company has been in the PE portfolio for too long,
�ipping it to a friendly investor can be a rational risk-reduction choice. In addition,
consistent with the view that the availability of cheap �nancing provides a powerful in-
centive to engage in secondary deals, as it can drive up equity returns, we �nd a small
but signi�cantly negative sign for the LBO spread parameter. The leverage in the LBO
market is surprisingly negative and signi�cant, appearing to suggest that the increase
in debt multiples reduces the likelihood of secondary deals. Finally, consistent with
evidence presented in Demiroglu and James (2010), the reputation of the PE buyer has
a strong positive e¤ect on the likelihood of observing an SBO rather than a trade sale.
The seller�s reputation parameter is also positive, but the estimate is approximately one
tenth that of the buyer, and the signi�cance of this relationship is lower. In column 7,
we turn to a comprehensive multivariate model that introduces quadratic terms. The
results of this are extremely signi�cant and aligned with our hypotheses. Revenue mul-
tiple, deal value and duration estimates are aligned in sign and size, but the revenue
multiple is no longer signi�cant. Separately, debt spread and LBO leverage are highly
signi�cant and with the correct sign, suggesting that the availability of low-cost debt
increases the attractiveness of SBOs for PE investors. In particular, a one-basis-point
decrease in the spread increases the likelihood of an SBO by approximately 3 percent-
age points, whereas a one-unit increase in the Debt to EBITDA multiple increases the
likelihood of SBO by approximately 8%. Finally, the reputation of the secondary buyer
is a key determinant of the exit choice, the likelihood of SBO increasing by 40% for a
reputation value 1 standard deviation above the mean value.
These results suggest that highly reputable PE investors are reacting to favorable
market conditions by targeting cash-generating companies that, despite having lim-
ited growth potential, can a¤ord sustained levels of relatively cheap debt and allow a
more predictable route to achieve (and largely beat) the investors�return targets, thus
allowing them increased chances for incremental fundraising.
28
5.2 Collusion
A complete and conclusive test of this hypothesis is extremely hard to devise given the
patchy nature of transaction data availability and the existence of potentially unob-
servable factors. However, given that collusion can in principle be a powerful driver of
buyout activity, we try to provide some evidence on both our extended sample of 1,513
deals and the restricted sample of 326 deals adopted for the operating performance
tests. For the two samples, we focus only on the secondary rounds, that is, on 723 and
163 deals.
Table 11 reports the frequency of transactions where the seller is a company ranked
as a top syndicate, according to the classi�cation developed in the previous paragraph,
and the buyer is either a Top or non-Top syndicate.
INSERT TABLE 11 HERE
In Panel A, we note that the best funds sell more often to junior funds than to
their peers, whereas the opposite is true for less reputable funds, which show a higher
propensity to transact between themselves. This pattern is partly con�rmed also in
the subset of deals included in our operating performance analysis, which, however, is
a¤ected by a reduced sample size. On the one hand, the larger fraction of deals sold to
junior funds is reasonable, given the much larger number of funds and the correlated
assets under management. However, it is interesting to notice that top funds buy much
more from each other than they do from junior funds, with the fraction being around
50% both in the global sample and the restricted sample. This pattern can signal collu-
sive behavior, as top funds are more likely to have a close and established relationship
that can allow for some deal management. In such a case, deal characteristics should
exhibit higher deal multiples and deal values, as suggested by the previous regression
analysis. We test this conjecture by examining di¤erential deal-level characteristics in
top vs. non-top seller deals. The results reported in Table 12 are fairly aligned for both
the global and the restricted sample and provide some support to our conjecture.
INSERT TABLE 12 HERE
29
We notice larger multiples and deal characteristics for potentially collusive deals,
even though signi�cance of the means is weak and the K-sample non-parametric median
test is signi�cant only for the EBIT multiple of the global sample. This analysis is
certainly not su¢ cient to be considered proof of the existence of collusive cross-selling
in the private equity industry, but it does provide an intriguing clue that would certainly
be worth a more focused analysis.
6 Conclusions
The recent spectacular growth in secondary buyout transactions has attracted attention
from both academics and practitioners because of the limited understanding of the
economic determinants of these deals. Existing theories on leverage buyouts identify
four main factors that motivate the acquisition of a company by a PE investor: i)
increasing the operating performance through agency cost reduction and operational
engineering (Jensen, 1986; Kaplan, 1989a; Kaplan and Stromberg, 2009); ii) mispricing
in the debt and equity markets (Phalippou and Zollo, 2005; Kaplan and Stromberg,
2009, Guo et al., 2011); iii) value transfers from employees and the government (Kaplan,
1989b; Davis et al. 2008; Kaplan and Stromberg, 2009); and iv) collusion (O¢ cer et
al. 2010; Mulherin, 2011, Wang, 2011). However, it is unclear which of these theories
can explain secondary transactions.
In this paper, we address this question, shedding light on the e¤ects on operating
performance by SBO investors and on the determinants of SBO activity.
We collect from Mergermarket and S&P LCD a sample of 2,911 European LBO
transactions between 1998-2008 that have been divested either through an SBO or a
trade sale and for which we have information on at least one of the following deal-level
items: revenue, EBIT, the EBITDA transaction multiple, the total absolute deal con-
sideration, the total debt funding, or months held in the portfolio of the initial PE
buyer. From this initial sample, we extract 326 transactions for which we have full
�nancial and accounting data from one year before the �rst buyout to two years after
the second buyout. Our results show that companies targeted by multiple buyouts
experience abnormal improvements in their operating performance as a result of the
�rst acquisition but do not exhibit signs of incremental changes in performance during
the secondary transaction. In particular, for all measures of operating performance,
�rst-round acquisitions result in a steep, one-o¤ increase that is smaller or absent for
30

secondary transactions. SBO transactions exhibit evidence of liquidity squeeze-out and
higher leverage than �rst-round deals. These limited contributions to the target com-
pany growth translate into signi�cantly lower, although still positive, returns to PE
investors. However, there is a structural change in the dynamic of returns to PE in-
vestors between the two rounds: whereas �rst-round returns are mainly generated by
higher exit values, which are largely determined by an increase in operating perfor-
mance, second-round deal returns rely heavily on interim cash �ows. This suggests
that these deals are more sensitive to deterioration in market conditions because if cash
�ows reduce and exit values drop, deals can generate negative enterprise values. This
conjecture is supported by the �gures of estimated returns on unrealized second-round
deals that are signi�cantly negative and exhibit a positive number of actual and ex-
pected defaults. These results allow the rejection of the hypothesis that operating value
creation can be the main driver of an SBO. Looking at the global SBO sample of 2,911
transactions, we investigate whether mispricing in the debt and equity markets can
explain growth in this class of deals. Our results show that the likelihood of exiting
transactions through SBO increases quickly in response to upward movements in LBO
market leverage and downward movements in the cost of acquisition �nance. Addi-
tionally, the �rst-round deal�s duration, the deal size and the buyer�s reputation are
positive determinants of secondary transactions. These results hint at the possible ex-
istence of a particular form of collusion in the PE market: PE management companies
are repeated players in the market that base their chances of raising new funds on past
performance track records. Market conditions can negatively a¤ect portfolio company
exits and/or prevent the investment of committed capital. Both phenomena reduce
returns and send negative signals to investors, who may not provide further capital in
follow-on fundraising. A collusive practice whereby PE funds agree to buy from each
other to reduce or solve exit or investment di¢ culties may thus be a rational behavior
by fund managers that comes at the cost of reduced returns to investors and a violation
of the risk-return pro�le of this class of investments. Our results, albeit certainly not
conclusive, support this view by showing that highly ranked funds signi�cantly transact
more between themselves at higher multiples and higher deal values.
Our results imply a puzzle: because transactions completed at higher multiples,
increased levels of debt and lower spreads are clearly more risky, as shown by increased
levels of defaults of companies and CLOs12, it is unclear what motivates debt providers
12As measured by the current level of the S&P/LSTA Leveraged Loan Index and the number ofprojected corporate defaults in the next three years by S&P LCD.
31

in entering and fuelling this family of deals. We intend to answer this question in future
research.
32

References
Acharya V., Hahn M. Kehoe C.(2012), "Corporate Governance and Value Creation:
Evidence from Private Equity", The Review of Financial Studies, forthcoming
Barber B., Lyon J. (1996), "Detecting Abnormal Operating Performance: The Em-
pirical Power and Speci�cation of Test-Statistics", Journal of Financial Economics,
41:359-399
Bargeron L., Schlingemann F., Stulz R., Zutter C. (2008), "Why do private acquirers
pay so little compared to public acquirers?", Journal of Financial Economics, 89(3):375-
390
Bonini S. (2011), "The development of Venture Capital", in �Handbook of Venture
Capital and Private Equity�, D. Cumming ed., Oxford University Press
Boone, A., Mulherin, H., (2011). "Do private equity consortiums facilitate collusion
in takeover bidding?" Journal of Corporate Finance, 17(5), 1475�1495
Bull I. (1989). "Financial Performance of Leveraged buyouts: an Empirical Analy-
sis.", Journal of Business Venturing, 4(4): 263-279.
Cumming D., D. Siegel and M. Wright (2007), "Private Equity, Leveraged Buyouts
and Governance", Journal of Corporate Finance, 13 (4): 439�460
Davis S., Haltiwanger J., Jarmin R., Lerner J., Miranda J., (2008), �Private Equity
and Employment.�U.S. Census Bureau Center for Economic Studies Paper CES-WP-
08-07.
Demiroglu C., James C. (2010), "The role of private equity group reputation in
buyout �nancing", Journal of Financial Economics, May, 96(2), 306-330.
Desbrieres P., Schatt A. (2002),"The Impacts of LBOs on the Performance of Ac-
quired Firms:The French Case", Journal of Business Finance & Accounting, 29(5):695-
729
Guo S., Hotchkiss E., Song W.(2011), " Do Buyouts (Still) Create Value?", Journal
of Finance, 66 (2),479�517.
Harris R., Siegel D., Wright M. (2005),"Assessing the Impact of Management Buy-
outs on Economic E¢ ciency: Plant-Level Evidence from the United Kingdom", The
Review of Economics and Statistics,87(1):148-153
Jensen M. (1986), "Agency Cost Of Free Cash Flow, Corporate Finance, and
Takeovers." American Economic Review, 76(2): 323-329
Jensen M. (1989), "Eclipse of the public corporation", Harvard Business Review,
67(5):61-74.
33

Jensen M. (1993), "The modern industrial revolution: exit and the failure of internal
control systems", Journal of Finance, 48(3):831�880
Kaplan S. (1989a), "The E¤ects of Management Buyouts on Operating Performance
and Value." Journal of Financial Economics, 24(2):217-254.
Kaplan S. (1989b), "Management buyouts: Evidence on taxes as a source of value",
Journal of Finance, 44(3):611-632
Kaplan S., Stromberg P. (2009), "Leveraged buyouts and private equity", Journal
of economic perspectives, 23(1): 121-126
Lehn K., Poulsen A. (1989),"Free cash �ow and stockholder gains in going private
transactions", Journal of Finance, 44(3):771-787
Leslie P., Oyer P. (2008). "Managerial Incentives and Value Creation: Evidence
from Private Equity", NBER Working Papers 14331, National Bureau of Economic
Research, Inc.
Levis M. (2008),"The London markets and private equity backed IPOs", Report
prepared for The British Private Equity and Venture Capital Association (BVCA) and
London Stock Exchange
Lichtenberg F., Siegel D., (1990). "The e¤ects of leveraged buyouts on productivity
and related aspects of �rm behavior", Journal of Financial Economics, 27(1):165-194
Mc Kinsey (2004) "Internal rate of return: a cautionary tale", McKinsey Quarterly,
August.
Muscarella C., Vetsuypens M. (1990). "E¢ ciency and Organizational Structure: A
Study of Reverse LBOs.", Journal of Finance, 45(5): 1389-1413.
Nikoskelainen E., Wright M., (2007), "The impact of corporate governance mech-
anisms on value increase in leveraged buyouts", Journal of Corporate Finance, 13(4):
511-537
O¢ cer, M.S., Ozbas, O., Sensoy, B.A. (2010) "Club deals in leveraged buyouts"
Journal of Financial Economics, 98 (2), pp. 214-240.
Palepu Krishna G., 1990, "Consequences of leveraged buyouts", Journal of Financial
Economics, 27(2): 247-262.
Penman S. (2007), "Financial statement analysis and security valuation", Boston,
Mass., McGrawhill, 3rd Ed.
Phalippou L (2008), "The Hazards of Using IRR to Measure Performance: The
Case of Private Equity", Journal of Performance Measurement", Fall., 12 (4).
Phalippou L., Zollo M., "What Drives Private Equity Fund Performance?", Working
Papers - Financial Institutions Center at The Wharton School, Vol. 2005
34

Phan P., Hill C. (1995), "Organizational Restructuring and Economic Performance
in Leveraged Buyouts: An Ex Post Study", The Academy of Management Journal,38(3):704-
739
Renneboog, L.; Simons, T.; Wright, M.(2007)., "Why do �rms go private in the
UK?", Journal of Corporate Finance, 13(4):591-628
Shivdasani, A. and Wang, Y. (2011), "Did Structured Credit Fuel the LBO Boom?",
Journal of Finance, 66(8), 1291-1328
Smith A. (1990), "Corporate ownership structure and performance : The case of
management buyouts", Journal of Financial Economics, 27(1):143-164
Sorenson O., Stuart T. (2001). "Syndication Networks and the Spatial Distribution
of Venture Capital Investments.", The American Journal of Sociology, 106(6):1546-1588.
Stromberg P. (2007), "The new demography of Private Equity", Swedish Institute
for Financial Research, Stockholm School of Economics Working Paper
UDC-United District Court of Massachusetts Case1:07-cv-12388-EFH, 2011
Wright M., J. Gilligan and K. Amess (2009), "The economic impact of private
equity: what we know and what we would like to know", Venture Capital ,11(1):1-21
35

Abnormal Change in Performance
Figure 1
This figure summarizes the abnormal percentage change figures in 11 performance ratios computedon a sample of 163 companies target to two consecutive buyouts. For each ratio, the first columnreports the abnormal percentage change in that ratio under the first round buyer while the secondand third column report the change under the secondary buyer between one year before the secondbuyout and one and two years after the second buyout. The ratios are defined as follows:Operating Margin ratios (EBIT/S and EBITDA/S); Turnover ratio (S/EA); return on investmentRatios (EBIT/EA and EBITDA/EA); Return on Equity Ratios (NI/E and CF/E); LiquidityRatios (CA/CL and Cash/CL); Capital Structure Ratios (FD/EA and EF/EBITDA)
36

Mea
nSt
. D
evM
edia
nO
bs.
Mea
nSt
. D
evM
edia
nO
bs.
Mea
nSt
. D
evM
edia
nO
bs.
Num
ber
of d
eals
1,10
71,
804
2,91
1
Rev
enue
Mul
tipl
e3.
99(2
1.46
)1.
13*
545
26.8
5(5
34.8
0)1.
3382
017
.72
(414
.78)
1.26
1365
EB
IT M
ulti
ple
240.
43(2
,990
.74)
14.5
429
713
8.49
(1,4
11.3
1)14
.34
427
180.
39(2
,200
.85)
14.3
472
5
EB
ITD
A M
ulti
ple
72.2
7**
(586
.63)
10.0
0**
319
23.4
7(6
8.18
)10
.73
459
43.4
8(3
79.6
8)10
.42
778
Dea
l V
alue
360.
65**
*(5
96.4
2)15
3.00
***
741
227.
38(4
72.2
8)76
.00
1257
276.
80(5
25.8
4)95
.50
1998
Tot
al D
ebt
Fun
ding
386.
97(5
71.0
3)22
6.67
165
384.
71(4
74.3
1)20
2.08
838
6.87
(565
.74)
222.
1617
3
Mon
ths
Hel
d43
.30*
**(2
1.17
)39
.00*
**50
538
.56
(21.
85)
35.0
061
740
.65
(21.
65)
37.0
011
22
Tot
al
Thi
sta
ble
prov
ides
sum
mar
yst
atisti
csfo
rth
efu
llsa
mpl
eof
2,91
1LB
Ofr
om19
98to
2008
trac
ked
byM
erge
rmar
ket.
Rev
enue
,E
BIT
,an
dE
BIT
DA
mul
tipl
esre
port
the
tran
sact
ion
valu
eas
am
ultipl
eof
the
last
avai
labl
efig
ure
for
sale
s,E
BIT
and
EB
ITD
A,re
spec
tive
ly;D
ealva
lue
isth
edi
sclo
sed
valu
eof
the
tran
sact
ion
inm
illio
nof
dolla
rs;T
otal
debt
fund
ing
isth
edi
sclo
sed
valu
eof
the
tran
sact
ion
inm
illio
nof
dolla
rs;M
onth
she
ldis
the
calc
ulat
edho
ldin
gpe
riod
from
initia
lpu
rcha
seto
dive
stm
ent.
Diff
eren
cein
mea
nsan
dm
edia
nssign
ifica
nce
betw
een
the
"SB
O"
and
"Oth
erex
its"
grou
psis
estim
ated
bya
stan
dard
tte
stfo
req
ualit
yof
mea
nsan
da
non
para
met
ric
Ks
ampl
ete
stfo
req
ualit
yof
med
ians
.Sig
nific
ance
atth
e1%
,5%
and
10%
leve
l is
deno
ted
by *
**,*
* an
d *
resp
ecti
vely
.
Ful
l sam
ple
sum
mar
y st
atistics
Tab
le 1
SBO
Oth
er e
xits
37
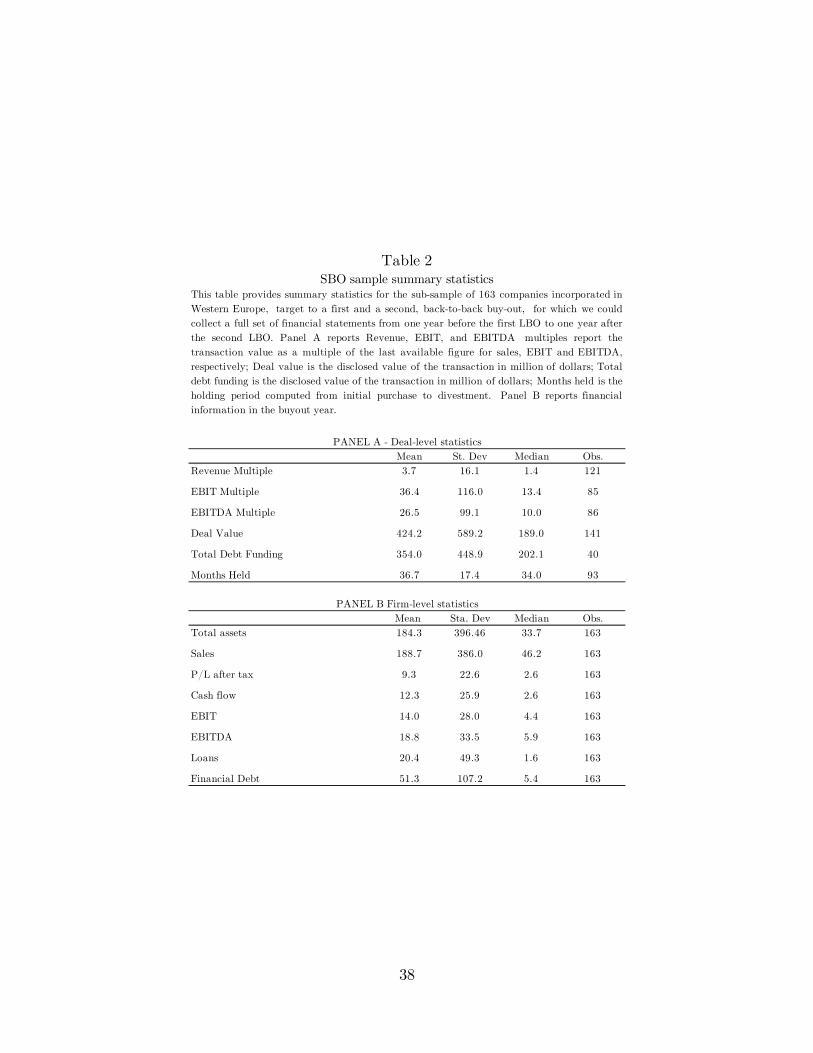
Mean St. Dev Median Obs.Revenue Multiple 3.7 16.1 1.4 121
EBIT Multiple 36.4 116.0 13.4 85
EBITDA Multiple 26.5 99.1 10.0 86
Deal Value 424.2 589.2 189.0 141
Total Debt Funding 354.0 448.9 202.1 40
Months Held 36.7 17.4 34.0 93
Mean Sta. Dev Median Obs.Total assets 184.3 396.46 33.7 163
Sales 188.7 386.0 46.2 163
P/L after tax 9.3 22.6 2.6 163
Cash flow 12.3 25.9 2.6 163
EBIT 14.0 28.0 4.4 163
EBITDA 18.8 33.5 5.9 163
Loans 20.4 49.3 1.6 163
Financial Debt 51.3 107.2 5.4 163
Table 2
PANEL B Firmlevel statistics
PANEL A Deallevel statistics
This table provides summary statistics for the subsample of 163 companies incorporated inWestern Europe, target to a first and a second, backtoback buyout, for which we couldcollect a full set of financial statements from one year before the first LBO to one year afterthe second LBO. Panel A reports Revenue, EBIT, and EBITDA multiples report thetransaction value as a multiple of the last available figure for sales, EBIT and EBITDA,respectively; Deal value is the disclosed value of the transaction in million of dollars; Totaldebt funding is the disclosed value of the transaction in million of dollars; Months held is theholding period computed from initial purchase to divestment. Panel B reports financialinformation in the buyout year.
SBO sample summary statistics
38
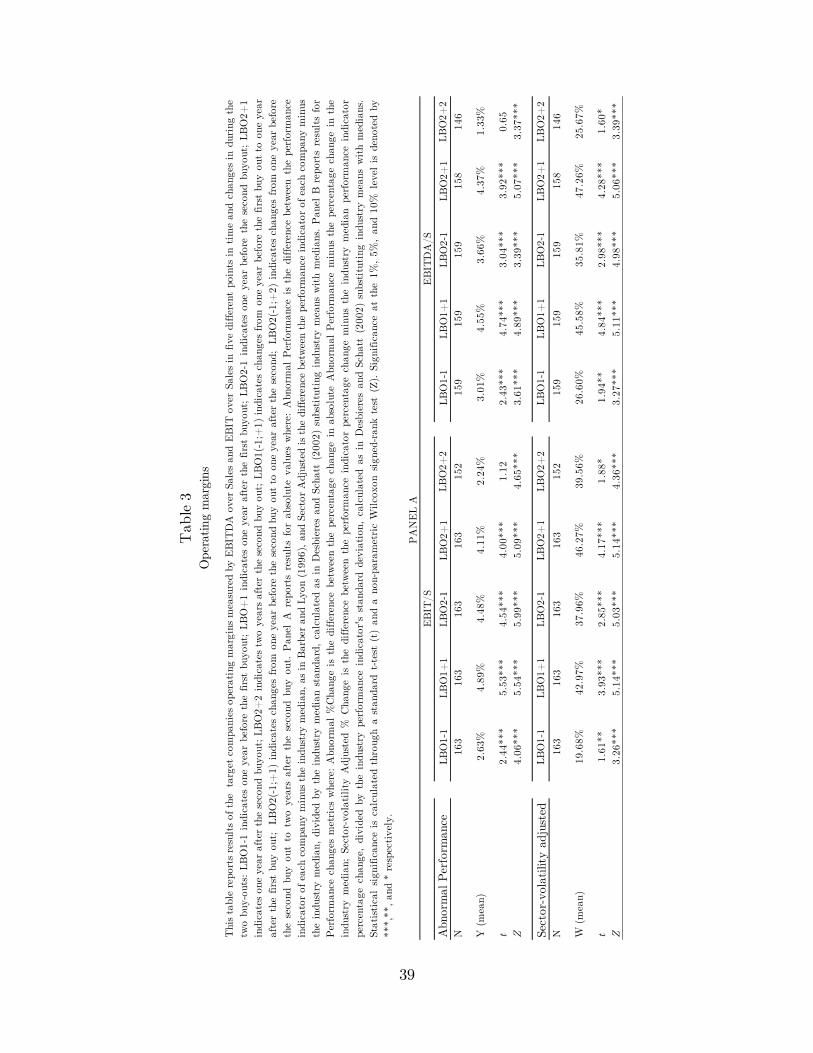
Abn
orm
al P
erfo
rman
ceLB
O1
1LB
O1+
1LB
O2
1LB
O2+
1LB
O2+
2LB
O1
1LB
O1+
1LB
O2
1LB
O2+
1LB
O2+
2N
163
163
163
163
152
159
159
159
158
146
Y (
mea
n)2.
63%
4.89
%4.
48%
4.11
%2.
24%
3.01
%4.
55%
3.66
%4.
37%
1.33
%
t2.
44**
*5.
53**
*4.
54**
*4.
00**
*1.
122.
43**
*4.
74**
*3.
04**
*3.
92**
*0.
65Z
4.06
***
5.54
***
5.99
***
5.09
***
4.65
***
3.61
***
4.89
***
3.39
***
5.07
***
3.37
***
Sect
orv
olat
ility
adj
uste
dLB
O1
1LB
O1+
1LB
O2
1LB
O2+
1LB
O2+
2LB
O1
1LB
O1+
1LB
O2
1LB
O2+
1LB
O2+
2
N16
316
316
316
315
215
915
915
915
814
6
W (
mea
n)19
.68%
42.9
7%37
.96%
46.2
7%39
.56%
26.6
0%45
.58%
35.8
1%47
.26%
25.6
7%
t1.
61**
3.93
***
2.85
***
4.17
***
1.88
*1.
94**
4.84
***
2.98
***
4.28
***
1.60
*Z
3.26
***
5.14
***
5.03
***
5.14
***
4.36
***
3.27
***
5.11
***
4.98
***
5.06
***
3.39
***
Thi
sta
ble
repo
rts
resu
lts
ofth
eta
rget
com
pani
esop
erat
ing
mar
gins
mea
sure
dby
EB
ITD
Aov
erSa
les
and
EB
ITov
erSa
les
infive
differ
ent
poin
tsin
tim
ean
dch
ange
sin
duri
ngth
etw
obu
you
ts:
LB
O1
1in
dica
tes
one
year
befo
reth
efirs
tbu
yout
;LB
O+
1in
dica
tes
one
year
afte
rth
efirs
tbu
yout
;LB
O2
1in
dica
tes
one
year
befo
reth
ese
cond
buyo
ut;
LB
O2+
1in
dica
tes
one
year
afte
rth
ese
cond
buyo
ut;LB
O2+
2in
dica
tes
two
year
saf
ter
the
seco
ndbu
you
t;LB
O1(
1;+
1)in
dica
tes
chan
ges
from
one
year
befo
reth
efirs
tbu
you
tto
one
year
afte
rth
efir
stbu
you
t;LB
O2(
1;+
1)in
dica
tes
chan
ges
from
one
year
befo
reth
ese
cond
buy
out
toon
eye
araf
ter
the
seco
nd;
LB
O2(
1;+
2)in
dica
tes
chan
ges
from
one
year
befo
reth
ese
cond
buy
out
totw
oye
ars
afte
rth
ese
cond
buy
out.
Pan
elA
repo
rts
resu
lts
for
abso
lute
valu
esw
here
:A
bnor
mal
Per
form
ance
isth
edi
ffer
ence
betw
een
the
perf
orm
ance
indi
cato
r of
eac
h co
mpa
ny m
inus
the
ind
ustr
y m
edia
n, a
s in
Bar
ber
and
Lyo
n (1
996)
, an
d Se
ctor
Adj
uste
d is
the
diffe
renc
e be
twee
n th
e pe
rfor
man
ce ind
icat
or o
f ea
ch c
ompa
ny m
inus
the
indu
stry
med
ian,
divi
ded
byth
ein
dust
rym
edia
nst
anda
rd,
calc
ulat
edas
inD
esbi
eres
and
Scha
tt(2
002)
subs
titu
ting
indu
stry
mea
nsw
ith
med
ians
.P
anel
Bre
port
sre
sult
sfo
rP
erfo
rman
cech
ange
sm
etri
csw
here
:A
bnor
mal
%C
hang
eis
the
differ
ence
betw
een
the
perc
enta
gech
ange
inab
solu
teA
bnor
mal
Per
form
ance
min
usth
epe
rcen
tage
chan
gein
the
indu
stry
med
ian;
Sect
orv
olat
ilit
yA
djus
ted
%C
hang
eis
the
differ
ence
betw
een
the
perf
orm
ance
indi
cato
rpe
rcen
tage
chan
gem
inus
the
indu
stry
med
ian
perf
orm
ance
indi
cato
rpe
rcen
tage
chan
ge,
divi
ded
byth
ein
dust
rype
rfor
man
cein
dica
tor'
sst
anda
rdde
viat
ion,
calc
ulat
edas
inD
esbi
eres
and
Scha
tt(2
002)
subs
titu
ting
indu
stry
mea
nsw
ith
med
ians
.St
atis
tica
lsi
gnific
ance
isca
lcul
ated
thro
ugh
ast
anda
rdt
test
(t)
and
ano
npa
ram
etri
cW
ilco
xon
sign
edr
ank
test
(Z).
Sign
ific
ance
atth
e1%
,5%
,an
d10
%le
vel
isde
note
dby
***,
**, an
d *
resp
ecti
vely
.
Ope
rating
mar
gins
Tab
le 3
PA
NE
L A
EB
ITD
A/S
EB
IT/S
39
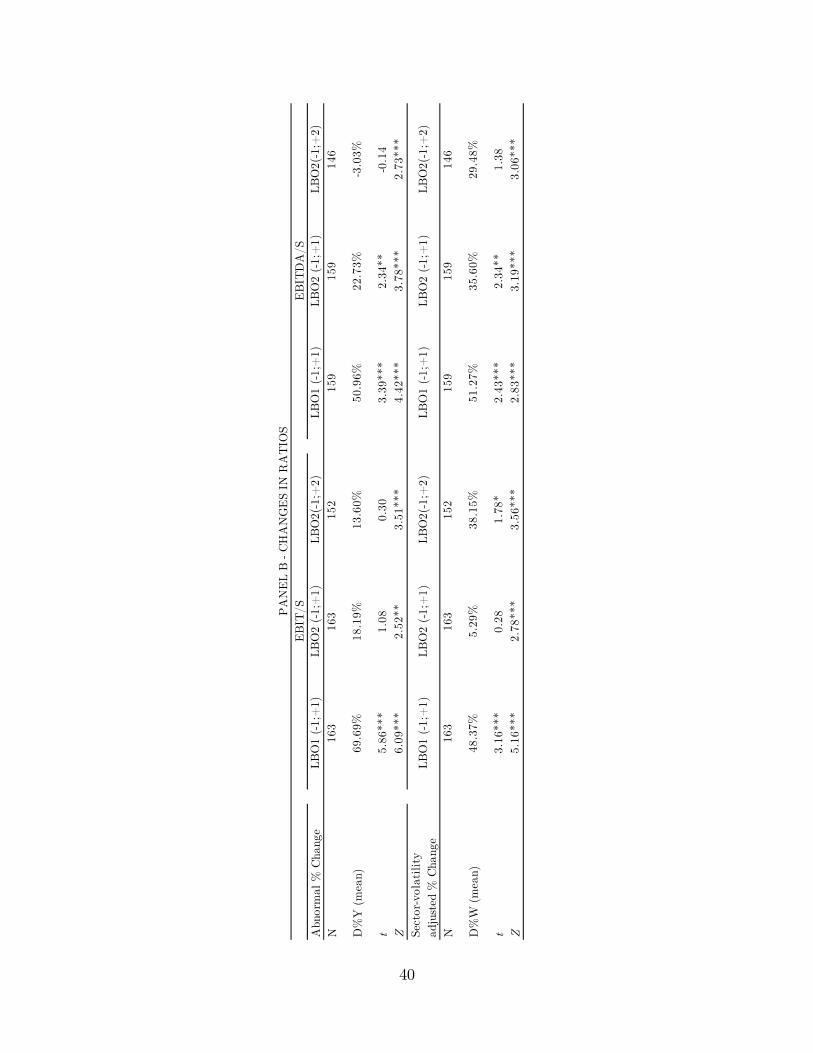
Abn
orm
al %
Cha
nge
N D%
Y (
mea
n)
t Z Sect
orv
olat
ilit
yad
just
ed %
Cha
nge
N D%
W (
mea
n)
t Z
146
LB
O2
(1;
+1)
48.3
7%5.
29%
38.1
5%29
.48%
1.78
*3.
16**
*0.
28
159
51.2
7%35
.60%
2.34
**
EB
IT/S
LB
O2(
1;+
2)
163
163
152
LB
O1
(1;
+1)
LB
O2
(1;
+1)
PA
NE
L B
C
HA
NG
ES
IN R
AT
IOS
LB
O2(
1;+
2)
159
LB
O1
(1;
+1)
EB
ITD
A/S
5.16
***
2.78
***
3.56
***
LB
O1
(1;
+1)
LB
O2
(1;
+1)
LB
O2(
1;+
2)15
2
69.6
9%18
.19%
13.6
0%
5.86
***
1.08
0.30
163
163
3.51
***
4.42
***
3.78
***
6.09
***
2.52
**
1.38
2.43
***
22.7
3%3
.03%
2.83
***
3.19
***
3.06
***
LB
O1
(1;
+1)
LB
O2
(1;
+1)
LB
O2(
1;+
2)
2.73
***
3.39
***
2.34
**0
.14
159
159
146
50.9
6%
40

Abnormal Performance LBO11 LBO1+1 LBO21 LBO2+1 LBO2+2N 152 162 156 156 138
Y (mean) 164.78% 184.71% 142.77% 143.31% 159.06%
t 4.85*** 4.13*** 4.26*** 3.91*** 2.16**Z 3.67*** 3.97*** 3.51*** 3.61*** 2.83***
Sectorvolatility adjusted LBO11 LBO1+1 LBO21 LBO2+1 LBO2+2N 152 156 155 155 134
W (mean) 84.20% 78.76% 58.14% 57.53% 63.44%
t 3.26*** 3.32*** 3.23*** 2.76*** 2.87***Z 2.24** 2.88*** 2.26** 2.28*** 2.46**
Abnormal % ChangeN
D%Y (mean)
tZSectorvolatility adjusted % ChangeN
D%W (mean)
tZ 0.10
Turnover
SALES/EA
LBO2(1;+2)134
58.83%
LBO1 (1;+1) LBO2 (1;+1)
1.32 0.05
152 155
2.21** 0.05
99.78% 2.88%
1.18
1.96**1.15 0.11
2.06**
Table 4
SALES/EAPANEL B
PANEL A
This table reports results of the target companies Turnover measured by Sales over Assets in five different points intime and changes in during the two buyouts: LBO11 indicates one year before the first buyout; LBO+1 indicatesone year after the first buyout; LBO21 indicates one year before the second buyout; LBO2+1 indicates one yearafter the second buyout; LBO2+2 indicates two years after the second buy out; LBO1(1;+1) indicates changesfrom one year before the first buy out to one year after the first buy out; LBO2(1;+1) indicates changes from oneyear before the second buy out to one year after the second; LBO2(1;+2) indicates changes from one year beforethe second buy out to two years after the second buy out. Panel A reports results for absolute values where:Abnormal Performance is the difference between the performance indicator of each company minus the industrymedian, as in Barber and Lyon (1996), and Sector Adjusted is the difference between the performance indicator ofeach company minus the industry median, divided by the industry median standard, calculated as in Desbieres andSchatt (2002) substituting industry means with medians. Panel B reports results for Performance changes metricswhere: Abnormal %Change is the difference between the percentage change in absolute Abnormal Performanceminus the percentage change in the industry median; Sectorvolatility Adjusted % Change is the difference betweenthe performance indicator percentage change minus the industry median performance indicator percentage change,divided by the industry performance indicator's standard deviation, calculated as in Desbieres and Schatt (2002)substituting industry means with medians. Statistical significance is calculated through a standard ttest (t) and anonparametric Wilcoxon signedrank test (Z). Significance at the 1%, 5%, and 10% level is denoted by ***,**, and* respectively.
LBO2(1;+2)138
22.13%
1.80*
46.04% 18.68%
152 156LBO1 (1;+1) LBO2 (1;+1)
0.08
41

Abn
orm
al P
erfo
rman
ceLB
O1
1LB
O1+
1LB
O2
1LB
O2+
1LB
O2+
2LB
O1
1LB
O1+
1LB
O2
1LB
O2+
1LB
O2+
2N
149
153
152
152
142
154
157
156
157
146
Y (
mea
n)21
.46%
43.6
3%45
.27%
18.5
2%9.
91%
20.1
6%41
.31%
41.9
5%19
.98%
11.9
7%
t6.
07**
*1.
89**
1.94
**6.
82**
*3.
76**
*5.
81**
*2.
10**
2.12
**5.
25**
*4.
23**
*Z
5.87
***
6.71
***
7.21
***
6.34
***
4.02
***
6.24
***
7.44
***
7.45
***
6.83
***
5.07
***
Sect
orv
olat
ilit
y ad
just
edLB
O1
1LB
O1+
1LB
O2
1LB
O2+
1LB
O2+
2LB
O1
1LB
O1+
1LB
O2
1LB
O2+
1LB
O2+
2N
147
151
150
150
138
152
155
154
155
142
W (
mea
n)62
.57%
72.2
2%63
.87%
66.0
1%57
.06%
127.
81%
186.
97%
180.
30%
173.
30%
78.0
2%
t4.
13**
*5.
26**
*5.
05**
*4.
75**
*3.
65**
*5.
32**
*6.
19**
*5.
17**
*5.
16**
*3.
78**
*Z
4.43
***
5.33
***
5.21
***
5.11
***
3.76
***
6.44
***
7.52
***
7.30
***
7.31
***
4.40
***
Ret
urn
on I
nves
tmen
tT
able
5
Thi
sta
ble
repo
rts
resu
lts
ofth
eta
rget
com
pani
esre
turn
onin
vest
men
tsm
easu
red
byE
BIT
DA
over
Ass
ets
and
EB
ITov
erA
sset
sin
five
differ
ent
poin
tsin
tim
ean
dch
ange
sin
duri
ngth
etw
obu
you
ts:
LB
O1
1in
dica
tes
one
year
befo
reth
efirs
tbu
yout
;LB
O+
1in
dica
tes
one
year
afte
rth
efirs
tbu
yout
;LB
O2
1in
dica
tes
one
year
befo
reth
ese
cond
buyo
ut;
LB
O2+
1in
dica
tes
one
year
afte
rth
ese
cond
buyo
ut;LB
O2+
2in
dica
tes
two
year
saf
ter
the
seco
ndbu
you
t;LB
O1(
1;+
1)in
dica
tes
chan
ges
from
one
year
befo
reth
efirs
tbu
you
tto
one
year
afte
rth
efirs
tbu
you
t;LB
O2(
1;+
1)in
dica
tes
chan
ges
from
one
year
befo
reth
ese
cond
buy
out
toon
eye
araf
ter
the
seco
nd;
LB
O2(
1;+
2)in
dica
tes
chan
ges
from
one
year
befo
reth
ese
cond
buy
out
totw
oye
ars
afte
rth
ese
cond
buy
out.
Pan
elA
repo
rts
resu
lts
for
abso
lute
valu
esw
here
:A
bnor
mal
Per
form
ance
isth
edi
ffer
ence
betw
een
the
perf
orm
ance
indi
cato
rof
each
com
pany
min
usth
ein
dust
rym
edia
n,as
inB
arbe
ran
dLyo
n(1
996)
,an
dSe
ctor
Adj
uste
dis
the
differ
ence
betw
een
the
perf
orm
ance
indi
cato
rof
each
com
pany
min
usth
ein
dust
rym
edia
n,di
vide
dby
the
indu
stry
med
ian
stan
dard
,ca
lcul
ated
asin
Des
bier
esan
dSc
hatt
(200
2)su
bsti
tuti
ngin
dust
rym
eans
wit
hm
edia
ns.
Pan
elB
repo
rts
resu
lts
for
Per
form
ance
cha
nges
met
rics
whe
re: A
bnor
mal
%C
hang
e is
the
diffe
renc
e be
twee
n th
e pe
rcen
tage
cha
nge
in a
bsol
ute
Abn
orm
al P
erfo
rman
ce m
inus
the
per
cent
age
chan
gein
the
indu
stry
med
ian;
Sect
orv
olat
ilit
yA
djus
ted
%C
hang
eis
the
differ
ence
betw
een
the
perf
orm
ance
indi
cato
rpe
rcen
tage
chan
gem
inus
the
indu
stry
med
ian
perf
orm
ance
indi
cato
rpe
rcen
tage
chan
ge,
divi
ded
byth
ein
dust
rype
rfor
man
cein
dica
tor'
sst
anda
rdde
viat
ion,
calc
ulat
edas
inD
esbi
eres
and
Scha
tt(2
002)
subs
titu
ting
indu
stry
mea
nsw
ith
med
ians
.St
atis
tica
lsi
gnific
ance
isca
lcul
ated
thro
ugh
ast
anda
rdt
test
(t)
and
ano
npa
ram
etri
cW
ilco
xon
sign
edr
ank
test
(Z).
Sign
ific
ance
atth
e1%
,5%
,an
d10
%le
vel
isde
note
d by
***
,**,
and
* r
espe
ctiv
ely.
PA
NE
L A
EB
ITD
A/E
AE
BIT
/EA
42

Abn
orm
al %
Cha
nge
N D%
Y (
mea
n)
t Z Sect
orV
olat
ilit
yad
just
ed %
Cha
nge
N D%
W
t Z
LB
O2(
1;+
2)
3.28
***
0.81
1.99
**
57.7
8%36
.33%
LB
O1
(1;
+1)
LB
O2
(1;
+1)
LB
O2(
1;+
2)
147
150
138
2.75
***
1.62
*0.
664.
05**
*1.
571.
81*
149
153
152
95.9
0%
154
142
108.
63%
72.1
2%96
.41%
2.31
**1.
492.
21**
LB
O1
(1;
+1)
LB
O2
(1;
+1)
3.63
***
2.61
***
1.56
3.85
***
1.73
*2.
45**
28.4
3%13
.41%
LB
O1
(1;
+1)
LB
O2
(1;
+1)
LB
O2(
1;+
2)
3.02
***
1.47
*0.
674.
45**
*1.
012.
31**
LB
O1
(1;
+1)
LB
O2
(1;
+1)
LB
O2(
1;+
2)E
BIT
/EA
EB
ITD
A/E
A
22.9
4%
154
153
146
116.
73%
45.7
2%40
.87%
152
PA
NE
L B
43
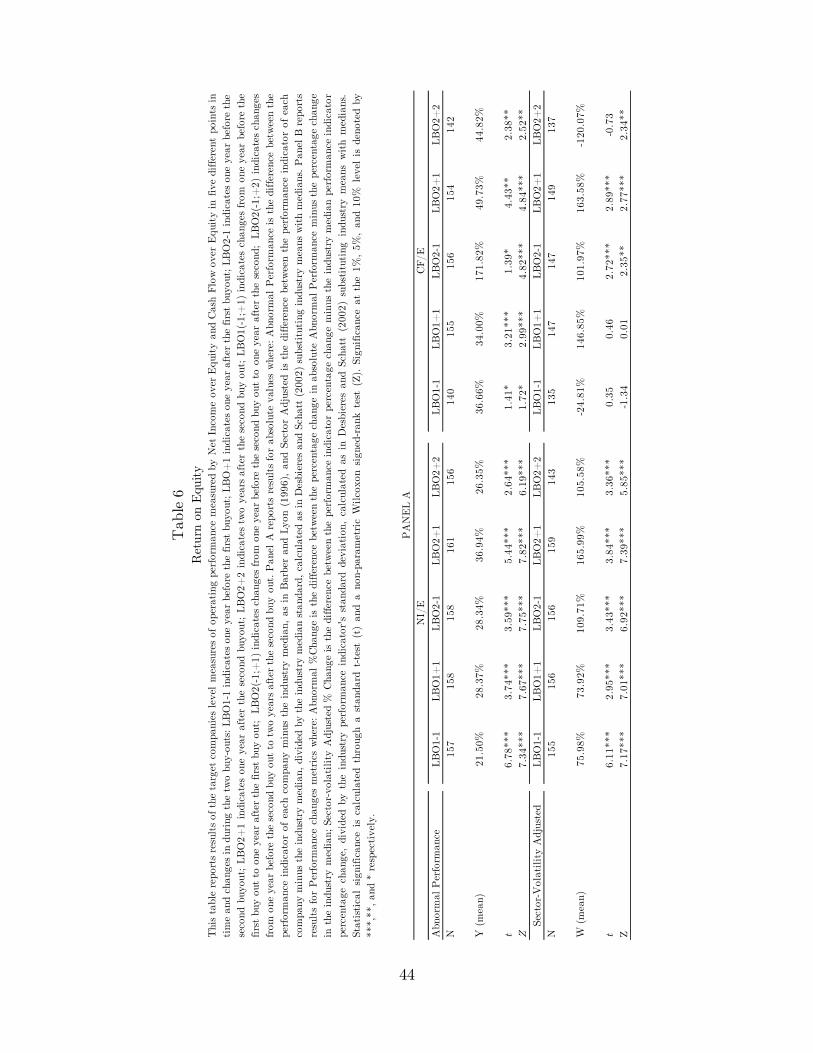
Abn
orm
al P
erfo
rman
ceLB
O1
1LB
O1+
1LB
O2
1LB
O2+
1LB
O2+
2LB
O1
1LB
O1+
1LB
O2
1LB
O2+
1LB
O2+
2N
157
158
158
161
156
140
155
156
154
142
Y (
mea
n)21
.50%
28.3
7%28
.34%
36.9
4%26
.35%
36.6
6%34
.00%
171.
82%
49.7
3%44
.82%
t6.
78**
*3.
74**
*3.
59**
*5.
44**
*2.
64**
*1.
41*
3.21
***
1.39
*4.
43**
2.38
**Z
7.34
***
7.67
***
7.75
***
7.82
***
6.19
***
1.72
*2.
99**
*4.
82**
*4.
84**
*2.
52**
Sect
orV
olat
ilit
y A
djus
ted
LB
O1
1LB
O1+
1LB
O2
1LB
O2+
1LB
O2+
2LB
O1
1LB
O1+
1LB
O2
1LB
O2+
1LB
O2+
2N
155
156
156
159
143
135
147
147
149
137
W (
mea
n)75
.98%
73.9
2%10
9.71
%16
5.99
%10
5.58
%2
4.81
%14
6.85
%10
1.97
%16
3.58
%1
20.0
7%
t6.
11**
*2.
95**
*3.
43**
*3.
84**
*3.
36**
*0.
350.
462.
72**
*2.
89**
*0
.73
Z7.
17**
*7.
01**
*6.
92**
*7.
39**
*5.
85**
*1
.34
0.01
2.35
**2.
77**
*2.
34**
PA
NE
L A
Tab
le 6
NI/
E
Thi
sta
ble
repo
rts
resu
lts
ofth
eta
rget
com
pani
esle
vel
mea
sure
sof
oper
atin
gpe
rfor
man
cem
easu
red
byN
etIn
com
eov
erE
quit
yan
dC
ash
Flo
wov
erE
quit
yin
five
differ
ent
poin
tsin
tim
e an
d ch
ange
s in
dur
ing
the
two
buy
outs
: LB
O1
1 in
dica
tes
one
year
bef
ore
the
firs
t bu
yout
; LB
O+
1 in
dica
tes
one
year
aft
er t
he fir
st b
uyou
t; L
BO
21
indi
cate
s on
e ye
ar b
efor
e th
ese
cond
buyo
ut;
LB
O2+
1in
dica
tes
one
year
afte
rth
ese
cond
buyo
ut;
LB
O2+
2in
dica
tes
two
year
saf
ter
the
seco
ndbu
you
t;LB
O1(
1;+
1)in
dica
tes
chan
ges
from
one
year
befo
reth
efirs
tbu
you
tto
one
year
afte
rth
efirs
tbu
you
t;LB
O2(
1;+
1)in
dica
tes
chan
ges
from
one
year
befo
reth
ese
cond
buy
out
toon
eye
araf
ter
the
seco
nd;
LB
O2(
1;+
2)in
dica
tes
chan
ges
from
one
year
befo
reth
ese
cond
buy
out
totw
oye
ars
afte
rth
ese
cond
buy
out.
Pan
elA
repo
rts
resu
lts
for
abso
lute
valu
esw
here
:A
bnor
mal
Per
form
ance
isth
edi
ffer
ence
betw
een
the
perf
orm
ance
indi
cato
rof
each
com
pany
min
usth
ein
dust
rym
edia
n,as
inB
arbe
ran
dLyo
n(1
996)
,an
dSe
ctor
Adj
uste
dis
the
differ
ence
betw
een
the
perf
orm
ance
indi
cato
rof
each
com
pany
min
us t
he ind
ustr
y m
edia
n, d
ivid
ed b
y th
e in
dust
ry m
edia
n st
anda
rd, ca
lcul
ated
as
in D
esbi
eres
and
Sch
att
(200
2) s
ubst
itut
ing
indu
stry
mea
ns w
ith
med
ians
. P
anel
B r
epor
tsre
sult
sfo
rP
erfo
rman
cech
ange
sm
etri
csw
here
:A
bnor
mal
%C
hang
eis
the
differ
ence
betw
een
the
perc
enta
gech
ange
inab
solu
teA
bnor
mal
Per
form
ance
min
usth
epe
rcen
tage
chan
gein
the
indu
stry
med
ian;
Sect
orv
olat
ilit
yA
djus
ted
%C
hang
eis
the
differ
ence
betw
een
the
perf
orm
ance
indi
cato
rpe
rcen
tage
chan
gem
inus
the
indu
stry
med
ian
perf
orm
ance
indi
cato
rpe
rcen
tage
chan
ge,
divi
ded
byth
ein
dust
rype
rfor
man
cein
dica
tor'
sst
anda
rdde
viat
ion,
calc
ulat
edas
inD
esbi
eres
and
Scha
tt(2
002)
subs
titu
ting
indu
stry
mea
nsw
ith
med
ians
.St
atis
tica
lsi
gnific
ance
isca
lcul
ated
thro
ugh
ast
anda
rdt
test
(t)
and
ano
npa
ram
etri
cW
ilco
xon
sign
edr
ank
test
(Z).
Sign
ific
ance
atth
e1%
,5%
,an
d10
%le
vel
isde
note
dby
***,
**, an
d *
resp
ecti
vely
.
Ret
urn
on E
quity
CF/E
44

Abn
orm
al %
Cha
nge
N D%
Y (
mea
n)
t Z Sect
orV
olat
ilit
yad
just
ed %
Cha
nge
N D%
W
t Z
82.7
6%91
.41%
CF/E
LB
O1
(1;
+1)
LB
O2
(1;
+1)
LB
O2(
1;+
2)N
I/E
LB
O1
(1;
+1)
LB
O2
(1;
+1)
LB
O2(
1;+
2)
LB
O1
(1;
+1)
LB
O2
(1;
+1)
LB
O2(
1;+
2)
155
156
143
31.1
5%22
.76%
32.9
9%
1.99
**1.
75*
1.96
*3.
93**
*3.
34**
*4.
38**
*
2.10
**3.
12**
*1.
76*
3.99
***
4.53
***
4.38
***
157
158
156
140.
78%
156
142
170.
48%
163.
26%
11.4
7%
140
3.99
***
3.21
***
1.50
*4.
97**
*3.
07**
*2.
46**
1.00
LB
O1
(1;
+1)
LB
O2
(1;
+1)
LB
O2(
1;+
2)
135
147
137
PA
NE
L B
4.42
***
2.46
**2.
01**
139.
95%
46.6
9%46
.95%
3.32
***
1.62
45

Abn
orm
al P
erfo
rman
ceLB
O1
1LB
O1+
1LB
O2
1LB
O2+
1LB
O2+
2LB
O1
1LB
O1+
1LB
O2
1LB
O2+
1LB
O2+
2N
158
154
157
160
141
161
159
160
161
141
Y (
mea
n)5.
38%
1.85
%1
.21%
2.9
8%6
.48%
0.7
7%26
.99%
24.7
1%13
.04%
41.9
9%
t1.
301.
92**
0.32
0.53
1.85
**0.
081.
94**
2.21
**1.
153.
70**
*Z
0.57
0.9
02
.39*
*3
.91*
**3
.89*
**2
.02*
*0.
241.
100
.40
2.91
***
Sect
orv
olat
ilit
y ad
just
edLB
O1
1LB
O1+
1LB
O2
1LB
O2+
1LB
O2+
2LB
O1
1LB
O1+
1LB
O2
1LB
O2+
1LB
O2+
2N
159
157
157
159
137
166
156
160
165
142
W (
mea
n)6
.28%
14.2
1%7.
36%
0.0
2%32
.01%
22.4
3%11
.78%
6.09
%3.
27%
9.5
6%
t0.
671.
050.
810.
012.
21**
*1.
38*
1.39
*0.
670.
221.
34*
Z2
.27*
**0
.38
0.02
0.9
91.
82*
0.6
10
.68
2.3
2**
3.6
1***
4.1
9***
PA
NE
L A
Tab
le 7
CA
/CL
CA
SH/C
L
Thi
sta
ble
repo
rts
resu
lts
ofth
eta
rget
com
pani
esliqu
idit
ym
easu
red
byC
urre
ntA
sset
sov
erC
urre
ntLia
biliti
esan
dC
ash
and
Cas
hE
quiv
alen
tsov
erC
urre
ntLia
biliti
es,
infive
differ
ent
poin
tsin
tim
ean
dch
ange
sin
duri
ngth
etw
obu
you
ts:
LB
O1
1in
dica
tes
one
year
befo
reth
efirs
tbu
yout
;LB
O+
1in
dica
tes
one
year
afte
rth
efirs
tbu
yout
;LB
O2
1in
dica
tes
one
year
befo
reth
ese
cond
buyo
ut;
LB
O2+
1in
dica
tes
one
year
afte
rth
ese
cond
buyo
ut;
LB
O2+
2in
dica
tes
two
year
saf
ter
the
seco
ndbu
you
t;LB
O1(
1;+
1)in
dica
tes
chan
ges
from
one
year
befo
reth
efirs
tbu
you
tto
one
year
afte
rth
efirs
tbu
you
t;LB
O2(
1;+
1)in
dica
tes
chan
ges
from
one
year
befo
reth
ese
cond
buy
out
toon
eye
araf
ter
the
seco
nd;
LB
O2(
1;+
2)in
dica
tes
chan
ges
from
one
year
befo
reth
ese
cond
buy
out
totw
oye
ars
afte
rth
ese
cond
buy
out.
Pan
elA
repo
rts
resu
lts
for
abso
lute
valu
esw
here
:A
bnor
mal
Per
form
ance
isth
edi
ffer
ence
betw
een
the
perf
orm
ance
indi
cato
rof
each
com
pany
min
usth
ein
dust
rym
edia
n,as
inB
arbe
ran
dLyo
n(1
996)
,an
dSe
ctor
Adj
uste
dis
the
differ
ence
betw
een
the
perf
orm
ance
indi
cato
rof
each
com
pany
min
usth
ein
dust
rym
edia
n,di
vide
dby
the
indu
stry
med
ian
stan
dard
,ca
lcul
ated
asin
Des
bier
esan
dSc
hatt
(200
2)su
bsti
tuti
ngin
dust
rym
eans
wit
hm
edia
ns.
Pan
elB
repo
rts
resu
lts
for
Per
form
ance
chan
ges
met
rics
whe
re:
Abn
orm
al%
Cha
nge
isth
edi
ffer
ence
betw
een
the
perc
enta
gech
ange
inab
solu
teA
bnor
mal
Per
form
ance
min
usth
epe
rcen
tage
chan
gein
the
indu
stry
med
ian;
Sect
orv
olat
ilit
yA
djus
ted
%C
hang
eis
the
differ
ence
betw
een
the
perf
orm
ance
indi
cato
rpe
rcen
tage
chan
gem
inus
the
indu
stry
med
ian
perf
orm
ance
indi
cato
rpe
rcen
tage
chan
ge,
divi
ded
byth
ein
dust
rype
rfor
man
cein
dica
tor'
sst
anda
rdde
viat
ion,
calc
ulat
edas
inD
esbi
eres
and
Scha
tt(2
002)
subs
titu
ting
indu
stry
mea
nsw
ith
med
ians
.St
atis
tica
lsi
gnific
ance
isca
lcul
ated
thro
ugh
ast
anda
rdt
test
(t)
and
ano
npa
ram
etri
cW
ilco
xon
sign
edr
ank
test
(Z).
Sign
ific
ance
at
the
1%, 5%
, an
d 10
% lev
el is
deno
ted
by *
**,*
*, a
nd *
res
pect
ivel
y.
Liq
uidi
ty
46
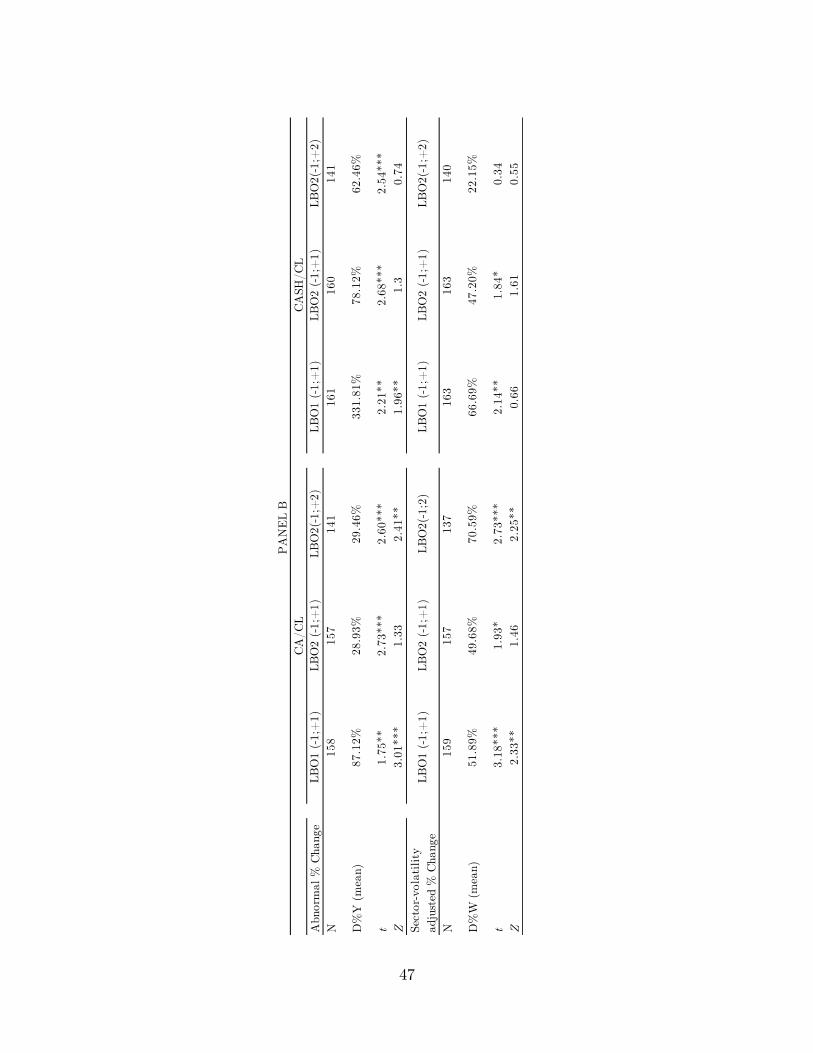
Abn
orm
al %
Cha
nge
N D%
Y (
mea
n)
t Z Sect
orv
olat
ilit
yad
just
ed %
Cha
nge
N D%
W (
mea
n)
t Z
3.01
***
1.33
1.96
**1.
32.
41**
2.25
**
29.4
6%
2.60
***
CA
SH/C
LC
A/C
L
LB
O1
(1;
+1)
LB
O2
(1;
+1)
LB
O2(
1;2
)
49.6
8%70
.59%
66.6
9%47
.20%
157
163
0.66
1.61
3.18
***
1.93
*2.
73**
*
159
137
51.8
9%
1.75
**2.
73**
*
LB
O1
(1;
+1)
LB
O2
(1;
+1)
158
157
87.1
2%28
.93%
2.33
**1.
46
22.1
5%
0.74
LB
O1
(1;
+1)
LB
O2
(1;
+1)
LB
O2(
1;+
2)
140
2.14
**1.
84*
0.34
163
2.21
**2.
68**
*
LB
O1
(1;
+1)
LB
O2
(1;
+1)
161
160
LB
O2(
1;+
2)14
1
62.4
6%
2.54
***
331.
81%
78.1
2%
PA
NE
L B
0.55
LB
O2(
1;+
2)14
1
47

Abn
orm
al P
erfo
rman
ceLB
O1
1LB
O1+
1LB
O2
1LB
O2+
1LB
O2+
2LB
O1
1LB
O1+
1LB
O2
1LB
O2+
1LB
O2+
2N
138
141
142
143
134
145
148
149
149
119
Y (
mea
n)4.
05%
10.7
2%6.
46%
6.98
%3.
90%
40.1
4%19
7.99
%20
.89%
195.
70%
41.4
0%
t1.
261.
631.
79*
2.47
**1.
340.
992.
26**
0.31
2.25
***
1.12
Z0.
291.
381.
142.
24**
0.89
0.05
0.21
0.58
0.91
0.28
Sect
orv
olat
ilit
y ad
just
edLB
O1
1LB
O1+
1LB
O2
1LB
O2+
1LB
O2+
2LB
O1
1LB
O1+
1LB
O2
1LB
O2+
1LB
O2+
2N
136
136
138
139
125
143
147
150
150
123
W (
mea
n)6.
56%
25.6
2%10
.36%
17.6
4%15
.56%
51.5
1%14
.66%
26.7
3%1
8.69
%19
.16%
t0.
481.
26*
0.76
1.33
*1.
40*
1.74
**0.
431.
84**
0.45
0.82
Z0
.29
0.44
0.31
1.50
1.35
0.36
1.11
0.17
0.87
0.01
PA
NE
L A
Tab
le 8
FD
/EB
ITD
AFD
/EA
Thi
sta
ble
repo
rts
resu
lts
ofth
eta
rget
com
pani
esca
pita
lst
ruct
ure
mea
sure
dby
Fin
anci
alD
ebt
over
Tot
alA
sset
san
dth
efina
ncia
lm
ulti
ple
mea
sure
dby
Fin
anci
alD
ebt
over
EB
ITD
A,
infive
differ
ent
poin
tsin
tim
ean
dch
ange
sin
duri
ngth
etw
obu
you
ts:
LB
O1
1in
dica
tes
one
year
befo
reth
efirs
tbu
yout
;LB
O+
1in
dica
tes
one
year
afte
rth
efirs
tbu
yout
;LB
O2
1in
dica
tes
one
year
befo
reth
ese
cond
buyo
ut;LB
O2+
1in
dica
tes
one
year
afte
rth
ese
cond
buyo
ut;
LB
O2+
2in
dica
tes
two
year
saf
ter
the
seco
ndbu
you
t;LB
O1(
1;
+1)
indi
cate
sch
ange
sfr
omon
eye
arbe
fore
the
firs
tbu
you
tto
one
year
afte
rth
efirs
tbu
you
t;LB
O2(
1;+
1)in
dica
tes
chan
ges
from
one
year
befo
reth
ese
cond
buy
out
toon
eye
araf
ter
the
seco
nd;
LB
O2(
1;+
2)in
dica
tes
chan
ges
from
one
year
befo
reth
ese
cond
buy
out
totw
oye
ars
afte
rth
ese
cond
buy
out.
Pan
elA
repo
rts
resu
lts
for
abso
lute
valu
esw
here
:A
bnor
mal
Per
form
ance
isth
edi
ffer
ence
betw
een
the
perf
orm
ance
indi
cato
rof
each
com
pany
min
usth
ein
dust
rym
edia
n,as
inB
arbe
ran
dLyo
n(1
996)
,an
dSe
ctor
Adj
uste
dis
the
differ
ence
betw
een
the
perf
orm
ance
indi
cato
rof
each
com
pany
min
usth
ein
dust
rym
edia
n,di
vide
dby
the
indu
stry
med
ian
stan
dard
,ca
lcul
ated
asin
Des
bier
esan
dSc
hatt
(200
2)su
bsti
tuti
ngin
dust
rym
eans
wit
hm
edia
ns.
Pan
elB
repo
rts
resu
lts
for
Per
form
ance
chan
ges
met
rics
whe
re:
Abn
orm
al%
Cha
nge
isth
edi
ffer
ence
betw
een
the
perc
enta
gech
ange
inab
solu
teA
bnor
mal
Per
form
ance
min
usth
epe
rcen
tage
chan
gein
the
indu
stry
med
ian;
Sect
orv
olat
ilit
yA
djus
ted
%C
hang
eis
the
differ
ence
betw
een
the
perf
orm
ance
indi
cato
rpe
rcen
tage
chan
gem
inus
the
indu
stry
med
ian
perf
orm
ance
indi
cato
rpe
rcen
tage
chan
ge,
divi
ded
byth
ein
dust
rype
rfor
man
cein
dica
tor'
sst
anda
rdde
viat
ion,
calc
ulat
edas
inD
esbi
eres
and
Scha
tt(2
002)
subs
titu
ting
indu
stry
mea
nsw
ith
med
ians
.St
atis
tica
lsi
gnific
ance
isca
lcul
ated
thro
ugh
ast
anda
rdt
test
(t)
and
ano
npa
ram
etri
c W
ilco
xon
sign
edr
ank
test
(Z).
Sig
nifica
nce
at t
he 1
%, 5%
, an
d 10
% le
vel is
den
oted
by
***,
**, an
d *
resp
ecti
vely
.
Cap
ital
Str
uctu
re
48

Abn
orm
al %
Cha
nge
N D%
Y (
mea
n)
t Z Sect
orv
olat
ilit
yad
just
ed %
Cha
nge
N D%
W (
mea
n)
t Z
138
LB
O1
(1;
+1)
LB
O2
(1;
+1)
LB
O2
(1;
+1)
275.
99%
136
138
143
150
20.7
9%87
.55%
LB
O1
(1;
+1)
LB
O2
(1;
+1)
LB
O1
(1;
+1)
125
61.6
7%
1.32
149
119
130.
34%
1.41
*
LB
O2(
1;+
2)LB
O2
(1;
+1)
2.72
***
322.
34%
1.52
*
2.84
***
2.09
**
LB
O2(
1;+
2)
2.92
***
1.89
**
LB
O1
(1;
+1)
1.89
**
145
101.
55%
0.47
FD
/EB
ITD
A
1.32
1.35
2.12
**
142
134
37.8
2%55
.82%
2.52
**2.
83**
*
0.17
0.2
30.
490.
91
123
168.
21%
PA
NE
L B
1.85
*
LB
O2(
1;+
2)
LB
O2(
1;+
2)
FD
/EA
0.0
70
.28
27.
94%
0.1
7
18.4
5%
0.98
49

LBO1LBO 2 (Full
sample)LBO 2
(Actual exits)LBO 2 (Est.
Exits)(A) (B) (C) (D) (A)(B) (A)(C) (A)(D)
Mean 1.102 0.507 0.811 0.149 3.911*** 1.592* 6.754***(1.195) (0.789) (0.909) (0.392)
Median 0.786 0.334 0.602 0.114 10.024*** 0.813 20.337***
Dividends/Cash Flows (mean) 0.121 0.295 0.434 0.166 4.483*** 5.732*** 1.112
(0.457) (0.488) (0.483) (0.405)
Obs. 89 87 47 40
LBO1LBO 2 (Full
sample)LBO 2
(Actual exits)LBO 2 (Est.
Exits)(A) (B) (C) (D) (A)(B) (A)(C) (A)(D)
Mean 0.329 0.054 0.127 0.267 5.383*** 2.371** 7.425***(0.457) (0.488) (0.483) (0.405)
Median 0.242 0.027 0.148 0.191 14.206*** 3.934** 27.785***
Obs. 89 87 47 40
Writeoffs
Obs.
115 4.000 10
Modified IRRTable 9
PANEL C Writeoffs
Full sample (actual+estimated)Global Dataset Full sample (actual)
PANEL A Equity MIRR
Difference tests
Difference tests
PANEL B EVMIRR
This table provides summary statistics for the MIRR on companies target of two consecutive buyout rounds. We report means andmedians significance tests for the difference between first round and second round (AB); the difference bewtween first round andsecond round buyout returns including only true exits (AC) and the difference bewtween first round and second round buyoutreturns including only the estimated exits. Estimated exits are computed as the runrate EBITDA multiplied by the prevailingmarket multiple. Panel A reports differences in equity MIRR computed as in Phalippou (2008) and the differences in the interimcash flows contribution to MIRR. Panel B reports differences in Enterprise Value MIRR computed as in Phalippou (2008) excludinginterim cash flows and net Financial Position at entry and exit; Panel C reports the number of writeoffs in the original globalEuropean sample of 2,911 buyout deals. Standard deviation is reported in parentheses in panel A and B. Difference in means isestimated by a standard twotailed ttest for equality of means. Difference in medians is estimated by a non parametric Ksampletest for equality of medians. We report Tvalues for the difference in means tests and Chisquare values for the differences inmedians tests. Significance at the 1%, 5% and 10% level is denoted by ***,** and * respectively.
(4.60%) (11.49%)(12.97%)
8747887
50

1 2 3 4 5 6 7Intercept 0.391*** 0.363*** 0.386*** 1.908*** 3.297** 0.622*** 0.805***
(0.056) (0.076) (0.074) (0.173) (1.395) (0.129) (0.076)
Revenue Multiple 0.002*** 0.003(0.000) (0.002)
Deal Value 0.186*** 0.108*(0.033) (0.057)
Months Held 0.005*** 0.014**(0.002) (0.007)
Months held^2 0.000(0.000)
Debt Spread 0.001*** 0.288***0.000 (0.027)
Debt Spread^2 0.001***(0.000)
LBO market Leverage 0.027*** 0.224***(0.000) (0.020)
Seller Ranking 0.121** 0.089(0.055) (0.095)
Buyer Ranking 1.966*** 2.483***(0.251) (0.386)
Joint Buyer, Seller Ranking 0.316 0.23(0.306) (0.503)
Year Fixed Effects YES YES YES YES YES YES YES
N 1,355 1,992 1,117 2,903 2,541 2,834 569Pseudo R2 0.020 0.040 0.020 0.130 0.000 0.010 0.220
Table 10Probit Regressions
This table presents results for a set of logistic regressions capturing the propensity of a target company tobe divested through a Secondary BuyOut. Peers are identified by LBO target companies in the same 4digit SIC code, not divested through a SBO or liquidation. In each model the dependent variable is 1 forsample firms, indicating exit through secondary buyout and 0 for control transactions, indicating exitthrough other routes. Independent variables are defined as follows: Revenue Multiple is the reported dealvalue multiple of the last available year revenues; Ebit Multiple is the reported deal value multiple of thelast available year EBIT; EBITDA Multiple is the reported deal value multiple of the last available yearEBITDA; Deal Value is the absolute disclosed dollar value of the deal expressed in million of dollars;Total debt funding is the reported total debt provided for the transaction; months held is the number ofmonths the company has been held by the seller before a Trade Sale or a SBO; Ranking Seller andRanking Buyer are measures of the cumulative ranking of PE investors in the selling or buying syndicate.It is computed by assigning a value of 1 to each investors ranked in the PEI 300 Worldwide Top50 fundsor European Top 25. If the majority of syndicate members are ranked as Top investors then the syndicateis given a dummy value of 1 and 0 otherwise. Joint Ranking is a dummy variable that takes a value of 1 ifboth the buysing and selling syndicate are classified as Top ranked by the two individual rankings. Robuststandard errors clustered at the year level are reported in parentheses. Significance at the 1%, 5% and 10%level is denoted by ***,** and * respectively.
Probability of exit through a SBO
51

TOTAL Pearson's Chi2NonTop Buyer 365 73% 133 27% 498
78% 65%14.48***
Top Buyer 100 58% 73 42% 17322% 35%
TOTAL 465 206 671
TOTAL Pearson's Chi2NonTop Buyer 36 69% 16 31% 52
67% 47%3.32*
Top Buyer 18 50% 18 50% 3633% 53%
TOTAL 54 34 88
NonTop Seller
Top SellerNonTop Seller
Top Seller
Table 11Collusion Deal Frequencies
PANEL B RESTRICTED SBO SAMPLE
PANEL A GLOBAL SBO SAMPLE
This table reports the frequency matrix of SBO transactions between Top funds and non top funds,wehere a Top fund is identified as a fund ranked in the top 50 investors worldwide or in the top 25European investors according to the Private Equity International PEI 300 survey. Panel A reportsabsolute and relative values observed in the global sample of 1,513 buyout deals focusing only onthe 723 second rounds. Panel B reports absolute and relative values observed in the restrictedsample of 326 buy out deals adopted for the operating performance tests and focusing only on the163 secondary rounds. Frequencies add up by column or row respectively. In the last column wereport a Pearson's chisquared test for the hypothesis that rows and columns are independent.
52

Mea
nM
edia
nM
ean
Med
ian
Mea
nM
edia
nM
ean
Med
ian
Rev
enue
Mul
tipl
e2.
112
1.78
12.
446*
1.89
41.
990
1.82
42.
717*
2.07
5
EB
IT M
ultipl
e20
.811
14.1
1827
.635
*18
.207
**15
.350
15.6
8125
.813
*17
.344
12
EB
ITD
A M
ultipl
e13
.824
11.2
14.1
2911
.904
811
.880
11.7
1117
.118
*12
.717
P/E
mul
tipl
e44
.093
23.5
3562
.821
*48
.307
39.5
7623
.801
38.2
4522
.962
Dea
l Val
ue39
9.59
730
9.00
093
4.94
2***
1029
.000
***
341.
400
290.
000
1002
.833
***
1004
.500
***
Tot
al D
ebt
Fun
ding
346.
419
248.
872
669.
181*
**54
4.17
***
201.
308
209.
435
619.
308*
**52
7.55
3**
Tab
le 1
2C
ollu
sion
Dea
l Cha
ract
eristics
Thi
sta
ble
repo
rts
mea
nan
dm
edia
nsof
ase
tof
deal
char
acte
rist
ics
betw
een
Top
fund
san
dno
nto
pfu
nds,
weh
ere
aT
opfu
ndis
iden
tified
asa
fund
rank
edin
the
top
50in
vest
ors
wor
ldw
ide
orin
the
top
25E
urop
ean
inve
stor
sac
cord
ing
toth
eP
riva
teE
quit
yIn
tern
atio
nal
PE
I30
0su
rvey
.St
atis
tics
are
com
pute
dfo
rth
egl
obal
sam
ple
of1,
513
buy
out
deal
sfo
cusi
ngon
lyon
the
723
seco
ndro
unds
and
for
the
rest
rict
edsa
mpl
eof
326
buy
out
deal
sad
opte
dfo
rth
eop
erat
ing
perf
orm
ance
test
san
dfo
cusi
ngon
lyon
the
163
seco
ndar
yro
unds
.D
iffe
renc
ein
mea
nsis
esti
mat
edby
ast
anda
rdtw
ota
iled
tte
stfo
req
uality
ofm
eans
.D
iffe
renc
ein
med
ians
ises
tim
ated
bya
non
para
met
ric
Ks
ampl
ete
stfo
req
uality
ofm
edia
ns.W
ere
port
Tv
alue
sfo
rth
edi
ffer
ence
inm
eans
tes
ts a
nd C
his
quar
e va
lues
for
the
diffe
renc
es in
med
ians
tes
ts. Si
gnific
ance
at
the
1%, 5%
and
10%
leve
l is
den
oted
by
***,
** a
nd *
res
pect
ivel
y.
Glo
bal S
BO
sam
ple
(Top
buy
er)
Res
tric
ted
SBO
Sam
ple
(Top
Buy
er)
Non
Top
Sel
ler
Top
Sel
ler
Non
Top
Sel
ler
Top
Sel
ler
6055
1316
3332
10
3735
1012
2925
107
7769
1518
1627
311
53