working paper series - european central bankworking paper series no 1664 / april 2014 tax deferral...
TRANSCRIPT

Work ing PaPer Ser ieSno 1664 / aPr i l 2014
Tax deferral andmuTual fund infloWS
evidence from aquaSi-naTural exPerimenT
Giuseppe Cappelletti, Giovanni Guazzarottiand Pietro Tommasino
In 2014 all ECB publications
feature a motif taken from
the €20 banknote.
noTe: This Working Paper should not be reported as representing the views of the European Central Bank (ECB). The views expressed are those of the authors and do not necessarily reflect those of the ECB.
HouSeHold finance and conSumPTion neTWork

© European Central Bank, 2014
Address Kaiserstrasse 29, 60311 Frankfurt am Main, GermanyPostal address Postfach 16 03 19, 60066 Frankfurt am Main, GermanyTelephone +49 69 1344 0Internet http://www.ecb.europa.euFax +49 69 1344 6000
All rights reserved.
ISSN 1725-2806 (online)EU Catalogue No QB-AR-14-038-EN-N (online)
Any reproduction, publication and reprint in the form of a different publication, whether printed or produced electronically, in whole or in part, is permitted only with the explicit written authorisation of the ECB or the authors.This paper can be downloaded without charge from http://www.ecb.europa.eu or from the Social Science Research Network electronic library at http://ssrn.com/abstract_id=2405423.Information on all of the papers published in the ECB Working Paper Series can be found on the ECB’s website, http://www.ecb.europa.eu/pub/scientific/wps/date/html/index.en.html
Household Finance and Consumption NetworkThis paper contains research conducted within the Household Finance and Consumption Network (HFCN). The HFCN consists of survey specialists, statisticians and economists from the ECB, the national central banks of the Eurosystem and a number of national statistical institutes.The HFCN is chaired by Gabriel Fagan (ECB) and Carlos Sánchez Muñoz (ECB). Michael Haliassos (Goethe University Frankfurt ), Tullio Jappelli (University of Naples Federico II), Arthur Kennickell (Federal Reserve Board) and Peter Tufano (University of Oxford) act as external consultants, and Sébastien Pérez Duarte (ECB) and Jiri Slacalek (ECB) as Secretaries.The HFCN collects household-level data on households’ finances and consumption in the euro area through a harmonised survey. The HFCN aims at studying in depth the micro-level structural information on euro area households’ assets and liabilities. The objectives of the network are:1) understanding economic behaviour of individual households, developments in aggregate variables and the interactions between the two; 2) evaluating the impact of shocks, policies and institutional changes on household portfolios and other variables;3) understanding the implications of heterogeneity for aggregate variables;4) estimating choices of different households and their reaction to economic shocks; 5) building and calibrating realistic economic models incorporating heterogeneous agents; 6) gaining insights into issues such as monetary policy transmission and financial stability.The refereeing process of this paper has been co-ordinated by a team composed of Gabriel Fagan (ECB), Pirmin Fessler (Oesterreichische Nationalbank), Michalis Haliassos (Goethe University Frankfurt) , Tullio Jappelli (University of Naples Federico II), Sébastien PérezDuarte (ECB), Jiri Slacalek (ECB), Federica Teppa (De Nederlandsche Bank), Peter Tufano (Oxford University) and Philip Vermeulen (ECB). The paper is released in order to make the results of HFCN research generally available, in preliminary form, to encourage comments and suggestions prior to final publication. The views expressed in the paper are the author’s own and do not necessarily reflect those of the ESCB.
Giuseppe CappellettiBank of Italy; e-mail: [email protected]
Giovanni GuazzarottiBank of Italy
Pietro TommasinoBank of Italy

Abstract
We propose a new method to identify the impact of a change in the tax burden on
mutual fund in�ows, exploiting a switch from an accrual-based to a realization-based tax
regime. We use quasi-experimental data from Italy where, starting from July 2011, the
tax regime for domestic mutual funds was changed from an accruals basis to a realization
basis, while the taxation of foreign funds remained on a realization basis. We �nd that
the reform has had a positive e¤ect on net in�ows of Italian funds (the treated group)
with respect to foreign funds (the control group). The e¤ect is both economically and
statistically signi�cant. Moreover, we �nd no evidence that the increase in the demand
for Italian funds came at the expense of foreign funds.
JEL Classi�cation: G20, G2, H2.
Keywords: mutual funds, capital income taxation

Non-technical summary
Mutual funds are one of the most widespread investment vehicle worldwide and it is
therefore important to understand the determinants of mutual funds investors�behaviour.
In this paper, we study to what extent they take into account mutual funds�taxation.
Theoretically, the e¤ects of reduced taxation on asset demand are ambiguous: a decrease
in the tax rate on the returns of a given asset tends to increase its average net return (with
a positive e¤ect on the asset�s demand), but also the variability of returns (which has a
negative e¤ect). The cross-e¤ect of a change in taxation of a given asset on other assets�
demand is also ambiguous.
In this paper, we try to identify the impact of a change in the tax burden on mutual
funds�in�ows, exploiting a switch from an accrual-based to a realization-based tax regime
enacted in Italy in July 2011. Under the �rst regime the increase in the value of a share
of the fund is taxed when it occurs; under the second, the capital gain is taxed only when
the share is sold and the gain is cashed by the investor. Ceteris paribus, taxation on a
realization basis amounts to a reduction in the net discounted value of the tax burden, as
the tax payment is deferred. For our purposes, a crucial element of the Italian reform is
that before its introduction the mutual funds based in Italy were taxed on accrual basis
while those based abroad were taxed on a realization basis. Starting from July 2011 both
types of mutual funds are taxed on a realization basis. Therefore, the reform concerned
only a subset of the funds available in the Italian market and this allows us to use funds
sponsored by foreign companies as a control group.
In the analysis we consider open-end harmonized funds (i.e. those established and
managed in accordance with the EU rules and regulations) and we use monthly data from
supervisory reports of the Bank of Italy and from the Morningstar database. In particular,
we rely on information communicated by asset management companies to the Bank of Italy
for purchases, redemptions and assets under management relative to Italian holders. This
source is quite valuable since it allows us to focus on Italian investors, who are subject to the
tax reform, excluding shares held by foreign investors. Data on returns �before and after
1

taxes �and on the investment specialization of each fund come instead from Morningstar.
Our baseline analysis is conducted on equity funds, which represent about 20% of the
whole Italian mutual funds market. The sample consists of 116 Italian funds (the treatment
group) and 259 foreign funds (the control group), divided among 52 di¤erent fund families.
In some robustness exercises, we consider a much wider sample (albeit on a quarterly instead
of a monthly frequency), including basically all Italian mutual funds and the majority of
foreign funds marketed in Italy (three quarters of the total in terms of assets held by Italian
residents).
Given our quasi-experimental set-up, we can make resort to di¤erence-in-di¤erences
techniques in order to identify the causal e¤ect of the tax change. We also use matching
techniques, which allow for non-linear as well as heterogeneous treatment e¤ects across
mutual funds. In some regressions we allow for the presence of substitution e¤ects between
treated and control funds.
Our results indicate that � controlling for returns, risk, and other fund-speci�c char-
acteristics �the switch from an accrual-based to a realization-based tax regime led to an
increase in the net in�ows for the treated funds, relative to non-treated ones, which is both
economically and statistically signi�cant. The increase is robust to di¤erent identi�cation
assumptions, estimation windows, and speci�cations. Our analysis suggests that the regime
change (which can be estimated as equivalent to a 1 percentage point reduction in the tax
burden for the treated funds) has increased the ratio of monthly net in�ows to assets of the
treated funds, relative to the control group, by about 2 percentage points. Moreover, we
found no evidence that the increase in the demand for Italian funds came at the expense of
foreign funds.
2

1 Introduction1
Mutual funds are one of the biggest investment vehicles worldwide. In the US, their
assets amount to about 37% of GDP and 11% of households��nancial portfolios. Even
in the euro area, where they are relatively less developed, their importance is far from
negligible (they account for 13% of GDP and 7% of households��nancial assets).
It is therefore important to understand how mutual funds investors behave. The consid-
erable exant literature sheds light on several issues2. We know, for example, that investors
tend to chase past fund performance (see e. g. Gruber, 1996 and Sirri and Tufano, 1998);
avoid funds with high fees (Sirri and Tufano, 1998, Barber et al., 2005); and prefer funds
which are more "visible", due to media coverage or to the size of the fund�s family (Sirri
and Tufano, 1998, Jain and Wu, 2000). There is also evidence that distribution channels
matter: �ows to funds distributed through captive brokers are less sensitive to expenses
(Christo¤ersen et al., forthcoming)3.
There is comparatively much less research on how investors take into account mutual
funds�taxation, which is the topic of the present paper.
The e¤ects of reduced taxation on asset demand are theoretically ambiguous (Stiglitz,
1969). A decrease in the tax rate on the returns of a given asset tends to increase its average
net return (with a positive e¤ect on the demand for the same asset), but also the variability
of returns (which has the opposite e¤ect).4 The cross-e¤ect of a change in taxation of a
given asset on other assets�demand is also ambiguous (Sandmo, 1977).
In this paper, we study in particular the e¤ects on funds��ows of a switch from an
accrual-based to a realization-based tax regime. Under the �rst regime, the increase in the
value of a share of the fund is taxed when the rise in value occurs. Under the second, it is
1The views expressed in the paper are those of the authors and do not necessarily re�ect those of theBank of Italy. We would like to thank Dimitris Christelis, Giorgio Gobbi, Sandro Momigliano, MarcinKacperczyk, Alessandro Rota, and seminar participants at the Bank of Italy, the ECB, the Annual Congressof the European Economic Association and the Annual Congress of the Italian Public Economics Societyfor their useful comments and suggestions.
2For a survey, see Zheng (2008).3By contrast, the distribution channel does not seem to in�uence the �ow-performance relationship
(Bergstresser et al., 2009).4The Government will in fact bear an increased share of potential losses as well as potential gains.
3

taxed only when the share is sold. Ceteris paribus, taxation on a realization basis amounts
to a reduction in the net discounted value of the tax burden, as the tax payment is deferred.
To measure the e¤ect of the switch to realization-based taxation we exploit a reform
enacted in Italy in July 2011. For our purpose, a crucial element of this reform is that it
concerned only a subset of the funds available in the Italian market, namely those sponsored
by asset management companies based in Italy. This allows us to use funds sponsored by
foreign companies as a control group.
To give a preview of our results, we �nd that the regime change (which can be estimated
as equivalent to a 1 percentage point reduction in the tax burden for the treated funds) has
had a signi�cant and positive impact on the ratio of monthly net in�ows to assets of the
treated funds, increasing them by about 2 percentage points.
Our paper adds to a small set of previous contributions, all concerned with the US
market. The paper most closely related to ours is that by Bergstresser and Poterba (2002)
which is, to our knowledge, the only one to address directly the relationship between a
fund�s tax burden and a fund�s in�ows. In particular, they regress the latter on the former
and on several other factors that can in�uence investor behavior, using a repeated cross-
section of US funds, and �nd that the relationship is negative and statistically signi�cant.
This suggests that investors are aware that funds returns are dented by taxes, and that tax
considerations play a role in determining their choices. With respect to this seminal paper,
the main di¤erence in our analysis is that we exploit a quasi-experimental policy change
instead of using a more standard regression-based approach. This should provide a more
clear-cut identi�cation of the relationship between taxation and fund �ows.
Ivkovic and Weisbrenner (2009) compare the behavior of a sample of US investors hold-
ing shares of mutual funds in taxable accounts with that of investors holding mutual funds
in non-taxable accounts. In the US, mutual funds�taxation is partly on a realization basis,
therefore the investors in the �rst group have an incentive to defer sales of their funds�
shares if the funds recorded positive returns. Ivkovic and Weisbrenner (2009) �nd that for
investors holding mutual funds�shares in taxable accounts there is indeed a negative rela-
tionship between redemptions and performance, whereas this relationship is absent in the
4

case of tax-exempt investors. In the same vein, Johnson and Poterba (2008) �nd that gross
fund in�ows are lower-than-average immediately before the tax year-end and higher-than-
average immediately after. Again, this is what one should expect given that postponing
the investment by a few days allows a delay of the tax payment by (at least) one year, and
therefore a non-negligible reduction of the present value of taxes. Like Ivkovic and Weis-
brenner (2009), Johnson and Poterba (2008) �nd that this e¤ect is absent for investors with
tax-deferred accounts. These two papers demonstrate that, for a subset of investors (those
holding a trading account), the possibility of tax deferral plays a role in the timing of their
sale decisions. However, as neither of their samples is representative of the population of
mutual funds investors, their results do not reveal much about the aggregate consequences
of di¤erent taxation regimes, which is instead the focus of our analysis.
A partially related literature investigates whether mutual fund managers consider taxes
in their choices. Barclay et al. (1998), Christo¤ersen et al. (2005) and Sialm and Starks
(2012) show that funds with a clientele of mostly taxable investors have a higher propensity
to realize losses and a lower propensity to distribute gains (another instance of the above-
mentioned lock-in e¤ect). By showing that mutual fund managers care about taxes, these
contributions provide indirect evidence that mutual fund investors care about taxes too.
The possibility of tax deferral applies to several �nancial instruments and not just mutual
funds. Turning to common stock investors, one should mention the notable studies by
Barber and Odean (2004) and Ivkovic et al. (2005).5
The rest of the paper is structured as follows: Section 2 outlines the characteristics of
the Italian mutual funds market, and describes in detail the quasi-natural experiment which
is at the core of our analysis. Section 3 we describes the data. In Section 4 we discuss our
empirical strategy and give our results. Section 5 concludes.
5These papers are also noteworthy as they pioneered the method of comparing tax-exempt and taxabletrading accounts. Earlier contributions are discussed in Poterba (2002a and 2002b). See also Daunfeldt etal. (2010) and Sadmo (1985).
5

2 The Italian mutual funds market and the 2011 tax reform
Table 1 gives an overview of the Italian mutual funds market structure. As of 2011,
Italian investors held open-end mutual funds shares valued at about e425 billion euros
(12% of total households��nancial assets or almost 30% of GDP). Italian mutual funds
i.e. funds sponsored by asset management companies based in Italy, represent about 35%
of this pie; the remaider is invested in foreign funds i.e. funds sponsored by companies
based abroad. Foreign funds sponsored by companies incorporated abroad but owned by
Italian intermediaries account in turn for 65% of all foreign funds. Many asset management
companies, both Italian and foreign, are held by Italian banking groups (they account for
about 80% of total net assets).6
Mutual funds are open both to households and to institutional investors. Based on the
information that the Bank of Italy collects on the assets under deposit with Italian banks, it
appears that the share held by households is roughly the same in Italian and foreign funds:
in 2011 it was respectively 72% and 69% (Table 2).
Before the 2011 reform, Italian investors holding shares of an Italian mutual fund were
subject to a substitute tax at a rate of 12.5%, levied on the yearly change in the value of
the fund�s portfolio (net of the value of subscriptions and redemptions; so-called "risultato
di gestione"). The tax was paid by the fund itself once a year. No tax applied to investors
upon collection of the income from the fund or redemption of fund shares. The tax regime
for domestic mutual funds was therefore completely based on the accruals method. In case
of negative returns, losses could be used to o¤set the funds� future gains (for up to four
years).7
By contrast, if an Italian investor held shares of a foreign fund8, the 12.5% tax rate had
to be paid by the Italian investor upon receipt of the income from the distribution or sale
of the fund�s shares (realization method). In this case too, capital losses could be used by
6A yearly outlook on the developements of the Italian mutual fund industry can be found in the Bank ofItaly�s Annual Reports.
7Or they could be used to o¤set a positive result of other funds managed by the same company (seeSavona, 2006).
8The regime applies to harmonized funds, i.e. those funds established and managed in accordance withthe EU rules and regulations on Undertakings for Collective Investment in Transferable Securities (UCITS).
6

the investor to o¤set other capital gains for the next four years.
As argued in the previous section, these tax rules, and in particular the impossibility
of tax deferral, implied ceteris paribus a higher tax burden with respect to a foreign fund,
putting Italian funds at a disadvantage vis à vis their foreign competitors.
The new law was passed in January 2011 and took e¤ect from the following July.9 From
that momoent onwards, the taxation of Italian funds changed from annual taxation levied
on the accrued returns to a tax levied on the investor upon receipt of the income, eliminating
any tax asymmetry with respect to foreign funds.
The gains of the reform in terms of reduced taxation depends on the expected distrib-
ution of the net returns of the investment and from the expected holding period. If one
assumes that expected before-tax returns for Italian equity mutual funds are equal to the
average over the 1990-2011 period (about 5,5% per year), and that the holding period is
equal to that observed in the past (5 years) it turns out that the reform is equivalent to
a reduction in the tax rate on yearly returns of about 1 percentage point, from 12.5 to
11.5%.10
3 The Dataset
We collected monthly data from supervisory reports to the Bank of Italy and the Morn-
ingstar database. In particular, we rely on information communicated by asset management
companies to the Bank of Italy for purchases, redemptions and assets under management
relative to Italian subscribers. This information is quite unique since it allows us to focus on
Italian investors/taxpayers, excluding shares held by foreign investors.11 Data on returns
- before and after taxes - and on the investment specialization of each fund come instead
9Law n.10/2011.10The computation is done using the method proposed by Poterba (2002a, 2004), which abstracts from
uncertainty. Namely, we �nd the �� such that:
[1 + r(1� ��)]T = (1 + r)T � �h(1 + r)T � 1
iwhere r is the average long-run rate of return, � is the post-reform tax rate on realized capital gains, and Tis the holding period.11 In principle all UCITS funds can be traded in Italy, but we consider only those whose shares are actually
held by Italian investors.
7

from the Morningstar database.
Our initial dataset includes all the Italian funds and a wide sample of foreign funds
(amounting to three quarters of all foreign funds� assets held by Italian residents). We
consider open-end harmonized funds i.e. those established and managed in accordance with
the EU rules and regulations.12 For the sake of comparability, in most of the paper we
follow the other studies discussed in the introduction and limit our analysis to equity funds,
which represent about 20% of the whole Italian mutual funds market (however, in Section
4.1 we also show some sensitivity analyses in which the full sample is considered).
We also exclude funds with less than e1 million of assets under management and those
that registered net �ows greater in absolute value than 50 per cent of their net assets in a
single month.13 We also exclude sector and country funds. Their investment strategies focus
on very speci�c asset classes, and they are usually subscribed by institutional investors that
are subject to a distinctive tax regime. Indeed, corporations - as opposed to individuals -
can choose to receive mutual funds�earnings gross of taxes and to pay taxes on their total
net income, instead of being subject to the substitute taxation.
Our �nal sample consists of 116 Italian funds (the treatment group) and 259 foreign
funds (the control group), divided among 52 di¤erent fund families and belonging to the
following categories: European funds (of which 40 belonging to the treatment group and
68 to the control group), American funds (18 and 49), International funds (27 and 38),
and Paci�c or Emerging Markets funds (31 and 104). Italian funds tend to be bigger than
foreign funds (in the sex months preceding the reform the former had assets amounting
to e170 billion on average, against e126 billion for the foreign funds). On average, both
returns and volatility were rather similar across the two groups. Summary statistics are
reported in Tables 3 and 4.
As discussed above, the tax regimes of Italian and foreign funds di¤ered until June
and were aligned after that date, when Italian funds changed from an accrual-basis to a
12See footnote 7. Speci�cally we exclude exchange-traded, funds of funds and hedge funds. While only 85%of Italian funds are UCITS, foreign funds marketed to Italian investors are almost exclusively harmonizedfunds (UCITS).13Funds on the verge of being liquidated could report huge out�ows, which would skew the analysis.
8

realization-basis regime. On average, in the six months preceding the change in the tax
regime, Italian funds su¤ered monthly net out�ows of about 1.7%, against net in�ows of
about 0.8% for the foreign funds. In the six months after the reform, Italian funds net
out�ows decreased (to 1%), while foreign funds went from expansion to contraction, with
monthly net out�ows equal to about 0.5%.
These �gures are consistent with a positive impact of the reform on Italian funds in�ows
of roughly 2 percentage points of the funds�assets per month if one assumes that, without
the treatment, Italian fund in�ows would have experienced a drop analogous to the one
recorded by foreign funds. The rest of the paper aims at assessing whether this number
withstands out to a more rigorous econometric analysis, and in particular whether it can
be causally ascribed to the tax change or explained by other factors.
4 Empirical strategies and results
4.1 Di¤erence-in-di¤erences estimation
In this section, we employ the following empirical model:
Inflowit = �+Xk
�k1kt + Treati + �Treati � Postt + �Xit + "it (1)
where Inflowit is in�ows normalized by the fund�s size for fund i at date t;�1ktkis a set of
indicator functions equal to 1 if and only if t = k, and represent a full set of time dummies;
the dummy Treati is equal to 1 if i is an Italian fund and to 0 if it is a foreign fund; Postt
is equal to 1 for all months from July to December 2011 (i.e. after the reform came into
e¤ect) and to 0 for the remaining periods; Xit is a set of controls.
In particular, we control for the mean and the standard deviation of gross returns (both
computed as moving averages over the previous 12 months), the mutual fund investment
objective and - as it is customary in the literature - the previous period net asset value.
Our focus is on the coe¢ cient � of the interaction between the dummies Treati and Postt,
which captures the e¤ect of the tax reform on funds��ows for Italian funds, formally the
9

average treatment e¤ect on the treated.
In our baseline estimation (Table 5, column 2) the impact of the treatment is positive and
amounts to about 1,8 percentage points of the assets, on a monthly basis. Table 5 shows that
the estimate is largely stable for di¤erent speci�cations of model (1). In particular, results
analogous to the baseline estimate are obtained using a more parsimonious speci�cation -
substituting the full set of time dummies with just the Postt variable (column 1) - and also
including in the regression the 52 fund families as further controls (column 3).
The result does not change if we use the Jensen alpha - a more accurate proxy of
performance - instead of returns and their standard deviations (column 4)14 or if we do not
normalize our dependent variable dividing it by the size of the fund (Table 6).15
We also experiment with di¤erent time windows (Table 7, columns 1 and 2). First,
we restrict the sample to the three months before and the three months after the change.
Second, we extend the pre-treatment period up to January 2010. In both cases the e¤ect
of the tax-regime change appears strongly statistically signi�cant. In the former, it is
somewhat larger than in our baseline estimate (2.4% instead of 1.8%) in the latter it is
slightly lower (1.5%).
A further set of sensitivity analyses concerns the extension of the sample of funds consid-
ered. First, we enlarge the sample to include country and sector equity funds. As a second
step, we consider an even larger sample, including also bond and mixed (bond and equity)
funds, for a total of 3203 funds (as mentioned in Section 4, this represents basically 100%
of all Italian funds and three-quarters of all foreign funds). To build this sample, we have
to rely on Assogestioni data, which are released on a quarterly, not monthly, basis. In both
cases, the baseline estimates are substantially con�rmed (Table 7, respectively columns 5
and 6).
Di¤erence-in-di¤erences estimates are potentially exposed to the econometric problems
14The Jensen alpha is computed from a standard Capital Asset Pricing Model regression in which thefund�s extra-return with respect to the risk-free rate is regressed against a constant (the Jensen�s alpha)and the extra-return of the category to which the fund belongs (European, American, etc.). See Cesari andPanetta (2002) for a more detailed analysis of Italian funds �performance.15 In order to tackle scale problems we consider instead the hyperbolic sine of net in�ows (the log trans-
formation is obviously not viable as net �ows can take negative values). The coe¢ cient of the interactionterm can be interpreted as the semi-elasticity with respect to the change in the tax regime.
10

highlighted by Bertrand et al. (2004), namely a tendency (due to correlated residuals) to
�nd a signi�cant treatment e¤ect even when there is none, because the standard deviation
of the estimators is underestimated. However, to avoid this problem we adopted several
precautions. First, all our inferences are done using standard errors clustered at the fund�s
level. Moreover, we checked that the treatment e¤ect is signi�cant at 1% even if errors
are clustered at the group level, i.e. distinguishing Italian from Foreign funds16(Table 8,
column 1).
The statistical signi�cance of the treatment e¤ect remains very high even when the
standard errors are clustered in di¤erent ways (Table 8, columns 2 and 3), or the Bertrand
et al. (2004) recipe of collapsing the dataset into a T = 2 panel is adopted, with variables
averaged over the pre- and post-treatment period respectively (Table 8, column 4), or when
resorting to Generalized Least Squares estimation (Table 8, column 5).
4.2 Assessing the common trend assumption
The di¤erence-in-di¤erence approach relies on the assumption that, without the treatment,
the change in the outcome variable for the treated population would have been the same
as the change observed for the control group, conditional on the control variables (common
trend assumption). The common trend assumption is not directly testable, as it relies on
a counter-factual scenario. However, we can indirectly assess its plausibility. A simple eye-
ball test in our case does not seem inconsistent with the assumption, looking at net in�ows
normalized by the fund�s size (Figure 1) or at the residual of the regression of net in�ows
with respect to the mean and the standard deviation of returns (Figure 2). In this section
we discuss the issue more formally.
As a �rst check, we conduct a battery of "placebo" experiments, testing whether a sig-
ni�cant di¤erence in the dynamics of in�ows between foreign and domestic funds appeared
even in periods in which the treatment did not take place (in other words, we assessed the
e¤ects of several "mock reforms"). The evidence supports the common trend assumption
16This is the coarsest possible partition of our sample. Clustering at that level is suggested by Moulton(1990).
11

at least until the �rst quarter of 2011 (see Figure 3). The fact that the treatment e¤ect
starts to appear slightly signi�cant a few months before the change became e¤ective might
signal an anticipation e¤ect. As we discussed above, the law which changed the tax regime
for the Italian funds was passed at the beginning of January, even if the change took place
in the following July.17 If anything, this should strengthen our case for a positive impact of
the tax change on impact.
Another set of "placebo" experiments is performed using only foreign (i.e. non-treated)
funds. Namely, we pick at random a subset of them and pretend that they are treated; we
then run our baseline regression using this fake treatment group. The empirical distribution
of the estimate of the interaction term, shown in Figure 4, correctly suggests that the placebo
treatment has no e¤ect.
As a further check, we address the concern that Italian intermediaries providing both
Italian and foreign funds might have changed their marketing strategies at the same time of
the reform, therefore inducing a violation of the common trend assumption. This might be
in some way due to the increased funding di¢ culties experienced by some banks (which are
among the most important fund promoters) around mid-2011. While there is no evidence,
either formal or anecdotal, that this is the case (in particular, it does not appear that Italian
intermediaries started pushing Italian funds more aggressively than foreign funds), to be on
the safe side we repeat our baseline estimation excluding from the sample all foreign funds
sponsored by Italian groups. Reassuringly, the results don�t change (Table 7, column 3).
Similarly, we repeat our exercise excluding from the sample those funds (be they foreign or
domestic) that were sponsored by one of the �ve top Italian banking groups, which were
those that experienced the more severe deterioration in funding conditions (Table 7, column
4). Also in this case, our results hold.
Finally, we estimate a di¤erence-in-di¤erence model for all the controls we have used in
the baseline model. None of the controls appears to be in�uenced in a statistically relevant
way by the reform, in fact the coe¢ cient of the interaction term is never statistically di¤erent
17Of course, the existence of an anticipation e¤ect would only reinforce our point concerning the importanceof tax considerations for mutual fund investors.
12

from zero.
4.3 Allowing for substitution e¤ects
In principle, the change in the taxation of Italian funds (the treatment group) might have
in�uenced the demand for foreign mutual funds (the control group). In fact following the
reform some investors may have decided to move part of their savings from foreign mutual
funds to Italian ones. If this is so, our estimates would encompass the e¤ect of the tax
change on both on the demand for Italian funds and on that for foreign funds. Moreover,
the presence of a substitution e¤ect would violate the assumptions of the (simplest version
of the) di¤erence-in-di¤erences methodology. To obtain a consistent estimate of the direct
e¤ect of taxation on the demand for Italian mutual funds in the presence of a substitution
e¤ect between the two groups, we have to modify our di¤erence-in-di¤erence strategy.
In this section we follow Miguel and Kremer (2004), and adopt a procedure which doesn�t
require the no-substitution assumption. We assume, instead, that there is a sostitution e¤ect
but one that for each fund it is limited to a subset of funds which are more similar (its
"reference group"). In other words, within the class of foreign funds (the control group) the
change of taxation for Italian funds (the treatment group) has an e¤ect which depends on
(a measure of) similarity/substitutability among funds. Based on this weaker assumption,
we include two more regressors in the baseline regression: the total number of mutual funds
belonging to fund i�s reference group and the number of treated funds belonging to fund i�s
reference group. As for the reference groups, we adopt the Morningstar clusters, which are
built by looking at similarity along four dimensions: asset class, investment style, geographic
and sector specialization.
The results of this richer regression (Table 9, column 1) are very similar to those of our
baseline regression, suggesting that the substitution e¤ect did not play an important role.
This may not be surprising, given that only a relatively small fraction of the wealth of Italian
households is invested in equity funds (the resources to increase households�investments in
Italian mutual funds could therefore be easily found elsewhere).18
18Moreover, the overall amount of available resources is obviously not �xed: it can be increased by
13

Some asset management group sponsors mutual funds with the same asset allocation but
with a di¤erent domicile. We exploit this peculiarity of the Italian mutual funds industry
for a further robustness check. In particular, for each fund we de�ne as its reference group
the mutual funds which have the same Morningstar classi�cation and are run by asset
management companies belonging to the same group (Table 9, column 2). Even in this
case, the results are very similar to our baseline, again suggesting that the e¤ect of the
treatment on the control group is negligible. Other ways to build the reference groups yield
similar results too (Table 9, columns 3 and 4).
4.4 Matching estimators
Another set of estimators which do not require the common trend assumption to hold is pro-
vided by matching estimators. They rest on the assumption that the e¤ect of the treatment
will be the same both for the treated and for the non-treated population, conditional on the
included controls (unconfoundedness assumption). As remarked, among others, by Imbens
and Wooldridge (2009) and Lechner (2011), neither the common trend assumption nor the
unconfoundedness assumption implies the other. In particular, contrary to the matching
approach, the di¤erence-in-di¤erences approach is correct in the case of unobserved time-
invarying variables. However, given the panel nature of our data, we have the possibility of
including the pre-treatment outcome (i.e. Inflowit�1) among the regressors. This goes a
long way towards controlling for unobservables, and increases the plausibility of the uncon-
foundedness assumption. On this basis, the matching approach is often deemed preferable
to di¤erence-in-di¤erences when panel data are concerned (Imbens and Wooldridge, 2009).
The matching approach has two further advantages with respect to the di¤erence-in-
di¤erences estimator: �rst, it is fully non-parametric, so it does not assume linearity of the
treatment e¤ect; second, it allows for heterogeneous treatment e¤ects.
Therefore, in this section we complement the analysis of Section 4.1 by computing two
quite standard matching estimators (in both cases, we consider a T = 2 panel in which
variables are averaged over the pre-treatment and the post-treatment period, respectively).
increasing the saving rate.
14

The �rst is a propensity score matching estimator (Rosenbaum and Rubin, 1983). To
compute it, we �rst estimate the propensity score of each observation using a probit in
which the dependent variable is the treatment dummy, and the independent variables are
lagged in�ows, returns, and volatility; then, each observation is associated to one group of
observations or "stratum", so that the average propensity score of the treated and the non-
treated within each group/stratum is the same.19 For each stratum, the average di¤erence
in the di¤erence in in�ows between Italian and foreign funds is computed; the estimator of
the average treatment e¤ect is the across-strata average of this magnitude. More formally
(denoting by the set of all strata S, by j:j the number of elements of a set, and by N the
set of all observed funds), we have:
�̂ =XS2
jSjjN j �̂S , where �̂S =
Pi2fi:Treati=1g\S �Inflowi
jfi : Treati = 1g \ Sj�Pi2fi:Treati=0g\S �Inflowi
jfi : Treati = 0g \ Sj(2)
The estimated treatment e¤ect obtained with this methodology (�̂) is in line with the one
obtained with di¤erence-in-di¤erences and highly statistically signi�cant (Table 10, column
1).
The second estimator that we compute is a pairwise-matching estimator. We match each
treated fund with the most similar one among the non-treated, compute the di¤erence-in-
di¤erences between each treated fund and its non-treated counterpart, and �nally average
across all the treated funds. In symbols, this amounts to the following estimator:
�̂ =
Pfi:Treati=1g
��Inflowi ��InflowM(i)
�jfi : Treati = 1gj
; (3)
where M(i) denotes the non-treated unit matched to the treated unit i. The similarity is
judged by considering the same covariates that we used in the case of the propensity score
matching, therefore pre-treatment in�ows are also considered. The result is similar in size
to the one obtained using a propensity score, and it is again highly signi�cant (Table 10,
19For this purpose, we use the algorithm by Becker and Ichino (2002).
15

columns 2 and 3).20
As a �nal exercise, we compute the Athey and Imbens (2006) changes-in-changes esti-
mator, which also allows for heterogeneous and non-linear treatment e¤ects. Incidentally,
we notice that the estimator proposed by Athey and Imbens allows for the treatment to
in�uence the outcome of the control groups. Hence it can be used to tackle the issue related
to the presence of a substitution e¤ect among the two sets of funds, discussed in Section
4.3. Table 10 (column 4) reports the results of the changes-in-changes estimation. Our
main result is again con�rmed: the average e¤ect of the reform for Italian mutual funds is
positive and statistically signi�cant.
5 Conclusions
In this paper we use a new method to identify the impact of a change in the tax burden
on mutual funds�in�ows, exploiting a switch from an accrual-based to a realization-based
tax regime. In particular, we take advantage of a quasi-natural experiment due to a tax
reform enacted in Italy in 2011.
Our results indicate that there is an increase in the net in�ows for the treated funds which
is both economically and statistically signi�cant, as well as robust to di¤erent identi�cation
assumptions, estimation windows, and speci�cations. Moreover, we found no evidence that
the increase in the demand for Italian funds came at the expense of foreign funds.
Before concluding, we would like to stress that our results do not mean that the re-
form was welfare-enhancing. Indeed, while the development of the institutional investors�
industry in non Anglo-Saxon countries is often seen as a policy priority, this objective can
be pursued by other means as well. Resorting to the taxation lever entails costs for the
public budget. It would be interesting to compute these costs and to arrive at a full-�edged
evaluation of the Italian 2011 reform. It would also be interesting to investigate what kind
of investor is more sensitive to tax considerations. Both topics are left for future research.
20Two di¤erent metrics are used; for more details see Abadie et al. (2001). We also adjusted the pairwisematching estimator to take into account the bias highlighted by Abadie and Imbens (2006). No relevantdi¤erences emerged.
16

6 References
Abadie, A., Drukker, D., Herr, J.L., Imbens, G.W. (2001), "Implementing matching esti-
mators for average treatment e¤ects in Stata", Stata Journal, vol. 1(1), pp. 1-18.
Abadie, A. and Imbens, G. W. (2006), "Large sample properties of matching estimators
for average treatment e¤ects", Econometrica, vol. 74(1), pp. 235-267.
Athey, S., and G. Imbens (2006), �Identi�cation and Inference in Nonlinear Di¤erence-
In-Di¤erences Models�, Econometrica, vol. 74(2), pp. 431-497.
Barber, B. M. and Odean, T. (2004), "Are individual investors tax savvy? Evidence
from retail and discount brockerage accounts", Journal of Public Economics, vol. 88(1/2),
pp. 419-442.
Barber, B. M., Odean, T. and Zheng, L. (2005), "Out of sight, out of mind: the e¤ect
of expenses on mutual fund �ows", Journal of Business, vol. 78(6), pp. 2095-2120.
Barclay, M. J., Pearson, N. D., Weisbach, M. S. (1998), "Open-end mutual funds and
capital gains taxes", Journal of Financial Economics, vol. 49, pp. 3-43.
Becker, S.O. and Ichino, A. (2002), "Estimation of average treatment e¤ects based on
propensity scores", Stata Journal, vol. 2(4), pp. 358-377.
Bergstresser, D., Chalmers, J. M. R., Tufano, P. (2009), "Assessing the costs and bene�ts
of brokers in the mutual fund industry", Review of �nancial studies, vol. 22 (10), pp. 4129-
4156.
Bergstresser, D., Poterba, J. (2002), "Do after-tax returns a¤ect mutual funds in�ows?",
Journal of Financial Economics, vol. 63, pp. 381- 414.
Bertrand, M., Du�o, E. and Mullainathan, S. (2004), "How Much Should We Trust
Di¤erences-in-Di¤erences Estimates?", Quarterly Journal of Economics, vol. 119(1), pp.
249-275.
Cesari, R. and Panetta, F. (2002), �The performance of Italian equity funds�, Journal
of Banking & Finance, vol. 3.
Christo¤ersen, S., Evans, R. and Musto, D. (forthcoming), "What do Consumers�Fund
Flows Maximize? Evidence from Their Brokers�Incentives", Journal of �nance.
17

Christo¤ersen, S.E.K., Geczy, C.C., MUsto, D:K., Reed, A:V. (2005), "Crossborder div-
idend taxation and preferences of taxable and nontaxable investors: evidence from Canada",
Journal of �nancial economics, vol. 78, pp. 121-144.
Daunfeldt, S.O., Praski-Ståhlgren, U. and Rudholm, N. (2010), "Do high taxes lock-in
capital gains? Evidence from a dual income tax system", Public Choice, vol. 145, pp.25�38.
Gruber, M.J. (1996), "Another puzzle: the growth in actively managed mutual funds",
Journal of Finance, vol. 51(3), pp. 783-810.
Imbens, G. W. and Wooldridge, J. M. (2009), "Recent developments in the econometrics
of program evaluation", Journal of Economic Literature, vol. 47, pp. 5-86.
Ivkovic, Z. andWeisbrenner, S. (2009), "Individual investors mutual fund �ows", Journal
of �nancial economics, vol. 92 223-237.
Ivkovic, Z., Poterba, J. and Weisbrenner, S. (2005), "Tax-motivated trading by individ-
ual investors", American economic review, vol. 95 (5), pp. 1605-1630.
Jain, P. C. and Wu, J. S. (2000), "Truth in mutual fund advertising: evidence on future
performance and fund �ows", Journal of Finance, vol. 55(2), pp. 937-958.
Johnson, W. and Poterba, J.M. (2008), "Taxes and mutual fund in�ows around distri-
bution dates", NBER working paper no. 13884.
Lechner, M. (2011), "The estimation of causal e¤ects by di¤erence-in-di¤erence meth-
ods", Universitat St. Gallen, Discussion paper, no. 2010-28.
Miguel, E. and Kremer M. (2004), "Worms: Identifying Impacts on Education and
Health in the Presence of Treatment Externalities", Econometrica, vol. 72(1), pp. 159-217.
Moulton, B. R. (1990), "An Illustration of a Pitfall in Estimating the E¤ects of Aggregate
Variables on Micro Units", Review of Economics and Statistics, vol. 72, pp. 334-338.
Poterba, J. (2004), "Valuing Assets in Retirement Saving Accounts," NBER Working
Papers, no. 10395.
Poterba, J. (2002a), "Taxation, risk-taking, and household portfolio behavior", in Auer-
bach A. J. and Feldstein, M. (eds), Handbook of Public Economics, Elsevier.
Poterba, J. (2002b), "Taxation and portfolio structure: issues and implications", in
Guiso, L., Haliassos, M. and Jappelli, T. (eds), Household Portfolio, Mit Press, Cambridge.
18

Rosenbaum, P.R. and Rubin, D.B: (1983), "The central role of the propensity score in
observational studies for causal e¤ects", Biometrika, vol. 70(1), pp. 41-55.
Sandmo, A. (1977), "Portfolio theory, asset demand and taxation: Comparative statics
with many assets", Review of Economic Studies, vol. 44, pp. 369-379.
Sandmo, A. (1985),"The e¤ects of taxation on saving and risk-taking", in A.J. Auerbach
& M.S. Feldstein (eds.), Handbook of Public Economics, Vol. I, North-Holland.
Savona, R. (2006), �Tax-induced Dissimilarities Between Domestic and Foreign Mutual
Funds in Italy�, Economic Notes.
Sialm, C. and Starks, L. (2012), "Mutual Fund Tax Clienteles", The Journal of Finance,
Vol. 67(4), pp. 1397-1422.
Sirri, E. R. and Tufano, P. (1998), "Costly search and mutual fund �ows", Journal of
Finance, vol. 53(5), pp. 1589-1622.
Stiglitz, J. E (1969), "The e¤ect of income, wealth, and capital gains taxation on risk-
taking", Quarterly Journal of Economics, vol. 83, pp. 262-283.
Zheng, Lu (2008), "The behaviour of mutual fund investors", in Thakor, A. V. and
Boot A. W. A. (eds), Handbook of �nancial intermediation and banking, North Holland.
19

Figure 1: Average net in�ows (normalized by the fund�s size; percentage points).
Figure 2: Average of the residuals of net in�ows (normalized by the fund�s size) regressedon the mean and the standard deviation of returns (percentage points).
3
2
1
0
1
2
3
Jan10 Apr10 Jul10 Oct10
Foreign Italian
20
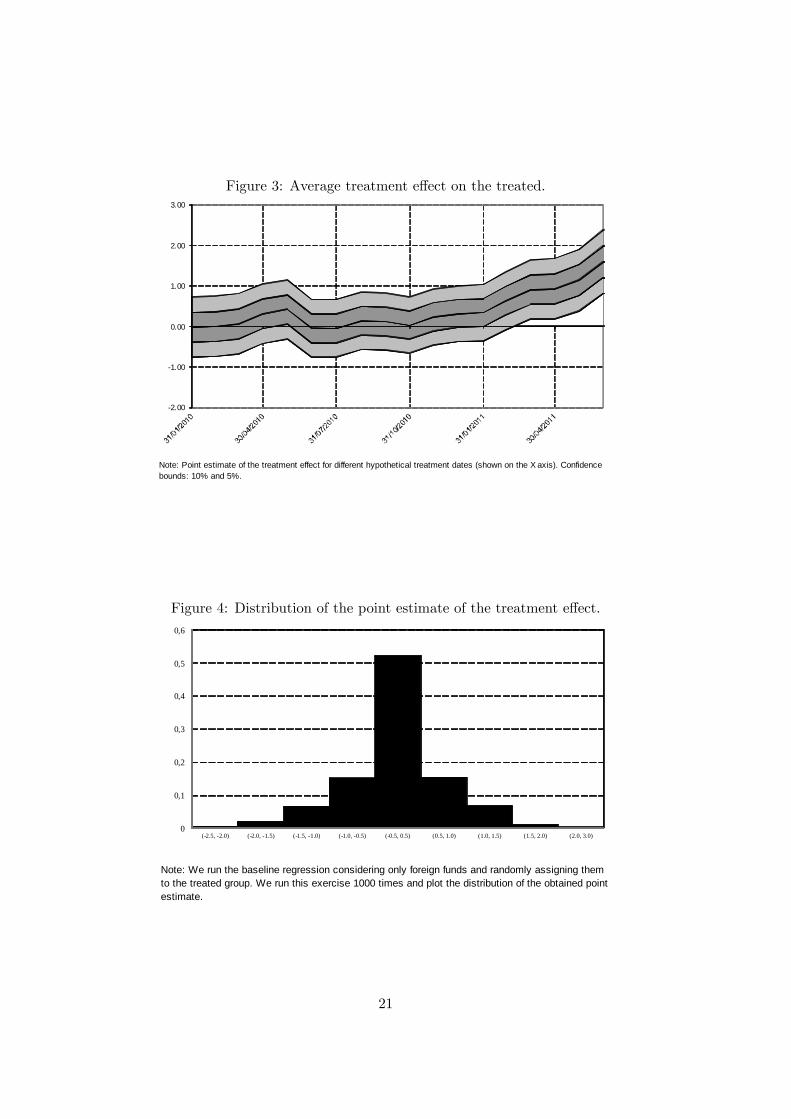
Figure 3: Average treatment e¤ect on the treated.
Note: Point estimate of the treatment effect for different hypothetical treatment dates (shown on the X axis). Confidencebounds: 10% and 5%.
2.00
1.00
0.00
1.00
2.00
3.00
Figure 4: Distribution of the point estimate of the treatment e¤ect.
Note: We run the baseline regression considering only foreign funds and randomly assigning themto the treated group. We run this exercise 1000 times and plot the distribution of the obtained pointestimate.
0
0,1
0,2
0,3
0,4
0,5
0,6
(2.5, 2.0) (2.0, 1.5) (1.5, 1.0) (1.0, 0.5) (0.5, 0.5) (0.5, 1.0) (1.0, 1.5) (1.5, 2.0) (2.0, 3.0)
21

Table1:Open-endmutualfundsheldbyItalianinvestors:marketstructure(endof2011).
Num
ber o
ffu
nds
Net a
sset
s(m
illio
n eu
ros)
Net i
nflo
ws
(mill
ion
euro
s)
Tota
l fun
ds3.
737
426.
771
33.
270
Dom
estic
(1)
811
153.
692
34.
486
of w
hich
: Equ
ity fu
nds
166
19.1
451
.906
Fore
ign
(2)
2.92
627
3.07
91.
216
of w
hich
: Equ
ity fu
nds
1.33
073
.449
2.1
59of
whi
ch: S
et u
p by
dom
estic
inte
rmed
iarie
s90
117
6.16
63
.974
Sour
ces:
Ban
k of
Ital
y an
d As
soge
stio
ni.
(1) D
omes
tic fu
nds
are
defin
ed a
s th
ose
run
by a
sset
man
agem
ent
com
pani
es b
ased
in It
aly.
(2) F
orei
gn fu
nds
are
defin
ed a
s th
ose
run
by a
fore
ign
asse
t man
agem
ent c
ompa
ny.
22

Table2:Holdingsofmutualfundsbysector(percentagepoints).
Fina
ncia
lS
ecto
rFi
rms
Hou
seho
lds
Fina
ncia
lS
ecto
rFi
rms
Hou
seho
lds
Jan
1124
,10,
673
,324
,41,
069
,2Fe
b11
27,9
0,6
69,6
24,3
1,1
68,9
Mar
11
22,3
0,6
75,2
24,4
1,1
69,0
Apr
11
29,3
0,6
68,3
25,1
1,1
68,2
May
11
30,0
0,6
67,7
24,9
1,1
68,4
Jun
1129
,80,
667
,924
,61,
168
,6Ju
l11
29,0
0,6
68,6
24,8
1,1
68,9
Aug
11
29,0
0,6
68,9
24,4
1,0
69,5
Sep
11
21,9
0,6
75,9
24,6
1,0
69,6
Oct
11
22,5
0,6
75,4
24,1
1,2
69,8
Nov
11
22,5
0,6
75,7
23,9
1,2
69,8
Dec
11
22,8
0,6
75,5
23,3
1,2
70,2
Sou
rce:
Ban
k of
Ital
y.
Fore
ign
fund
sIta
lian
fund
s
23

Table3:Summarystatistics.
Num
ber o
ffu
nds
Ave
rage
asse
ts
Ave
rage
net
inflo
ws
over
asse
ts
Num
ber o
ffu
nds
Ave
rage
asse
ts
Ave
rage
net
inflo
ws
over
asse
ts(m
ln e
uro)
(%)
(mln
(%)
Equ
ity A
mer
ica
1811
70,
0349
138
0,15
Equ
ity E
urop
e29
179
1,7
854
100
3,0
8E
quity
Pac
ific
1612
01
,66
4286
1,5
9E
quity
Eur
oA
rea
1110
71
,13
1430
1,7
7E
quity
Inte
rnat
iona
l27
131
0,8
838
134
1,7
9E
quity
Em
ergi
ng M
arke
ts15
201
2,5
162
112
1,3
2
Italia
n fu
nds
Fore
ign
Fund
s
24

Table 4: Summary Statistics.
Before reform(1)
After reform(2)
Before reform(1)
After reform(2)
Number of funds 116 116 259 259
Asset undermanagement (3)
mean 170,43 147,04 125,96 109,89median 73,71 67,44 48,96 42,93standard deviation 228,57 195,12 214,87 191,17
Net inflows (mln Euro)mean 1,00 1,03 0,21 1,02median 0,29 0,32 0,02 0,28standard deviation 5,51 4,85 8,99 6,06
Net inflows over assets(4)
mean 1,71 1,02 0,76 0,47median 0,98 0,66 0,10 0,74standard deviation 7,24 4,85 8,58 4,38
Average fund return overpast 12 months (4)
mean 0,86 0,48 0,99 0,46median 0,86 0,44 0,98 0,38standard deviation 0,50 0,68 0,65 0,88
Standard deviation offund returns over past12 months (4)
mean 3,15 3,99 3,44 4,30median 3,04 3,91 3,32 4,25standard deviation 0,66 0,94 0,86 1,18
Italian funds Foreign Funds
(1) Between January and June 2011. (2) Between July and December 2011. (3) Assetsheld by Italian investors; millions of euros. (4) Percentage points.
25
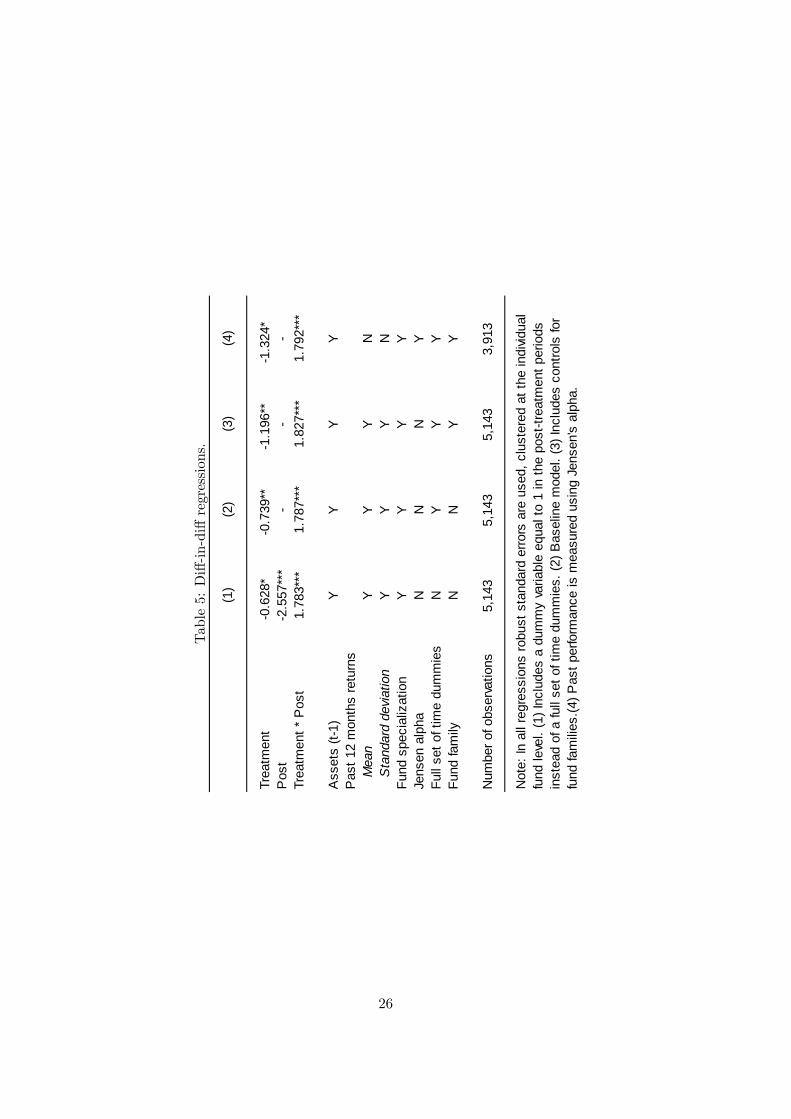
Table5:Di¤-in-di¤regressions.
(1)
(2)
(3)
(4)
Trea
tmen
t0
.628
*0
.739
**1
.196
**1
.324
*P
ost
2.5
57**
*
Trea
tmen
t * P
ost
1.78
3***
1.78
7***
1.82
7***
1.79
2***
Ass
ets
(t1)
YY
YY
Pas
t 12
mon
ths
retu
rns
Mea
nY
YY
NS
tand
ard
devi
atio
nY
YY
NFu
nd s
peci
aliz
atio
nY
YY
YJe
nsen
alp
haN
NN
YFu
ll se
t of t
ime
dum
mie
sN
YY
YFu
nd fa
mily
NN
YY
Num
ber o
f obs
erva
tions
5,14
35,
143
5,14
33,
913
Not
e: In
all
regr
essi
ons
robu
st s
tand
ard
erro
rs a
re u
sed,
clu
ster
ed a
t the
indi
vidua
lfu
nd le
vel.
(1) I
nclu
des
a du
mm
y va
riabl
e eq
ual t
o 1
in th
e po
sttr
eatm
ent p
erio
dsin
stea
d of
a fu
ll se
t of t
ime
dum
mie
s. (2
) Bas
elin
e m
odel
. (3)
Incl
udes
con
trols
for
fund
fam
ilies
.(4) P
ast p
erfo
rman
ce is
mea
sure
d us
ing
Jens
en's
alp
ha.
26

Table6:Di¤-in-di¤regressions:adi¤erentdependentvariable.
(1)
(2)
(3)
(4)
Trea
tmen
t0
.335
***
0.3
61**
*0
.532
***
0.5
03**
*P
ost
0.29
8***
Tr
eatm
ent *
Pos
t0.
298*
**0.
3***
0.29
1***
0.28
9**
Ass
ets
(t1)
YY
YY
Pas
t 12
mon
ths
retu
rns
Mea
nY
YY
NS
tand
ard
devi
atio
nY
YY
NFu
nd s
peci
aliz
atio
nY
YY
YJe
nsen
alp
haN
NN
YFu
ll se
t of t
ime
dum
mie
sN
YY
YFu
nd fa
mily
NN
YY
Num
ber o
f obs
erva
tions
5,14
35,
143
5,14
33,
913
Not
e: D
epen
dent
var
iabl
e: h
yper
bolic
sin
e of
net
inflo
ws.
In a
ll re
gres
sion
s ro
bust
stan
dard
erro
rs a
re u
sed,
clu
ster
ed a
t the
indi
vidua
l fun
d le
vel.
(1) I
nclu
des
a du
mm
yva
riabl
e eq
ual t
o 1
in th
e po
sttr
eatm
ent p
erio
ds is
tead
of a
full
set o
f tim
e du
mm
ies.
(2) B
asel
ine
mod
el. (
3) In
clud
es c
ontro
ls fo
r fun
d fa
mili
es. (
4) P
ast p
erfo
rman
ce is
mea
sure
d us
ing
Jens
en's
alp
ha.
27

Table7:Di¤-in-di¤regressions:varioussamples.
(1)
(2)
(3)
(4)
(5)
(6)
Trea
tmen
t1
.02*
**0
.703
***
1.6
42**
*0
.795
**0
.908
6***
2.9
67**
*P
ost
Trea
tmen
t * P
ost
2.31
2***
1.51
3***
2.57
5***
1.90
8***
1.88
73**
*1.
6836
***
Ass
ets
(t1)
YY
YY
YY
Pas
t 12
mon
ths
retu
rns
Mea
nY
YY
YY
YS
tand
ard
devi
atio
nY
YY
YY
YFu
nd s
peci
aliz
atio
nY
YY
YY
YJe
nsen
alp
haN
NN
NN
NFu
ll se
t of t
ime
dum
mie
sY
YY
YY
YFu
nd fa
mily
NN
NN
NN
Num
ber o
f obs
erva
tions
2,57
49,
774
4,39
84,
579
7,42
78,
663
Not
e: In
all
regr
essi
ons
we
use
robu
st s
tand
ard
erro
rs, c
lust
ered
at t
he in
divid
ual f
und
leve
l. (1
) Sam
ple
rest
ricte
dbe
twee
n M
arch
and
Sep
tem
ber 2
011.
(2) S
ampl
e en
larg
ed s
tarti
ng fr
om J
anua
ry 2
010.
(3) W
e ex
clud
e fo
reig
n fu
nds
spon
sore
d by
Ital
ian
inte
rmed
iarie
s. (4
) We
excl
ude
fund
s be
long
ing
to th
e to
p fiv
e Ita
lian
bank
ingr
gro
ups;
(5) S
ampl
een
larg
ed to
incl
ude
all t
he e
quity
fund
s (e
ven
thos
e w
ith c
ount
ry o
r sec
tor i
nves
tmen
t stra
tegi
es);
(6) A
ssog
estio
niS
ampl
e: q
uarte
rly d
ata
incl
udin
g bo
th e
quity
and
non
equ
ity (b
ond
and
mix
ed) m
utua
l fun
ds.
28

Table8:Di¤-in-di¤regressions:di¤erentwaystoaccountforcorrelatedresiduals.
(1)
(2)
(3)
(4)
(5)
Trea
tmen
t0
.739
**0
.739
0.7
39**
*1
.467
***
1.2
43**
*P
ost
2
.538
***
Tr
eatm
ent *
Pos
t1.
787*
**1.
787*
*1.
787*
**2.
266*
**1.
97**
*
Ass
ets
(t1)
YY
YY
YP
ast 1
2 m
onth
s re
turn
sM
ean
YY
YY
YS
tand
ard
devi
atio
nY
YY
YY
Fund
spe
cial
izat
ion
YY
YY
YJe
nsen
alp
haN
NN
NN
Full
set o
f tim
e du
mm
ies
YY
YN
YFu
nd fa
mily
NN
NN
N
Num
ber o
f obs
erva
tions
5,14
35,
143
5,14
385
05,
143
(1)
Bas
elin
e sp
ecifi
catio
n w
ith c
lust
erin
g ac
cord
ing
to tr
eatm
ent s
tatu
s. (
2) B
asel
ine
spec
ifica
tion
with
clu
ster
ing
acco
rdin
g to
fam
ily g
roup
and
tim
e pe
riod.
(3) B
asel
ine
spec
ifica
tion
with
clu
ster
ing
at th
e fu
ndfa
mily
leve
l. (4
) Var
iabl
esav
erag
ed o
ver t
he 6
mon
ths
befo
re a
nd a
fter J
uly
1, re
spec
tivel
y (B
ertra
nd e
t al.,
200
4). (
5) G
LS.
29
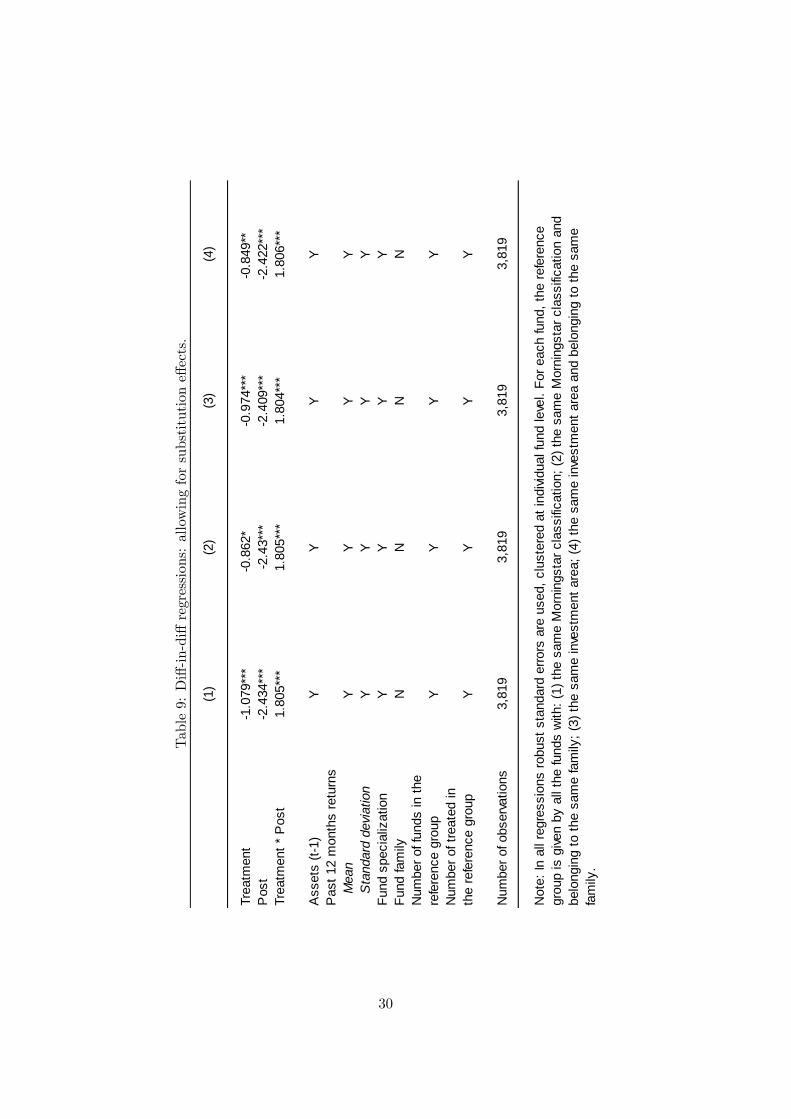
Table9:Di¤-in-di¤regressions:allowingforsubstitutione¤ects.
(1)
(2)
(3)
(4)
Trea
tmen
t1
.079
***
0.8
62*
0.9
74**
*0
.849
**P
ost
2.4
34**
*2
.43*
**2
.409
***
2.4
22**
*Tr
eatm
ent *
Pos
t1.
805*
**1.
805*
**1.
804*
**1.
806*
**
Ass
ets
(t1)
YY
YY
Pas
t 12
mon
ths
retu
rns
Mea
nY
YY
YS
tand
ard
devi
atio
nY
YY
YFu
nd s
peci
aliz
atio
nY
YY
YFu
nd fa
mily
NN
NN
Num
ber o
f fun
ds in
the
refe
renc
e gr
oup
YY
YY
Num
ber o
f tre
ated
inth
e re
fere
nce
grou
pY
YY
Y
Num
ber o
f obs
erva
tions
3,81
93,
819
3,81
93,
819
Not
e: In
all
regr
essi
ons
robu
st s
tand
ard
erro
rs a
re u
sed,
clu
ster
ed a
t ind
ividu
al fu
nd le
vel.
For e
ach
fund
, the
refe
renc
egr
oup
is g
iven
by a
ll th
e fu
nds
with
: (1)
the
sam
e M
orni
ngst
ar c
lass
ifica
tion;
(2) t
he s
ame
Mor
ning
star
cla
ssifi
catio
n an
dbe
long
ing
to th
e sa
me
fam
ily; (
3) th
e sa
me
inve
stm
ent a
rea;
(4) t
he s
ame
inve
stm
ent a
rea
and
belo
ngin
g to
the
sam
efa
mily
.
30

Table10:MatchingestimatesandChanges-In-Changesestimates.
(1)
(2)
(3)
(4)
Ave
rage
Tre
atm
ent E
ffect
on th
e Tr
eate
d2.
266*
**2.
214*
**1.
865*
**1.
63**
*
(0.4
44)
(0.3
97)
(0.7
23)
(0.7
10)
Ass
ets
(t1)
YY
YY
Pas
t 12
mon
ths
retu
rns
Mea
nY
YY
YS
tand
ard
devi
atio
nY
YY
Y
Num
ber o
f obs
erva
tions
444
444
444
696
(1) A
vera
ge T
reat
men
t Effe
ct o
n th
e Tr
eate
d es
timat
ed u
sing
pro
pens
ity s
core
. (2)
Ave
rage
Trea
tmen
t Effe
ct o
n th
e Tr
eate
d es
timat
ed u
sing
par
wis
e m
atch
ing
(radi
us m
etric
). (3
) Ave
rage
Trea
tmen
t Effe
ct e
stim
ated
usi
ng p
airw
ise
mat
chin
g (n
eare
st n
eigh
bor m
etric
). (4
) Cha
nges
In
Cha
nges
.
31