working paper series - european central bank · working paper series no 1412 / january 2012 global...
TRANSCRIPT
WORKING PAPER SERIESNO 1412 / JANUARY 2012
GLOBAL VALUE CHAINS DURING THE GREAT TRADE COLLAPSE
A BULLWHIP EFFECT?
by Carlo Altomonte, Filippo Di Mauro, Gianmarco Ottaviano, Armando Rungi
and Vincent Vicard
NOTE: This Working Paper should not be reported as representing the views of the European Central Bank (ECB). The views expressed are
those of the authors and do not necessarily refl ect those of the ECB.
In 2012 all ECB publications
feature a motif taken from
the €50 banknote.

© European Central Bank, 2012
AddressKaiserstrasse 29, 60311 Frankfurt am Main, Germany
Postal addressPostfach 16 03 19, 60066 Frankfurt am Main, Germany
Telephone+49 69 1344 0
Internethttp://www.ecb.europa.eu
Fax+49 69 1344 6000
All rights reserved.
ISSN 1725-2806 (online)
Any reproduction, publication and reprint in the form of a different publication, whether printed or produced electronically, in whole or in part, is permitted only with the explicit written authorisation of the ECB or the authors.
This paper can be downloaded without charge from http://www.ecb.europa.eu or from the Social Science Research Network electronic library at http://ssrn.com/abstract_id=1937513.
Information on all of the papers published in the ECB Working Paper Series can be found on the ECB’s website, http://www.ecb.europa.eu/pub/scientifi c/wps/date/html/index.en.html
Carlo Altomonte at Bocconi University, Via Roberto Sarfatti, 25, 20136 Milano, Italy; e-mail: [email protected]
Filippo Di Mauroat European Central Bank, Kaiserstrasse 29, D-60311 Frankfurt am Main, Germany; e-mail: fi [email protected]
Gianmarco Ottaviano at LSE, Houghton Street, London WC2A 2AE, UK and Bocconi University; e-mail: [email protected]
Armando Rungiat Bocconi University, Via Roberto Sarfatti, 25, 20136 Milano, Italy; e-mail: [email protected]
Vincent Vicardat Banque de France, 31 rue Croix des petits champs, 75001 Paris, France; e-mail: [email protected]

Abstract
This paper analyzes the performance of global value chains during the trade collapse.
To do so, it exploits a unique transaction-level dataset on French �rms containing infor-
mation on cross-border monthly transactions matched with data on worldwide intra-�rm
linkages as de�ned by property rights (multinational business groups, hierarchies of �rms).
This newly assembled dataset allows us to distinguish �rm�level transactions among two
alternative organizational modes of global value chains: internalization of activities (intra-
group trade/trade among related parties) or establishment of supply contracts (arm�s length
trade/trade among unrelated parties). After an overall assessment of the role of global value
chains during the trade collapse, we document that intra-group trade in intermediates was
characterized by a faster drop followed by a faster recovery than arm�s length trade. Am-
pli�ed �uctuations in terms of trade elasticities by value chains have been referred to as the
"bullwhip e¤ect" and have been attributed to the adjustment of inventories within supply
chains. In this paper we �rst con�rm the existence of such an e¤ect due to trade in inter-
mediates, and we underline the role that di¤erent organizational modes can play in driving
this adjustment.
JEL codes: F23, F15, L22.
Keywords: trade collapse, multinational �rms, global value chains, hierarchies of �rms , vertical
integration.

Non‐technical summary
The “Great Trade Collapse” has been one of the most striking features of the recent global financial crisis,
with the ongoing recovery still driving a wedge between output and trade. The drop in trade flows has been
very fast, particularly severe and synchronized across all countries, as several empirical studies already
suggest. Such features make the current trade drop quite unique among the many episodes of trade
decline typically associated to economic crises, and a number of transmission mechanisms have been
proposed which could account for these peculiarities. Among those mechanisms, a particular role has been
attributed to the emergence over the last decade of global supply chains, and to the different
compositional effects of the demand shock entailed by vertical linkages on trade and GDP.
In this paper we exploit transaction‐level French trade data matched with ownership data for the period
2007‐2009 to find evidence of a role for global value chains in explaining the magnitude of the trade
collapse. Consistent with other results, we find that trade in intermediates has been the main driver of the
trade collapse. However we also find that different organizational modes of the supply chain entailed
different dynamic responses: related‐party trade in intermediates exhibits a faster drop followed by a
faster rebound with respect to arm’s length trade in intermediates. In other words, trade originated within
multinational groups seems to have reacted faster to the negative demand shock but has also recovered
faster in the following months than arm’s length trade. Among the alternative channels of transmission of a
demand shock to trade proposed in previous studies, the adjustment in inventories seems the most
consistent with our findings. Indeed, through an adjustment of inventories, amplified fluctuations of trade
with respect to GDP could be associated to the so‐called "bullwhip effect", i.e. a magnification of the initial
(negative) demand shock along the supply chain due to an adjustment of production and stocks to the new
expected levels of output. In this case, our finding of a better performance of related‐party trade could be
explained by a better handling of inventories within multinational groups, thanks to a more efficient and
synchronized (vs. sequential) circulation of information and the ensuing optimal management of stocks
within the boundaries of the group. We cannot exclude a role for trade credit constraints, since hierarchies
of firms may have relied on an internal capital market to soften the crunch of external financing, but that
would however explain only a faster recovery of related‐party trade and not the faster drop at the outburst
of the crisis.
Our unique dataset also allows us to provide some stylized facts on multinational business groups:
affiliation to a headquarter is a concentrated phenomenon since affiliates in France account for about 65%
of exports and 62% of imports even if they represent less than 10% of the total number of trading firms.
Moreover, the distribution of multinational business groups by size, measured by number of affiliates
worldwide, is very dispersed resembling a Pareto distribution. Larger group size is associated with a wider
extensive margin in both the number of traded products and the number of countries served.

1 Introduction
The �Great Trade Collapse� has been one of the most striking features of the recent global
�nancial crisis, with the ongoing recovery still driving a wedge between output and trade. Apart
from its magnitude, the fall in trade during the crisis has also been quite homogeneous across
all countries: more than 90% of OECD countries have exhibited simultaneously a decline in
exports and imports exceeding 10%. The fall has also been very fast, with trade virtually
grinding to a halt in the last quarter of 2008. All these �ndings have led to qualifying the drop
in trade during the crisis as �severe, sudden and synchronized�(Baldwin and Evenett, 2009). A
number of transmission mechanisms (Baldwin, 2009) have been proposed which could account
for such peculiarities, making the latest generalized trade drop quite unique among the many
episodes of trade decline after a �nancial crisis (Abiad, Misha and Topalova, 2010). Among those
mechanisms, a particular role has been attributed to the emergence of global supply chains over
the last decade, and to the di¤erent compositional e¤ects of the demand shock on trade and
GDP. A role has also been acknowledged for the credit crunch su¤ered by internationalized �rms
(Bricongne et al., 2011).
Considering the transmission mechanism of global value chains, a �rst argument is that the
magnitude of the trade drop is due to a problem of multiple accounting. In a world increasingly
characterized by vertical specialisation, i.e. with goods produced sequentially in stages across
di¤erent countries, the same component of a �nal good is exchanged (and thus recorded at gross
value as trade) several times before the �nal product reaches the consumer. As a result, for a
given reduction in income, trade should decline �not only by the value of the �nished product,
but also by the value of all the intermediate trade �ows that went into creating it� (Yi, 2009;
but also previously Bergoeing et al., 2004).
A second channel that relates the magnitude and the synchronization of the latest trade
drop to the emergence of global value chains is the inherent adjustment in inventories after
a demand shock that the existence of inter-�rm linkages implies. The wider �uctuations in
terms of trade elasticities are in this case an overreaction due to adjustments in the stocks of
intermediate inputs by �rms involved in complex supply chains (Stadtler, 2008; Escaith et al.,
2010; Freund, 2009). According to this argument known as the "bullwhip e¤ect" (Forrester,
1961), each participant to a supply chain had a greater observed variation in demand during
the crisis and the initial negative shock propagated up the value chain. The logic is as follows.
When �nal demand is subject to volatility, businesses typically face forecast errors against which
they try to shelter by building safety stocks of inventories. Upstream participants to a supply
chain face greater demand volatility than downstream ones, so the need for such stocks rises
moving up the value chain. The result is that variations in �nal demand are ampli�ed as one
moves away from the �nal customer. When applied to the current context, the foregoing logic
implies that, with falling demand, orders decreased more than proportionally because �rms were
able to draw on inventories after expectations of lower future demand. Firms involved in value
chains reduced their stocks more than proportionally while the shock propagated up the value

chain. Alessandria et al. (2011) successfully tested this argument for the US.
Exploiting transaction-level French trade data matched with ownership data for the period
2007-2009, we �rst �nd evidence of an overreaction of trade in intermediates in line with what
suggested by Alessandria et al. (2011), then we notice di¤erent dynamics of value chains ac-
cording to their organizational mode: trade of intermediates among related parties reacted with
a a faster drop at the outburst of the crisis and a faster recovery thereafter. In other words,
verticalized multinational groups were able to adjust faster to the negative demand shock. While
a role for the �nancing capabilities internal to the group cannot be excluded in softening the
�nancial constraints in times of recovery, our hypothesis is that hierarchies of �rms belonging
to the same multinational groups are better able to optimize inventories management and do
not su¤er from the informative asymmetries of buyer/supplier contracts when compared with
value chains consisting of independent parties. For example, to better manage orders along the
supply chain, Wal-Mart stores frequently transmit sales data to the headquarters, which then
use this information to �ne tune the shipments from suppliers to stores through the distribution
center. Clearly, the successful implementation of this sort of demand-driven strategies requires
a degree of trustful collaboration and information sharing that is much easier to attain among
related than independent parties.
The paper is organized as follows. In Section 2 we introduce our newly assembled dataset
that allows us to capture inter-�rm proprietary linkages and we provide some descriptives of the
peculiarities of value chains organized by multinational business groups. In Section 3 we exploit
our dataset to draw some stylized facts that relate the trade collapse to the organizational modes
of value chains. In Section 4 we discuss the results of our empirical investigation. In Section 5
we present some concluding remarks.
2 The dataset: trade and inter-�rm linkages
Our transaction-level dataset has been built exploiting three di¤erent available sources: French
customs�monthly data for exports and imports by �rms; Orbis by Bureau Van Dijk for annual
balance sheet data; and the Ownership Database by Bureau Van Dijk for data on intra-group
linkages. In particular, the �rst source allowed us to collect over 62 million monthly transactions
of products classi�ed according to the HS (Harmonized System) 6-digit classi�cation with their
countries of origin and destination for the period 2007M1 to 2009M12; we therefore cover the
whole period of the trade collapse and the following recovery. The second source reports the
core and secondary economic activities of �rms involved or not in international trade, as well as
annual data on �rms�size and �nancial accounts. The third source, which is based on information
provided by company themselves or by national o¢ cial bodies when in charge, allows us to track
the proprietary network of a¢ liates belonging to the same headquarter and located worldwide.
The �nal outcome is a sample with di¤erent levels of interlocking economic disaggregation,
from consolidated multinational groups to single a¢ liates, from industries to products, which
are traded by single �rms organized as multinational groups or as independent �rms. Moreover,

a space disaggregation and a time disaggregation are present in the sample. The former enables
us to consider both the geographical dispersion of trade �ows and the locations of the property
networks of hierarchies composed by a French or a foreign headquarter and their own a¢ liates
worldwide. The disaggregation by month, on the other hand, allows us to properly split the
period of analysis following the timing of the �nancial crisis and hence its fast transmission to
�rm trading activities.
We end up with over 62 million of transactions by 167,833 exporting and/or importing
�rms located in France in the period 2007-2009 from all sector of economic activities, including
manufacturing, services and primary industries. Out of the total number of recorded �rms, only
6,760 are owned by a foreign multinational group (de�ned as a group with at least one a¢ liate
and the headquarter abroad) while 9,482 are part of a French multinational group (with the
headquarter in France and at least one a¢ liate abroad). The number of headquarters, i.e. the
number of multinational groups to which the a¢ liates belong, is 5,754 (either foreign or French),
whereas the total �gure for the worldwide a¢ liates to which French �rms can be linked (either
as headquarters or as domestic a¢ liates of French multinational groups) is about 690,500.
Thanks to the information provided by the Ownership Database, we are able to track the
complete control chains of these groups, from the bottom of the network up to the �nal ultimate
owner, considering also cross-participations and taking the majority of 50.01% as the threshold to
identify corporate control. This last threshold is already adopted as an international standard
to de�ne MNEs� activities (OECD, 2011), and by international accounting standards when
attributing control on pro�ts and hence tax liabilities across national borders1
We then de�ne a �trading �rm�as a �rm that exports and/or imports at least one product in
a month in the period of analysis, with two thresholds provided by French Customs, according to
which it is mandatory to report trading activity only when exports to a non-EU country exceed
1,000 euro for each transaction and when exports to all EU-countries exceed 150,000 euro on a
yearly basis. On the other hand, the only limitation of �rm level sources is the selectivity of the
mandatory presentation of a yearly balance sheet, which leaves out some 2,000 �rms registered
as trading from the French Customs. These �rms, however, account for only 1.20% of the total
number of trading �rms and 0.55% of trade volumes2
To better exploit the information at the product level, we have employed the correspon-
dence tables provided by the United Nations Statistics Division and EUROSTAT, to convert
the transactions of HS 6-digit products into CPA (Classi�cation of Products by Activity) cate-
gories. These are easily grouped in 4-digit NACE rev. 2 economic activities, which is the indus-
trial classi�cation we employ for �rm-level analysis, and in BEC (Broad Economic Categories)
reclassi�ed according to SNA (System of National Accounts), which distinguishes between capi-
1An advantage of this criterion is also to partition a¢ liates among groups avoiding double counting by di¤erentheadquarters. For a more complete reference on methodologies to track group control chains from a¢ liates toultimate headquarters, see Altomonte and Rungi (2011).
2The original source of Bureau Van Djik�s database for French �rms are the Tribunaux de Commerce thatare responsible to collect balance sheet data according to national legislation, according to which some smaller"sociétés de personne" and "sociétés coopératives" are exempted from the obligation of a complete balance sheet.

tal, consumption and intermediate goods, according to the main end-use of traded products. A
further classi�cation capturing the distinction between durable and non-durable goods has also
been adopted: the Main Industrial Grouping (MIG) by EUROSTAT has allowed us to reclassify
trade �ows in order to account for the di¤erent demand shocks that those two categories of
goods have su¤ered during the crisis3.
The sample covers all industries in manufacturing, services and primary sectors, as shown
in Table 1, where a matching of ownership and �rm-level trade data provides a picture of the
sectoral degree of internationalization. Firms pertaining to multinational groups, whether French
or foreign, have the lion�s share of trade, i.e. 65% of export and 62% of import �ows (Figure 1).
In the sample, there is a prevalence of service �rms, among which those involved in distribution
activities (whether wholesale or retail) account for about 56% of the total service industry (43%
of the whole sample)4. Firms involved in the distribution industry are recognized to have an
important role as intermediaries in trade (see for example Bernard et al., 2010, Ahn et al., 2011),
establishing so-called indirect modes of exporting and importing. In our sample wholesalers are
prevalently both importers and exporters and retailers are prevalently importers. Whereas the
vast majority (89%) of �rms in the sample do not belong to any group, group a¢ liation (whether
French or foreign) increases with �rm size (Figure 2).
Table 1: Sample coverage by macrosectors and ownership status, number of �rms
affiliates toFrench groups
affiliates toforeign groups
independentfirms Total
exporters andimporters only exporters only importers Total
Primary sectors 185 51 2,454 2,690 437 1,693 560 2,690
6.88% 1.90% 91.23% 100.00% 16.25% 62.94% 20.82% 100.00%
Manufacturing 2,869 2,065 31,847 36,781 18,113 10,997 7,671 36,781
% 7.80% 5,61% 86.59% 100.00% 49.25% 29.90% 20.86% 100.00%
Services 6,426 4,639 117,242 128,307 35,046 42,429 50,832 128,307
% 5.01% 3.62% 91.38% 100.00 27.31% 33.07% 39.62% 100.00%
of which
Wholesale trade
% 3.92% 4.65% 91.43% 100.00% 40.60% 25.40% 34.00% 100.00%
Retail trade 547 224 21,579 22,350 4,191 6,185 11,974 22,350
% 2.45% 1.00% 96.55% 100.00% 18.75% 27.67% 53.57% 100.00%
trading status (N. firms)
20,164 12,618 16,888 49,670
ownership status (N. firms)
1,948 2,310 45,412 49,670
In Figure 3 we group a¢ liates by headquarter and plot their distribution in terms of size,
where size is measured by number of a¢ liates. In this case, thanks to the coverage of our dataset,
we are able to consider all foreign a¢ liates worldwide of foreign groups operating in France, as
well as the total number of a¢ liates of French groups, thus drawing a more complete picture of
the network of �rms developed within multinational business groups. Recalling the de�nition
provided above, a French group is included in our dataset if it has at least an a¢ liate abroad
3MIG end-use categories are based on the NACE rev.2 classi�cation and are de�ned by the European Com-mission regulation (EC) n�656/2007 of 14 June 2007.
4According to NACE rev. 2, 2-digit industry codes, �rms involved in wholesale trade are classi�ed as NACEcode 46 and �rms involved in retail trade are classi�ed as NACE code 47.
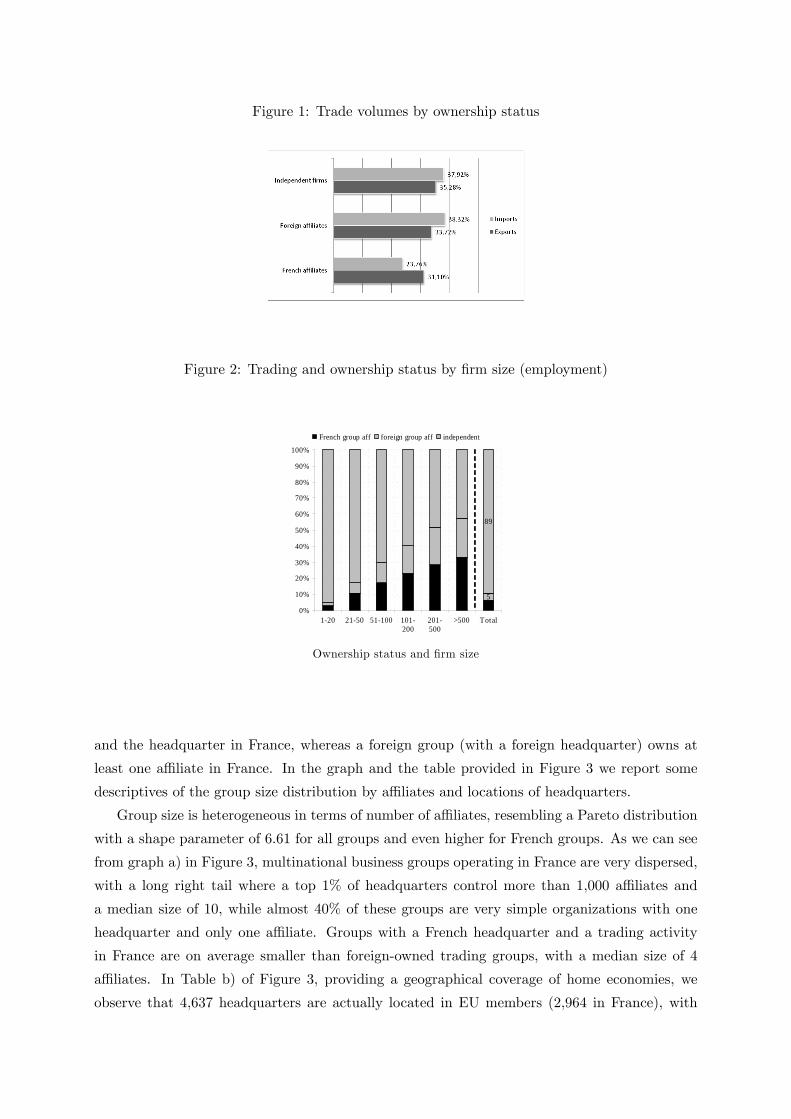
Figure 1: Trade volumes by ownership status
Figure 2: Trading and ownership status by �rm size (employment)
65
89
0%
10%
20%
30%
40%
50%
60%
70%
80%
90%
100%
120 2150 51100 101200
201500
>500 Total
French group aff foreign group aff independent
Ownership status and �rm size
and the headquarter in France, whereas a foreign group (with a foreign headquarter) owns at
least one a¢ liate in France. In the graph and the table provided in Figure 3 we report some
descriptives of the group size distribution by a¢ liates and locations of headquarters.
Group size is heterogeneous in terms of number of a¢ liates, resembling a Pareto distribution
with a shape parameter of 6.61 for all groups and even higher for French groups. As we can see
from graph a) in Figure 3, multinational business groups operating in France are very dispersed,
with a long right tail where a top 1% of headquarters control more than 1,000 a¢ liates and
a median size of 10, while almost 40% of these groups are very simple organizations with one
headquarter and only one a¢ liate. Groups with a French headquarter and a trading activity
in France are on average smaller than foreign-owned trading groups, with a median size of 4
a¢ liates. In Table b) of Figure 3, providing a geographical coverage of home economies, we
observe that 4,637 headquarters are actually located in EU members (2,964 in France), with

Figure 3: Group a¢ liation and worldwide networks, all groups vs. French groups)
a) Group size distribution by N. a¢ liates (worldwide)
Home economyN.
headquarters(%) on total
headquarters N. affiliates
avg. affiliatesper
headquarterMedian N.
affiliates
EU27 4,637 80.59% 429,760 93 2
Of which France (2,964) (51.51%) (144,050) (49) (4)
Rest of Europe 350 6.08% 46,239 132 13
NAFTA 638 11.09% 140,521 220 14
Of which United States (599) (10.41%) (135,881) 226 (15)
BRIC 31 0.54% 5,880 190 10
ASEAN 9 0.16% 5,122 569 39
Rest of Asia 154 2.68% 49,244 319 13
Of which Japan (138) (2.40%) (40,690) (295) (13)
Africa 10 0.17% 2,446 245 19
Middle East 44 0.76% 7,149 162 9
South America 8 0.14% 1,305 163 8
Oceania 23 0.40% 4,611 200 16
Total 5,754 690,501 120 10
Pareto kparameter 6.61
for French groups (9.36)
b) Group home economies, average size and dispersion
a signi�cant share in the United States, the rest of Europe and Japan. Considering the whole
network to which a¢ liates in France can be connected through proprietary linkages, we have a
total of 690,501 co-a¢ liates worldwide. In the fourth column of Table b) in Figure 3 we collect
them by home economy of the headquarter and we calculate average and median size for some
countries/regions. Here we note how on average groups originated in the rest of Asia (mainly
Japan, Korea and Taiwan) are usually very much concentrated in a¢ liates, followed at a distance
by few African groups involved in extractive activities and US groups. Brazil, Russia, India and
China (BRIC) altogether report only 31 multinational business groups with trading activity in
France.and almost two thirds of them (19) are based in India.

3 Global Value Chains, Organizational Modes and Trade Col-
lapse
3.1 The Great Trade Collapse in France
By now it has been acknowledged that the origin of the great trade collapse mostly lies in a
huge demand shock (Baldwin and Taglioni, 2009). Commodity prices tumbled when the price
bubble burst in mid 2008 and continued to follow world demand in its downward spiral. The
price movements and diminished demand sent the value and volume of commodities trade diving.
The production and exports of manufacturing collapsed as the Lehman�s induced shock-and-awe
caused consumers and �rms to wait and see. Private demand for all sorts of �postponeables�
crashed. The large observed drop in trade-to-GDP ratio can be ascribed to the ensuing com-
positional e¤ect as postponeable products represent a larger share in trade than in GDP and
global supply chains may have played a role in synchronizing the demand shock to GDP and
the demand shock to trade.
According to the �nding by Alessandria et al. (2011), supply chains shaped the response to
demand shock through an adjustment in inventories by single �rms involved in complex buyer-
supplier relationships. The shape would show a "bullwhip e¤ect" (a V-shape, here �rst dropping
and then rebounding after a negative shock), explained by the reduction of stocks in times of
crisis in order to adjust for new expectations about future demand. Forward and backward
linkages within a supply chain and uncertainty about the real dimension of the demand shock
would allow for its ampli�ed transmission up the chain because each participant �rm has a greater
observed variation in demand for its production of (intermediate) goods. The bullwhip e¤ect
after a negative demand shock is depicted in Figure 4, where a simple value chain, composed by
one retailer and two manufacturers, adjusts its orders exploiting previously stocked inventories
as a bu¤er.
Figure 4: A bullwhip e¤ect after a negative demand shock
Once looking at our transaction-level data, we have a �rst con�rmation of the posponement

story (Figure 5 and Figure 6), where we plot growth rates calculated on a year-on-year basis
from January 2007 to December 2009, with trends reported as moving averages of two lagged
periods. A generalized drop of total trade �ows is observed from September 2008, while an
overall reversal begins from June 2009.
In an e¤ort to capture compositional e¤ects, we �rst show in Figure 5 an aggregation by three
broad categories of products (consumption goods, intermediates and capital goods) and then, in
Figure 6, we decompose consumption goods in durable and non-durable components, always for
exports and imports5. Assuming that trade in intermediate goods and capital goods is entirely
driven by �rm-to-�rm relationships, whereas consumption goods are directed to �nal consumers
(possibly through the mediation of �rms involved in distribution activities), we observe that
the �rst two categories react much more than the latter both along the export and the import
dimensions. Indeed, while export and import growth rates of consumption register respectively
an average of -6% and -4% in the middle of the crisis, the same averages for intermediates are
-30% and -32%. On the other hand, capital goods show a di¤erent dynamics, sinking later and
having yet to invert the ensuing downward trend in December 2009 while, on the consumption
side, the durable component has hit exports harder with negative rates reaching a peak of -23%
in July 2009, when total export volumes were already recovering.
The �nal outcome on the overall change in total trade volumes is then the result of a com-
positional e¤ect, with trade in intermediates being more important (about 58% of both import
and export volumes) than trade in consumption goods (nowadays only 25% of total French
trade). Hence, the magnitude of the drop is clearly due to the exceptionally negative growth
rates of both intermediates and capital goods, which are originated by the emergence of global
value chains and have a higher weight on the overall export and import performance. Firms
facing declining pro�ts and uncertain demand have reduced their investment in capital goods
and their acquisition of inputs, i.e. they have reduced production capacity, waiting for better
future prospects. Indeed, at this stage of the analysis we could already dismiss the hypothesis of
a multiple accounting e¤ect as proposed by Yi (2009), since if the magnitude of the drop would
be due to the same intermediate component crossing national borders several times, also growth
rates of all �nal goods should re�ect this e¤ect, without regard to the durability of consumption,
once the intermediate component is transferred to their gross value.
In the analysis that follows we will try to assess the role of the di¤erent organizational modes
of a value chain during the crisis.
3.2 The role of global value chains
The emerging importance of global value chains is recognized by the increasing trade in inter-
mediate inputs that nowadays represents a share between 56% and 73% of overall trade �ows in
5Capital goods, consumption goods and intermediates are main end-user categories from BEC classi�cationof traded products reclassi�ed according to the System of National Accounts, see Table 4 in the Appendix fordetails. The Main Industrial Groupings (MIG) allow for a reclassi�cation of consumption goods among durablesand non-durables on the basis of the end-use of �nal consumer. For details, see Table 5 in the Appendix.
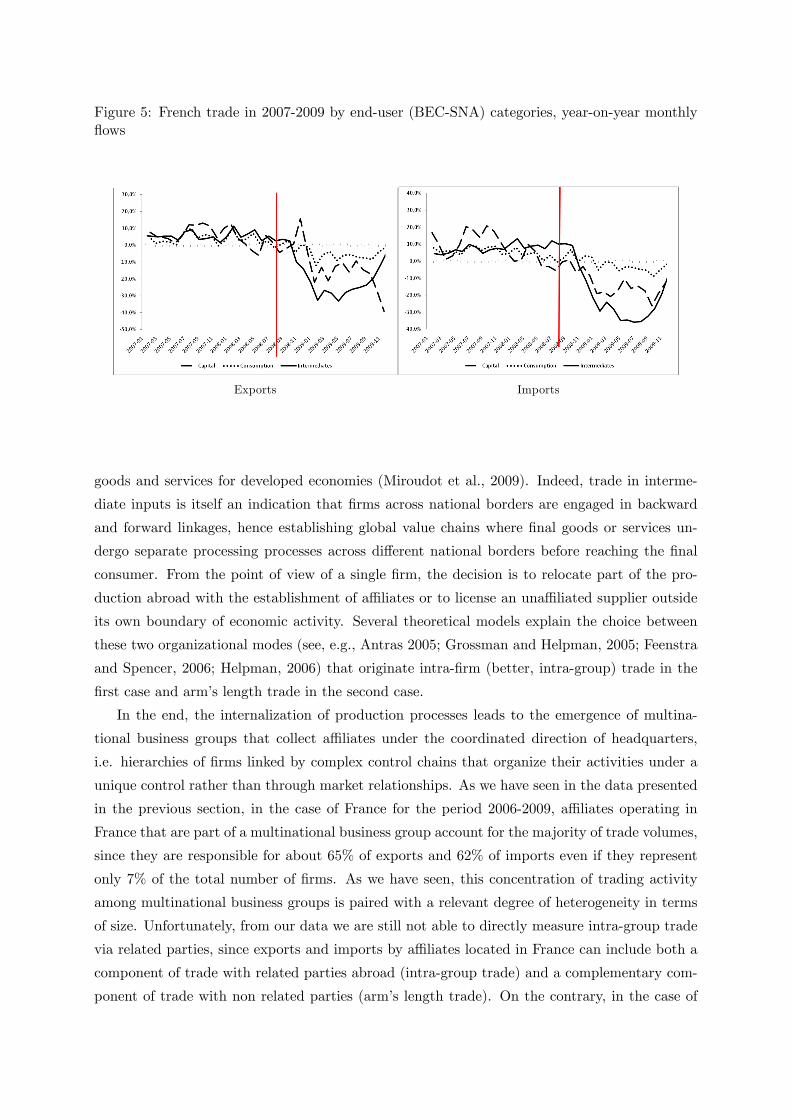
Figure 5: French trade in 2007-2009 by end-user (BEC-SNA) categories, year-on-year monthly�ows
Exports Imports
goods and services for developed economies (Miroudot et al., 2009). Indeed, trade in interme-
diate inputs is itself an indication that �rms across national borders are engaged in backward
and forward linkages, hence establishing global value chains where �nal goods or services un-
dergo separate processing processes across di¤erent national borders before reaching the �nal
consumer. From the point of view of a single �rm, the decision is to relocate part of the pro-
duction abroad with the establishment of a¢ liates or to license an una¢ liated supplier outside
its own boundary of economic activity. Several theoretical models explain the choice between
these two organizational modes (see, e.g., Antras 2005; Grossman and Helpman, 2005; Feenstra
and Spencer, 2006; Helpman, 2006) that originate intra-�rm (better, intra-group) trade in the
�rst case and arm�s length trade in the second case.
In the end, the internalization of production processes leads to the emergence of multina-
tional business groups that collect a¢ liates under the coordinated direction of headquarters,
i.e. hierarchies of �rms linked by complex control chains that organize their activities under a
unique control rather than through market relationships. As we have seen in the data presented
in the previous section, in the case of France for the period 2006-2009, a¢ liates operating in
France that are part of a multinational business group account for the majority of trade volumes,
since they are responsible for about 65% of exports and 62% of imports even if they represent
only 7% of the total number of �rms. As we have seen, this concentration of trading activity
among multinational business groups is paired with a relevant degree of heterogeneity in terms
of size. Unfortunately, from our data we are still not able to directly measure intra-group trade
via related parties, since exports and imports by a¢ liates located in France can include both a
component of trade with related parties abroad (intra-group trade) and a complementary com-
ponent of trade with non related parties (arm�s length trade). On the contrary, in the case of

Figure 6: French trade in 2007-2009, durable vs non durable consumption, year-on-year monthly�ows
trading activity by French non-a¢ liates we can be sure that international trade is exclusively at
arm�s length.
To solve this problem we are able to proxy intra-group trade by building on the �ndings
of Bas and Carluccio (2010), showing that 88% of trade by a¢ liates in France in a certain
destination/origin is made either following a "pure outsourcing" (arm�s length in our words)
strategy or a "pure o¤shoring" (intra-group) strategy, with a mere 12% of cases following a
mixed (outsourcing and o¤shoring) strategy.6
Henceforth, we will assume that trade occurs within the boundary of the business group
when transactions undertaken by French a¢ liates in a given partner country �nd in the same
country a corresponding subsidiary that belongs to the same multinational business group. While
allowing us to bypass the lack of related-party data, such a proxing assumption could still bias our
measure of intra-group trade since it might include a non-observed share of arm�s length trade,
due to the mixed strategy of outsourcing and o¤shoring. This can be considered an acceptable
bias if one is willing to believe, as we do, that the latter is not correlated with any speci�c
characteristic of the sample �rms. On the other hand we have no doubt that, if transactions are
undertaken by independent �rms, or if they are not directed towards a country in which there
are co-a¢ liates, those transactions are exclusively at arm�s length, as they fall by construction
outside the boundaries of the multinational business group. Following our approximation we
can then estimate a total of 48% of exports and 46% of imports in 2007 being undertaken as
intra-group trade.
To validate our measure, we can rely on a number of references against which compare our
proxy of French trade among related parties. In 1999, the �Enquête sur les échanges intra-
groupe�, a survey on �rms representing 55% of French imports and 61% of French exports,
6 In the international trade and the business studies literatures the term o¤shoring is used sometimes indi¤er-ently to de�ne either a general relocation of activities abroad (including both intra-group and arm�s length trade)or more speci�cally activities that are internalized by the �rm (only intra-group). Bas and Carluccio (2010) preferto use the term (pure) o¤shoring for trade originated by vertical integration only, hence intra-group trade.

estimated that 32% of transactions (not trade volumes) were among related parties. Among these
93% were by �rms located in developed countries (mainly EU and US). Given the spectacular
increase of outsourcing/o¤shoring decisions over the last decade, our estimate of 48% does not
seem inconsistent with these numbers. More interestingly, a partial direct validation is possible
considering bilateral trade between France and US. Indeed, according to the Related Party
Database by US Census Bureau (as reported by Lanz and Miroudot, 2011), 55.9% of imports
from France in 2009 are originated by intra-group trade, a �gure not very distant from the
61.9% we �nd in our dataset in the same year (exports from France to US); in this case, the
overestimation would be 10.7%, slightly less than what reported by Carluccio and Bas (2010)
as a mixed strategy. Furthermore, using Census Bureau data as a cross-country reference, the
amount of intra-group trade in the US (46.8% of exports) is very similar to our estimation for
France (48%)
Figure 7: Organizational modes and trade collapse in 2007-2009, monthly growth rates year-on-year basis
04
0%
20%
20%
60%
40%
60%
%
4020 10 0 10month
arm's length intragroup
Exports
04
0%
20%
20%
40%
60%
60%
gro
wth
rate
(%
)
4020 10 0 10month
arm's length intragroup
Imports
a) Exports and imports of intermediate goods
60
40
20
020
4060
%
20 10 0 10 20month
arm's length intrafirm
Exports
60
40
20
020
4060
20 10 0 10 20month
arm's length intrafirm
Imports
b) Exports and Imports of capital goods
20%
10%
0 %
10%
20%
40%
40%
60%
60%
%
20 10 0 10 20month
arm's length intrafirm
Exports
302
0%1
0%0%
10%
20%
60%
40%
40%
60%
%
20 15010 10month
arm's length intrafirm
Imports
c) Exports and imports of consumption goods
40%
20%
0%20
%6
0%60
%40
%%
20 150 1010month
arm's length intrafirm
Exports
40%
0%2
0%20
%40
%60
%60
%%
20 150 1010month
arm's length intrafirm
Imports
d) Total exports and imports

In Figure 7 we therefore report monthly growth rates of trade volumes distinguishing between
end-user categories (consumption goods, capital goods and intermediates) as in Figure 5, but
now taking into account whether transactions are intra-group or arm�s length, as proxied by our
methodology. Consistent with our prior, in both graphs of Figure 7 trade originated by vertical
integration (i.e. intra-group, graph a) in the case of intermediates and graph d) in the case of
total trade) drops faster at the outburst of the crisis but rebounds also faster once the recovery
begins, when rates have become positive again at the end of 2009, with values well above 10%; on
the contrary, in the same period arm�s length growth rates show still a consistent decline: -11%
for export of intermediates and -17% for import of intermediates. The organizational modes of
global value chains thus seem to show a di¤erent dynamics that was concealed when looking
at more aggregate data. Total trade �ows for both imports and exports are clearly driven by
the trend in intermediates (graph a of Figure 7), thus con�rming the compositional e¤ect of the
trade collapse induced by the creation of complex supply chains and the fact that intermediates
account for about 60% of total volumes. Also, the faster drop and faster rebound of intra-group
trade is determined by the sole trade in intermediates, since in the case of consumption and
capital goods such a di¤erent trend is not observed.
In the econometric analysis of Section 4 we will test whether the di¤erent behavior of multi-
national groups is con�rmed once looking at disaggregated data and controlling for several
compositional e¤ects.
3.3 The geography of the trade collapse
In the remaining of the Section we verify instead whether geography matters for the dynamics
of trade �ows during the crisis. In Figure 8, we provide a geographical dimension of the organi-
zational modes before and after September 2008, showing the heterogeneity of intra-group and
arm�s length growth by key partner countries/areas. In Figures 9 and 10 we draw two maps
identifying only the performance after the beginning of the drop. The indicator we adopt here
is an integration index that considers both imports and exports originated by respectively arm�s
length and intra-�rm trade averaging them from 2007M9 to 2009M12.7
7Our vertical integration indices are given by (exportsijkt + importsijkt) = (exportsijt + importsijt), where i isthe home country, j is the partner country, k is either arm�s length trade or intra-�rm trade to/from the partnercountry and t is time. At the denominator we have the sum of total imports and exports between home i andpartner j in the same period. This indicator, proposed in WTO (2008) to measure the degree of participation tovalue chains, can virtually range from [0; 1], from economies that are completely closed to o¤shoring/outsourcingactivities to economies that rely exclusively to value chains.

Figure 8: Organizational modes and trade collapse, monthly growth rates year-on-year basis,2007-2009
precrisis postcrisis precrisis postcrisisOECD 4.08 16.54 5.73 16.16emerging economies 7.78 11.77 9.57 13.34EU27 6.05 18.29 7.25 15.15 EU15 6.19 16.61 2.68 16.99 New EU members 5.9 20.25 12.98 12.83NAFTA 2.8 13.17 5.46 13.20 United States 0.12 7.00 1.37 11.98 Canada 6.53 20.06 6.78 0.83BRIC 15.11 12.20 17.4 24.65 China 13.34 0.09 11.31 5.67 Brazil 16.23 17.94 14.53 25.25 India 14.49 13.58 23.5 26.50 Russia 16.35 17.38 20.26 41.17ASEAN 0.33 11.34 27.9 8.70Africa 8.81 2.83 10.85 6.64Middle East 9.53 6.58 2.03 3.41South America 2.88 4.07 3.89 15.21
arm's length intrafirm
In contrast with the �nding of other authors (Kaplinsky and Farooki , 2010; Cattaneo,
Gere¢ and Staritz, 2010), we do not observe in our case that trade originated by value chains
shifted substantially after the crisis towards emerging economies. Rather, quite the opposite,
the integration of the so-called BRICs (Brazil, Russia, India and China) seems to take place well
before the crisis, while it stops afterwards with negative growth rates. A notable exception is
however China, where we observe that even during the crisis arm�s length trade was not disrupted
(+0.1% ), and intra-group trade fell considerably less than in the case of other French emerging
partners (with the exception of some African countries that instead have registered positive
growth rates for the whole period).
Vertical integration (intra-group) has on average fallen from September 2008 to December
2009 for both OECD High Income Countries and Emerging Economies, with a slightly di¤erent
dynamics at the beginning of 2009, when recovery begun a quarter earlier for intermediates
exported in emerging economies, until the end of the same year, when growth rates became
positive again. In absolute terms, trade is more substantial in OECD countries (74.8% of export
values and 74.6% of import values in 2007)8. Among developed partners, French-based value
chains with the European Union were severely hit both in the case of historical EU-15 and in
the case of New EU Members, whereas intra-group trade with Canada was more resilient. With
the US the negative trend begun well before the crisis.
Summing up, in line with the worldwide synchronized nature of the demand shock, it seems
we can rule out a speci�c role of geography in a¤ecting the dynamics of the trade �ows di¤erently
across organizational modes. In any case, we will also control for the latter possible compositional
e¤ect in our econometric speci�cation, to which we now turn.
8According to an OECD de�nition, its members can be distinguished between High-Income countries andMiddle-Income countries. This latter category includes only Turkey, Chile and Mexico and we exclude it fromour variable. The de�nition of emerging economies is more controversial. Here we have adopted the one providedby Dow Jones, the American �nancial information �rm, that lists 35 countries.

Figure 9: Arm�s length trade and trade collapse, average growth rates year-on-year basis
Figure 10: Intra-�rm trade and trade collapse, average growth rates year-on-year basis
4 Empirical strategy and results
In this section we test whether trade performance due to participation to value chains has been
responsible for the magnitude of the drop, and if the two alternative modes of organization
of inter-�rm linkages have shown a di¤erent resilience during the crisis, for both imports and
exports.
Our estimation strategy takes as dependent variable gisct, the midpoint growth rate of trade
�ows, speci�c for product s traded by �rm i in country c of origin/destination and month t: The
mid-point growth rate, already employed by Bricongne et al (2011) for the French case during
the crisis, correctly approximates the observed aggregate growth rates of exports but, unlike
other methods, it controls for composition e¤ects avoiding an attrition bias caused by the entry

and exit of sample observations and, also, for monthly seasonality9.
The latter is regressed against a number of relevant controls via the following speci�cation:
gisct = �0 + �1� + �2� � recovery + j + "isct (1)
where
� = �1intermisct + �2intragroupisct + �3(interm � intragroup)isct +OECDisct (2)
Among the set of regressors in �, the term intermisct stands for a binary variable that equals
1 if the traded product is an intermediate good and 0 otherwise, while intragroupisct is another
binary variable that equals 1 if the �ow is traded intra-group and 0 otherwise, following our
approximation of intra-group vs. arm�s length trade introduced in the previous section. The
interaction between the intermediate and the intra-group dummies (interm � intragroup)isct isto be interpreted as the subset of trade �ows that involve the exchange of intermediate goods
between a¢ liates belonging to the same headquarter, i.e. a global value chain represented by
a verticalized multinational group with backward and/or forward linkages. The binary variable
OECDisct allows us to control for a geographic compositional e¤ect induced by possibly di¤erent
demand shocks registered in OECD countries after the �nancial crisis.
Taking into account the period from 2008M09 to 2009M12, that is from the beginning of
the trade collapse until the last available month of our data, we di¤erentiate the impact of our
set of regressors � in two subperiods through the dummy recovery, that is before and after
2009M06. This is the month when overall trade �ows began their recovery in France after a
negative peak. More in general, this is the month in which conventionally the world economy
starts to experience a generalized resumption of world trade.
Finally, compositional e¤ects potentially induced by a change in the sectoral pattern of trade
�ows are captured by a set of NACE 4-digit industry �xed-e¤ects ( k).
In Tables 2 and 3 we report the results for French exports and imports growth rates, re-
spectively. In the �rst column of both Tables 2 and 3 we simply con�rm that, once considering
only the end-use of products and controlling for sector compositional e¤ects, the magnitude of
the drop is particularly due to trade in intermediates (inputs), namely to products that are
exchanged by �rms that establish backward and forward linkages either by proprietary or by
buyer/supplier relationships, as observed in Figure 5. In particular, while we have an average
negative growth rate for the whole period of, respectively, -8.8% and -6.1% for exports and
imports (the coe¢ cient of the constant term), a further negative and signi�cant e¤ect is to be
added for trade in intermediates. A bullwhip-shape due to trade in intermediates is however
9Applying the mid-point growth rate to our speci�c case we would have: gisct =�xisct � xisc(t�12)
�=�0:5 �
�xisct + xisc(t�12)
��:
The rate is bounded in the range [�2;+2] with the extremes of the interval indicating the emergence (+2) orthe disappearance (�2) of �ows in month t with respect of the same month of the previous year t� 12:For otherapplications of this methodology, see also Haltiwanger (1992) and Buono et al. (2008).

detected from the estimation in the second column: at a negative premium for intermediates at
the outburst of the crisis corresponds a positive premium once the recovery begins. Both the
magnitude of the drop and the pattern of recovery are to be attributed to trade in intermediate
goods that constitute already almost 60% of �ows as we already know from aggregated data.
In the third column we begin to control for the organizational mode of the value chain, that
is if products are exchanged by �rms on the basis of proprietary or buyer/supplier relationships,
whatever their end use. In this case, on average over the entire period, intra-group trade shows
no signi�cant di¤erence with respect to arm�s length trade in the case of exports, and a better
performance in the case of imports. This shows that, at least on the import side, trade �ows
within multinational groups (whatever their end use) during the considered period have been in
general more resilient than those undertaken by independent �rms.
In the fourth column we start controlling for the interaction between the organizational
mode of the value chain and the end use of traded products. For exports �ows, the positive
and signi�cant coe¢ cient on the interaction implies that intra-group trade on the average of
the entire period has grown more in intermediates than in other end use categories. In the case
of imports, the opposite e¤ect holds. However, as observed in Figure 7, these e¤ects are the
outcome of two very di¤erent dynamics over time, with trade in intermediates �rst dropping and
then recovering. Hence, it could well be the case that, in the case of exports, intra-group trade
in intermediates has recovered more than it originally dropped during the crisis, while such a
recovery is not yet fully undertaken in the case of imports. Our prior is instead more general, as
it only postulates that intra-group trade in intermediates recovered more quickly (or fell faster)
than all the other forms of trade (by end use or organizational form).
To test for the latter, in the �fth column of both Tables 2 and 3 we then split the e¤ect
between the crisis and the recovery period, in order to test whether there is such a di¤erence
in dynamics. The sign of the dummy identifying the recovery period shows that exports indeed
performed better after the through of the crisis, independently on end uses or organizational
modes. Moreover, the positive and signi�cant coe¢ cient on the triple interaction term implies
that, during the recovery, exports of intermediates have performed better when taking place
within multinational groups than at arm�s length, thus con�rming our hypothesis. Along the
same lines, on average imports do not show any di¤erential performance during the recovery
across end uses or organizational modes, again consistent with the idea that the overall growth
of intra-group trade in intermediates has not been such to absorb the e¤ect of the collapse.
However, once again, the positive and signi�cant coe¢ cient on the triple interaction term implies
that during the recovery imports of intermediates have in any case performed relatively better
when taking place within multinational groups than at arm�s length, in line with our assumption.
In the sixth column, we �nally check whether results are robust to a geographic compositional
e¤ect induced by the di¤erent (stronger) demand shocks coming from OECD countries. In
general, we observe a negative premium for transactions that involve a developed partner at
the beginning of the crisis. However in the second period of our analysis there seems to be no
di¤erence in trends of exports between developed and developing partners, while imports from

OECD countries recovered strongly. This result is in contrast with what suggested by Kaplinsky
and Farooki (2010) and Cattaneo, Gere¢ and Staritz (2010), according to whom the trade drop
entailed also a substantial shift of value chains towards emerging economies. More importantly
for our goals, our previous results on the triple interaction term are con�rmed.
To sum up, for both exports and imports of intermediates, we �nd that trade �ows have
grown more when undertaken intra-group vs. arm�s length, as soon as total trade begun its
recovery. This result is consistent with the �ndings by Alessandria et al. (2011) for the US,
attributing in general the faster drop and rebound of intermediates to adjustment in inventories.
More speci�cally, we show that the overreaction at the beginning of the period, then compensated
by a faster recovery in the aftermath, is particularly pronounced for verticalized multinational
groups vs. arms� length trade. This shows a di¤erent and faster response of value chains
organized by multinational groups. Our explanatory hypothesis is that the internalization of
activities within the boundary of a group allows for a better management of information �ows
coming from the bottom of the value chain so that production and inventories can be more
swiftly adjusted to demand shocks.
Table 2: Exports and global value chains
Dependent variable:midpoint growth rates
.009*** .013*** .009*** .012*** .012*** .012***(.001) (.002) (.001) (.001) (.002) (.002)
.001 .007*** .010*** .012***(.001) (.001) (.002) (.002)
.013*** .008** .008**(.002) (.003) (.003)
.022***(.002)
.002 .006*** .008***(.001) (.002) (.002)
.010*** .000 .000(.002) (.002) (.002)
.038*** .038***(.003) (.003)
.048*** .049***(.005) (.005)
.003(.002)
.088*** .088*** .088*** .087*** .089*** .073***(.001) (.001) (.001) (.001) (.001) (.002)
Industry fixed effects Yes Yes Yes Yes Yes Yes
Observations 11,985,900 11,985,900 11,985,900 11,985,900 11,985,900 11,985,900
Adjusted Rsquared .0010 .0010 .0010 .0010 .0010 .0010
OLS(II) OLS (VI)
Constant
intermediates
intragroup
intermediates*intragroup
intermediates*recovery
intragroup*recovery
intermediates*intragroup*recovery
recovery
OECD
OECD*recovery
OLS (I) OLS (III) OLS (IV) OLS (V)
*, **, *** stand resp ectively for sign i�cance at 90% , 95% and 99% . Robust standard errors in
parenthesis.

Table 3: Imports and global value chains
Dependent variable:midpoint growth rates
.006*** .013*** .008*** .001 .006*** .004**(.001) (.001) (.001) (.001) (.002) (.001)
.026*** .046*** .064*** .074***(.001) (.002) (.002) (.002)
.032*** .045** .051**(.002) (.003) (.003)
.083***(.002)
.007*** .001 .023***(.003) (.001) (.002)
.015*** .012*** .007***(.002) (.002) (.002)
.043*** .047***(.004) (.003)
.029*** .032***(.005) (.005)
.031***(.002)
.061*** .058*** .066*** .069*** .069*** .010***(.001) (.001) (.001) (.001) (.001) (.001)
Industry fixed effects Yes Yes Yes Yes Yes Yes
Observations 15,432,528 15,432,528 15,432,528 15,432,528 15,432,528 15,432,528
Adjusted Rsquared .0009 .0009 .0009 .0009 .0010 .0012
intermediates*recovery
intragroup*recovery
intermediates*intragroup*recovery
OECD*recovery
Constant
OLS (VI)OLS (III) OLS (IV) OLS (V)OLS (I) OLS(II)
intermediates
intragroup
intermediates*intragroup
OECD
recovery
*, **, *** stand resp ectively for sign i�cance at 90% , 95% and 99% . Robust standard errors in parenthesis.
5 Conclusions
In this paper we have analyzed the trade performance of global value chains during the Great
Trade Collapse. Exploiting a unique transaction-level dataset matching French monthly trade
data with ownership information for the period 2007-2009, we have been able to distinguish the
trade performance of two alternative organizational modes of the value chain: internalization
of activities by multinational business groups, entailing trade among related parties, and the
establishment of buyer/supplier contracts, entailing arm�s length trade.
We have �rst provided some stylized facts on multinational business groups: a¢ liation to a
headquarter is a concentrated phenomenon since a¢ liates in France account for about 65% of
exports and 62% of imports even if they represent less than 10% of the total number of trading
�rms. Moreover, the distribution of multinational business groups by size, measured by number
of a¢ liates worldwide, is very dispersed resembling a Pareto distribution.
Second, in order to assess the role of global value chains at the outburst of the crisis, we
have econometrically tested the di¤erential performance of trade in intermediates. This has
been shown to be the main determinant of the magnitude of the collapse. We have also found
that intra-group trade in intermediates exhibited speci�c dynamics with a faster drop followed

by a faster rebound than trade in other end categories. In other words, trade originated within
hierarchies of �rms reacted faster to the negative demand shock but also recovered faster in the
following months than arm�s length trade. Among the alternative channels of transmission of the
demand shock to trade performance proposed in previous studies, the adjustment in inventories
seems the most consistent with these �ndings. As in the case of the US studied by Alessandria
et al. (2011) for the general case of intermediates, ampli�ed �uctuations of trade with respect to
GDP could be associated to the so-called "bullwhip e¤ect" (Forrester, 1961; Stadtler, 2008), that
is, a magni�cation of the initial demand shock along the supply chain due to an adjustment of
production and stocks to new expectations. In this case, also the �nding of a better performance
of intra-group trade could be explained by better handling of inventories thanks to the ability
to react faster and optimize management of stocks within the boundaries of the group.
At this stage of the analysis, we cannot exclude also a role for trade credit constraints, since
hierarchies of �rms may have relied on an internal capital market that softened the crunch of
external sources of �nancing. This would, however, explain a faster recovery but not a faster
drop. Hence, while an interaction of both determinants (optimization of inventories management
and softer �nancial constraints) may have been relevant as suggested for example by Escaith
et al. (2010), softer �nancial constraints alone would not be able to account for the observed
patterns of the data.
ReferencesAbiad A., P. Mishra, and Topalova P. (2011). How Does Trade Evolve in the Aftermath of Financial Crises?,
IMF Working Paper WP113
Ahn J., Khandelwal A. K. and Wei, S.-J. (2011). The role of intermediaries in facilitating trade,Journal of
International Economics 84(1): 73�85.
Alessandria G.and Kaboski J.P. and Midrigan V. (2011) US Trade and Inventory Dynamics, American
Economic Review, American Economic Association, vol. 101(3), pages 303-07, May.
Altomonte C. and A. Rungi (2011) Organizational Complexity of Multinational Groups and Productivity in
the European Union, mimeo
Antras P. (2005) Property Rights and the International Organization of Production, American Economic
Review, Papers and Proceedings 95(2): 25-32
Baldwin R. (2009) Introduction: The Great Trade Collapse: What caused it and what does it mean?, in "The
great trade collapse: Causes, consequences and prospects", VoxEU.org ebook, Richard Baldwin (ed), November.
Baldwin R. and S. Evenett (2009) Introduction and Recommendations for the G20 in "The collapse of global
trade, murky protectionism, and the crisis. Recommendations for the G20" Baldwin and Evenett (eds.), CEPR
Baldwin R. and D. Taglioni (2009) The great trade collapse and trade imbalances, in "The great trade
collapse: Causes, consequences and prospects", VoxEU.org ebook, Richard Baldwin (ed), November.
Bas M. and J. Carluccio (2009) Wage Bargaining and the Boundaries of the Multinational Firm, mimeo
Bergoeing R., T. J. Kehoe, V. Strauss-Kahn and K. M. Yi (2004) Why Is Manufacturing Trade Rising Even
as Manufacturing Output is Falling?, American Economic Review, American Economic Association, vol. 94(2),
pages 134-138, May.
Bernard B. A. and Grazzi M. and Tomasi C. (2010). Intermediaries in International Trade: direct versus
indirect modes of export, mimeo
Borchert I., and A. Mattoo (2009) The Crisis-Resilience of Services Trade, World Bank Policy Research
Working Paper 4917. World Bank, Washington, DC.
Bricongne, J. C., Fontagné L., Gaulier G., Taglioni D. and Vicard V. (2011). "Firms and the global crisis:
French exports in the turmoil," Journal of International Economics, doi:10.1016/j.jinteco.2011.07.002.
Buono, I., H. Fadinger and S. Berger (2008). The micro dynamics of exporting: Evidence from French �rms,
MPRA Paper 12940, University Library of Munich, Germany.
Cattaneo O., G. Gere¢ and C. Staritz (2010). Global Value Chains in a postcrisis world (Edited by).
IBRD/World Bank
Davis S. J. and J. C. Haltiwanger (1992) Gross job creation, gross job destruction, and employment reallo-
cation, The Quarterly Journal of Economics 107 (3) (1992), pp. 819-863
Dunning J. H. and Lundan S. M. (2008). Multinational Enterprises in the Global Economy. (Edward Elgar
Publishing)
Escaith H., N. Lindenberg and S. Miroudot (2010) International Supply Chains and Trade Elasticity In
Times of Global Crisis, World Trade Organization (Economic Research and Statistics Division) Sta¤ Working
Paper ERSD-2010-08.
Feenstra R. C. and B. Spencer (2005) Contractual versus Generic Outsourcing: the Role of Proximity, NBER
Working Paper 11885

Forrester, J. (1961). Industrial Dynamics. (Pegasus Communications)
Freund, C. (2009) The Trade Response to Global Downturns. Historical Evidence, World Bank Working
Papers 5015, August 2009.
Grossman G. M. and E. Helpman (2005) Outsourcing in a Global Economy, Review of Economic Studies
72(1): 135-159
Helpman E. (2006) Trade, FDI, and the Organization of Firms, Journal of Economic Literature 44(4):
580-630
Johnson R. and G. Noguera (2009) Accounting for Intermediates: Production Sharing and Trade in Value
Added, Working Paper, Dartmouth College and University of California, Berkeley
Kaplinsky, R., and M. Farooki (2010) What Are the Implications for Global Value Chains When the Market
Shifts from the North to the South?, Policy Research Working Paper 5205, World Bank.
Koopman R., R. Wang and S. J. Wei (2008) How Much of Chinese Exports Is Really Made in China?
Assessing Domestic Value Added When Processing Trade Is Pervasive, NBER Working paper No. 14109, June
Lanz, R. and S. Miroudot (2011) Intra-Firm Trade: Patterns, Determinants and Policy Implications, OECD
Trade Policy Working Papers, No. 114
Miroudot S., R. Lanz and A. Ragoussis (2009) Trade in Intermediate Goods and Services, OECD Trade
Policy Working Papers 93, OECD Publishing
OECD (2011). OECD Guidelines for Multinational Enterprises, OECD Publishing
Stadtler H. (2008) Supply Chain Management - An Overview, in "Supply Chain Management and Advanced
Planning" (Stadtler H. and Kigler C. eds.), Springer-Verlag, 4th edition
Sturgeon, T., and G. Gere¢ (2009) Measuring Success in the Global Economy: International Trade, Industrial
Upgrading, and Business Function Outsourcing in Global Value Chains, Transnational Corporations 18 (2): 1�36
Yi, K. M. (2009) The collapse of global trade: the role of vertical specialization, in "The collapse of global
trade, murky protectionism, and the crisis. Recommendations for the G20", Baldwin and Evenett (eds). CEPR

Appendix A: End-user categories of trade �ows
Broad Economic Categories (BEC) is a reclassi�cation of traded goods according to their
main end use. It was developed by the UN Statistics Division to be matched with the System
of National Accounts. Our data, originally registered as HS (Harmonized System) 6-digit �ows,
were converted �rst by BEC categories and then grouped by basic classes of the System of
National Accounts following Table 4.
Table 4: Correspondence table, from Broad Economic Categories to the System of NationalAccounts
Basic classes System of NationalAccounts (SNA)
Broad Economic Categories (BEC)
41. Capital goods (exc. transport)521. Transport equipment, other, industrial112. Food and beverages, primary, mainly forhousehold consumption122. Food and beverages, processed, mainlyfor household consumption51. Transport equipment, passenger motorcars522. Transport equipment, other, nonindustrial61. Consumer goods, durable62. Consumer goods, semidurable63. Consumer goods, nondurable111. Food and beverages, primary, mainly forindustry21. Industrial supplies, primary31. Fuels and lubrificants, primary42. Capital goods, parts and accessories53. Transport equipment, parts andaccessories121. Food and beverages, processed, mainlyfor industry22. Industrial supplies, processed322. Fuels and lubrificants, processed, other
Capital goods
Consumption goods
Intermediate goods: Primary
Intermediate goods: Parts andcomponents
Intermediate goods: Semifinished goods
An alternative classi�cation by end-use is the Main Industrial Groupings (MIG) proposed
by Eurostat, which is based primarily on NACE rev. 2 industrial sectors and it allows to
distinguish also between durables and non-durables. Starting with HS product �ows, we �rst
converted them in NACE economic activities and then we reclassi�ed following Table 5
Table 5: Correspondence table, from NACE rev.2 to Main Industrial Groupings
Main Industrial Groupings (MIG) Nomenclature statistique des activitéséconomiques dans la Communautéeuropéenne (NACE), revision 2
Capital goods 251. 252. 253. 254. 262. 263. 265. 266. 28. 29. 301. 302. 303. 304. 325. 33.
Consumer durable goods 264. 267. 275. 309. 31. 321. 322.Consumer nondurable goods 101. 102. 103. 104. 105. 107. 108.
11. 12. 139. 14. 15. 18. 204. 21. 323. 324. 329.
Intermediate goods 07. 08. 09. 106. 109. 131. 132. 133. 16. 17. 201. 202. 203. 205. 206. 22. 23. 24. 255. 256. 257. 259. 261. 268. 271. 272. 273. 274. 279.
Energy 05. 06. 19. 35. 36.