working paper - not to be cited without author...
TRANSCRIPT

The importance of product development cycle time and cost in the development of product families
MICHAEL D. JOHNSONa*and RANDOLPH E. KIRCHAIN b
aDepartment of Engineering Technology and Industrial Distribution, Texas A&M University, College Station, USA; bDepartment of Materials Science & Engineering and Engineering Systems Division, Massachusetts Institute of Technology, Cambridge, USA
In today’s technologically driven world, the importance of innovation and product development is growing. Firms must develop innovative products faster and more efficiently. This has increased the importance of being able to quantify product development performance. This work attempts to quantify development effort and lead-time based on product and project characteristics. The effects of product platforming on development effort and lead-time are analyzed.
To assess the impact of product platforming on development effort and lead-time, models are presented which estimate these quantities based on product and project characteristics. Development cost is then forecast using direct engineering effort with indirect cost. These costs are then compared with fabrication and assembly costs. The effects of product platforming on development lead-time and cost are analyzed. Two case studies are examined: two instrument panel beam families and an automotive body-in-white family.
Results indicate that development costs, while generally a small percentage of total costs, can have significant effects on technology choice and lead to substantial cost savings in product families. Part size and complexity are shown to be the have the most significant influence over development effort. The engineering required for assembly and fabrication are shown to dominate total development costs.
Keywords: product families; interviews; automotive engineering; cost estimation
*Corresponding author. Email: [email protected]
Working Paper - Not to Be Cited without Author Permission
Introduction
Development is the set of activities that transform a concept for satisfying perceived
needs into a product or service that is ready for the market. Innovative firms use
development to increase demand or even create entirely new markets through novel
product design. In today’s technology driven marketplace, the importance of design and,
therefore, development seems unquestioned. This importance is further reinforced
because development not only establishes the functional performance of a product, but
also drives the economic characteristics of that product. In fact, it is widely cited, that
between 70% and 90% of total project costs are determined during the early stages of the
development process (Bhimani and Mulder 2001, Shehab and Abdalla 2001).
Furthermore, recent research has reinforced the importance of development in the context
of other available options for firm spending. Specifically, the return on research and
development spending vis a vis capital expenditure has been shown to be much more
effective at boosting operating margin, market value, and sales growth (Hsieh et al.
2003).
Nevertheless, reaping the benefits of effective development often requires a large
irrevocable investment. For some complex products, the product development process
can take years and require millions of person-hours of effort (Clark and Fujimoto 1991).
Accordingly, measures of performance of the development process, such as product
development cycle-time, also known as lead-time1, and engineering effort2 are widely
applied and tracked. While the importance of product development cycle time on product
profitability and success has been well documented (Weston and Simmons 1993, Cohen
et al. 1996, Gupta and Souder 1998), the engineering effort required for product
development has received little attention in the literature. This is true despite evidence
showing a positive correlation between engineering effort and development cycle time
(Clark et al. 1987).
1. Lead-time is the calendar time that passes from concept development to the end of pilot production. 2. Engineering effort refers to the number of engineering hours (often tracked in person-quarters or person-years) that are needed to go from concept development to the end of pilot production.
Working Paper - Not to Be Cited without Author Permission

In contrast to its impact, the cost of development is generally assumed to make up a small
portion of the total development effort cost, but this portion is rarely quantified. Recent
trends have further raised the importance of development, making the lack of information
regarding development costs increasingly unacceptable. In particular, the demands of
consumers for product variety have increased considerably in the past and are expected to
continue to do so in the future (Pine 1991, Pine 1993). These effects are magnified by
the accompanying trend toward decreasing product lifetimes (Schonberger 1987, von
Braun 1990, Pine 1993, Uzumeri and Sanderson 1995). In response, firms must develop
more and more products that stay in the marketplace for shorter and shorter time periods.
In turn, these trends put pressure on development organizations to be more nimble and
productive. The use of product platforms and product families has been proposed to help
reduce this pressure. A product platform is a set of subsystems from which derivative or
variant products can be developed and manufactured (Meyer and Lehnerd 1997). These
variant products combine both shared and unique components to perform a given
function. The product family is the group of variants that are derived from a given
platform (Gonzalez-Zugasti et al. 2000). Platforming has been shown to increase
development effort efficiency, and reduce both development time and product cost
(Ulrich 1995, Gupta and Souder 1998, Muffatto 1999, Gonzalez-Zugasti et al. 2000).
Several researchers have highlighted the importance of cost when providing product
variety (e.g., Martin and Ishii 1996, Tu et al. 2007, Zhang and Tseng 2007). However,
few quantitative analyses into the interaction between product platforming and
development effort have been performed.
The ability to assess the effects of platforming and product family decisions on product
development effort and lead-time can provide important information to decision-makers.
As an example, consider a common quandary that confronts designers: while parts
commonality can decrease part costs and/or engineering costs, it may constrain future
designs and lead to coordination problems (Collier 1981, Clark and Fujimoto 1989,
Nobelius and Sundgren 2002). Quantifying the relationship between product platforming
decisions and product development performance would allow designers and strategists to
make explicit trade-offs in the context of this and other questions that emerge due to the
tension between platforming strategy and development process efficiency.
Working Paper - Not to Be Cited without Author Permission

This work presents a process-based model of the product development process that
delivers such capability – quantifying the impact of platforming decisions. Specifically,
this model examines the impact of platforming on product development effort and lead-
time. The costs and lead-time for both standalone products and product families are
quantified for two automotive-related cases studies – alternative instrument panel
architectures and body structures. Case study results show development costs in the
context of total product family cost (including fabrication and assembly). As this paper
will demonstrate, knowledge about product development cost and lead-time can have real
impact on architectural and technology decisions. The article is organized in the
following manner. First, previous literature regarding product development lead-time
and engineering effort is summarized to provide the reader with an understanding of
previous work regarding the modeling of development performance. Second, a modeling
methodology, framework, and outcomes are detailed. Next, case studies are presented
that exercise these models. Finally, case study results and model performance are
discussed regarding applicability for general development decision-making.
Development Process Modeling
The literature dealing with the evaluation of product development is rather large, and
focuses primarily on the lead-time metric. Interestingly, several researchers have also
shown the importance of product development lead-time as it relates to project success.
This can be from the perspective of development personnel (Rosenau 1988, Rosenau
1989) or from a commercial and financial perspective (Hall and Jackson 1992,
Kalyanaram and Urban 1992, Datar et al. 1997). In response to this importance, some
major companies have even adopted time-to-market as their principal metric of product
development projects (Cohen et al. 1996).
Given the significance of development lead-time, several researchers have also examined
the project characteristics that influence product development lead-time and, from that,
deduced methods by which development lead-time could be predicted. One of the
earliest attempts to study the development process is Norden’s (1960) analysis of the
distribution of effort over a period of time for a development project. Organizational
characteristic have also been shown to dramatically affect development lead-time. An
Working Paper - Not to Be Cited without Author Permission

example is the scheduling of task overlap, increasing the number of overlapped tasks
increases iterations (Roemer et al. 2000), and increased iterations have been shown to
increase lead-time (Smith and Eppinger 1993). Griffin (1997) observed that cross-
functional teams and a formal development process reduce development cycle time. In
addition to organizational characteristics, inherent project characteristics have also been
shown to affect development lead-time. Clark and Fujimoto (Clark and Fujimoto 1989)
found that for the concept and planning phases of the automobile development process,
lead-time was dependent on product complexity (as determined by price), body
variations, and product innovativeness. Griffin’s (1993) work also found that
development lead-time was dependent on the project’s inherent complexity, the amount
of change between the current product and the previous generation, and the number of
functions providing input to the project. Although there is an abundant amount of
research on aggregate development lead-time (i.e., lead-time for the entire product), little
work has been done to relate individual development product and project characteristics
to lead-times for specific stages of the development process. Griffin’s, Clark’s, and
Fujimoto’s work all suggests that this should be possible and that the lead-times could
vary significantly.
As mentioned previously, correlations have been found between product development
cycle or lead-time and engineering effort (Clark et al. 1987). It should be possible then to
use product development effort data to estimate development effort lead-time and cost.
Adler et al. (1995) used the number of people available to perform a given task as well as
rules about work reallocation and probability of that task being needed to derive project
lead-time from engineering effort data. Given the large portion of labor costs that make
up design projects, engineering effort could also provide a good estimate of design
project cost (Bashir and Thomson 2001). Roy et al. (2001) studied the relationship
between detailed design time and component characteristics. The effects of part
geometry on both quantitative, or direct design time, and qualitative, or “thinking” time,
were analyzed. However, since it is estimated that over half of work effort is spent
performing tasks outside of the design process (.i.e. planning or cost estimation) (Wallace
and Hales 1987), a multiplier would have to be applied to these design time estimations
to determine the total cost and lead-time. Smith and Morrow (1999) provide an extensive
Working Paper - Not to Be Cited without Author Permission

review of research that has been carried out looking at the relationship between aggregate
product development effort and lead-time and project characteristics. They also point out
the importance of models that are rigorous, tractable, and applicable; while there are
several rigorous models, there has been a potential loss of applicability. Very little work
has been done to relate part and process characteristics to engineering effort and lead-
time. Most other models or formulations are highly aggregated, using overall project
characteristics to project overall time and/or cost. Finally, a large portion the previous
research relies on detailed data not usually available at the beginning of the development
process when model output could be used to make explicit trade-offs. This work builds
upon previous research to propose a generative modeling method, built around the
concepts of process-based cost modeling that can be used to estimate both product
development lead-time and cost (derived from engineering effort) based on
characteristics of a product and the development process in place at the early stages
development. The details of this methodology are presented in the next section.
Modeling Methods: Projecting Development Performance from Product Characteristics
The importance of reliable cost information in the development stage cannot be
overstated. In some cases, the decisions made in the early stages of the product
development process can lead to and affect billion dollar investments. Given these stakes,
uninformed decisions can cause irreparable harm to the firm. Specifically, a number of
authors lament that the divorce of the cost estimation process from the design process
leads to either cost constraints, which limit designer flexibility, or asynchronous cost
estimation and expensive iterative redesign (Noble and Tanchoco 1990, Wei and Egbelu
2000, Field et al. 2001); neither of which lead to effective product development
outcomes. In light of this, products should be designed with a close eye to both customer
preferences and cost.
A valuable cost estimation tool would allow the designer to make explicit trade-offs
between product characteristics and their marginal cost. Specifically, Noble and
Tanchoco (1990) suggest that a cost estimation tool should analyze and present
quantifiable information, allow the decision maker to process or integrate uncertain or
Working Paper - Not to Be Cited without Author Permission

incomplete information throughout the design process, and allow the designer to be the
decision maker that drives the design process. Such cost estimation tools could then be
used to guide decisions during the early stages of the product development process.
Cost modeling attempts to realize such a tool by projecting the cost of a process or
product before it has been executed or produced. There are two widely recognized
methods of cost estimation. Variant (or analogous) cost estimation uses similarities
between a current product or process being studied and previous products or processes
that have been completed to project costs; generative (or parametric) cost estimation
projects costs based on production requirements and operational conditions(Asiedu and
Gu 1998, Weustink et al. 2000). The fact that variant-based costing relies on historic
products makes it less useful for assessing novel processes, materials, or architectures.
Because the specific cases presented deal with some form of novel technology, the model
presented in this paper was derived from the perspective of a generative costing method.
Several generative models have been proposed for use in cost estimation of both
manufacturing and assembly (Hu and Poli 1997, Jain 1997, Kang 1998, Shehab and
Abdalla 2001) and others3. In the end, each of these makes use of cost models to support
technology choice decisions. However, in none of these studies were modeling
approaches used to comprehensively project the cost of design or development associated
with the applications under evaluation.
While no standard method of cost modeling is widely used and accepted, one generative
cost modeling approach that satisfies all of the preferred characteristics proposed by
Noble and Tanchoco is process-based cost modeling. Process-based cost modeling
(PBCM) is an early stage cost estimation tool that has been used to project manufacturing
or assembly costs based on part and process characteristics. While PBCM approaches
have previously been used to answer numerous research questions related to
manufacturing costs (Busch 1987, Han 1994, Jain 1997, Kang 1998, Kelkar 2000), the
following sections will demonstrate that these methods can be adapted to forecast
engineering effort as well.
3. For a more exhaustive discussion of this topic see Johnson (2004).
Working Paper - Not to Be Cited without Author Permission

Process-based cost models are constructed by working backward from cost -the model’s
objective- to physical parameters that can be controlled – the model’s inputs. The
modeling of cost involves 1)correlating the effects of these physical parameters on the
cost-determinant attributes of a process (e.g., cycle time, equipment performance
requirements), 2) relating these processing attributes to manufacturing resource
requirements (e.g., kg of material, number of laborers, number of machines and/or tools),
and 3) translating these requirements to a specific cost (Kirchain and Field 2001). The
relationship between physical parameters and process characteristics is determined by
using fundamental physical relationships and/or through statistical analysis.4 A detailed
description of PBCM methods is beyond the scope of this article. Interested readers are
referred to Busch (1987) or Kirchain and Field (2001) for a full description of the
method. For the purposes of this document, those key aspects of constructing a PBCM
that are unique for modeling development activities will be detailed.
General Model Framework
The goal of the proposed product development model is to project both the cost and
expected lead-time for a development project based on the characteristics of the product
and the specific development context. To project development cost, the model comprises
four key cost elements – labor, equipment, software, and overhead / supervision – for
each phase of the development process. These four cost elements were selected based on
feedback from several design managers at an automotive OEM and based on their
prevalence as focal issues within the literature.
The allocated cost per assembly variant v, is computed according to Equation (1) to
Equation (15). Aggregated costs are calculated as:
Total Labor Equipment Software Overhead
v v v v vC C C C C= + + + (1)
ElEl
vv
vAC
C PV= (2)
( )El El
v vAC TC crf product life= × (3)
4. In the case of the development model, this is limited to statistical analysis, since no fundamental physical relationships were identified to correlate between part and project characteristics and development effort.
Working Paper - Not to Be Cited without Author Permission

where Cv = unit cost ($ per saleable unit) per assembly variant, v; ACv = annual cost ($),
PVv = annual production volume (saleable assemblies produced), TCv = total cost over
product life, and crf(product life) = capital recovery factor with s = product life as
defined in Equation (4); and El = cost element (Labor, Equipment, Software, Overhead).
A key element of any cost forecast is the method used to allocate non-uniform cash flows
to appropriate activities, here the development cost of a specific component. For the
purposes of this model, all development costs were assumed to occur prior to or near the
start of production. As such, even nominally variable cost elements like labor are
aggregated, amortized, and allocated to individual products are per Equation (1) through
Equation (3). Additionally, in the proposed development cost model, those cash flows
with periodicity longer than one year (e.g., equipment investments) are assessed as if
distributed uniformly in time over the usable lifetime of the relevant resource. An
amount equal to the product of that uniform cost rate and the time that the resource is
used by the modeled development activity is assessed to that activity. The opportunity
cost associated with tying up funds either for equipment investments specifically or
development expenditures in general are incorporated using a standard capital recovery
factor (crf) defined as:
[ (1 ) ]( )
[(1 ) 1]
s
s
d dcrf sd+
=+ −
(4)
Where s = number of periods over which is investment is distributed and d = periodic
discount rate (here, d=10%) (de Neufville 1990).
In developing these costs for specific variants that are members of a product family,
individual components can occur in one of three varieties: 1) Exclusive, components that
only exist in that variant; 2) Shared, components that are used without modification in
multiple variants in the product family, and 3) Modified, components that are slightly
modified variations of those used by other variants in the product family. All costs
associated with Exclusive components are allocated to the variant that comprises them.
As described below, the cost of shared components are allocated either across variants
based on production volume or to the first variant (which contains the component)
designed within the family (depending on assessment perspective).
Working Paper - Not to Be Cited without Author Permission

To provide more resolution on the impact of platforming, both cost and lead-time
measures were assessed from three distinct perspectives. The first perspective, referred
to as the Standalone Cost and Standalone Lead-time, represents the projected cost or
lead-time associated with a variant or product family assuming that each variant was
produced independently (i.e., without the benefits of component or process sharing). In
this case, all components are assumed to be exclusive and no cross-variant allocation of
cost is required. The second perspective, the Shared Cost of a variant, quantifies the
production volume weighted ratio of that variant’s cost contribution to the total cost for a
part or assembly. Stated conceptually, the Shared Cost of variant v would be:
vv v
w
platform
PVShared Cost Exclusive Development Cost Total Shared Development CostPV
= + ×∑
(5)
where {platform} represents the set of all variants. The final perspective, the Incremental
Cost or Incremental Lead-time of a constituent part or assembly, reveals the extra cost or
time that is incurred to produce a variant of that part or assembly, assuming that the
investment5 for the original parts has already been made. It should be noted that these
assessment perspectives can be used for manufacturing costs as well.
Considering the above definitions, the Shared Total Labor Cost is computed based on
Equation (6) and Equation (7):
,
,
,{ }, { }
,{ }Labor Shared
vv vs w
v w si v w
iw
PV TDHi exclusive s shared
TC wage TDHPV w platform
⎛ ⎞×∀ ∈ ∈⎜ ⎟= × +⎜ ⎟ ∀ ∈⎜ ⎟
⎝ ⎠
∑∑∑ ∑
(6)
,,
x wx w
reqRTHTDH designer productivity⎛ ⎞= ⎜ ⎟⎝ ⎠
(7)
where {exclusivev} is the set of components i, exclusively in variant v; {sharedv} is the
set of components within v that are also used in other variants; TDHx,w is the total paid
time for designers allocated to the development or modification of component x in variant
w (hours); reqRTHx,w is the projected required active computer time to design or modify
component x for variant w; designer productivity is defined as the ratio of average total
paid time per designer to the average time spent doing design activities; and wage is the 5. This investment could be fixed cost of manufacturing or development cost or time.
Working Paper - Not to Be Cited without Author Permission

average salary for designers ($/hour). The Standalone Labor Cost can also be computed
using Equation (6) and Equation (7). For a Standalone scenario, the set {sharedv} is null
and the second term with the parentheses in Equation (6) falls out. Incremental costs are
computed without any sharing across variants. As such, the Incremental Labor Cost is
computed simply as:
, , , { } { }
Labor Incremental
v v vi v
iTC wage TDH i exclusive shared⎛ ⎞
= × ∀ ∈ ∪⎜ ⎟⎝ ⎠∑ (8)
Notably, the character of TDHi,v within {sharedv}would be expected to differ across the
set of variants within the product family. For the first variant, shared design efforts would
include developing novel components. For subsequent variants, efforts would be limited
to design modifications of previously designed components.
At the assembly level, total Shared Equipment Costs are computed according to Equation
(9) through Equation (11):
( ),
, , ,
, ,
( ( ) ){ }, { }
( ) ,{ }Equip Shared
vv vEquip s w Equip s w
v w sEquip i Equip i v w
iw
PV Inv crf s LRi exclusive s shared
TC Inv crf s LRPV w platform
∀ ∈ ∈= +
∀ ∈
∑∑∑ ∑
(9)
ii
TDHLR availLT= (10)
(24 )availLT DPY NS UB PB UD= ⋅ − − − − (11)
where LRi = number of required parallel sets of equipment to design component i Inv = non-periodic investment to be allocated, s = the productive life of the design equipment. DPY = operating days per year for the design shop, NS = no operations (hr/day the plant is closed), UB = unpaid breaks (hr/day), PB = paid breaks (hr/day), and UD = Unplanned downtime (hr/day).
As before, Equation (9) can be used without modification to compute total Standalone
Equipment Cost. Similarly, total Incremental Equipment Cost is calculated as:
( ), , ,( ) , { } { }
Equip Incremental
v v vEquip i Equip i v
iTC Inv crf s LR i exclusive shared= ∀ ∈ ∪∑
(12)
Working Paper - Not to Be Cited without Author Permission

Although this study only considered capital costs in the form of equipment, the above
formulation is appropriate for extension to other capital costs which are deemed relevant
(e.g., facilities).
The total shared cost of software and overhead are treated as in Equation (13) and
Equation (15), respectively; total incremental cost of software and overhead are treated as
in Equation (14) and Equation (16), respectively
,
,( )( )
Software Shared
vs w
v w sSoftware i w
iw
PV LRTC UC LR
PV
⎛ ⎞×⎜ ⎟= × +⎜ ⎟⎜ ⎟⎝ ⎠
∑∑∑ ∑
(13)
,( )
Software Incremental
vSoftware i
iTC UC LR= ×∑ (14)
,
,( )( )
Overhead Shared
vs w
v w si w
iw
PV RTHTC Oh RTH
PV
⎛ ⎞×⎜ ⎟= × +⎜ ⎟⎜ ⎟⎝ ⎠
∑∑∑ ∑
(15)
,
( )Overhead Incremental
vi
iTC Oh RTH= ×∑ (16)
where UCSoftware is the unit cost of software licenses per year per seat, Oh represents the
ratio of indirect labor costs to direct design labor effort, and set applicability is consistent
with all preceding expressions.
The fundamental determinant of all of four cost elements is the projected magnitude of
engineering effort (i.e., required active computer time representing the expected person-
hours of designer time). As such, to incorporate sensitivity to changes in product or
project characteristics within the model, relationships were developed to capture the
impact of these on engineering effort. The following section details these relationships, as
well as the analytical and data collection methods used to develop them.
The secondary goal of the proposed development model was to project the expected lead-
time associated with a specific development effort. The model presented in this paper is
similar to that of Alder et al. (1995) in that it views the engineers in the development
process as resources that are used to complete tasks. In contrast, the model presented
herein estimates the engineering effort required to perform development functions based
Working Paper - Not to Be Cited without Author Permission

on part and assembly characteristics, as opposed to high and low estimates of effort based
on previous work. This model also uses empirical data to determine the amount of
calendar time required to complete a given amount of engineering effort. This
calculation begins by computing the TDHx,w for each component or assembly of each
variant for each stage of the development process as detailed above; these total design
hours figures are summed to determine the overall engineering effort for the variant (or
total incremental effort). Given that there are limited resources available for a given
development project, the total number of engineers available, TEAq for that stage, q, for a
given project is specified. This is used to determine the total development hours that are
allocated to each engineer. However, some components or assemblies in a development
stage require a large number of total design hours; engineers working on other
components or assemblies could not easily switch to and complete small portions of this
work. To accurately convey this, a maximum number of engineers per component or
assembly MEPCq for stage q is also specified.6 This is then used to determine which is
ratio is larger: that of total development hours per total engineers available or that of the
maximum development effort required for a given component per the maximum number
of engineers per component. This engineering effort density is then divided by availLT
to determine development lead-time for that stage. This is shown in Equation (17) below,
which calculates stage lead-time, STq for a single variant:
( )maxmax ,
xxx
q q
q
TDH TDHTEA MEPC
STavailLT
⎛ ⎞⎜ ⎟⎜ ⎟⎜ ⎟⎝ ⎠=
∑
(17)
Finally, the amount of overlap between development stages is used to determine overall
project lead-time. Total project lead-time, TT, is determined by summing the products of
the stage lead-times, STq and the overlap factors for those stages, OLq. The overlap
6. For stages where smaller projects are worked on, such as detailed design this might be a single engineer; for stages where larger projects are the norm, this might be a team of twelve engineers.
Working Paper - Not to Be Cited without Author Permission

factor, OLq, is the portion of that stage that must be completed before the next stage can
commence. This is shown below in Equation (18):
q qq
TT ST OL= ⋅∑ (18)
In the end, as the case studies presented in a later section will demonstrate, this
combination of features allows for powerful insights around the impact of development
costs in determining the economically preferred technology and architectural strategy for
a given product family.
Modeling Engineering Effort across Product Development Stages
The core element of the proposed development model is a set of empirically derived
models that relate characteristics of the product under development and the project
context to projected engineering effort. Roy et al. (2001) propose that when modeling the
development process, that 1) the process should be well understood, 2) dissimilar
products should not be mixed, and 3) data for as many designs as possible should be
collected. Prevailing wisdom about modeling also dictates that the development process
should also be well established and stable. To accommodate these conditions, data on
engineering effort was collected at various stages of the development process for projects
designing a range parts and subassemblies, specifically automotive structures and
closures. At each stage, similar parts and subassemblies were assessed. All data were
collected at a single, large automotive OEM. The specific extent and target of data
collection is detailed subsequently according to each stage of development. A set of
models was then formulated to relate these data to engineering effort. A diagram of the
stages in the product development process that was examined is shown in Figure 1.
Insert Figure 1 Here
For the purpose of this work, models of the advanced engineering, prototyping, and
process development phases of the product development process were constructed.
Within the firm under investigation, the concept development and product planning
stages of the development process occur before technology selection decisions. Since the
Working Paper - Not to Be Cited without Author Permission

focus of this inquiry is the impact of cost information on such decisions, these stages
were assumed completed, not relevant, and not modeled. The subsequent pilot
production and ramp-up phases of the development effort were also not modeled.7 The
advanced engineering phase of the development process for automotive structures and
closures includes two stages: the detailed design of individual parts as well as
determining the formability (manufacturability) of these parts. Next, both virtual and
physical prototypes are produced for finite element analysis and physical validation. It
should be noted that the finite element analysis and physical validation phases of the
development process described and modeled in this work include structural validation
only and do not address the process of determining vehicle crash worthiness.8 The
process development phase includes the fabrication engineering required for the
individual parts and the engineering required for the assemblies and subassemblies of the
body or closure. Activity specific data were collected through half hour face-to-face
surveys of engineers in both truck and car divisions.
Advanced Engineering Data For the advanced engineering phase of development, each engineer was asked to select
between two and four (depending on available time) recently completed (released) parts
or assemblies of varying size and complexity. In addition to contact information, the
engineers were asked to specify how long they had been performing similar engineering
work. Engineers were asked to identify the material of the part and the manufacturing
technology used to fabricate the part. They were also asked to estimate the geometric
complexity of the part based on a five-point scale. The engineer was told that a part such
as a simple bracket was a “one”, while a complex part such as a floor pan was a “five”.
The length, width, and height of a box in which the part would fit were also collected. In
both stages of the advance-engineering phase, the engineer was asked to estimate the total
7. Both pilot production and ramp-up were excluded from analysis because of their current high degree of variability in terms of effort and duration, even for existing designs and technologies. Project resources precluded analyses of sufficient scope to characterize such high variance activities. 8. The extent of modern physical crashworthiness testing is largely dictated by regulation and is little affected by technological characteristics within the vehicle. New designs frequently incur additional simulation and testing expense, but these costs are almost exclusively attributable to novelty, not to specific technological characteristics.
Working Paper - Not to Be Cited without Author Permission

time spent working on the part in question at the computer. It was specified that the
estimate should include all iterations and any work done between reception of the task
requirements until the part was released to the next stage. The calendar time or number
of days required to complete this amount of work was also queried.
For the detailed design stage, information was also collected about the 1) if the part
contributed to the structural integrity and crash-worthiness of the vehicle, 2) amount of
time it would take to add features or change the parts overall size, 3) the likelihood of the
part having to be changed after an acceptable engineering solution had been reached, 4)
the number of iterations which had occurred in design of the part, 5) the amount of
overlap in the project (“one” – most tasks done in parallel vs. “five” – most tasks done
sequentially), and 6) the sensitivity of this part to changes in other parts (the likelihood
that design changes would be required for the part in question if a mating or proximate
part changed). For the detailed design stage, twenty-three engineers were surveyed
producing fifty-nine responses.
In addition to the general advanced engineering phase questions, for the formability
engineering stage, engineers were asked about 1) the amount of computer processing
time required for an analysis, 2) if the part was a surface part (i.e., seen by the consumer),
and 3) the number of formability analyses done (iterations to acceptable performance).
Formability engineers were also asked about the novelty of the manufacturing process
being employed. For the formability stage, six engineers were surveyed producing
twenty-four responses.
Prototyping Data For the prototyping phase, engineers were asked to select recent projects that they had
completed.9 They were then asked about entire projects as well as individual tests or
procedures. First these engineers were asked to describe the type of project they had
worked on. They were then asked about the major manufacturing technology and
material of the assembly. Given the consolidated nature of these analyses, there was little
variability in the range of manufacturing technologies reported. In the finite element
9. It should be noted that these are aggregated projects, done only on major assemblies.
Working Paper - Not to Be Cited without Author Permission

analysis (FEA) stage, the engineers were asked to estimate the amount of effort required
to set up their analyses. This time included the effort required to mesh the models
received from design engineering, as well as to apply loads and design testing
procedures. Next the engineers were asked to estimate the effort required to run the
analysis. This effort included the time required to analyze the results and create any
required documentation or figures. Similar to the FEA engineers, physical validation
engineers were asked about entire projects as well as individual tests. They were asked to
estimate the amount of effort required to perform the validation for the project or
individual test. Finally, all prototyping engineers were asked to estimate the calendar time
required for the entire process. Unlike the previous two stages of the development
process, there are few individual characteristics that could be used to estimate the amount
of effort required during prototyping. This was due to the aggregated nature of the
systems under consideration as well as the standardization of the analyses. Fifteen FEA
engineers were surveyed producing information about eight auto bodies and eleven
enclosures. Seven physical validation engineers were surveyed produced data for four
bodies and seven closures.
Process Development Data The process development phase included the engineering for the fabrication of individual
parts as well as assembly engineering. Unlike the previous phases of the development
process, larger groups performed these sets of tasks. For stampings (the most widely
used forming technology in the automotive industry), part characteristics and the
corresponding person-hours and calendar time for several parts were collected from
engineering managers who were responsible for overseeing the different portions of the
process development stage. The first portion is the effort related to the machine selection
and process design; these are described as expensed tasks. The other portion of the
process development stage is the actual design of the dies; these are described as capital
tasks. Similar to the advance engineering phase, data about the size and complexity of
the parts was tabulated. Data about whether or not a part was a surface part, thus
requiring a higher quality standard, and the number of dies required to form the part was
also noted for capital tasks. In addition to the detailed information gathered for stamped
parts, data about other processes was also tabulated. In these cases, process experts were
Working Paper - Not to Be Cited without Author Permission

asked to estimate the total amount of engineering effort including manufacturability,
machine selection, process design, and tooling design for parts of varying complexity and
size. These experts were interviewed and data were collected for die-casting, tube
hydroforming, roll forming, and both tube and stretch bending. For steel stamping, data
were collected from two managers yielding information for thirteen parts.
For the assembly engineering stage, engineering managers were asked to provide data for
recently completed projects. Again, assembly engineering is a set of tasks performed by a
larger group. First they were asked to estimate the overall complexity of the assembly on
a scale of one to five. They were told a simple bracket assembly was a “one” and a
complex motor compartment or bodyside was a “five”. Next the amount of joining
required for the assembly was queried. Joining methods were converted into the
equivalent number of spot welds which would join a similar length so that a consistent
metric could be used. The number of distinct joining methods and number of parts in the
assembly were also recorded. These engineering managers were asked to estimate the
total amount of engineering effort required to design the assembly process, design any
tooling, and determine equipment needs. They were also asked to estimate the amount of
calendar time required to complete this assembly engineering. Finally, they were asked
to estimate the percentage of the original effort that would be required to assemble a
slight variant of the original subassembly. Three engineering managers provided data
regarding seventeen subassemblies.
General Product Development Data In addition to data about direct engineering effort, for each development stage, data were
collected about indirect costs from engineers and engineering managers: 1) overhead, 2)
computer hardware and software, and 3) physical prototypes. These data were combined
with development resource requirements to estimate development cost as described
previously.
Working Paper - Not to Be Cited without Author Permission

Engineering Effort Model Outcomes
As previously mentioned, linear regression analysis was used to relate part and assembly
characteristics to engineering effort. While all stages were rigorously analyzed, detailed results
for the formability engineering stage are presented here along with a summary of the other
analyses performed. Due to the highly proprietary nature of these data, all engineering effort and
calendar time quantities were normalized by the mean of the data set. All cost data are also
disguised. All trends shown are consistent and proportional to those found using actual data.
Data gathered from six engineers about the formability of twenty-four parts was analyzed. Table
1 shows the Pearson correlation matrix for the formability survey data; statistically significant
( 0.1p ≤ ) relationships are detailed as follows. As expected, the time required to perform a
formability analysis was positively correlated with part complexity, part size, and whether or not
the part is a surface part. It is expected that larger more complicated parts would require longer
analysis time. It is also reasonable that the higher quality required for surface parts would lead to
greater effort. Part complexity and part size were positively correlated. While it is possible to
have small complex parts or large simple parts, large parts tend to contain more features and are
therefore more likely to be complex. The size of a part was also positively correlated with
whether or not the part was a surface part. These correlations were then used to select variables
for use in the multiple linear regression analyses.
Insert Table 1 Here
Four linear correlation models were evaluated for the engineering time required to perform a
formability analysis. These models are shown in Table 2. Model one included part size, part
complexity, and whether the part was a surface part. Notably, the coefficient for surface status
was not statistically significant, excluding it from further consideration. Model two incorporates
part complexity and size. Models three and four included a single variable each: part complexity
and size, respectively. Neither models three or four have a R2 as high as model two. Given the
higher R2 and its use of readily available inputs, model two was used to estimate formability
effort in the following sections of this work. A plot of collected data verses predicted data is
shown in Figure 2. A plot of standardized residuals verses modeled values for model two is
shown in Figure 3. This figure shows the error terms to be evenly distributed and mostly
Working Paper - Not to Be Cited without Author Permission

independent of the predicted value. These results were then combined with data about indirect
costs and formability engineers’ efficiency to determine engineering effort and subsequently
cost. Data collected regarding the correlation between engineering effort required and calendar
time was then used to estimate the cycle time for the formability engineering stage.
Insert Table 2 Here
Insert Figure 2 Here
Insert Figure 3 Here
In addition to formability engineering, other stages of the development process were analyzed in
a manner similar to that presented. Table 3 shows a breakdown of the data used to predict
engineering effort for these other stages. To determine the major part and project characteristics
that affect computer design time a model that contained part size and the amount of overlap in
the project was used. To determine the amount of time required to make overall length and
width changes, part size was used. The engineering effort required for the capital portion of
fabrication (for stamping) engineering used a model based on part size and complexity. The
model for assembly engineering used subassembly complexity and the number of parts in the
subassembly. As previously mentioned, the aggregated and standardized nature of both the finite
element analyses and physical validation stages did not allow for statistical analyses. Data for
the individual tasks and completed projects were compared to standardized task lists and found
to be consistent (i.e., within 20% with no statistical bias) with projected effort. This data along
with that collected about the cost of physical prototypes was used to complete the proposed
development model. Overlap factors, the percentage of a proceeding task that must be
completed prior to the subsequent task beginning, similar to those found in product development
planning documents at the automotive OEM were used in the development lead-time
calculations. The model is demonstrated in the context of two case studies in the following
section.
Insert Table 3 Here
Working Paper - Not to Be Cited without Author Permission

Exercising the development model: two case studies in body structure platforming
To assess the importance of development cost in the context of total product cost and determine
the suitability of process-based cost modeling as a technique for determining development cost
and lead-time, two case studies are presented. Process-based cost models are used to forecast
development, parts production, and assembly costs (details of the production and assembly
models can be found in Johnson and Kirchain (2006)). Total costs for producing product
variants individually and as a planned product family are investigated. Although the models
allow for exploration of production under a range of strategic and operational conditions, all
results are presented here for the conditions shown in Table 4.
Insert Table 4 Here
Case one: alternative instrumental panel beam designs
The first case examines two alternative instrument panel (IP) beam designs: 1) a tube-based
steel design10 and 2) a die-cast magnesium design which affords significant parts consolidation.
The steel IP beam (denoted Steel IP) consisted of a tubular structure with over two-dozen
brackets attached. The magnesium design comprised a primary die cast magnesium structure
(denoted Mg IP) with two additional unique bracket pairs. In addition to parts consolidation, the
magnesium design is attractive because it affords significant weight savings (approximately
14%) over the steel design. The development costs forecast using the proposed development
model are shown in Figure 4. In both cases, development costs are dominated by fabrication and
assembly engineering; accounting for over 90% of development costs in the both designs.
Insert Figure 4 Here
Interestingly, although the complex die-casting (i.e., the primary structured part within the Mg IP
design) is projected to demand more than three times the development effort than the analogous
steel structure (i.e., the steel tube), the development cost for the overall magnesium design is
much less. In aggregate, total development costs for the Steel IP were over six times higher than
those of the whole Mg IP. This difference was driven primarily by savings in Assembly
10. Most vehicles today use similar tube-based steel instrument panel beams.
Working Paper - Not to Be Cited without Author Permission

Engineering and Fabrication Engineering. In both cases, higher Steel IP costs derive from the
larger number of parts and more complex assembly process required for the steel design.
To quantify the impact which development costs plays in a technology choice decision, both
designs were also modeled for parts production and assembly cost. As shown in Figure 5, these
manufacturing costs are distributed differently for the two designs. The magnesium design
incurs significantly higher fabrication costs – due to the high unit cost of magnesium— but has
much lower assembly costs – due to the extent of parts consolidation. At the production volume
shown (75,000 units per year), the steel design provides marginally lower direct manufacturing
costs. Notably, at this production volume, the development savings are sufficient to drive the
total cost of the magnesium IP design to only slightly more than the cost of the steel design (see
Figure 5). In fact, the inclusion of development costs makes the magnesium design more
competitive at all production volumes and the least cost option across a broader range of
conditions (Johnson and Kirchain 2006).
Insert Figure 5 Here
To assess the role of platform design strategies on development lead-time and cost, a
permutation of the above case study was examined in which each of two IP designs were shared
across two vehicles. The second vehicle was assumed to require an IP beam design variant that
was 10% longer than the original design (required for a vehicle with a larger track or width).
Related to this, some authors have noted that the ability to share parts between variant products
is often limited by more integrated designs (Ulrich 1995, Muffatto 1999). For the purpose of this
case, the two magnesium design variants were assumed to share the pair of unique brackets, but
not the main magnesium structure. The steel variants were assumed to share a large portion of
the brackets (those whose spacing was not significantly affected by the length change) and a
portion of the tubular structure. The Standalone (Var 1) and Incremental (Var 2) development
costs for the two alternative designs are shown in Figure 6. Based on these assumptions, the
Incremental Development Costs for the second steel variant were 86% less than its standalone
costs ($1.17 for the Incremental Costs vs. $8.49 for the Standalone Costs). The Shared
Development Costs for the two steel variants were 43% lower than the Standalone Costs ($9.66
in the shared case vs. $16.98 for the two standalone steel beams). The Incremental Development
Costs for the second magnesium variant were 79% lower than the Standalone Costs ($0.28 for
Working Paper - Not to Be Cited without Author Permission

the Incremental Costs vs. $1.32 for the Standalone Costs); Shared Development Costs for the
magnesium variants were 40% lower ($1.60 in the shared case vs. $2.65 for the two standalone
magnesium beams).
Insert Figure 6 Here
In addition to development cost, development lead-time was also analyzed. As mentioned
previously, overlap factors similar to those found at a major automotive OEM were used to
project development lead time. Formability was assumed to begin after 50% of the detailed
design stage was completed; fabrication engineering stage was assumed to begin after 100% of
formability stage was completed; the assembly engineering stage was assumed to begin after
10% of the fabrication engineering stage was completed. Figure 7 shows the projected
Standalone Lead-times for the first variants (Var 1), and the Incremental Lead-times for the
second variants (Var 2), of both the steel and magnesium designs. The Standalone Lead-time for
the original steel IP beam (shown as equal to one time unit for Steel Var 1 in Figure 6) was
projected by the model to be over 250% longer than that of the standalone magnesium beam.
This difference was due mainly to the increase in assembly engineering lead-time required to
integrate the numerous components within the steel design. As would be expected, Incremental
Development Lead-times (IDLt) for the variant designs were projected to be dramatically lower
than for the original designs. The IDLt for the Mg IP beam decreased from 0.37 for the original
design (Mag Var 1) to 0.25 for the variant (Inc. Mag Var 2), a reduction of 32%. Interestingly,
the IDLt for the steel IP was projected to drop even more dramatically, falling by 80% to 0.20
time units, over 20% shorter than that of the second magnesium variant. The difference in these
two results occurs because while the time-consuming detailed design of the main magnesium
castings must be replicated across variants, the steel design can leverage many existing
components, allowing the latter to greatly reduce lead-time for subsequent variants. As a result,
while the steel design has longer Standalone Development Lead-time, variants off the original
steel IP beam design can be developed more quickly than variants off the original magnesium IP
beam design.
In the end, the proposed development model provides information about development cost and
lead-time that may alter the design decisions surrounding the instrumental panel case. For the
production assumptions presented for the case (most notably operating at a production volume of
Working Paper - Not to Be Cited without Author Permission

75,000 units per year), the model projects a difference in development costs that is sufficient to
show the magnesium design as a much more cost competitive option than when considering part
production and assembly costs alone. In fact, including development cost and using base-case
conditions, the cost parity point between the two designs shifts from 10,000 units per year to
70,000 units per year. Obviously, access to predictive models about the performance and cost of
development activities can have an influential impact on the materials and process selection
decisions. The addition of development cost activities also had a marked effect in the case of the
platformed instrument panel beams. The costs of development activities accounted for 20% and
3% of total standalone costs for the Steel IP and Mg IP designs, respectively. However, the cost
savings associated with development activities as a result of part sharing accounted for 36% of
total cost savings in the case of the Steel IP design and 16% in the case of the Mg IP design.
Insert Figure 7 Here
Case two: body structures
The second case investigates the significance of platforming strategy to the cost of producing a
family of vehicle bodies-in-white (BIWs). Specifically, a family of mid-sized vehicles structures
comprising BIWs for a convertible, a sedan, and a crossover (the emergent class of vehicles
combining features of SUVs and passenger cars). All three variants utilize a tubular steel,
spaceframe-type construction. Although this architecture is not widely applied in high-volume
production, it offers attractive characteristics for lower volume niche applications. Furthermore,
the tubular design affords much greater opportunity for parts commonality. This product family
was designed to capitalize on that characteristic and share a large number of parts. Summary
information about the three designs can be found in Table 5. When considered as a whole the
three designs share 46% of all parts produced.
Insert Table 5 Here
As with the previous case, the proposed development model was used to forecast development
costs for the three variants. Figure 8 shows the breakdown of these for the three variants. Both
Incremental and Standalone Costs are presented. Standalone Costs assume that only that variant
is developed, while Incremental Costs assume the convertible is produced first then the sedan
and then the crossover (each bar represents only the additional development effort needed given
Working Paper - Not to Be Cited without Author Permission

that the designs share components and subassemblies). No bar is plotted for the Incremental Cost
of developing the convertible as it is assumed to be the original design.
Notably, in Case Two no specific alternative technology was explored. However, as will be
quantified, this case further emphasizes the potential significance of development costs in
establishing the cost effectiveness of platforming strategies. Across all three variants, fabrication
and assembly engineering made up a majority of the development costs, together accounting for
around 80% of the costs in each case. As with the IP beam case, parts sharing led to significant
savings in development cost. For both the sedan and crossover designs, Incremental
Development Costs were projected to be more than 40% lower than the corresponding
Standalone Development Cost. Furthermore, examining the full set of three vehicles, the model
projects a total cost decrease of 28% compared to developing all components independently. Not
surprisingly, savings in fabrication and assembly engineering made up most (90%) of the
forecast development cost savings. These savings are directly linked to avoided costs associated
with part and subassembly commonality.
Insert Figure 8 Here
As a second test of the importance of development cost in technology decision making,
development costs were combined with modeled costs of part production and assembly for the
three body designs. These costs were derived using the proposed models of part production and
body construction were used to project corresponding manufacturing costs. Figure 9 shows these
costs for producing 75,000 units per year under two scenarios: the sedan being produced
independently (Standalone) and all three variants are produced in concert sharing investments
where possible (Shared). Notably, the shared strategy reduces total cost by 8%.
While development accounts for only 7% of the total (i.e., development, fabrication, and
assembly) cost, almost 30% of the total cost savings are due to the reduction in development cost
resulting from parts and assembly sharing (as seen in Figure 9). So, while development cost may
not be a large contributor to aggregate costs, it can become a determinant factor in decisions
involving platforming and product families. Ignorance of the magnitude of these potential
savings could lead to inferior product family development strategies.
Working Paper - Not to Be Cited without Author Permission

Insert Figure 9 Here
Discussion
The significance of effective development for technologically driven products is rarely
questioned. Innovative development can increase demand by realizing enhanced products,
driving down operating costs, or even creating new markets. However, these benefits come with
real costs. Development activities require expensive, skilled resources, which must be engaged
through numerous, often iterative activities. Aware of this, many successful firms closely
monitor their development activities, tracking both the use of development resources
(engineering effort) and the elapsed time that is required to go from concept to salable
production (lead-time). Nonetheless, despite their importance as performance metrics, the
specific correlation between product characteristics and engineering effort and/or lead-time has
not been extensively studied.
This work has presented a methodology for studying that relationship as well as a corresponding
model, which has been built through a detailed study of engineering practices within the
automotive industry. These analyses of engineering practices have repeatedly showed that
component size and complexity are the strongest drivers for development cost throughout its
many stages. Generally, this trend would dissuade the adoption of integrated designs, which are
inherently larger and more complex than any single modular component that they replace.
However, as shown explicitly in the first case study, sufficiently integrated designs can provide
such significant reductions in assembly and, therefore, the design of assembly processes as to
overcome this disincentive. One driving reason behind the lesser attention paid to development
costs, is that they are often overshadowed by manufacturing costs for high volume production (as
both case studies reveal). Interestingly, however, in both cases, development costs play a key
role in establishing the preferred technological option. When considering the IP beam designs,
assembly cost savings are insufficient to motivate using the magnesium design at production
volume of 10,000 per year or greater (considering only cost). However, the associated savings
that would emerge from designing both fewer parts and fewer assembly processes are more than
adequate to overcome that deficit. In fact, including development cost and using base-case
conditions, the cost parity point between the two designs shifts from 10,000 units per year to
over 70,000 units per year.
Working Paper - Not to Be Cited without Author Permission

The modeling approach presented in this paper also projected that development cost can play a
significant role in motivating the use of product platforms. Similar to integration, product
families reduce cost by eliminating unnecessary fixed investments. As redundant manufacturing
investments – tooling and equipment – go away, so do the development investments associated
with those same activities – fabrication and assembly engineering. For product families, savings
can extend to even more development activities, for example, eliminating unnecessary testing
and qualification of duplicate parts and assemblies. These trends were shown explicitly in the
two cases. The elimination of redundant development activities resulting from part sharing in
the product families generated development cost savings well in excess of the development
portion of total cost. Such savings can play a critical role in motivating technology choice for
low production volume applications, if tools like the one presented in this paper are made
available to appropriate decision-makers.
Ultimately, the costs associated with development activities may seem small compared to the
investments made in manufacture and assembly, especially for large complex products.
However, both as a controllable cost and amplifier of other more recognized strategic benefits,
development cost can play an influential role in dictating the lowest total cost technological
option. The case studies presented have shown how applying the process-based modeling
approach can quantify that role in decisions involving material, process, and architectural
decisions. Application of these methods to firm specific contexts should afford product
development decision-makers the information that they need to make more economically
effective decisions on both product architecture and the production technologies used to realize
that architecture.
Working Paper - Not to Be Cited without Author Permission

References Adler, P.S., Mandelbaum, A., Nguyen, V. & Schwerer, E., 1995. From project to process
management: An empirically - based framework for analyzing product development time. Management Science, 41 (3), 458-484.
Asiedu, Y. & Gu, P., 1998. Product life cycle cost analysis: State of the art review. International Journal of Production Research, 36 (4), 883-908.
Bashir, H.A. & Thomson, V., 2001. Models for estimating design effort and time. Design Studies, 22, 141-155.
Bhimani, A. & Mulder, P.S., 2001. Managing processes, quality, and costs: A case study. Journal of Cost Management, 15 (2), 28-32.
Busch, J.V., 1987. Technical cost modeling of plastics fabrication processes. Thesis (Ph.D.). Massachusetts Institute of Technology.
Clark, K.B., Chew, W.B. & Fujimoto, T., 1987. Product development in the world auto industry. Brookings Papers on Economic Activity, 1987 (3), 729-771.
Clark, K.B. & Fujimoto, T., 1989. Lead time in automobile product development explaining the japanese advantage. Journal of Engineering and Technology Management, 6 (1), 25-56.
Clark, K.B. & Fujimoto, T., 1991. Product development performance: Strategy, organization, and management in the world auto industry Boston, MA: Harvard Business School Press.
Cohen, M.A., Eliashberg, J. & Teck-Hua, H., 1996. New product development: The performance and time-to-market tradeoff. Management Science, 42 (2), 173-186.
Collier, D.A., 1981. The measurement and operating benefits of component part commonality. Decision Sciences, 12 (1), 85-96.
Datar, S., Jordan, C.C., Kekre, S., Rajiv, S. & Srinivasan, K., 1997. The advantages of time-based new product development in a fast-cycle industry. Journal of Marketing Research, 34, 36-49.
De Neufville, R., 1990. Applied systems analysis : Engineering planning and technology management New York: McGraw-Hill.
Field, F.R., Clark, J.P. & Ashby, M.F., 2001. Market drivers for materials and process development in the 21st century. MRS Bulletin, 26 (9), 716-725.
Gonzalez-Zugasti, J.P., Otto, K.N. & Baker, J.D., 2000. A method for architecting product platforms. Research in Engineering Design, 12, 61-72.
Griffin, A., 1993. Metrics for measuring product development cycle time. Journal of Product Innovation Management, 10, 112-125.
Griffin, A., 1997. The effect of project and process characteristics on product development cycle time. Journal of Marketing Research, 34 (1), 24-35.
Gupta, A.K. & Souder, W.E., 1998. Key drivers of reduced cycle time. Research Technology Management, 41 (4), 38-43.
Hall, D. & Jackson, J., 1992. Speeding up new product development. Management Accounting, 74 (4), 32-36.
Han, H.N., 1994. The competitive position of alternative automotive materials. Thesis (Ph.D.). Massachusetts Institute of Technology.
Hsieh, P., Mishra, C.S. & Gobeli, D.H., 2003. The return on r&d versus capital expenditure in pharmaceutical and chemical industries. IEEE Transactions on Engineering Management, 50 (2), 141-150.
Hu, W. & Poli, C., Year. To injection mold, to stamp, or to assemble? Part ii: A time to market perspectiveed.^eds. DETC, Sacramento, California: ASME.
Working Paper - Not to Be Cited without Author Permission

Jain, A., 1997. An analysis of automotive body assembly technologies and their implications in lightweight vehicle development. Thesis (S.M.). Massachusetts Institute of Technology.
Johnson, M.D., 2004. A methodology for determining engineering costs and their effects on the development of product families. Thesis (Ph.D.). Massachusetts Institute of Technology.
Johnson, M.D. & Kirchain, R.E., 2006. Using process-based cost models to determine the effects of product family decisions and development costs on material selection. Materials Science and Technology. Cincinnati, OH: The Materials Society, 659-670.
Kalyanaram, G. & Urban, G.L., 1992. Dynamic effects of the order of entry on market share, trial penetration, and repeat purchases for frequently purchased consumer goods. Marketing Science, 11 (3), 235-250.
Kang, P.J., 1998. A technical and economic analysis of structural composite use in automotive body-in-white applications. Thesis (S.M.). Massachusetts Institute of Technology.
Kelkar, A.S., 2000. Analysis of aluminum in auto body designs and its strategic implications for the aluminum industry. Thesis (S.M.). Massachusetts Institute of Technology.
Kirchain, R. & Field, F.R., 2001. Process-based cost modeling: Understanding the economics of technical decisions. Encyclopedia of Materials Science & Engineering, 1718–1727.
Martin, M.V. & Ishii, K., Year. Design for variety: A methodology for understanding the costs of product proliferationed.^eds. ASME Design Engineering Technical Conference, Irvine, CA: ASME.
Meyer, M.H. & Lehnerd, A.P., 1997. The power of product platforms New York: The Free Press. Muffatto, M., 1999. Introducing a platform strategy in product development. International
Journal of Production Economics, 60-61, 145-153. Nobelius, D. & Sundgren, N., 2002. Managerial issues in parts sharing among product
development projects: A case study. Journal of Engineering and Technology Management, 19 (1), 59-73.
Noble, J.S. & Tanchoco, M.A., 1990. Concurrent design and economic justification in developing a product. International Journal of Production Research, 28 (7), 1225-1238.
Norden, P.V., 1960. On the anatomy of development projects. IRE Transactions on Engineering Management, 7 (1), 34-42.
Pine, B.J., 1991. Paradigm shift: From mass production to mass customization. Thesis (S.M.). Massachusetts Institute of Technology.
Pine, B.J., 1993. Mass customization: The new frontier in business competition Boston: Harvard Business School Press.
Roemer, T.A., Ahmadi, R. & Wang, T.H., 2000. Time-cost trade-offs in overlapping product development. Operations Research, 48 (6), 858-865.
Rosenau, M.D., 1988. Faster new product development. Journal of Product Innovation Management, 5 (2), 150-153.
Rosenau, M.D., 1989. From experience: Schedule emphasis on new product development personnel. Journal of Product Innovation Management, 6 (4), 282-288.
Roy, R., Kelvesjo, S., Forsberg, S. & Rush, C., 2001. Quantitative and qualitative cost estimating for engineering design. Journal of Engineering Design, 12 (2), 147-162.
Schonberger, 1987. Frugal manufacturing. Harvard Business Review, 65 (5), 95-100. Shehab, E.M. & Abdalla, H.S., 2001. Manufacturing cost modelling for concurrent product
development. Robotics and Computer Integrated Manufacturing, 17, 341-353. Smith, R.P. & Eppinger, S.D., Year. Characteristics and models of iteration in engineering
design. In: Roozenburg, N.F.M., ed.^eds. International Conference on Engineering Design, The Hague, Netherlands, 564-571.
Working Paper - Not to Be Cited without Author Permission
Smith, R.P. & Morrow, J.A., 1999. Product development process modeling. Design Studies, 20, 237-261.
Tu, Y.L., Xie, S.Q. & Fung, R.Y.K., 2007. Product development cost estimation in mass customization. IEEE Transactions on Engineering Management, 54 (1), 29-40.
Ulrich, K., 1995. The role of product architecture in the manufacturing firm. Research Policy, 24, 419-440.
Uzumeri, M. & Sanderson, S., 1995. A framework for model and product family competition. Research Policy, 24 (4), 583-607.
Von Braun, C.F., 1990. The acceleration trap. Sloan Management Review, 32 (1), 49-58. Wallace, K.M. & Hales, C., Year. Detailed analysis of an engineering design project. In: Eder,
W.E., ed.^eds. International Conference on Engineering Design, Boston, MA, 94-101. Wei, Y. & Egbelu, P.J., 2000. A framework for estimating manufacturing cost from geometric
design data. International Journal of Computer Integrated Manufacturing, 13 (1), 50-63. Weston, N.J. & Simmons, J.E.L., Year. Managing the issue of time in mechanical engineering
design. In: Roozenburg, N.F.M., ed.^eds. International Conference on Engineering Design, The Hague, Netherlands, 533-540.
Weustink, I.F., Ten Brinke, E., Streppel, A.H. & Kals, H.J.J., 2000. A generic framework for cost estimation and cost control in product design. Journal of Materials Processing Technology, 103, 141-148.
Zhang, M. & Tseng, M.M., 2007. A product and process modeling based approach to study cost implications of product variety in mass customization. IEEE Transactions on Engineering Management, 54 (1), 130-144.
Working Paper - Not to Be Cited without Author Permission

Figure 1. Stages of the product development process included in the analyses presented herein
Detailed Design
Formability Engineering
FEA Simulations
Physical Validation
Fabrication Engineering
Assembly Engineering
Detailed Design
Formability Engineering
FEA Simulations
Physical Validation
Fabrication Engineering
Assembly Engineering
Working Paper - Not to Be Cited without Author Permission

Table 1. Pearson correlation matrix for formability engineer survey results.
Formability Engineering
Time
Part Complexity
Size of Part
Years of Experience
Surface Part (1-yes)
Formability Engineering
Time
0.764** 0.821** ‐0.118 0.390**
Part Complexity
0.611** 0.147 0.237
Size of Part ‐0.176 0.360**
Years of Experience
‐0.151
Surface Part (1-yes)
*p<0.1 **p<0.05
Working Paper - Not to Be Cited without Author Permission
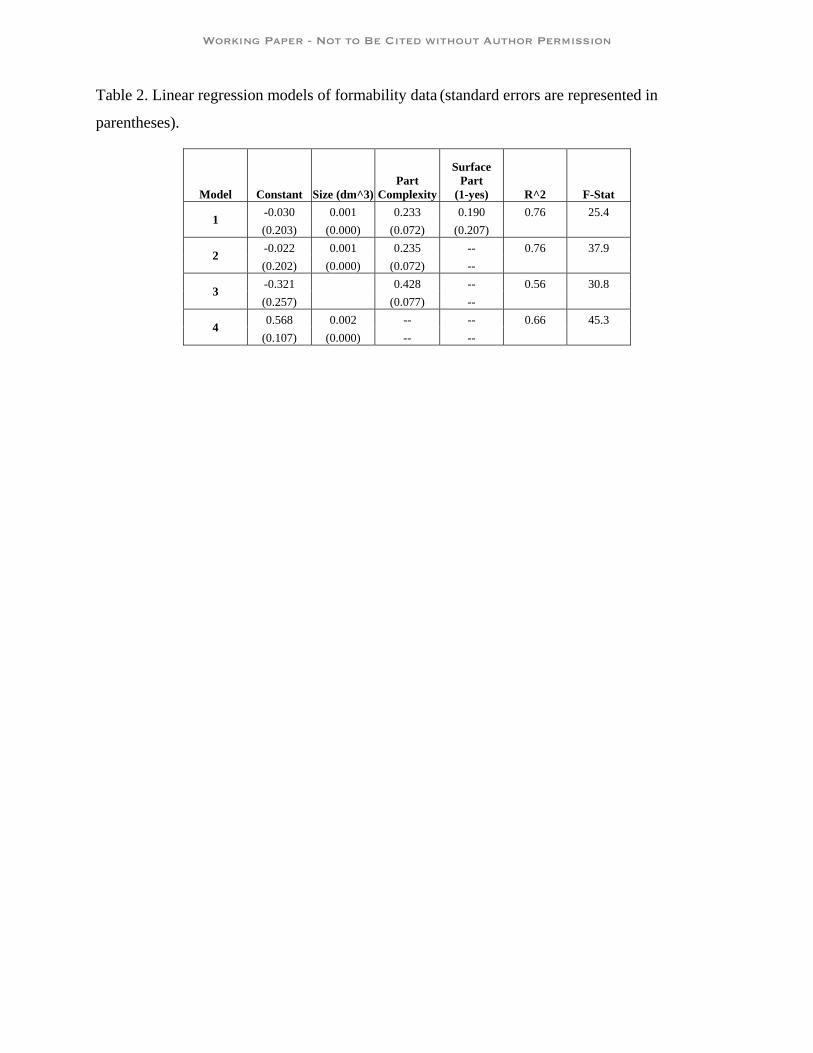
Table 2. Linear regression models of formability data (standard errors are represented in
parentheses).
Model Constant Size (dm^3)Part
Complexity
Surface Part
(1-yes) R^2 F-Stat
1 -0.030 0.001 0.233 0.190 0.76 25.4 (0.203) (0.000) (0.072) (0.207)
2 -0.022 0.001 0.235 -- 0.76 37.9 (0.202) (0.000) (0.072) --
3 -0.321 0.428 -- 0.56 30.8 (0.257) (0.077) --
4 0.568 0.002 -- -- 0.66 45.3 (0.107) (0.000) -- --
Working Paper - Not to Be Cited without Author Permission

Figure 2. Modeled and collected data for formability engineering time
Formability Engineering Time (Collected Survey Data)
3.53.02.52.01.51.0.50.0
Form
abilit
y En
gine
erin
g Ti
me
(Mod
eled
)
3.5
3.0
2.5
2.0
1.5
1.0
.5
0.0
Working Paper - Not to Be Cited without Author Permission

Figure 3. Standardized residuals vs. standardized predicted values for formability engineering
time.
Standardized Modeled Value
3210-1-2-3
Stan
dard
ized
Res
idua
l
3
2
1
0
-1
-2
-3
Working Paper - Not to Be Cited without Author Permission

Table 3. Summary of multiple linear regression analyses for various development stages (standard errors are represented in parentheses).
Intercept Size (dm3) Complexity Project
Overlap No. of Parts R2 F-Stat
Design - Main 0.230 0.002 -- -0.031 --
0.47 17.3 (0.050) (0.000) -- (0.018) --
Design - Change 0.114 0.005 -- -- --
0.82 104 (0.125) (0.000) -- -- --
Formability -0.022 0.001 0.235 -- --
0.76 37.9 (0.202) (0.000) (0.072) -- --
Fabrication -0.026 0.001 0.210 -- --
0.96 129 (0.169) (0.000) (0.061) -- --
Assembly1 -- -- 0.119 -- 0.070 0.88 65.4 -- -- (0.053) -- (0.016)
1R2 for assembly linear regression should not be compared to those which have intercepts.
Working Paper - Not to Be Cited without Author Permission

Table 4. Base model parameters.
Model Inputs
Annual Production Volume 75000 parts/yr Days per Year 235 days/yr Wage (including benefits) 50 $/hr Unit Energy Cost 0.05 $/kWhr Interest 0.1 Equipment Life 15 yr Indirect workers / Direct Worker (part fabrication) 0.25 Indirect workers / Line (part fabrication) 1 Building Unit Cost 1200 $/sqm Product Life 5 yrs Building Life 40 yrs Downtimes:
Hours Per Day 7 hrs/day Worker unpaid breaks 1 hrs/day
Worker paid breaks 1.2 hrs/day Magnesium Price $3.10 /kg Magnesium Scrap Price $2.30 /kg Steel Sheet price $0.81 /kg Steel Tube Price $1.30 /kg Steel Scrap Price $0.10 /kg
Working Paper - Not to Be Cited without Author Permission

Figure 4. Development costs for IP beam design alternatives.
$0.00$1.00$2.00$3.00$4.00$5.00$6.00$7.00$8.00$9.00
Steel IP Beam Mg IP Beam
DesignFormabilityFabricationAssembly
Working Paper - Not to Be Cited without Author Permission

Figure 5. Total costs for IP bean design alternatives.
$0
$10
$20
$30
$40
$50
Steel IP Beam Mg IP Beam
Assembly
Fabrication
Development
Working Paper - Not to Be Cited without Author Permission

Figure 6. Standalone (Var 1) and incremental costs (Var 2) for IP beam design alternatives.
$0.00
$1.00
$2.00
$3.00
$4.00
$5.00
$6.00
$7.00
$8.00
$9.00
Steel Var 1 Steel Var 2 Mg Var 1 Mg Var 2
DesignFormabilityFabricationAssembly
Working Paper - Not to Be Cited without Author Permission

Figure 7. Standalone and Incremental development lead-times for IP beam design alternatives.
0 0.2 0.4 0.6 0.8 1
Mg Var 2
Mg Var 1
Steel Var 2
Steel Var 1
DesignFormabilityFabricationAssembly
Working Paper - Not to Be Cited without Author Permission

Table 5. Tubular design summary.
Manufacturing Process Total Part Weight (kg) # of Parts Casting 48.6 10
Press Breaking 7.9 5
Roll Forming 73.2 16
Resin Transfer Molding 4.5 1
Sheet Hydroforming 13.2 2
SMC 11.7 4
Steel Stamping* 180.5 116
Tube Bending 79.1 25
Tube Hydroforming 6.9 3
Total 425.55 182
*Includes 90 Small parts
Working Paper - Not to Be Cited without Author Permission

Figure 8. Standalone and Incremental Development Costs for the tubular design.
$0
$20
$40
$60
$80
$100
$120
Convertible Sedan Incremental Sedan
Crossover Incremental Crossover
DesignFormabilityCAEValidationFabricationAssembly
Working Paper - Not to Be Cited without Author Permission

Figure 9. Standalone and Shared Costs for Sedan bodies with cost savings breakdown.
0%
10%
20%
30%
40%
50%
60%
70%
80%
90%
100%
$0
$200
$400
$600
$800
$1,000
$1,200
$1,400
Sedan Standalone
Sedan Shared
Savings
AssemblyFabricationDevelopment
Working Paper - Not to Be Cited without Author Permission