working paper no. 177
TRANSCRIPT

1
by Emilio Depetris-Chauvin and Ruben Durante | December 2017
Working Paper No. 177
One team, one nation:
Football, ethnic identity,
and conflict in Africa

Afrobarometer Working Papers
Copyright ©Afrobarometer 2017 0
Working Paper No. 177
One team, one nation: Football,
ethnic identity, and conflict in Africa
by Emilio Depetris-Chauvin and Ruben Durante | December 2017
Emilio Depetris-Chauvin is assistant professor of economics and political science at Pontificia Universidad Católica de Chile. Email: [email protected]. Ruben Durante (corresponding author) is associate professor at Sciences Po, Universitat Pompeu Fabra, Barcelona GSE, and CEPR. E-mail: [email protected].
Abstract
Do collective experiences that prime sentiments of national unity reduce interethnic tensions and conflict? We examine this question by looking at the impact of national football teams’ victories in sub-Saharan Africa. Combining individual survey data with information on official matches played between 2000 and 2015, we find that individuals interviewed in the days after a victory of their country’s national team are less likely to report a strong sense of ethnic identity and more likely to trust people of other ethnicities than those interviewed just before. The effect is sizeable and robust and is not explained by generic euphoria or optimism. Crucially, national victories do not only affect attitudes but also reduce violence. Indeed, using plausibly exogenous variation from close qualifications to the Africa Cup of Nations, we find that countries that (barely) qualified experience significantly less conflict in the following six months than countries that (barely) did not. Our findings indicate that, even where ethnic cleavages have deep historical roots, patriotic shocks can reduce interethnic tensions and have a tangible impact on conflict.
Acknowledgements
We thank Francesco Drago, Leopoldo Fergusson, Matthieu Couttounier, Quoc-Anh Do, Marcel Fafchamps, Ignacio Munyo, Wolfgang Stojetz, Jorge Tovar, Oliver Vanden Eynde, Ekaterina Zhuravskaya, Jeff Staton, and especially Leonard Wantchekon for insightful comments. We also thank seminar participants at Brown, Messina, Lausanne, Sciences Po, PSE, GWU, SMU, Universitat Autonoma de Barcelona, Nottingham, Universidad Diego Portales, Universidad de Chile, PUC Chile, Universidad Adolfo Hurtado, Universidad de Los Andes, and Universidad del Rosario, and participants in the 2017 NBER Summer Institute in Development Economics, APSA Annual Meeting, 20th Annual Conference of the SIOE, 2016 Barcelona Summer Forum, 2017 Oxford CSAE Conference, 2016 MIPP Workshop in Political Economy and Political Science, 2016 NEUDC, 2016 LACEA Meeting, 2016 RIDGE-LACEA Workshop in Political Economy, and 2016 AL CAPONE meeting for helpful discussion. Carlos Molina Guerra, Sebastian Melo, Francisco Eslava, Catalina Morales, Christine Cai, and Florin Cucu provided excellent research assistance. Emilio Depetris-Chauvin acknowledges financial support from CONICYT, FONDECYT Iniciación 11160290.

Afrobarometer Working Papers
Copyright ©Afrobarometer 2017 1
“Men and women of Côte d’Ivoire, from the North, South, Center and West:
We proved today that all Ivoirians can coexist and play together with a
shared aim: to qualify for the World Cup. We promised that the celebration
would unite the people. Today, we beg you, on our knees. ... Forgive. Forgive.
Forgive. The one country in Africa with so many riches must not descend into
war. Please lay down your weapons. Hold elections. Everything will be better."
- Didier Drogba after Côte d’Ivoire’s historic qualification
to the 2006 FIFA World Cup
1. Introduction
A vast literature has documented the detrimental effect of ethnic divisions on various
aspects of socioeconomic development. In particular, ethnically diverse communities tend
to experience more corruption and conflict, and less social cohesion, public good provision,
and growth (Easterly & Levine, 1997; Alesina, Baqir, & Easterly, 1999; Alesina & La Ferrara,
2005; Miguel & Gugerty, 2005).1 The consequences of ethnic divisions are especially severe in
Africa, where the arbitrary drawing of borders by European powers forced different
ethnicities to cohabitate (Cederman, Gleditsch, Salehyan, & Wucherpfennig, 2013;
Michalopoulos & Papaioannou, forthcoming) and where ethnic cleavages were used by
colonizers to divide and rule over the indigenous population (Mamdani, 2014; Herbst, 2014).
Two questions that remain largely unexplored are where interethnic tensions originate and
whether anything can be done to mitigate them. On the one hand, previous evidence
suggests that interethnic mistrust has deep historical roots and can be traced back to
experiences, such as the slave trade, that occurred several centuries ago (Nunn &
Wantchekon, 2011). On the other hand, other studies have shown that ethnic sentiments are
surprisingly malleable and can be primed by factors such as political competition or
propaganda (Eifert, Miguel, & Posner, 2010; Yanagizawa-Drott, 2014). Indeed, the desire to
promote interethnic cooperation by reinforcing national identity has motivated the adoption
of “nation-building” policies in various African countries after independence (Miguel, 2004).2
Yet what collective experiences can contribute to appease ethnic tensions, and how long-
lasting their impact may be, remains largely unknown.
This paper examines this question by looking at the impact of one phenomenon that spurs
nationalistic fervor like few others: football. Specifically, focusing on sub-Saharan Africa, we
test whether the victories of national football teams make people identify less with their own
ethnic group and more with the country as a whole, and can ultimately contribute to
reducing interethnic tensions and violence. Indeed, sport in general, and football in
particular, have traditionally played a key role in nation-building in Africa. As argued by
1 Two (non-mutually exclusive) sets of theories have attempted to rationalize the negative association between ethnic fractionalization and public good provision. According to some, lower public good provision in more ethnically diverse communities could be attributed to differences across ethnic groups in preferences for different types of public goods (Alesina et al., 1999), aversion to “mixing” with other ethnic groups (Alesina & La Ferrara, 2005), and/or preferences for public goods that benefit one’s own ethnic group (Vigdor, 2002). Other theories have instead emphasized the importance of social sanctions and community pressure in sustaining collective action; because social interactions are less frequent between members of different ethnic groups, social sanctions that discourage free-riding are harder to enforce in less ethnically homogeneous communities. 2 Examples of such policies include the change of the country’s name (Zimbabwe, Burkina Faso), of the capital city (Tanzania, Malawi, Nigeria), or of the national currency (Ghana, Angola); the introduction of military conscription; the promotion of national services (Zambia, Nigeria); the imposition of religious and linguistic homogenization (Sudan, Mauritania, Tanzania); the introduction of non-ethnic censuses (Ghana, Malawi, Tanzania); and the nationalization of land (Ghana, Tanzania, Sudan). For a comprehensive survey of these policies and a discussion of their mixed results, see Bandyopadhyay and Green (2013).

Afrobarometer Working Papers
Copyright ©Afrobarometer 2017 2
Darby (2002), football has greatly contributed to “construct a sense of national identity and
to create a feeling of bonded patriotism cutting across tribal and ethnic allegiances.” An
eminent example of the unifying power of football is represented by the historic qualification
of Côte d’Ivoire for the 2006 FIFA World Cup under the charismatic leadership of Didier
Drogba, which many argue helped pave the way to a peaceful solution of the civil war that
had ravaged the country for more than five years (Stormer, 2006; Mehler, 2008).3
We aim to examine how the success of national football teams in important international
competitions influences the strength of ethnic identification, attitudes toward people of
other ethnicities, and actual interethnic violence. To do so, we combine different empirical
approaches and use data from a variety of sources. First, to study the impact of national
teams’ victories on individual attitudes, we combine survey data from four waves of
Afrobarometer with information on more than 70 official matches by African teams played
between 2000 and 2015. In this case, our identification strategy exploits plausibly exogenous
differences in the timing of the interviews relative to the timing of the matches. In particular,
we compare self-reported attitudes of individuals interviewed in the days immediately before
a victory of their national team and of individuals interviewed in the days immediately after.
Since our regressions control for country×year, language group (a proxy for ethnicity)×year,
and, in the most demanding specification, country×match fixed effects, we identify the
effect from comparing individuals with the same ethnic background, interviewed in the
same country, in the same period, but respectively before and after a given match, two
groups that, we show, are comparable along most dimensions.
Applying this approach to more than 28,000 respondents in 18 countries, we find that
individuals interviewed after a national team’s victory are 4% less likely to report a strong
sense of ethnic identity than those interviewed just before the match. This effect is sizeable,
corresponding to a 20% decrease in the average probability of ethnic self-identification.
Furthermore, the effect does not appear to be particularly short-lived; in fact, it is quite
persistent within the limited time window for which data are available (i.e. up to 30 days
before and after the match), and becomes even larger several days after the match.
Additional results further support the view that the victory of the national team – perceived
as a successful collective venture – galvanizes national supporters and tilts the balance
between ethnic and national identity in favour of the latter. First, only a victory, and not the
mere occurrence of an important match, affects ethnic sentiments. Second, the effect is
driven only by victories in high-stakes official games (i.e. Africa Cup of Nations and FIFA World
Cup qualifiers and finals), while friendly matches are inconsequential. Third, the effect is
substantially larger for victories against traditional rivals, which are likely to trigger a stronger
emotional reaction. Fourth, the effect is similar for victories in home and away games, which
indicates it is not driven by respondents’ direct participation in the event. Interestingly, while
national teams’ wins weaken ethnic identification, defeats do not seem to have any
significant effect.
These results are further corroborated by the fact that post-match respondents are also
significantly more likely to trust other people, particularly members of other ethnicities.
Crucially, respondents’ lower emphasis on ethnic identity and higher trust in others do not
merely reflect a generally positive mood due to post-victory euphoria. In fact, we find no
effect of national teams’ victories on either trust in the ruling party or approval for the
incumbent, a result that suggests that politicians’ effort to use national teams’ achievements
to boost their own popularity may not pay off. Furthermore, we find that national teams’
victories do not affect respondents’ optimism about their own or the country’s economic
3 Another notable example is represented by the unexpected success of the South African national rugby team – the Springboks – in the 1995 Rugby World Cup, which President Nelson Mandela masterfully exploited in his effort to build a common national identity and bridge racial divisions in the immediate post-apartheid period.

Afrobarometer Working Papers
Copyright ©Afrobarometer 2017 3
prospects.4 We then explore whether, in addition to people’s attitudes, national teams’
victories have a tangible impact on violence and conflict. To do so, we combine the football
data with data on the occurrence and severity of political violence events available from
the Armed Conflict Location & Event Data Project (ACLED) for the period 1997-2014. To
investigate the impact of national teams’ success on violent conflict, and how persistent this
effect may be, we resort to a different empirical strategy that allows us to analyze the
evolution of conflict over a longer time span. Our approach exploits the quasi-randomness of
the qualification for the final tournament of the Africa Cup of Nations (ACN) for teams that,
prior to the last game of the group stage, could still qualify. In other words, for each two
teams in the same group that, prior to the very last game, could still qualify, we attribute the
one that actually qualified to the treatment group and the one that barely failed to do so to
the control group. We then compare the evolution of conflict in the six months before and
after the (missed) qualification for countries in the two groups, which, we show, are ex ante
comparable along many dimensions. Our results indicate that countries whose teams
(barely) qualified for the ACN tournament experience significantly less conflict in the
following six months than countries whose teams (barely) did not. This effect is sizeable and
significant, and robust to controlling for country×qualifier and week fixed effects, as well as
for the intensity of conflict in the months prior to qualification. Interestingly, the effect is
stronger for teams that had never qualified before or that had not qualified in a long time,
and whose success was rather unexpected.5 Crucially, the reduction in conflict intensity that
follows a successful qualification campaign appears to be quite persistent, up to several
months after the event.
Taken together, our findings indicate that successful collective experiences – such as
important sport victories – can be effective at priming sentiments of national unity and at
attenuating even deeply-rooted ethnic mistrust, with tangible effects on violence. Though
the effect of these events is likely to be transient, our results suggest that it may last long
enough to open a precious window of opportunity for political dialogue, negotiations, and
reforms capable of producing long-lasting improvements.
Our research contributes to various streams of literature. First, it relates to previous work on the
determinants of ethnic identification that indicates that the strength of ethnic identification
may be malleable by factors such as electoral competition or economic modernization
(Eifert et al., 2010; Robinson, 2014). Yet, due to data limitations and identification issues, it has
been difficult for these contributions to go beyond correlations and draw causal conclusions.
Our paper fills this gap by providing robust causal evidence that the patriotic sentiments
primed by important sport events can affect the strength of ethnic identity.
Our paper also relates to previous work on the determinants of interpersonal trust that has
documented how historical episodes, such as the slave trade, the introduction of the
Napoleonic civil code, or the East German system of mass surveillance, had long-lasting
effects on contemporary trust attitudes (Nunn & Wantchekon, 2011; Buggle, 2016; Jacob &
Tyrell, 2010). Our findings indicate that other, more transitory factors can also have a
substantial impact on trust attitudes, particularly toward people of other ethnicities. In this
respect, our results are especially related to recent work by Robinson (forthcoming), who
4 To better interpret our findings on respondents’ attitudinal changes, we relate them to previous work in social psychology that has discussed various ways in which sport results may influence social identity. 5 Our finding that unexpected results are more consequential than expected ones is in line with previous evidence on the effect of sport events on various outcomes. For example, in their study on the impact of games in the U.S. National Football League on intra-household violence, Card and Dahl (2011) find that upset losses are associated with a 10% increase in violence toward female partners while expected losses have no impact. Similarly, Munyo and Rossi (2013) find that upset losses increase violent property crime whereas unexpected victories strongly reduce it, though both effects are extremely short-lived and mainly due to incapacitation.

Afrobarometer Working Papers
Copyright ©Afrobarometer 2017 4
shows that manipulating the salience of national identity in a “lab-in-the-field” experiment
improves interethnic trust, and by Miguel (2004), who argues that nation-building policies can
improve interethnic cooperation.
Finally, our work contributes to the vast literature on the determinants of civil conflict by
documenting that priming national identity can contribute to reducing violence.
2. Data
2.1 National football teams’ matches
We collect information on all official matches played by men’s national teams of various sub-
Saharan African countries over the period 1990-2015; these data are available from the FIFA
statistical office.6 In particular, we focus on matches played for both the qualifying and the
tournament phases of the two most important competitions for African national football
teams: the Africa Cup of Nations (ACN) and the FIFA World Cup (WC).7 For each match, we
have information on the date, the location, the opponent, the competition, the phase, and
the final score. We use the date of the match to combine the data with both the individual
survey data and the conflict data described below. Overall, for the individual-level analysis,
we use information from nearly 70 official matches played between 2002 and 2013 while
Afrobarometer surveys were administered. For the country-level conflict analysis, we also
collect information on teams’ standings in nine ACN qualifying rounds between 1997 and
2013. In particular, we record all teams’ standings before and after the final match of the
group stage to identify teams that, prior to the last game, could still qualify for the
tournament phase and, among these, those that eventually did and did not.8
2.2 Survey data on individual attitudes
We use individual survey data from four waves of Afrobarometer conducted between 2002
and 2013. Afrobarometer is a series of nationally representative surveys covering many
African countries. Interviews are conducted in the national and local languages, and
questions are standardized so that responses can be compared across countries. Questions
are designed to assess respondents’ attitudes on a range of issues, including democracy,
political actors, markets, and civil society. For our analysis, we focus on questions regarding
individuals’ identification with the nation and with their own ethnic group, and trust in others,
particularly in people from other ethnicities. In addition, we use information on a range of
respondents’ personal characteristics, with particular regard to the main language spoken at
home, which, following Eifert et al. (2010), we use as a proxy for ethnic background.9 Overall,
we use data from 47 surveys conducted in 24 sub-Saharan African countries.
Our main outcome variable is a measure of ethnic identification, which captures the strength
of an individual’s ethnic identity relative to national identity. The variable is based on
responses to the following question: “Let us suppose that you had to choose between being
a [National] and being a [Respondent’s ethnic group]. Which of these two groups do you
feel most strongly attached to?” While Round 2 Afrobarometer survey respondents could
only choose between the options “national identity” and “group identity,” in rounds 3-5 they
6 We disregard countries from the Maghreb region because, for these countries, Afrobarometer surveys do not include questions on attitudes regarding ethnic identity. 7 We also collect information on friendly matches, which we use for a robustness check reported below. 8 The qualification phase for the 2013 ACN did not involve a group stage but sequential two-legged knockout pairs. We thus consider in our analysis only the last two-legged knockout stage. However, our quantitative and qualitative results do not depend on the inclusion of the 2013 qualification phase. 9 Language is the best available proxy for ethnic background since the Afrobarometer questionnaires did not systematically include explicit questions on the respondent’s ethnicity.

Afrobarometer Working Papers
Copyright ©Afrobarometer 2017 5
could pick any of the following five options: 0 (“only [National]”), 1 (“more [National] than
[Ethnic group]), 2 (“equally [National] and [Ethnic group])”, 3 (“more [Ethnic group] than
[National]”), and 4 (“only [Ethnic group]”). In order to compare respondents’ answers across
rounds, we construct a binary measure of ethnic identity that takes value 1 for all
respondents in Round 2 who chose the option “group identity” and for all respondents in
rounds 3-5 who reported feeling “only [Ethnic group]” or “more [Ethnic group] than
[National].”
In Figure 1 we plot the share of respondents who reported stronger ethnic than national
identity, separately for the sample of countries and years we exploit in our analysis. As shown,
the relative strength of ethnic identity varies considerably across countries, and even in the
same country over time, possibly also due to the impact of the type of major sport events we
investigate. One suggestive example in this regard is Mali, where more than 30% of the
individuals interviewed in 2002 emphasized ethnic over national identity, but where less than
15% did so in 2013, when the Malian national football team achieved third place in the Africa
Cup of Nations, its best performance in the history of the competition.10 The strength of ethnic
identity appears to be lower and more stable in other countries; for example in Tanzania, a
country known for its effective nation-building policies (Miguel, 2004), less than 10% of
respondents in any round emphasized ethnic over national identity.
Figure 1: Ethnic identification over time and across countries
10 Similarly, the typically high share of Zambians who report a strong sense of ethnic identification was greatly reduced in 2013, a year after the country’s historic and unexpected victory in the 2012 ACN. Incidentally, the finals took place in Libreville near the place where, 20 years earlier, most of the Zambian national football team died in an air crash, a circumstance that further strengthened the emotional valence of the victory.

Afrobarometer Working Papers
Copyright ©Afrobarometer 2017 6
To explore the impact of national teams’ victories on respondents’ trust in others, we use four
additional variables. First, we construct a measure of generalized trust computed as the
average score on four questions regarding trust in i) relatives, ii) other acquaintances, iii)
neighbours, and iv) compatriots, all defined on a four-point scale ranging from 0 (“not at all”)
to 3 (“a lot”). Second, using questions on respondents’ trust in people within and outside their
own ethnic group, we construct measures of interethnic and intra-ethnic trust, also defined
over the same four-point scale, as well as a measure of interethnic trust premium given by
the difference between the two.11 To assess the effect of national teams’ victories on support
for the government, we code two additional variables: trust in the ruling party (with answers
ranging from 0 “not at all” to 3 “a lot”) and approval of the president (with answers ranging
from 1 “strongly disapprove” to 4 “strongly approve”). Finally, to examine whether victories
influence respondents’ overall mood, we code two measures of respondents’ assessment of
their current living conditions and of the country’s economic situation (indicating 1 for "fairly
good" and "very good" and 0 otherwise) and two measures of how they expect these
conditions to evolve in the future (indicating 1 for "better" and "much better" and 0
otherwise).
2.3 Country-level conflict data
To study the impact of national teams’ victories on actual violence, in the last part of our
analysis we use country-level data on conflict from the Armed Conflict Location % Event
Data Project (ACLED). The data, available for the period 1997-2013, include information on
the date and location of any episode of political violence, i.e. battles, killings, or riots that
involve the government, rebel groups, militias, or civilians. The data also include information
on the severity of the events, measured by the number of associated fatalities. Based on this
information, we construct three measures of conflict intensity at the countryweek level: i) a
dummy for whether any conflict event occurred, ii) the number of conflict events that
occurred, and iii) the number of fatalities associated with these events. We also construct
analogous measures specifically for ethnicity-related conflict. Though the ACLED data do not
explicitly distinguish between ethnic and non-ethnic conflict, some of the information in the
ACLED records can be used to indirectly make this distinction. Specifically, we code as
ethnically relevant conflict any event that involves the participation of actors who are
classified as ethnic militia or whose denomination refers to an ethnic faction (e.g. “Bete
ethnic group”), or any event for which the ACLED records include a specific reference to
ethnic tensions as a cause of violence. Such a procedure is of course vulnerable to
substantial measurement error, namely to the risk of coding as non-ethnic episodes that are
in fact driven by ethnic motives. Yet, to the extent that it affects the dependent variable and
is unrelated to the timing of qualification, measurement error should only reduce the
precision of our estimates. According to our classification, about 6% of the observations in our
sample can be classified as ethnicity-related (i.e. observations for which at least one
ethnicity-related conflict event occurred in a given country in a given week). Summary
statistics of the measures of conflict used in our analysis are reported in Appendix Table A.5.
3. Individual-level analysis: Empirical strategy and results
Our empirical strategy to estimate the impact of national teams’ victories on individual
attitudes is summarized by the following equation:
𝑂𝑢𝑡𝑐𝑜𝑚𝑒𝑖,𝑒,𝑐,𝑡 = 𝛼 + 𝛽𝑃𝑜𝑠𝑡𝑉𝑖𝑐𝑡𝑜𝑟𝑦𝑐,𝑡 + γ𝑋𝑖 + Γ𝑐,𝑡 + Δ𝑒,𝑡 + 휀𝑒,𝑡 (1)
where i, e, c, and t denote respectively individual, language group (a proxy for ethnicity),
country, and year. Outcome is one of the attitudinal variables described in the previous
11 Because the question on interethnic trust was only included in Afrobarometer Round 3, the analysis on this aspect relies on a substantially smaller sample.

Afrobarometer Working Papers
Copyright ©Afrobarometer 2017 7
section; post-victory is the main regressor of interest and takes value 1 if the respondent was
interviewed in the days after a victory of her national team in an official match, and 0
otherwise; Xi is the vector of baseline individual controls (i.e. education, gender, age, age
squared, unemployment status, and an indicator for living in a rural area); Γ and ∆ are
country×year and language group×year fixed effects, respectively; 휀𝑒,𝑡 is an error term that is
heteroskedasticity-robust and is clustered by language group×year.
We also estimate an alternative and more demanding specification summarized by the
following equation:
𝑂𝑢𝑡𝑐𝑜𝑚𝑒𝑖,𝑒,𝑐,𝑚,𝑡 = 𝛼 + 𝛽𝑃𝑜𝑠𝑡𝑉𝑖𝑐𝑡𝑜𝑟𝑦𝑐,𝑚,𝑡 + γ𝑋𝑖 + Θ𝑐,𝑚 + Δ𝑒,𝑡 + 휀𝑒,𝑡 (2)
where m denotes the match and Θ𝑐,𝑚 the country×match fixed effects. Hence, while when
estimating Equation (1) we identify the effect of post-victory by comparing respondents
interviewed after any victory of their national team in a given year with all other respondents
of the same country and language group interviewed in the same year, with Equation (2) we
compare respondents interviewed after a given match with others of the same country and
language group interviewed before the same match.
We mainly focus on the sample of individuals interviewed in the 15 days before and after
official matches of their national football team. We consider, in particular, the sample of
respondents exposed to only one match, which includes more than 28,000 individuals in
treatment and control groups. For purposes of robustness, we also look at the larger sample
of respondents potentially exposed to one or more matches, which includes more than
35,000 individuals. Descriptive statistics for the first sample for all variables used in our analysis
are presented in Appendix Table A.1 Half of the individuals were exposed to a match in the
15 days prior to being interviewed. Roughly 18% of them experienced a victory, while 22%
and 10% saw their national team losing and drawing, respectively.12
Our identification strategy relies on the quasi-random nature of the date and final result of
matches relative to the timing of the Afrobarometer interviews. Hence, our identifying
assumption is that national teams’ matches did not interfere with the implementation of the
survey, or, more precisely, that victorious matches did not interfere differently than non-
victorious ones. Such a possibility seems especially unlikely since, as emphasized by Eifert et
al. (2010), the logistics involved in the implementation of the Afrobarometer survey –
selection of the enumeration sites, setting up of the field teams, etc. – require many months
of preparation and are hardly related to the occurrence of sport events, let alone to their
unpredictable results.
To assess the validity of our identification strategy, we conduct a balance test for several
respondent characteristics that may potentially correlate with the timing of the interview and
the outcomes of interest. These include gender, education, age, unemployment status,
religious membership, whether the respondent belongs to the country’s ethnic majority,
whether (s)he lives in a rural area, and whether (s)he lives in an area where basic public
goods are available.13 To control for the possibility of social desirability bias, we also test to
ensure that several characteristics of the interviewer are not systematically different between
treatment and control groups. These include gender, education, whether the interviewer
speaks the same language as the respondent, and whether the interviewer thought anyone
12 In a robustness exercise, we increase the length of the time window to 30 days before and after a match. In that case, the sample size increases to nearly 44,000. 13 Evidence suggests that these characteristics can potentially affect ethnic sentiments. For instance, Robinson (forthcoming) shows that urban status, education, gender, and formal employment all positively predict national (relative to ethnic) identification. Regarding age, however, Eifert et al. (2010) find no evidence that young people are more likely to self-identify in ethnic terms.

Afrobarometer Working Papers
Copyright ©Afrobarometer 2017 8
influenced the respondent during the interview.14 Specifically, we perform two balance tests:
one comparing individuals interviewed before and after a match, regardless of the outcome
of the match (i.e. Played), and another one comparing individuals interviewed before and
after a victory. To ensure that we compare respondents from the same country interviewed
around the same match, we regress each variable on either treatment including
country×match fixed effects, and cluster standard errors at the same level. The results are
reported in Table 1.
Table 1: Balance in covariates
Panel A: Played Panel B: Victory
Covariate N Estimate Std. error Estimate Std. error
Male 28,758 0.006 0.004 0.009* 0.005
Education 28,758 -0.213 0.134 -0.291* 0.153
Age 28,758 0.799 0.687 1.109 0.777
Unemployed 28,758 0.003 0.015 -0.008 0.014
Major ethnicity 28,758 -0.024 0.055 -0.028 0.041
Rural 28,758 -0.002 0.009 -0.007 0.010
Religious group member 28,647 -0.025 0.020 -0.020 0.026
Public goods 28,758 0.007 0.024 -0.021 0.017
Same language 28,758 -0.046 0.038 -0.022 0.045
Influenced by others 28,710 -0.002 0.006 -0.000 0.008
Male interviewer 28,758 -0.002 0.014 -0.005 0.018
Education 28,728 -0.037 0.052 -0.072 0.062
Interviewer’s age 28,758 0.109 0.118 0.194 0.141
*** p<0.01, ** p<0.05, * p<0.1 Robust standard errors in parentheses clustered at country-match level.
Each panel presents point estimates and standard errors for 13 regressions of a covariate (listed at the
left) on Played (Panel A) and Victory (Panel B). Played takes value 1 if the respondent was interviewed
within 15 days after a game (regardless of the result), 0 otherwise. Victory takes value 1 if the
respondent was interviewed within 15 days after a victory, 0 otherwise. All estimates are based on OLS
regressions using 55 country-match dummies to ensure that the comparison in the covariates is made
between respondents in the proximity of the same game and in the same country.
We first show that individual characteristics are largely balanced between respondents
interviewed before and after the same match (Panel A). The same pattern holds when
comparing individuals interviewed before and after a victory of the national team (Panel B).
The only exceptions are education and gender, but the marginally significant differences in
these two variables between treatment and control group are very small: On average,
individuals interviewed after a victory were only 0.9% more likely to be men than women and
displayed lower educational attainment by just 12% of a standard deviation (or 8% of its
mean value). Furthermore, the potential biases from these imbalances are likely to operate
against finding an effect, since men and less educated people generally tend to display
higher levels of ethnic identification (Robinson, 2014). In any event, in all the regressions
presented below, we control for the entire set of respondents’ individual characteristics,
14 A large literature argues that interviewers’ observable traits such as race, ethnicity, and gender can influence respondents’ answers (see West and Blom (2017) for a summary). In particular, using Afrobarometer data, Adida, Ferree, Posner, and Robinson (2016) find that respondents give systematically different answers to coethnic and non-coethnic interviewers.

Afrobarometer Working Papers
Copyright ©Afrobarometer 2017 9
though their inclusion does not affect our results. Finally, regardless of whether they are
defined based on all matches or just victorious ones, treatment and control groups are also
balanced with respect to all interviewer-related variables.
3.1 Results: National teams’ victories and ethnic identification
In Table 2 we test the empirical relationship between national teams’ victories and ethnic
identification on the baseline sample of all respondents exposed to just one match. In
Column 1 we regress the dummy for stronger ethnic than national identity on a dummy for
being interviewed after a victory, controlling for country-year dummies. The inclusion of
country×year fixed effects allows us to control for all country-level confounders that vary
between years, such as political or economic events (e.g. national elections, ethnic conflicts,
nationwide economic policies, yearly variation in commodity prices).
Table 2: National teams’ victories and ethnic identification
*** p<0.01, ** p<0.05, * p<0.1 Robust standard errors in parentheses in columns 1 and 2, clustered by
language group×year in the other columns. Sample includes respondents interviewed within 15 days
before and after an official game. Post-victory, Post-draw, and Post-defeat take value 1 if the
respondent was interviewed in the 15 days after a victory, a draw, or a loss, respectively, and 0
otherwise.
The results indicate that national teams’ victories have a significant negative effect on the
probability of self-identifying with one’s own ethnicity as opposed to the country as a whole.
The coefficient becomes slightly larger and more significant in Column 2 when we include
Dependent variable: Ethnic over national identity (0-1 dummy)
(1) (2) (3) (4) (5) (6)
OLS OLS OLS OLS OLS Probit
Post-victory -0.017**
(0.008)
-0.020**
(0.008)
-0.044***
(0.014)
-0.036**
(0.014)
-0.036**
(0.014)
-
0.165**
(0.065)
Post-draw -0.004
(0.031)
Post-defeat -0.014
(0.016)
Country×year FE Yes Yes Yes No No No
Individual controls No Yes Yes Yes Yes Yes
Language×year FE No No Yes Yes Yes Yes
Country×match FE No No No Yes Yes Yes
Observations 28,758 28,758 28,758 28,758 28,758 27,118
R-squared 0.059 0.070 0.116 0.116 0.116 —
Afrobarometer Working Papers
Copyright ©Afrobarometer 2017 10
the baseline set of individual controls. Results are even stronger and more significant in
Column 3 when we include language group×year fixed effects and cluster standard errors at
the same level. The estimated effect is quite large: Individuals interviewed after national
teams’ victories are 4.4% less likely to report a strong sense of ethnic identity than other
respondents of the same language group interviewed just before; this corresponds to a more
than 20% decrease in the average probability of ethnic self-identification. In Column 4 we
include country×match fixed effects, hence restricting the comparison to compatriots
interviewed before and after the same victorious game of their national team. Even under
this more restrictive specification, the magnitude and significance of the coefficient of
interest remain largely unchanged. In Column 5 we examine the effect of different results of
national teams’ matches; the results indicate that while the successful performance of the
national team weakens national identity, losing or drawing a match has no particular effect.
The lack of an effect of national teams’ defeats is especially interesting, as it suggests that
negative collective experiences do not necessarily undermine national unity. Finally, in
Column 5 we show that the results are qualitatively similar when estimating a non-linear
probit model instead of the linear probability model used in the previous columns.15
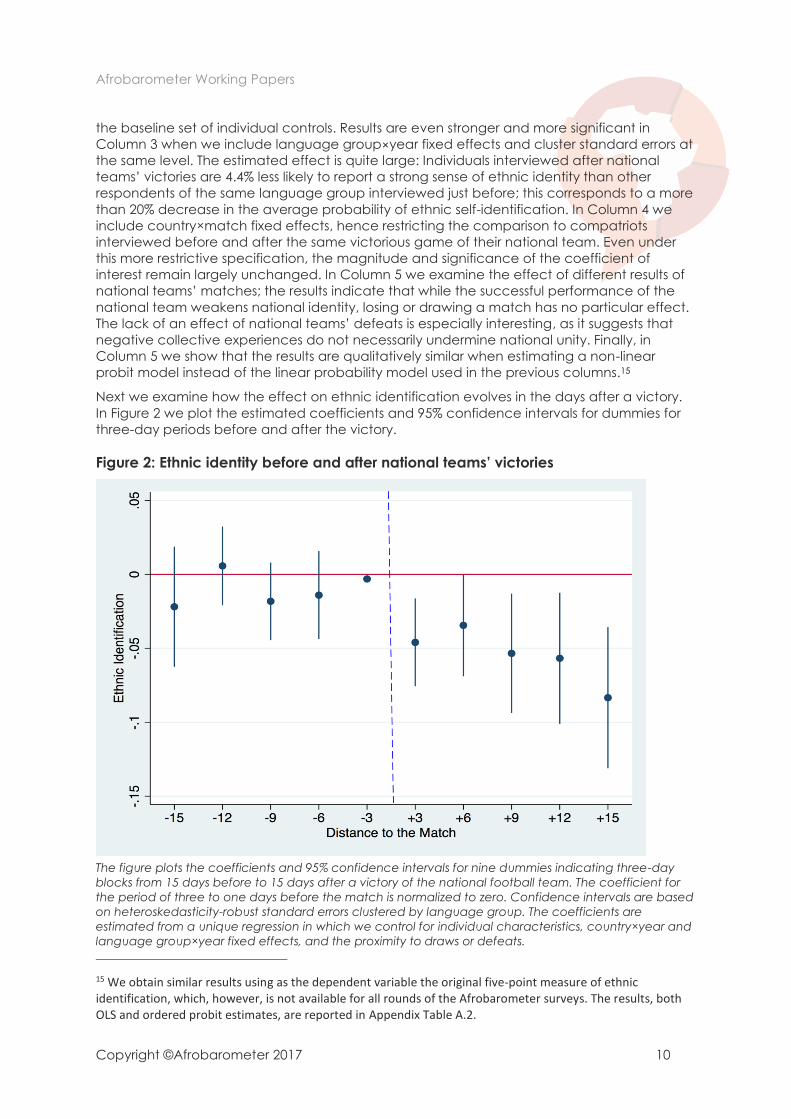
Next we examine how the effect on ethnic identification evolves in the days after a victory.
In Figure 2 we plot the estimated coefficients and 95% confidence intervals for dummies for
three-day periods before and after the victory.
Figure 2: Ethnic identity before and after national teams’ victories
The figure plots the coefficients and 95% confidence intervals for nine dummies indicating three-day
blocks from 15 days before to 15 days after a victory of the national football team. The coefficient for
the period of three to one days before the match is normalized to zero. Confidence intervals are based
on heteroskedasticity-robust standard errors clustered by language group. The coefficients are
estimated from a unique regression in which we control for individual characteristics, country×year and
language group×year fixed effects, and the proximity to draws or defeats.
15 We obtain similar results using as the dependent variable the original five-point measure of ethnic identification, which, however, is not available for all rounds of the Afrobarometer surveys. The results, both OLS and ordered probit estimates, are reported in Appendix Table A.2.

Afrobarometer Working Papers
Copyright ©Afrobarometer 2017 11
The coefficients are estimated from a unique regression in which we control for individual
characteristics, country×year and language group×year fixed effects, and the proximity to
draws or defeats.16 Since we normalize the coefficient for the three days before the victory to
zero, the other coefficients indicate how ethnic identification changes over time relative to
the eve of the event. The figure confirms that individuals are less likely to report a strong sense
of ethnic identification after a victory of the national team, and indicates that the effect
persists and, if anything, becomes stronger several days after the match. In contrast, ethnic
identification does not seem to evolve in any particular way in the days prior to the match.
We also test that our baseline results – based on a 15-day window before and after a victory
– are robust to the choice of alternative time windows. In Table 3, we estimate our baseline
specification with country×match fixed effects on the sample of respondents interviewed in
the five, 10, 20, 25, and 30 days before and after a match. The results indicate that,
regardless of which time window is selected, the effect of national teams’ victories on ethnic
sentiments is remarkably stable, with a somewhat larger coefficient when focusing on the
days immediately before and after the match.
Table 3: Alternative time windows
Dependent variable: Ethnic over national identity (0-1 dummy)
(1) (2) (3) (4) (5) (6)
+/-15 days +/-5 days +/-10 days +/-20 days +/-25 days +/-30 days
Post-victory -0.036**
(0.014)
-0.039***
(0.014)
-0.031**
(0.014)
-0.035**
(0.014)
-0.035**
(0.014)
-0.035**
(0.014)
Country×match FE Yes Yes Yes Yes Yes Yes
Individual controls Yes Yes Yes Yes Yes Yes
Language×year FE Yes Yes Yes Yes Yes Yes
Observations 28,758 10,901 19,438 32,785 38,459 43,600
R-squared 0.116 0.150 0.124 0.109 0.108 0.110
*** p<0.01, ** p<0.05, * p<0.1 Robust standard errors clustered by language group×year in parentheses.
Post-victory takes value 1 if the respondent was interviewed in the x days following a victory of the
national team, with the value of x indicated at the top of each column, and 0 otherwise.
We then explore which types of victories are more likely to affect the strength of ethnic
sentiments. In particular, we examine whether the stakes, the emotional valence, the
location, the margin of victory, and the entertainment value of the match matter. In the first
column of Table 4, we start by looking at whether ethnic identity is also affected by victories
in friendly games, and how this compares to the impact of victories in official matches
documented above. The results indicate that victories in friendly matches have virtually no
effect on ethnic identification, consistent with the view that low-stakes games are less
effective than high-stakes matches at spurring patriotic fervor. We next test the hypothesis
that victories against traditional rivals are more consequential than other victories. To do so,
we interact our post-victory variable with an indicator of rivalry. The results indicate that,
though all victories negatively affect ethnic identification, the effect is considerably larger for
victories against traditional rivals, which arguably trigger a stronger emotional reaction. In
16 Appendix Figure A.1 reports the coefficients obtained when including country×match instead of country×year fixed effect; the coefficients are very similar in magnitude though somewhat less precisely estimated due to the lower statistical power.

Afrobarometer Working Papers
Copyright ©Afrobarometer 2017 12
Column 3 we focus on the heterogeneous effect of victories in matches played at home. The
facts that the interaction term is not statistically significant and that post-victory is still
associated with a significant decline in ethnic identification suggest that the effect is not
driven by people’s direct participation in the event but rather by the resulting wave of
nationalistic fervor. In Column 4 we examine whether winning by a large margin boosts pride
in the national team and reduces ethnic identification even further. To do so, we interact the
post-victory dummy with a dummy for whether the team won by two goals or more (i.e. the
top 20% of the distribution). The large and negative coefficient on the interaction term,
though marginally insignificant (p-value: 0.14), provides some support for this hypothesis.
Finally, in Column 4, we examine whether victories in games in which a large number of goals
were scored are associated with a larger reduction in ethnic identification. This exercise
allows us to test whether our baseline effect is driven by enthusiasm for witnessing a
particularly spectacular game rather than a genuine increase in national pride. We find that
the interaction between the post-victory dummy and the number of total goals scored is
small and insignificant, a result that provides little support for this alternative hypothesis.
Table 4: National teams’ victories and ethnic identity: Stakes, location, margin of
victory, and entertainment value
Dependent variable: Ethnic over national identity (0-1 dummy)
(1) (2) (3) (4) (5)
Post-victory 0.010
(0.012)
-0.030**
(0.014)
-0.036**
(0.014)
-0.032**
(0.015)
-
0.033**
(0.016)
Post-victory×rivalry -0.090*
(0.051)
Post-victory×home game 0.014
(0.028)
Post-victory×wide margin -0.043
(0.029)
Post-victory×= # goals in
game -0.005
(0.009)
Individual controls Yes Yes Yes Yes Yes
Language FE Yes Yes Yes Yes Yes
Country×match FE Yes Yes Yes Yes Yes
Sample Friendly
games Baseline Baseline Baseline Baseline
Observations 28,767 28,758 28,758 28,758 28,758
R-squared 0.093 0.116 0.117 0.117 0.116
*** p<0.01, ** p<0.05, * p<0.1 Robust standard errors clustered at the language group level in
parentheses. Post-victory takes value 1 if the respondent was interviewed within 15 days after a victory,
0 otherwise.
Finally, we analyze whether certain segments of the population are more responsive to the
patriotic influence of national teams’ victories. In particular, interacting the dummy post-
victory with various individual characteristics, we test whether the effect is larger for men vs.
women, for younger vs. older cohorts, for more vs. less educated individuals, for people in

Afrobarometer Working Papers
Copyright ©Afrobarometer 2017 13
urban vs. rural areas, and for people belonging to the largest ethnic group in the country.
The results, presented in Appendix Table A.4, indicate that none of these attributes is
associated with a stronger effect of national teams’ victories, which suggests that important
sport achievements influence the public as a whole and not just sport fans or people who
are more likely to have a coethnic on the national team. An important exception is the
interaction with rural status, which displays a significant positive coefficient of a magnitude
similar to the coefficient on the post-victory dummy; this implies that, for individuals in rural
areas, the effect of national teams’ victories is virtually zero.
3.2 National teams’ victories and interethnic trust
We then examine whether national teams’ victories also affect individual propensity to trust
others, particularly people from other ethnicities. First, we look at the effect of victories on
trust toward other people in general. In Column 1 of Table 5, we estimate our baseline
specification with country×match fixed effects using generalized trust as the dependent
variable.
Table 5: National teams’ victories and trust in others
(1) (2) (3) (4) (5)
Generalized
trust
Interethnic
trust
Interethnic
trust
Interethnic
trust premium
Interethnic
trust premium
Post-victory 0.114***
(0.032)
0.253**
(0.106)
0.145***
(0.038)
0.047*
(0.028)
0.076**
(0.033)
Generalized trust 0.587***
(0.030) -0.154***
(0.016)
Country×match FE Yes Yes Yes Yes Yes
Individual controls Yes Yes Yes Yes Yes
Language×year FE Yes Yes Yes Yes Yes
Observations 25,475 7,992 7,990 7,979 7,977
R-squared 0.242 0.196 0.392 0.056 0.079
*** p<0.01, ** p<0.05, *p<0.1. Robust standard errors clustered at the language group×year level in
parentheses. Post-victory takes value 1 if the respondent was interviewed during the 15 days after a
victory, 0 otherwise. Generalized trust is the average level of trust in relatives, other acquaintances,
other compatriots, and neighbours. Interethnic trust is the self-reported score of trust in people of other
ethnicities, while interethnic premium is the difference between the latter and trust in coethnics.
The results indicate that, following a victory of the national team, individuals tend to
generally trust others more. In Column 2 we test whether this effect is stronger for interethnic
trust, using as dependent variable the self-reported measure of trust in people of other ethnic
groups. Again the coefficient on post-victory is negative and significant; furthermore, it is
larger than the one for generalized trust, which suggests a stronger effect on trust outside
one’s own ethnicity. The estimated coefficient is economically meaningful, since it represents
an increase in trust equivalent to one-fifth of its mean value in our sample.17 This result is
confirmed by the fact that the coefficient on post-victory remains large and significant even
17 The implied standardized beta coefficient is 0.05. This effect is quite large compared to other determinants of trust examined in the literature. For example, it corresponds to more than half the long-term effect of slave trade on interethnic trust estimated by Nunn and Wantchekon (2011).

Afrobarometer Working Papers
Copyright ©Afrobarometer 2017 14
when we explicitly control for generalized trust (Column 3). To further test for the larger effect
on trust across rather than within ethnic groups, in columns 4 and 5 we use as dependent
variable a measure of interethnic trust premium, given by the difference between trust
outside and within one’s own ethnic group. Consistent with the previous findings, national
teams’ victories improve respondents’ relative propensity to trust people of other ethnicities,
regardless of whether generalized trust is controlled for.
3.3 National teams’ victories and other attitudes
An important question is whether weaker ethnic identity and higher interethnic trust reflect a
genuine change in attitudes or, rather, a generally euphoric mood due to a national team’s
achievements. One way to test this hypothesis is to examine whether victories are also
associated with changes in other attitudes unrelated to ethnic sentiments. We perform this
exercise in Table 6. In Column 1 we start by assessing whether national teams’ victories are
associated with an increase in respondents’ trust in the ruling party.18 When estimating our
most complete specification, we find that post-victory has no significant effect on the
outcome of interest. A similar pattern emerges in Column 2 when we use as dependent
variable the respondent’s approval rate for the president. These results indicate that football-
driven patriotic shocks do not necessarily translate into generally more positive political
attitudes or higher support for incumbent rulers.
Table 6: National teams’ victories and other attitudes
(1) (2) (3) (4) (5) (6)
Trust in
ruling party
President’s
approval
Assess country’s
economic conditions
Assess own
living conditions
Present Future Present Future
Post-victory 0.010
(0.034)
-0.000
(0.035)
-0.018
(0.019)
-0.004
(0.021)
-0.013
(0.017)
-0.035
(0.023)
Country×match FE Yes Yes Yes Yes Yes Yes
Individual controls Yes Yes Yes Yes Yes Yes
Language×year FE Yes Yes Yes Yes Yes Yes
Observations 27,270 27,330 28,752 28,746 28,725 28,733
R-squared 0.184 0.241 0.121 0.160 0.125 0.162
Post-victory takes value 1 if the respondent was interviewed during the 15 days after a victory, 0
otherwise. Trust in ruling party is a dummy variable that takes value 1 if the respondent reports trusting
the ruling party (either “somewhat” or a “lot”) and 0 otherwise. President’s approval is a dummy that
takes value 1 if the respondent reports approving the president’s performance in the previous 12
months (either “approve” or “strongly approve”) and 0 otherwise. The other dependent variables are
dummies for whether the respondent has a positive assessment of the country’s current economic
conditions and her own living conditions, respectively (“good” or “very good”), and positive
expectations about the evolution of the country’s and of their own conditions in the future, respectively
(“better” or “much better”). *** p<0.01, ** p<0.05, * p<0.1. Robust standard errors clustered at the
language group×year level in parentheses.
18 Evidence that sport victories, and the resulting euphoria, can boost support for the incumbent is available, for example, from Healy, Malhotra, and Mo (2010), who find that victories in U.S. college football games lead to an increase in the incumbent’s vote share in Senate, gubernatorial, and presidential elections.

Afrobarometer Working Papers
Copyright ©Afrobarometer 2017 15
To further rule out that the effect of national teams’ victories is driven by general euphoria,
we test whether victories affect respondents’ perception of the country’s and of their own
economic situation and prospects. In columns 3 and 4 we estimate our baseline specification
using as dependent variables dummies for whether a respondent reports having a positive
assessment of the country’s current economic conditions and positive expectations of
whether they will improve in the near future, respectively. In columns 5 and 6 we do the same
using as dependent variables dummies for whether a respondent has a positive assessment
of her own living conditions and expects these to improve in the future. The lack of significant
coefficients in any column further corroborates the view that football-driven patriotism does
not make individuals more optimistic in general and does not alter their perception of the
conditions they live in.
All the results presented so far are based on the sample of individuals exposed to just one
game. In Appendix Table A.3, we replicate the results on the larger sample of individuals
who, in the days prior to the interview, may have experienced more than one match of their
national team, which is rather common in the case of back-to-back matches. In this case,
the treatment is less clear-cut, since a team may have contrasting results in different matches
(e.g. win one but lose another one). To address this issue, we use as main regressor of interest
either the share of all matches won or the share of available points won (with a win
corresponding to three points, a draw to one point, and a loss to 0 points). The results confirm
that a more successful performance by the national team is associated with a reduction in
the strength of ethnic identification and an increase in generalized and interethnic trust,
while there is no effect on other opinions or expectations.
3.4 More on the interpretation of the individual-level results
To better interpret the results presented, we relate them to previous research in social
psychology on the impact of sport results on social identity. Several hypotheses have been
discussed in this literature.
The first one is that high-profile sport events reinforce group identification because they
provide group members with an opportunity to unite against a common enemy, and this
regardless of whether the collective effort is successful or not (Heinila, 1985; Hargreaves,
1992). While this argument can explain the effect of national teams’ victories, it is inconsistent
with the lack of such an effect for defeats.
The second hypothesis is that to improve their self-image, individuals associate themselves
more with their group following a victory and less following a defeat, in an attempt to bask in
the reflected glory of success and avoid the shadow of failure (Cialdini et al., 1976; Cialdini &
Richardson, 1980; Cialdini & De Nicholas, 1989). According to this argument, victories should
increase group identification while defeats should decrease it – the latter a prediction that
our findings do not support. One possibility is that the two effects might both be at work, but
while they reinforce each other for victories, they offset each other for defeats. However, the
available data do not allow us to separate these two interpretations.
Finally, a third hypothesis is that due to the euphoria of the victory, individuals may be more
likely to adopt pro-social attitudes and behaviours toward both in-groups and out-groups
(Platow et al., 1999). This argument may explain the positive effect on generalized trust since,
after a victory, individuals may be more prone to believe other people can be trusted. Yet it
cannot explain why victories should reduce ethnic identification, or why they should increase
trust in members of other ethnicities disproportionately.
4. Country-level analysis: Empirical strategy
The results presented so far indicate that football-driven positive shocks contribute to
reducing ethnic identification and interethnic mistrust. An important related question is
whether the documented attitudinal change may contribute to decreasing actual violence,

Afrobarometer Working Papers
Copyright ©Afrobarometer 2017 16
and how long-lasting this effect may be. To shed light on this issue, we analyze how civil
conflict in sub-Saharan African countries evolves following important achievements of
national football teams. Specifically, we attempt to exploit quasi-experimental variation in
whether a team qualified for the tournament phase of the African Cup of Nations (ACN), the
most important continental competition for African national teams, which generates
widespread popular attention. The ACN involves two phases: i) a qualifying stage in which all
teams compete, and ii) a final (or tournament) stage in which only the teams that ranked
highest in the qualifying round compete for the title. In the qualifying round, teams are
divided into groups; each team plays each of the others in the group twice (once at home
and once away), with each match assigning a certain number of points; and the teams
(usually one or two per group) with the most points qualify for the final round. The qualifying
stage is usually very competitive, and qualification is often decided only in the last match
based on a narrow point margin or goal difference. Our strategy consists of i) identifying pairs
of teams in the same group that, until the last match day of the group stage, were both in a
position to qualify, but one of which barely did while the other did not, and ii) comparing the
evolution of conflict in the two countries in the six months before and after the qualification.
Our identification strategy is summarized by the following equation:
𝐶𝑜𝑛𝑓𝑐,𝑞,𝑡 = 𝛼 + 𝛽𝑄𝑢𝑎𝑙𝑐,𝑞,𝑡 + ∑ 𝛿𝑘4𝑘=1 𝐶𝑜𝑛𝑓𝑐,𝑞,𝑡−𝑘 + ∑ Γ𝑡
25𝑡=−25 + Δ𝑐,𝑞 + 휀𝑐,𝑞 (3)
where c, q, and t denote country, qualification, and week since qualification (-25 to +25).
Conf is one of the three measures of conflict intensity described above. Qual, our regressor of
interest, is a dummy variable that equals 1 for countries of teams that qualified only in the
weeks after qualification, and 0 otherwise. ∑ Γ𝑡25𝑡=−25 is a set of dummies for each of the weeks
before and after the qualification, while Δ𝑐,𝑞 are country×qualification fixed effects. To control
for possible auto-correlation in conflict events, we also control for the occurrence of conflict
in the previous weeks (up to four). Heteroskedasticity-robust standard errors are clustered by
country×qualifier.
4.1 Qualification for ACN and social conflict
For our analysis, we use data from ACLED on the occurrence and severity of violent conflict
events in sub-Saharan African countries between 1997 and 2013, with a particular focus on
the months before and after each ACN qualification campaign. As mentioned above, our
key comparison is between countries that barely qualified for the ACN final round (our
treatment group) and those that did not (our control group). The underlying identification
assumption is that if two teams in the same group got to the last match day with concrete
chances of qualifying, which one would actually qualify would be determined by quasi-
random circumstances, such as a goal scored in the final minutes of the last match by one
side or the other. One example of such a scenario, depicted in Figure 3, is available from
2012, when three teams in qualifying Group A, Mali, Zimbabwe, and Cape Verde, were in a
position to qualify until the last match day while only one team, Liberia, had already been
eliminated. In the last two matches, Cape Verde defeated Zimbabwe while Mali was only
able to tie Liberia but still managed to qualify due to a three-goal difference. In this case,
Mali would be included in the treatment group while both Cape Verde and Zimbabwe
would be in the control group.

Afrobarometer Working Papers
Copyright ©Afrobarometer 2017 17
Figure 3: Example of close qualification: Group A, ACN, 2012
Table 7 reports the countries included in the treatment and control groups for the various
qualifying campaigns (totaling 46 and 55 entries, respectively). In Table 8, we test whether
the countries in the two groups are balanced along a range of characteristics that may
affect conflict. We focus in particular on the following variables, measured in the year prior to
qualification: GDP per capita, poverty rate, income inequality, life expectancy, population
density, share of urban population, index of political corruption, and autocracy index, as well
as two measures of past conflict intensity, i.e. the number of active conflicts and a dummy
for whether the country experienced a civil war in the 1990s.19 In columns 1 and 2 we report
the mean for each variable separately for treatment and control groups, and in Column 3
the p-value for the difference. The only two variables that are somewhat unbalanced
(differences significant at the 10% level) are autocracy and political corruption, which are
both somewhat higher for treatment than for control countries. The differences are, however,
rather small, corresponding to respectively one-third and one-fourth of a standard deviation
on the sample of sub-Saharan African countries for the period of interest. In Column 4 we test
whether covariates are balanced between countries that did and did not qualify in the
same qualifying campaign; to this end, we report the coefficients from separate OLS
regressions of each covariate on our treatment variable and on a set of nine qualification-
campaign dummies. The results indicate that the difference is insignificant for all but three
variables: political corruption, autocracy, and poverty rates. Yet in our empirical analysis we
control for country×qualifier fixed effects, which capture all observable and unobservable
factors specific to a country in a given year that may affect conflict.
To further corroborate our identification strategy, we also test that conflict was not evolving
differently in the treatment and control groups prior to qualification, a situation that would
threaten our difference-in-differences approach. To do so, we estimate a variant of Equation
3 pooling observations for treatment and control groups and assigning a fictitious treatment
for the pre-qualification period to countries that will eventually qualify. Specifically, this
variable takes the value 1 for the 12 weeks prior to qualification and 0 otherwise. If conflict
19 Data on GDP, poverty rates, income inequality, life expectancy, population density, and share of urban population are from the 2017 version of the World Development Indicators; data on political corruption are from Varieties of Democracy (V-Dem, v6.2); data on the autocracy index are from the Polity IV project; data on civil conflicts in the 1990s are from Fearon and Laitin (2003); the indicator of active conflict is constructed based on the Uppsala Conflict Data Program/PRIO Armed Conflict Dataset.

Afrobarometer Working Papers
Copyright ©Afrobarometer 2017 18
was evolving differently in the two groups in the pre-qualification period, we would expect
the fictitious treatment to display a significant coefficient. The results, reported in Table 9,
seem to rule out this possibility: Regardless of which measure of conflict is used and whether
we control for conflict in previous weeks, we find no evidence that conflict was evolving
differently in the 12 weeks preceding qualification in countries that would eventually qualify
relative to countries that would not.
Table 7: Treatment and control groups by qualifying process
Tournament year Treatment group Control group
1998 Angola, Namibia, DRC, and
Mozambique
Zimbabwe, Mali, Senegal, Gabon,
Liberia, and Malawi
2000 Togo, Côte d’Ivoire, and Congo Guinea, Mali, Liberia, and Uganda
2002 Zambia, Burkina Faso, and DRC Angola, Zimbabwe, Madagascar
Lesotho, and Gabon
2004 Benin, Kenya, Rwanda, Mali,
DRC, South Africa, and Zimbabwe
Zambia, Togo, Sierra Leone, Côte
d’Ivoire, Madagascar, and Uganda
2006 DRC and South Africa Burkina Faso
2008
Côte d’Ivoire, Sudan, Senegal,
Guinea, Namibia, Benin, and
South Africa
Gabon, Gambia, Uganda, Eritrea,
Equatorial Guinea, Mozambique, and
DRC
2010 Zambia and Malawi Rwanda and Guinea
2012 Mali, Guinea, Niger, Angola, and
Sudan
Zimbabwe, Sierra Leone, Nigeria,
Malawi, South Africa, Cameroon, Cape
Verde, Uganda, Kenya, CAR, and
Gambia
2013
Côte d’Ivoire, Ethiopia, Cape
Verde, Niger, Angola, Togo, DRC,
Burkina Faso, Ghana, Mali,
Nigeria, and Zambia
Malawi, Botswana, Uganda, Sierra
Leone, Senegal, Liberia, Cameroon,
Equatorial Guinea, Sudan, Guinea,
Mozambique, Zimbabwe, Gabon, and
CAR
Note: Italic is used to denote that an overdue qualification was at stake (defined as at least three years
without qualifying for the ACN final round). Italic bold is used to denote that a first-time qualification for
the ACN final round was at stake. Due to a lack of conflict data, Mauritius is not included in the analysis
despite the fact that it narrowly missed qualifying for the 2000 ACN on the last match day.

Afrobarometer Working Papers
Copyright ©Afrobarometer 2017 19
Table 8: Balance check
Variable Qualified Not qualified P-value of difference
Within qualification difference
(1) (2) (3) (4)
GDP per capita 1689.92 2252.11 0.396 -515.812 (568.896)
Poverty rate 0.49 0.44 0.246 0.048* (0.025)
Gini index 44.18 44.49 0.826 -0.119 (2.282)
Life expectancy 53.82 54.17 0.785 -0.447 (0.930)
Population density 45.10 65.66 0.131 -21.190 (18.468)
Urban population rate 37.88 38.25 0.909 -0.175 (2.775)
Autocracy 1.64 2.31 0.081 -0.674* (0.313)
Political corruption 0.66 0.72 0.084 -0.065* (0.029)
Fraction civil war 90s 0.29 0.33 0.603 -0.037 (0.059)
Number of conflicts 0.30 0.26 0.696 0.039 (0.083)
For a set of covariates (listed on the left) in the year before the end of each qualification process for
the ACN, columns 1 and 2 report the unconditional means for (barely) qualified countries (46
observations) and (barely) not qualified countries (55 observations). Column 3 reports the p-value
associated with the mean difference test between 1 and 2. A second test is presented in Column 4,
which presents the OLS coefficients from separate regressions of each covariate on a treatment status
(i.e. qualified) conditional on nine qualification process dummies to ensure that comparison in the
covariates is made between countries in the same year. *** p<0.01, ** p<0.05, * p<0.1. Robust standard
errors in parentheses (in Column 4). Each test includes 101 observations except in poverty rate and Gini
index with 100 observations.
Table 9: Parallel trends test
(1) (2) (3) (4) (5) (6)
Dependent variable: Dummy for
any conflict
Number of
events (log+1)
Number of
fatalities (log+1)
12 weeks before qualification 0.036
(0.038)
0.040
(0.037)
0.048
(0.067)
0.040
(0.056)
-0.107
(0.104)
-0.103
(0.081)
Country×qualifier FE Yes Yes Yes Yes Yes Yes
Week FE Yes Yes Yes Yes Yes Yes
4 lags of conflict No Yes No Yes No Yes
Observations 2,525 2,121 2,525 2,121 2,525 2,121
R-squared 0.010 0.023 0.008 0.040 0.008 0.033
*** p<0.01, ** p<0.05, * p<0.1. Robust standard errors in parentheses clustered at the country×qualifier
level. Sample covers 25 weeks before the end of qualification process (i.e. pre-treatment period). The
variable 12 weeks before qualification takes value 1 during the 12 weeks immediately before the end
of the qualification process for the countries that will eventually qualify to the ACN, 0 otherwise. Conflict
data come from the ACLED data set.

Afrobarometer Working Papers
Copyright ©Afrobarometer 2017 20
4.2 Qualification for ACN and conflict
In Table 10 we examine the effect of national teams’ (close) qualification on conflict
prevalence and intensity. We start by estimating, in Column 1, our baseline specification with
country×qualifying campaign and week fixed effects (Equation 3), using as dependent
variable a dummy for whether any conflict event occurred in the country in a given week.
Table 10: Impact of ACN qualification on conflict
(1) (2) (3) (4)
Conflict dummy
Conflict dummy
Number of events (log+1)
Number of fatalities (log+1)
Post-qualification -0.078**
(0.031)
-0.068**
(0.026)
-0.105***
(0.038)
-0.147**
(0.058)
Conflict variablet-1 0.112*** 0.261*** 0.163***
(0.021) (0.024) (0.032)
Conflict variablet-2 0.012 0.069*** 0.129***
(0.019) (0.026) (0.024)
Conflict variablet-3 0.023 0.041* 0.051**
(0.017) (0.021) (0.021)
Conflict variablet-4 0.009 0.076*** -0.018
(0.018) (0.020) (0.032)
Long-run impact -0.078 -0.081 -0.190 -0.218
Country×qualifier FE Yes Yes Yes Yes
Week FE Yes Yes Yes Yes
Observations 5,050 4,646 4,646 4,646
R-squared 0.010 0.024 0.118 0.070
The sample includes the 25 weeks before and after the close qualification for 101 country×qualifier
pairs. The variable Post-qualification takes value 1 for the team that qualified for the weeks after the
qualification and 0 otherwise. The dependent variables are respectively a dummy for whether any
conflict event was recorded in the country in a given week (columns 1 and 2), the log+1 of the number
of conflict events recorded in a given week (Column 3), and the log+1 of the number of fatalities
associated with those events (Column 4). All conflict data are from the ACLED data set. *** p<0.01, **
p<0.05, *p<0.1. Robust standard errors clustered by country×qualifier reported in parentheses.
The results indicate that the probability of experiencing conflict is significantly lower in the
months following the qualification; the effect is sizeable, corresponding to a 9% decrease in
the probability of conflict in a given week. The effect remains largely unchanged in Column
2, where we control for conflict in each of the previous four weeks.20 The results are
qualitatively similar in columns 3 and 4 when we use the two measures of conflict intensity,
i.e. (log+1 of) the number of conflict events that occurred and (log+1 of) the number of
20 The results are virtually the same if we include the four lags of conflict occurrence one by one or in any combination. They are also very similar when we estimate a probit model rather than a linear probability model (results shown in Appendix Table A.6).

Afrobarometer Working Papers
Copyright ©Afrobarometer 2017 21
fatalities associated with them. The effect is economically sizeable: Countries whose teams
barely qualified experience reductions of 18% in the number of conflict episodes and of 20%-
23% in the number of fatalities relative to countries whose teams narrowly did not. The table
also reports the long-run impact of the qualification, which takes into account the effect of a
reduction in today’s conflict on future violence. We obtain analogous results when using the
number of conflict episodes and victims (i.e. without the log transformation) and when
estimating negative binomial regressions (see Appendix Table A.7).
In Figure 4 we provide additional graphical evidence of the impact of qualification on
conflict and examine the duration of this effect. To this end, we plot the estimated
coefficients and 95% confidence intervals of the interaction terms between the treatment
variable and dummies for 11 four-week periods in the months before and after the
qualification.
Figure 4: Occurrence of conflict and number of conflict episodes before and after
qualification
A: Occurrence of conflict (four-week bandwidths)
B: Number of conflict episodes (four-week bandwidths)
Figures plot coefficients and 95%
confidence intervals for
interactions between the dummy
for countries that barely qualified
for the ACN and 11 dummies for
four-week period included
between 25 weeks before and
after the qualification. The
coefficient for the four weeks
immediately before the
qualification is normalized to
zero. The dependent variable for
the top panel is a dummy for
whether any conflict event has
been recorded in the country
during the week, while for the
bottom panel is log+ 1 the
number of conflict events
recorded in the country during
the week. The regressions also
include week and
country×qualifier dummies.
Confidence intervals are based
on heteroskedasticity-robust
standard errors clustered by
country×qualifier.

Afrobarometer Working Papers
Copyright ©Afrobarometer 2017 22
The coefficients are obtained from a regression that also includes 50 week dummies and 101
country×qualifier dummies. To facilitate the interpretation of the results, we normalize to 0 the
coefficient on the four-week periods immediately before qualification.
The results indicate clearly that the occurrence and the number of conflict events (top and
bottom panel, respectively) decrease sharply in the weeks following the qualification for the
ACN tournament. Indeed, all the coefficients for the post-qualification periods are
significantly different from 0 at the 10% level, and most of them at the 5% level. Two
additional patterns emerge quite clearly. First, none of the coefficients for the periods before
qualification is significantly different from zero, confirming the absence of any differential
trend in countries that would later qualify, documented in Table 9. Second, the effect of
qualification on conflict persists and, if anything, becomes stronger as more time elapses
since qualification, especially three months after.
To further test the persistence of the effect, in Table 11 we re-estimate our difference-in-
differences specification, splitting the post-qualification period in two sub-periods: i) the first
12 weeks after qualification and ii) the following 13 weeks. The results document a reduction
in conflict occurrence and intensity of a similar magnitude for the two periods; in fact, the
point estimates for the second period are somewhat larger and more significant when using
the dummy and the number of events as dependent variables (columns 1-4) but slightly
smaller for the number of fatalities (columns 5-6). Results are largely similar when controlling
for the lags of conflict (columns 2, 4, and 6). Combined with the results on attitudes, these
findings provide robust evidence that important achievements of the national team, by
priming a sentiment of national unity and by reducing interethnic cleavages, can contribute
to reducing violence in a tangible and rather persistent way.
Table 11: Evolution of conflict after qualification
(1) (2) (3) (4) (5) (6)
Dependent variable: Conflict
dummy
Number of
events (log+1)
Number of
fatalities (log+1)
1-12 weeks post-qualification -0.061* -0.056** -0.149** -0.107*** -0.238** -0.169**
(0.032) (0.027) (0.069) (0.038) (0.100) (0.069)
13-25 weeks post-qualification -0.090** -0.078** -0.214** -0.116** -0.229* -0.144*
(0.040) (0.035) (0.098) (0.054) (0.121) (0.080)
Country×qualifier FE Yes Yes Yes Yes Yes Yes
Week FE Yes Yes Yes Yes Yes Yes
4 lags of conflict No Yes No Yes No Yes
Observations 5,050 4,646 5,050 4,646 5,050 4,646
R-squared 0.010 0.024 0.014 0.119 0.012 0.070
*** p<0.01, ** p<0.05, * p<0.1. Robust standard errors in parentheses clustered at the country×qualifier
level. Sample covers +/- 25 weeks around the end of qualification process for 101 country×qualifier
pairs. The variable 1-12 weeks after qualification takes value 1 during the 12 weeks immediately after
the end of the qualification process for the countries that barely qualified for the ACN, 0 otherwise. The
variable 13-25 weeks after qualification takes value 1 starting the 13th week after the end of the
qualification process for the countries that barely qualified for the ACN, 0 otherwise. Conflict data
come from the ACLED data set.

Afrobarometer Working Papers
Copyright ©Afrobarometer 2017 23
4.3 Effect of qualification on conflict: Heterogeneity
We then examine whether unexpected qualifications have a stronger effect on conflict.
Indeed, it seems plausible that qualification for the ACN tournament may be perceived as
an especially important achievement for teams that had never qualified in the past or that
had not qualified in a long time, as opposed to teams – such as Ghana or Côte d’Ivoire - --
that usually qualify. This hypothesis is in line with previous findings on the effect of sport results
on violence and crime, which indicate that unexpected outcomes are more consequential
than expected ones (Card & Dahl, 2011; Munyo & Rossi, 2013). To test this hypothesis, in Table
12 we estimate our baseline specification separately for i) countries that had not qualified in
three or more years and ii) countries that had never qualified. The results provide strong
support for the above-mentioned hypothesis: The reduction in the occurrence and intensity
of conflict is generally larger and more significant for overdue and first qualifications, with the
exception of the decrease in the number of fatalities, which is marginally insignificant for first
qualifications.
4.4 Qualifications and ethnic conflict
In Table 13 we investigate the effect of qualification for the ACN tournament on conflict
events classified as ethnicity-related according to the procedure described in Section 2.3.
When estimating our most comprehensive specification – with country×qualifier and week
fixed effects and lags of conflict – we find that national teams’ qualification for the ACN
finals reduced the occurrence of interethnic violence (Column 1) as well as its intensity
measured both by the number of conflict events and associated fatalities (columns 2-3).
Though smaller than for overall conflict, the effect is rather sizeable: The qualification
reduced the likelihood of ethnic violence by one-third of the mean value of the dummy
variable.21
4.5 Alternative explanations
Finally, we analyze two alternative explanations of the negative effect of qualification on
conflict documented above. The first one is that the decline in conflict may be partly due to
coincidence with the ACN tournament, which in some cases took place within six months of
the qualification. Indeed, since the ACN final round is very popular and is broadcast around
the continent, it may distract many individuals who may otherwise engage in violence,
particularly in countries that qualified. To test for this possibility, in Table 14 we re-estimate our
baseline specification excluding from the sample the weeks during which ACN final-round
matches were taking place. The results indicate that, regardless of which measure of conflict
we use and whether we control for lagged conflict, the effect of qualification on conflict
remains virtually unchanged.22
21 As shown in Table A.8, the results are similar when we use the number of conflict events and fatalities instead of their log+1 version. 22 As an additional test, in Appendix Table A.12 we look at the entire sample but include a dummy for the weeks during which the ACN’s final-round matches are taking place only for teams that qualified. The results are largely consistent with those in Table 14.

Afrobarometer Working Papers
Copyright ©Afrobarometer 2017 24
Table 12: Overdue and first qualification effects
(1) (2) (3) (4) (5) (6) (7) (8) (9)
Dependent variable: Conflict dummy Number of events (log+1) Number of fatalities (log+1)
Sample Full Overdue qualif. 1st qualif. Full Overdue qualif. 1st qualif. Full Overdue qualif. 1st qualif.
Post-qualification
-0.068** -0.114** -0.158** -0.105*** -0.168*** -0.218*** -0.147** -0.224*** -0.082
(0.026) (0.044) (0.072) (0.038) (0.059) (0.102) (0.058) (0.082) (0.047)
Country×qualifier FEs Yes Yes Yes Yes Yes Yes Yes Yes Yes Week FEs Yes Yes Yes Yes Yes Yes Yes Yes Yes 4 lags of conflict Yes Yes Yes Yes Yes Yes Yes Yes Yes
Observations 4,646 2,346 828 4,646 2,346 828 4,646 2,346 828 (Pseudo) R-squared 0.024 0.031 0.090 0.118 0.161 0.221 0.070 0.077 0.092
*** p<0.01, ** p<0.05, * p<0.1. Robust standard errors in parentheses clustered at the country×qualifier level. Sample covers +/-25 weeks around
the end of qualification process. Post-qualification takes value 1 during the 25 weeks following the qualification for ACN, 0 otherwise. Conflict
data come from the ACLED data set. An overdue (first-time) qualification is defined as reaching the last match day with chances of qualifying
for the ACN final round after three or more years of not having qualified (after never having qualified before). See Table 7.

Afrobarometer Working Papers
Copyright ©Afrobarometer 2017 25
Table 13: Impact on ethnic conflict
(1) (2) (3)
Dependent variable: Dummy for
any conflict
Number of
events (log+1)
Number of
fatalities (log+1)
Post-qualification -0.024** -0.022* -0.066**
(0.012) (0.011) (0.031)
Long-run impact 0.029 0.034 0.086
Country×qualifier FE Yes Yes Yes
Week FE Yes Yes Yes
4 lags of conflict Yes Yes Yes
Observations 4,646 4,646 4,646
R-squared 0.029 0.083 0.055
*** p<0.01, ** p<0.05, * p<0.1. Robust standard errors in parentheses clustered at the country×qualifier
level. Sample covers +/-25 weeks around the end of qualification process. Post-qualification takes value
1 during the 25 weeks following the qualification for ACN, 0 otherwise. Ethic conflict is coded using
conflict data from the ACLED data set.
Table 14: Effect of qualification and ACN finals
Dependent variable: Dummy for
any conflict event
Number of
conflict events (log+1)
Number of
fatalities (log+1)
(1) (2) (3) (4) (5) (6)
Post-qualification -0.076**
(0.031)
-0.066**
(0.026)
-0.179**
(0.070)
-0.106***
(0.037)
-0.231**
(0.094)
-0.151**
(0.060)
Country×qualifier FE Yes Yes Yes Yes Yes Yes
Week FE Yes Yes Yes Yes Yes Yes
4 lags of conflict No Yes No Yes No Yes
Excluding ACN finals Yes Yes Yes Yes Yes Yes
Observations 4,782 4,378 4,782 4,378 4,782 4,378
R-squared 0.010 0.023 0.015 0.112 0.013 0.071
*** p<0.01, ** p<0.05, * p<0.1. Robust standard errors in parentheses clustered at the country×qualifier
level. Post-qualification takes value 1 during the 25 weeks following the qualification for ACN, 0
otherwise. Sample covers +/-25 weeks around the end of qualification process, except for observations
in weeks wherein the ACN final-round matches took place, which are excluded (268 weekly
observations). Conflict data come from the ACLED data set.
The second possibility relates to the news-based nature of the ACLED conflict data. A conflict
event is recorded by ACLED only if it is mentioned by at least one of a multiplicity of local,
national, or international media, in addition to reports by local NGOs. It is in principle possible
that the qualification of a national team to the ACN tournament may lead to an increase in

Afrobarometer Working Papers
Copyright ©Afrobarometer 2017 26
the number of football-related news reports in local media that may crowd out news about
the conflict, potentially leading to a mechanical reduction in the number of conflict events
recorded by ACLED.23 To the extent that football-related news reports are likely more
extensive during the final round of the ACN, the results in Table A.12 are reassuring that this
aspect is not driving our results. Yet it could be that football news increases in the months
prior to the ACN final round as discussion about players’ selection and teams’ prospects
intensifies. One way to test for the crowding-out hypothesis is to verify that the effect is not
driven by less severe conflict events, which should be more likely to go unreported due to
competition from football news than events involving a higher number of fatalities. We
implement this approach in Table 15, where we estimate our baseline specification for the
occurrence of conflict events of increasing severity, i.e. involving 10 or more fatalities, 25 or
more fatalities, and 50 or more fatalities. The fact that the results are similar for the different
samples, both in terms of magnitude and significance, suggest that reporting bias is not
driving our results.
Table 15: Conflict occurrence by number of fatalities
Dependent variable: Dummy for at least one conflict event in a week
Events with 10
or more fatalities
Events with 25
or more fatalities
Events with 50
or more fatalities
(1) (2) (3) (4) (5) (6)
Post-qualification -0.042**
(0.021)
-0.035**
(0.016)
-0.034**
(0.016)
-0.027*
(0.014)
-0.030**
(0.013)
-0.022*
(0.012)
Mean dep. variable 0.089 0.089 0.043 0.042 0.024 0.023
Country×qualifier FE Yes Yes Yes Yes Yes Yes
Week FE Yes Yes Yes Yes Yes Yes
4 lags of conflict No Yes No Yes No Yes
Observations 5,050 4,646 5,050 4,646 5,050 4,646
R-squared 0.010 0.026 0.011 0.045 0.012 0.053
*** p<0.01, ** p<0.05, * p<0.1. Robust standard errors in parentheses clustered at the country×qualifier
level. Post-Qualification takes value 1 during the 25 weeks following the qualification for ACN, 0
otherwise. Sample covers +/-25 weeks around the end of qualification process. Conflict data come
from the ACLED data set.
5. Conclusions
This research examines how successful collective experiences that prime national pride and
unity can contribute to alleviating interethnic tensions and reducing violence. We investigate
this issue in the context of sub-Saharan Africa by looking at the impact of national football
teams’ victories on both individual attitudes and political violence.
Combining information on more than 70 official matches by 24 national teams with survey
data from four rounds of the Afrobarometer survey, we find that individuals interviewed in the
23 Evidence that news coverage of important sport events on TV can crowd out news about other issues, such as natural disasters or conflict, is available from Eisensee and Stromberg (2007) and Durante and Zhuravskaya (forthcoming).

Afrobarometer Working Papers
Copyright ©Afrobarometer 2017 27
days immediately after a victory are less likely to report a strong sense of ethnic (as opposed
to national) identity than those interviewed just before. The estimated effect is sizeable –
accounting for a 20% decrease in the average probability of ethnic self-identification – and
robust to different specifications and controls. Exposure to national teams’ victories is also
associated with a higher level of trust in others, both in general and in individuals of other
ethnicities. These effects appear to be driven by a genuine increase in national pride rather
than generic post-victory euphoria; indeed, national teams’ victories have no significant
impact on other attitudes such as support for the government or optimism about present and
future economic conditions.
To test whether the effect of football on national identity extends beyond attitudes to more
tangible outcomes, we then look at the evolution of conflict around the time of important
national team achievements. Specifically, we find that countries whose national teams
(barely) qualified for the final round of the Africa Cup of Nations experience significantly less
conflict in the six months after the qualification than countries whose teams (barely) did not
qualify. This effect is not only sizeable and statistically significant but also persists for several
months after the successful event.
Taken together, the evidence presented indicates that, even in regions where ethnic
tensions have deep historical roots, events that prime patriotic pride can reinforce national
identity, reduce interethnic mistrust, and have a tangible impact on violence. Though
specific to the case of sport events, our findings suggest that policies that favour emotional
participation may be most effective at forging a shared sentiment of unity and set the
foundations for more long-lasting cultural and political changes.

Afrobarometer Working Papers
Copyright ©Afrobarometer 2017 28
References
Adida, C. L., Ferree, K. E., Posner, D. N., & Robinson, A. L. (2016). Who’s asking? Interviewer coethnicity effects in African survey data. Comparative Political Studies, 49(12), 1630-1660.
Afrobarometer. (2007). Round 4 Survey Manual. www.afrobarometer.org.
Alesina, A., & La Ferrara, E. (2005). Preferences for redistribution in the land of opportunities. Journal of Public Economics, 89(5), 897-931.
Alesina, A., Baqir, R., & Easterly, W. (1999). Public goods and ethnic divisions. Quarterly Journal of Economics, 114(4), 1243–1284.
Bandyopadhyay, S., & Green, E. (2013). Nation-building and conflict in modern Africa. World Development, 45, 108-118.
Buggle, J. C. (2016). Law and social capital: Evidence from the Code Napoleon in Germany. European Economic Review, 87, 148-175.
Card, D., & Dahl, G. B. (2011). Family violence and football: The effect of unexpected emotional cues on violent behavior. Quarterly Journal of Economics, 126(1), 103-143.
Cederman, L.-E., Gleditsch, K. S., Salehyan, I., & Wucherpfennig, J. (2013). Transborder ethnic kin and civil war. International Organization, 67(2), 389-410.
Cialdini, R. B., & Richardson, K. D. (1980). Two indirect tactics of image management: Basking and blasting. Journal of Personality and Social Psychology, 39(3), 406.
Cialdini, R. B., & De Nicholas, M. E. (1989). Self-presentation by association. Journal of Personality and Social Psychology, 57(4), 626.
Cialdini, R. B., Borden, R. J., Thorne, A., Walker, M. R., Freeman, S., & Sloan, L. R. (1976). Basking in reflected glory: Three (football) field studies. Journal of Personality and Social Psychology, 34(3), 366.
Darby, P. (2002). Africa, football, and FIFA: Politics, colonialism, and resistance. Sport in the Global Society series. Psychology Press.
Durante, R., & Zhuravskaya, E. (forthcoming). Attack when the world is not watching? U.S. media and the Israeli-Palestinian conflict. Journal of Political Economy.
Easterly, W., & Levine, R. (1997). Africa’s growth tragedy: Policies and ethnic divisions. Quarterly Journal of Economics, 112(4), 1203-1250.
Eifert, B., Miguel, E., & Posner, D. N. (2010). Political competition and ethnic identification in Africa. American Journal of Political Science, 54(2), 494-510.
Eisensee, T., & Stromberg, D. (2007). News droughts, news floods, and US disaster relief. Quarterly Journal of Economics, 122, 693-728.
Fearon, J. D., & Laitin, D. D. (2003). Ethnicity, insurgency, and civil war. American Political Science Review, 97, 75-90.
Hargreaves, J. (1992). Olympism and nationalism: Some preliminary consideration. International Review for the Sociology of Sport, 27(2), 119-135.
Healy, A. J., Malhotra, N., & Mo, C. H. (2010). Irrelevant events affect voters’ evaluations of government performance. Proceedings of the National Academy of Sciences, 107(29), 12804-12809.
Heinila, K. (1985). Sport and international understanding: A contradiction in terms? Sociology of Sport Journal, 2(3), 240-248.
Herbst, J. (2014). States and power in Africa: Comparative lessons in authority and control. Princeton, NJ: Princeton University Press.

Afrobarometer Working Papers
Copyright ©Afrobarometer 2017 29
Jacob, M., & Tyrell, M. (2010). The legacy of surveillance: An explanation for social capital erosion and the persistent economic disparity between East and West Germany. Available at SSRN: https://ssrn.com/abstract=1554604 or http://dx.doi.org/10.2139/ssrn.1554604.
Mamdani, M. (2014). When victims become killers: Colonialism, nativism, and the genocide in Rwanda. Princeton, NJ: Princeton University Press.
Mehler, A. (2008). Political discourse in football coverage – the cases of Cote d’Ivoire and Ghana. Soccer & Society, 9(1), 96-110.
Michalopoulos, S., & Papaioannou, E. (forthcoming). The long-run effects of the scramble for Africa. American Economic Review.
Miguel, E. (2004). Tribe or nation? Nation building and public goods in Kenya versus Tanzania. World Politics, 56(3), 328-362.
Miguel, E., & Gugerty, M. K. (2005). Ethnic diversity, social sanctions, and public goods in Kenya. Journal of Public Economics, 89(11), 2325-2368.
Munyo, I., & Rossi, M. A. (2013). Frustration, euphoria, and violent crime. Journal of Economic Behavior & Organization, 89, 136-142.
Nunn, N., & Wantchekon, L. (2011). The slave trade and the origins of mistrust in Africa. American Economic Review, 101(7), 3212-3252.
Platow, M., Durante, M., Williams, N., Garrett, M., Walshe, J., Cincotta, S., Lianos, G., & Barutchu, A. (1999). The contribution of sport fan social identity to the production of prosocial behavior. Group Dynamics: Theory, Research, and Practice, 3, 161-169.
Robinson, A. L. (2014). National versus ethnic identification in Africa: Modernization, colonial legacy, and the origins of territorial nationalism. World Politics, 66(4), 709-746.
Robinson, A. L. (forthcoming). Nationalism and inter-ethnic trust: Experimental evidence from an African border region. Comparative Political Studies.
Stormer, N. (2006). More than a game. Common Ground News Service, 20 June 2006.
Vigdor, J. L. (2002). Interpreting ethnic fragmentation effects. Economics Letters, 75(2), 271- 276.
West, B. T., &Blom, A. G. (2017). Explaining interviewer effects: A research synthesis. Journal of Survey Statistics and Methodology, 5(2), 175-211.
Yanagizawa-Drott, D. (2014). Propaganda and conflict: Evidence from the Rwandan genocide. Quarterly Journal of Economics, 129(4), 1947-1994.

Afrobarometer Working Papers
Copyright ©Afrobarometer 2017 33
Appendix
Figure A.1: Ethnic identity before and after national teams’ victories, including
country-match fixed effect
The figure plots the coefficients and 95% confidence intervals for nine dummies indicating three-day
blocks from 15 days before to 15 days after a victory of the national football team. The coefficient for
the period between three to one days before the match is normalized to zero. Confidence intervals are
based on heteroskedasticity-robust standard errors clustered by language group×year. The coefficients
are estimated from a unique regression in which we control for individual characteristics,
country×match, and language group×year fixed effects and for the proximity to draws or defeats.

Afrobarometer Working Papers
Copyright ©Afrobarometer 2017 34
Table A.1: Summary statistics
Variable Mean Std. dev. Min. Max. N
Ethnic over national Identity 0.149 0.356 0 1 28,758
Post-play 0.505 0.5 0 1 28,758
Post-victory 0.181 0.385 0 1 28,758
Post-defeat 0.225 0.418 0 1 28,758
Post-draw 0.099 0.299 0 1 28,758
Generalized trust 1.946 0.826 0 3 25,475
Interethnic trust 1.414 1.057 0 3 7,992
Intra-ethnic trust 1.734 1.054 0 3 8,078
Trust in Ruling Party 1.544 1.128 0 3 27,270
President’s approval 2.759 0.963 1 4 27,330
Country’s economic conditions today (1=good) 0.268 0.443 0 1 28,752
Country’s economic conditions future (1=good) 0.526 0.499 0 1 28,746
Own economic conditions today (1=good) 0.291 0.454 0 1 28,725
Own economic conditions future (1=good) 0.561 0.496 0 1 28,733
Male 0.505 0.5 0 1 28,758
Age 36.4 14.537 18 130 28,758
Unemployed 0.294 0.456 0 1 28,758
Rural status 0.21 0.407 0 1 28,758
Education 3.023 2.078 0 9 28,758
Major ethnicity 0.383 0.486 0 1 28,758
Public goods provided 0.47 0.305 0 1 28,758

Afrobarometer Working Papers
Copyright ©Afrobarometer 2017 35
Table A.2: Ordered dependent variable
Dependent variable: Ethnic identity (ordered, 0-4) OLS Ordered probit
(1) (2) (3) (4)
Post-victory -0.086*** -0.044 -0.091*** -0.049
(0.032) (0.035) (0.031) (0.034)
Country×year FE Yes No Yes No
Individual controls Yes Yes Yes Yes
Language×year FE Yes Yes Yes Yes
Country×match FE No Yes No Yes
Observations 25,293 25,293 25,293 25,293
*** p<0.01, ** p<0.05, * p<0.1. Robust standard errors clustered at the language group×year level in
parentheses. Post-victory takes value 1 if the respondent was interviewed within 15 days after a victory,
0 otherwise.

Afrobarometer Working Papers
Copyright ©Afrobarometer 2017 36
Table A.3: Multiple games
Panel A: Share of victories
Ethnic
identification Generalized
trust Interethnic
trust
Interethnic trust
premium
Trust in ruling party
President’s approval
Share of victories
(1) (2) (3) (4) (5) (6)
-0.039***
(0.014)
0.064
(0.048)
0.147***
(0.037)
0.077**
(0.032)
0.002
(0.032)
0.039
(0.032)
Generalized trust 0.589***
(0.030)
-0.154***
(0.016)
Observations 35,069 33,910 8,200 8,186 31,983 31,864
R-squared 0.110 0.236 0.389 0.079 0.199 0.233
Panel B: Share of points won
Ethnic identification
Generalized trust
Interethnic trust
Interethnic trust
premium
Trust in ruling party
President’s approval
Share of points won
(1) (2) (3) (4) (5) (6)
-0.039***
(0.013)
0.075*
(0.039)
0.147***
(0.037)
0.077**
(0.032)
0.016
(0.033)
0.047
(0.033)
Generalized trust 0.589***
(0.030)
-0.154***
(0.016)
Observations 35,069 33,910 8,200 8,186 37,735 37,556
R-squared 0.110 0.236 0.389 0.079 0.165 0.231
Multiple games Yes Yes Yes Yes Yes Yes
Country×year FE Yes Yes Yes Yes Yes Yes
Individual controls Yes Yes Yes Yes Yes Yes
Language×year FE Yes Yes Yes Yes Yes Yes
*** p<0.01, ** p<0.05, * p<0.1. Robust standard errors clustered at the language group×year level in
parentheses. Share of victories accounts for the fraction of total games won. Share of points won
accounts for the fraction of total possible points obtained (a win, draw, and loss award three, one, and
0 points, respectively).

Afrobarometer Working Papers
Copyright ©Afrobarometer 2017 37
Table A.4: Victories and ethnic identification: Heterogenous effects
Dependent variable: Ethnic over national identity (0-1 dummy)
(1) (2) (3) (4) (5)
Post-victory -0.044***
(0.014)
-0.044***
(0.014)
-0.044***
(0.014)
-0.043***
(0.014)
-0.045***
(0.014)
Interaction 0.012
(0.012)
0.001
(0.004)
0.000
(0.000)
0.044**
(0.021)
0.009
(0.028)
Uninteracted term -0.023***
(0.007)
-0.018***
(0.002)
-0.003***
(0.001)
-0.001*
(0.012)
-0.009
(0.034)
Interaction term Male Education Age Rural Ethnic
majority
Country×match FE Yes Yes Yes Yes Yes
Individual controls Yes Yes Yes Yes Yes
Language×year FE Yes Yes Yes Yes Yes
Observations 28,758 28,758 28,758 28,758 28,758
R-squared 0.116 0.116 0.116 0.116 0.116
*** p<0.01, ** p<0.05, * p<0.1. Robust standard errors clustered at the language group×year level in
parentheses. Post-victory takes value 1 if the respondent was interviewed in the 15 days after a victory,
0 otherwise.

Afrobarometer Working Papers
Copyright ©Afrobarometer 2017 38
Table A.5: Summary statistics for conflict measures
Variable Mean Std. Dev. Min. Max.
Conflict dummy 0.406 0.491 0 1
Number of events (log+1) 0.618 0.907 0 4.263
Number of fatalities (log+1) 0.544 1.251 0 10.131
Ethnic conflict dummy 0.062 0.242 0 1
Number of ethnic events (log+1) 0.065 0.277 0 2.773
Number of ethnic fatalities (log+1) 0.115 0.604 0 6.909
Riot dummy 0.188 0.39 0 1
Attack on civilians dummy 0.234 0.423 0 1
Government event dummy 0.268 0.443 0 1
Battle event dummy 0.188 0.391 0 1
Number of riot events (log+1) 0.194 0.458 0 3.807
Number of attack on civ. (log+ 1) 0.286 0.598 0 3.892
Number of govt events (log+1) 0.346 0.666 0 3.871
Number of battles (log+1) 0.252 0.59 0 3.466
Number of fatalities in riots (log+1) 0.029 0.23 0 4.836
Number of fatalities due to attack on civ. (log+1) 0.294 0.874 0 10.127
Number of fatalities in govt events (log+1) 0.308 0.93 0 6.987
Number of fatalities in battles (log+1) 0.334 1.002 0 6.987
Sample size 5,050 weeks

Afrobarometer Working Papers
Copyright ©Afrobarometer 2017 39
Table A.6: Impact of ACN qualification on conflict prevalence (probit)
Dependent variable: Conflict prevalence (1 if at least one conflict in week, 0 otherwise)
(1) (2) (3) (4)
Estimates from probit regression models. *** p<0.01, ** p<0.05, * p<0.1. Robust standard errors in
parentheses clustered at the country×qualifier level. Sample covers +/-25 weeks around the end of
qualification process. Qualification takes value 1 during the 25 weeks following the qualification for
ACN, 0 otherwise. Conflict data come from the ACLED data set.
Table A.7: Impact of ACN qualification on conflict intensity (maximum likelihood
negative binomial)
Dependent variable: Num. events Num. fatalities (1) (2) (3) (4)
Qualification -0.440** -0.332** -0.803** -0.797**
(0.194) (0.146) (0.327) (0.335)
4 lags of conflict No Yes No Yes
Country×qualifier FE Yes Yes Yes Yes
Week FE Yes Yes Yes Yes
Observations 5,050 4,646 5,050 4,646
Estimates from negative binomial regression models. *** p<0.01, ** p<0.05, * p<0.1. Robust standard
errors in parentheses clustered at the country×qualifier level. Sample covers +/-25 weeks around the
end of qualification process. Qualification takes value 1 during the 25 weeks following the qualification
for ACN, 0 otherwise. Conflict data come from the ACLED data set.
Qualification -0.336** -0.301*** -0.200** -0.308**
(0.133) (0.117) (0.079) (0.128)
Country×qualifier FE Yes Yes No No
Random effect model No No No Yes
Qualifying country indicator No No Yes No
4 lags of conflict No Yes No No
Week FE Yes Yes Yes Yes
Observations 4,650 4,278 5,050 5,050

Afrobarometer Working Papers
Copyright ©Afrobarometer 2017 40
Table A.8: Conflict intensity (IHS transformation)
Dependent variable: Inverse hyperbolic sine transformation of type of conflict: All Ethnic Num. events Num. fatalities Num. events Num. fatalities
(1) (2) (3) (4) (5) (6) (7) (8)
Qualification -0.225**
(0.090)
-0.136***
(0.048)
-0.265**
(0.106)
-0.174***
(0.066)
-0.041
(0.026)
-0.028*
(0.015)
-0.088*
(0.046)
-0.068**
(0.031)
4 lags of conflict No Yes No Yes No Yes No Yes
Country×qualifier FE Yes Yes Yes Yes Yes Yes Yes Yes
Week FE Yes Yes Yes Yes Yes Yes Yes Yes
Observations 5,050 4,646 5,050 4,646 5,050 4,646 5,050 4,646
R-squared 0.013 0.111 0.012 0.068 0.010 0.080 0.011 0.061
*** p<0.01, ** p<0.05, * p<0.1. Robust standard errors in parentheses clustered at the country×qualifier
level. Sample covers +/-25 weeks around the end of qualification process. Qualification takes value 1
during the 25 weeks following the qualification for ACN, 0 otherwise. Conflict data come from the
ACLED data set.
Table A.9: Conflict prevalence by type of conflict
Dependent variable: Conflict prevalence (if at least one conflict in week, 0 otherwise) Riots Attacks on civilians Government Battles
(1) (2) (3) (4) (5) (6) (7) (8)
Qualification -0.089***
(0.030)
-0.083***
(0.027)
-0.063**
(0.029)
-0.052**
(0.024)
-0.045
(0.032)
-0.043*
(0.026)
-0.014
(0.024)
-0.005
(0.020)
4 lags of conflict No Yes No Yes No Yes No Yes
Country×qualifier FE Yes Yes Yes Yes Yes Yes Yes Yes
Week FE Yes Yes Yes Yes Yes Yes Yes Yes
Observations 5,050 4,646 5,050 4,646 5,050 4,646 5,050 4,646
R-squared 0.017 0.037 0.014 0.032 0.008 0.024 0.010 0.022
*** p<0.01, ** p<0.05, * p<0.1. Robust standard errors in parentheses clustered at the country×qualifier
level. Sample covers +/-25 weeks around the end of qualification process. Qualification takes value 1
during the 25 weeks after the qualification for ACN, 0 otherwise. Conflict data come from the ACLED
data set.

Afrobarometer Working Papers
Copyright ©Afrobarometer 2017 41
Table A.10: Conflict intensity by type of conflict (num. events)
Dependent variable: Number of conflict events by type (log+1) Riots Attacks on civilians Government Battles
(1) (2) (3) (4) (5) (6) (7) (8)
Qualification -0.124*** -0.100*** -0.084 -0.055* -0.086 -0.051 -0.019 -0.000
(0.039) (0.027) (0.051) (0.029) (0.058) (0.033) (0.043) (0.026)
4 lags of conflict No Yes No Yes No Yes No Yes
Country×qualifier FE Yes Yes Yes Yes Yes Yes Yes Yes
Week FE Yes Yes Yes Yes Yes Yes Yes Yes
Observations 5,050 4,646 5,050 4,646 5,050 4,646 5,050 4,646
R-squared 0.018 0.085 0.012 0.070 0.008 0.096 0.011 0.093
*** p<0.01, ** p<0.05, * p<0.1. Robust standard errors in parentheses clustered at the country×qualifier
level. Sample covers +/-25 weeks around the end of qualification process. Qualification takes value 1
during the 25 weeks following the qualification for ACN, 0 otherwise. Conflict data come from the
ACLED data set.
Table A.11: Conflict intensity by type of conflict (num. fatalities)
Dependent variable: Number of fatalities by type (log+1) Conflict type: Riots Attacks on civilians Government Battles (1) (2) (3) (4) (5) (6) (7) (8)
Post-qualification
-0.004
(0.017)
-0.011
(0.015)
-0.132**
(0.062)
-0.112**
(0.054)
-0.112
(0.073)
-0.066
(0.048)
-0.152**
(0.074)
-0.106**
(0.053)
4 lags of conflict No Yes No Yes No Yes No Yes
Country×qualifier FE Yes Yes Yes Yes Yes Yes Yes Yes
Week FE Yes Yes Yes Yes Yes Yes Yes Yes
Observations 5,050 4,646 5,050 4,646 5,050 4,646 5,050 4,646
R-squared 0.011 0.020 0.011 0.022 0.009 0.035 0.011 0.047
*** p<0.01, ** p<0.05, * p<0.1. Robust standard errors in parentheses clustered at the country×qualifier
level. Sample covers +/-25 weeks around the end of qualification process. Post-qualification takes
value 1 during the 25 weeks following the qualification for ACN, 0 otherwise. Conflict data come from
the ACLED data set.

Afrobarometer Working Papers
Copyright ©Afrobarometer 2017 42
Table A.12: Incapacitation effect due to ACN finals?
Dependent variable: Conflict prevalence Num. events (log+1) Num. fatalities (log+1)
(1) (2) (3) (4) (5) (6)
Qualification -0.075** -0.065** -0.190*** -0.111*** -0.240** -0.157***
(0.031) (0.027) (0.072) (0.037) (0.094) (0.060)
During ACN final round -0.024 -0.027 0.100 0.050 0.134 0.101
(0.043) (0.039) (0.092) (0.067) (0.152) (0.122)
Country×qualifier FE Yes Yes Yes Yes Yes Yes
Week FE Yes Yes Yes Yes Yes Yes
4 Lags of conflict No Yes No Yes No Yes
Observations 5,050 4,646 5,050 4,646 5,050 4,646
R-squared 0.010 0.024 0.014 0.119 0.012 0.070
*** p<0.01, ** p<0.05, * p<0.1. Robust standard errors in parentheses clustered at the country×qualifier
level. Sample covers +/-25 weeks around the end of qualification process. During ACN final round takes
value 1 for qualified teams during the weeks in which ACN final-round matches are taking place, 0
otherwise. Conflict data come from the ACLED data set.

Afrobarometer Working Papers
Copyright ©Afrobarometer 2017 43
Recent Afrobarometer working papers
No. 176 Tannenberg, Marcus. The autocratic trust bias: Politically sensitive survey items and self-censorship. 2017.
No. 175 Liu, Shelley. Wartime educational loss and attitudes toward democratic institutions. 2017.
No. 174 Crisman, Benjamin. Disease, disaster, and disengagement: Ebola and political participation in Sierra Leone. 2017.
No. 173 Claassen, Christopher. Explaining South African xenophobia. 2017.
No. 172 Logan, Carolyn. 800 languages and counting: Lessons from survey research across a linguistically diverse continent. 2017.
No. 171 Guardado, Jenny & Leonard Wantchekon. Do electoral handouts affect voting behavior? 2017.
No. 170 Kerr, Nicholas & Anna Lührmann. Public trust in elections: The role of media freedom and election management autonomy. 2017.
No. 169 McNamee, Lachlan. Indirect colonial rule and the political salience of ethnicity. 2016.
No. 168 Coulibaly, Massa. Measuring democracy in Africa: Applying anchors. (French). 2016.
No. 167 Monyake, Moletsane. Does personal experience of bribery explain protest participation in Africa? 2016.
No. 166 Robinson, Amanda Lea. Ethnic diversity, segregation, and ethnocentric trust in Africa. 2016.
No. 165 Hounsounon, Damas. Décentralisation et qualité de l’offre de services socio-publics en Afrique subsaharienne. 2016.
No. 164 Mattes, Robert & Mulu Teka. Ethiopians’ views of democratic government: Fear, ignorance, or unique understanding of democracy? 2016.
No. 163 Manacorda, Marco & Andrea Tesei. Liberation technology: Mobile phones and political mobilization in Africa. 2016.
No. 162 Albaugh, Ericka A. Language, education, and citizenship in Africa. 2016.
No. 161 De Kadt, D., & Evan S. Lieberman. Do citizens reward good service? Voter responses to basic service provision in southern Africa. 2015.
No. 160 Aquino, J. A. The effect of exposure to political institutions and economic events on demand for democracy in Africa. 2015.
No. 159 Tsubura, Machiko. Does clientelism help Tanzanian MPs establish long-term electoral support? 2015.
No. 158 Claire, Adida L., Karen E. Ferree, Daniel N. Posner, & Amanda L. Robinson. Who’s asking? Interviewer coethnicity effects in African survey data. 2015.
No. 157 Bratton, Michael & E. Gyimah-Boadi. Political risks facing African democracies: Evidence from Afrobarometer. 2015.
No. 156 Croke, Kevin, Guy Grossman, Horacio A. Larreguy, & John Marshall. Deliberate disengagement: How education decreases political participation in electoral authoritarian regimes. 2015.
No. 155 Bleck, Jaimie & Kristin Michelitch. On the primacy of weak public service provision in rural Africa: Malians redefine ‘state breakdown’ amidst 2012 political crisis. 2015.

Afrobarometer Working Papers
Copyright ©Afrobarometer 2017 44
Afrobarometer Working Papers Series
Editor: Michael Bratton, [email protected]
Editorial Board: E. Gyimah-Boadi, Carolyn Logan, Robert Mattes, Leonard Wantchekon Afrobarometer publications report the results of national sample surveys on the attitudes of citizens in selected African countries toward democracy, markets, civil society, and other aspects of development. Afrobarometer publications are simultaneously co-published by the six Afrobarometer Core Partner and Support Unit Institutions. All Afrobarometer publications can be searched and downloaded from www.afrobarometer.org.
Support for Afrobarometer’s current Round 7 surveys is provided by the Swedish International Development Cooperation Agency (SIDA), Mo Ibrahim Foundation, Open Society Foundations, Bill & Melinda Gates Foundation, William and Flora Hewlett Foundation, U.S. State Department, National Endowment for Democracy, and Transparency International.
Core partners: Center for Democratic Development (CDD-Ghana)
95 Nortei Ababio Street, North Airport Residential Area
P.O. Box LG 404, Legon-Accra, Ghana
Tel: +233 21 776 142 Fax: +233 21 763 028
www.cddghana.org
Institute for Development Studies (IDS), University of Nairobi P.O. Box 30197, Nairobi, 00100, Kenya Tel: +254 20 2247968 Fax: +254 20 2222036 www.ids.uonbi.ac.ke
Institute for Empirical Research in Political Economy (IREEP) Arconville, Lot 104 - Parcelle J, 02 BP: 372, Cotonou, Republique du Benin Tel: +229 21 363 873/ 229 94 940 108 Fax: +229 21 362 029
www.ireep.org
Institute for Justice and Reconciliation (IJR) 105 Hatfield Street, Gardens, 8001, Cape Town, South Africa Tel: +27 21 763 7128 Fax: +27 21 763 7138 www.ijr.org.za
Support units:
Michigan State University (MSU) Department of Political Science
East Lansing, MI 48824, USA
Tel: +1 517 353 6590; Fax: +1 517 432 1091 www.polisci.msu.edu
University of Cape Town (UCT) Institute for Democracy, Citizenship and Public Policy in Africa Leslie Social Science Building Rondebosch, Cape Town, WC 7701
South Africa
Tel: +27 21 650 3827