working paper no. 150
TRANSCRIPT

WORKING PAPER NO. 150
ECONOMIC PERFORMANCE, POWER POTENTIAL AND GLOBAL GOVERNANCE:
TOWARDS A NEW INTERNATIONAL ORDER
Arvind Virmani
DECEMBER, 2004
INDIAN COUNCIL FOR RESEARCH ON INTERNATIONAL ECONOMIC RELATIONSCore-6A, 4th Floor, India Habitat Centre, Lodi Road, New Delhi-110 003
Website: www.icrier.org
ECONOMIC PERFORMANCE, POWER POTENTIAL AND GLOBAL GOVERNANCE:
TOWARDS A NEW INTERNATIONAL ORDER
Arvind Virmani
DECEMBER, 2004
The views expressed in the ICRIER Working Paper Series are those of the author(s) and do notnecessarily reflect those of the Indian Council for Research on International Economic Relations

CONTENTS
Page
FOREWORD I
1 INTRODUCTION 1
2 ECONOMIC SIZE AND POWER 3
2.1 Relative Size: GDP AT PPP 4
2.2 Evolution of Global Economy 52.2.1 Trend in Shares of World GDP 52.2.2 High Growth Economies 72.2.3 Relative Size in 2002 8
2.3 Power Potential 82.3.1 Power Potential Index 92.3.2 GDP At Exchange Rate 10
2.4 Actual Power: Strategic Public Goods 122.4.1 Military Power 122.4.2 Alliances 122.4.3 Index 13
3 NATURE OF POWER IN THE 21ST CENTURY 14
3.1 Globalisation And Interdependence 14
3.2 Realism 14
3.3 Natural Balance of Power 15
4 GLOBAL GOVERNANCE 17
4.1 Global Parliament: Double Majority 17
4.2 Global Security Council 184.2.1 Principles: Democracy & Power 184.2.2 Permanent Members, Weighted Veto 19
4.3 The United Nations 224.3.1 Reform Reality 24
4.4 World Bank, IMF and WTO 25
4.5 Time Lags 26
5 NEW INTERNATIONAL ORDER 26
5.1 Economic Forces & Projections 265.1.1 Population 265.1.2 Globalisation & Catch-up 275.1.3 Per-capita GDP Growth 28

4
5.1.4 Relative Size And Power 295.1.5 Global Growth Engines 32
5.2 Shift in Balance of Power 325.2.1 Bipolar or Tri-polar World? 335.2.2 Half Century of Uni-Polarity! 345.2.3 Asian Balance 365.2.4 Imbalance and Hegemony? 40
6 CONCLUSION 42
7 APPENDIX: FORECASTS 43
7.1 India and China 43
7.2 Appendix Tables 47
8 REFERENCES 49
TABLESPage
TABLE 1: AVERAGE GDP GROWTH DURING 1980 TO 2003 7TABLE 2: RELATIVE SIZE OF THE 20 LARGEST ECONOMIES IN 2002 11TABLE 3: PER CAPITA GDP GROWTH RATE (AVERAGE) 30TABLE 4: RELATIVE SIZE AND POWER POTENTIAL IN 2015 30
FIGURES
FIGURE 1: SHIFTS IN THE WORLD ECONOMY – GDP SHARES AT PPP (CURRENT INT $).....................6FIGURE 2: SHARE OF ASIAN COUNTRIES IN WORLD GDP AT PPP (IN CURRENT INT $).......................6FIGURE 3: DISTRIBUTION OF WORLD GDP (PPP, EXCH RT & AVERAGE) .................................................20FIGURE 4: PROJECTED RATIO OF COUNTRY TO USA GDP AT PPP (2002 INT. $).....................................31FIGURE 5: PROJECTED IMPACT OF COUNTRY GROWTH ON WORLD ECONOMY (GDP AT 2002
EXCHANGE RATE) ....................................................................................................................................................31FIGURE 6: CHANGING SIZE DISTRIBUTION OF GDP AND POWER POTENTIAL......................................35FIGURE 7: TRENDS IN POWER POTENTIAL AS MEASURED BY PP1.4..........................................................37FIGURE 8: PROJECTED SIZE OF CHINA RELATIVE TO INDIA .........................................................................38FIGURE 9: PROJECTED SIZE OF ASIAN COUNTRIES RELATIVE TO INDIA................................................38

i
FOREWORD
The founder Chairman of ICRIER, the late Shri K B Lall believed that an analytical approachwas needed for the determination of India’s economic relations with other countries. This was one ofthe reasons he founded ICRIER in 1981 along with all the leading lights of the economic profession inIndia at that time. Though economic relations have to be grounded in economic facts, economic lawsand economic impact, international relations go beyond these to incorporate geopolitical and otherissues. The current paper draws inspiration from this literature, and attempts to link and groundgeopolitical interactions in economic reality. The starting point is the economic size of Nation statesand their relative economic power. The paper starts by analysing past trends and ends by projectingthem into the future to define a global economic scenario for the next 30 years. Implications are thendrawn for geo-political evolution.
The paper proposes a definition of economic power that can be widely applied using easilyavailable published data. This is characterised by one parameter, variations in which can yielddifferent sub-scenarios of relative economic power. The paper goes on to argue that this relativepower represents the “Natural Power Potential” of a Nation. It is argued that the system of GlobalGovernance must be based on a fair sharing of the rights and responsibilities and that the ‘naturalpower potential’ represents such a fair metric. If global power is shared in proportion to this powerpotential not only will it be fair, it will also give the right incentive to Nation States to compete interms of economic advancement rather than in terms of military might. As many have written before,the current UN system reflects neither the current economic realities nor the democratic impulse thathas characterised the 20th century. It goes on to define certain principle and then applies them to showwhat a reformed system of global governance would look like, based on the relative position in 2002.
The projections of economic size and power potential show that tectonic shifts are under wayand will occur over the 1st half of the 21st century. These will result in a shift in global economic andpolitical power. Asia, in particular China, followed a decade later by India, will become an importantdriver of World economic growth. The weight of the World economy will gradually shift from theAtlantic to the Pacific and from Europe to Asia. Within Asia, the relative weight of China and Indiawill rise and that of Japan will decline. This will mean a dilution of the super-power status of theUSA and possibly a move to a bipolar World (China) followed gradually by the emergence of tri-polarity as India begins to catch up with China. Eventual multi-polarity would depend on theemergence of the EU as a virtual Nation State with independent defence forces and taxation power.Because of the very sharp ascent of China, the relative decline of the USA and a large gap betweenChina and the rest of Asia, the second quarter of the 21st century will be a period of heightened risk topeace in Asia. Use of an alternative parameter to represents power potential, however, yields adifferent sub-scenario in which the World will remain uni-polar for at least 25 years.
The USA, EU and India are democratic, free and culturally open societies that sharefundamental human values. It will be in the interests of the USA and EU to strengthen India’seconomic and technological capability over the next two decades for mutual benefit, peace andstability in Asia. The scenarios presented in this paper are merely one among many possibilities thatso often surprise forecasters. The USA, EU, Japan, India and other democratic countries can by theirenlightened and determined actions help bring about a World that is much more beneficial to all itscitizens than is suggested by some of these scenarios.
Arvind VirmaniDirector and CE
ICRIER
December 2004

1
1 INTRODUCTION*
State power is the “extent that (one) effects others more than they affect [one]”[Waltz
(1979)]. It is therefore a “combination of its capacity to resist the unwelcome influence of
others and conversely to influence others to behave as it wants them to.” 1 In the long sweep
of history power plays have been represented by warfare and consequently analysts have
argued that military power is the most important element of national power [Levy (1983)]. It
has also been pointed out that even in war the state with the most military strength does not
necessarily prevail [Mearshiemer (2001)].
The end of the colonial era, coinciding with the end of the second world-war, has led
in the second half of the 20th century to a post colonial world in which conquest of other
nations and peoples is no longer seen as a legitimate means of expressing national power. As
Francis Fukuyama noted (1989, 1992) the strengthening of the democratic impulse and
recognition of individual (as against States’) rights has played an important role in this
process. Over the same period the forces of globalisation have increased the mobility of
capital, goods & services and technology across countries. Temporary movement of people
across countries in the form of tourism has increased dramatically. As a result both
competition and co-operation among countries and their peoples has increasingly focussed on
the economic domain. Social cultural interaction has increased and ‘soft power’ has become
more important.2
This does not, however, mean that the role of military power in relations between
states has been eliminated. The threat of use of force can itself increase risk and thus harm
economic interests and well being. The nature of this role therefore needs to be redefined in
the 21st century. As Paul Kennedy (1988) emphasised, Economic Power is the foundation of
National Power. Even though military power disproportionate to economic power can be
used to enhance national power for a certain period of time, this is not sustainable over long
* Some of these ideas were first outlined in remarks made while chairing a session of the Indo-German Dialogueon Security Issues: “Dynamics of the Future International Order,” organised by Institute of Defence Studies &Analysis and Konrad Adenauer Foundation, at IIC annex on November 29-30, 1999. The relationship to GlobalGovernance Issues was outlined at an EU-India-USA Trilogue organised by the Hans Siedel & Konrad AdeneurFoundations in Brussels on 30th September 2004. My thanks to Mr. K Subrahmanyam,Vice Admiral Prem VirDas (retd), Mr B. K Zutshi and Nitin Desai for their detailed comments and to Air Commodore (retd) JasjitSingh Messers Henry A. Kissinger, Shashank, Lalit Mansingh, Alexander Nicoll, Amrl Gulab Hirnandani(retd),Bharat Karnad, and Brahma Chellaney for comments on earlier versions of the paper. Any shortcomings remainthe author’s responsibility.1 These and other introductory references are based on Perkovich’s (2003) answer to the question, ‘What Makesa Great Power?”2 The first use of this word is attributed to Joseph Nye. See also Held et al (1999).
2
periods. This is particularly so in the post-colonial world, as the option of colonial conquest
to expand economic power and thus eliminate the discrepancy has virtually disappeared.
Diplomacy, partnerships, strategic relationships and alliances also retain their
relevance. Gerald Segal (1999) pointed to the skill with which China has mastered what he
called the Diplomacy of Power. The skill lay in making the established world powers believe
that China is the second most powerful nation in the world (which it is in GDPppp) rather
than the seventh (as per GDPus$). India in contrast has been singularly ineffective in making
the World recognise it as one of the five largest powers.3 Its democratic, open and free civic
& political system would entitle it to be part of a new democratic concert, perhaps an
expansion or modification of the G7 (G8).
This paper argues that the new order must be based on natural power potential defined
primarily in economic terms. The nineteenth century concept of ‘Balance of power’ must
gradually give way to the “Natural Balance of Power” that has economic size at its base.
This balance of power can also be a “Stable Balance” if the International order recognises,
promotes and preserves the natural balance. There will however be heightened risks during
the transition because of the tectonic shifts taking place in power potential. To minimise the
risks we need to build a new system of global governance that reflects the natural power
potential. The old systems of global governance like the United Nations and its institutions
are widely recognised to reflect the power relations that existed at the end of the Second
World War. The world has changed dramatically since then. The most important of these is
the rise in the share of Asia in the global economy and the gradual decline of the shares of the
USA and Europe. This trend will continue in the 21st century and become more prominent.
The new global system of governance must reflect these shifts in the global economy if a
stable and peaceful World order is to be established in the 21st century. Global institutions
must either be reformed to reflect the new realities or new institutions built.
The rest of the paper is in four sections. The next section defines and presents trends
in the relative size of large countries. It then goes on to define a simple measure of power
potential based on economic concepts. Section 3 explores the concept of Natural Balance of
Power. Section 4 spells out the implications of these for reforming the structures of Global
Governance in the light of certain principles of fairness and realism. Section 5 presents
economic projections for the largest economies and their likely power potential. Based on
3 It has been included in the Group of 20 (G20) formed in 1999.

3
these it suggests the likely shift in the global balance of power and explores some of the
implications for the USA, EU, Japan and India. Section 6 concludes the paper.
2 ECONOMIC SIZE AND POWER
Tellis et al (2000) have developed a comprehensive and complex model for measuring
power in terms of the ability of a State to achieve and sustain global hegemony. In their
model military capability is the outcome of an interaction between national resources and
national performance. National resources consist of five building blocks of poser, technology
enterprise, human resources, financial/capital resources and physical resources. National
performance contains three factors, infrastructural capacity, ideational resources and
ideational resources that augment or detract from the utilisation of these natural resources.
This paper takes an economics perspective and applies the principle of Occam’s razor,
that is it presents the simplest possible indicators of power grounded in economic reasoning.
The factors mentioned in the Tellis model are all inputs into the productive capacity of an
economy, though their economics nomenclature and definition may be different. Thus a
country’s natural resource (e.g. oil), physical capital stock (including the stock of
infrastructure), human capital (education & skills) and technology (including management,
marketing and entrepeneurship) are all inputs into the production of national output and are
formally included in the aggregate production function of the economy.4 The Gross
Domestic Product of a country, which is the output produced by all these inputs, given the
external (e.g. technology denial) and internal (e.g. quality of governance, social
divisions/conflicts) constraints facing economic agents, is therefore a summary index of its
‘national resources’ and ‘national capacity.’ Even more broadly the growth of a country’s
GDP and the level it has reached reflects both the strengths and weakness of its Society
(Social capital, religion, culture, family) and Institutions (Political, market regulating, Non-
profit organisations, civil) in addition to the its National Policies.5
The GDP of a country contains different types of goods & services among which
‘public goods’ like Defence/military (Police, roads). The potential for producing military
related goods & services is therefore also captured by the total GDP. Military capability is
however the outcome of an interaction between this potential, the special external constraints
4 y = f( (k, h, r, T), where y is GDP, k is the stock of physical capital, h is the stock of, human capital, rrepresents natural resources (e.g. oit, minerals), and T is the level of technology(broadly defined).5 The quality of institutions is an important determinant of growth. Social capital and related variables are alsofound to be significant.

4
that apply to military technology and a nation’s choice on how much of the output should be
in the form of military goods & services. The GDP of a country is therefore a good measure
of economic strength and a basic measure of military potential. The relative GDP of two
counties is therefore the simplest measure of relative power potential. A more general
measure of overall power potential is presented subsequently that has this as a special case.
2.1 Relative Size: GDP AT PPP
The Gross Domestic Product of an economy combines population (N) and per capita
income (y), in the most natural way. Namely,
Equation 1: GDP (Y) = Population * Per Capita GDP = N * y
Population N represents the manpower potential which can be used for both economic
(workers) and military (soldiers) purposes. Per capita GDP y represents the average
productivity of the population and summarises its diverse capabilities. These two variables
have often been used historically as indicators of national power, along with GDP.6
The GDP of each country is normally measured in local currency units (LCU) and
must be converted to a common unit of account before it can be compared with another. The
best way to compare two country’s economic size & per capita income is to measure GDP
(Y) and per capita GDP (y) at purchasing power parity. Technically this method solves the
Index Number Problem of comparing two different baskets of goods and services? Normally
this is done by using a common set of prices to aggregate all goods and services in each
basket. This is the approach taken by Heston-Summers in deriving PPP estimates for
countries. These estimates are available for most countries from 1975 onwards. The ratio of
GDP measured at purchasing power parity is therefore the best available measure of relative
economic size and the simplest measure of relative power potential.
A common method of converting GDP measured in LCU to a common currency (US$
say) is by using the current US$/LCU exchange rate. The argument of those using this
measure of GDP (X) is based on a theoretical construct that is applicable in the (very) long
run. That is, if there are no controls or taxes on imports and exports, relative prices of all
goods in all countries will converge and the exchange rate will reach a purchasing power
parity (PPP) equilibrium. Clearly if and when all prices converge across countries this
measure is equally good or even better and can be used to compare GDP of different
6 Singer, Bremer and Stuckey (1972)
5
countries. It can therefore be used to convert and compare the different baskets of goods &
services (X). Econometric tests have however shown that the exchange rate reaches a PPP
equilibrium (even for the set of OECD economies) only over long periods (20-30 years). For
countries at very different levels of development, relative prices of non-tradable services will
not converge as long as per-capita incomes have not converged. Nevertheless the GDP at
current exchange rate (X) is relevant for comparing international trade (exports and imports)
and financial flows between countries as these take place at the current exchange rate.
2.2 Evolution of Global Economy
2.2.1 Trend in Shares of World GDP
During the last 30 years or so the weight of the world economy has shifted from the
USA and developed Europe (OECD) to Asia (South, Southeast & East). Within Asia the
weight has similarly shifted from Japan towards China and India (Figure 1 & Figure 2).
OECD Europe has seen the greatest decline in global GDP share by 4.9% points followed by
USA and Japan with a decline of about 1% points each. The share of Latin America and
Africa in World GDP has also declined by about 1% point each. With the gradual inclusion
of much of E. Europe (former USSR) in the European Union and the faster growth of these
economies the sharp downtrend in European Union (and Europe’s) share is likely to be halted
and perhaps reversed. Any reversal is however likely to be short-lived because of declining
populations in many European countries.
Within Asia the declining global share of Japan since 1990 has been more than made
up by the rising share of China and India (Figure 2). During the seventies and eighties
ASEAN and during the eighties S. Korea along with China & India also contributed to the
rising share of Asia in world GDP. Between 1975 and 2002 Japan’s share of world GDP fell
by 1% point while that of S. Korea, ASEAN, India and China rose by 1%, 1.2%, 2.2% and
9.2% respectively. Thus India’s gains since 1980 have been much larger than ASEAN & S.
Korea but much less than those of China.

6
Figure 1: Shifts in the World Economy – GDP Shares at PPP (current int $)
Figure 2: Share of Asian Countries in World GDP at PPP (in current int $)
5%
10%
15%
20%
25%
30%19
7519
7619
7719
7819
7919
8019
8119
8219
8319
8419
8519
8619
8719
8819
8919
9019
9119
9219
9319
9419
9519
9619
9719
9819
9920
0020
0120
02
Sh
are
of
Wo
rld
GD
Pp
pp
(%)
USA Europe(OECD) S, SE & E Asia
Latin America Africa & Mid-east Linear (USA )
0%
2%
4%
6%
8%
10%
12%
1975
1976
1977
1978
1979
1980
1981
1982
1983
1984
1985
1986
1987
1988
1989
1990
1991
1992
1993
1994
1995
1996
1997
1998
1999
2000
2001
2002
Sh
are
of
Wo
rld
GD
Pp
pp
(%
)
Japan China India
ASEAN S. Korea Australia & N Zealand
Mid-east & N Africa

7
2.2.2 High Growth Economies
Underpinning these trends in the rising share of Asia in the global economy are the
fastest growing economies in the World. The ten fastest growing economies in the World
during the period 1980 to 2003 were in Asia (including the mid-east). Though several
scholars have pointed out, and the IMF and World Bank have acknowledged, the growth rate
of the Chinese economy may be over-estimated by about 2% points during the 1980s and
1990s, no adjustment has been made for this factor in Table 1. Even with such an adjustment
China with an average growth rate of 7.5% per annum is the fastest growing economy during
this period. The growth performance of what were called the NICs, Singapore, S. Korea,
Taiwan, China and Hong Kong has long been recognised, even though the last is no longer in
the top ten (12th rank). The growth performance of the ASEAN countries, Malaysia,
Thailand, and Indonesia was recognised and appreciated, along with that of the NICs in the
World Bank’s Asia Miracle Study.
Vietnam ranked 4th and India 9th have been referred to along with China as the New
Asian Miracle economies. Few still know that India has been the 9th fastest growing
economy for the 24 years from 1980 and not just since 1992. There is also very little
volatility in this growth rate, compared to the other Asian economies that have grown faster
than India. As a consequence of the Asian crisis of 1998 and the competitive pressure from
China in terms of manufacturing FDI and Exports, most of the ASEAN economies as well as
S Korea have slowed and are unlikely to grow as fast as they have in the past. Thus India is
likely to move up the growth rankings even if its growth rate remains unchanged.
Table 1: Average GDP Growth during 1980 to 2003
Table1a: GDP Growth Table1b: Per capita GDP Growth1980 to 2003 1980 to 2003
Economy RankAvg
. Economy RankAvg
.China, PRC 1 9.5 China, PR 1 8.2Singapore 2 6.7 Korea, Rep. 2 5.6Korea, Rep. 3 6.7 Taiwan, China 3 5.3Vietnam 4 6.5 Thailand 4 4.7Taiwan, China 5 6.5 Vietnam 5 4.6Oman 6 6.5 Ireland 6 4.5Malaysia 7 6.2 Singapore 7 4.2Thailand 8 6.0 Hong Kong 8 3.9India 9 5.7 India 9 3.7Indonesia 10 5.3 Luxembourg 10 3.7Authors calculations based on data Indonesia 11 3.6from WDI 2003 & WEO April 2004 Malaysia 12 3.6
8
2.2.3 Relative Size in 2002At the start of the new millennium the ranking of the 20 largest economies in terms of
size is shown in Table 2. USA the largest economy is almost 2 times the size of the next
largest economy China and about three times the third largest economy Japan. The fourth
largest economy India is a little over one-quarter the size of the US economy. The next five
positions are taken by the big four of Europe. Germany which was overtaken by India at the
end of the decade, UK, France and Italy. Brazil and Russia bring up the rear of the 10 largest
economies. It should be noted that Japan, India, Germany, and Brazil have staked their
(joint) claim to permanent seats on a reformed UN Security Council. This would leave Italy,
whose economy is 12.5% larger than that of Brazil as the only one among the top ten without
a permanent seat on a ‘new’ Security Council.
Relative size should not however be confused with average income. As the size of
GDP is the product of population and per capita income and India and China are the two
poorest among the 10 largest economies their large economic size is based on their large
populations. These two along with Indonesia are the three poorest among the 20 largest
economies (table 2). The fact that two of the five largest economies in the world have much
lower per capita income than the other large economies is historically speaking a very
unusual situation, however. Despite the increase in their size and power they will remain
much poorer than the currently rich countries for at least a century. This may affect the
interplay between them in a manner different from what has been historically observed.
2.3 Power PotentialMany have argued that technological prowess is a separate input into the relative
power of a country. This argument has weakened with globalisation. Technological mobility
with regard to civilian technology has increased dramatically during the 20th century. The
extent of this mobility is apparent from the fact that the USA (and EU) have, during the
1980s and 1990s, encouraged transfer of sophisticated technology to NPT nuclear member
China, the country most likely to challenge thier power in the 21st century. To the extent
technology is mobile it is already reflected in GDP (and in growth). There are, however,
restrictions on transfer of “Dual use” technologies and on advanced military technology,
technologies that can be referred to as the “technologies of power.” These restrictions are
imposed so as to maintain an oligopoly or monopoly over strategic technology that can be
translated into military power. Therefore inherent technological prowess is still a factor in
determining national power.

9
2.3.1 Power Potential IndexWe can define a measure that gives much greater weight to technological
achievement. In economic terms, per capita GDP (y), is closely correlated with capital
intensity (average capital stock k), level of education/skills (h) and level of technology (T).
Formally, the aggregate production function defines the relationship between these as,
Equation 2: y = T f(k, h, r),
Where f is a function of k the per capita capital stock and h the per capita human
capital (combination of education and skills) and r the per capita domestic availability of
natural resources. Therefore technology level T is not directly measurable, but is implicitly
defined by inverting the production function, i.e.
Equation 3: T = y/f(k, h, r)
The level of technology is formally defined by T. Per capita GDP y however captures
the level of technology along with the physical and human capital needed to convert this
potential into actual goods and services (including military) as well as the efficiency with
which it is being done. Power potential (PP) can therefore be defined as a weighted average
of population (N) and per capita GDP at purchasing power parity (y):
Equation 4: PP = (Population)* (Per capita GDP)αα = N * yαα , with 1 < αα < αα m
αm is the maximum value of α, which in this paper we will take as 1.4. If α=1, PP is
identical to GDP at purchasing power parity. A value of α greater than 1 would give greater
weight to technology than GDPppp, with the weight given to technology increasing with the
value of α. On rearranging Equation 4 we obtain,
Equation 5: PP = Tf *Y, Tf = yββ , with 0 < ββ =1-αα < 1-αα m
This equation shows that the Power Potential PP is the product of a technology factor
Tf and the GDP at purchasing power parity Y (same as in Equation 1). We can convert the PP
into an index PPI by dividing the PP of each country j by the implicit PP for the World i.e.
Average per capita GDP at PPP for the World (yw) and World population (N w):
Equation 6: PPIj = A*(Nj*yjαα )/ *(Nw*yw
αα ) = A*(Tf j/Tfw)*(Yj/Yw)
This index is similar in form to the share of a country’s GDP in world GDP (A=0.713 in this
paper).

10
2.3.2 GDP At Exchange RateThe gap between Per capita GDP measured at current exchange rates (x) and the per
capita GDP measured at purchasing power parity (y) is found to be inversely related to the
latter. That is the gap is the highest at low incomes and declines as income rises. This can be
summarised as follows:
Equation 7: x = C ya
The log form of this equation log (x) = Log (C) +a * log(y) can be estimated using the
cross-country data for medium-large countries in 2002 to yield C = 0.0147, a = 1.38.7 Thus
Equation 7 becomes:
Equation 8: x = 0.0147 y1.4
On comparing this with equation 4 for PP it is seen that if the value of α=1.4, PP is
identical to Per capita GDP at current exchange rate, except for a multiplicative constant
(0.0147).8 In other words the relative share and relative ranking given by the two (X and PP
with α=1.4) will be broadly the same except for short-term deviations arising from large
devaluation. For instance, India because of a devaluation of 25% in 1992, which at one stroke
reduced the USD value of its GDP (X), ranks much lower in terms of X than in terms of PP
with α=1.4 ( Table 2).
In general however the relative share of World GDP at purchasing power parity and
the relative share of World GDP at current exchange rate represent the range of possibilities
for measuring the relative power potential of nation states (if αm = 1.4)
7 That is all countries with GDP at PPP of $15 bi or more.8 In any regression estimate there is also an error term. In other words individual countries will not lie exactlyon the estimated curve but above and below it. For instance India, because of a major devaluation in 1992 liesbelow the long term curve. In other words its ranking in terms of GDPxr is lower than would arise from theindex which represents the long run position.

11
Table 2: Relative Size of the 20 Largest Economies in 2002
Economy GDP at PPP GDP at exchange rate Z=(Y+X)/2 PPI (α=1.4) Pop(Int$bi) Rnk Wshare Pcpita (US$bi) Rnk Wshare Pcpita Wshr Rnk Share Rnk Wshare
USA 10308 1 21.3% 35746 10383 1 32.3% 36006 25.7% 1 27.2% 1 4.7%China PR 5861 2 12.1% 4577 1266 6 3.9% 989 8.8% 3 6.8% 3 20.7%Japan 3425 3 7.1% 26937 3993 2 12% 31407 9.2% 2 8.1% 2 2.1%India 2800 4 5.8% 2670 510 11 1.6% 487 4.1% 5 2.6% 8 16.9%Germany 2236 5 4.6% 27102 1984 3 6.2% 24051 5.2% 4 5.3% 4 1.3%France 1601 6 3.3% 26921 1431 5 4.5% 24061 3.8% 7 3.8% 5 1.0%UK 1549 7 3.2% 26155 1566 4 4.9% 26445 3.9% 6 3.6% 6 1.0%Italy 1525 8 3.1% 26429 1184 7 3.7% 20528 3.4% 8 3.6% 7 0.9%Brazil 1355 9 2.8% 7766 452 13 1.4% 2593 2.2% 9 1.9% 10 2.8%Russia 1186 10 2.4% 8229 347 16 1.1% 2405 1.9% 12 1.7% 12 2.3%Canada 925 11 1.9% 29484 714 8 2.2% 22777 2.0% 10 2.3% 9 0.5%Mexico 905 12 1.9% 8972 637 10 2.0% 6320 1.9% 11 1.4% 14 1.6%Spain 878 13 1.8% 21457 653 9 2.0% 15961 1.9% 13 1.9% 11 0.7%Korea, S 807 14 1.7% 16946 477 12 1.5% 10006 1.6% 14 1.6% 13 0.8%Indonesia 683 15 1.4% 3225 173 27 0.5% 817 1.1% 17 0.7% 18 3.4%Australia 556 16 1.1% 28262 409 15 1.3% 20822 1.2% 15 1.3% 15 0.3%Taiwan,China 477 17 1.0% 21293 282 17 0.9% 12586 0.9% 18 1.0% 17 0.4%Netherlands 470 18 1.0% 29105 418 14 1.3% 25886 1.1% 16 1.1% 16 0.3%South Africa 457 19 0.9% 10074 104 35 0.3% 2299 0.7% 21 0.7%Turkey 445 20 0.9% 6388 184 25 0.6% 2638 0.8% 19 1.1%Iran 438 21 0.9% 6687 108 34 0.3% 1652 0.7% 23 1.1%Thailand 432 22 0.9% 7009 127 31 0.4% 2060 0.7% 22 1.0%Argentina 413 23 0.9% 11312 102 37 0.3% 2797 0.6% 25 0.6%Poland 408 24 0.8% 10556 189 23 0.6% 4894 0.7% 20 0.6%Philippines 333 25 0.7% 4171 78 43 0.2% 975 0.5% 30 1.3%
12
2.4 Actual Power: Strategic Public Goods
2.4.1 Military PowerPP is a measure of power potential not actual power, because the technological
capability associated with higher per capita income has to be used to develop military & dual
use technology and translated into military strength before it becomes effective. The starting
point is the ‘will to power’ (i.e. national motivation to achieve national power and the
organisation of national security systems to achieve it). From this arises a strategic vision
and the appropriate allocation of public resources for strategic purpose. As military
expenditure and military R&D are technically “Public goods,” two countries with the same
level of “potential power” may choose to spend different amounts on different types of public
goods. One country may spend more on military R&D and armaments and another on
highways, urban amenities, forest conservation and the environment. We expect actual
power to rise with the ratio of strategic expenditure to public welfare expenditure up to some
limit after which it starts declining (inverted U shape). In the rising portion of the curve
therefore, of two countries with equal power potential, a country that spends more on
strategic public goods would be more powerful than one that spends more on other public
goods. If the expenditure ratio (strategic to other public goods) moves beyond the peak it
would represent strategic over-stretch and would ultimately undermine actual power.
The ‘actual’ power of Russia and Japan relative to their power potential illustrates
these aspects. Russia’s effective/actual power appears to be higher than its 16th rank in GDP
at current exchange rate, 12th rank in PP1.4 (i.e. with α=1.4) and perhaps even its 10th rank
in GDP at PPP (PP1 α=1). This is because of its historical legacy of the USSR, whose global
ambition converted the world into a bi-polar one, and the R&D and military development that
it undertook to achieve this goal. Similarly Japan’s power is lower than that indicated by its
ranking according to either criteria (Y 3rd rank, X 2nd rank) because of its Pacifism since
World War II and its deliberate policy (till very recently) of underplaying its own strength.
2.4.2 AlliancesFormal alliances and informal arrangements have been used to overcome inherent
technological differentials through transfer of strategic technology and thus change the
‘actual’ power and to some extent the ‘power potential’. The transfer of military technology
allows the recipient country to spend less on developing these technologies and to divert
revenues to other public goods including weapons. For instance, transfer of missile and

13
nuclear technology from the USSR to China during the fifties and sixties was a major factor
in the development of China’s strategic defence capabilities. China in turn is reported to have
informally passed on these technologies including an atomic bomb design to Pakistan. 9
Pakistan is a State whose inherent technological potential is not even in the top 25. It in turn
has passed on elements of this technology to Iran, Libya, S. Arabia and N. Korea (which also
received technology directly from China) that are even further down the technology ladder.10
India acquired nuclear weapons capability in 1974 (first nuclear test), six years after
China (1968), because its inherent technological potential (as measured by PPI) was higher
than that of China’s till the mid-1980s.11 The denial of technology to India by the West since
then, contrasts sharply with China’s favoured access during the eighties and nineties and has
been a factor in the growth of China’s power vis-à-vis India.12 Formal and informal alliances
can therefore play an important role in determining ‘actual power’ vis-à-vis ‘potential power’
and if used productively (i.e. to promote growth instead of consumption) can also affect the
power potential of the recipient country.
2.4.3 IndexThough a standardised approach to measurement of power is useful it can be partially
negated by geopolitical arrangements. An alternative would, therefore be to construct a
completely separate index of military technology and capabilities and then combine it with
measure of relative size (Y) to get a measure of power. A new global system based on this
would, however, give too much incentive to develop military technologies, convert them into
arms and to assert military power. The post-war UN Security Council reflects such a system
based largely on military and technological achievements and the views of the World War II
victors.
9 Pakistan had the additional advantage of complete designs for a uranium enrichment plant from Netherlands (ala A Q Khan Xeroxing activity in URENCO) and access to the supply network of URENCO spread overGermany, Netherlands, UK etc. for critical components.10 K Subramanium raised the possibility of such transfer when Saudi Arabia purchased M19 and other missilesfrom China decades ago. Both Saudi Arabia and Libya were identified by him and others as financiers of thePakistan nuclear program and the possibility of a quid pro quo was also raised in discussion of Bhutto’s “IslamicBomb.” Sale of technology to Iran was, however, less anticipated by Indian strategic analysts.11 The NPT was signed in 1972, only two years earlier by all major powers except India. One option wouldtherefore be to extend the NPT cut-off date for acceptance of nuclear status to 1974 and thus incorporate Indiaas a nuclear power under the NPT.12 What K Subramanium dubbed “Nuclear Aparthied” a word later picked up by Jaswant Singh.
14
3 NATURE OF POWER IN THE 21ST CENTURYThe world is gradually moving towards the recognition of democratic rights of all
human beings living in this world and globalisation has increased the interdependence
between economies. The world will, in our view, gradually move towards a concept of power
grounded in relative economic strength and economic inducements rather than on military
might and military threats. The concepts of “realism” and “balance of power” will however
continue to have relevance in the relations between nation states for the foreseeable future.
These two concepts can be synthesised to derive the concept of “Natural Balance of Power.”
3.1 Globalisation And InterdependenceThe Globalisation that has occurred in the 20th century will influence the evolution of
the New Global Order in the 21st century. The essence of globalisation from this perspective
is the removal of barriers to and the reduction of costs and risks of, the flow of commercial
technology, financial capital, goods & services and people between countries. The last mostly
covers temporary flow e.g. tourism, while medium-long term migration flows remain much
smaller than they were in the 19th century. The global economy, including both the rich &
powerful countries and the relatively poor and less developed ones, depend on such global
flows. Thus there is much greater economic inter-dependence on a continuing basis than in
earlier centuries. The dark side of globalisation is the increased access to Weapons of Mass
Destruction (WMD) and greater ease in undertaking cross-border terrorism. It is now easier
for determined individuals with sufficient funds, to procure WMDs and to cross international
borders to engage in terrorist acts.13
3.2 RealismProf. Kissinger (1994, 1995) the best known recent practitioner of “Realism” and
analyst of the “Balance of Power” in International relations has said: “In the emerging
international order, nationalism has gained a new lease of life.” “Nations have pursued self-
interest more frequently than high minded principle and have competed more than they have
co-operated. There is little evidence to suggest that this age-old mode of behaviour has
changed, or that it is likely to change in the decades ahead.”14 “The balance-of-power
system…when working properly, ...was meant to limit both the ability of states to dominate
13 Though the issues of Terrorism/Fundamentalism and WMD are outside the scope of this paper, both thesefactors will tend to reinforce one of the conclusions of this paper, that the powerful democracies of N. Americaand Europe need to strengthen India (with which they share many fundamental human values) in their owninterest and for mutual benefit. See also Huntington(193,1996).14 Page 19 of Kissinger (1995).
15
others and the scope of conflicts. Its goal was not peace so much as stability and
moderation.”15 The observations of Professors Kissinger and Kennedy have to be integrated
and modified to account for the influence of democratic forces in truly open and democratic
societies, countries where people’s sovereignty is not just a façade and elections a ritual for
propaganda purposes.
An ideal (but unrealistic) world order could legitimately be based on the democratic
principle of one-person one vote, no matter what the ethnic or national identity of the person.
This would effectively mean that power is proportional to population. 16 This is clearly
unacceptable to those populations, which have greater achievements in the field of
economics, technology or military. Economic and technological achievements of a nation
translate directly into per capita GDP and are closely correlated with per capita income.
Economic size (Y = GDPppp), based as it is on a multiplicative combination of population
and economic achievement (per capita GDP) is therefore a more realistic basis for a world
order.
3.3 Natural Balance of PowerThe 19th century power balance was conceived largely in terms of military power
(essence of ‘Realism”). The development of nuclear weapons has made conventional
military balance less important. For instance, even though Russia’s economic power is a
fraction (1/5th) of that of China the latter is unlikely to threaten the former militarily because
of its formidable nuclear deterrence. Military power does not however free it completely
from economic and diplomatic pressures.17 Military strength and conventional balance of
power have therefore not necessarily become irrelevant as some analysts have implied. For
instance, a pacifist Japan without nuclear weapons and small defence forces and with an
economy about half the size of China’s would likely bend to Chinese pressures if it was not
covered by the US nuclear umbrella.18 India with an economy less than half China’s will not
be able to maintain its decision-making autonomy if the size gap widens, unless it has a
credible Nuclear Deterrent and sufficient military power.
15 Page 21 of Kissinger (1995).16 At the other extreme, a colonial world was based purely on the military superiority of nations, philosophicallyjustified by ideas similar to those that justified slavery & serfdom.17 For instance China’s controlled media recently objected to the visit of the Dalai Lama, a Buddhist leader toRussia (despite his having repeatedly and publicly declared that his objective is to preserve the cultural andreligious autonomy of Tibet within China). It is doubtful if Russia would be able to resist such pressures if itdid not still have some of its historical military and technological power.18 Despite this Japanese Prime Ministers have repeatedly and routinely apologised to China for World War IIand given aid under pressure, while China (reportedly) supported the development of WMDs by North Korea.

16
To discriminate between legitimate and illegitimate use of national power in the
modern world we can define a concept of, “Natural Balance of Power” based on the
economic definition of power potential PP (Equation 5). The Natural Balance of Power can be
defined as one in which National Power, International standing and Global rights and
responsibility are proportional to relative power potential (Equation 6).19 Such a system would
be consistent with peaceful economic competition among states and provide an incentive for
diverting competition from the military to economic dimension.
The Natural Balance of Power can be a Stable Balance of Power if,
a) Relative Military strength is proportionate to relative economic strength. Such a militaryposture is in general rational and legitimate.
b) Initiators of “Disproportionate/Aggressive” Military Build-up (i.e. in excess of economicstrength) can in principle be identified and isolated by the International System / Globalpower(s) before a “Defensive/Reactive” build-up by potential victims.
c) Changes in relative economic power are accommodated by mutual adjustment ofinternational power relations. The international standing of high growth economies isallowed by the established powers, to rise while (established) low growth economiesgracefully accept the fall in their international standing. The system of global governanceis periodically (every decade or two) is adjusted in accordance with the changes that aretaking place.
d) Co-operative and inclusive regional and global structure of economic relations exist,which increase interdependence and raise the costs to any Nation that disrupts the globaleconomy through aggressive actions.
Cataclysmic changes in the economic balance can however disturb the natural
balance. More than in the domestic context, “Power corrupts and absolute power corrupts
absolutely.” So too the sudden acquisition of enormous national power in the hands of a
ruling oligarchy can corrupt its intentions and global ambitions for the Nation. In such a
period of transition, the classical 19th century concepts of ‘Balance of Power’ may still be
relevant for avoiding hegemony and maintaining peace.20
During the 21st century the world is likely to move towards this concept of ‘Natural
balance of power’ in global relations. The speed with which it does so depends partly on the
adoption and propagation of this concept by the global community and partly on the spread of
democratic ideals and practices.
19 Adjustments would have to be made for unsettled borders and number of hostile neighbours.20 An imbalance of power allows a hegemonic power to fearlessly proliferate nuclear and missile technology toa potential rival’s hostile neighbour and thus undermine the rival’s security without directly threatening itmilitarily. The net result is the same. Such 19th century real politics requires offsetting arrangements by theadversely affected nations.
17
4 Global GovernanceThe current institution of global governance is the UN system (Security Council &
General Assembly) along with the associate organisations like the World Bank and the IMF.
The UN Security Council reflects the power balance at the mid-point of the 20th century. As
the World economy has changed considerably since then, there is a widely felt need to review
the entire system. A credible reform has to be based on the principles of democratic
legitimacy and natural power potential.
4.1 Global Parliament: Double MajorityGlobal governance in the 21st century must be based on two principles: One is the
Democratic Principle, that “All men are created equal.” In the domestic context this means
one person one-vote and that all are equal before law (rule of law). In the global context we
can interpret this to mean proportional representation of World population in institutions that
will take decisions regarding social & human development polices (health, environment,
education etc.) that have direct bearing on people e.g. Policy regarding negative global
externalities such as global warming and HIV-AIDs.
On the basis of population in 2002, the people resident in China would have the
highest vote share of 21%, followed by residents of India with 17%, USA with 5% and
Indonesia and Brazil with about 3% each and Russia and Japan with over 2%.
The proportional representation can be implemented in two ways: Either country
governments would have a weighted vote in such organisations that are proportional to their
population or that people would democratically elect representatives to such global
body/bodies under rules, regulations and procedures that are globally determined and
monitored. The former is more realistic to start with, but gives undue power to dictatorial
regime vis-à-vis their own citizens as well as the citizens of the world. The latter would be
closer to genuine democracy and empowerment of global citizenship. It is an extension of
what is beginning to happen in the European Parliament to a World parliament.
Unlike in a National Parliament the Global Parliament is unlikely to have in the near
future any independent revenue sources, as richer States are unlikely to cede the right of
taxation of their citizens to a global authority. The global parliament will therefore be
dependent on the contributions of member States. Each Member State would have to
contribute in proportion to its ‘natural power’ and would be entitled to a weighted vote in

18
proportion to this power.21 A weighted majority vote would be required for passing the social
budget, which would include expenditures on global public goods and global social concerns.
There could, however, be a conflict of interest between the economic majority that
contributes the finances and the population majority that decides what social policies are in
the best interests of global citizens. As double majority vote could therefore be required to
pass the social (non-security) expenditure budget.
4.2 Global Security Council
4.2.1 Principles: Democracy & PowerThe second issue is that of global security and the reality of power. In the domestic
context, the Nation State has the monopoly of violence over its citizens. It uses this power (or
is supposed to use) for protecting its citizens form deviants and from external aggressors. No
State is going to cede this monopoly of violence over its own citizens to a global government,
in the foreseeable future. Thus the power of global government to ensure global security can
only be a co-operative aggregation of the power of nation states for global purpose. Thus
each nation must have a fair share of power in a new global Security Council responsible for
global security. We have argued that the natural balance of power based on relative
economic strength represents such a fair sharing of power in a peaceful world. A fair and
equitable system of global governance is therefore one in which each Nations’ rights and
responsibility for global security are commensurate with the natural balance of global power.
The above principle has two major implications, one relating to permanent
membership and veto power, and the other relating to regional representation. Permanent (P-
V) membership and ‘veto’ power must go together, with the ‘veto’ re-formulated as follows.
Each P-V member would be assigned a weighted vote in proportion to its natural power
potential. A total weighted vote of v% by the permanent members would constitute a veto,
where v could be 1/3rd or 1/2. The P-V members have to be selected from a set of countries
ranked according to their ability to act globally by applying a cut-off to this ranking. The cut-
off point has to be based on a trade-off between compactness of the council and the
comprehensiveness of the power represented. The vote shares would be updated at pre-
determined intervals (every decade say) to account for continuing changes.
Regional organisations cannot be P-V members because they neither have the security
forces or the right to taxation of their citizens. Even the EU, which is just starting on this
21 If a country does not want to contribute as much as its vote share its voting rights must be correspondinglyreduced.

19
path, may take decades to reach a point where it has exclusive rights over the security forces
and the right to taxation of EU citizens. Regional representation must therefore be in the
form of non-veto yielding non-permanent membership (NP-NV). The system for selecting
regional representatives must be fair to the regional powers. Either the probability of being in
the council or the proportion of years that they are on the Council must therefore be
proportional to the nations’ relative power. Thus for instance Nigeria and S. Africa are both
important regional powers in Sub-Saharan Africa, but their Natural power is relatively weak
(table 2). Though they cannot be P-V members, they should be represented on the Sub-
Saharan NP-NV seat in proportion to their ‘natural power potential’ in Sub-Saharan Africa.
4.2.2 Permanent Members, Weighted VetoAs outlined in sectio 2.3 the Power Potential of a country can be characterised by the
parameter α, which ranges from 1 to 1.4. When α=1 the relative power potential of a nation
can be represented by its share of world GDP measured at purchasing power parity (Y).
When α=1.4, the power potential of a nation can be approximated by its share of world GDP
at current exchange rates (X).22 We can also define an intermediate case in which the power
potential is defined by the average Z=(Y+X)/2 of the two extremes.
The shares calculated for the year 2002 are shown in Table 2 with the countries ordered
by country size (i.e. Y). Figure 3 (A & B) also show the share of GDP (Y, X and Z) on the
vertical axis with the countries ordered by size on the horizontal axis. The greatest changes
occur in the relative ranking of India, China, Russia and Brazil, if we move from one measure
of power potential to another. Thus to an extent the choice of a measure cannot be divorced
from a decision on what role these countries will play on the global stage.
22 Recall that a large devaluation disturbs the concordance by reducing ranking sharply. For instance India in2002 is correctly ranked 8th according to PP (α=1.4) and wrongly at 11th according to X.

20
Figure 3: DISTRIBUTION OF WORLD GDP (PPP, Exch Rt & Average)
Figure 3A: Share of World GDP
0%
5%
10%
15%
20%
25%
30%
35%
US
AC
hin
a P
R
Ja
pa
n
Ind
iaG
erm
an
yF
ran
ce UK
Italy
Bra
zil
Ru
ss
i aC
an
ad
aM
exic
o
Sp
ain
Ko
rea
, SIn
do
ne
sia
Au
stra
liaT
aiw
an
,Ch
Ne
the
rla
nd
sS
. Afri
caT
urke
y
Iran
T
ha
ila
nd
Arg
entin
aP
ola
nd
Ph
ilip
pin
es
Sha
re o
f Wor
ld G
DP
(%)
GDPppp Avg Z GDPxr
Figure 3B: Cumulative share of GDP
20%
30%
40%
50%
60%
70%
80%
90%
US
AC
hin
a P
R
Ja
pa
n
Ind
iaG
erm
an
yF
ran
ce UK
Italy
Bra
zil
Ru
ss
i aC
an
ad
aM
exic
o
Sp
ain
Ko
rea
, SIn
do
ne
sia
Au
stra
liaT
aiw
an
,Ch
Ne
the
rla
nd
sS
. Afri
caT
urke
y
Iran
T
ha
ila
nd
Arg
entin
aP
ola
nd
Ph
ilip
pin
es
Sha
re o
f Wor
ld G
DP
(Cum
ulat
ive)
GDPppp Avg Z GDPxr

21
The cumulative GDP share of countries included grows fairly rapidly with the
addition of the first 10 countries but much more slowly after the 15th (Figure 3B). Thus
the share of world GDP at purchasing power parity (Y) of the top 5, 10 and 15
countries is about 51%, 66% and 74% respectively. Adding another 5 members adds
only 5% of World GDP (Y). The share of the top 5, 10 and 15 countries in World
GDP at current exchange rate (X) is about 56%, 72% and 80% respectively. Adding
another 5 members adds only 4% of World GDP (X). This suggests there should be
around 10 permanent members of the global Security Council along with a similar
number of regional non-permanent members representing the rest of world GDP.23
The choice of the measure for applying the cut-off runs into the Russia
problem. Russia is the 10th largest country in terms of GDPppp (Y), 16th largest in
terms of GDP at current exchange rate (X) and 12th ranked in terms of the average Z.
The second criteria (X) applied fairly while including Russia would make the Security
Council too unwieldy, unless there is no regional representation. We are therefore left
with a choice of either Y or Z as the cut-off criteria. The vote shares off the selected
countries could, however, lie between that determined using relative size Y or that
determined using X. Thus the US share would be between 21% and 32%, China’s
share between 4% and 12%, Japan’s between 7% and 12% and India’s between 1.5%
and 5.8%.
Though many variations are possible, there are two basic options; One is a
hybrid that uses the Y ranking to determine those who will become permanent
members and uses Z to assign the weighted voter or voter share. The other is to use
only Z for both purposes. If we use the first option there could be 10 permanent
members with the following shares: USA (25.7%), Japan (9.2%), China (8.8%),
Germany (5.2%), India (4.1%), UK (3.9%), France (3.8%), Italy (3.4%), Brazil (2.2%)
and Russia (1.9%). In the second option there would be 12 members. This option has
the interesting property that the top 7th, 8th, 9th and 12th ranked countries (as per Z) are
identical to the top 7th, 8th, 9th and 12th ranked countries according to Y.
23 Under the conventional approach. An alternative is to have only the 20 largest countries as members,with no regional representation.

22
4.3 The United NationsThe system of representation used in the United Nations is clearly outdated.
Representation in the General Assembly is based on the concept of one nation one
vote. This violates both the principles outlined earlier. It is clearly undemocratic in
that a nation with 100,000 people has the same vote as a nation of 1 million and a
nation of 1 billion people. Such a system provides an incentive for nations to split into
smaller and smaller units to get greater representation. It also violates the principle of
fair division of power by giving the same vote to a country with a GDP of $1 million
as that to one with $1 billion or $100 billion. It gives an incentive for those nations
with higher GDP to purchase the votes of those with lower GDP by bribing them
through aid and other inducements.24 If the UN is to have any legitimacy it must be
reformed to give nations a vote share in the General assembly that reflects the
distribution of population. An adjustment may have to be made for the fact that
authoritarian governments cannot be assumed to reflect the will of their people.
Initially there could also be a minimum (e.g. 1 mil) and maximum (1bi) cut-off. Tiny
nations would be allowed to band together to attain this minimum size and claim one
vote in the General assembly.
The UN Security Council similarly fails to reflect the power reality of today.
The reality is that in 2002 the share of World GDP at PPP (Y) of the USA and other
four permanent members of the Security Council is 21% and 21.3% respectively. In
contrast the GDP of the other five members of the top ten who are not permanent
members is 23.4% of World GDP. Further Japan, India and Germany with 7.1%, 5.8%
and 4.6% of World GDP respectively are not permanent members while France and
UK with 3.3% and 3.2% of world GDP respectively are. A Security Council with 12
of the largest countries as permanent members would encompass 69.4% of world
GDP. Similarly the USA has started ignoring the UN Security Council, because its
single positive vote or the (effectively) 100% negative vote of the other permanent
members, does not reflect the current balance of power. If we want the USA to be
bound by the discipline of the global governance structure, its vote share in the
Council must at least reflect its relative economic power (i.e. about 1/4th of the vote).
24 The bribe need not distribute income from the richest to the poorest, as nations with low populationcan be bribed at lower cost even if they are better off.

23
The nature of the veto would also change. Either a 33.1% or a 50.1% vote
against a proposal by the permanent members of the Council could constitute a veto.
If the vote share is as proposed in the last paragraph of the previous sub-section, the
sole super power would have to garner another 8% or 25% vote from the permanent
members if it wants the Security Council to support its actions. Conversely for any
other nation to veto its proposal would require getting the vote of a number of
permanent members. This will make it much more difficult for China, Russia, France
and UK to veto US action than it is at present. This will be both a recognition of the
USA’s primacy as well as of the limits on its ability to act unilaterally without loosing
its legitimacy and primacy. A majority vote (in terms of assigned vote shares) of the
full council would also be required for any action (‘double majority”). There could
also be certain types of decisions requiring a higher vote share (e.g. Pre-emptive attack
or rules changes).
The non-permanent seats to represent the remaining 30.6% of the World
economy could be assigned on a regional basis. On this basis and excluding the 10
permanent members the vote shares would be as follows: Western or OECD Europe
would have the highest vote share of 7.7%, followed by East Asia with about 5.1%,
Latin America (LAC) with 4.5%, E. Europe and Central Asia with 3.6%. The Middle
East and N Africa would have a vote share of 3%, Sub-Saharan Africa 1.9%,
Australia, New Zealand and pacific about 1.4% and S Asia 1%. Mexico and Canada
with a combined share of 3.9% could in principle be classed in N America.
The representative of each region should, logically, be elected by the nations
constituting the region with their vote share proportional to their size. The election
should be transparent and supervised by the UN if necessary. OECD Europe could in
principle be assigned three seats with an average vote share of 2.56% and E. Asia two
seats with an average vote share of about 2.55%. LAC is a borderline region that
could also have two non-permanent seats. Thus there would be about 10 non-
permanent seats (i.e. without veto power) representing regional interests. However,
some regions could choose to have a different format of representation. For instance
the EU may prefer a single seat to represent its non-permanent members (from W. &
E. Europe) with the vote share of the member States assigned to it. In this case it

24
would be a non-veto yielding renewable semi-permanent membership (in that its
constituents would repeatedly elect it).25
With rights come responsibilities. Contributions to UN security operations
would have to be in proportion to the vote share. Any country that desires to
contribute less than its vote share would have to have a commensurate reduction in its
vote share.
4.3.1 Reform Reality
UN reform cannot happen unless the five permanent members of the Security
Council as well as a majority of members of the General assembly approve of the
reform. Any reform means that there will be some losers in the process. The losers
will not only oppose the reform but also generate opposition by raking up old rivalries.
The permanent members can of course veto any reform that weakens their role in the
UN. It is therefore useful to ask what would be the best compromise between the
principles and analysis given in the previous sub-section and the reality.
Firstly reform of the General Assembly along the lines proposed appears
unlikely and therefore would have to be abandoned so as to get the best possible
outcome on reform of the Security Council. Radical reform of the Security Council in
the form of weighted voting shares is likely to be vetoed by one or more of the
permanent members. Thus the most realistic option during the next few years is to add
some permanent members to the Security Council. In our judgement the following is a
possible compromise: (a) Add Japan, Germany and India as permanent members of the
Security Council with veto power. (b) Add Brazil as a permanent member without
veto. (c) Have a permanent seat without veto to be shared by S. Africa and Nigeria (ie
a rotating semi-permanent seat).
As none of the existing powers will be very keen to undertake any reform that
dilutes their own power, UN reform may in any case take a decade. An alternative
would therefore be to support these natural instincts of the current veto powers so that
it does not take place during the next ten years. A radical transformation of the UN
structure may become feasible in 10-15 years, when the transformation of the World
along the lines spelled out below, would be too clear for any country to ignore.
25 Though EU may prefer a single permanent seat with the total vote share of all its members, the UKand France and perhaps even Germany are unlikely to agree.

25
India’s diplomatic focus should be on publicising the likely shape of the world
in 10-15 years time when India will be major player. It should highlight how absurd it
would be for India to be a second class member of such a UN security council in the
World of 2015/2020.
4.4 World Bank, IMF and WTOUnlike the Global Security Council there is no veto power in the economic
institutions. The current system of representation is broadly acceptable, but the voting
rights and responsibilities need to be updated to reflect the current situation. Because
these organisations deal with the interactions between States (Aid & BOP support
respectively) and the high income countries that are the source of funds have a right to
a greater say in how these funds are used, GDP at current exchange rates is relevant.26
On the other hand the World Bank deals extensively with internal policies that affect
the population of these countries, while the IMF has imposed conditions on its lending
that relate to domestic policies. Such policies affect people and GDP at PPP, which
gives equal weight to population and per capita income remains relevant. Therefore
for these economic organisations the option of using Z both to determine inclusion and
vote shares is probably the most realistic.
The 20 top ranked countries in terms of Z with about 81.4% of the global share
in 2002 could be directly represented on the board of directors of these bodies, with a
weighted vote share in proportion to their share of Z (Table 2). As is the practice today,
the remaining countries could select the large member from their sub-region to
represent them, with their Z share added to its own share. For instance if India
continues to represent Bangladesh, Sri Lanka and Nepal their share would be added to
its own share of 4.1%. The weighted share would be adjusted periodically, perhaps
every 10 years to reflect changes in the global economy.
In the WTO voting rights are based on one country one vote and are therefore
clearly undemocratic. The General Agreement on Trade and Tariffs (GATT) was a
purely trade related organisation and a vote share based on the share in World trade
could have been a basis of representation. But even in this case the deviations from
zero tariffs, the subject of GATTS attention, are justified in by their impact on the
economy of the country and on others. Thus GDP at current exchange rate would have
been the natural basis for weighted vote share. The WTO has in contrast extended
26 Recall that this will give greater weight to countries with higher per capita income.

26
itself into many areas besides merchandise trade, such as internal subsidies, TRIMS,
TRIPS and GATS (modes 3 & 4). The so-called Singapore issues go even deeper into
domestic policy matters and domestic social and development concerns, blurring the
distinction between trade and domestic issues. The share of world GDP at PPP would
therefore be a candidate for determining the vote share weights given that the
population that is likely to be affected by such basic changes in the scope of WTO
(rules of the game). Given the current situation the use of a weighted vote share based
on Z, as in the case of the World Bank and IMF would be a fair balancing of interests.
4.5 Time LagsThe detailed vote shares based on 2002 should be used if reforms are expected
to be completed before further data become available. In practice any reforms e.g. UN
reforms would be preceded by years of discussion and negotiation. The latest
available data should be used. There should also be a provision for periodic update of
vote shares based on changing shares. An imperfect alternative would be to base the
share on the projected data for the mid-point of the expected duration of the new
system. For instance, if the new system was assumed to last unchanged for 30 years
then it must be based on the GDP shares (Y or Z) that are expected to prevail 15 years
later.
5 NEW INTERNATIONAL ORDERA New Global Order will emerge during the 21st century, along with new
institutions of global governance. Some of these will be adaptations of existing
institutions, while others may be completely new ones. This is not likely to happen
very quickly however because of resistance from declining powers, which currently
have disproportionate power in the current system. It is therefore important to project
the past economic developments into the future to see how the distortions in the
current system will grow. At some point these distortions will force a re-alignment.
5.1 Economic Forces & Projections
5.1.1 PopulationPopulation has reached stable or declining levels in the rich, developed and Eastern
European countries. European population has peaked in 2000 and is now declining.
The population of other continents will continue to grow during the first half of the
century but the rate of growth is decelerating. Within Asia, Japan’s population will

27
peak in 2010 and that of China will peak in 2030 while that of India will continue to
rise till 2050. Sub-Saharan Africa, North Africa and W. Asia will have the most rapid
expansion of population during this period. By 2025 both N America’s and Asia’s
share of the world’s population will decline marginally by 0.2% point to 5% and
60.2% respectively. The population share of Europe and China will decline
substantially by 3.1% points and 2.6% points (to 18.4%) respectively. USA’s share of
the World population will remain almost unchanged. The population share of India
will increase to 17.4% by 2025 and stabilise at that level, so that China’s share
(17.3%) will fall below India’s by 2035.
In 2025 the USA’s population will be about 1/4th that of India or China’s. The
population of the next three most populated countries (Brazil, Russia & Japan) will be
16%, 9% and 9% of India’s respectively. The population of Europe will be about half
of India or China’s.
The share of population aged 15 to 64, which forms the base (catchment area) of
the active labour forces follows broadly the same pattern (UN projections). In 2030,
China and India will have 18.3% and 18.1% respectively of the world population aged
15 to 64. China’s share of potential workers will fall sharply to 17.1% by 2035 when
India’s share peaks at 18.2%. Thus India will have the largest share of the world’s
potential workers around 2030 about five years before its share of total population
peaks. As far as this element of relative economic size & power is concerned, India
will catch up with China between 2025 and 2035.
5.1.2 Globalisation & Catch-up
The last two decades of the 20th century have been characterised by a rising
share of Asia in World GDP. This has been driven by the phenomenon of fast “Catch-
up” growth. A set of countries which had relatively low income in the middle of the
century stepped up their growth rate well above that of the high income countries and
started closing the gap between the two. These countries were labelled as “Emerging
Markets” [Garten (1997)]. Among the reasons are Globalisation and economic policy
reforms. The “Catch–up” phenomenon has occurred in the most sustained and
effective way in Asia. Among the reasons is the fact that Asia’s civilisations are
millennial and most countries of Asia have had governing institutions for centuries.
Over the centuries these institutions have evolved and adapted to the changing

28
environment with varying speed and effectiveness. The presence of these institutions
is a source of great strength and continuity. For instance, it has been shown in global
cross-country regressions that India’s per capita income is about one-fourth of that
predicted by the quality of its institutions, implying that further policy reforms will
accelerate growth. 27
Globalisation has resulted in freer flow of commercial technology, financial
capital, goods & services and people (tourism) between countries. Though the precise
national policies needed to convert this potential into a reality in any specific country
are still a matter of discussion and debate it is quite clear that policy reform has played
a role in converting the potential of globalisation into “catch-up” economic growth.
5.1.3 Per-capita GDP Growth
The last two decades of the 20th Century (1980-2003), eight of the ten best
performing economies in the World in terms of growth of per capita GDP were in
Asia. India ranked 9th (Table 3). In the first decade of the 21st Century, China and
India will be among the five best performing economies. Nine of the ten best
performers are also likely to be from Asia. Despite this fast growth there will still be,
in 2025, a substantial gap between the per capita GDP of China and India on the one
hand and the USA, Japan Germany and other OECD countries.
Asian economies (Singapore, Hong Kong, Taiwan China, Thailand, Malaysia,
China PR, Vietnam and India) have benefited the most from globalisation during the
last quarter of the 20th century. India has been the most cautious and slowest growing
among them. Given its comparative advantage in services & ‘labour-medium skill’
intensive manufacturing and young labour force, it is poised for a bolder opening &
globalisation to accelerate growth above that of the others.28
The rate of growth of GDP and GDP per capita is projected till 2035 based on
past performance. These growth assumptions are given in Appendix tables A1 and A2
and discussed there. Population growth rates are taken from the UN (mean)
projections. These growth rates are used to project GDP at purchasing power parity
(which forms the basis for appendix table A3, table 4 & figure 4) and per capita GDP
27 Rodik and Subramanium (2004)28 FDI should be allowed in currently closed service sectors with a phased increase of foreign equitylimits in the service sectors in which it is currently less than 100% (manufacturing is already 100%).Peak tariffs should be reduced to 10% by 2006 and to 5% by 2008. Above–peak exceptions should belimited to 60% and brought down proportionately to 30% by 2006 and 15% by 2008.

29
at PPP. The latter is used along with the population projections to derive the power
potential and GDP at 2002 exchange rates according the formulas presented in section
2.3 (which forms the basis of appendix table A4, table 4 & figure 5).
5.1.4 Relative Size And PowerThe economic development of the major countries during the next few decades
has been projected and is depicted in Table 4, Figure 4 & Figure 5.29 A historic
transformation of the World Economy is underway, with a dramatic rise in the relative
size of China to be followed some decades later by that of India. This will be offset by
a decline in the relative size of Europe and Latin America. The World economy will
however, continue to grow at around the same average rate it has in the past 25 years,
so that there is no structural break in growth of demand for natural resources.30
China will become the largest economy in the World within 15 years. At that
point it will also be the second strongest power after the USA [in terms of Z, table 4].
Its size (Y) will be almost double that of the USA by 2035 (figure 4). This scenario
assumes that China will be able to sustain the ‘FDI-Export’ cum ‘Zero capital cost’
model of fast growth that gives it a knife edge character.31 Though the decline in
USA’s share will be more gradual, its power will inevitably be challenged in Asia.
This phenomenal change in relative power poses major challenge to the economies of
Europe, N America, and Asia that very few seem to fully understand or appreciate.
India’s economy will become larger than Japan’s in about five years taking it to
3rd place behind USA and China. By 2015 it will become the fourth strongest power in
terms of power potential measured by Z. Within a few years thereafter its size (Y) will
be larger than the total of the three largest European powers and a little less than half
that of the USA (figure 4). By 2035 the Indian economy is likely to be larger than that
of W. Europe and by 2050 that of the US.
29 A number of caveats apply. First the range of uncertainty increases as we project further out into thefuture. Second the precise numbers are less important than the relative position of the different countriesand the changes in these over time i.e. trends in these ratios. There can be other equally valid scenariosof economic evolution.30 Energy demand could still grow faster than in the past if the energy efficiency of the fastest growingeconomy China is lower than that of countries that will be growing slower. This aspect needs to beinvestigated further.31 The Asian crises exposed the weakness of this model. It is heavily dependent on creating andsustaining optimistic expectations and in burying firm level inefficiencies in the government controlledbanking system (implicit fiscal subsidies). It is however hard to predict what kind of exogenous shockwill knock the economy of the high growth knife-edge path to more normal sustainable growth rates.

30
Table 3: PER CAPITA GDP GROWTH RATE (Average)
Economy 1980 to 2003 2005 to 2010Rank Gr rt % Rank Gr rt %
China, P.R. 1 8.2 1 6.9Korea, Rep. 2 5.6 4 4.6Taiwan,China 3 5.3Thailand 4 4.7 3 5.3Vietnam 5 4.6 2 6.3Ireland 6 4.5Singapore 7 4.2Hong Kong 8 3.9India 9 3.7 5 4.6Luxembourg 10 3.7Indonesia 11 3.6Malaysia 12 3.6Data Source: WDI CD ROM 2003 and WEO 2004
Table 4: RELATIVE SIZE AND POWER POTENTIAL IN 2015
[In 2002 $; 18 largest economies in 2002]Economy GDP at PPP (Y) GDP Exch Rt (X) Z=(X+Y)/2 Pop W
Rank Value Wshr Pcapita Value rank Incremt rank Value rank share
USA 1 15152 19.6% 45962 16752 1 592 1 15952 1 4.6%China 2 15087 19.5% 10759 4542 3 396 2 9814 2 19.5%India 3 6389 8.2% 5126 1495 8 223 3 3942 4 17.3%Japan 4 4786 6.2% 37622 6349 2 127 4 5567 3 1.8%Germany 5 2721 3.5% 32980 2602 4 67 5 2662 5 1.1%France 6 2145 2.8% 34139 2080 6 59 8 2113 7 0.9%UK 7 2090 2.7% 34110 2337 5 64 6 2214 6 0.9%Russia 8 2050 2.6% 15368 761 13 44 10 1406 9 1.9%Italy 9 1904 2.5% 34296 1631 7 17 18 1768 8 0.8%Brazil 10 1700 2.2% 8416 587 16 42 11 1144 14 2.8%Korea, S 11 1464 1.9% 29467 1066 11 40 12 1265 11 0.7%Canada 12 1367 1.8% 40047 1186 9 38 13 1276 10 0.5%Mexico 13 1331 1.7% 11125 1022 12 45 9 1176 13 1.7%Spain 14 1326 1.7% 32211 1121 10 62 7 1223 12 0.6%Indonesia 15 1325 1.7% 5738 418 18 28 14 872 15 3.2%Australia 16 837 1.1% 38484 692 14 27 15 765 16 0.3%Taiwan,Chi 17 740 1.0% 32697 544 17 26 16 642 17 0.3%Netherlands 18 634 0.8% 37772 622 15 21 17 628 18 0.2%

31
Figure 4: PROJECTED RATIO OF COUNTRY TO USA GDP AT PPP (2002 Int. $)
Figure 5: Projected Impact of Country Growth on World Economy (GDP at 2002 exchange rate)
0.0
0.2
0.4
0.6
0.8
1.0
1.2
1.4
1.6
1.8
2.0
2002
2004
2006
2008
2010
2012
2014
2016
2018
2020
2022
2024
2026
2028
2030
2032
2034
Year
GD
P a
t PP
P (2
002)
: Rat
io to
US
A
USA China India
Japan EU3 W Europe
0.0
0.2
0.4
0.6
0.8
1.0
1.2
1.4
2004
2005
2006
2007
2008
2009
2010
2011
2012
2013
2014
2015
2016
2017
2018
2019
2020
2021
2022
2023
2024
2025
2026
2027
2028
2029
2030
2031
2032
2033
2034
2035
Incr
ease
in G
DP
(200
2 ex
ch r
t): R
atio
to U
SA
USA China Japan India UK EU6

32
5.1.5 Global Growth EnginesBecause the western economies grew relatively slowly in the last few years,
while China has continued to boom, the latter was described in the press as a new
engine of growth for the World economy. Cyclical factors clearly played a role in this
perception. Our long-term projections allow us to explore whether this is a permanent
phenomenon and more generally whether Asia is likely to replace the USA and Europe
as the driver of growth for the World economy. In this case we are interested not in
the relative size of the economy but the impact on the rest of the World. We had noted
earlier that the GDP converted to US$ at the exchange rate is the best measure of the
potential for trade and financial interaction between countries. Changes in this
measure of GDP give us an idea of the growth impact (world demand and supply of
goods) of an economy on the rest of the World economy.
The trends in the impact of the global growth poles over the next 30 years are
shown in Figure 5. Thus by the end of the decade, China will become a larger driver
of global growth than the European Union’s six largest economies and India will be a
larger growth driver than the United Kingdom the most significant growth pole in the
EU. At this time the combined impact of the three Asian giants will exceed that of the
USA. By around 2025 China’s impact on World growth is likely to be larger than that
of the USA and India’s larger than that of Japan. By 2035 even India is likely to be a
larger growth driver than the EU6, though its impact will be a little over half that of
the USA. China’s impact will, however be about 40% more than that of the USA, if
China is able to maintain its knife edge growth path. Table 4 also shows the global
impact of the other large economies in 2015. For instance Canada and Russia are
ranked 11 and 12 in terms of impact, which is less than a third of that of India at that
time. The S Korean economy in contrast comes in at 7th rank with an impact that is
half that of India’s. Brazil’s impact is projected to be much lower than that of Mexico.
5.2 Shift in Balance of Power
Several observers have talked about the emerging shift of global power from
the Atlantic to the Pacific dubbing it a ‘Pacific century,’ while others have referred to
the ‘Asian Century’ a shift in the weight of the World economy towards Asia
[(Mahbubani (1995)]. By the end of the first quarter of the 21st century, China’s
communist oligarchy will have the economic power to actively challenge the USA’s
predominance in Asia, even though it will not be in a position to challenge its

33
predominance outside Asia till the middle of the century. By the end of this quarter
India will also start playing an important role in Asian affairs and by the middle of the
century in Global affairs. Though the EU matches the USA in size its institutional
capacity to translate this into commensurate global power is uncertain given the
strength of national sentiment among its constituent nation states.
The power potential of a country lies in a band indexed by a parameter lying
between 1 (PP1) and 1.4 (PP1.4). As noted the relative country share of GDP at PPP
(Y) and GDP at exchange rate (X) approximate the limits of the band.32 We explore
each of these in turn to trace the possible evolution of global power balances over the
first half of the 21st century. The actual power balances are likely to lie within this
band.
5.2.1 Bipolar or Tri-polar World?
The ‘Power Potential’ (PP1) captured by the size distribution of GDP at PPP
(Y) puts the power of China & India at the upper limit of the band vis-à-vis USA,
Japan and W. Europe. The World will become bipolar in terms of size during the next
two decades and tri-polar over the subsequent two decades. Figure 3A shows clearly
the Uni-polar nature of the World in 2002 with the GDP share dropping sharply as we
move from the USA to the lower ranked countries. The evolution of this distribution
over the 1st half of the 21st century is projected in Figure 6A (base scenario). While the
uni-polar nature of the size distribution is quite clear in 2005, the distribution becomes
bipolar by 2015 with the emergence of China.
As the relative share of the USA falls and that of India rises, the latter emerges as
third pole in terms of relative size of GDP. If power-potential is accurately measured by
PP1 (i.e. α=1), then the World will become tri-polar by 2050 with China, USA and India
constituting the three poles. At that point China’s economy is projected to equal that of the
USA and India combined.
All the other countries that are either currently members of the Security Council or
aspire to become so will therefore have relatively small shares. Japan the largest among
them will have a share of about 5% while the others (including Russia) will each have
2.5%. They would be considered regional players but be greatly in demand as partners
32 This was true in 2002 except for an error term. The parameter that was estimated to b 1.38 in 2002may change in future.
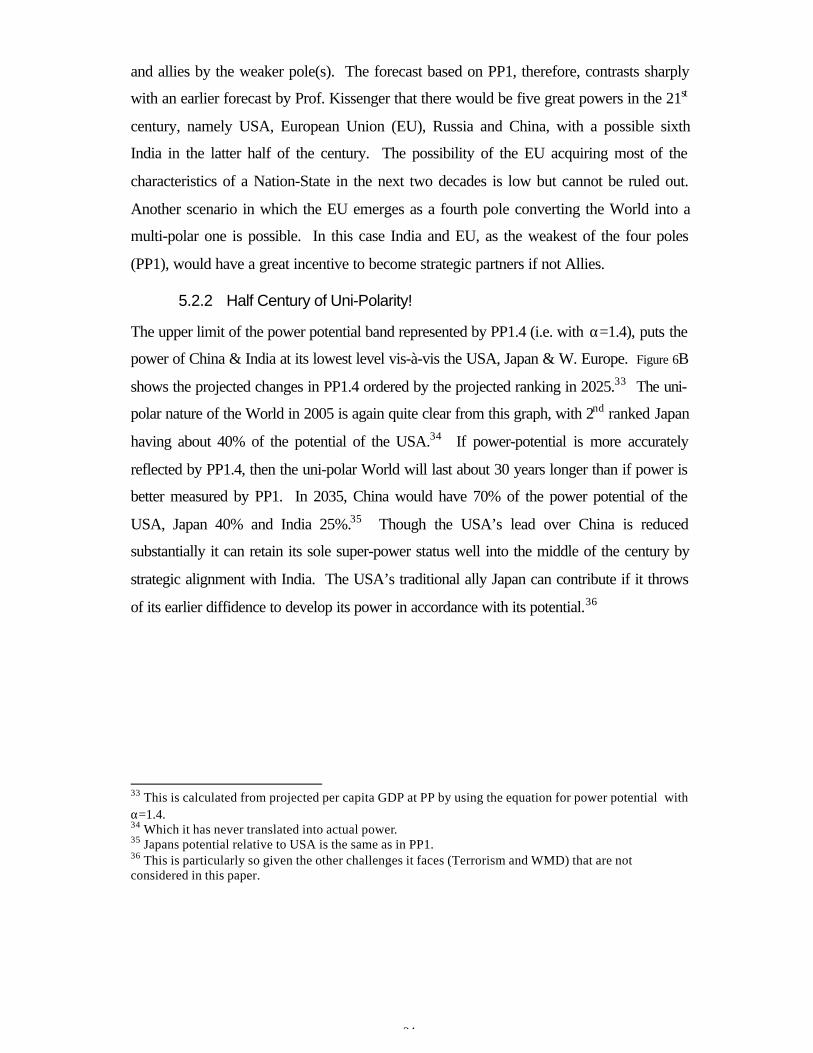
34
and allies by the weaker pole(s). The forecast based on PP1, therefore, contrasts sharply
with an earlier forecast by Prof. Kissenger that there would be five great powers in the 21st
century, namely USA, European Union (EU), Russia and China, with a possible sixth
India in the latter half of the century. The possibility of the EU acquiring most of the
characteristics of a Nation-State in the next two decades is low but cannot be ruled out.
Another scenario in which the EU emerges as a fourth pole converting the World into a
multi-polar one is possible. In this case India and EU, as the weakest of the four poles
(PP1), would have a great incentive to become strategic partners if not Allies.
5.2.2 Half Century of Uni-Polarity!
The upper limit of the power potential band represented by PP1.4 (i.e. with α=1.4), puts the
power of China & India at its lowest level vis-à-vis the USA, Japan & W. Europe. Figure 6B
shows the projected changes in PP1.4 ordered by the projected ranking in 2025.33 The uni-
polar nature of the World in 2005 is again quite clear from this graph, with 2nd ranked Japan
having about 40% of the potential of the USA.34 If power-potential is more accurately
reflected by PP1.4, then the uni-polar World will last about 30 years longer than if power is
better measured by PP1. In 2035, China would have 70% of the power potential of the
USA, Japan 40% and India 25%.35 Though the USA’s lead over China is reduced
substantially it can retain its sole super-power status well into the middle of the century by
strategic alignment with India. The USA’s traditional ally Japan can contribute if it throws
of its earlier diffidence to develop its power in accordance with its potential.36
33 This is calculated from projected per capita GDP at PP by using the equation for power potential withα=1.4.34 Which it has never translated into actual power.35 Japans potential relative to USA is the same as in PP1.36 This is particularly so given the other challenges it faces (Terrorism and WMD) that are notconsidered in this paper.

35
Figure 6: CHANGING SIZE DISTRIBUTION OF GDP AND POWER POTENTIAL
Fig 6A: CHANGING SIZE DISTRIBUTION AND POWER
0%
5%
10%
15%
20%
25%
30%
US
A
Ch
ina
Ja
pa
n
Ind
ia
Ge
rma
ny
Fra
nce UK
Italy
Bra
zil
Ru
ss
i a
Ca
na
da
Mex
ico
Sp
ain
Ko
rea
, S
Ind
on
es
ia
Sha
re o
f Wor
ld G
DP
(%)
2005 2015 2025 2035
Fig 6B: CHANGING POWER POTENTIAL (a=1.4)
0%
10%
20%
30%
40%
50%
60%
70%
80%
90%
100%
US
A
Ch
ina
Ja
pa
n
Ind
ia
Ge
rma
ny
UK
Fra
nce
Italy
Ko
rea
, S
Sp
ain
Ca
na
da
Mex
ico
Ru
ss
i a
Au
stra
liaN
eth
erl
an
ds
Ta
iwa
n
Ind
on
es
ia
Bra
zil
RA
TIO
OF
CO
UN
TRY
TO U
SA (%
)
2005 2015 2025 2035

36
The relative power potential of Germany (14.7%), France (11.6%), UK (12.4%),
Italy (7.8%), Russia (6.1%) and Brazil (2.9%) would be lower than under PP1.37 Thus even
if the power potential is more accurately measured by pp1.4 Brazil would remain a regional
player and Russia seems headed in that direction.
The trend in power potential PP1.4 for India represents the lower bound scenario for
its rise as a global power. The gap between India’s relative size and relative PP1.4 arises
from the gap between the inherent technological capability represented by the gap in
productivity per person or per capita GDP y. Even by this measure, India’s power potential
will over take that of Mexico, Spain and Canada within the next 10 years Figure 7. In the
subsequent 10 years it will go on to overtake Italy, France, UK and Germany. During that
period China would (likely) have overtaken Japan in terms of this measure (PP1.4), so that
India would be fourth ranked behind Japan.
5.2.3 Asian Balance
A stable balance of power in Asia will be critical to Asian and consequently World
peace in the second half of the 21st century. The second quarter of the 21st century is likely
to be the most sensitive period for Asian stability. During this period the relative position
of India vis-à-vis China will be unbalanced while the uni-polar system with the USA as
the sole super-power will be under strong challenge from China. According to our base
scenario the gap between (ratio of) China and India’s per capita GDP will be the highest
around 2020. Given the logic of catch-up the gap is likely to start closing thereafter and to
be significantly narrowed by 2050. The gap between China’s GDP will be highest around
2015, but the gap between China’s power potential and India’s potential power will reach
a peak around 2020 (Figure 8). The weakness of China’s model of development (‘FDI-
export led’ plus ‘Zero capital cost’ intermediate supply) is bound to show itself some time
after 2020. That is, the probability of China falling off the knife-edge growth path will
increase progressively after 2020 if the growth rate has not moderated to normal levels.
37 Numbers in bracket are for 2035.
37
Figure 7: Trends in Power Potential as Measured by PP1.4
0%
5%
10%
15%
20%
25%
30%
35%
40%
20
02
20
04
20
06
20
08
20
10
20
12
20
14
20
16
20
18
20
20
20
22
20
24
20
26
20
28
20
30
20
32
20
34
Po
wer
Po
ten
tial
Rel
ativ
e to
US
A
China Japan India Germany UK France
Italy Spain Canada Mexico

38
Figure 8: PROJECTED SIZE OF CHINA RELATIVE TO INDIA
Figure 9: PROJECTED SIZE OF ASIAN COUNTRIES RELATIVE TO INDIA
1.0
1.5
2.0
2.5
3.0
3.5
20
02
20
03
20
04
20
05
20
06
20
07
20
08
20
09
20
10
20
11
20
12
20
13
20
14
20
15
20
16
20
17
20
18
20
19
20
20
20
21
20
22
20
23
20
24
20
25
20
26
20
27
20
28
20
29
20
30
20
31
20
32
20
33
20
34
20
35
Rat
io o
f Chi
na:In
dia
PP1.4/GDPxr Size (GDP at PPP) Per Capita GDPppp Population
0.0
0.2
0.4
0.6
0.8
1.0
1.2
1.4
20
02
20
03
20
04
20
05
20
06
20
07
20
08
20
09
20
10
20
11
20
12
20
13
20
14
20
15
20
16
20
17
20
18
20
19
20
20
20
21
20
22
20
23
20
24
20
25
20
26
20
27
20
28
20
29
20
30
20
31
20
32
20
33
20
34
20
35
Rat
io o
f C
ou
ntr
y G
DP
at
PP
P t
o In
dia
's
Japan ASEAN Russia Korea, S Australia
39
In contrast, some of the weakness of governance in India, which results in poor
supply of public goods & services, will reduce as incomes increase and poverty declines.
The entrepreneurial, social (capital) and institutional strengths of India will then assert
themselves more strongly. By 2035 India’s population will have reached that of China
and the population balance restored (Figure 8). China’s dependency ratio as well as the
average age of its labour force will also be rising relative to that of India.
As a stable balance of power in Asia will be critical to peace in Asia in the first
half of the 21st century, it is useful to look at the relative balances in Asia. Figure 9
shows the size of the major countries of Asia relative to the size of India. There are two
interesting facts that emerge from these projections. Firstly, there is great imbalance in
the relative size of large Asian countries and this imbalance will be accentuated in
future.38 Thus China’s size is more than twice that of India. Japan’s economy in 2005-6
will be approximately the same size as India (while ASEAN countries together are about
70% of India). The next largest economy Russia is about 40%, S. Korea and Indonesia
about 1/4th and Australia about 1/5th of India’s size respectively. The size of these
economies is projected to decline relative to that of India with Japan 3/4th and Russia
1/3rd the size of India by 2015 (Figure 9).
The second noteworthy fact is that China’s economy (PP1) in 2004 will be
marginally larger than that of India and Japan together. By 2017, China’s economy/PP1
will be larger than the combined economy/PP1 of India, Japan, ASEAN, Russia, S. Korea
and Australia. If PP1.4 is a better measure of power potential, then China’s power
potential will not exceed that of Japan till after 2020. In this case Japan still has time to
realign its actual power with its power potential to produce a ‘Natural Balance of Power,’
in Asia that is also more stable. In the 19th century world of military oriented ‘balance of
power’ an alliance between the middle powers would have appeared inevitable. The 21st
century version of ‘realism’ requires more imaginative responses.
As India and China will be the two most populous countries in the World by a
wide margin, establishment of a “natural balance of power” between the two will be
38 The imbalance is however nowhere near what it was in the Americas with respect to the USA.

40
critical to Asian & global stability. Our projections suggest that the relative size and
power (PP1) of China vis-à-vis India will rise during the current decade, stabilise during
the next decade and start declining during the third decade of this century (fig 7).
China’s relative size and power (PP1) is projected to peak at 2.5 to 2.8 times that of
India’s. The USA and the EU can play a critical role in ensuring that the rising power
with its governing nationalist-communist oligarchy is not tempted to assert its power by
force of arms. They can do this through whole hearted and unambiguous support to a
democratic and free India with which it shares fundamental human values and belief in
the rule of law. The main focus of this support has to be in terms of technology transfer
to correct emerging imbalances (such as the need for nuclear power to moderate oil
demand) and FDI that helps close the per capita income gap faster than projected. If as a
consequence India were in a position to balance the economic power of China by 2025,
the temptation for aggressive nationalists within its power structure to assert their
hegemony in Asia in the second quarter of the century would be moderated. This would
allow the peaceful evolution of Asia and the global power structure.
5.2.4 Imbalance and Hegemony?
As the Appendix indicates, there is a possibility that the rate of growth of India
and Japan may be lower than in the base forecast. The maintainance of high growth in
China for a longer period than assumed (helped by euphoric expectations among OECD
countries), cannot also be ruled out. In this case the imbalances in Asia would be
accentuated and the risks would be much greater, as historically major changes in global
power have been marked by violent upheaval.
The global system will be severely challenged to ensure that the rise of China is
peaceful. 39 Though incorporation of Taiwan (China) into the mainland by force poses
risks to mainland China’s FDI-Export driven growth, the communist party may be
tempted, particularly if its authority is being undermined (e.g. by democratic pressures
within the mainland). As China establishes its paramount status in Asia its approach to
various issues will reveal the extent to which its attitude is non-hegemonic. For instance,
39 The phrase, “The Peaceful rise of China,” that was mentioned by the General Secretary and otherofficials of the Chinese Communist party, and the President and Prime Minister of China havesubsequently replaced by the, “Peaceful Development of China.”

41
attempts to exclude specific countries from regional economic co-operation arrangements
could indicate a hegemonic intent to deny them a due role in Asia. Among the issues are,
(a) The development of an East Asian community that excludes potential rivals so that
Japan’s financial resources can reinforce its own to establish ASEAN’s financial
dependence on it. (b) Use of bilateral and regional Free Trade Arrangements to
undermine support of other countries’ claims on the South China Sea and ensure an
effective take over of its natural resources. (c) Creation of a nuclear capable N. Korea
that undermines the security of S. Korea and Japan. 40 (d) Use of Pakistan as a conduit for
proliferation of China’s nuclear technology and as a ‘Trojan horse’ to undermine the
security of potential rivals. (e) A nuclear Iran that strengthens its position in W Asia vis-
à-vis Israel/USA. (f) Choice of approach (reason and mutual respect or economic/military
power) to solution of border disputes. If the hegemonic impulse that has characterised
such historical shifts in power cannot be diffused and de-fanged, 19th century balance of
power politics may become inevitable.
In our view, the risk of conflict can be reduced by building co-operative and
inclusive structures and systems in Asia that respect the natural balance of power and
give a due share of power (& responsibility) to each nation. It is in the interest of Asian
countries, including a China that believes in “peaceful rise,” to build an inclusive system
that ties the major Asian powers and ASEAN into co-operative economic systems. One
such structure could be an Asian Economic Community (eventually Asian Common
Market). A positive approach by the most powerful nation in Asia, for example with
respect to border settlement, can ensure that neighbours are not pressured to look outside
the region for alliances to strengthen their security.
40 This assumes a US veto of S Korean & Japanese nuclearisation.

42
6 CONCLUSION
Significant changes have taken place in the global economic power since the
Second World War. These changes are grounded in the differential economic
performance of Nations spurred in part by economic globalisation and economic reforms.
The pace of change has accelerated in the last few decades. Consequently changes in the
natural balance of power during the first quarter of the 21st century are likely to be larger
than in the latter half of the 20th century. There is an urgent need to reform the
institutions of global governance to reflect the changes in global power balances (past
and projected). Co-operative economic structures would have to be built in Asia to
minimise the risks of conflict and demonstrate peaceful intent towards each other.
Because the tectonic nature of the changes underway, global governance reforms
may not be enough to avoid conflict. A 21st century version of 19th century balance of
power politics may be temporarily needed to minimise hegemony and avoid violent
upheaval during the high-risk period between 2025 and 2050. A particular responsibility
devolves on free, democratic nations in North America and Europe to strengthen those
democratic Nations in Asia who share their fundamental human values and can help
insure its peaceful evolution. This requires recognition of the changes taking place in
Asia and perhaps the evolution of a long-term vision to temper the universal temptation
of short-term gains from exports of embodied & disembodied technology to the fastest
growing economy in the world.
The projections in this paper indicate that India will have the potential to become
a global power in a couple of decades, while other nations (besides USA & China) will
be reduced to regional status. To what extent it does so will depend on its ‘will to
power.’ Historically Indian forays into the outside World have been driven by commerce
and culture. Even the culturally Indian Kingdoms that came to be established in S.E.
Asia had no connection with India – they were neither colonies controlled from India nor
paid tribute or bore allegiance to any ruler in India. India therefore lacks a tradition of
strategic thought and experience. The extent to which India is able to translate its power
potential into actual power will depend on the success of its political system and its elite
in developing a strategic culture and an understanding of global power politics.

43
The USA, EU and India are democratic, free and culturally open societies that
share fundamental human values. It will be in the interests of the USA and EU to
strengthen India’s economic and technological capability over the next two decades for
mutual benefit, peace and stability in Asia. The Indian elite and political system must
abandon the lingering cold war mentality, suspicions and approach that still survives in
some corners. A true partnership requires mutual dependence.41 India must be willing to
share the US (& EU’s) global responsibilities in return for USA and EU’s willingness to
modify the national laws and international arrangements they have put in place (after
India’s first nuclear test in 1974) to cut India’s access to strategic technology. The
scenarios presented in this paper are merely one among many possibilities that so often
surprise forecasters. The USA, EU, Japan, India and other democratic countries can by
their enlightened and determined actions help bring about a World that is much more
beneficial to all their citizens than is suggested by these scenarios.
7 APPENDIX: FORECASTS
7.1 India and ChinaThe rate of growth of GDP and GDP per capita is projected till 2035 based on
past performance. These growth assumptions are given below in tables A1 and A2. The
most significant departure from past trends, the assumed spurt in the Indian economy,
and the slow down in the Chinese economy need some elaboration. According to India’s
National accounts data GDP and per capita GDP have grown at an average of 5.8% per
annum and 3.7% per annum respectively during the last 24 years (1980-1 to 2003-4).42
The comprehensive reforms instituted in the 1990s have increased competitive pressures
on the Indian economy while at the same time enhancing its ability to compete globally.
In our view an opening of the economy to international trade produces a J-curve effect:
The direct negative effects of competition appear immediately as capacity utilisation falls
in un-competitive product lines as capital is immobile (so reduction is limited by the rate
of depreciation). The positive effects of competition on productivity appear only after
41 According to K Subramaniam, instead of fearing India’s dependence on the USA, India must strive todevelop a ‘reverse dependence’ of the USA on India.42 The WDI data underestimate the GDP growth rate substantially thought the per capita GDP growth rateis almost the same.

44
new technology adopted by the pioneers and fructifies through new investment and
gradually diffuses to the rest of the industry. 43 Improvements in productivity will
therefore appear at the aggregate level only after a lag and we expect the underlying trend
rate of growth to gradually move up to around 6.5%.
There are a number of other factors that suggest India’s growth rate could
accelerate further. One area in which the improved competitiveness of the Indian
economy is clearly visible is in the double-digit (20% to 30% per year) growth of non-
traditional service exports (commonly referred to as IT & ITES exports).44 Though such
exports are already a significant share of India’s total exports of goods and services, this
sector constituted a very small part of the economy. Therefore the impact of the impact
on GDP growth was limited. The sector is now becoming a significant part of the
economy and it contribute between 0.5 to 1.5 per cent points per year to aggregate GDP
growth rates.45
The second factor is the un-exploited potential of foreign direct investment (FDI).
The proportion of FDI in total investment and GDP is very low in India compared to
other high growth Asian countries such as Singapore, Malaysia, Thailand, China,
Indonesia and Vietnam. In contrast to China, which has followed an FDI-export led
growth model, India’s growth has been led by domestic investment and entrepreneurship.
The positive role of FDI in growth (marketing, technology, management systems) is
therefore largely un-exploited. A doubling of FDI flows from the current low levels of
$4 bi to $8bi to $10bi per annum could have a substantial positive effect on the growth
rate of the economy. India is already a highly attractive location for skill-intensive
manufacturing because of the high quality and availability of middle management/
technical skills and knowledge workers. With China’s per capita income more than twice
that of India’s we would normally expect hourly/daily wages to be twice that in India.
China has so far kept monthly wages lower than that in India by allowing workers in FDI
invested enterprises to work 60 to 80 hours a week (double that permitted in India). This
advantage will dis-appear very soon. India could therefore become a more attractive
43 There are numerous cases of firms that have transformed their systems and shown large increases inproductivity. The effects of these are not however available in the sector data.44 We call Transport, Tourism and Communication as traditional service exports and the rest as non-traditional.

45
location for labour-intensive manufactured exports than China if the new Special
Economic Zone law can reduce red tape/bureaucracy and introduce much needed
flexibility in labour laws, rules and procedures.
The third important factor is the demographic transition that is taking place across
the World. The high growth of E & S.E. Asian countries was to a substantial degree due
to the demographic transition (the U shaped curve followed by the dependency ratio/
inverted U of the labour force to population ratio). China is now near the end of its
demographic transition while India has entered its most positive phase. This could add
between 0.5% to 0.8% points to the growth of the Indian economy. In addition the
population of Europe and Japan is aging rapidly and there will be a great demand from
these economies for ‘youth-intensive’ goods and services.46 Over the next half century
India will have the youngest labour force in the world. India is therefore likely to
become the largest exporter of such items. As China’s population will age much earlier
than that of India it is not in a position to exploit this opportunity.
The biggest downside risk to Indian growth scenario come from the infirmities in
its political system that have led to a deterioration in the quality and quantity of public
goods (roads, policing, legal system.) and quasi-public goods over the last four decades.
The high fiscal deficit is merely a symptom of this deterioration in governance. It is
necessary however to distinguish between levels and trends. The quality and diversity of
India’s institutions and its social capital built over centuries, is very high. The democratic
system, including the free media and the non-governmental institutions is a great source
of long term strength. Dani Rodick has estimated that India’s growth is 2% to 2.5%
lower than predicted be the quality of its institutions. The trends in governance are
however disturbing and need to be corrected: There is however still enough time for the
Indian political system and civil society to reform the governance system.
On China, Bosworth and Collins (1996) followed by the World Bank and IMF
have shown that its growth from 1980 to end-nineties was overestimated by 1% to 2%.
Young has asserted that China’s growth is over-estimated by as much as 3%. If we
assume an over estimation of 2%, China seems to have the ability to sustain growth at
45 Starting at the lower end and going up to the higher end of the range.46 For instance a study has shown that Nobel prise winners in Physics did their most productive work belowthe age of 25-30.

46
about 7.5% per annum over decades. Most observers have, however, been forecasting a
slow down in this growth rate (see e.g. Virmani (1999)). The 1990s were a period of
above average international trade growth and the current decade will see a slower growth.
China’s export growth will therefore slow as its share of World exports rises to the top
and per capita income/wages reach upper-middle income levels.
China has used a dual model of high growth that combines FDI-export led growth
(like Thailand & Indonesia) with zero-capital cost for critical intermediates.47 The latter
represents a channelling of subsidies through the banking system (which is effectively
like a govt department) into State enterprises producing intermediate goods and
infrastructure services and from there, through low prices, into the FDI-export complex. 48
Though the labour intensive (LI) export goods produced by Hong Kong, Taiwanese and
other non-resident Chinese entrepreneurs are highly competitive this is not so for other
(non-LI) exports. The FDI-export drive is critically dependent on building and sustaining
optimistic expectations about the economy and the Asian crises demonstrated the
vulnerability of this model. Given the continuing generation of non-performing assets
(50% to 100% of GDP), which are in reality an implicit cross-tax subsidy, China is
somewhat more vulnerable. On the other hand its large economy has domestic strengths
that were absent in the smaller Asian countries. It is therefore very difficult to predict if
and when a growth crisis could occur in China. We therefore assume a gradual slowing
down of China’s economy.
Our assumption for Japan are perhaps more optimistic than justified by its growth
over the last 25 years. They should therefore be viewed as upper bounds. If Japan’s
growth is slower than assumed (as is quite likely) and India’s growth does not match up
to the forecast, Asian and Global balance of power will be even more unbalanced than in
our base scenario.
47 S. Korea has used the latter approach to a much more limited extent in that the subsidies were restrained.48 The prices of intermediate goods in China is reportedly less than their price on the high seas outside India– i.e before taxes, delays or red tape.

47
7.2 Appendix Tables
Table A1: GDP growth rate (PPP, constant 2002 international $)Average growth rate Projected growth rate
1980- 1990- 1998- 2003- 2016- 2026-Country 2002 2002 2002 2015 2025 2035
China 9.5% 9.3% 7.6% 7.5% 6.5% 5.8%USA 2.9% 2.8% 3.0% 3.0% 2.9% 2.8%India 5.6% 5.4% 5.4% 6.6% 7.0% 6.5%Japan 2.5% 1.4% 0.1% 2.6% 2.6% 2.6%Germany 1.8% 1.6% 1.5% 1.5% 2.2% 2.5%France 2.1% 1.9% 2.6% 2.2% 2.4% 2.5%UK 2.2% 2.1% 2.4% 2.3% 2.2% 2.3%Russia -0.1% -2.4% 3.8% 4.3% 3.8% 3.3%Italy 1.9% 1.5% 1.7% 1.7% 1.8% 1.6%Brazil 2.4% 2.0% 1.6% 1.8% 2.2% 2.0%Korea, S. 6.8% 6.2% 4.6% 4.7% 4.3% 3.8%Canada 2.7% 2.6% 3.8% 3.1% 2.7% 2.7%Mexico 2.8% 3.1% 3.2% 3.0% 3.0% 2.8%
Source: Authors calculations based on WDI 2003
Table A2: Per capita GDP (at PPP) growth rateAverage growth rate Projected growth rate
1980- 1990- 1998- 2003- 2016- 2026-2002 2002 2002 2015 2025 2035
China 8.2% 8.2% 6.8% 6.9% 6.2% 5.7%USA 1.8% 1.8% 1.9% 2.0% 2.0% 2.2%India 3.6% 3.6% 3.6% 5.2% 6.0% 5.9%Japan 2.0% 1.1% -0.1% 2.6% 2.9% 3.0%Germany 1.6% 1.3% 1.4% 1.5% 2.3% 2.6%France 1.6% 1.4% 2.2% 1.8% 2.1% 2.4%UK 2.0% 1.8% 2.0% 2.0% 1.9% 2.0%Russia -2.1% 4.2% 4.9% 4.5% 4.1%Italy 1.8% 1.4% 1.7% 2.0% 2.2% 2.2%Brazil 0.7% 0.5% 0.3% 0.7% 1.5% 1.5%Korea, S 5.7% 5.3% 3.9% 4.3% 4.1% 3.9%Canada 1.6% 1.5% 2.9% 2.4% 2.1% 2.3%Mexico 0.8% 1.4% 1.6% 1.8% 2.1% 2.3%
Source: Authors calculations based on WDI 2003

48
Table A3: World Share of GDP at Purchasing Power Parity
Current: Uni polar Projected (2002 prices)2002 2015:Bipolar 2025 2035:Tripolar
Economy (Int$bi) Share Rank Share Rank Share Rank Share Rank
China 5861 12.1% 2 19.5% 1 25.2% 1 30.0% 1USA 10308 21.3% 1 19.5% 2 17.8% 2 16.0% 2India 2800 5.8% 4 8.2% 3 11.2% 3 14.3% 3Japan 3425 7.1% 3 6.2% 4 5.5% 4 4.8% 4Germany 2236 4.6% 5 3.5% 5 3.0% 5 2.6% 5France 1601 3.3% 6 2.7% 6 2.4% 7 2.1% 8UK 1549 3.2% 7 2.7% 7 2.3% 8 2.0% 9Russia 1186 2.4% 10 2.6% 8 2.6% 6 2.5% 6Italy 1525 3.1% 8 2.5% 9 2.0% 9 1.6% 11Brazil 1355 2.8% 9 2.2% 10 1.9% 12 1.6% 12
Table A4: GDP at 2002 Exchange Rate Relative To USA
Actual Projected2002 2015 2025 2035
Country Ratio Rank Ratio Rank Ratio Rank Ratio Rank
USA 1.00 1 1.00 1 1.00 1 1.00 1China 0.12 6 0.27 3 0.45 2 0.68 2Japan 0.38 2 0.38 2 0.38 3 0.39 3India 0.05 11 0.09 8 0.15 4 0.25 4Germany 0.19 3 0.16 4 0.15 5 0.15 5UK 0.15 4 0.14 5 0.13 6 0.12 6France 0.14 5 0.12 6 0.12 7 0.12 7Italy 0.11 7 0.10 7 0.09 8 0.08 9Korea, S 0.05 12 0.06 11 0.08 9 0.09 8Spain 0.06 9 0.07 10 0.07 10 0.07 10Canada 0.07 8 0.07 9 0.07 11 0.07 11Mexico 0.06 10 0.06 12 0.06 12 0.06 12

49
8 REFERENCES1. Collins, Susan and Bosworth, Barry, 1996. “Total Factor Productivity,” Brookings
Papers on Economic Activity, 1996:2.2. David Held, Anthony McGrew, David Goldblatt and Jonathan Perraton, Global
Transformations, Politics, Economics and Culture, Cambridge Polity, 1999.3. Fukuyama, Francis, “The End of History,” The National Interest, 16 ,Summer 1989, pp
4-18.4. Fukuyama, Francis, The End of History and the Last Man, Penguin Books, 1992.5. Garten, Jeffrey, The Big Ten: Big Emerging Markets and How They will Change Our
lives, Basic Books, 1997, 1998.6. Haass, Richard, The Reluctant Sheriff, Council on Foreign Relations; 148 pages.7. Huntington, Samuel P., “The Clash of Civilisations” Foreign Affairs, May/June 1993.8. Huntington, Samuel P., The Clash of Civilisations and The Remaking of World Order
New York: Simon & Schuster, 1996.9. Kennedy, Paul, The Rise and Fall of the Great Powers: Economic Change and Military
Conflict from 1500 to 2000, USA, Random House, 1988.10. Keohane, Robert O, and Joseph S Nye, Power and Interdependence, Little Brown & Co,
Boston, 1977.11. Kissinger, Henry A., Diplomacy, New York: Simon & Schuster, 1994; Touchstone,
1995.12. Levy, Jack, War in the Modern Great Power System, 1945-1975, University Press of
Kentucky, Lexington, 1983.13. Mahbubani, Kishore, “The Pacific Way,” Foreign Affairs, 74 Jan./Feb. 1995, pp100-103.14. McDougall, Walter, Promised Land, Crusader State, Houghton Mifflin; 286 pages.15. Mearshiemer, John,, The Tragedy of Great Power Politics, W.W. Norton & Co, New
York, 2001.16. Perkovich, George, “The Measure of India: What MakesGreatness,” 2003 annual
Fellows Lecture, Center for the Advanced Study of India, University of Pennsylvania,April, 2003.
17. Segal, Gerald, “Does China Matter?” Foreign Affairs, Vol. 78, No. 5, September-October1999.
18. Singer, Bremer and Stuckey, “Capability Distribution, Uncertainty, and Major PowerWar,” in Bruce M Russet, Peace, War and Numbers, Sage Publications, Beverly Hills,1972
19. Tellis, Ashley J, Janice Bially, Christopher Layne, Melissa Mcpherson, MeasuringNational Power in the Post industrial Age: Analysis Handbook, Rand, Santa Monica,2000.
20. Virmani, Arvind, ”Star Performers of the 20th (21st) Century: Asian Tigers, Dragons orElephants,” Occasional Paper, Chintan, September 1999, www.icrier.org/avpapers.html.
21. Virmani, Arvind, ”Potential Growth Stars of the 21st Century: India, China and TheAsian Century,” Occasional Paper, Chintan, October 1999, www.icrier.org/avpapers.html.
22. Waltz, Kenneth, Theory of International Politics, Addison-Wesley, Reading, 1979.