working paper no. 14-16/r the evolution of u.s. …
TRANSCRIPT

WORKING PAPER NO. 14-16/R THE EVOLUTION OF U.S. COMMUNITY BANKS
AND ITS IMPACT ON SMALL BUSINESS LENDING
Julapa Jagtiani Federal Reserve Bank of Philadelphia
Ian Kotliar Rutgers University
Raman Quinn Maingi Rutgers University
October 2015

1
The Evolution of U.S. Community Banks and Its Impact on Small Business Lending
Julapa Jagtiani*
Ian Kotliar
Raman Quinn Maingi
October 2015
Abstract There have been increasing concerns about the potential of larger banks acquiring community
banks and the declining number of community banks, which would significantly reduce small business lending (SBL) and disrupt relationship lending. This paper examines the roles and characteristics of U.S. community banks in the past decade, covering the recent economic boom and downturn. We analyze risk characteristics (including the confidential ratings assigned by bank regulators) of acquired community banks, compare pre- and post-acquisition performance, and investigate how the acquisitions have affected SBL. Contrary to concerns, our regression analysis shows that the overall amount of SBL increases more after a merger when a large bank acquires a community bank. Data suggest an overall (regardless of mergers) declining SBL trend for all size groups. In fact, the decline in the SBL ratio has been more severe among community banks on average, relative to large banks. Community banks that were merged during the financial crisis were less healthy than in earlier periods. Our results indicate that mergers involving community bank targets over the past decade have enhanced the overall safety and soundness of the banking system without adversely impacting SBL. Supervisory policies that discourage mergers between community banks and large banks could potentially result in an unintentional dampening effect on the supply of SBL.
Keywords: community banks, small business lending, bank mergers JEL Classifications: G21, G28, G34 ______________________ *Please direct correspondence to Julapa Jagtiani, Federal Reserve Bank of Philadelphia, Supervision, Regulation, and Credit Department, Ten Independence Mall, Philadelphia, PA 19106; 215-574-7284; e-mail: [email protected]. Both Kotliar and Maingi were students at Rutgers University when this paper was written. The authors thank Allen Berger, Mitchell Berlin, Paul Calem, William Lang, and Lamont Black for their valuable comments and suggestions. Thanks also to Vince Poppa for his data support and Juanzi Li for her dedicated research assistance. The views in this paper are those of the authors and do not necessarily reflect the views of the Federal Reserve Bank of Philadelphia or the Federal Reserve System. This paper is available free of charge at www.philadelphiafed.org/research-and-data/publications/working-papers/.

2
I. Introduction
The recent financial crisis has resulted in a dramatic increase in the number of problem
banks — from 50 problem banks in 2005 to a peak of 884 in 2010. As of March 2013, there
were still 612 problem banks.1 Most of these are small community banks with average assets of
about $450 million. The stock market recovered and reached a new high in 2013 and has
continued to climb. Large banks, particularly those in the too-big-to-fail (TBTF) category or the
systemically important financial institutions (SIFI), have also recovered strongly.2 However, the
affected community banks remained troubled.
While the Dodd-Frank Wall Street Reform and Consumer Protection Act has focused
mostly on large TBTF banks, there have been fears among small community banks that they
also might be affected and that the new rules might inhibit their ability to lend in their local
communities because of the increased costs of such lending.3 For these reasons, some
commentators believe that many of the community banks have been seeking to merge or to be
acquired by a large bank to take advantage of the scale economies under the new regulations.4
Should community banks be encouraged to merge? Would acquisitions of community banks by
large banks result in a significant reduction in small business lending (SBL) and destroy
relationship lending?
Our objective is to examine the impact of small community bank acquisitions on SBL
over the past decade, covering both the boom and the recent downturns, with particular
attention to the differential impacts of acquisitions by large versus small banks. It is important
to note that we define community banks as being smaller than $1 billion in this paper. The
1 Source: Federal Deposit Insurance Corporation (FDIC) Report (2012) 2 For example, JPMorgan Chase & Co. reported profit growth of 31 percent per share in the second quarter of 2013, Goldman Sachs’ profits also more than doubled in the second quarter of 2013 compared with the year before, and the Bank of America reported a 65 percent increase in profits during the same period. 3 This concern holds despite the recent efforts to impose less complex requirements for small banks, such as the Volcker Rule, which was approved by the Senate in December 2013. 4 In the 2013 Annual Report, the Conference of State Bank Supervisors released a paper on designing a federal regulatory framework for community banks. The group has argued that the rulemaking policy since the financial crisis has undermined the smaller lenders’ ability to provide credit tailored to consumers and small businesses. See the Conference of State Bank Supervisors (2014) for more details.

3
definition of a community bank has been evolving. Some may refer to community banks being
as large as $10 billion when considering the entire banking organization.5 In this study,
however, we separate out small community banks with assets of less than $1 billion from the
group of larger community banks with assets of between $1 billion and $10 billion.
The measures of performance and risk characteristics used in this study include
confidential supervisory ratings (CAMELS) before and after the mergers. (The component rating
C represents capital adequacy, A represents asset quality, M is management quality, E
represents earnings, L measures the bank’s liquidity position, and S measures the bank’s
sensitivity to market risk. The composite rating of CAMELS is also assigned to represent the
rating on the overall banking institution.) In addition, this study also measures how the banks
perform in terms of risk-taking, efficiency, liquidity, capitalization, asset quality, and
profitability. We use data on mergers and acquisitions that involved community bank targets
from 2000 to 2012 to examine the risk characteristics of the targets and acquirers at the time of
the mergers, to track post-merger performance of the combined banking firm, and to
investigate whether the mergers affected the banks’ SBL.
We find that community bank mergers that took place during the recent financial crisis
are much different than those mergers that occurred in the earlier periods. Interestingly, the
acquirers have been generally healthier prior to the merger, and the combined banking firms
have been healthier financially and more efficient in their operations after the merger,
regardless of the economic condition and whether the acquirers are large or small. Controlling
for the risk characteristics of the targets and the acquirers, the economic environment, and the
market condition for SBL at nonmerged banks with similar (to the combined firm) asset size and
CAMELS rating, our regression analysis shows that the overall SBL amount increases more when
the acquirer is a large bank with assets of more than $10 billion. In terms of changes in the SBL-
to-asset ratio, however, the impact of the mergers tend to be insignificant regardless of the size
of the acquirers. Our overall results suggest that mergers that involved community bank targets
have enhanced the safety and soundness of the banking system so far and have done so
5 See, for example, the Federal Deposit Insurance Corporation (2012) for definitions of a community bank.

4
without any adverse effects on SBL, as large banks have come in to substitute and to fill the SBL
gap.6
The rest of the paper is organized as follows. Section II discusses existing literature
related to the special role of community banks in relationship lending and those related to the
impact of community bank mergers on credit availability to small businesses. Section III
describes the data sources and provides a statistical overview of the changes in the U.S.
community banking industry and community bank mergers since the year 2000. Section IV
explores the risk characteristics of the targets, the acquiring banks, and the combined banking
firms for all the mergers that involved community bank targets since the year 2000 and shows
that community banks have become stronger through the mergers and acquisitions. Section V
investigates the evolving role of community banks versus large banks in SBL between 2000 and
2012 by exploring SBL market shares at large versus community banks and how SBL may have
been affected by community bank mergers. Section VI provides a rigorous analysis of the
impact of community bank mergers on SBL using regression analysis and controlling for the
various risk characteristics of the targets and the acquirers, economic conditions, and the
overall market trend for SBL around the time of the merger announcement. Finally, concluding
remarks and policy implications are presented in Section VII.
II. Literature Review and Our Contribution
About 90 percent of all U.S. banks are community banks with total assets of less than
$1 billion. These banks altogether, however, account for only about 10 percent of U.S. banking
assets (see Table 1). This may be the reason why research that focuses on community banks has
been relatively scarce, despite concerns about the impact of the recent recession on this sector
and the related policy considerations. We will focus on studies pertaining to community bank
mergers and the role of community banks in SBL.
The Role of Community Banks in SBL: The existing literature on the role of community
banks in SBL has provided mixed results so far. Beccalli and Frantz (2013) and Kowalik (2014), 6 It should be noted, however, that we measure a bank’s SBL activities based on Call Reports. The data do not allow us to identify whether the SBL was made to local businesses or to small businesses outside the local community.

5
for example, find support for the traditional view that small community banks have advantages
in monitoring their customers through personal relationships and that, through mergers,
community banks could become too large to look beyond credit scores in their lending
decisions and too large to maintain direct personal knowledge, which has enabled them to
meet community needs.
Using merger data from 1991 to 2006, Beccalli and Frantz (2013) examine important
determinants for banks to become involved as either a target or an acquirer in a merger. While
the paper focuses primarily on methodological approaches — multinomial logistic versus Cox
regression — the authors find banks that are likely to become a target of a bank merger tend to
be cost- and profit-inefficient, less liquid, and less capitalized. They also find that acquiring
banks tend to be well diversified and well managed and managers leverage their profits and
pursue higher growth strategies. Banks that acquire other banks multiple times (involved in
multiple merger deals rather a single deal) tend to be larger banks.
Kowalik (2014) examines how competition from large banks, which have lower funding
costs, affects small banks’ ability to attract and maintain their borrowers. Small community
banks have advantages in monitoring their customers through personal relationships, and they
have an important role to play in monitoring and enhancing the project value for intermediate
quality borrowers whose true quality may not be reflected in the public reports. The paper
argues that small banks can be viable competitors of large banks and can add value to the
borrowers’ projects when the true value cannot be easily observed by large banks. This finding
suggests that, unlike large banks that serve large transparent firms, small community banks
have a special role in supporting small businesses in their local communities since they are
better able to form strong relationships with small opaque firms.
Several other papers, however, find different results that may be driven by different
data and/or by different methodologies. Overall, other studies suggest that while large banks
may have a comparative disadvantage in relationship lending, it does not necessarily imply that
large banks are disadvantaged in providing credit to informationally opaque (and small) firms.
One reason is that large banks have a comparative advantage in using small business credit
scores (SBCS) that has allowed them to increase lending to marginal borrowers and to do so at

6
lower cost than small banks could. The SBCS, which has been widely used by large banks, is also
believed by some to serve as a better tool for evaluating credit risk than the individual (business
owner) credit scores used by community banks. Finally, some studies examine reactions by
other local banks to local community bank mergers and find that other banks start making
more SBL. In addition, de novo banks7 tend to spring up in response to community bank
mergers. Both large banks and de novo banks together have more than filled the SBL gaps
caused by community bank mergers. More details on these studies follow.
Berger and Udell (2006) examine lending to small and medium-size enterprises (SME)
using a more complete framework that allows the presence of alternative lending technologies.
They conclude against some previous findings that large banks have a comparative advantage
in transaction-based lending technologies and that some transaction-based lending
technologies used by large banks are actually well suited for funding opaque SMEs. They also
point out that the conventional results from other studies may be driven by the differences
between the U.S. structure and that of other nations. The presence of small banks may be more
important in other nations because their financial structures may limit use of some lending
technologies that are available in the U.S.8
Berger, Goulding, and Rice (2014) examine the type of bank serving as the main
relationship bank for small businesses, controlling for risk characteristics of the firm and those
of the owner, using the 2003 Survey of Small Business Finances. Their results are not consistent
with the conventional paradigm. Similarly, Berger, Cerqueiro, and Penas (2014) examine the
contributions of small banks in lending to recent startups from 2004 to 2009. They find that the
greater market presence of small banks results in more lending to small opaque firms and a
lower failure rate of these small firms during normal times. However, this holds only for
information-intensive loans, such as term loans and business lines of credit. In addition, this
relationship disappeared and was reversed during the financial crisis.
Berger, Frame, and Miller (2005) find that SBCS plays an important role in SBL. The SBCS
has allowed some large banks to expand their lending to at least some pools of small business
7 Denovo banks are state banks that have been in business for less than five years. 8 The most recent review of bank lending technologies may be found in Berger (2014).

7
customers — therefore, this technology has allowed larger banks to increase their role in
lending to small businesses. Consistent with these findings, Berger, Cowan, and Frame (2011)
find that the use of credit scores (rather than relationships) in SBL by community banks is
surprisingly widespread. Interestingly, the credit scores employed by community banks tend to
be the consumer credit scores of the small business owners rather than the more
encompassing SBCS that more accurately reflect credit information on both the firms and the
owners.
Community Bank Mergers and SBL Impacts: Elyasiani and Goldberg (2004) present a
literature survey on SBL and suggest that, while bank mergers are likely to affect SBL, the
decision for banking firms to make relationship loans also could be affected by several other
factors, such as regulatory and/or technological changes, loan characteristics (such as collateral
and loan rates), and borrower characteristics (such as multiple relationships, length of
relationship, distance, etc.).
Jagtiani (2008) examines 3,900 mergers that involved publicly traded banking
organizations during the pre-financial crisis period from 1990 to 2006. The results indicate that
more than one-half of the acquiring banks that bought community banks were themselves
community banks. This, in conjunction with another finding that almost 90 percent of all
mergers between community banks involved banks headquartered in the same state, seems to
suggest that community banks may be merging with the goal of concentrating their efforts on
what they are believed to do best (which is to provide personal service to small businesses and
other local customers); thus, this should not have an adverse impact on SBL.
Avery and Samolyk (2004) look deeper into this issue and take into account reactions by
other local banks, using data from 1994 to 2000. Interestingly, they find different reactions to
large bank mergers versus small bank mergers. Specifically, large bank mergers are associated
with slower loan growth in the local area, but community bank mergers are associated with
higher loan growth and greater market share of the SBL funded by local community banks. They
conclude that other community banks in the area react to mergers by making more SBLs. This is
consistent with Jagtiani (2008) and sheds light on the source of increased SBLs by community
banks in the local area.

8
Berger, Scalise, Saunders, and Udell (1998) also find that other banks in the area had
strong SBL reactions to bank mergers as the size distribution of banks in the local market
change. They investigate the static versus dynamic effects of bank mergers on SBL. They find
that while the static effects (associated with scale and strategy because of reduced efficiency in
relationship lending as the banks merge into a larger bank) resulted in a reduction in SBLs, the
dynamic effects (associated with post-merger impact and reactions by other local banks)
resulted in increased SBL by other banking firms in the local area. Overall, they conclude that
the static effects reducing SBL are more than offset by the reactions of other local banks so the
net impact of bank mergers results in increased SBL.
In addition to increased SBL from other nonmerged banks in the same local area,
Berger, Bonime, Goldberg, and White (2004) found that de novo banks spring up and start
engaging in SBL in markets in which there are mergers. Goldberg and White (1998) and
DeYoung, Goldberg, and White (1999) find that new banks tend to make more relationship
loans and that the amount of relationship lending declines as banks age (up to 20 years old). In
response to community bank mergers, de novo banks tend to be formed to fill the SBL gap as
small local banks disappear through mergers.
Overall, the literature suggests there are many factors that impact the amount and
growth in SBL. Bank consolidation and reactions by other banks to local bank mergers could
impact SBL. Besides mergers and acquisitions, factors such as changes in market environment
and regulations could play an important role. The recent financial crisis has brought about one
of the largest changes in the history of banking regulations, resulting in dramatic changes in the
behaviors of both borrowers and banking firms. Our paper reexamines community bank
mergers and SBL, using more recent data.
III. Community Banking Overview
Our data come from various sources. We focus on mergers that involved community
bank (with assets of less than $1 billion) targets from 2000 to 2012. All the information related
to the mergers, such as merger announcement date, type of merger, financial characteristics as

9
of merger announcement date, comes from the SNL Financial database. Our sample excludes
government-assisted mergers, mergers that were announced but not completed, and mergers
that involved a purchase or sale of branches or some operating units (rather than the
acquisition of the entire bank or bank holding company (BHC)).
Supervisory CAMELS ratings are collected from the National Examination Data (NED)
System and the National Information Center (NIC). Data related to SBL are collected from the
Federal Reserve Call Reports. We use information from Y-9 Reports and the structure data from
the Federal Reserve to identify relationships between the banks and BHCs involved in the
mergers. Some mergers involved mergers and acquisitions of between banks, some are
between BHCs, and others are between a bank and a BHC. Since SBL and CAMELS ratings are
available only at the bank (rather than the BHC) level, we use SBL and CAMELS of the largest
bank under the BHCs that were involved in the mergers. Economic factors are collected from
the Haver Analytics database.
Basic Facts on U.S. Banking Industry
The U.S. banking industry is unique in that, while more than 90 percent of about 7,000
U.S. banks are small community banks (with less than $1 billion in assets), more than 90
percent of the U.S. banking assets are held at large banking institutions.9 The community
banking sector has also been shrinking over time, both in terms of the number of community
banks and the amount of assets controlled by community banks (Table 1).
There has also been a long-term, steady trend of merger and acquisition activity
involving community banks. Overall, the number of large banks has been growing significantly
in the past decade, while there has been a substantial decline in the number of community
banks. More than 90 percent of all bank merger transactions that took place from 2000 to 2012
involved community bank targets. However, this number translates to about only 10 percent in
terms of all targets’ banking assets (Table 2A).
9 This is as of year-end 2012.

10
Community Banks and Relationship Lending
There have been concerns that attrition of the community banking sector may be
adversely affecting SBL and that acquisition of small banks by large banking institutions would
disrupt relationship lending. The general perception seems to be that the observed decline in
the number of community banks in the past decade may not result in much impact on SBL if the
acquirers have been community banks (rather than large banks). Table 2B shows that about 68
percent of the community banks that merged during the sample period were acquired by other
community banks.
The next question is whether these acquirers of community banks are from out-of-state
firms because of the concerns that, if the acquiring banks are headquartered in another state,
the funding from the local community may be lost to out-of-state borrowers. Table 3 shows
that more than 80 percent of community bank mergers (mergers between the community bank
target and the community bank acquirer) have been within the same state (in-state mergers).
So far, these basic statistics indicate that the majority of community bank mergers
involved community bank acquirers and that they were mostly in-state mergers; thus, the
mergers may not have a significant impact in reducing lending to small businesses and/or
moving funds out of the community. We explore this issue further and examine whether
community bank mergers that took place in the past decade may have strengthened the banks’
comparative advantage in relationship lending.
IV. Have Community Banks Become Stronger or Weaker After the Mergers?
We explore important characteristics of targets and acquirers around the mergers’
announcement dates and compare those with characteristics of the combined firm (after the
mergers). Figures 1.1 to 1.7 compare pre-merger and post-merger performance based on the
various components of the confidential supervisory CAMELS ratings.
The sample includes nonassisted mergers that involved community banks targets from
2000 to 2012. The plots in Figures 1.1 to 1.7 compare the targets’ and the acquirers’ average
supervisory CAMELS ratings across all the mergers that were announced in each year. The

11
ratings are usually assigned at least about every 18 months. The pre-merger ratings for targets
and acquirers are the latest assigned CAMELS ratings prior to the merger announcement date.
The post-merger CAMELS ratings are the combined firm’s first assigned rating after the merger
has been completed. When the targets or the acquirers are BHCs, we use the CAMELS rating of
the largest bank under the involved BHC. Note that the lowest rating (1) represents the best
rating, and the highest rating (5) is the worst.10
Based on the average supervisory ratings prior to the mergers, the community bank
target is consistently weaker on average than the acquirer, particularly for mergers that took
place during the financial crisis period or later (2008 and thereafter) when the targets’ ratings
averaged around 3 (satisfactory) for capital adequacy, asset quality, management quality, and
composite rating. The targets’ average rating for earnings and profitability was slightly below 3
for mergers that were announced between 2008 and 2010. The ratings of the combined firm
(after the merger) are much improved compared with those of the targets before the mergers.
These results are consistent across all component ratings and the composite CAMELS ratings.
Overall, community banks that were acquired during the financial crisis had performed poorly
and, on average, were right around border line to be rated satisfactory by their regulators on all
risk aspects.
Figure 1.8 plots the number of community bank targets and the distribution of their
composite CAMELS ratings as of the merger announcement date. The majority of community
bank targets for mergers announced during the sample period (except for the financial crisis
period) are healthy banks, with composite CAMELS rating of 1 or 2. Unlike the mergers that
were announced between 2000 and 2007 and in 2012, community bank targets for mergers
that took place between 2008 and 2011 consisted of a larger share of lower rated targets,
which would have been less able to serve as a good funding source for small businesses
10 Agarwal, Lucca, Seru, and Trebbi (2014) find that different regulators may be applying different standards when assigning the CAMELS ratings. The discrepancy is related to different weights given to local economic conditions. While our analysis here does not control for the regulators (federal versus state regulators) that assigned the ratings, we do control for economic conditions around the merger date.

12
anyway. In fact, they were more likely to fail if they were not acquired by another (healthier)
bank.11
Unlike the target community banks, most of the acquirers of community banks were
1-rated or 2-rated institutions, as shown in Figure 1.9. Overall, for the entire sample period that
includes both boom-and-bust economic environment, community bank mergers have served to
enhance the safety and soundness of the banking system,12 suggesting that there may not be
any good reasons to be overly concerned about the large number of community bank mergers
so far.
In addition to exploring the confidential supervisory ratings before and after the
mergers, we support our findings with additional analysis of other important performance
measures for targets and acquirers. Figures 2.1 to 2.5 present the various performance
measures, based on the return on equity (ROE), operational inefficiency ratio (measured as the
ratio of noninterest expense to the sum of net interest income and other income),
nonperforming assets (NPA) ratio, loan-loss reserve ratio, and common equity capital-to-total
asset ratio, respectively. The results are consistent with those presented earlier based on
supervisory CAMELS ratings. It is also interesting to note that most of the community bank
targets consistently have been very small banks — with less than $500 million in assets — as
shown in Figure 2.6. Again, community bank targets are generally weaker than the acquirers
prior to the mergers, particularly for community bank mergers that took place during and after
the recent financial crisis.13
11 Gilbert, Meyer, and Fuchs (2014) examine banks with asset <$10 billion that were rated 4 or 5 at some point during 2006‒2013, and they find that almost half of them either merged with another bank (15.6 percent) or failed (24.7 percent) by the end of 2013. 12 Our finding is consistent with Cooper and Vermilyea (2012), who find that mergers involving a well-managed acquiring bank (with a superior M rating) could improve the long-term performance of the combined banking firm after the merger. 13 The targets were not profitable (smaller ROE or larger losses), were less efficient in their operations, had more bad loans (more charge-offs), and were less capitalized.
13
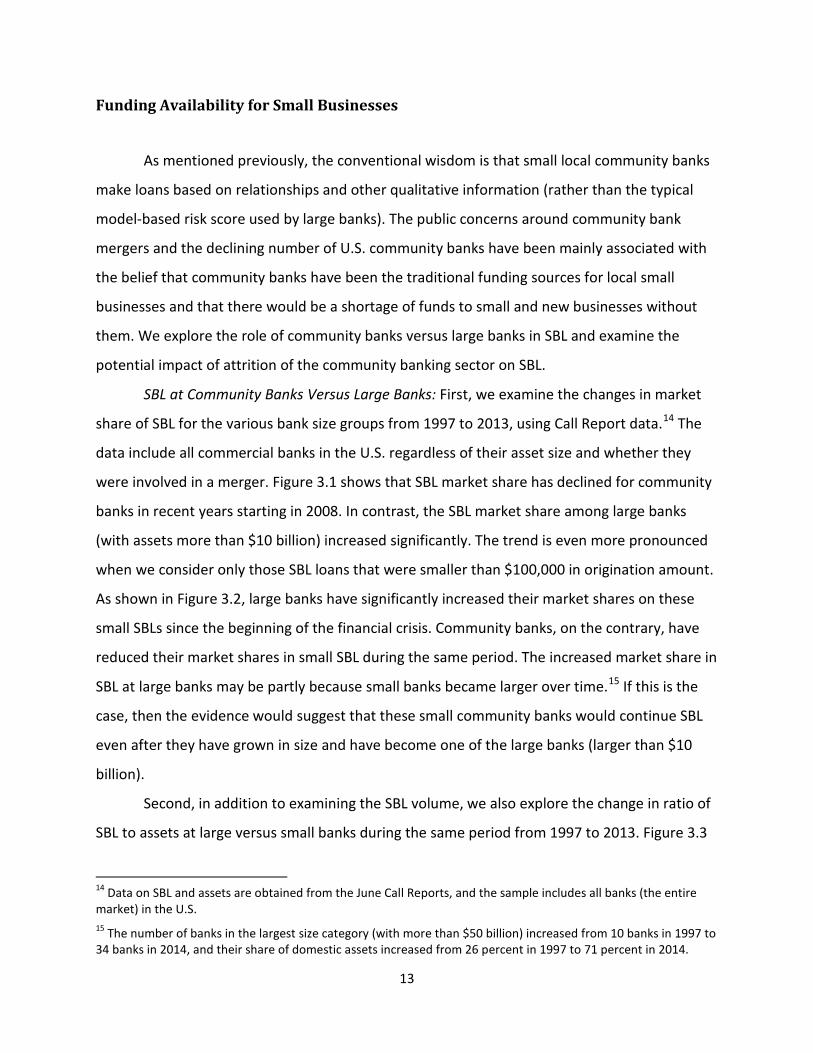
Funding Availability for Small Businesses
As mentioned previously, the conventional wisdom is that small local community banks
make loans based on relationships and other qualitative information (rather than the typical
model-based risk score used by large banks). The public concerns around community bank
mergers and the declining number of U.S. community banks have been mainly associated with
the belief that community banks have been the traditional funding sources for local small
businesses and that there would be a shortage of funds to small and new businesses without
them. We explore the role of community banks versus large banks in SBL and examine the
potential impact of attrition of the community banking sector on SBL.
SBL at Community Banks Versus Large Banks: First, we examine the changes in market
share of SBL for the various bank size groups from 1997 to 2013, using Call Report data.14 The
data include all commercial banks in the U.S. regardless of their asset size and whether they
were involved in a merger. Figure 3.1 shows that SBL market share has declined for community
banks in recent years starting in 2008. In contrast, the SBL market share among large banks
(with assets more than $10 billion) increased significantly. The trend is even more pronounced
when we consider only those SBL loans that were smaller than $100,000 in origination amount.
As shown in Figure 3.2, large banks have significantly increased their market shares on these
small SBLs since the beginning of the financial crisis. Community banks, on the contrary, have
reduced their market shares in small SBL during the same period. The increased market share in
SBL at large banks may be partly because small banks became larger over time.15 If this is the
case, then the evidence would suggest that these small community banks would continue SBL
even after they have grown in size and have become one of the large banks (larger than $10
billion).
Second, in addition to examining the SBL volume, we also explore the change in ratio of
SBL to assets at large versus small banks during the same period from 1997 to 2013. Figure 3.3
14 Data on SBL and assets are obtained from the June Call Reports, and the sample includes all banks (the entire market) in the U.S. 15 The number of banks in the largest size category (with more than $50 billion) increased from 10 banks in 1997 to 34 banks in 2014, and their share of domestic assets increased from 26 percent in 1997 to 71 percent in 2014.

14
shows that the SBL-to-assets ratio has declined for all bank size groups (including community
banks). This evidence suggests that banking assets have been growing at a faster rate than the
banks’ small business loans, possibly partially driven by a decline in overall demand for SBL
and/or competition from nonbank lenders.16 Focusing on depository institutions, Figure 3.3
shows that the decline in the SBL ratio at community banks has been more severe than at larger
banks since the beginning of the financial crisis. This evidence is consistent with an argument
that large banks could potentially fill the gap created by community banks in SBL lending.17
In summary, while community banks have consistently been more committed to SBL
(with larger SBL-to-asset ratios), this does not translate to a large volume of SBL. More
important, since the beginning of the recent financial crisis, the average SBL-to-assets ratio has
declined more sharply on average at community banks than at the larger banks. The significant
decline in SBL among community banks occurred despite the federal support to help them
jump-start the economy during the financial crisis through the Small Business Lending Fund
(SBLF). The SBLF was made available only to small banks with assets less than $10 billion.
However, 87 percent of the eligible community banks did not apply for the SBLF.18
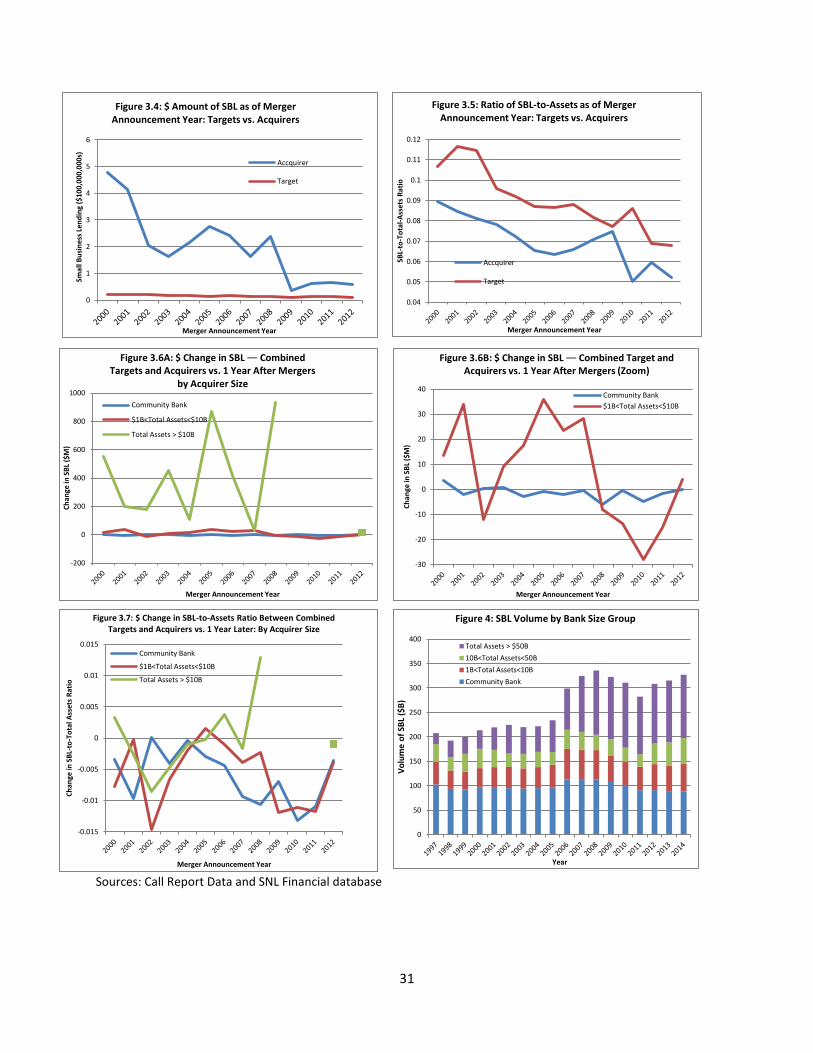
SBL at Community Banks That Merged: We next focus on SBL volume associated with
community banks that merged during the period from 2000 to 2012. First, we compare SBL at
the targets versus the acquirers. In terms of SBL volume (in dollar amount), Figure 3.4 shows
that, as expected, the community bank targets had significantly smaller SBL on average than
the acquirers did.19 In terms of commitment to SBL (SBL-to-assets ratio), however, Figure 3.5
16 Jagtiani and Lemieux (2015) find evidence that nonbank lenders have also been playing an increasing role in small business lending in recent years. 17 Hughes, Jagtiani, and Mester (2015) explore the incentives (for SBL) across large and small banking institutions. Their preliminary results suggest that small banks (with assets of less than $1 billion) had fewer incentives for SBL when compared with larger banks with assets of between $1 billion and $10 billion, based on 2013 data. 18 Of the 7,700 banks that were eligible, only 1,000 banks applied and 332 banks were approved. As a result, of the total SBLF funding of $30 billion, only $4 billion was distributed. See Carpenter and Robinson (2014) for more details. 19 For Figures 3.4 to 3.7, the data on SBL and assets are obtained from the quarterly Call Reports. The sample includes all mergers announced from 2000 to 2012 that involved community banks (targets of less than $1 billion in assets). The mergers data are from the SNL database. Note that SBL is reported only once a year in June until 2012, when the SBL began being reported quarterly.

15
shows that the community bank targets were more committed than the acquirers prior to the
mergers.
We then compare SBL activities during the period pre- versus post-mergers, controlling
for the asset size of the acquirers, whether they are also community banks or larger banks. The
results are presented in Figures 3.6A, 3.6B, and 3.7. From Figure 3.6A, the change in dollar
amount of SBL, from before mergers (combined targets’ and acquirers’ SBL) to one year after
the mergers, is large and quite volatile when the acquirers are large banks (larger than $10
billion). For this group of (large) acquirers, the change in SBL has been consistently positive on
average for the entire sample period. Figure 3.6B is an enlarged version of Figure 3.6A that
focuses on small acquirers (excluding large acquirers), indicating that the change in SBL volume,
from before the mergers to one year after the mergers, has often been negative when the
acquirers are smaller banks. The results support an argument that mergers between small
community banks and large banks would not necessarily harm SBL as some may have feared.
Figure 3.7 plots the change in the SBL-to-assets ratio, from before the mergers to one
year after the mergers. The percentage change in SBL ratio is measured based on the combined
SBL made by the targets and the acquirers as of the merger announcement date versus the SBL
made by the combined firm as of one year after the merger. Post-merger SBL ratio is the SBL
volume of combined firm (as of one year after the merger) divided by the assets of the
combined firm (as of one year after the merger). We find that the average change in the SBL-to-
assets ratio, from pre-mergers to one year after the mergers, have been consistently negative
(a decline in the SBL ratio) on average when the acquirers are small banks, with less than
$10 billion in assets. The change in the SBL ratio was positive on average in a few years (around
the financial crisis period) when the acquirers are larger than $10 billion. Again, this evidence is
consistent with an argument that supports the acquisitions of community banks by large banks.
To summarize, our results so far suggest that, while the U.S. banking industry has been
expanding rapidly in the past decade, the share of SBL-to-banking assets ratio has become
significantly smaller now than it was more than a decade ago.20 Following the overall industry
trends, the ratio of SBL to assets has declined for all bank size groups, regardless of whether 20 For example, for community banks, the SBL-to-asset ratio declined from about 12 percent in 2000 to about 8 percent in 2013. See Figure 3.3 for more details.

16
they were involved in mergers and acquisitions. Interestingly, the decline in the SBL ratio has
been more severe at community banks than at larger banks. Large banks have been playing an
increasing role in providing funding to small businesses.
V. Community Bank Mergers and SBL
To further understand the impact of community bank mergers on SBL, we perform a
regression analysis in which we control for the characteristics of the targets and the acquirers
as well as the SBL trend for similar banks (in the same size category, in the same time period as
merger announcement date, and with the same supervisory CAMELS rating), including banks
that did not merge. The data used for the analysis of SBL before and after the mergers consist
of 1,509 nonassisted mergers that involved community banks from 2000 to 2012. Summary
statistics of the sample are presented in Table 4.
We attempt to measure the impact of mergers on the changes in SBL activities between
merger announcement date (pre-merger SBL) and one year after the merger (post-merger SBL),
controlling for the SBL activities at similar banks that were not merged. We focus on both the
changes in SBL volume and the changes in SBL ratio to assets. Our analysis uses a diff-in-diff
regression analysis, in which our dependent variables measure the difference between the
change in SBL activities at merged banks and the change in SBL activities at nonmerged banks
that are similar to the merged banks, during the same time period (between the merger date
and one year later).
SBL activity at the similar nonmerged banks is calculated for each merged bank i. It is
calculated as a simple average of SBL activities (either SBL $ volume or SBL ratio to assets) at all
banks that are similar to the merged banks ― i.e.; being in the same asset size Segment j (less
than $1 billion, $1 billion to $10 billion, or greater than $10 billion) as the combined firm, and
holding the same composite supervisory CAMELS rating Segment k (1, or 2 rated, 3 rated, 4 or 5
rated) as the acquiring bank ― as of the merger announcement year (pre-merger) and as of one
year after the merger (post-merger). See Equations (1) and (2) that follow for the SBL trend
calculated for nonmerged banks before and after the merger for each merged bank i. We then

17
calculate the changes (differences) in SBL activities for these nonmerged banks between the
pre-merger and post-merger periods for each of the merger observations, as shown in Equation
(3) that follows. For each of the merged banks, we calculate the change in SBL activities from
merger announcement date to one year after the merger, as shown in Equation (4).21
Trend_SBLi,j,k,pre-merger = Average (SBLj,k,pre-merger) -------- (1)
Trend_ SBLi,j,k,post-merger = Average (SBLj,k,post-merger) --------- (2)
Diff_Trend SBLi,j,k = Trend_SBLi,j,k,post-merger - Trend_ SBLi,j,k,pre-merger ------ (3)
Diff_SBLi = SBLi,post-merger - SBLi,pre-merger --------- (4)
Diff_Diff_SBLi = Diff_SBLi - Diff_Trend SBLi,j,k --------- (5)
Dependent variables are measured as spreads between change in SBL activities at each
of the merged banks (Diff_SBLi) and the change in the trend of SBL activities at the similar
nonmerged banks (Diff_Trend SBLi,j,k). As noted previously, the SBL activities are measured in in
two ways: change in SBL $ volume and change in SBL ratio to assets. For each merged bank i,
the dependent variable (Diff_Diff_SBLi) is calculated as the difference between the change at
bank i and the change at similar nonmerged banks, as shown in equation (5).
Independent variables include the various risk characteristics of the acquirers and the
targets, including size of the acquirers, whether it is an in-state or out-of-state merger, whether
the acquirers are involved in any other merger activities within a year, the supervisory CAMELS
ratings, and the SBL market trends. For the supervisory ratings, which have values ranging from
1 (best) to 5 (worst), we include dummy indicators for the composite CAMELS ratings being 2, 3,
or 4 for the acquirers and 2, 3, 4, or 5 for the targets, as of merger announcement date. The
base cases are 1-rated targets and 1-rated acquirers.22 We also include dummy indicators for
the size category (less than $1 billion, between $1 billion and $10 billion, and larger than $10
billion) of the acquiring banks, where the community bank acquirers, with assets of $1 billion or
less, are included in the analysis as the base case.
21 Until 2010, SBL was reported only once a year at the end of the second quarter. The trend control factor is measured as the one-year change in the overall market (for the merged bank’s size group) around the merger date. For example, for a merger announced in November 2006, the trend variable would capture the change in SBL in the market from June 2006 to June 2007. 22 As shown earlier in Figures 1.8 and 1.9, which present the CAMELS distribution for the targets and the acquirers, respectively, indicate that most of the acquirers are 1-rated or 2-rated banks, while the targets are lower rated.

18
It is expected that the SBL and relationship lending may be harmed when a community
bank is acquired by an out-of-state acquirer. To measure change in SBL that was caused by a
specific merger, we control for multiple mergers within the one year using a dummy indicator
in the regression. The supervisory ratings are included in the analysis to control for the risk
characteristics of the targets and the acquirers. We include dummy indicators for the acquirers’
asset size to examine the impacts of acquirers’ size on SBL activities at the combined banking
firms. The results are reported in Table 5.23
From column 1 of Table 5, controlling for all the risk characteristics of the targets and
the acquirers and economic factors as described earlier, the combined banking firms tend to
increase their overall SBL volume by a larger amount when the acquiring bank is very large
(with more than $10 billion in assets).24 This is reflected in the significantly positive coefficients
of the dummy indicator D_Largest_Acquirer_>$10Bill. We find no significant change in the SBL
volume when the acquiring banks are either small community banks or medium size (with
assets less than $10 billion), after controlling for the risk characteristics, economic conditions,
and market trends. That is, there is no significant difference in SBL activities whether the
acquirers are community banks or not as long as the acquirers have less than $10 billion in
assets, as reflected in the insignificant coefficient of D_Large Acquirer_$1Bill to $10Bill. 25
When focusing on the change in ratio of SBL to assets, rather than the change in dollar,
the results in column 2 of Table 5 show that the change in SBL activity in terms of ratio to assets
(after the merger) is not significantly affected by the size of the acquirers after controlling for
the various risk characteristics of the targets and the acquirers and the SBL trends. The
coefficient of the indicator for the large acquirer is positive but not statistically significant. 23 We have also performed similar analysis, using changes in SBL activities at merged banks as dependent variables and controlling for the SBL trends at similar nonmerged banks; this is used instead of the diff-in-diff approach. The trend variable is calculated for each observation, and it is defined as a change in SBL at similar banks (regardless of whether they merged) that are in the same size segment and the same CAMELS segment, where the SBL change is measured over the same period based on the merged bank’s merger date. This trend variable is included in the analysis to control for SBL activities that were driven by the overall market trend and SBL demand through time and across banks (rather than the merger). The results are consistent with the results presented in Table 5. 24 Our analysis is based on the overall reported SBL in the Quarterly Call Report, which does not allow us to identify whether the increase in SBL takes place in the same local community as the community bank target or in other communities. 25 We repeat the same analysis with the component CAMELS ratings as control factors, rather than the composite rating; the concluding results are consistent with those reported in Table 5.

19
Instead, the risk characteristics of the acquirers and the targets seem to play a role here. When
the targets are poorly rated by bank supervisors (unsatisfactory ratings at 4 or 5 composite
CAMELS), the SBL activity after the merger tends to increase by less (or even decrease), as
reflected in significantly negative coefficients of the dummy indicators for targets being 4 rated
or 5 rated. For the acquirers, as shown earlier in Figure 1.9, most of the acquirers are either 1
rated or 2 rated. The results in column 2 of Table 5 show that the increase in the SBL ratio after
the merger is smaller when the acquirers are 2 rated than when the acquirers are 1-rated
banks. Very few acquirers are rated below 2, and the coefficients are not significant in those
cases.
The regression results confirm our previous findings that SBL activities on average
change significantly after the acquisitions. On the one hand, the volume of SBL lending seems to
grow by a substantially larger amount, even after controlling for the SBL trend, when the
acquirer is larger than $10 billion in assets. On the other hand, asset size of the acquirer does
not seem to have significant impacts on the change in SBL ratio to assets after the mergers,
controlling for important risk characteristics of the targets and acquirers, economic conditions,
and market trends.
Overall, the results are consistent with a favorable impact of acquisitions of community
banks on SBL activities, regardless of whether the acquirer is large or small. We note one
limitation on our SBL data that does not differentiate whether the increase in SBL after the
mergers occur in the local community of the acquired community banks or outside the local
community. Our results only conclude that the SBL activities have not been negatively affected
(reduced) overall by community bank mergers that involved large acquirers.
These findings should also be viewed in the context of the overall industry trends
described previously. The SBL ratio for the banking industry overall has been declining, more so
for community banks than large banks, on average, over the recent years. Figure 4 shows that
the overall SBL by the banking industry has been declining since the beginning of the financial
crisis and that larger banks (with assets more than $10 billion) have been playing increasing

20
roles in SBL relative to smaller banks during the same period.26 The roles of large banks in
supporting small businesses have become increasingly important relative to small community
banks.27 The overall results, in conjunction with the plot in Figure 3.3 that shows smaller SBL
ratio to assets at larger banks, suggest that the growth in loan demand for small business may
be slower than that of the overall banking assets in recent years. This is something to explore in
more detail in a separate study.
VI. Conclusions and Policy Implications
There have been growing concerns about the potential of the decline in the number of
community banks and the increasing number of acquisitions of community banks by larger
banks — to disrupt local relationships and significantly reduce SBL.
In this paper, we examine the roles and characteristics of U.S. community banks in the
past decade, covering both the boom period and the subsequent downturn. We compare the
pre- and post-merger performance and risk characteristics (including the confidential ratings
assigned by bank regulators) and investigate whether the mergers have affected SBL. We also
explore whether large banks have been able and willing to step in and substitute for community
banks in providing funding to small businesses.
We show that large banks have been getting larger and that the number of small banks
has been declining over the past two decades. During our sample period from 2000 to 2012, the
number of community banks has declined, and the overall SBL market share for the large banks
has grown, indicating that large banks have been stepping in to fill the SBL gap.
Our regression analysis, controlling for risk characteristics of the targets and the
acquirers, economic factors, and market trends, finds that the amount of SBL tends to increase
from the pre-acquisition base, and more so when the acquirer is a large bank (with assets of
more than $10 billion), indicating that the large bank acquirers do grow SBL. Our results on the 26 Nonbank lenders have also been playing an increasing role in SBL in recent years; see Jagtiani and Lemieux (2015) for more details. 27 It is interesting to note that while the amount of SBL by large banks increased throughout the years (as shown in Figure 4), the ratio of SBL by large banks has been declining (as shown in Figure 3.3). This suggests that assets at large banks have been growing at a faster rate than SBL.
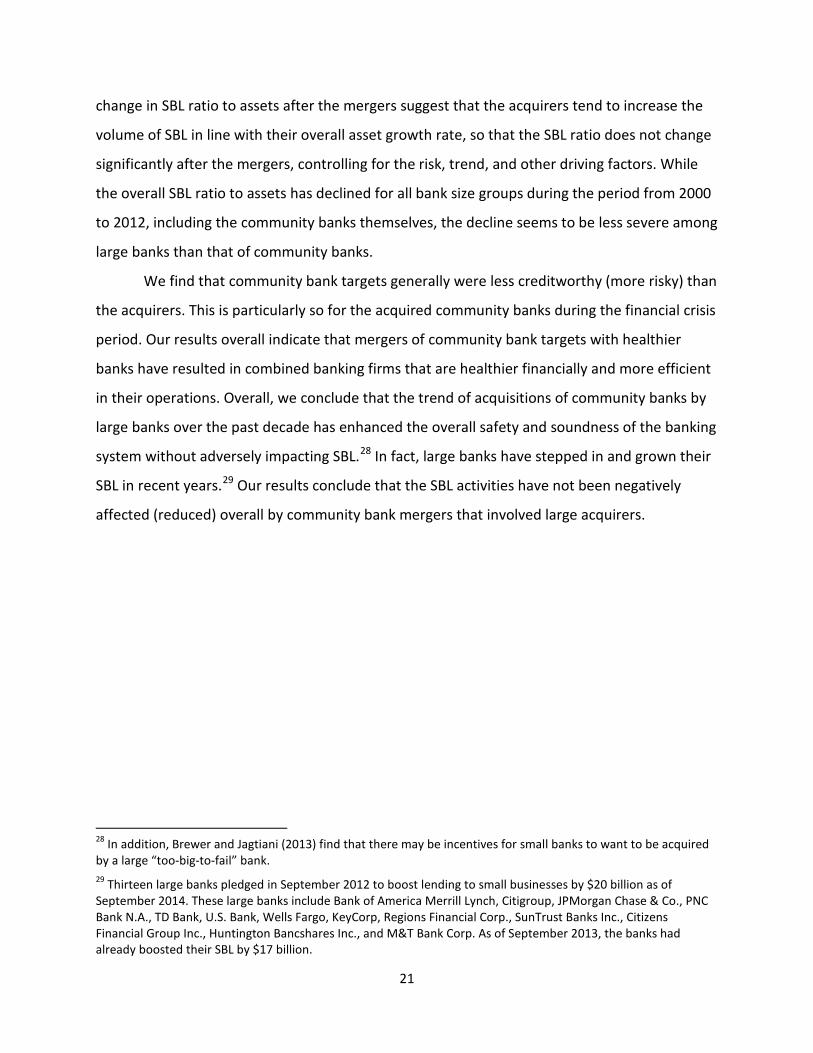
21
change in SBL ratio to assets after the mergers suggest that the acquirers tend to increase the
volume of SBL in line with their overall asset growth rate, so that the SBL ratio does not change
significantly after the mergers, controlling for the risk, trend, and other driving factors. While
the overall SBL ratio to assets has declined for all bank size groups during the period from 2000
to 2012, including the community banks themselves, the decline seems to be less severe among
large banks than that of community banks.
We find that community bank targets generally were less creditworthy (more risky) than
the acquirers. This is particularly so for the acquired community banks during the financial crisis
period. Our results overall indicate that mergers of community bank targets with healthier
banks have resulted in combined banking firms that are healthier financially and more efficient
in their operations. Overall, we conclude that the trend of acquisitions of community banks by
large banks over the past decade has enhanced the overall safety and soundness of the banking
system without adversely impacting SBL.28 In fact, large banks have stepped in and grown their
SBL in recent years.29 Our results conclude that the SBL activities have not been negatively
affected (reduced) overall by community bank mergers that involved large acquirers.
28 In addition, Brewer and Jagtiani (2013) find that there may be incentives for small banks to want to be acquired by a large “too-big-to-fail” bank. 29 Thirteen large banks pledged in September 2012 to boost lending to small businesses by $20 billion as of September 2014. These large banks include Bank of America Merrill Lynch, Citigroup, JPMorgan Chase & Co., PNC Bank N.A., TD Bank, U.S. Bank, Wells Fargo, KeyCorp, Regions Financial Corp., SunTrust Banks Inc., Citizens Financial Group Inc., Huntington Bancshares Inc., and M&T Bank Corp. As of September 2013, the banks had already boosted their SBL by $17 billion.

22
Table 1: Industry Trend
Number of Banking Organizations and Share of Banking Assets by Asset Size of Banking Organizations
Banking organizations include bank holding companies and independent commercial banks. Size thresholds are adjusted for inflation by using assets measured in 2006 prices. This table shows that while more than 90 percent of (about 7,000) U.S. banks are small community banks (with less than $1 billion in assets), more than 90 percent of the U.S. banking assets are held at larger banking institutions. More important, the community banking sector has been shrinking over time, both in terms of the number of community banks and the amount of assets controlled by community banks.
Source: Call Reports (June data for each year)
Year
Number of Banking Organizations by Asset Size ($billions)
Share of Domestic Banking Assets (%) by Asset Size ($billions)
<$1 $1-$10
$10-$100 >$100 All <$1 $1-$10
$10-$100 >$100 All
2001 6850 275 53 6 7184 18.4% 15.3 30.1 36.1 100% 2002 6671 270 52 7 7000 18.0% 14.3 25.7 42.0 100% 2003 6521 277 60 7 6865 17.1% 12.5 27.1 43.3 100% 2004 6380 300 54 7 6741 16.0% 12.8 24.6 46.7 100% 2005 6240 312 54 7 6613 13.4% 11.0 22.1 53.6 100% 2006 6933 384 75 8 7400 12.6% 11.3 27.5 48.6 100% 2007 6795 394 68 13 7270 11.9% 10.5 20.6 57.0 100% 2008 6674 379 57 17 7127 11.3% 9.7 16.8 62.1 100% 2009 6440 406 63 18 6927 10.8% 9.4 16.9 62.8 100% 2010 6159 379 57 19 6614 10.6% 8.9 14.7 65.8 100% 2011 5897 375 61 17 6350 9.9% 8.5 16.8 64.8 100% 2012 5708 369 61 18 6156 9.7% 8.5 15.9 65.9 100%

23
Table 2A: Bank Mergers ― by Asset Size of the Targets
This table presents the merger trend, including both assisted and nonassisted mergers, over the period from 2000 to 2012. More than 90 percent of the mergers that took place involved community bank targets (with assets less than $1 billion). This number, however, accounts for only slightly more than 10 percent in terms of all targets’ banking assets. Note: Banking organizations include bank holding companies and independent commercial banks. Size thresholds are adjusted for inflation by using assets measured in 2006 prices.
Year
Number of Acquisitions ($billions) by Target’s Asset Size
Amount of Assets Acquired ($billions) by Target’s Asset Size
<$1 $1-$10
$10-$100 >$100 All <$1 $1‒$10 $10‒
$100 >$100 All
2000‒2004 810 67 18 4 899 $140.3 $172.0 $526.1 $937.4 $1775.8 2005‒2006 412 28 7 0 447 $73.6 $70.1 $220.0 $0.0 $363.8 2007‒2008 307 24 4 3 338 $53.0 $69.0 $102.9 $1017 $1242.7 2009‒2010 342 28 6 0 376 $69.3 $77.0 $114.3 $0.0 $260.6 2011‒2012 337 23 1 0 361 $64.2 $53.1 $24.5 $0.0 $141.8
Total Number of
Acquisitions 2208
91.2% 170
7.0% 36
1.5% 7
0.3% 2421 100%
$400.4 10.6%
$441.2 11.7%
$987.8 26.2%
$1955 51.9%
$3764.7 100%
Source: SNL Financial database
Table 2B: Bank Mergers — by Asset Size of Acquirers
The table below shows that about 60 percent of all the community bank acquisitions that took place during the period from 1990 to 2012 involved community bank acquirers. This translates to about 40 percent of all community bank assets being acquired in the same period. Note: Banking organizations include bank holding companies and independent commercial banks. Size thresholds are adjusted for inflation by using assets measured in 2006 prices.
Year
Number of Community Bank Acquisitions ($billion)
by Buyer’s Asset Size
Amount of Community Bank Assets Acquired ($billion)
by Buyer’s Asset Size
<$1 $1‒$10
$10‒$100 >$100 All <$1
$1‒$10
$10‒$100 >$100 All
2000‒2004 467 257 80 6 810 44 62 31 2.5 140 2005‒2006 243 137 24 8 412 28 32 10 2.6 73 2007‒2008 217 74 14 2 307 24 22 6 0.8 53 2009‒2010 312 29 0 1 342 61 8 0 0.4 69 2011‒2012 261 69 6 1 337 44 18 2 0.4 64
Total
1500 68%
566 26%
124 5%
18 1%
2208 100%
201 50%
142 36%
49 12%
6.7 2%
399 100%
Source: SNL Financial database

24
Table 3: Mergers Between Community Banks
In-State vs. Out-of-State
The table below shows that about 80 percent of community bank mergers (mergers between the community bank target and the community bank acquirer) have been within the same state (in-state mergers). This translates to about 60 percent of assets of the targets. Note: The sample includes all bank mergers in which both the targets and the acquirers are U.S. commercial banks or bank holding companies with total assets less than $1 billion (in 2006 prices).
Year
Number of Community Bank Acquisitions
Amount of Community Bank Assets Acquired ($billion)
In-State Out-of-State In-State Out-of-State
1990‒1994 937 87%
137 13%
115 61%
75 39%
1995‒1999 718 89%
86 11%
125 56%
96 44%
2000‒2004 445 82%
97 18%
85 61%
55 39%
2005‒2006 212 79%
57 21%
44 60%
29 40%
2007‒2008 204 80%
50 20%
35 66%
18 34%
2009‒2010 257 66%
132 32%
45 65%
24 35%
2011‒2012 237 77%
70 23%
40 63%
24 37%
Total
3,010 82.7%
629 17.3%
490 60.4%
321 39.6%
Source: SNL Financial database

25
Table 4: Sum Statistics — Sample Excludes Assisted Mergers Data include all mergers that involved community bank targets during the period 2000‒2012.
Name N Mean Std. Min. Max. Acquirer_C Rating Acquirer_A Rating Acquirer_M Rating Acquirer_E Rating Acquirer_L Rating Acquirer_S Rating Acquirer_Composite CAMELS Target_C Rating Target_A Rating Target_M Rating Target_E Rating Target_L Rating Target_S Rating Target_Composite CAMELS For Acquirers < $1 Billion: Target’s Asset Size (in $1,000) Acquirer’s Asset Size (in $1,000) Change in SBL Volume (in $1,000) Change in SBL Ratio (% to Assets) For Acquirers $1‒10 Billion: Target’s Asset Size (in $1,000) Acquirer’s Asset Size (in $1,000) Change in SBL Volume (in $1,000) Change in SBL Ratio (% to Assets) For Acquirers > $10 Billion: Target’s Asset Size (in $1,000) Acquirer’s Asset Size (in $1,000) Change in SBL Volume (in $1,000) Change in SBL Ratio (% to Assets)
1509 1509 1509 1509 1509 1509 1509
1509 1509 1509 1509 1509 1506 1509
957 957 957 957
457 457 457 457
94 95 95 95
1.5792 1.5958 1.6243 1.6455 1.5878 1.5931 1.6163
1.9032 1.9192 2.1431 2.3545 1.7455 1.9283 2.0862
99,157 360,206 1,847.53
0.13
262,437 3,282,551 17,261.61
0.069
369,660 55,100,000 221,423.2
-0.016
0.5187 0.6080 0.5201 0.6273 0.5212 0.5291 0.5078
0.9277 1.0236 0.9437 1.0709 0.7812 0.6879 0.9252
101,047 257,465 1,076.56
0.70
209,239 2,328,735 6,675.70
0.22
242,913 85,500,000 140,204.3
0.13
1 1 1 1 1 1 1
1 1 1 1 1 1 1
4,588 14,977 -558.76
-1.02
11,433 1,004,059 -18,914.45
-0.48
34,727 10,000,000 14,463.89
-0.24
4 4 4 5 3 3 4
5 5 5 5 5 5 5
847,427 999,631 4,204.57
1.40
939,247 9,986,914 24,866.78
0.49
918,388 397,000,000
504,067.5 0.22

26
Table 5: Change in SBL After the Mergers — Relative to the Peer Nonmerged Banks (Using Diff-in-Diff Approach) The samples include all mergers that involved community bank targets during the period from 2000 to 2012 (assisted mergers are excluded). Supervisory CAMELS ratings have a value of 1 (best) to 5 (worst). Community bank acquirers (with assets up to $1 billion) are included in the analysis as the base case. The dependent variable is the Diff_Diff_SBLi (see Equations 1-5) for the definition; it is the increase in total SBL ($amount in column 1 and SBL ratio in column 2) from pre- to post-mergers relative to the control group. The change in SBL activities by the control group are measured based on the activities at similar nonmerged banks — being in the same asset size segment, the same CAMELS rating segment, and observed in the same period as the merger announcement. The significance levels are calculated with heteroscedasticity-consistent standard errors, where ***, **, and * represent significance at the 1%, 5%, and 10% levels, respectively.
Diff_Diff_SBLi = Diff_SBLi - Diff_Trend SBLi,j,k ------- Equation (5)
Independent Variables Dependent Variable is Diff_Diff_SBLi (see Equations 1‒5)
Increase in SBL $ Increase in SBL Ratio %
Intercept D_Large Acquirer_$1Bill to $10Bill D_Largest Acquirer_> $10Bill D_In-State Merger D_ Multiple Merger in 1 Year D_Acquirer_Composite CAMELS_2 D_Acquirer_Composite CAMELS_3 D_Acquirer_CompositeCAMELS_4 D_Target_Composite CAMELS_2 D_Target_Composite CAMELS_3 D_Target_Composite CAMELS_4 D_Target_Composite CAMELS_5
11,863.99 (19446.21) -7,759.81
(14179.72) 107,481.4***
(27080.66) -15,621.31 (14527.9) 6,017.73
(15896.04) 10,096.88 (12272.5) 8,398.86
(74190.43) -27,159.96 (163709.7) -7,039.93
(14464.23) -13,128.37 (20298.96) -34,155.2 (28313.5)
-21,047.12 (37354.11)
0.00075 (0.0028) 0.0022
(0.0020) 0.0060
(0.0039) -0.0013 (0.0021) -0.0029 (0.0023)
-0.0045** (0.0018) -0.0138 (0.0107) -0.0117 (0.0236) -0.0040* (0.0021) -0.0047 (0.0029)
-0.0133*** (0.0041)
-0.0108** (0.0054)
R-Square Adjusted R-Square Observation Number (N)
1.94% 1.22% 1509
2.08% 1.36% 1509

27
1.2
1.4
1.6
1.8
2
2.2
2.4
2.6
2.8
3
Figure 1.1: Capital Adequacy (C) Rating Targets vs. Acquirers
for Mergers in 2000‒2012
Acquirer
Target
Combined Firm (+ 1 Yr)
1
1.5
2
2.5
3
3.5
Figure 1.2: Asset Quality (A) Rating Targets vs. Acquirers
for Mergers in 2000‒2012
Acquirer
Target
Combined Firm (+ 1 Yr)
1.4
1.6
1.8
2
2.2
2.4
2.6
2.8
3
Figure 1.3: Management Quality (M) Rating Targets vs. Acquirers
for Mergers in 2000‒2012
AcquirerTargetCombined Firm (+ 1 Yr)
1
1.5
2
2.5
3
3.5
Figure 1.4: Earnings (E) Rating Targets vs. Acquirers
for Mergers in 2000‒2012
AcquirerTargetCombined Firm (+ 1 Yr)
1.2
1.4
1.6
1.8
2
2.2
2.4
Figure 1.5: Liquidity (L) Rating Targets vs. Acquirers
for Mergers in 2000‒2012
Acquirer
Target
Combined Firm (+ 1 Yr)
1.2
1.4
1.6
1.8
2
2.2
2.4
2.6
2.8
Figure 1.6: The Market Sensitivity (S) Rating Targets vs. Acquirers
for Mergers in 2000‒2012
Acquirer
Target
Combined Firm (+ 1 Yr)

28
Sources for Figures 1.1 to 1.9: Mergers data are from the SNL Financial database, and supervisory rating data are from the Federal Reserve National Examination Database (NED) and National Information Center (NIC). Assisted mergers are not included.
1
1.5
2
2.5
3
3.5
Figure 1.7: The Composite CAMELS Rating Targets vs. Acquirers
for Mergers in 2000‒2012
Acquirer
Target
Combined Firm (+ 1 Yr)
0
50
100
150
200
250
Figure 1.8: Composite CAMELS Ratings of Community Bank Targets
by Merger Announcement Year
Composite Rating 5Composite Rating 4Composite Rating 3Composite Rating 2Composite Rating 1
0
20
40
60
80
100
120
140
160
180
200
Figure 1.9 Composite CAMELS Rating of Acquirers of Community Banks
by Merger Announcement Year Composite Rating 4
Composite Rating 3
Composite Rating 2
Composite Rating 1

29
Sources for Figures 2.1 to 2.6: Mergers data and financial information as of merger announcement date are from the SNL Financial database. Assisted mergers are not included in the sample.
-15
-10
-5
0
5
10
15
20
Figure 2.1: ROE For Targets vs. Acquirers Mergers Between Community Banks
Target
Acquirer
50
60
70
80
90
100
110
Figure 2.2: Inefficiency Ratio for Targets vs. Acquirers Mergers Between Community Banks
Target
Acquirer
0
0.5
1
1.5
2
2.5
3
3.5
4
4.5
5
Figure 2.3: NPA Ratio for Targets vs. Acquirers Mergers Between Community Banks
Target
Acquirer
50
100
150
200
250
300
350
400
Figure 2.4: Loan-Loss Reserve Ratio — Targets vs. Acquirers; Mergers Between Community Banks
TargetAcquirer
8
8.5
9
9.5
10
10.5
11
11.5
12
12.5
Figure 2.5: Capital Asset Ratio for Targets. vs. Acquirers; Mergers Between Community Banks
TargetAcquirer
0
50
100
150
200
250
Merger Announcement Year
Figure 2.6: Number of Community Bank Targets by Asset Size Group
Total Assets>$500M
$100M<Total Assets<$500M
Total Assets <$100M

30
Source: Call Report Data Source: Call Report Data Note: The plot in Figure 3.1 is for small business loans with origination amount being less than $100,000. The plot in Figure 3.2 is for small business loans with origination amount being less than $1 million. Source: Call Report data Note: SBL is defined as loans with origination amount of $1 million or less.
0%
10%
20%
30%
40%
50%
60%
70%
80%
90%
100%
Year
Figure 3.1: Market Share of $ Loans <$1 Mil by Bank Size Group (1997‒2014)
Total Assets> $50B
10B<TotalAssets<50B
1B<TotalAssets<10B
CommunityBank
0
0.02
0.04
0.06
0.08
0.1
0.12
0.14
SBL-
to-A
sset
Rat
io
Figure 3.3: SBL-to-Total Asset Ratio by Bank Size Group (1997‒2014) — All Commercial Banks
Community Bank1B<Total Assets<10B10B<Total Assets<50BTotal Assets > $50B
0%
10%
20%
30%
40%
50%
60%
70%
80%
90%
100%
Year
Figure 3.2: Market Share of Loans<$100K By Bank Size Group (Period 1997‒2014)
TotalAssets >$50B10B<TotalAssets<50B
1B<TotalAssets<10B
Community Bank
31
Sources: Call Report Data and SNL Financial database
0
50
100
150
200
250
300
350
400
Volu
me
of S
BL ($
B)
Year
Figure 4: SBL Volume by Bank Size Group
Total Assets > $50B10B<Total Assets<50B1B<Total Assets<10BCommunity Bank
0
1
2
3
4
5
6
Smal
l Bus
ines
s Len
ding
($10
0,00
0,00
0s)
Merger Announcement Year
Figure 3.4: $ Amount of SBL as of Merger Announcement Year: Targets vs. Acquirers
Accquirer
Target
0.04
0.05
0.06
0.07
0.08
0.09
0.1
0.11
0.12
SBL-
to-T
otal
-Ass
ets
Ratio
Merger Announcement Year
Figure 3.5: Ratio of SBL-to-Assets as of Merger Announcement Year: Targets vs. Acquirers
Accquirer
Target
-200
0
200
400
600
800
1000
Chan
ge in
SBL
($M
)
Merger Announcement Year
Figure 3.6A: $ Change in SBL — Combined Targets and Acquirers vs. 1 Year After Mergers
by Acquirer Size
Community Bank
$1B<Total Assets<$10B
Total Assets > $10B
-0.015
-0.01
-0.005
0
0.005
0.01
0.015
Chan
ge in
SBL
-to-
Tota
l Ass
ets
Ratio
Merger Announcement Year
Figure 3.7: $ Change in SBL-to-Assets Ratio Between Combined Targets and Acquirers vs. 1 Year Later: By Acquirer Size
Community Bank
$1B<Total Assets<$10B
Total Assets > $10B
-30
-20
-10
0
10
20
30
40
Chan
ge in
SBL
($M
)
Merger Announcement Year
Figure 3.6B: $ Change in SBL — Combined Target and Acquirers vs. 1 Year After Mergers (Zoom)
Community Bank$1B<Total Assets<$10B

32
References
Agarwal, Sumit, Divid Lucca, Amit Seru, and Francesco Trebbi (2014). “Inconsistent Regulators: Evidence from Banking,” Quarterly Journal of Economics (forthcoming). Avery, Robert, and Katherine Samolyk (2004). “Bank Consolidation and Small Business Lending: The Role of Community Banks,” Journal of Financial Services Research, 25(2), 291‒326. Beccalli, Elena, and Pascal Frantz (2013). “The Determinants of Mergers and Acquisitions in Banking,” Journal of Financial Services Research 43(3), 265‒291. Berger, Allen (2014). “Small Business Lending by Banks: Lending Technologies and the Effects of Banking Industry Consolidation and Technological Change,” Oxford Handbook of Banking, Chapter 12, forthcoming. Berger, Allen, Geraldo Cerqueiro, and Maria Fabiana Penas (2014). “Market Size Structure and Small Business Lending: Are Crisis Times Different from Normal Times?” Review of Finance, 1‒31. Berger, Allen, William Goulding, and Tara Rice (2014). “Do Small Businesses Still Prefer Community Banks?” Journal of Banking and Finance 44, 264‒278. Berger, Allen, Adrian Cowan, and Scott Frame (2011). “The Surprising Use of Credit Scoring in Small Business Lending by Community Banks and the Attendant Effects on Credit Availability, Risk, and Profitability,” Journal of Financial Services Research 39, 1‒17. Berger, Allen, and Gregory Udell (2006). “A More Complete Conceptual Framework for SME Finance,” Journal of Banking and Finance 30, 2945‒2966. Berger, Allen, Joseph Scalise, Anthony Saunders, and Gregory Udell (1998). “The Effects of Bank Mergers and Acquisitions on Small Business Lending” Journal of Financial Economics, 50(2), 187‒229. Berger, Allen, Seth Bonime, Lawrence Goldberg, and Lawrence White (2004). “The Dynamics of Market Entry: The Effects of Mergers and Acquisitions on Entry in the Banking Industry,” Journal of Business 77 (October), 797‒834. Berger, Allen, Scott Frame, and Nathan Miller (2005). “Credit Scoring and the Availability, Price, and Risk of Small Business Credit,” Journal of Money, Credit, and Banking 37, 191‒222. Brewer, Elijah, and Julapa Jagtiani (2013). “How Much Did Banks Pay to Become Too-Big-To-Fail and to Become Systemically Important?” Journal of Financial Services Research, 43 (2013), 1‒35.

33
Carpenter, Robert, and Breck Robinson (2014). “Leaving So Soon? Exiting the Small Business Lending Fund,” Federal Reserve Bank of Richmond, work-in-progress, presented at the Southern Finance Association conference, November. Conference of State Bank Supervisors (2014). “2013 Annual Report of the Conference of State Bank Supervisors,” May. Cooper, Elizabeth, and Todd Vermilyea (2012). “The Impact of Management Quality on Merger Outcomes,” Federal Reserve Board, unpublished manuscript. DeYoung, Robert, Lawrence Goldberg, and Lawrence White (1999). “Youth, Adolescence, and Maturity of Banks: Credit Availability to Small Business in an Era of Banking Consolidation,” Journal of Banking and Finance 23, 463‒492. Elyasiani, Elyas, and Lawrence Goldberg (2004). “Relationship Lending: A Survey of the Literature,” Journal of Economics and Business 56, 315‒330. Federal Deposit Insurance Corporation (2012). “FDIC Community Banking Study,” FDIC Community Banking Study, Chapter 1: Defining the Community Bank, December. Gilbert, Alton, Andrew Meyer, and James Fuchs (2014). “The Future of Community Banks: Lessons From the Recovery of Problem Banks,” Working Paper, Federal Reserve Bank of St. Louis. Goldberg, Lawrence, and Lawrence White (1998). “De Novo Banks and Lending to Small Business: An Empirical Analysis,” Journal of Banking and Finance 22, 851‒867. Hughes, Joseph, Julapa Jagtiani, and Loretta Mester (2015). “Does Scale Define the Winners in Community Banking?” Working Paper, International Atlantic Economic Society Conference (Boston), October. Jagtiani, Julapa (2008). “Understanding the Effects of the Merger Boom on Community Banks,” Federal Reserve Bank of Kansas City: Economic Review, Second Quarter, 29‒48. Jagtiani, Julapa, and Cathy Lemieux (2015). “Small Business Lending: Challenges and Opportunities for Community Banks – Before, During, and After the Financial Crisis,” Working Paper, Federal Reserve System Community Banking Conference (St. Louis), September. Kowalik, Michal (2014). “Can Small Banks Survive Competition from Large Banks?” Working Paper, Federal Reserve Bank of Boston.