working paper #9 march 2019 - europa
TRANSCRIPT

Food Reserves
Working Paper #9
March 2019
The Role of Food Reserves in Enhancing
Food Security:
The Experience of Senegal
Dr. Ibrahima Hathie
Study funded by the European Commission,
Directorate-General for Development and Cooperation, Unit C1

DAI Europe Ltd. 3rd Floor Block C Tel: +44 (0) 1442 202 400
Westside, Fax: +44 (0) 207 420 8601
London Road, www.dai-europe.com
Apsley
HP3 9TD
United Kingdom
About this working paper
This working paper is one of the products of a study conducted by DAI at the request of the European Commission as part of the advisory
service ASiST managed by the unit in charge of rural development, food security and nutrition (C1) within the Directorate General for
International Cooperation and Development (DEVCO).
The study has aimed at clarifying the potential role of food reserves in enhancing food and nutrition security in developing countries, and
at making recommendations on how to use food reserves (in complement to other tools), taking into account the specificities on the
context and the constraints of World Trade Organisation (WTO) disciplines.
The study was conducted based on i) an extensive review of the existing literature (both theoretical and empirical) and ii) 10 case studies
analysing national or regional experiences in Africa, Asia and South America.
All the products of the study (including other working papers, a compilation of case study summaries, and a synthesis report) are available
at: https://europa.eu/capacity4dev/hunger-foodsecurity-nutrition/discussions/how-can-food-reserves-best-enhance-food-and-nutrition-
security-developing-countries.
Acknowledgements
Franck Galtier (CIRAD) coordinated the overall study. This working paper was written by Dr. Ibrahima Hathie (Initiative Prospective Agricole
et Rurale). It benefited from the review of Franck Galtier, Ralph Cummings (consultant, ex IFPRI), Kalanidhi Subbarao (consultant, ex World
Bank), and Steve Wiggins (Overseas Development Institute).
Disclaimer
The authors accept sole responsibility for this report. The contents of this publication do not necessarily reflect the official position or
opinion of the European Commission. Neither the European Commission nor any person acting on behalf of the Commission is responsible
for the use that might be made of the following information.
iv
Table of Contents
List of Abbreviations and Acronyms ....................................................................................................... v
Introduction .................................................................................................................................... 1
2.1 Food supply and demand .................................................................................................... 2
2.2 Food and nutrition security in a context of poverty ........................................................... 5
Government intervention for food security ................................................................................. 10
3.1 Interventions for price stabilisation .................................................................................. 10
3.2 Senegalese rice self-sufficiency policy .............................................................................. 13
3.3 Food reserve and government intervention ..................................................................... 16
3.4 Food reserve and government intervention ..................................................................... 20
3.5 Governance of the food security system .......................................................................... 23
Conclusions ................................................................................................................................... 24
References ............................................................................................................................................ 25
List of Tables
Table 1: Cereal imports, 2010-2014 4
Table 2: Poverty level by region 7
Table 3: Changes in regulations on imported rice 12
Table 4: Forecasted Acreage and Rice Production by 2017 13
Table 5: Domestic production of rice and demand coverage (2004-2015) 14
Table 6: Level of funding allocated for the food security stock 19
Table 7: CSA's storage capacities in Senegal 19
Table 8: Number of National Cash transfer programme beneficiaries 20
Table 9: Summary of food distribution and cash by region (from 28 April to 31 October 2012) 23
List of Figures
Figure 1: Evolution of cereal production, 1960-2013 3
Figure 2: Cereal production per decade 3
Figure 3: Share of crops per decade over time 4
Figure 4: Percent consumption of food per capita (kcal) in selected countries 5
Figure 5: Percentage of children under 5 affected by wasting, are stunted and/or are underweight
6
Figure 6: Prevalence of undernourishment and food inadequacy 6
Figure 7: Level of food security 8
Figure 8: Prevalence of food insecurity by district 8
Figure 9: Yearly Evolution of World Rice Prices - OSIRIZ (2004-2015) 11
Figure 10: Area planted and rice yields in Senegal (2004/05 – 2015/16) 13
Figure 11: Rice imports in volume and value terms (2002-2017) 15
Figure 12: Proportion of imports by origin (1996-2014) 16
v
List of Abbreviations and Acronyms
ANSD Agence Nationale de la Statistique et de la Démographie CLM Cellule de Lutte contre la Malnutrition CNSA Conseil National de la Sécurité Alimentaire CSA Commissariat à la Sécurité Alimentaire CPSP Caisse de péréquation et de stabilisation des prix (CPSP) DAPSA Direction de l’Analyse, de la Prévision et des Statistiques agricoles DGPSN Délégation Générale à la Protection Sociale et à la Solidarité Nationale ESPS Enquête Santé et Protection Sociale FAO Food and Agriculture Organisation GOANA Grande Offensive Agricole pour la Nourriture et l’Abondance MAER Ministère de l’Agriculture et de l’Equipement Rural MARE Ministry of Agriculture and Rural Equipment NACE Note d’Analyse du Commerce Extérieur NGO Non-Governmental Organisation ONCAD Office National de Commercialisation et d’assistance au développement OSIRIZ Rapport mensuel sur le marché mondial du riz PAM Programme Alimentaire Mondial RGPHAE Recensement Général de la Population et de l’Habitat, de l’Agriculture et de
l’Elevage SONADIS Société Nationale de Distribution SRDR Service Régional de Développement Rural SRV Senegal River Valley UNDP United Nations Development Programme VCB Village Cereal Banks WFP World Food Programme

1
Introduction
The global crisis of food prices in 2007/2008 had a particular resonance in West Africa, culminating in
violent riots in major capitals of the region. In Senegal, these events were a wake-up call for
policymakers who seemed surprised by the extent of the vulnerability of the country's food security.
Within days, rice prices soared and the news from Southeast Asia was hardly reassuring. Massive
imports to the Philippines to guard against possible shortages, export restrictions imposed by India,
and the residual nature of the global rice market constituted serious threats of disruption to rice
supply in the country.
For decades, successive governments in Senegal often pursued conflicting food security policy
objectives: to provide cheap food to urban consumers while guaranteeing high producer prices to
farmers. During the agricultural programme of the 1960s and the 1970s, stabilisation policies were
crafted around peanut production and marketing. Input provision, mechanisation strategies, and
marketing of produce all evolved around peanuts. Domestic cereals (millet, sorghum, and maize)
benefitted little from this policy. At the same time, imports of cheap food (rice and wheat) destined
to urban dwellers was an essential part of the food security strategy.
The recurrent climate shocks from the 1970s disrupted the seemingly stable food security state
prevalent in rural areas, where most rural households produced their own cereals (millet, sorghum,
and maize) for auto-consumption and sold the surpluses in weekly markets and secondary cities. In
general, food deficit households would rely on cash crops to fill the gap. Provision of food aid during
the lean season would alleviate the situation of the most vulnerable households. In this context of
chronic food deficits and recurrent shocks, the use of food reserves is of paramount importance. Since
the droughts of the 1970s, the various agricultural policies have always incorporated elements related
to the constitution of food reserves to meet the needs of vulnerable groups.
Rice has gained more space in cities and even in rural areas due to recurrent droughts and food
shortages in the rural area on the one hand, and urbanisation and shifts in consumption patterns on
the other. Government food security options relying more on availability and access (i.e. cheap
imports of food products), heightened this imbalance and reinforced Senegal’s extraversion in terms
of food consumption and supply.
The 2007/2008 price crisis was an awakening for policymakers. Their response focused primarily on
price stabilisation, with limited success. Then they quickly moved towards longer term perspectives
with the launch of the Great Agricultural Offensive for Food and Abundance (GOANA), which
embedded a rice self-sufficiency programme.
The rest of this paper is organised as follows. The following section is a brief overview of the
Senegalese food economy with a focus on two subthemes: food supply and demand, and food and
nutrition security. Section 3 analyses government and other partners’ interventions in terms of food
reserves and alternative tools. Section 4 analyses the impact of interventions. The final section
presents the conclusions of the study.
2
The Senegalese Food Economy
Senegal is in West Africa, covers an area of 196,712 km2, and has a population of 13,508,715 (RGPHAE,
2013). Considered a least developed country, Senegal is ranked 170 out of 188 countries according to
the Human Development Index of the United Nations Development Programme (UNDP, 2015). The
country belongs to the Sahel zone and as such is prone to recurrent climatic challenges, structural
deficits in food production, and price volatility. The agricultural sector employs nearly 60% of the
active population but contributed only 11.2% to GDP in 2013, a sign of the sector’s low productivity
(ANSD, 2016).1
To cope with these constraints, the Plan Senegal Emergent (PSE) has set a vision of “an emerging
Senegal in 2035 with an inclusive society and the rule of law”. This national strategy for economic and
social development, initiated in 2014, focuses on wealth and job creation, governance strengthening,
and the development of key strategic sectors that have significant impacts on improving the well-
being, particularly through the protection of vulnerable groups and ensuring access to essential
services.
The Programme of Accelerated Cadence of Senegalese Agriculture (PRACAS), the agricultural
component of Plan Senegal Emergent (PSE) aims to build competitive, diversified and sustainable
agriculture. This vision focuses on the emergence of an agriculture capable of: (i) feeding people
sustainably on an endogenous basis; (ii) taking advantage of the benefits of international trade; (iii)
securing and increasing rural incomes; (iv) providing agricultural and non-farm employment; (v)
managing natural resources sustainably; and (vi) improving the nutritional status of the population.
PRACAS aims, in a very short time, to achieve food and nutrition security and develop agricultural
exports, while building a competitive, diversified and sustainable agricultural sector. Specifically, it
seeks self-sufficiency in rice and onion, optimisation of groundnut sector performance, and
development of the off-season fruit and vegetable sectors.
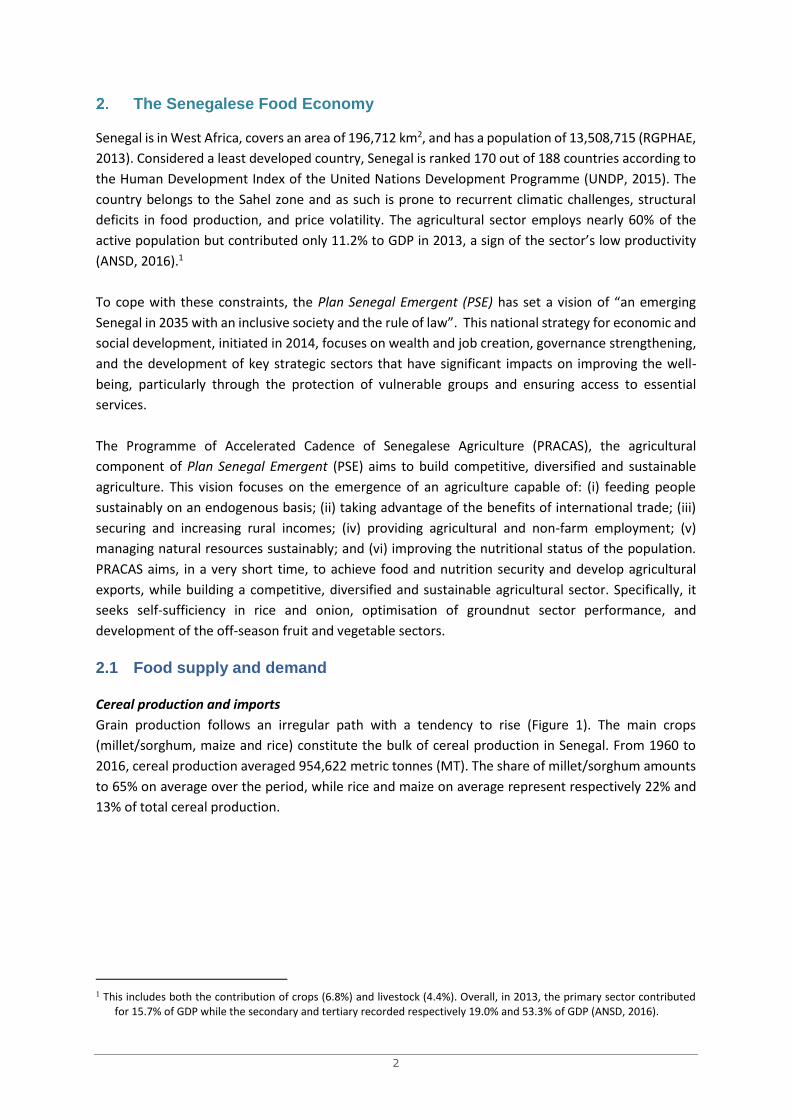
2.1 Food supply and demand
Cereal production and imports
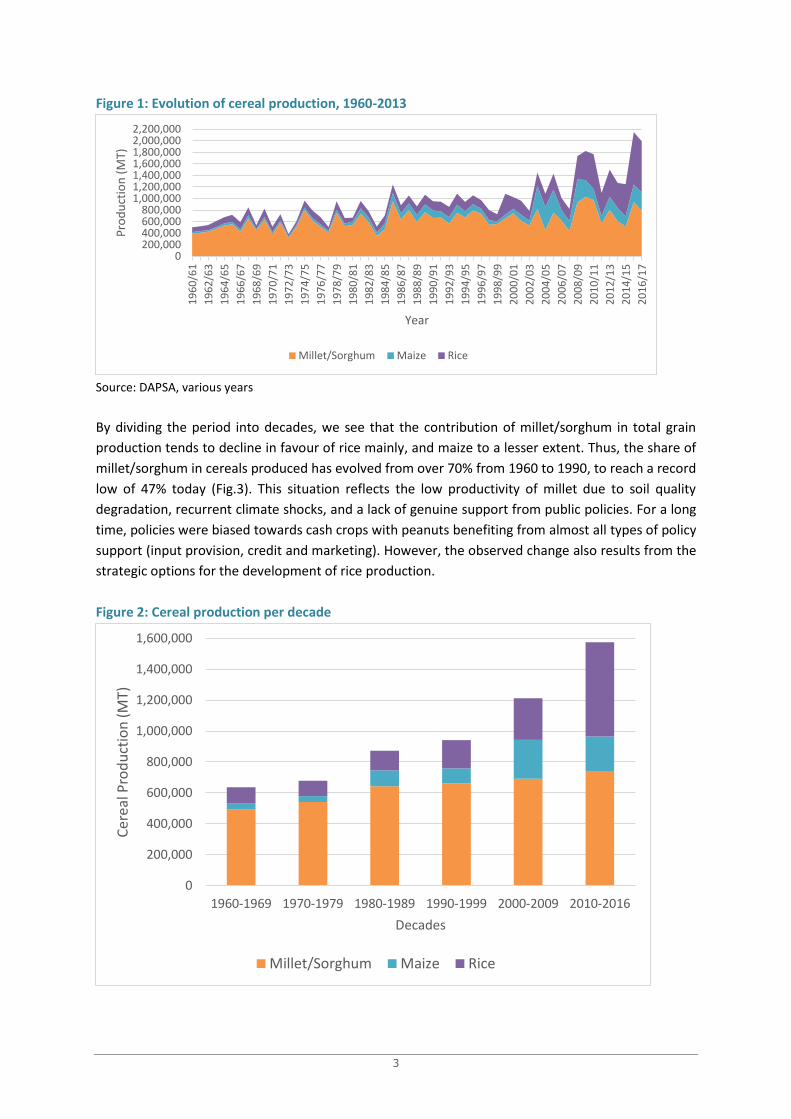
Grain production follows an irregular path with a tendency to rise (Figure 1). The main crops
(millet/sorghum, maize and rice) constitute the bulk of cereal production in Senegal. From 1960 to
2016, cereal production averaged 954,622 metric tonnes (MT). The share of millet/sorghum amounts
to 65% on average over the period, while rice and maize on average represent respectively 22% and
13% of total cereal production.
1 This includes both the contribution of crops (6.8%) and livestock (4.4%). Overall, in 2013, the primary sector contributed
for 15.7% of GDP while the secondary and tertiary recorded respectively 19.0% and 53.3% of GDP (ANSD, 2016).
3
Figure 1: Evolution of cereal production, 1960-2013
Source: DAPSA, various years
By dividing the period into decades, we see that the contribution of millet/sorghum in total grain
production tends to decline in favour of rice mainly, and maize to a lesser extent. Thus, the share of
millet/sorghum in cereals produced has evolved from over 70% from 1960 to 1990, to reach a record
low of 47% today (Fig.3). This situation reflects the low productivity of millet due to soil quality
degradation, recurrent climate shocks, and a lack of genuine support from public policies. For a long
time, policies were biased towards cash crops with peanuts benefiting from almost all types of policy
support (input provision, credit and marketing). However, the observed change also results from the
strategic options for the development of rice production.
Figure 2: Cereal production per decade
0200,000400,000600,000800,000
1,000,0001,200,0001,400,0001,600,0001,800,0002,000,0002,200,000
19
60
/61
19
62
/63
19
64
/65
19
66
/67
19
68
/69
19
70
/71
19
72
/73
19
74
/75
19
76
/77
19
78
/79
19
80
/81
19
82
/83
19
84
/85
19
86
/87
19
88
/89
19
90
/91
19
92
/93
19
94
/95
19
96
/97
19
98
/99
20
00
/01
20
02
/03
20
04
/05
20
06
/07
20
08
/09
20
10
/11
20
12
/13
20
14
/15
20
16
/17
Pro
du
ctio
n (
MT)
Year
Millet/Sorghum Maize Rice
0
200,000
400,000
600,000
800,000
1,000,000
1,200,000
1,400,000
1,600,000
1960-1969 1970-1979 1980-1989 1990-1999 2000-2009 2010-2016
Cer
eal P
rod
uct
ion
(M
T)
Decades
Millet/Sorghum Maize Rice

4
Figure 3: Share of crops per decade over time
Source: DAPSA, various years
Senegal, like most other countries of the Sahel, faces a relatively difficult food situation. Weak
domestic cereal production is offset by grain imports. The gap between domestic production and the
growing needs of the population has been widening over the years. Table 1 below shows the
importance of grain imports. Between 2010 and 2012 for instance, cereal imports averaged 1,366,956
MT per year against average annual production of 1,454,082 MT that barely covers 52% of the
country’s needs.
Table 1: Cereal imports, 2010-2014
2010 2011 2012 2013 2014
Tons 1,196,322 1,323,980 1,580,565 1,552,564 1,706,680
millions FCFA 207,022 270,491 327,037 302,484 290,737
Source: ANSD, NACE, 2014
Characteristics of demand and consumption patterns
Senegal has food traditions, both urban and rural, based on consumption of cereals (rice, millet, maize,
and sorghum) as staple foods, constituting 40% of the household food budget, along with other
products in variable proportions depending on the available crops, area (urban or rural), and social
status (rich or poor) of families or individuals.
Senegal's food situation has deteriorated steadily since the 1970s, and this phenomenon is
accelerating due to urbanisation and high population growth, which increases cereal consumption, in
a context where cereal production has increased only slightly. As a result, cereal imports are
increasing, reaching 1,706,680 MT in 2014 (Table 1). The result is serious food dependence,
permanent food insecurity, and frequent food crises for the most vulnerable groups.
78% 80%74% 70%
57%47%
6% 6%12%
10%
21%
14%
17% 15% 15% 19% 22%
39%
0%
10%
20%
30%
40%
50%
60%
70%
80%
90%
100%
1960-1969 1970-1979 1980-1989 1990-1999 2000-2009 2010-2016Shar
e o
f cr
op
in c
erea
l pro
du
ctio
n (
%)
Decades
Millet/Sorghum Maize Rice

5
There is increasing rice and millet substitution in the Senegalese diet as urban consumers prefer rice.
Consumption of wheat flour has also increased. Unfortunately, over 70% of the consumed rice and
100% of the wheat are imported. In contrast, millet, sorghum and maize are mostly produced within
the country. This preference for rice and wheat is related to urbanisation that leads to changes in
eating habits. The share of these two imported products has increased in household consumption,
making food imports per capita go up steadily.
As stated above, rice, millet/sorghum, wheat, and maize are the foundations of the Senegalese diet.
Senegalese derive 60% of their calories from grain consumption. Today, rice occupies the first place,
meeting a third of the population’s calorie needs. A comparison with Mali and Madagascar (two large
rice consumers) shows the special situation of Senegal (Figure 4). Rice provides 48% of calories to
Malagasy, and it is mainly produced locally (43%). As for Mali, not only other cereals (millet / sorghum,
maize) occupy more space, domestic rice provides an important contribution, relegating the caloric
intake of rice imports to only 3%.
Figure 4: Percent consumption of food per capita (kcal) in selected countries
Source: David-Benz and Lançon, 2013.
2.2 Food and nutrition security in a context of poverty
Despite efforts made over years to ensure food self-sufficiency, Senegal is a food-deficit country.
Coverage rates of its cereal needs through domestic production has varied between 30% and 65%
over the past 10 years. In 2013/14, for example, national cereal availability estimated at 1,079,617 MT
covered about 5 months, which represent 45% of needs estimated at 2,381,616 MT. The gap was
covered through imports of rice (750,000 MT), wheat (350,000 MT), corn (80,000 MT) and sorghum
(25,000 MT). Food aid amounted to 24,703 tons (ANSD, 2016, p.175).
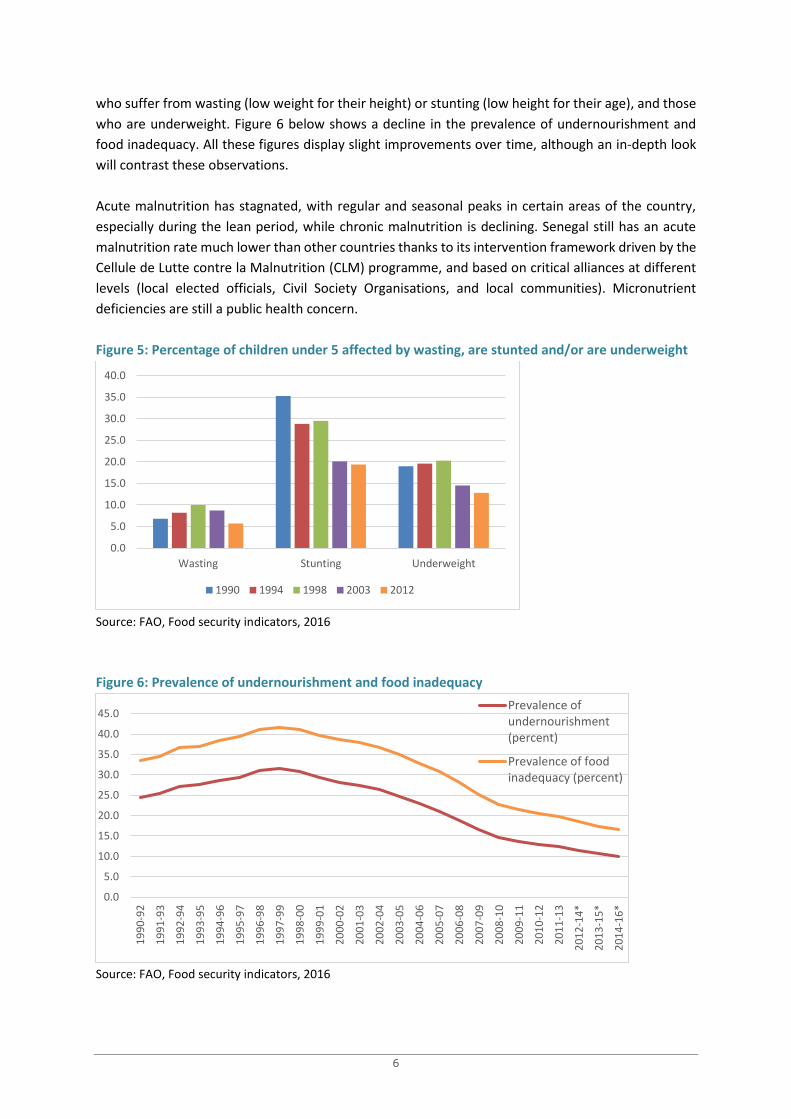
On the nutrition side, Senegal has shown a significant improvement in the nutritional status of its
population in recent years. The most striking example is represented by the reduction of stunting
among children under 5, which was around 30% in the 1990s and was at 19% in 2012, the second
lowest in Sub-Saharan Africa. Figure 5 below shows the proportion of children under the age of five
21%3% 5%
12%
17%
43%
28% 51%7%
40%29%
45%
0%
20%
40%
60%
80%
100%
Senegal Mali Madagascar
Per
cen
t C
on
sum
pti
on
per
cap
ita
(KC
AL)
Countries
Imported rice Local rice Other cereals Other food
6
who suffer from wasting (low weight for their height) or stunting (low height for their age), and those
who are underweight. Figure 6 below shows a decline in the prevalence of undernourishment and
food inadequacy. All these figures display slight improvements over time, although an in-depth look
will contrast these observations.
Acute malnutrition has stagnated, with regular and seasonal peaks in certain areas of the country,
especially during the lean period, while chronic malnutrition is declining. Senegal still has an acute
malnutrition rate much lower than other countries thanks to its intervention framework driven by the
Cellule de Lutte contre la Malnutrition (CLM) programme, and based on critical alliances at different
levels (local elected officials, Civil Society Organisations, and local communities). Micronutrient
deficiencies are still a public health concern.
Figure 5: Percentage of children under 5 affected by wasting, are stunted and/or are underweight
Source: FAO, Food security indicators, 2016
Figure 6: Prevalence of undernourishment and food inadequacy
Source: FAO, Food security indicators, 2016
0.0
5.0
10.0
15.0
20.0
25.0
30.0
35.0
40.0
Wasting Stunting Underweight
1990 1994 1998 2003 2012
0.0
5.0
10.0
15.0
20.0
25.0
30.0
35.0
40.0
45.0
19
90
-92
19
91
-93
19
92
-94
19
93
-95
19
94
-96
19
95
-97
19
96
-98
19
97
-99
19
98
-00
19
99
-01
20
00
-02
20
01
-03
20
02
-04
20
03
-05
20
04
-06
20
05
-07
20
06
-08
20
07
-09
20
08
-10
20
09
-11
20
10
-12
20
11
-13
20
12
-14
*
20
13
-15
*
20
14
-16
*
Prevalence ofundernourishment(percent)
Prevalence of foodinadequacy (percent)
7
The following subsections will respectively address the incidence of poverty, chronic food insecurity,
and the situation of malnutrition.
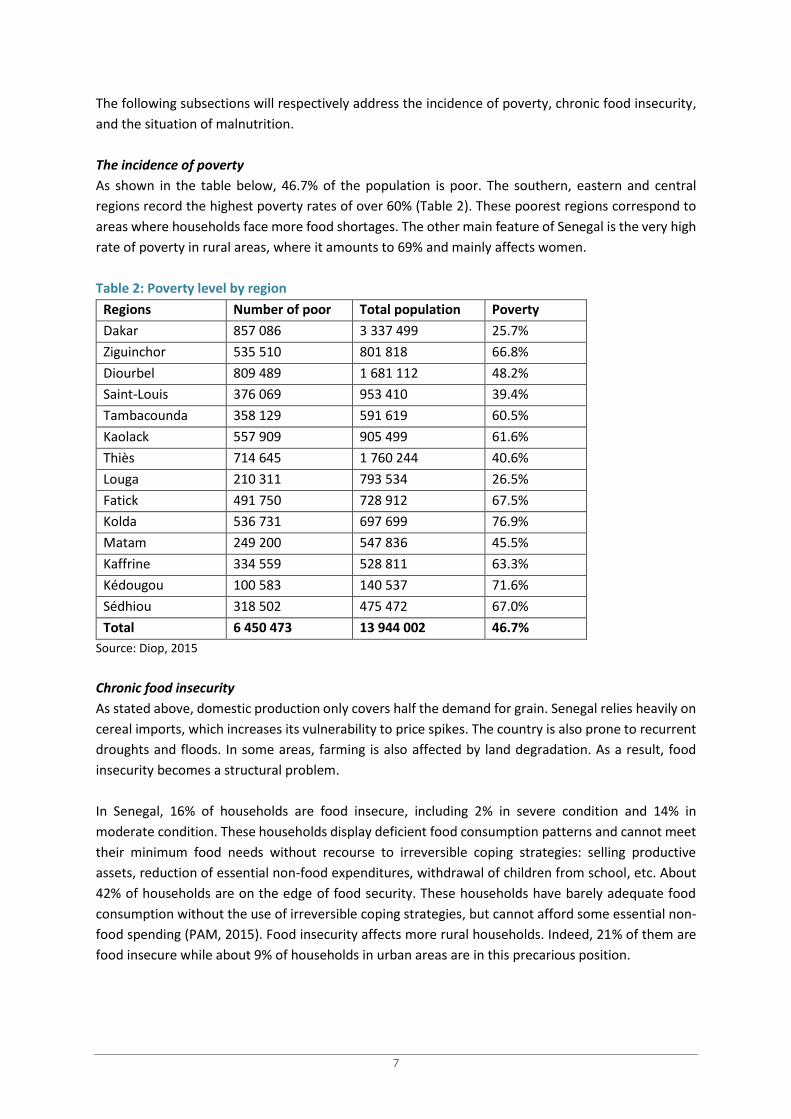
The incidence of poverty
As shown in the table below, 46.7% of the population is poor. The southern, eastern and central
regions record the highest poverty rates of over 60% (Table 2). These poorest regions correspond to
areas where households face more food shortages. The other main feature of Senegal is the very high
rate of poverty in rural areas, where it amounts to 69% and mainly affects women.
Table 2: Poverty level by region
Regions Number of poor Total population Poverty
Dakar 857 086 3 337 499 25.7%
Ziguinchor 535 510 801 818 66.8%
Diourbel 809 489 1 681 112 48.2%
Saint-Louis 376 069 953 410 39.4%
Tambacounda 358 129 591 619 60.5%
Kaolack 557 909 905 499 61.6%
Thiès 714 645 1 760 244 40.6%
Louga 210 311 793 534 26.5%
Fatick 491 750 728 912 67.5%
Kolda 536 731 697 699 76.9%
Matam 249 200 547 836 45.5%
Kaffrine 334 559 528 811 63.3%
Kédougou 100 583 140 537 71.6%
Sédhiou 318 502 475 472 67.0%
Total 6 450 473 13 944 002 46.7%
Source: Diop, 2015
Chronic food insecurity
As stated above, domestic production only covers half the demand for grain. Senegal relies heavily on
cereal imports, which increases its vulnerability to price spikes. The country is also prone to recurrent
droughts and floods. In some areas, farming is also affected by land degradation. As a result, food
insecurity becomes a structural problem.
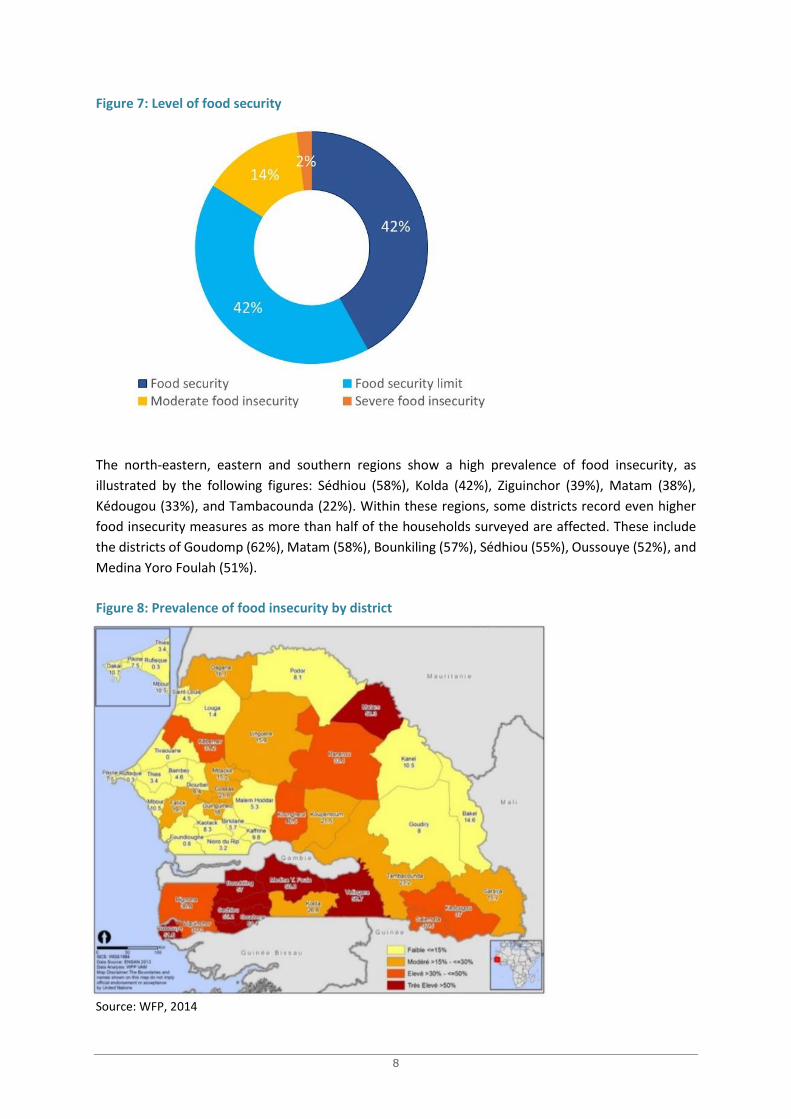
In Senegal, 16% of households are food insecure, including 2% in severe condition and 14% in
moderate condition. These households display deficient food consumption patterns and cannot meet
their minimum food needs without recourse to irreversible coping strategies: selling productive
assets, reduction of essential non-food expenditures, withdrawal of children from school, etc. About
42% of households are on the edge of food security. These households have barely adequate food
consumption without the use of irreversible coping strategies, but cannot afford some essential non-
food spending (PAM, 2015). Food insecurity affects more rural households. Indeed, 21% of them are
food insecure while about 9% of households in urban areas are in this precarious position.
8
The north-eastern, eastern and southern regions show a high prevalence of food insecurity, as
illustrated by the following figures: Sédhiou (58%), Kolda (42%), Ziguinchor (39%), Matam (38%),
Kédougou (33%), and Tambacounda (22%). Within these regions, some districts record even higher
food insecurity measures as more than half of the households surveyed are affected. These include
the districts of Goudomp (62%), Matam (58%), Bounkiling (57%), Sédhiou (55%), Oussouye (52%), and
Medina Yoro Foulah (51%).
Source: WFP, 2014
Figure 7: Level of food security
Figure 8: Prevalence of food insecurity by district

9
Food insecurity results from several factors:
1. Low agricultural productivity resulting from low water control, degradation of productive
resources, and under-equipment.
2. Strong dependence on markets: 89% of households primarily source their food from
purchase, and about 80% of the food they eat is purchased.
3. Pervasive household poverty – according to the Enquête de Suivi de la Pauvreté au
Sénégal (ESPS) survey (2011), almost half of the population (46.7%) lived below the
poverty line. Poverty rates above 60% were recorded in the Eastern, Southern and central
regions: Kolda (76.6%), Kédougou (71.3%), Sédhiou (68 3%), Ziguinchor (66.8%), Fatick
(67%), Kaffrine (63.8%), Tambacounda (62.5%) and Kaolack (61.7%).
4. High food prices contributing to increased food insecurity and vulnerability. In 2013,
except for the price of imported ordinary rice that was regulated through price control,
grain prices were higher than the average of the past five years.
5. Finally, Senegal is exposed repeatedly to climatic shocks (droughts, floods) which increase
the vulnerability of households.
At the national level, food spending accounts for 46% of the household budget. This figure is higher
among rural households. Indeed, in rural areas, 51% of household expenditures go to food while in
urban areas, households spend about 41% of their budget on food. As expected, the share of
expenditure on food is higher among households located in the eastern and southern part of the
country: Tambacounda (64%), Kédougou (60%), Kolda (59%), Sédhiou (55%), Matam and Ziguinchor
Box 1. Senegal and its food security challenges
Senegal continues to cope with a food and nutrition crisis that particularly affects the North and
East regions. More than 2.4 million people are food insecure (17% of the population), of which
over 220,000 will be in crisis during the lean season 2016. It is expected that more than 407,500
children under 5 years will suffer from acute malnutrition in 2016, including 86,026 from severe
acute malnutrition. Climate shocks such as drought and delayed onset of the rainy season have
worsened the situation especially in the north, while in other areas floods have affected more than
60 000 people.
Indeed, it is estimated that more than 407,500 children under 5 years are at risk of acute
malnutrition among which more than 86 000 cases suffering from the severe form; 31% (28,645)
of these severe cases of acute malnutrition are found in the priority areas (regions of
Tambacounda and Matam and Podor). In addition, almost 74,000 pregnant and lactating women
will be at risk of acute malnutrition.
Source: Extract 2016 Response Plan
10
(52%), Kaolack (51%) and Fatick (50%). In Tambacounda, Kolda, and Kédougou, 23 to 27% of
households spend more than 75% of their budget on food.
Persistently high malnutrition levels
Malnutrition levels are high among children under five, and are a testimony of the precarious
nutritional situation of this age category. The global acute malnutrition rate is 9.1%, very close to the
WHO alert threshold of 10%. This rate is highest in the Matam region (18.8%), which contains three
districts exceeding the critical threshold of 15%. Acute malnutrition has risen in the last five years. In
contrast, chronic malnutrition has been following a downward trend, although it is still pervasive with
16.5% of children under 5 affected at the national level. Chronic malnutrition rates are higher in the
south and south east of the country, with high prevalence in the departments of Kolda (31%), Medina
Yoro Foula (30%), Saraya (29%) in the regions of Kolda and Kédougou (PAM, 2014).
Malnutrition is partly due to poor dietary habits including inappropriate feeding practices, especially
in the early months of life. Only one third of children under six months are exclusively breastfed and
21% of children receive a diversified diet. The nutritional situation in Senegal is also characterised by
micronutrient deficiencies. Of serious concern is the high prevalence of iron deficiency among women
and children under five. Access to iodised salt, especially for rural households, is also a serious issue
(Genequand et al., 2016).
Government intervention for food security
3.1 Interventions for price stabilisation
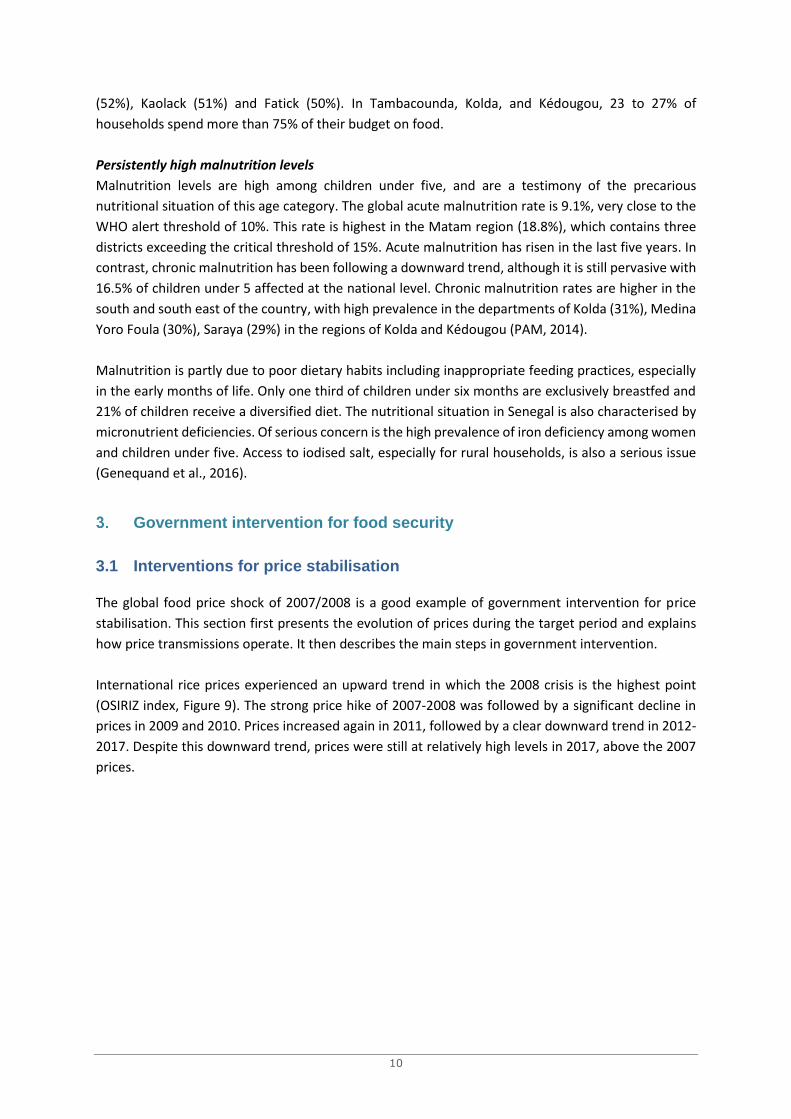
The global food price shock of 2007/2008 is a good example of government intervention for price
stabilisation. This section first presents the evolution of prices during the target period and explains
how price transmissions operate. It then describes the main steps in government intervention.
International rice prices experienced an upward trend in which the 2008 crisis is the highest point
(OSIRIZ index, Figure 9). The strong price hike of 2007-2008 was followed by a significant decline in
prices in 2009 and 2010. Prices increased again in 2011, followed by a clear downward trend in 2012-
2017. Despite this downward trend, prices were still at relatively high levels in 2017, above the 2007
prices.
11
Figure 9: Yearly Evolution of World Rice Prices - OSIRIZ (2004-2015)
Source: Mendez del Villar P. (2004-2015)
Seasonal fluctuations of the millet price, the main local grain, are known and can be explained mainly
by the availability of the product over time and space. But it is especially the stabilisation of the price
of imported rice that has always concerned the authorities due to the sensitivity of this product,
especially in urban areas. The global food price crisis of 2007/2008 highlighted Senegal’s vulnerability
to the volatility of the international price of rice. In Senegal, global rice prices determined the retail
price of imported rice, as well as the price of rice produced locally, over a long period. However, the
impact of international prices is recorded with a delay of two to three months in Dakar and four
months in the countryside. This price transmission was mainly due to the fact that rice is a staple food
and imports account for most of its supply. The price of millet is not affected by fluctuations in the
price of imported rice (Diarra, 2008).
By September 2007, facing soaring prices including energy,2 the government decided to suspend
customs duties of 10% applied to rice. Rice imports have been exempt from VAT for several years. The
suspension of duties boosted imports which reached exceptional levels in 2007, well above the
national needs without the desired (expected) effect on lower consumer prices.
From April 2008, confronted by the severity of the problem, the government took several measures:
1. Limiting margins of the various market intermediaries. This was to curb speculation by
predetermining margins. Thus, the following margins were permitted: importer (2000 FCFA /
ton); semi-Wholesale (5000 FCFA / ton including transportation), retail (750 FCFA / bag and
15 FCFA / kg).
2 The price of energy has multiple effects on the price of other goods and on transport cost, thus worsening the case for food
prices.
108.00118.00
127.30143.60
294.40
231.90220.10
253.50238.80
223.90209.80
186.60 186.00 195.10
0.00
50.00
100.00
150.00
200.00
250.00
300.00
350.00
2004 2005 2006 2007 2008 2009 2010 2011 2012 2013 2014 2015 2016 2017
IPO Linear (IPO )

12
2. Supporting the purchasing power of end consumers through a grant of 5.1 billion FCFA
between May and July 2008. This measure was very expensive, and its implementation led to
supply rationing.
3. Distributing food and animal feed. The state also specifically aided the strongly-affected rural
sector strongly affected through the purchase of 25,000 MT of rice and cattle feed.
4. Establishing reference stores: in June 2008, to improve access to basic products at moderate
prices, the state allied with few private operators to establish reference stores.
5. Finally, the government decided in May 2008 to boost local production through the Great
Agricultural Offensive for Food and Abundance (GOANA) programme, with its rice self-
sufficiency programme component.
From July 2008, coping with the budgetary difficulties and the limited impact of the measures taken
so far, the Government stopped subsidies and took drastic control measures, including establishing::
1. A toll-free number by the Internal Trade Department, prompting consumers to report traders
who participate in the rationing of supply and upward price speculations.
2. An operational security plan of the territory against illegal trade practices (re-exports,
arbitrations through outgoing products to neighbouring countries).
3. A control committee against food retention with a focus on a control of distribution channels
by state services.
4. Support for a few importers to conduct special operations to supply the local market in rice.
Beyond unilateral administrative measures, the government negotiated with importers who accepted
to incur part of the price increase from the international market, with a limited transmission to
domestic prices. Authorities promised to pay the shortfall once the situation stabilised and the fiscal
situation was less tense. This agreement lasted only a few months due to the persistence of the crisis
and the heavy financial burden for importers. The breakdown of the deal resulted in a greater
transmission of the international price changes to the domestic market prices.
Table 3: Changes in regulations on imported rice
Tools Action/ Price regime Rice category
Decree 95-77 of 20 June 1995 Authoritarian pricing Rice
Decree 2006-1246 of 14 November
2006
Rice removed from the authoritarian
fixing scheme
Inter-ministerial Order No. 3419
dated 16 April 2008
Pricing of certain varieties of
imported broken rice
Fragrant broken rice;
ordinary broken rice
Ministerial order of 4 February
2011
Price freeze of certain essential
commodities
Non-fragrant broken rice;
fragrant broken rice
Decree n° 2013-692 of 17 May
2013
Authoritarian pricing Ordinary broken rice
Ministerial Order No. 07111 dated
May 22, 2013
Prices of oil, sugar and non-fragrant
broken rice are administered
Non-fragrant broken rice
Source: compilation of texts by author
13
3.2 Senegalese rice self-sufficiency policy
Senegal aimed to achieve rice self-sufficiency by 2017 with production targets of 1.6 million MT of
paddy. These results would be achieved through 331,308 ha of planting, of which 55% will come from
rainfed areas (Table 4). Although progress has been made, the goal of self-sufficiency was not
achieved.
Table 4: Forecasted Acreage and Rice Production by 2017
Zones
Items
Senegal River
Valley (SRV) Anambe Rainfed Total
Area (ha) 140,308 8,000 183,000 331,308
42.4% 2.4% 55.2% 100%
Production (MT) 912,002 48,000 640,500 1,600,502
57% 3% 40% 100%
Source: Ministry of Agriculture and Rural Equipment (MARE), 2014, p.27
The overall cost of the rice self-sufficiency programme is estimated at 424.7 billion CFA francs. Seeds
and fertilisers account for 55% of that amount, while irrigation schemes and equipment take up 33%
and 8.98% respectively.
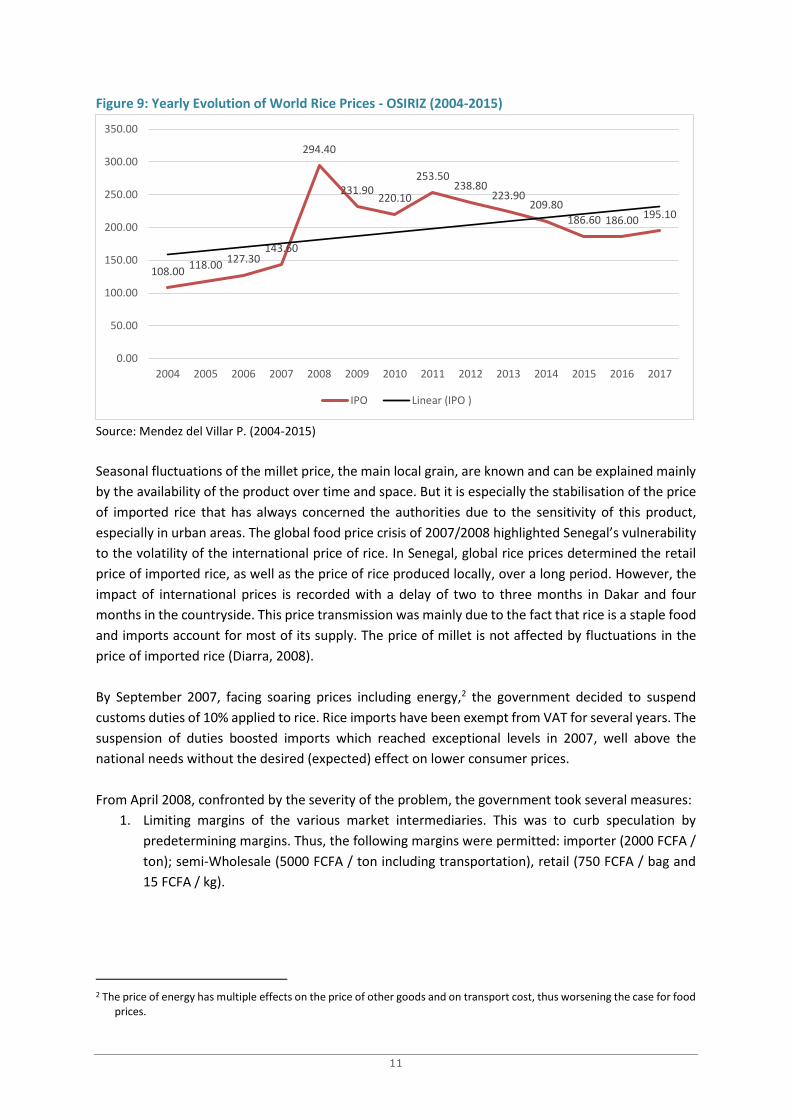
Rice production increased suddenly in 2008 under the combined effect of more irrigated land and
higher yields. These results stem from the innovations carried out as part of the Great Agricultural
Offensive for Food and Abundance (GOANA) and favourable prices for producers in the context of the
crisis in food prices. Yields also improved significantly from 2008. If the Senegal River Valley has seen
steady progress and displays average yields of 5 to 6 MT/ha per year, with peaks of 8 MT/ha, the
introduction of the “Nerica” varieties in rainfed production has greatly improved the yields of upland
rice and subsequently positively impacted average rice yields across the country.
Figure 10: Area planted and rice yields in Senegal (2004/05 – 2015/16)
Source: DAPSA, 2014
0.00
0.50
1.00
1.50
2.00
2.50
3.00
3.50
4.00
4.50
0
50,000
100,000
150,000
200,000
250,000
Yiel
d (
MT/
ha)
Are
a (h
a)
Years
Area Yield
14
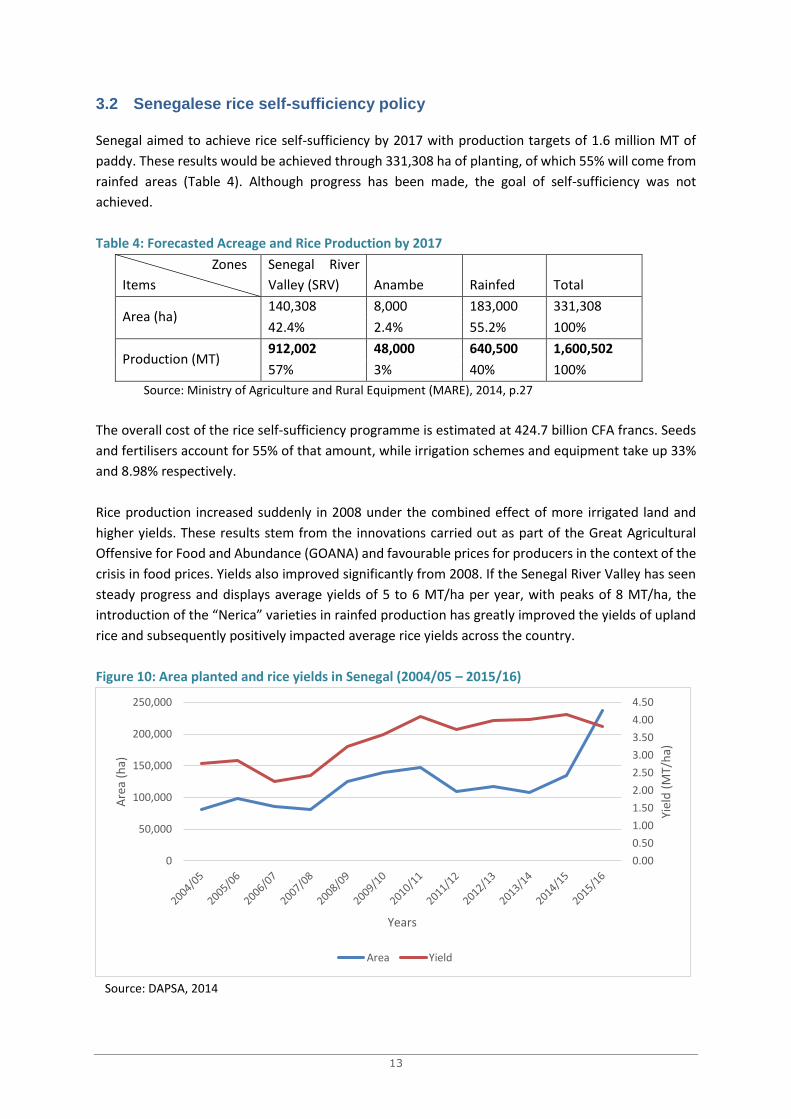
Rice production reached an exceptional level of 906,348 MT of paddy in 2015, against an average
annual production of 555,399 MT from 2010-2014. In terms of white rice equivalent, it is estimated
that domestic production amounted to 308,565 MT on average over the past 10 years, representing
approximately 28% of the country's needs. Table 5 below shows that the coverage of the country’s
rice needs through domestic production has improved over the last 5 years, ranging between 24 and
47%, covering an average a little less than a third of demand (30%). Despite steady progress over these
years, these rates show the enormous challenge to achieve rice self-sufficiency goals.
Table 5: Domestic production of rice and demand coverage (2004-2015)
Year Acreage
(ha)
Yield
(kg/ha)
Paddy
Production (MT)
White rice
Equivalent (MT)
Demand
(MT)
Coverage
ratio
2004/05 81,486 2,476 201,744 133,151 782,219 17%
2005/06 97,779 2,854 279,080 184,193 832,974 22%
2006/07 85,037 2,240 190,493 125,725 896,123 14%
2007/08 80,312 2,408 193,379 127,630 921,538 14%
2008/09 125,329 3,257 408,219 269,425 970,972 28%
2009/10 139,388 3,602 502,104 331,389 1,010,215 33%
2010/11 147,208 4,103 604,043 398,668 1,063,302 37%
2011/12 109,177 3,717 405,824 267,844 1,105,543 24%
2012/13 117,729 3,989 469,649 309,968 1,161,839 27%
2013/14 108,547 4,018 436,153 287,861 1,215,784 24%
2014/15 134,973 4,142 559,021 368,954 1,248,611 30%
2015/16 237,300 3,819 906,348 598,190 1,282,323 47%
Source: DAPSA 2016 and calculations of the author
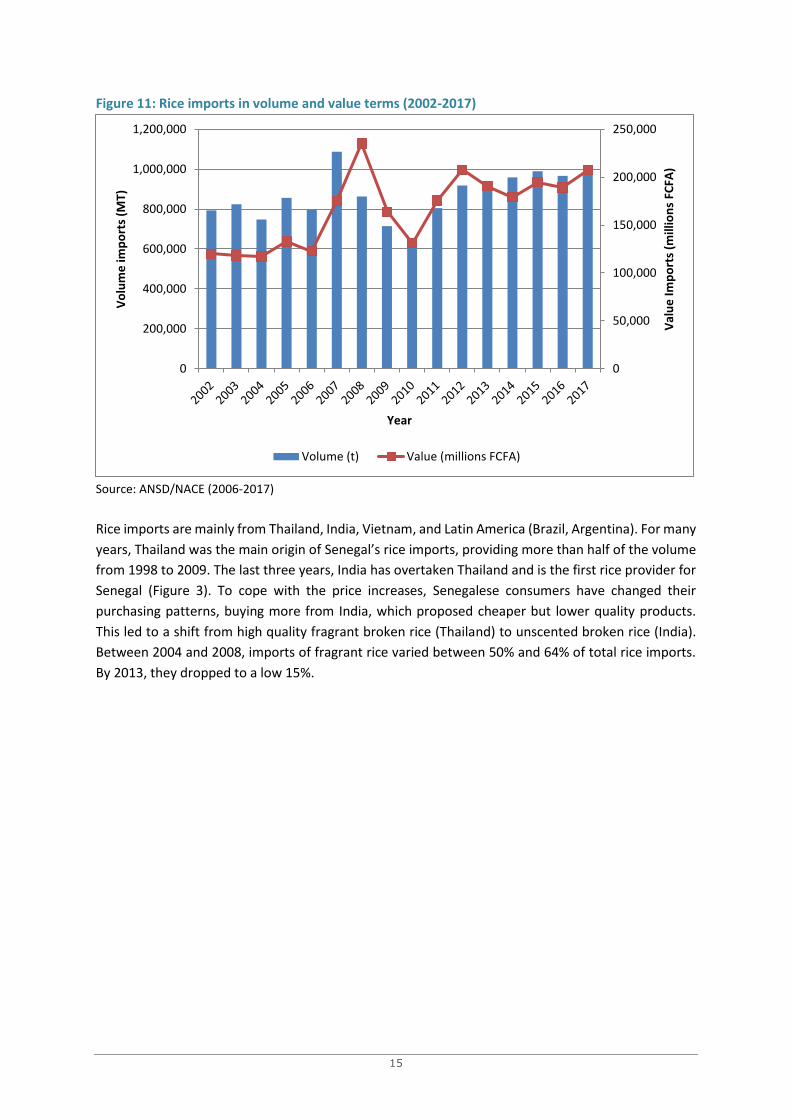
Trends in Senegalese rice imports
Senegalese rice imports remained high during this decade, despite efforts in recent years by the
government to develop local production. Average imports (2005-2017) are at 866,091 MT per year,
with a peak in 2007 of 1,087,522 MT in anticipation of rising world prices. The next three years, rice
imports experienced a downtrend to reach a minimum of 650,789 MT in 2010. Since then, they have
remained above 800,000 MT per year (Figure 11). In value terms, rice imports amounted, on average,
to 187 billion CFA franc per year from 2008-2017. The weight of these imports on the trade balance is
undeniable: they account for 7% of total imports and 33% of imports of foodstuffs (ANSD, NACE, 2006-
2014).
15
Figure 11: Rice imports in volume and value terms (2002-2017)
Source: ANSD/NACE (2006-2017)
Rice imports are mainly from Thailand, India, Vietnam, and Latin America (Brazil, Argentina). For many
years, Thailand was the main origin of Senegal’s rice imports, providing more than half of the volume
from 1998 to 2009. The last three years, India has overtaken Thailand and is the first rice provider for
Senegal (Figure 3). To cope with the price increases, Senegalese consumers have changed their
purchasing patterns, buying more from India, which proposed cheaper but lower quality products.
This led to a shift from high quality fragrant broken rice (Thailand) to unscented broken rice (India).
Between 2004 and 2008, imports of fragrant rice varied between 50% and 64% of total rice imports.
By 2013, they dropped to a low 15%.
0
50,000
100,000
150,000
200,000
250,000
0
200,000
400,000
600,000
800,000
1,000,000
1,200,000
Val
ue
Imp
ort
s (m
illio
ns
FCFA
)
Vo
lum
e im
po
rts
(MT)
Year
Volume (t) Value (millions FCFA)
16
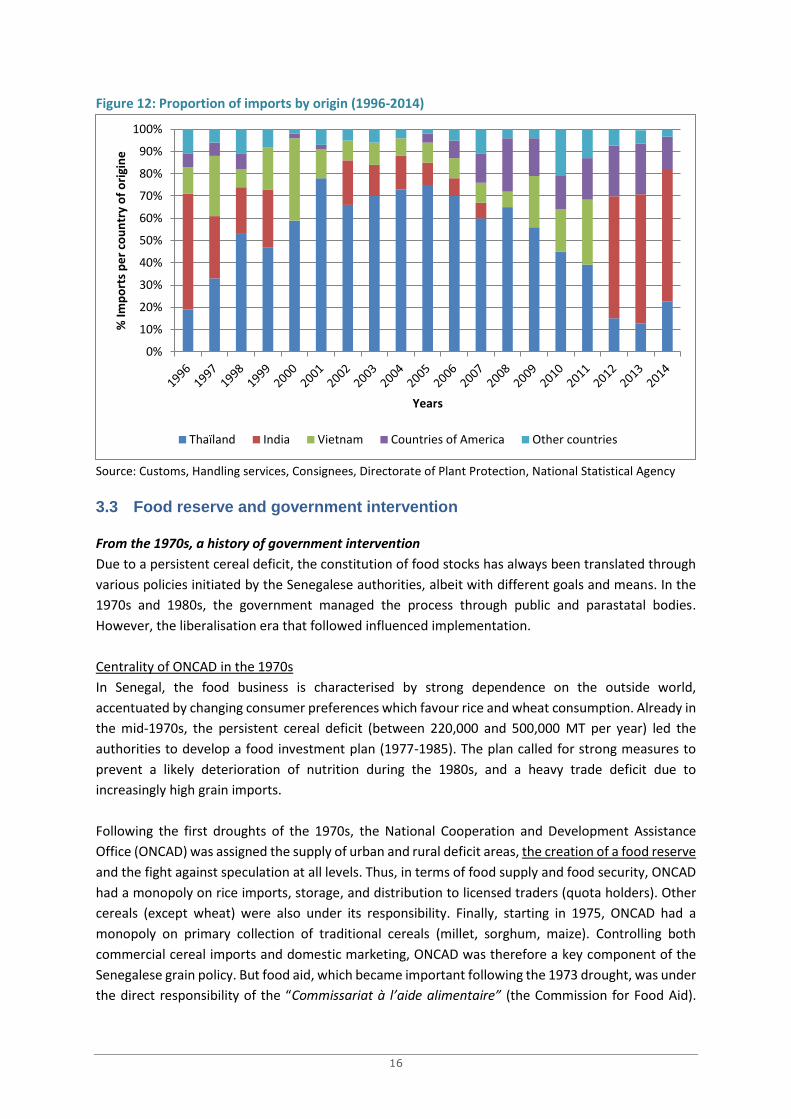
Figure 12: Proportion of imports by origin (1996-2014)
Source: Customs, Handling services, Consignees, Directorate of Plant Protection, National Statistical Agency
3.3 Food reserve and government intervention
From the 1970s, a history of government intervention
Due to a persistent cereal deficit, the constitution of food stocks has always been translated through
various policies initiated by the Senegalese authorities, albeit with different goals and means. In the
1970s and 1980s, the government managed the process through public and parastatal bodies.
However, the liberalisation era that followed influenced implementation.
Centrality of ONCAD in the 1970s
In Senegal, the food business is characterised by strong dependence on the outside world,
accentuated by changing consumer preferences which favour rice and wheat consumption. Already in
the mid-1970s, the persistent cereal deficit (between 220,000 and 500,000 MT per year) led the
authorities to develop a food investment plan (1977-1985). The plan called for strong measures to
prevent a likely deterioration of nutrition during the 1980s, and a heavy trade deficit due to
increasingly high grain imports.
Following the first droughts of the 1970s, the National Cooperation and Development Assistance
Office (ONCAD) was assigned the supply of urban and rural deficit areas, the creation of a food reserve
and the fight against speculation at all levels. Thus, in terms of food supply and food security, ONCAD
had a monopoly on rice imports, storage, and distribution to licensed traders (quota holders). Other
cereals (except wheat) were also under its responsibility. Finally, starting in 1975, ONCAD had a
monopoly on primary collection of traditional cereals (millet, sorghum, maize). Controlling both
commercial cereal imports and domestic marketing, ONCAD was therefore a key component of the
Senegalese grain policy. But food aid, which became important following the 1973 drought, was under
the direct responsibility of the “Commissariat à l’aide alimentaire” (the Commission for Food Aid).
0%
10%
20%
30%
40%
50%
60%
70%
80%
90%
100%%
Imp
ort
s p
er
cou
ntr
y o
f o
rigi
ne
Years
Thaïland India Vietnam Countries of America Other countries
17
ONCAD’s intervention was restricted to being a service provider (unloading, handling, transportation)
(Hirsch, 1979).
Period prior to liberalisation (1979-1988)
The marketing of local cereals (millet/sorghum, maize, paddy rice) followed strong state regulations.
It involved public and parastatal organisations such as the Caisse de péréquation et de stabilisation
des prix or CPSP (the price stabilisation agency), the Commissariat à la Sécurité Alimentaire (CSA) (the
Commission for Food Security) and the Regional Rural Development Service (SRDR), and private sector
actors (accredited traders).
The CPSP oversaw the distribution of imported rice (75% of the local rice supply at the time) and locally
produced rice. It received local rice from the regional public bodies (SRDR) that oversaw the primary
collection and hulling of rice. The CPSP distributed rice inside the country through SONADIS, (a
parastatal specialised in distribution) and private traders who were quota holders. In general, they
had to market their quota within three months, with monthly instalments. The CPSP needed to be
prepared to dispose at any time of a rice buffer stock which amounts to at least two months of national
consumption.
Beside rice, other cereals (millet/sorghum, maize) were managed by the Commissariat à la sécurité
alimentaire (CSA). From the dissolution of ONCAD in 1980, CSA was responsible for public marketing
of local cereals such as millet, sorghum, and maize. The transfer of grains to deficit areas, the
distribution of free food to the poor, and the supply of millet and maize to processing plants were all
under the responsibilities of CSA at this time (Sow and Newman, 1988).
Price stabilisation policy of grain products: the role of the CSA (1979-1988)
In Senegal, cereal production fluctuates considerably and causes significant fluctuations in grain
prices. In the early 1980s, Sow and Newman (1988) noted that millet prices were a barometer of these
fluctuations. Indeed, these prices displayed a pattern of four stages during the year:
1. At harvest (October-December), millet prices are low – below the price floor set by the
government.
2. During peanut marketing, between January and March, millet supply is reduced, resulting in
a price increase.
3. In April-June, preparations for the rainy season encourage producers to sell millet in order to
buy peanut seeds and fertiliser – as the result, there is a slight price drop.
4. Finally, during the lean season (July-September), prices are highest.
To stabilise prices of cereal products, the government put forward the CSA. From the inception of the
New Agricultural Policy (up to 1988), the CSA was responsible for stabilising the market during harvest,
paying millet producers the minimum price set by the government. Despite these CSA interventions,
market prices during harvest were on average lower than the price floor. The limited impact of the
CSA interventions was primarily due to:
1. Inadequate financial resources that prevent the CSA from buying any quantity that producers
are willing to sell;
2. The administrative policy that does not allow the CSA to buy small quantities; and
18
3. The CSA’s dispersion of its interventions, as it made a costly decision to spread its activities to
a wide range of markets rather than focusing on targeted ones, to contain costs.
CSA programmes aimed at stabilising prices and ensuring producer access to markets have not been
very effective. Reducing price variability in the local cereal subsector has been an elusive catch. This is
probably why the government decided to end the experiment in 1988 and to refrain from millet and
maize price stabilisation policies (Ndoye et al., 1991). The context of structural adjustment and
liberalisation policies has also certainly played a role.
Food security stocks and price stabilisation
Since the 1970s, food reserves have been included as a strategy in the fight against food insecurity.
ONCAD was mandated to set up reserves. At its dissolution in 1980, the CPSP (price stabilisation
agency) was responsible for ensuring the presence of a stock that can cover national cereal needs for
at least two months. In addition, the Commissariat à l’aide alimentaire (Commission for Food Aid) was
created after the great drought of 1973 to specifically manage the food aid component. This
organisation was replaced a few years later by the CSA, mandated to ensure the free distribution of
food to vulnerable people. The above policies had often been designed with the inclusion of price
stabilisation objectives. That was one of the essences of the CPSP, which managed its funds to smooth
out prices and revenues in the agricultural sector, keeping in mind the interests of both producers and
consumers in a context of urban dwellers’ larger political clout.
During this period, the government took care to maintain a stock of 2,000 to 3,000 MT of rice renewed
periodically. But the high costs of managing this food security system and the policy environment of
structural adjustment of the 1980s and 1990s encouraged the authorities to end the use of food
reserves despite food insecurity and recurrent shocks.
Significant changes occured in the late 1990s following the commitments made at the World Food
Summit. As a result, the National Food Security Council (CNSA) was created in 1998.3 A year later, a
food security strategy was developed. This marked a turning point because the strategy indicates
clearly that the maintenance of food security stocks is not necessary insofar as Senegal is a coastal
country and can stock up in a relatively short time. In this context, maintaining a safety stock at
national level by the CSA is not required.
The government must limit its actions to provide support to stakeholders who wish to create lines of
defence for their community, of the departmental safety stock type or other communal grain banks.
Government assistance can concentrate on providing guidance in areas including the management
and maintenance of inventories and seasonal credit.
The process of liberalisation of the rice sector, which began in 1995, culminated with a devolution of
the monopoly on imports and distribution of broken rice to the private sector. To support the process,
a rice market management and monitoring unit (Cellule de gestion et de surveillance des marchés du
riz) was created along with a market regulatory agency (Agence de regulation des marchés - ARM).
Furthermore, by Ministerial order, a market information system for rice was established. This
3 Decree 98-554 of 25 June 1998.

19
institutional environment has contributed to preventing the establishment and maintenance of a food
reserve, considered too expensive by the government of Senegal (PAM, 2008).
Reconstitution of the food security stock
With the change of political regime in 2000, policymakers decided to replenish food security stocks
for use in case of food crises (during the lean season) and/or unexpected shocks. In reality there is no
stock on site, but a budgetary provision called “replenishment of food security stock” (a budget line).
Table 6: Level of funding allocated for the food security stock
Year 2011 2012 2013 2014 2015
Amount allocated (millions FCFA) 2176 4900 1 500 3 160 1 200
Source: Diop, 2015
In principle, the CSA uses the funds provided following specific procedures. Procurements are made
by tender procedure following which two suppliers are retained for two years. Goods are bought, and
direct redistribution is made, immediately and with fast rotation. Therefore, there is no palpable
physical stock. Although CSA has 71 stores spread all over the country with a total capacity of 87,340
tons (Table 7), these are not used for long to medium term storage. When needed, CSA had the
capacity and the knowledge to handle the necessary volumes. The distribution is made to people who
cannot make ends meet during the lean season and to religious leaders who organise religious
ceremonies. The funds allocated to this budget line are generally limited (Table 6).
Table 7: CSA's storage capacities in Senegal
Regions Volume (MT) Regions Volume (MT)
Thies 19000 Kaolack 10000
Louga 10000 Kaffrine 4000
Saint Louis 7500 Tambacounda 6000
Matam 3000 Kédougou 1000
Diourbel 14000 Kolda 3000
Fatick 9000 Ziguinchor 840
Source: Audit CSA, 2015
The distribution rules of the available goods are unclear and political interference is significant. A
recent audit noted the lack of a manual of procedures. Religious ceremonies use most of the provisions
(there are about 735 religious events annually during which the CSA is requested to provide rice
support).
Supply is made with rice. The government encourages the use of locally produced rice, but suppliers
usually complain about logistical constraints due to dispersed production and high costs for its
aggregation. According to the CSA, suppliers tried to stock up at the Senegal River valley (the main rice
basket) in 2015 but they encountered several difficulties: rice availability, i.e. problems gathering large
volumes in a short time span, quality from small-scale processors; and high prices offered by modern
processing plants than cannot match the prices offered by suppliers in their responses to the tender
(based on import prices). Due to the procurement procedures, a restricted tender cannot be made on
local rice only.
20
When a shock occurs, the food security stock is not mobilised, and cannot be, for two reasons: (1) the
CSA stock is limited and used mostly for religious events; and (2) there is a budget line to cope with
these shocks but the allocated funds are insufficient. According to a high level official, food crisis is not
budgeted.
In general, when these shocks happen, government officials tend to take two complementary actions:
(i) they resort to development partners; and (ii) they print guaranteed letters that allow suppliers to
commit and get resources from a bank. In 2013, for instance, the government emitted a special
guarantee of 5 billion FCFA of which 2.6 billion were spent. In 2015, the government was able to fund
its intervention through the African Risk Capacity (ARC) funds. ARC funding covered much of the
operations, with 5.6 billion for food security and 3.2 billion for safeguarding livestock (cattle feed).
3.4 Food reserve and government intervention
Social Cash transfer programmes
Experience of Senegal’s national conditional cash transfer programme (Programme national des
bourses de sécurité familiale - PNBSF)
The main objective of the programme is to contribute to the fight against vulnerability and social
exclusion of families through an integrated social protection scheme to strengthen their productive
and educational capabilities. Specifically, the programme aims to:
1. Allocate 25,000 FCFA per quarter to 300,000 households by 2017.
2. Promote school enrolment and retention of children.
3. Ensure beneficiary households have registered their children for a birth certificate.
4. Encourage beneficiary households to regularly update of vaccination records of children aged
0-5 years.
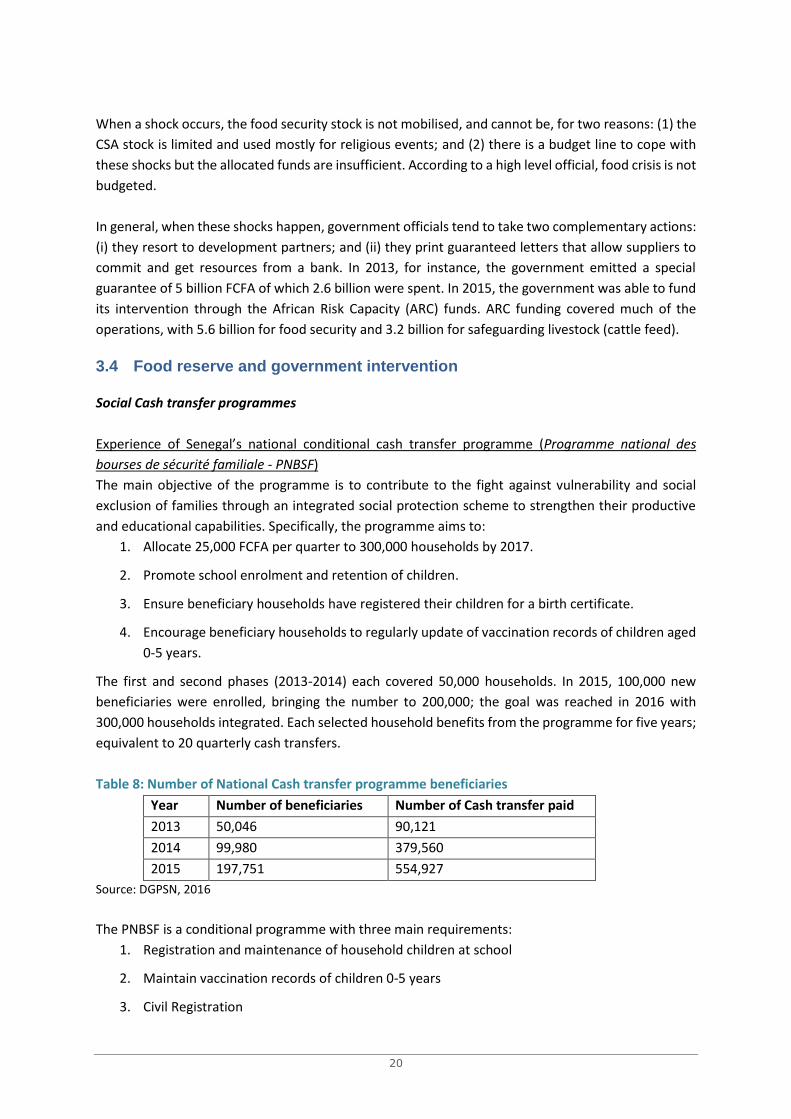
The first and second phases (2013-2014) each covered 50,000 households. In 2015, 100,000 new
beneficiaries were enrolled, bringing the number to 200,000; the goal was reached in 2016 with
300,000 households integrated. Each selected household benefits from the programme for five years;
equivalent to 20 quarterly cash transfers.
Table 8: Number of National Cash transfer programme beneficiaries
Year Number of beneficiaries Number of Cash transfer paid
2013 50,046 90,121
2014 99,980 379,560
2015 197,751 554,927
Source: DGPSN, 2016
The PNBSF is a conditional programme with three main requirements:
1. Registration and maintenance of household children at school
2. Maintain vaccination records of children 0-5 years
3. Civil Registration
21
The programme seeks to gradually target all urban and rural households listed in the National Unique
Registry and in extreme poverty, based on geographic, community and categorical targeting. In
addition to the chronically poor, the main target of the cash conditional transfer programme, the
National Unique Registry includes households who are potentially vulnerable so that they are easily
identified during crises.
Senegal is also currently building an emergency contingency plan that includes an early warning
system. It is expected that the early warning system will trigger a pre-defined set of temporary
interventions and a financing strategy to respond to specific shocks or crises.4
Specific interventions in nutrition
Reducing child malnutrition through community intervention programmes has been one of Senegal’s
key strategies since 2002 under the Programme de Renforcement de la Nutrition – Nutrition
Enhancement Programme. This programme is built around three pillars:
1. A traditional nutrition supplementation approach combining growth promotion and
integrated disease control.
2. Multi-sectoral interventions with several ministries involved in programme implementation.
3. Institutional capacity building of the relevant agencies for future sustainability of the
programme.
Senegal’s relative success in nutrition is linked to its multi-sectoral and multiplayer intervention
strategy. CLM itself is multi-sectoral in nature as it gathers, among others, all ministries concerned
with nutrition. This is strengthened by an implementation scheme that guarantees stakeholder
involvement at community level, thus providing a role for each actor. Consequently CLM, ministries,
local elected officials, civil society organisations, and village level communities work hand in hand
under the leadership of the decentralised authorities who play the key role of 'contracting authorities'
for the interventions.
World Food Programme’s (WFP) experiences
WFP's intervention has included several interesting experiments: (i) the distribution of food; (ii) the
distribution of food stamps; and (iii) the use of village stocks. Cash transfer was also implemented, but
abandoned due to high institutional costs.
What lessons from WFP’s experiences? The 2012 intervention
Joint missions (government / development partners) conducted in November 2011 and February 2012
revealed that 739,000 people in rural areas were food insecure because of the scale of the agricultural
production deficit. There was also an urban targeting project. In addition to geographic targeting, WFP
partnered with 25 institutions/NGOs to perform the individual targeting and distribution of food
assistance.
Overall, from 28 April to 31 October 2012, WFP assisted 1,080,902 food insecure people with 23,704
MT of food and 1,785,382,506 FCFA in food vouchers in 116 localities. A total of 167 village cereal
4 World Bank: http://www.worldbank.org/en/news/feature/2016/06/20/in-senegal-a-safety-net-system-designed-to-
break-the-cycle-of-poverty
22
banks (VCB) were supplied with 3,800 MT of cereals that benefited more than 116,019 beneficiaries.
Food stamps (cash vouchers) were distributed in seven urban areas and 11 rural areas to 142,628
beneficiaries in the amount of 1,785,382,506 FCFA.
After these various interventions, WFP was able to distribute food at least twice in different target
areas. In areas where food insecurity was found to be high, three to four distributions were made to
the same recipients. The "food voucher" modality seems the most efficient because in the majority of
targeted areas, 4-5 distributions were realised. The restocking of VCB has also been very successful.
In terms of lessons learned, it was noted that the modality Cash Voucher far outweighs the preference
of households as long as the amount transferred can purchase the same amount of commodities in
the food basket. Choice of modalities and mechanisms must consider the context and target group
acceptability. Cash transfers may not be practical in areas where local markets are non-existent.
Imperfections in the early warning system should be corrected. Likewise, the lack of a contingency
plan with an effective mechanism for whistleblowing if necessary, and the lack of adequate resource
mobilisation devices, may jeopardise future interventions.
WFP encourages local food procurement. In terms of tools, “cash & voucher modalities are preferred
considering the sizeable amount of cash that is injected into the local economy each time a value
voucher transfer takes place. With the inclusion of local foods in the food basket, value voucher
distributions help to diversify dietary intake, stimulate local agricultural production and offer a market
for smallholder farmers and producers.”5
5 WFP Senegal Brief: Reporting period: 01 April – 30 June 2015
23
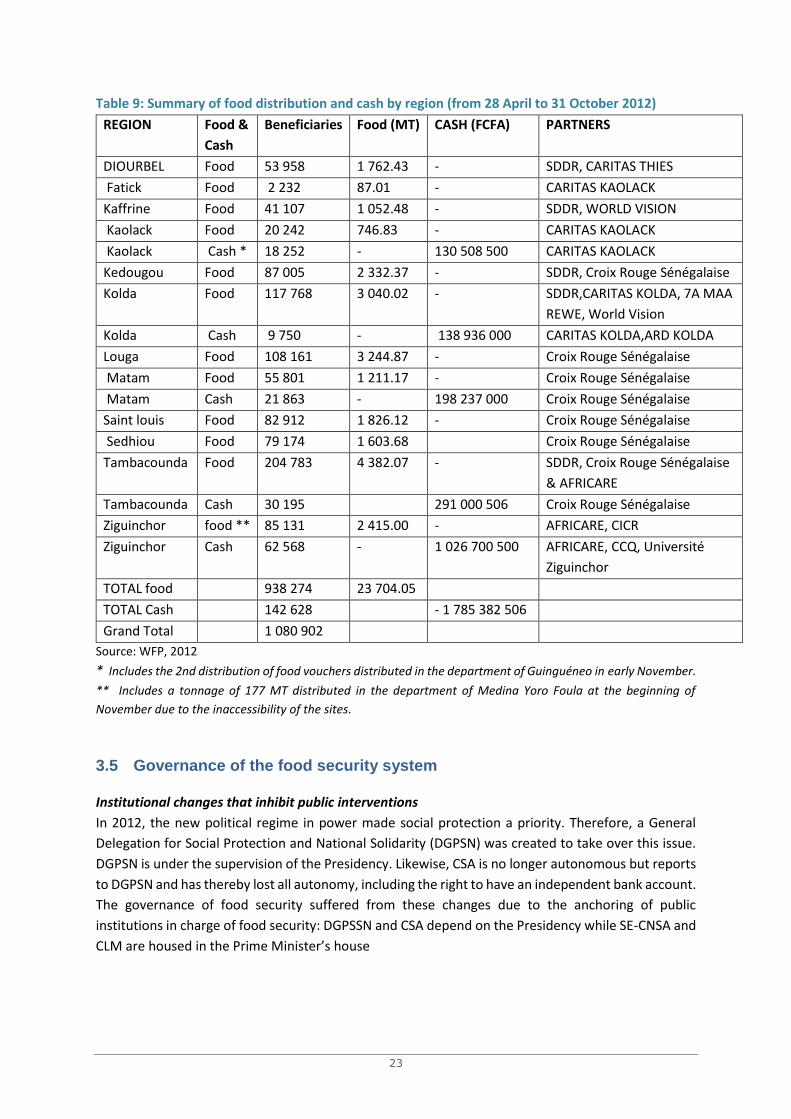
Table 9: Summary of food distribution and cash by region (from 28 April to 31 October 2012)
REGION Food &
Cash
Beneficiaries Food (MT) CASH (FCFA) PARTNERS
DIOURBEL Food 53 958 1 762.43 - SDDR, CARITAS THIES
Fatick Food 2 232 87.01 - CARITAS KAOLACK
Kaffrine Food 41 107 1 052.48 - SDDR, WORLD VISION
Kaolack Food 20 242 746.83 - CARITAS KAOLACK
Kaolack Cash * 18 252 - 130 508 500 CARITAS KAOLACK
Kedougou Food 87 005 2 332.37 - SDDR, Croix Rouge Sénégalaise
Kolda Food 117 768 3 040.02 - SDDR,CARITAS KOLDA, 7A MAA
REWE, World Vision
Kolda Cash 9 750 - 138 936 000 CARITAS KOLDA,ARD KOLDA
Louga Food 108 161 3 244.87 - Croix Rouge Sénégalaise
Matam Food 55 801 1 211.17 - Croix Rouge Sénégalaise
Matam Cash 21 863 - 198 237 000 Croix Rouge Sénégalaise
Saint louis Food 82 912 1 826.12 - Croix Rouge Sénégalaise
Sedhiou Food 79 174 1 603.68 Croix Rouge Sénégalaise
Tambacounda Food 204 783 4 382.07 - SDDR, Croix Rouge Sénégalaise
& AFRICARE
Tambacounda Cash 30 195 291 000 506 Croix Rouge Sénégalaise
Ziguinchor food ** 85 131 2 415.00 - AFRICARE, CICR
Ziguinchor Cash 62 568 - 1 026 700 500 AFRICARE, CCQ, Université
Ziguinchor
TOTAL food 938 274 23 704.05
TOTAL Cash 142 628 - 1 785 382 506
Grand Total 1 080 902
Source: WFP, 2012
* Includes the 2nd distribution of food vouchers distributed in the department of Guinguéneo in early November.
** Includes a tonnage of 177 MT distributed in the department of Medina Yoro Foula at the beginning of
November due to the inaccessibility of the sites.
3.5 Governance of the food security system
Institutional changes that inhibit public interventions
In 2012, the new political regime in power made social protection a priority. Therefore, a General
Delegation for Social Protection and National Solidarity (DGPSN) was created to take over this issue.
DGPSN is under the supervision of the Presidency. Likewise, CSA is no longer autonomous but reports
to DGPSN and has thereby lost all autonomy, including the right to have an independent bank account.
The governance of food security suffered from these changes due to the anchoring of public
institutions in charge of food security: DGPSSN and CSA depend on the Presidency while SE-CNSA and
CLM are housed in the Prime Minister’s house
24
Significant progress made in coordinating activities
Government institutions and development partners interested in food security issues have established
channels of collaboration that facilitate interventions. Each year, a response plan is designed based
on well-crafted analyses. WFP provides leadership in connection with the Executive Secretariat of the
National Food Security Commission. Operationally, significant progress has been made on targeting
(done in a participatory manner).
Conclusions
The rice self-sufficiency programme helped increase grain availability without resolving Senegal’s food
dependency over imports. Responses to chronic food crises involve a variety of actors who are
increasingly well coordinated. The food security strategy of the country recognises the importance of
the reconstruction of emergency food stocks even though the modalities for constituting these food
reserves are still not clearly specified. The principle of having a mixed strategy involving on the one
hand a small food reserve and on the other hand the availability of financial resources that could be
mobilised when needed, seems widely shared. However, the practical arrangements are not yet
specified. Of prime importance is the need for predictability of financial resources and food to deal
with emergencies.
A recent study (ASIST, 2015) advocates alternatives that are worth exploring. They include:
1. The need for priority use of the government’s financial reserve.
2. Establishing a financial reserve fund specifically for emergencies.
3. Strengthening the existing physical stock management mechanism.
4. Increasing the scope of the African Risk Capacity (ARC).
5. Use of the ECOWAS regional food security reserve as soon as it is operational.
A cost/benefit analysis of different alternatives could shed light on the pros and cons and provide
evidence to policymakers that would guide their decisions.
25
References
Agence Nationale de la Statistique et de la Démographie, ANSD. (2016, Février). Situation Economique et Sociale du Sénégal
en 2013, 350p.
Agence Nationale de la Statistique et de la Démographie, ANSD. Note d’analyse du commerce extérieur, édition 2014, 350p.
ASiST (2015) “ Prévisibilité des dépenses publiques liées à la sécurité alimentaire et nutritionnelle au Sénégal » EU, Advisory
Service in Social Transfers (ASiST III), Décembre 2015
David-Benz H. et F. Lançon « Transmission des prix internationaux du riz sur les marchés africains : le long terme, la crise de
2008… et maintenant ? », CIRAD, Powerpoint presentation, 3rd Africa Rice Congress, 21-24 October 2013,Yaounde,
Cameroun.
David-Benz H., Diallo A., Lançon F., Meuriot V., Rasolofo P., Temple L., Wane A., 2010. « L’imparfaite transmission des prix
mondiaux aux marchés agricoles d’Afrique Subsaharienne », CIRAD / FARM, Février 2010, 97 p.
Diarra M. M. « Mécanisme de transmission de la hausse des Prix des céréales depuis les marchés mondiaux vers les marchés
du Mali et du Sénégal » FARM, Rapport de stage de fin de formation de Master 2 Professionnel « Etudes du
Développement » (2007 – 2008), Mars-Août 2008.
Diop A. N. (2015). Revue des dépenses publiques de l’agriculture. Rapport MEFP & DUE. 76 pages
Genequand M. M., Pasquet J., Seck K. (2016, Février). « Evaluation à mi-parcours du Programme de Pays du PAM (2012-
2016) » Rapport d’Evaluation final, Rapport no OEV/2015/007. Retrieved June 8, 2016 from
http://documents.wfp.org/stellent/groups/public/documents/reports/wfp282398.pdf
Hirsch R.D., (1979). SENEGAL: la commercialisation du mil par l’ONCAD en 1978/1979. Etude de cas. Colloque de Nouakchott,
2-7 juillet 1979.
Meuriot V., 2012. « Une analyse comparative de la transmission des prix pour l’orientation des politiques publiques : le cas
du riz au Sénégal et au Mali » CIRAD, LAMETA, Document de recherche no2012-04, Janvier 2012, 33 p.
Ndoye O., Boughton D., & Crawford E. (1991). Politique de fixation de prix des céréales au Sénégal : Synthèse d’études
réalisées depuis l’installation de la nouvelle politique agricole. ISRA, Etudes et documents, Vol. 4, No 17, 28 p.
Programme Alimentaire Mondial, PAM. (2014, Juillet). Analyse Globale de la Vulnérabilité, de la Sécurité Alimentaire et de la
Nutrition (AGVSAN). Retrieved April 1, 2016, from https://www.wfp.org/content/senegal-analyse-globale-
vulnerabilite-securite-alimentaire-nutrition-juillet-2014
Programme Alimentaire Mondial, PAM. (2011). Analyse Globale de la Vulnérabilité, de la Sécurité Alimentaire et de la
Nutrition (AGVSAN). Retrieved April 1, 2016, from
Programme Alimentaire Mondial, PAM. (2008). Rapport d’Analyse de Marché, Senegal Commerce du riz, août 2008.
Sow A. et Newman D.M. (1988) La réglementation et l’organisation des marchés céréaliers au Sénégal: situation des
campagnes de commercialisation pour les saisons 1983/84 et 1984/85, 47 p.
United Nations Development Programme, UNDP. (2015), Human Development Report 2015, Work for human development,
288 p.
World Food Programme – WFP (2012). Bilan de la réponse du PAM à la crise alimentaire 2011-2012.