working paper - ipc · 4 working paper average household income per capita in brazil increased from...
TRANSCRIPT

W O R K I N GP A P E R
1
working paper number 155april, 2017
ISSN 1812-108x
Social policy in Brazil (2004–2014): an overview
Patrícia Andrade de Oliveira e Silva, Institute for Applied Economic Research (Ipea)

Copyright© 2017International Policy Centre for Inclusive Growth
International Policy Centre for Inclusive Growth (IPC-IG)
SBS, Quadra 1, Bloco J, Ed. BNDES, 13º andar70076-900 Brasília, DF - BrazilTelephone: +55 61 2105 5000
[email protected] ■ www.ipc-undp.org
The International Policy Centre for Inclusive Growth is jointly supported by theUnited Nations Development Programme and the Government of Brazil.
Rights and Permissions
All rights reserved.
The text and data in this publication may be reproduced as long as the source is cited.Reproductions for commercial purposes are forbidden.
The International Policy Centre for Inclusive Growth disseminates the findings of its workin progress to encourage the exchange of ideas about development issues. The papers aresigned by the authors and should be cited accordingly. The findings, interpretations, andconclusions that they express are those of the authors and not necessarily those of theUnited Nations Development Programme or the Government of Brazil.
Working Papers are available online at www.ipc-undp.org andsubscriptions can be requested by email to [email protected].
Print ISSN: 1812-108X

SOCIAL POLICY IN BRAZIL (2004–2014): AN OVERVIEW
Patrícia Andrade de Oliveira e Silva1
ABSTRACT
Social policy has played a central role in developing countries over the last decade, contributing to a significant decline in poverty and inequality. The objective of this paper is to provide an overview of the evolution of social policy in Brazil, its effects on inequality and poverty, and the implications of the current political and economic scenario regarding the maintenance of its continuous progress. Analyses conducted over the past decade show that negative poverty indicators resulted from a combination of an increase in the value of the minimum wage, a renewed focus on income transfer programmes, and the expansion of assistance projects, old-age pensions and educational and health policies. However, despite these improvements, the current critical economic and political situation (with inflation rates rising in almost every country worldwide) could be quite destructive and demands a concerted strategy to preserve social policy benefits in Brazil. This paper provides a review of recent literature focused on social assistance, social security, health and education, and is divided into six sections. The introduction is followed by an overview of social policy in Brazil. The third section discusses the evolution of poverty and inequality in the country, while the fourth explores the current political and socio-economic situation. The fifth and sixth sections provide the final remarks and bibliographical references, respectively.
1 INTRODUCTION
Brazil underwent a process of extensive economic reforms in the 1980s and 1990s. The 2000s (especially from 2004 onwards) marked a different period, characterised by sustained economic growth. According to data from the Brazilian Institute of Geography and Statistics (Instituto Brasileiro de Geografia e Estatística—IBGE), the Gross Domestic Product (GDP) increased from USD1.5 trillion in 2000 to USD2.8 trillion in 2014,2 with a positive annual variation in every year except 2009 (which presented a negative growth rate of 0.1 per cent, due to the international economic crisis). Osorio (2015) shows that the
1. PhD in Economic Development, Space and Environment at the State University of Campinas (UNICAMP) and Research Assistant for the Directorate of Studies and Social Policies of the Institute for Applied Economic Research (Instituto de Pesquisa Econômica Aplicada—Ipea).
2. In this study, all monetary conversions are made using the Purchasing Power Parity Comparison (PPC) conversion factor for December 2011.

Working Paper4
average household income per capita in Brazil increased from USD11.13/day in 2004 to USD17.44/day in 2014.3 Additionally, there was a reduction in income inequality indicators during this period, and the Gini index4 decreased from 0.570 in 2004 to 0.515 in 2014.
All of this had clear impacts. According to Osorio (ibid.) between 2004 and 2014, extreme poverty (according to the threshold defined by the Brazilian government and the World Bank)5 was reduced by at least 63 per cent in the country, with an average reduction of 10 per cent per year. Observing the macroeconomic conditions, the positive economic context (generating primary surpluses) and the increasing appreciation of the minimum wage, government-ledresearch and actions increased sharply regarding this issue, as demonstrated by the implementation of cash transfer programmes such as Bolsa Família and the creation of the Ministry of Social Development and Fight against Hunger (Ministério do Desenvolvimento Social e Combate à Fome—MDS) in 2004.
However, as a result of the international financial crisis of 2007–2008, the global economic reversal led to negative expectations about the Brazilian economy and its ability to sustain such positive indicators. This negative atmosphere intensified after then-president Dilma Rousseff announced countercyclical measures to combat the mounting crisis, seeking to increase government spending to stimulate the domestic market. Furthermore, corruption scandals involving high-ranking government officials contributed to a mounting political crisis, which eventually culminated in Rousseff ’s impeachment from office.6
Therefore, this political scenario featuring the recessionary adjustment of public accounts (such as higher interest rates and reduced availability of credit and federal spending, among others) directly affected economic and social indicators (leading to an increase in inflation and unemployment rates), especially between 2014 and 2015, with dire predictions for the following years.
Given the difficulties faced by the Brazilian population in the 1980s and 1990s— high inflation and rising poverty rates, among others—it is important to understand the importance of preserving the gains that were achieved in the 2000s, particularly related to social policies.
Therefore, the purpose of this paper is to analyse social policy in Brazil and demonstrate its evolution and progress regarding poverty and inequality indicators. The central hypothesis is that the adjustment mechanisms currently in place in the Brazilian economy are tending to reverse the expansion and even the continuation of progressive social policies. This study provides an overview of the evolution of social policy in Brazil, followed by an analysis of poverty behaviour and inequality underpinned by the current socio-economic context in the country.
2 THE EVOLUTION OF SOCIAL POLICY IN BRAZIL
2.1 INSTITUTIONAL ARTICULATION AND SOCIAL POLICY EXPENDITURES
Various research studies reveal the importance of social policy in changing lives. Castro et al. (2012) analyse the Brazilian literature on the topic, demonstrating advances in specific areas and the predominance of empirical analysis that reveals the role of social policy as providing

International Policy Centre for Inclusive Growth 5
care for citizens through social protection and carrying out social development, generating opportunities and outcomes for communities and individuals. Social policy is a complex system, constructed through a manifold network of taxes, transfers and the provision of services involving several steps and agents, all of which must be considered when attempting any impact evaluation.
Social programmes have been present in Brazil since the end of military rule in the country, to different degrees. Figure 1 depicts current social policies developed by the government, from the perspective of both social protection and social development, across different sectors, in addition to horizontal policies.
The breadth of this social policy system in a country such as Brazil, of continental proportions and with a population of almost 200 million people, is nothing short of remarkable. Within such a system, this article highlights five policies that are crucial to human development: health, education, welfare, labour and social security.
FIGURE 1Social policies in Brazil, 2010
Social security
Gender social secutrity
Socialprotec�on
Socialdevelopment
Socialpolicy
Special socialsecurity
Housing and urban planning
Employmentpolicies
Educa�on
Culture
Agrariandevelopment
Health
Social assistance
Nutri�on
Sanita�on
POLICY SECTORS CROSS�CUTTING POLICIES
SOCIAL AREAS
Social assistance
Sanita�on
Employmentpolicies
Agrariandevelopment
Housing andurban planning
Gender-equality
Children’spolicies
Youthpolicy
Seniorpolicies
Racial equality
Health
Educa�on
Culture
Source: Castro et al. (2012).
Working Paper6
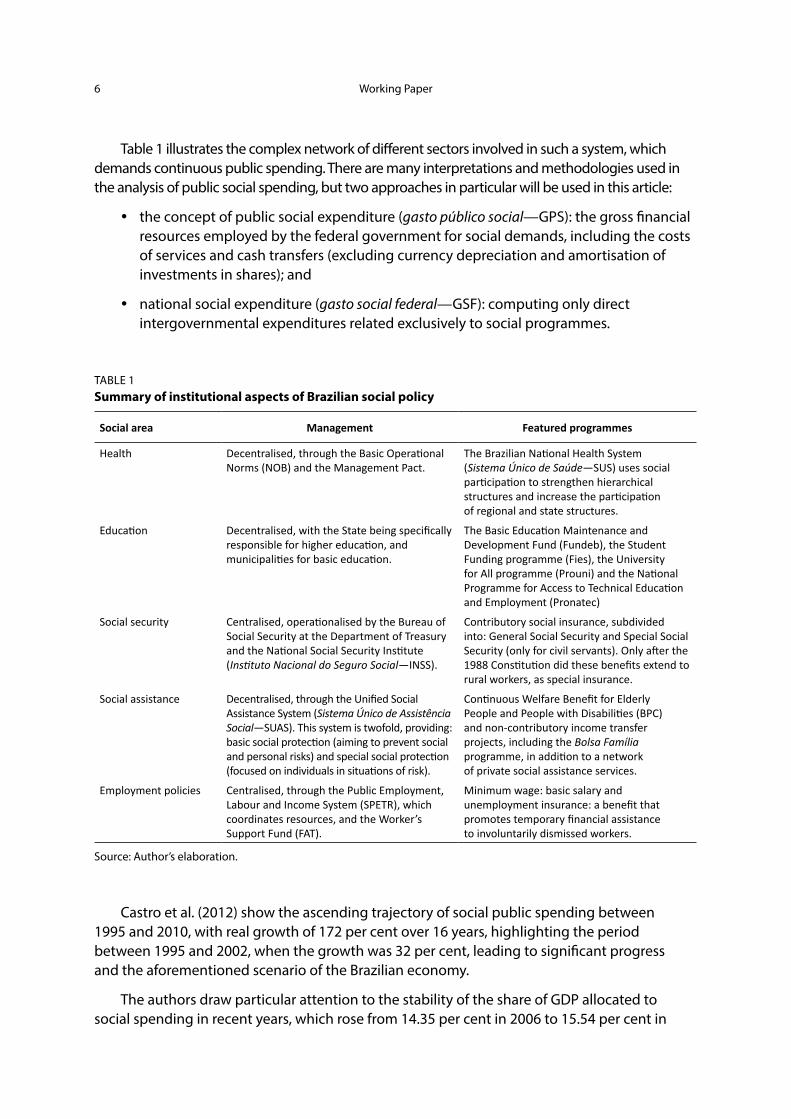
Table 1 illustrates the complex network of different sectors involved in such a system, which demands continuous public spending. There are many interpretations and methodologies used in the analysis of public social spending, but two approaches in particular will be used in this article:
y the concept of public social expenditure (gasto público social—GPS): the gross financial resources employed by the federal government for social demands, including the costs of services and cash transfers (excluding currency depreciation and amortisation of investments in shares); and
y national social expenditure (gasto social federal—GSF): computing only direct intergovernmental expenditures related exclusively to social programmes.
TABLE 1Summary of institutional aspects of Brazilian social policy
Social area Management Featured programmes
Health Decentralised, through the Basic Operational Norms (NOB) and the Management Pact.
The Brazilian National Health System (Sistema Único de Saúde—SUS) uses social participation to strengthen hierarchical structures and increase the participation of regional and state structures.
Education Decentralised, with the State being specifically responsible for higher education, and municipalities for basic education.
The Basic Education Maintenance and Development Fund (Fundeb), the Student Funding programme (Fies), the University for All programme (Prouni) and the National Programme for Access to Technical Education and Employment (Pronatec)
Social security Centralised, operationalised by the Bureau of Social Security at the Department of Treasury and the National Social Security Institute (Instituto Nacional do Seguro Social—INSS).
Contributory social insurance, subdivided into: General Social Security and Special Social Security (only for civil servants). Only after the 1988 Constitution did these benefits extend to rural workers, as special insurance.
Social assistance Decentralised, through the Unified Social Assistance System (Sistema Único de Assistência Social—SUAS). This system is twofold, providing: basic social protection (aiming to prevent social and personal risks) and special social protection (focused on individuals in situations of risk).
Continuous Welfare Benefit for Elderly People and People with Disabilities (BPC) and non-contributory income transfer projects, including the Bolsa Família programme, in addition to a network of private social assistance services.
Employment policies Centralised, through the Public Employment, Labour and Income System (SPETR), which coordinates resources, and the Worker’s Support Fund (FAT).
Minimum wage: basic salary and unemployment insurance: a benefit that promotes temporary financial assistance to involuntarily dismissed workers.
Source: Author’s elaboration.
Castro et al. (2012) show the ascending trajectory of social public spending between 1995 and 2010, with real growth of 172 per cent over 16 years, highlighting the period between 1995 and 2002, when the growth was 32 per cent, leading to significant progress and the aforementioned scenario of the Brazilian economy.
The authors draw particular attention to the stability of the share of GDP allocated to social spending in recent years, which rose from 14.35 per cent in 2006 to 15.54 per cent in

International Policy Centre for Inclusive Growth 7
2010. Due to the anti-cyclical response from the Brazilian government to the 2007–2008 international financial crisis, this scenario was halted. However, it is important to note that GDP has grown significantly in some years since 2007, which increases the denominator effect when calculating the share of GDP allocated to social spending and may not correctly capture increases in these expenditures over the period.
Observing expenditures by sector, it is clear that some areas, such as social assistance, increased more than others, as shown in Table 2. This increase also influenced the increase in the share of Brazilian GDP allocated to these sectors, from 0.08 per cent in 1995 to 1.07 per cent in 2010. In contrast, health and education lost ground during this period (about 10 per cent of total expenditures), which is dangerous because of the enormous impact of these areas on development. However, major changes were made to the Law of Guidelines and Bases of National Education (Lei de Diretrizes e Bases—LDB), a category which increased from only 0.95 per cent of GDP in 1995 to 1.11 per cent in 2010. The situation regarding health policy can be considered even worse, because although a real increase in spending was found, it was nonetheless not enough to increase its share of overall GDP, which fell from 1.79 per cent in 1995 to 1.68 per cent in 2010.
TABLE 2Federal social spending (1995–2010), by area of activity (percentage of total in BRL), Brazil, 1995–2015
Area 1995 1996 1997 1998 1999 2000 2001 2002 2003 2004 2005 2006 2007 2008 2009 2010
Nutrition 1.0 0.5 0.8 0.9 0.9 0.8 0.8 0.7 0.7 0.5 0.6 0.6 0.6 0.5 0.6 0.7
Social 0.7 0.8 1.5 2.0 2.4 3.2 3.8 4.6 5.1 5.7 6.0 6.3 6.5 6.9 6.8 6.9
Assintance public workes benefits 21.9 20.8 20.4 20.1 20.4 19.7 19.9 1.9 18.4 17.5 16.6 15.7 15.5 15.4 15 14.6
Culture 0.2 0.2 0.2 0.2 0.2 0.2 0.2 0.1 0.2 0.2 0.2 0.2 0.2 0.2 0.2 0.3
Agrarian development 1.4 1.2 1.8 1.8 1.7 1.2 0.9 0.8 1.0 1.4 1.4 1.4 1.4 1.2 1.1 0.8
Education 8.5 7.3 6.4 6.4 6.5 6.9 6.4 5.9 5.5 5.6 5.7 5.7 6.1 6.2 6.5 7.2
Employment policies 4.7 5.1 4.6 4.6 4.8 4.1 4.3 4.4 4.3 4.1 4.8 4.8 5.1 5.2 5.7 5.3
Habitation and urban planning 1.0 1.6 3.9 3.9 2.7 3.5 2.4 2.7 2.3 2.3 2.8 2.8 2.9 4.0 4.9 5.2
Social security 44.3 47.8 44.8 44.8 47.0 45.9 46.2 47.1 50.3 50.7 50.2 50.2 49 47.8 46.1 47.5
Sanitation 0.3 0.7 1.0 1.0 1.4 0.9 1.7 0.7 0.3 0.4 0.7 1.2 1.2 1.2 1.3 0.9
Health 15.9 13.9 14.5 14.5 12.9 13.5 13.1 13.0 12.2 12.3 11.7 11.7 11.5 11.5 11.7 10.8
Total 100 100 100 100 100 100 100 100 100 100 100 100 100 100 100 100
Source: Castro et al. (2012).
An analysis of social security expenditure shows that, despite an increase in 2010, the real increase derives from the continued appreciation of the minimum wage over the last decade (a real increase of 130 per cent in 16 years). The low coverage among formal workers and the consequently high share of informality in the Brazilian labour market is still notable, since the percentage of contributors to social security represented 38 per cent of the economically active population in 1995, rising to 45.8 per cent in 2010. Considering recent events, the prospects for social policy are clearly dire. However, a detailed analysis is necessary, and the studies by the National Treasury (2016) describe an increase in social

Working Paper8
spending (GSF) from 59.9 per cent of expenditure in 2002 to 67.3 per cent in 2015 (see Table 3). When observing tax expenditures, it becomes clear that the increased share was even more significant, from 17 per cent in 2002 to 38.6 per cent in 2015.
This increased spending represents more than 3 percentage points of GDP when comparing the values observed between 2002 and 2015. The featured areas are:
y education and culture (an increase of 0.74 percentage points—pp—of GDP); y social assistance (0.78 pp of GDP); and c) social security (0.97 pp of GDP). According to Castro
et al. (2012), while the share of GDP spent on health remained stable, agrarian development and sanitation were expressionless throughout the period, as can be seen in Table 3.
TABLE 3Federal government social spending, Brazil, 2002–2015 (percentage of GDP)
Area 2002 2003 2004 2005 2006 2007 2008 2009 2010 2011 2012 2013 2014 2015
Sanitation and urban planning 0.1 0.1 0.1 0.1 0.1 0.1 0.2 0.2 0.2 0.3 0.4 0.4 0.5 0.5
Agrarian development 0.2 0.2 0.3 0.3 0.3 0.3 0.2 0.2 0.1 0.2 0.1 0.1 0.1 0.2
Employment policies 0.5 0.5 0.5 0.6 0.7 0.7 0.7 0.9 0.8 0.8 0.8 0.9 1.4 1.2
Social assistance 0.5 0.6 0.8 0.9 1.0 1.0 1.0 1.3 1.3 1.3 1.4 1.5 1.5 1.5
Education and culture 1.7 1.6 1.5 1.6 1.6 1.7 1.8 2.0 2.1 2.2 2.3 2.3 2.6 2.7
Health 1.8 1.6 1.8 1.7 1.8 1.8 1.8 2.0 1.9 1.9 2.0 2.0 2.1 2.1
Social security 8.0 8.2 8.3 8.9 8.9 8.6 8.3 8.9 8.5 8.4 8.7 8.7 8.9 9.3
Total 12.8 12.6 13.2 13.9 14.2 14.2 14.1 15.4 14.9 15.0 15.8 15.8 17.0 17.5
Source: National Treasury (2016).
The study shows social security as always representing over 50 per cent of total spending. Further breaking down social security into two distinct types, we can note the following:
y 77 per cent of ‘general social security’ beneficiaries live in urban areas, and the values of the benefit range from the minimum wage to special pension benefits for death and retirement pensions. Rural areas represent the most retirement benefits (99.7 per cent). It is worth noting that the benefits for rural populations have become important mechanisms for combating poverty and contributing to reducing inequality; and
y the expenditures on ‘special social security’ (pensions for federal civil servants) increased by 50 per cent between 2002 and 2014, and, additionally, only 10 per cent of these expenditures had a social character.
Therefore, a significant positive trend in social security expenditures derived fundamentally from the minimum wage appreciation policy since 2007. This policy also affected the pension system. However, because of their relevance for poor people, it was suggested that an adjustment to pension accounts was necessary to reduce the disparities between the total amount of benefits paid to civil servants and to the general population, instead of reversing the minimum wage appreciation policy.

International Policy Centre for Inclusive Growth 9
Expenditures on social assistance also rose significantly, with an increase of 375 per cent in real terms between 2002 and 2015, mainly derived from social programmes, including the Bolsa Família programme and the Continuous Welfare Benefit (Benefício de Prestação Continuada—BPC). However, it is necessary to highlight two factors: first, the impact of social assistance as a percentage of GDP also increased, from 0.46 per cent in 2002 to 1.24 per cent in 2015; and second, as shown in Table 4, considering the amount of benefits, it is possible to notice a fall between 2014 and 2015, with a drop in the number of Bolsa Família benefits awarded, while the increase in the BPC was lower than the one registered in the previous year. This deceleration could be a result of the political and economic crisis.
TABLE 4Number of benefits in december, Brazil, 2002–2015
Year Bolsa Família programme Continuous welfare benefit for disabled people
Continuous welfare benefit for elderly people
2002 0 976,257 584,597
2003 0 1,036,365 664,875
2004 6,571,839 1,127,849 933,164
2005 8,700,445 1,211,761 1,065,604
2006 10,965,810 1,293,645 1,183,840
2007 11,043,076 1,385,107 1,295,716
2008 10,557,996 1,510,682 1,423,790
2009 12,370,915 1,625,625 1,541,220
2010 12,778,220 1,778,345 1,623,196
2011 13,352,306 1,907,511 1,687,826
2012 13,900,733 2,021,719 1,750,113
2013 14,086,199 2,141,846 1,822,346
2014 14,003,441 2,253,822 1,876,610
2015 13,936,791 2,323,808 1,918,918
Source: National Treasury (2016).
Spending on education and culture over the same period was represented mainly by tax expenditures, which increased by 595 per cent between 2002 and 2015. Examining the funds allocated to basic education, and higher technical education, we found that the former was the only category that had a smaller budget, while the others had increases of approximately 30 per cent each over the same period. Since 2002, the Ministry of Education has emphasised the democratisation of access to quality higher education, expanding the programmes on offer in federal universities, especially University for All (ProUni) and Science without Borders. Regarding technical education, the National Programme for Access to Technical Education and Employment (Pronatec) is of special importance. The programme’s main objective is to democratise access to technical education.
Expenditures on health policy also increased, however not as significantly as other areas, and declined in 2015. As a proportion of GDP, spending rose from 1.6 per cent to 2.1 per cent between 2002 and 2015. The main expenditure was on ambulatory, hospital and emergency care, which accounted for almost half of the budget, and the improvement of the subsidised

Working Paper10
National Health System (Sistema Único de Saúde—SUS). The second featured group is staff expenses, followed by health and community agents, both seeing a considerable upward trend after 2002 but falling again in recent years.
Data from the National Treasury (2016) show that direct expenses for employment policies more than doubled. In 2015 their share of GDP was 52 per cent higher than in 2002. Unemployment insurance accounted for the majority of total spending, while there was a reduction in salary bonuses between 2014 and 2015. Unemployment insurance increased during this period, representing 0.65 per cent of GDP in 2015, compared to 0.63 per cent in the previous year. This increase was directly linked to the value of the minimum wage, which has extremely positive indirect effects on all wages in the economy.
In conclusion, studies of social expenditures showed that between 2004 and 2014 there was a significant increase in some areas (especially social security and social assistance). The reversal of this scenario in 2015 is likely to have a negative impact on Brazil’s social policy performance.
2.2 ANALYSIS OF MAIN RESULTS
Given the evolution of expenditures presented in the previous section, the most recent studies indicate some interesting results related to five selected areas:
I. Health policy: According to the Ministry of Health (2015), the performance of the SUS in primary care through the National Programme for Improving Access and Quality of Basic Care (Programa de Melhoria do Acesso e da Qualidade na Atenção Básica—Pmaq) was positive: 83.6 per cent of users evaluated the service as good or very good, and 86 per cent of users would recommend the use of basic health care units. Medical training programmes are also highlighted, including the Professional Enhancement Programme for Primary Care Professionals (Programa de Valorização do Profissional de Atenção Básica—Provab), and the More Doctors (Mais Médicos) programme, created in 2013 and divided into three areas: improvement of infrastructure, provision of medical emergency services and training for SUS professionals. The programme has brought 18,240 physicians to 4,058 municipalities and 34 Special Indigenous Health Districts (Distrito Sanitário Especial Indígena—DSEI), and has expanded medical schools, with 5,306 new undergraduate courses in public and private institutions. Other prominent programmes are the Smiling Brazil (Brasil Sorridente) programme, which provides dental care to about 80 million people. In 2014 alone this programme was responsible for carrying out about 130 million procedures for dental and preventive care. In addition, there was pharmaceutical assistance through programmes such as the Popular Pharmacy (Farmácia Popular) and others that facilitated access to medicines.
Despite these advances, problems persist, as pointed out by Ribeiro et al. (2006), especially in the coordination and prevention of chronic diseases such as cholesterol, diabetes and high blood pressure. Information from DataSUS shows the number of hospital admissions of cancer patients into the SUS (per 10,000 people) rose from 15.9 in 1998 to 24.8 in 2012, and of diabetes patients from 6.4 to 7.3 over the same period. Additionally, it is necessary to integrate policies in the system, such as intersectoral action promoting the participation of other ministries in policy management. Successful alleviation programmes, such as the mobilisation of treatment for HIV/AIDS, can serve as examples.

International Policy Centre for Inclusive Growth 11
II. Education policy has achieved the greatest progress in recent decades, despite receiving a low proportion of GDP. According to IBGE (2015) and the Institute of Applied Economic Research (Instituto de Pesquisa Econômica Aplicada—Ipea—2010), the illiteracy rate among people aged over 10 fell from 9.2 per cent in 2008 to 7.9 per cent in 2013. School attendance became almost universal among children aged 10–14. Child labour among this age group decreased from 20 per cent in 1978 to 6 per cent in 2008. These indicators remained positive when analysing higher education through the Unified Selection System (Sistema de Seleção Unificada—Sisu) and ProUni, serving more than 1.4 million students (70 per cent of total scholarships) between 2004 and 2014. Additionally, the Higher Education Funding Programme (Fies) has benefited over 310,000 students since 2010, and the National Programme for Access to Technical Education and Employment (Programa Nacional de Acesso ao Ensino Técnico e Emprego—Pronatec) enrolled about 8.1 million students in technical and/or professional qualification courses between 2011 and 2014. In 2015 there were 1.3 million registrations.
As a benchmark of progress, the percentage of young people aged 20 or older with higher education rose from 8 per cent in 1988 to almost 15 per cent in 2008. Data from the National Institute of Educational Studies (Instituto Nacional de Estudos e Pesquisas Educacionais—INEP) show that student enrolment rose by 3.8 per cent between 2012 and 2013, reaching 7.3 million students in 2013. There are still challenges regarding the quality of education, especially regarding access to basic education and specific assistance to remote, difficult-to-access areas (such as the Amazon region and rural areas). The proportion of children attending day-care centres in these regions saw paltry growth, from18.1 per cent in 2008 to only 23.2 per cent in 2013.
III. Social security: According to Ipea (2010), the expansion of pension schemes has been remarkable, in both the number of beneficiaries and average value of benefits. In 1981, 6.5 per cent of the total population received pensions, whereas in the population aged 65 or older this proportion was about 70 per cent. The proportion of retired people in the overall population grew from close to 10 per cent in 1995 to 12 per cent in 2008. According to the 2013 Statistical Yearbook on Social Welfare (Anuário Estatístico da Previdência Social 2013), 5.2 million benefits were granted in 2013, of which 86.7 per cent were social security benefits, 6.5 per cent were accident benefits, and 6.8 per cent were social assistance benefits. This represented an increase over the previous year of 6.3 per cent in urban benefits and 0.2 per cent in rural benefits. Data collected by IBGE (2015) show that there was a total of 31 million active benefits in 2013, about 70 per cent urban and 30 per cent rural, mostly destined to the General Social Security regime.
The main concern is the demographic transition, as pointed out by Camarano and Kanso (2007) and Rock (2015). Population ageing will directly affect the pension budget and its management methods. Between 1980 and 2005, the fertility of Brazilian women halved, while the population group aged over 60 steadily increased. This may be characterised as an ageing population, both at the base of the pyramid (decreasing birth rate) and at the top (increasing life expectancy). As a result, the size of the economically active population is decreasing relative to the non-economically active population. According to data released by the Brazilian government in 2013, the labour force comprised about 103 million people, compared to 69 million non-economically active people who do not contribute to social security, decreasing overall revenue.

Working Paper12
IV. Social assistance: Among the most successful programmes, the Continuous Welfare Benefit (BPC) has had an overwhelmingly positive evolution since its formation in 1996. By 2009 it had grown almost tenfold, and in that year almost 3.2 million benefits were issued, reaching a transfer amount of USD11.4 billion—about 0.55 per cent of GDP.
The Bolsa Família conditional cash transfer programme is also especially worthy of note. It aims to improve access to basic social rights such as health, food, education and social assistance through its conditionalities. The various benefits granted under the programme are the Basic Benefit, the Variable Benefit, the Variable Youth Benefit and the Benefit for Overcoming Extreme Poverty. Beneficiary households living in extreme poverty can receive multiple benefits. According to the Ministry of Social Development and Fight against Hunger (Ministério do Desenvolvimento Social e Combate à Fome—MDS), there were over 6 million beneficiary households in 2004 and almost 14 million in 2016. According to Ipea, one of the positive impacts of the programme is that “spending on Bolsa Família represents only 0.4 per cent of Gross Domestic Product (GDP), but every US dollar spent on the programme becomes USD1.06 in household consumption, adding USD0.79 in GDP”.7
The relevance and international repercussions of these programmes led the MDS to turn its attention to the documentation and articulation of integrated control systems across the different programmes. In this sense, two initiatives are highlighted by MDS/SAGI (2014; 2015): first, the creation of the Single Registry of Beneficiaries (Cadastro Único) in 2001, an identification and socio-economic characterisation tool for low-income households in Brazil; and second, World Without Poverty, a joint initiative between Ipea, MDS, the World Bank and the International Policy Centre for Inclusive Growth (IPC-IG) forged in 2014, aiming to document, analyse and disseminate information regarding social technology management, design and implementation of social policies in Brazil, highlighting the country’s social policies and reinforcing their relevance for development more broadly.
V. Employment policies: For decades the Brazilian labour market was unable to generate sufficient jobs and of sufficient quality to absorb the growth of the economically active population. In the 1990s, unemployment rates grew, reaching 7 per cent of the economically active population. It was only after 2004-2005 that the unemployment rate fell from 10 per cent to less than 8 per cent, and average pay saw a real gain of 17 per cent between 2004 and 2008. Despite the global financial crisis that started in 2008, studies show that 3.2 million new jobs were created between 2011 and 2013, mostly in the range of up to two minimum wages (Ipea 2010).
According to Lúcio (2015) and Cardoso Jr. (2007), the labour market in Brazil employed 103 million people in 2013 and saw reductions in waiting periods to find work and inequality rates by more than 8 per cent between 2001 and 2008, similar to rates observed in developed countries in the mid-20th century. Additionally, according to official sources, the minimum wage showed real growth (above inflation) of 76 per cent between 2003 and 2015—from USD168.91 in 1995 to USD359.17 in 2015— which altered the consumption profile of the population and is recognised as one of the major causes for reducing inequalities and alleviating poverty. According to the World Bank (2015, 65), “about 60 percent of Brazilians climbed to a higher economic group, that is, a higher level of income, between 1990 and 2009. Overall, approximately 25 million Brazilians escaped extreme or moderate poverty.”

International Policy Centre for Inclusive Growth 13
It is necessary to mention the relevance of the services sector in the changing labour market, as well as the positive effects of the increase in minimum wage on retirement benefits, unemployment insurance and salary increases. Challenges remain regarding the wage divide; the International Labour Organization (ILO)8 estimates that women’s earnings amount to 77 per cent of men’s, in addition to the historic exclusion of Afro-Brazilian people and the overall lower wage levels in poor regions of the country, such as the North and the Northeast.
The analysis shows that many advances have been made during the past decade across all social policy areas. Therefore, it is necessary to understand how these policies have contributed to decrease poverty and inequality, by examining the actual effects and risks involved if such policies are hindered by national or international crises.
3 POVERTY AND INEQUALITY IN THE 2000s
Several studies, such as by Ipea (2006) and Smith (2006), analysed the data available on the evolution of income distribution. According to Silva (2013), these studies indicate that between 2001 and 2004 the degree of income concentration decreased by 4 per cent, and the Gini index decreased from 0.593 to 0.569. This highlights an improvement in the distribution of labour income, since this decrease represents half the total decline in household income inequality observed during the same period. Major causes of income inequality were educational level of workers, persistent gender inequality, regional disparities and the wage gap between formal and informal workers.
Studies show an annual increase in the income of the poorest people of about 7.2 per cent to 9.2 per cent between 2001 and 2004, with income growth for the poorest 20 per cent of the population that is 20 per cent above the income growth of the richest 20 per cent of the population—a significant response to extreme poverty. In addition, the decrease in the Gini index represents a 20 per cent increase in per capita income. This positive trend improved further over the next decade, as pointed out by Osorio (2015), Souza (2012) and MDS/SAGI (2015). The income of the poorest 20 per cent of the population increased by 127 per cent between 1995 and 2009, while the same indicator for the richest 20 per cent of the population increased by only 54 per cent. Extreme poverty during this period decreased from 16.4 per cent to 4.7 per cent of the population, while the Gini index decreased from 0.599 to 0.539, and real GDP growth in 2010 was over 7 per cent, an extremely positive scenario.
This positive trend continued after 2010. Table 5 illustrates the significant growth in average per capita household income, from USD11.13/day in 2004 to USD17.44/day in 2014. This reduction in inequality represented a significant step towards reducing poverty. According to data from MDS/SAGI (2015), the extreme poverty rate reached 2.5 per cent of the population in 2014 and, in numerical terms, the number of individuals living in extreme poverty decreased from 19.6 million to 5.1 million, with the largest declines happening between 2002 and 2009 (40 per cent) and between 2009 and 2014 (over 40 per cent), despite the 2008 international financial crisis.
According to Silva (2013), this change was very significant due to greater access to the labour market and the ensuing drop in unemployment rates. He highlights the improvement

Working Paper14
in the distribution of labour income, including the decrease in pay differentials by age and work experience. Soares (2006) reinforces these results, stating that by any measure, 2004 was one of the most egalitarian years regarding per capita household income since 1984, with a transfer of income from the richest to the poorest people.
TABLE 5Average household income per capita in Brazil, 2004–2014
Year USD/day (PPC, December 2011)
Mean Error (I.C. 95%)
2004 USD11.13 +/- 0.23
2005 USD11.80 +/- 0.25
2006 USD12.91 +/- 0.27
2007 USD13.27 +/-0.27
2008 USD13.89 +/-0.27
2009 USD14.28 +/-0.27
2011 USD15.14 +/-0.27
2012 USD16.33 +/- 0.33
2013 USD16.92 +/- 0.31
2014 USD17.44 +/- 0.32
Source: Osorio (2015).
Medeiros and Souza (2016) analyse inequality by observing tax data from Personal Income Tax Declarations (DIRPF) between 2006 and 2012, especially the influence of those at the top of the income pyramid (the richest) on the situation. After the necessary data adjustments, changes in results at the top of the distribution have major impacts on income inequality. This indicator is affected more by the richer than the poorer population, which could explain the slower than expected decrease in the Gini index over recent years compared to a significant drop in the number of poor and extremely poor individuals. The authors conclude: “the change caused by a modification in the richest 5 per cent is clearly stronger than the one caused by a group five times larger, the poorest 25 per cent” (Medeiros and Souza 2016, 14).
This scenario was also mentioned by Osório (2015). The Gini index fell from 0.570 in 2004 to 0.515 in 2014, a decrease in inequality of 9.7 per cent. When considering other, more sensitive indicators of the income of wealthy individuals, inequality rates could reach up to 21.4 per cent, more than 2 per cent per year. According to Medeiros and Souza (2016), to correct the underestimation of income declared by people at the top of income distribution, one possible methodology is to take into account the total underestimated income at the top income levels. Without correction, inequality based on data from the National Household Sample Survey (Pesquisa Nacional por Amostra de Domicilios—PNAD) decreases by 7 per cent; limiting correction to the richest 1 per cent, inequality decreases by 4 per cent; and if the correction is extended to the richest 5 per cent of the population, inequality registers a decrease of 2 per cent, reinforcing the understanding that rich people have a much more significant impact on inequality than poor people. However, the study

International Policy Centre for Inclusive Growth 15
does not intend to calculate the effects of incorrect estimation of income on poor people (the bottom of the pyramid), since the data capture limitations of the PNAD are well known.
In any case, Brazilian society in 2014 had a completely different profile from previous decades—especially the 1990s—with the consolidation of social policies (despite their low share of the federal budget), in addition to the significant appreciation of the minimum wage and lower unemployment rates, comprising a period of improvement in the quality of life of the population. However, political pressures and international crises have shown that after 2009, and especially after 2014, a negative atmosphere can threaten these policies. Serious political crises will inevitably worsen an economic crisis, as presented in the next section.
4 CURRENT SOCIO-ECONOMIC CONTEXT AND PERSPECTIVES
The 2007–2008 international financial crisis (unleashed by the US sub-prime mortgage crisis) quickly spread to other countries, due to globalisation and easier communication between markets and real sectors of the economy (especially through the reversal of expectations and the credit crunch).
According to Ipea (2011), the negative effects on the Brazilian economy were quickly reversed because of the favourable situation in last decade. This situation was also driven by resolutions implemented by the Central Bank to control the derivatives market and system liquidity, and the strengthening of the Brazilian domestic market (minimum-wage appreciation policy, low level of unemployment, ongoing social policies). In fact, the positive economic situation continued until June 2013, when a moderate decline in economic growth and in the support for social initiatives began. Signs of economic and political crisis in the Brazilian economy, with a clear downward trend after the re-election of then-president Dilma Rousseff in 2014, contributed to threaten a reversal of socio-economic growth.
The true causes of the resulting abrupt and profound reversal remains a topic under analysis by many researchers and will certainly will be the object of profound research in years to come. Thus, against this background of uncertainty, this paper aims to discuss certain points that may help elucidate this question, dividing the topic into different contexts (economic and political) and future prospects for social policy.
4.1 ECONOMIC CONTEXT
According to Singer (2015a; 2015b), the administrations of former President Luis Inácio Lula da Silva appear ‘virtuous’ due to the impressive performance of the international market, generating a considerable expansion of Brazilian international reserves (an increase from USD37.7 billion in 2002 to USD370 billion in 2015). This situation provided favourable internal conditions to decrease the public net debt (from 52 per cent of GDP in 2002 to 35 per cent in 2008), in addition to an expansion of credit, which increased from 26 per cent of GDP in 2002 to 45.2 per cent of GDP in 2010, according to Mora (2015).
However, from a structural point of view, these advances have not been sufficient to reverse the Brazilian exports tradition (agricultural commodities), perpetuating the decline in competitiveness of the Brazilian industry (especially in manufacturing) and contributing

Working Paper16
to the low gross fixed capital formation (about 15 per cent of GDP according to IBGE data,9 with many variations). Additional contributing factors are the lack of necessary reforms of the tax (i.e. progressive taxation), social security and political systems, among others.
According to Marques and Nakatani (2011), after the crisis, the government adopted a successful expansionist policy, as follows: a) increasing liquidity and reducing short-term interest rates (SELIC); b) maintaining social protection and public investment programmes, even during crises; c) providing temporary and permanent tax cuts; d) increasing the credit supply for public banks; and e) increasing public investment in housing. Although successful, these policies initiated a process of indebtedness for the Brazilian State, which was reversed at the end of 2010 by a restrictive macroeconomic policy regarding government spending, due to the realisation that the worst of the international crisis had passed and that the Brazilian economy could continue to grow without additional government stimulus.
This positive scenario meant that ex-President Lula left office in 2010 with 80 per cent approval rates, unprecedented in Brazilian history. Given the impossibility of his re-election after two consecutive terms, the people of the country elected his Worker’s Party (PT) colleague, Dilma Rousseff, into office. From a structural point of view, she pursued the same initiatives launched by the previous administration; however, international conditions worsened significantly. According to Singer (2015), the lack of effective policies to stimulate growth in the USA and the European Union, combined with a slowdown in Chinese growth, multiplied the negative impact of the initial actions of Dilma’s administration.
In 2012, the Brazilian government began an expansionary economic and monetary policy, supported by two pillars: lower interest rates and the reform of the energy sector. Also according to Singer (ibid.), the monetary policy increased compulsory deposits and the requirements for the capital of banks (forcing the decrease of spreads), discouraging the expansion of high-risk credit operations in conjunction with an increase in the Tax on Financial Operations (IOF), which slowed down credit growth and made the financial market lose profitability, contrary to investment expectations. As pointed out by Cagnin et al. (2013), from an international perspective these monetary measures, together with the devaluation of the Euro, contributed towards Brazil achieving international competitiveness.
The reform of the energy sector, which sought to boost the sector, reduced the price of energy by 20 per cent but at the same time significantly reduced the market value of energy companies, a situation that was compounded by the massive international decrease in oil prices (from USD123.15 per barrel in April 2011 to USD39.07 in May 2016). This had a direct impact on revenues from Petrobras, Brazil’s state-owned oil company, which further increased the instability of the market and the reversal of expectations. Figure 2 depicts data that help describe the instability that has permeated the entire Brazilian economy, generating a retraction of investments, a decrease in overall GDP (negative growth after 2014—a true recession), increasing interest rates to contain inflationary growth and rising public debt. The combination of these factors further decelerated investment, credit and productive activity, leading to increased unemployment in the country.
The productive sector did not respond to government investment, and the situation was made worse by the political crisis that will be discussed in the next section, adding to the negative expectations about the Brazilian economy. These factors, together with structural reforms not carried out and a continuous search for primary surplus, inflation control and

International Policy Centre for Inclusive Growth 17
floating exchange, increased the expectations for fiscal adjustment. This adjustment started in 2014, after the re-election of Dilma Rousseff, and focused on government expenditure and Brazil’s fiscal situation. Gobetti and Orair (2015) show that the net debt reached 33.2 per cent of GDP in 2015 (lower than the global average), but gross debt reached 66 per cent of GDP, leaving the country among the 29 per cent most indebted countries in the world. At the same time, the country’s primary result (which does not consider expenditures on interest) was in line with global trends, with a primary surplus of around 2 per cent of GDP in 2013 and deficits in the following years. This demonstrated a series of idiosyncrasies in the interactions of macroeconomic policies, with low levels of net debt and high gross debt.
FIGURE 2Select Brazilian economic indicators
-6
-4
-2
...
2
4
6
8
10 14
12
10
8
6
4
2,500,000
2,000,000
1,500,000
1,000,000
500,000
0
2
0
-2
-4
151413121110
98765
2004 2005 2006 2007 2008 2009 2010 2011 2012 2013 2014
2004
Dez/2014
Jan/2015
Feb/2015
Mar/2015
Apr/2015
May/2015
Jun/2015
Jul/2015
Aug/2015
Sep/2015
Oct/2015
Nov/2015
Dec/2015
Jan/2016
Feb/2016
Marc/2016
Apr/2016
May/2016
2005 2006 2007 2008
2009
2010 2011 2012 2013 2014 2015
2004 2005 2006 2007 2008 20102009 2011 2012 2013 2014 2015
2015
GDP percentage varia�on
Net debt from public sector (BRL in million)
GDP percentage varia�on
Interest rate - % year (selic - overnight)
Source: Brazilian Central Bank and IPEADATA.
Gobetti (2015) examines the adjustment of the public accounts, as the current close-to-zero primary surplus tends to increase public debt, and an increase of 1.5 to 2.3 percentage points of GDP will be necessary (depending on the growth situation, which is negative by all accounts). However, programmes already in place can hardly be maintained without increasing taxes, because a significant fraction of primary expenditure (about 55 per cent) is committed to the mandatory payment of benefits, pensions and retirement funds.
However, would it be possible to carry out the fiscal adjustment without further hurting the poorer population through increased taxes? According to Gobetti (ibid.), alternatives exist. If the Brazilian tax system seeks to be progressive, dividends should be taxed (Brazil is one of the few countries in the world where dividends are not taxed), which could generate an additional revenue of 0.7 per cent of GDP (assuming a 15 per cent tax rate). This would require considerable political effort to be approved in the short term.

Working Paper18
Even though this alternative route is possible, the current political climate (with Rousseff’s impeachment) seems to increasingly corroborate an extremely costly tax adjustment—rising indirect taxes, which would affect vulnerable people in the country and put extra strain on the ongoing sustainability of social policies. It is important to first understand the current political context and its impacts, to subsequently examine the future prospects for social policy.
4.2 POLITICAL CONTEXT
As previously mentioned, the Brazilian political context has significantly deteriorated during the last decade, especially after the departure of former President Lula. Singer (2015) and Benjamin (2016) state that, despite Rousseff belonging to the same political party as Lula and having been elected with the express support of the former President, the different political context since the first time Lula was elected in 2002 was evident. Back then, conservative parties and ideas were losing influence and popularity. This benefited Lula’s presidential run, being a candidate with a democratic social agenda who was supported by broad party coalitions guided by principles not always compatible with proposals from Lula’s own Worker’s Party, ensuring greater participation in both lower and upper Houses of Congress, leading to better conditions for governance and even garnering support from some sectors of the Brazilian financial market.
The ‘Letter for Brazilians’10 written by Lula in June 2002 was a notification (especially for the entrepreneurial and financial markets) that serious decisions were not taken in an autocratic way but, rather, together with networks representing the different sectors of the Brazilian economy. This attitude characterised both of his terms, leading to the so-called ‘coalition presidentialism’. According to Lopez, Bugarin and Bugarin (2015), in this type of presidentialism political coordination incorporated concessions to allied parties, not only regarding ministerial positions but also in ‘high-level management and advisory’ positions (DAS).
This style remained largely the same during Rousseff’s administration in 2010, since initially the government majority facilitated her relationship with the Lower House of Representatives. The average turnover rate of people in DAS positions is about 30 per cent across all levels (from 1 to 6), which could lead to harmful effects regarding the planning capacity and execution of public policies.
However, this study counts all the DAS hierarchical levels. According to Praça, Freitas and Hoepers (2012), levels 4 to 6 are the most important categories, with access to classified information and the possibility of directly influencing government decision-making. An exploratory analysis of these levels between 2010 and 2011 showed that appointees had a permanence rate of 58.61 per cent, demonstrating that these positions promote a renewal of leadership. The rotation of DAS personnel may be centred around other hierarchies and not necessarily on those who have the power to influence decision-making.
According to Singer (2015), allies of the party base demanded even more space in the government through the distribution of second-ranking government positions, and threatened to adopt significant measures that would have an impact on the budget if their demands were not met. Certain events worsened the political crisis (especially after Rousseff’s re-election in 2014), such as the media coverage of several cases of corruption in the higher echelons of the government. Within the first 14 months of her second term, Dilma removed eight of her administration’s 39 ministers due to corruption scandals.

International Policy Centre for Inclusive Growth 19
The situation escalated after economic policy failures (previously explained in this article) and as a result of the ‘Car Wash’ (Lava Jato) operation by the Federal Police, a deep-reaching investigation of corruption involving high-ranking members of the government, especially related to Petrobras, the national oil company. The federal government began to suffer attacks, not only from the media but also from their own allies, especially the Speaker of the Lower House, Eduardo Cunha. The apex of this crisis were allegations of improper conduct through illegal tax manoeuvres in the federal budget. This ultimately led to Rousseff’s impeachment in August 2016. She was replaced by Michel Temer, her Vice-President. Another relevant aspect of this political crisis was the removal of Eduardo Cunha from office. He was found guilty of corruption in December 2015.11
Therefore, three fundamental aspects of current Brazilian politics are relevant:
y an absence of political representation: the majority of the population does not feel represented by the current political system;
y ‘bipolarity’: there is a divide between those in favour of the impeachment process and those who accuse Rousseff’s political leaders of staging a coup in an open attack on the Brazilian Constitution; and
y the end of coalition presidentialism, which is proving unsustainable.
The government structure is shifting, with several changes in the composition of ministries. It is probable that the DAS appointees will also change, leading to further political instability regarding the social advances of the past decade.
The manifesto ‘A Bridge to the Future’,12 from Michel Temer’s PMDB party, details the measures that are necessary for re-establishing and stabilising public finances and economic growth. Among these, it states that it is necessary for the federal budget to “end pre-established constitutional bindings, as in the case of health and education expenditures” and “do away with all indexing, be it for wages, social security benefits and everything else”.
If such intentions come to fruition, social policy will be negatively affected. It is necessary to investigate the possible consequences for the future, although unstable economic and especially political contexts will be present in any projection. However, it is precisely in times of crisis, with rising unemployment and the need for budget cuts, that the poor population is much more vulnerable and, therefore, more dependent on social policy.
4.3 POSSIBLE CONSEQUENCES FOR BRAZILIAN SOCIAL POLICY
Brazil has seen significant advances in social spending, far beyond those of the Bolsa Família and other social protection programmes. Social security and employment policies, both influenced by an appreciation of the minimum wage, have had an extremely positive effect on reducing extreme poverty and inequality.
However, poverty and inequality cannot be fully solved without the intensification of these initiatives, in addition to other structural measures that are necessary for Brazilian social reorganisation. The economic measures put in place since 2014 have led to a reduction in expenditures in these areas, a deepening political crisis and budget cuts for social assistance and education, which seem likely to compromise social policy in future.

Working Paper20
This synthesis demonstrates that the fiscal adjustment strategies will probably encompass all areas except structural reforms (among them progressive tax reform). It is still too soon for definitive conclusions, given that the economic and political situations are extremely uncertain, but the new government plan seems to consider a reduction in social expenditures as a necessary sacrifice for public financial health and subsequent economic and social advancement. However, it is possible that the poorest of the Brazilian population will be affected immediately, with a chance of the previous decade’s efforts to alleviate poverty being completely reversed.
We present this plausible hypothesis: if since 2014 the main fiscal adjustment variable has been the level of investment, the tendency is to further reduce expenditure on Brazilian social welfare, which may negatively affect the current structure of social protection, depending on how the measures are implemented over time.
5 CONCLUDING REMARKS
The purpose of this article was to provide a summary of Brazilian social policy and its future prospects, with a focus on health, education, social security, social assistance and employment policies. The research and data presented herein demonstrate a significant evolution of these policies between 2004 and 2010, due in large part to the continuous appreciation of the minimum wage and the expansion of social programmes such as Bolsa Família, among others. In addition, educational policies stand out, especially in higher education (most notably Pronatec, Science without Borders and ProUni, among other programmes).
The most significant results of social policies over this period were in poverty alleviation, leading to millions of people exiting poverty. Despite this great progress, services still need to be improved, especially regarding health and education. This would require better resource management.
However, potentially reversing this process, the international financial crisis in 2007–2008 spilled over into productive areas, reversing China’s demand for commodities exported from Brazil and hindering the latter’s ability to generate primary surpluses and maintain positive economic results. The government tried countercyclical measures to combat this crisis, but the internal market did not respond as expected due to the low expectations of the international market and the political deterioration of former President Dilma Rousseff’s administration. These two factors contributed to a severe political crisis, compounded by allegations of corruption against members of the ruling Worker’s Party. This recently culminated in Rousseff’s impeachment and her replacement by President Michel Temer.
From an economic perspective, the new government is set on a recessionary fiscal adjustment project, probably leading to budget cuts in priority social areas such as education and health, among others, that would probably negatively affect the previous cycle of progress. The new government plan indicates that economic adjustment should be expanded and intensified in all areas, with a clear preference for reducing public spending.
Definitive conclusions are impossible in this uncertain climate, but many researchers agree that the country has to carry out long overdue structural reforms, especially progressive tax and political reforms. However, these policies do not seem to be in the new government’s plans. Unfortunately, the prospects for social policy are dire, and it is possible that a reversal of the positive cycle experienced between 2004 and 2010 and a contraction of key projects in all areas will occur, significantly affecting the poorest populations of Brazil.

International Policy Centre for Inclusive Growth 21
REFERENCES
Benjamin, C. 2016. “O Golpe é Outro: Programa que será Imposto ao País não teria Aceitação nas Urnas.” Revista Piauí 116, May.
Cagnin, R.F., D.M. Prates, M.C.P. Freitas, and L.F. Novais. 2013. “A Gestão Macroeconômica do Governo Dilma.” Revista Novos Estudos 97.
Camarano, A.A., and S. Kanso. 2007. “Dinâmica da População Brasileira e Implicações para a Previdência Social.” Previdência no Brasil: Debates, Dilemas e Escolhas. Brasília: Instituto de Pesquisa Econômica Aplicada, Chapter 3.
Cardoso Júnior, J.C. 2007. “De Volta para o Futuro? As Fontes de Recuperação do Emprego Formal no Brasil e as Condições para a sua Sustentabilidade.” Texto para Discussão, No. 1310. Brasília: Instituto de Pesquisa Econômica Aplicada.
Castro, J.A., J.A.C. Ribeiro, J.V. Chaves, and B.C. Duarte. 2012. “Gasto Social Federal: Prioridade Macroeconômica no período 1995–2010.” Nota Técnica, No. 9. Brasília: Instituto de Pesquisa Econômica Aplicada.
Da Silva, F.J.F., and M.A. da Silva. 2011. “Desigualdade de Renda do Trabalho dos Setores da Economia Brasileira, Nordestina e Pernambucana.” Revista Economia e Desenvolvimento 10(2).
Gobetti, S.W. 2015. “Ajuste Fiscal no Brasil: Os Limites do Possível.” Texto para Discussão, No. 2037, Brasília: Instituto de Pesquisa Econômica Aplicada.
Gobetti, S.W., and V.L. Almeida. 2016. “Uma Radiografia do Gasto Público Federal entre 2001 e 2015.” Texto para Discussão, No. 2191. Rio de Janeiro: Instituto de Pesquisa Econômica Aplicada.
Gobetti, S.W., and R.O. Orair. 2015. “Fatos e Versões sobre a Política Fiscal.” Revista de Conjuntura XIV(56), May/August. Brasília: Conselho Regional de Economia do Distrito Federal.
IBGE. 2015. Brasil em Números, Vol. 23. Rio de Janeiro: Instituto Brasileiro De Geografia e Estatística.
Ipea. 2011. “O Brasil Ante a Crise Financeira Internacional.” Comunicados do IPEA, No. 107. Brasília: Instituto de Pesquisa Econômica Aplicada.
Ipea. 2010. “Balanço da Política Social no Novo Milênio.” Perspectivas da Política Social no Brasil, Vol. 8. Brasília: Instituto de Pesquisa Econômica Aplicada.
Ipea. 2006. “Sobre a recente queda da desigualdade de renda no Brasil.” Nota técnica. Brasília: Instituto de Pesquisa Econômica Aplicada.
Lúcio, C.G. “Desafios para o Crescimento e o Emprego.” Revista Estudos Avançados 29(85).
Lopez, F., M. Bugarin, and K. Bugarin. 2015. “Mudanças Político-Partidárias e Rotatividade dos Cargos de Confiança (1999–2013).” Cargos de Confiança no Presidencialismo de Coalizão Brasileiro. Brasília: Instituto de Pesquisa Econômica Aplicada.
Marques, R.M., and P. Nakatani. 2011. “A Crise Mundial e a Economia Brasileira.” Revista Olhar da História 16, July.
Medeiros, M., and P.H.G.F. Souza. 2016. “A Estabilidade da Desigualdade no Brasil entre 2006 e 2012: Resultados Adicionais.” Texto para Discussão, No. 2170. Rio de Janeiro: Instituto de Pesquisa Econômica Aplicada.
Ministério da Saúde. 2015. Planejamento Estratégico do Ministério da Saúde, 2011–2015, 5th edition. Brasília: Secretaria Executiva, Departamento de Avaliação do SUS, Ministério da Saúde.

Working Paper22
MDS/SAGI. 2014. “Documentação de Programas e Ferramentas Sociais na SAGI: A experiência com o Cadastro Único.” Estudo Técnico, No. 20/2014. Brasília: Secretaria de Avaliação e Gestão da Informação, Ministério do Desenvolvimento Social e Combate à Fome.
MDS/SAGI. 2015. “Mudança Social no Brasil: Um Panorama Descritivo de 1992 a 2014 a partir de Diferentes Indicadores.” Estudo Técnico, No. 10/2015. Brasília: Secretaria de Avaliação e Gestão da Informação, Ministério do Desenvolvimento Social e Combate à Fome.
Mora, M. 2015. “A Evolução do Crédito no Brasil entre 2003 e 2010.” Texto para Discussão, No. 2022. Rio de Janeiro: Instituto de Pesquisa Aplicada.
National Treasury. 2016. Gasto Social do Governo Central, 2002 a 2015. Brasília: National Treasury.
Osório, R. 2015. “Desigualdade e Pobreza.” Nota Técnica, No. 22: PNAD 2014 – Breves Análises. Brasília: Instituto de Pesquisa Econômica Aplicada.
Praça, S., A. Freitas, and B. Hoepers. 2012. “A Rotatividade dos Servidores de Confiança no Governo Federal Brasileiro, 2010–2001.” Revista Novos Estudos 94, November.
Ramos, L. 2015. “Breve Análise dos Dados da PNAD 2014 para o Mercado de Trabalho.” Nota Técnica, No. 22: PNAD 2014 – Breves Análises. Brasília: Instituto de Pesquisa Econômica Aplicada.
Ribeiro, M.C.S.A., R.B. Barata, M.F. Almeida, and Z.P. Silva. 2006. “Perfil sociodemográfico e padrão de utilização de serviços de saúde para usuários e não-usuários do SUS – PNAD 2003.” Revista Ciência e Saúde Coletiva 11(4): 1011–1022.
Rocha, F.R.F. 2015. “A Previdência Social no Brasil: Uma Política em Reestruturação.” Revista Temporalis 15(30), July/December.
Santos, E.R., and M.F. Nunes. 2015. “Capital social e políticas públicas: um estudo comparado no Vale do Rio dos Sinos.” Revista de Administração Pública 50(1): 129–149, January/February.
Silva, P.A.O. 2013. “Os Avanços e os Limites da Queda Recente da Desigualdade no Brasil.” Revista de Estudos Sociais (UFMT) 15: 33–57.
Singer, A. 2015a. “O Lulismo nas Cordas.” Revista Piauí 111, December.
Singer, A. 2015b. “As Democracias Passam por um Momento Difícil.” Revista Desafios do Desenvolvimento 86. Brasília: Instituto de Pesquisa Econômica Aplicada.
Soares, S.S.D. 2006. “Distribuição de renda no Brasil de 1976 a 2004 com ênfase no período entre 2001 e 2004.” Textos para discussão, No. 1166. Brasília: Instituto de Pesquisa Econômica Aplicada.
Souza, P.H.G.F. 2012. “Poverty, Inequality and Social Policies in Brazil, 1995–2009.” Working Paper, No. 87. Brasília: International Policy Centre for Inclusive Growth.
World Bank. 2015. Shared Prosperity and Poverty Eradication in Latin America and the Caribbean. Washington, DC: World Bank. Accessed 14 March 2017. <https://openknowledge.worldbank.org/handle/10986/21751>.

International Policy Centre for Inclusive Growth 23
NOTES3. According to Osorio (2015, 1), “household per capita income is not a perfect variable... despite the variation over time, the population share in households with ignored or no income is small. Thus, it does not affect the averages. However, those without income, or ‘zero income’, significantly affect the estimates of extreme poverty. There is no hard rule to deal with ignored incomes (...)Ipea, following IBGE’s example, when developing income-based indicators for monitoring inequality and poverty, chooses simplicity: households and people with ignored income are not considered, and no treatment is given to zero-income households.”
4. The Gini index is an indicator that represents the degree of income concentration within a group, pointing out the difference between the incomes of the poorest and the richest. It can range from 0 to 1 (closer to 0 being less unequal, and closer to 1 being more unequal).
5. One of most used international poverty lines is the one that was developed for the Millennium Development Goals and was updated by the World Bank in 2015: the international poverty line of USD3.10/day, based on the PPC in 2011.
6. For more information about Rousseff’s impeachment, see <http://www.nytimes.com/2016/09/01/world/americas/brazil-dilma-rousseff-impeached-removed-president.html?_r=0>.
7. For more information, see <http://www.valor.com.br/brasil/3305466/ipea-cada-r-1-gasto-com-bolsa-familia-adiciona-r-178-ao-pib>.
8. For more information, see <http://www.segs.com.br/seguros/13722-oit-desigualdade-de-genero-no-mercado-de-trabalho-global.html>.
9. Data available at <http://seriesestatisticas.ibge.gov.br/series.aspx?vcodigo=ST37>.
10. For more information, see <http://www.cfr.org/brazil/lulas-surprise/p6062>.
11. For more information, see <http://www.peoplesworld.org/article/mastermind-of-brazilian-impeachment-saga-arrested/>.
12. For more information, see <http://www.bbc.com/news/world-latin-america-36070366>.

International Policy Centre for Inclusive Growth (IPC-IG)
SBS, Quadra 1, Bloco J, Ed. BNDES, 13º andar70076-900 Brasília, DF - BrazilTelephone: +55 61 2105 5000
[email protected] ■ www.ipc-undp.org