working paper 32 water for rural development
TRANSCRIPT

Water forRural Development
David Molden, Upali Amarasingheand Intizar Hussain
WORKING PAPER 32
Postal Address
Location
Telephone
Fax
Website
P O Box 2075ColomboSri Lanka
127, Sunil MawathaPelawattaBattaramullaSri Lanka
94-1-867404, 784084
94-1-866854
www.iwmi.org
SM
IWMI is a Future Harvest Centersupported by the CGIAR
SM
Water ManagementI n t e r n a t i o n a l
I n s t i t u t eWater ManagementI n t e r n a t i o n a l
I n s t i t u t e
Background Paper on Water forRural Development Preparedfor the World Bank

Working Paper 32
WWWWWater for Rural Developmentater for Rural Developmentater for Rural Developmentater for Rural Developmentater for Rural Development
Background Paper on Water for Rural DevelopmentPrepared for the World Bank
International Water Management Institute
David MoldenUpali Amarasinghe
andIntizar Hussain

IWMI receives its principal funding from 58 governments, private foundations, and
international and regional organizations known as the Consultative Group on International
Agricultural Research (CGIAR). Support is also given by the Governments of Ghana,
Pakistan, South Africa, Sri Lanka and Thailand.
This report was prepared by the IWMI researchers, David Molden, Upali A. Amarasinghe, andIntizar Hussain and it is based on past research work of IWMI. The authors wish to thankDr. Eugene Terry and other staff of the World Bank and Drs. Frank Rijsberman, Tushaar Shah,Wim van der Hoek, Barbara van Koppen, M. Samad and Abdul Kamara of IWMI for their valuablecomments and inputs.
The authors: David Molden is Principle Researcher and Leader, Comprehensive AssessmentProgram, Upali A. Amarasinghe is Senior Regional Researcher and Intizar Hussain is SeniorResearcher all of the International Water Management Institute.
Molden, David; Upali Amarasinghe; and Intizar Hussain. 2001. Water for rural development:Background paper on water for rural development prepared for the World Bank. Working Paper32. Colombo, Sri Lanka: International Water Management Institute.
/ water management / irrigation management / rural development / water resources development/ small- scale systems / land management / groundwater / environment / health / water policy /institutions / water supply / water demand / water allocation / crop yield / cereals / food production/ food security / crop production / population growth / South Asia / East Asia / Central Asia /Europe / Pacific Islands / Africa / Middle East / North Africa / Latin America / Caribbean /
ISBN 92-9090-459-3
Copyright © 2001, by IWMI. All rights reserved.
Please direct inquiries and comments to: [email protected]

iii
Contents
Introduction .............................................................................................................................. v
Part I
Issues in Water Management for Agriculture for the World Bank
Strategy Paper on Water for Rural Development................................................................. 1
Introduction ....................................................................................................................... 3
Different Situations, Different Needs ................................................................................... 4
Key Areas for Interventions in Water Resources Development and Management .............
for Rural Development..................................................................................................... 5
Recommendations ................................................................................................................. 14
Part II
Background Paper on Water for Rural Development.................................................. ........ 19
Global Water Resources ........................................................................................................ 21
Past Developments and Trends ............................................................................................. 24
Water Supply and Demand 1995–2025: Issues and Scenarios ............................................ 43
Water for Rural Development ............................................................................................... 56
Summary ....................................................................................................................... 59
Appendixes ....................................................................................................................... 68
Literature Cited ..................................................................................................................... 89


v
Introduction
This paper on Water for Rural Development is divided into two parts. The first part outlines themost important issues from IWMI’s point of view on water for rural development, with a focuson developing countries. This part identifies, discusses and provides recommendations for keyareas for interventions in water resources development and management in the context of ruraldevelopment.
The second part of the document provides analyses of present and future water resources inthe World Bank’s defined regions. This part is divided into four chapters followed by a summaryof the findings. The first chapter assesses global water resources and regional variations of inter-nally renewable water resources and water withdrawals. The second chapter provides estimatesof past trends in population, food production and consumption, and irrigation development, in-cluding growth in cereal yield and areas at the world and regional levels. The third chapter ana-lyzes and discusses future water and food supply and demand scenarios (1995 to 2025) usingIWMI’s PODIUM model. The fourth chapter briefly outlines the importance of water for ruraldevelopment. The last section summarizes the study findings and important issues.

1
PPPPPARARARARART IT IT IT IT I
Issues in Water Management for Agriculture for the World BankStrategy Paper on Water for Rural Development

2

3
Introduction
With increasing water scarcity, it is essential to view water allocation and distribution in ruralareas from the basin perspective. Traditionally, in the water sector, much of the focus on ruraldevelopment has been aimed at individual systems or communities. This focus has to change tocope with wider issues of competition for water, particularly for water of good quality.
Looking at water from a basin perspective means that we have to look not only at water supplyand demand for all users but also at institutional issues involved in the provision of services. Theissue may best be exemplified by the issue of “scaling-up,” whereby each separate water use, byitself, may not have a noticeable impact, but as the number of such water uses intensifies, theoverall impact on water resources and other water users becomes significant.
In light of these issues, safeguarding and developing water resources for rural developmentrequire a combination of inputs or interventions in three major dimensions:
• The upstream-downstream dimension, which recognizes that each water use or water userpotentially impacts on all the other uses and users.
• The institutional dimension that needs to consider how planning, policies, rights,regulations, monitoring, water user organizations, etc., need to be designed andimplemented to enhance the effective functioning of organizations at basin and systemlevels as well as at the level of individual uses or users.
• The provision of services to different water uses and users so that water is delivered witha highly reliable level of service to encourage productive water use, and that this is madeconsistent with other service inputs such as credit, technology and marketing.
The basin perspective allows us to look with greater clarity at the importance of upstream-downstream issues. The most obvious element is that there is some form of equitable allocationpolicy maintained throughout the basin that recognizes existing uses, and yet has the ability toreallocate water amongst uses to meet emerging needs. Besides the quantity of water supply, thereare other issues that emerge with increasing water scarcity:
• Deterioration of water quality, either from agricultural or urban-industrial complexes, thatreduces the value and utility of water to downstream users.
• Ensuring water supplies of adequate quantity and quality for sensitive environmental areas,including such issues as wetland and wildlife protection and containment of salinity intrusion.
• Opportunities and threats posed by reuse of wastewater for irrigation or consumption.
• Meeting the water needs of the rural poor who, at present, have insufficient access towater.

4
• Impacts of upstream water-harvesting techniques on basin-level hydrology.
• Development and subsequent overdevelopment of groundwater resources to compensatefor decreased availability of surface water.
The institutional dimension means that both suppliers and users of water need to be involvedat the basin level for effective planning, implementation, regulation and for other water-management functions. Previous moves towards more localized participatory involvement in thesetasks also need to be scaled up to the basin level to have groups dealing with basin-scale issues.A clear definition of property rights and mechanisms of enforcement of defined rights becomesmore important with increasing scarcity. Single-purpose line agencies need to have greaterinteraction or there need to be more comprehensive management organizations at the basin levelthat can address the complexity of interactions between different uses and users.
Provision of services for water users needs to be viewed from a different perspective.Traditionally, service provision has been geared for a single or specific water use, dealing withsuch aspects as the reliability of irrigation deliveries, power, technology, credit, marketing,infrastructure, etc. While much needs to be done still to make such services more effective, theyalso need to be addressed from the basin perspective to ensure that improvement of services atone location or for one set of users does not impinge on the potential of other uses and users.
Different Situations, Different Needs
Through water-scarcity studies, such as those presented in this document, we see that there aredifferent needs for different areas. Three useful categorizations help in understanding thesedifferences:
• water-scarce areas
• high potential areas
• high need areas
Water-Scarce Areas
Areas of physical water scarcity cover much of the globe, including MENA (Middle East andNorth African) countries, and large parts of SA (South Asia), China, and ECA (Europe and CentralAsia), i.e., those areas shown in red on IWMI’s water scarcity map. These countries do not haveadditional water that can be tapped for more development. Water-related problems includegroundwater overdraft and pollution that threaten long-term productivity of water. Challenges arereallocating water from lower-value, typically agriculture uses, to higher-value uses in industries,cities and high-value agriculture. This must be done in a manner where poor people can takeadvantage of the increase in the value of water, and where they do not lose out because water istaken away from them. Managing and designing for water savings in agriculture to free up waterfor cities, industries and environment are key challenges for many water-stressed areas.

5
High Potential Areas
Fortunately, water is not a limiting resource in many areas where there is much remaining scopeto use water development to help poor people. The Ganges basin, home to 500 million people,many of whom are amongst the poorest in the world, is an example of a high potential area. Muchof the Mekong river basin can also be classified as a high potential area. Those areas on IWMI’swater scarcity map in SA, East Asia and Pacific (EAP) and Latin America and the Caribbean(LAC), classified as economically water scarce, are typically high potential areas. In the Gangesbasin, there is huge scope remaining to increase production. The problem, of course, is that duringa few days of the year, there is too much water, while during most of the year, water supplies areinsufficient. Many argue for more large dams, while others look to groundwater and alternativemeans of storage to help in this area. There is scope for investment in these areas, but these shouldbe made with an understanding of basin-wide impacts of various development alternatives.
High Need Areas
For many people in sub-Saharan Africa, water scarcity is a daily reality. But in many areas thereare utilizable water resources that could be tapped. IWMI has termed these regions economicallywater scarce because these countries do not have the economic, financial and skilled humanresources to tap this water supply. In these areas, there is a great need for water resourcesdevelopment but the difficulty in doing so is also quite great.
The fact that much of the water serves important ecological functions is not only a majordifficulty but also a major point of conflict. Legitimate concerns over water development mustdeal with equally legitimate concerns over the environment. Oftentimes, those in favor of waterfor the environment are at loggerheads with those in favor of water for agriculture. Meanwhile,we are far from an optimal solution, and people suffer. A major question in this area is how touse water for agricultural and rural development in a way that meets ecological needs. Much moreinformation is required, and much more dialogue between these two groups is required to meetneeds in these areas.
Key Areas for Interventions in Water Resources Management for Rural Development
To address these issues, IWMI has organized its research program around five key themes. Wefeel that these are the most critical areas in water resources management for rural development:
• Integrated Water Management for Agriculture
• Smallholder Water and Land Management Systems
• Groundwater
• Environment and Health
• Water Resource Institutions and Policies
The following discussion is based on the experience gained from IWMI’s work andinvolvement with other key players in developing countries including farmers, managers,researchers and policy makers. It touches on these five thematic areas, which we feel are veryimportant for the World Bank’s strategy.

6
Integrated Water Resources Management for Agriculture
Reinventing irrigation. There are considerable concerns about the performance of irrigatedagriculture. In many cases, we know that promised goods have not been delivered—productivityremains low, the environment suffers, and issues of poverty have not been adequately addressed.We also know that food security is essential for a growing population in spite of increasing waterscarcity and land degradation. And we know we have to preserve nature, and make sure ourenvironment sustains future generations.
It is time to put the pieces together to carefully assess the benefits and costs of irrigation.IWMI, with key partners, proposes to perform a comprehensive assessment of the benefits andcosts of water management for agriculture. The result will provide key insights into the mostpressing question about water: How much irrigation do we really need? How much irrigationand how we do irrigated agriculture will have profound impacts on people and nature, and aresome of the most pressing natural resources questions of the early twenty-first century.
The face of irrigated agriculture is changing rapidly, but the public perception of irrigationremains as one of dams and canals. Many new innovations are being realized in the areas ofinstitutions, practices for improving the productivity of water, water-management systems forsmallholders such as water-harvesting structures and low-cost drip lines, and in the ways water ismanaged at the basin scale. There is a need to change the public perception about this newirrigation. Yet there remain serious issues of poverty, groundwater depletion and environmentalsecurity that we will address more in this document. If these are successfully addressed, we willhave reinvented both irrigation and the way we use water for agriculture.
Increasing the productivity of water. It is useful to shift thinking from increasing the productivityof land to increasing the productivity of water where water-scarce areas are concerned. For eachdrop of water, we should aim at increasing the value added and welfare derived from its use. Inagriculture, this means promoting practices that achieve more output per unit of water consumedby agriculture. In the context of a river basin, this means ensuring clean water for drinking andindustry. It means wise allocation between sectors and uses of water. It means ensuring enoughwater for the environment.
One of the best ways to free up water for other uses is to improve the productivity of waterin agriculture. With more crop from each drop, there is a need for fewer drops. In agriculturethere is considerable scope remaining to increase the productivity of water. Productivity gainscan be achieved from improved agricultural practices and improved water delivery services (seebox). Irrigated agriculture has received a decreasing amount of attention by the internationalassistance community because of disappointing performance of irrigation systems, increasinginterests in the environment and the doubts about the linkage between irrigation development andpoverty alleviation. But putting productivity of water in the basin perspective, we see that it haseverything to do with helping the environment and helping poor people get the most out of alimited resource. Increasing agricultural productivity of water will free up more water for nature,it will reduce scarcity by giving more opportunities to poor, and with a poverty focus, it canimprove their incomes and livelihoods.
A basin perspective on water savings. Essentially, the term “water savings” means freeing up waterfrom non-beneficial uses and providing it to another more productive use. In agriculture, we wouldlike to increase production on existing lands, and yet be able to release water for use by theenvironment, cities, or by more agriculture. In agriculture, it is often possible to identify means

7
Box 1. Means for saving water and increasing the productivity of water.
Increasing the productivity per unit of water consumed
• Changing crop varieties to new crop varieties that can provide increased yields for each unit of waterconsumed, or the same yields with fewer units of water consumed.
• Crop substitution by switching from high- to less-water-consuming crops, or switching to crops withhigher economic or physical productivity per unit of water consumed.
• Deficit, supplemental, or precision irrigation. With sufficient water control, higher productivity canbe achieved using irrigation strategies that increase the returns per unit of water consumed.
• Improved water management to provide better timing of supplies to reduce stress at critical crop-growth stages leading to increased yields or by increasing water supply reliability so that farmersinvest more in other agricultural inputs leading to higher output per unit of water.
• Optimizing non-water inputs. In association with irrigation strategies that increase the yield per unitof water consumed, agronomic practices such as land preparation and fertilization can increase thereturn per unit of water.
Reducing non-beneficial depletion
• Lessening of non-beneficial evaporation—by reducing:
∗ evaporation from water applied to irrigated fields through specific irrigation technologies suchas drip irrigation, or agronomic practices such as mulching, or changing crop planting dates tomatch periods of less-evaporative demand.
∗ evaporation from fallow land, decreasing the area of free water surfaces, decreasing non- orless-beneficial vegetation and controlling weeds.
• Reducing water flows to sinks—by interventions that reduce irrecoverable deep percolation and surfacerunoff.
• Minimizing salinization of return flows—by minimizing flows through saline soils or through salinegroundwater to reduce pollution caused by the movement of salts into recoverable irrigation return flows.
• Shunting polluted water to sinks—to avoid the need to dilute with freshwater, saline or otherwisepolluted water should be shunted directly to sinks.
• Reusing return flows.
Reallocating water among uses
• Reallocating water from lower- to higher-value uses. Reallocation will generally not result in anydirect water savings, but it can dramatically increase the economic productivity of water. Becausedownstream commitments may change, reallocation of water can have serious legal, equity and othersocial considerations that must be addressed.
Tapping uncommitted outflows
• Improving management of existing facilities to obtain more beneficial use from existing water supplies.A number of policy, design, management and institutional interventions may allow for an expansionof irrigated area, increased cropping intensity or increased yields within the service areas. Possibleinterventions are reducing delivery requirements by improved application efficiency, water pricing,and improved allocation and distribution practices.
∗ Reusing return flows through gravity and pump diversions to increase irrigated area.∗ Adding storage facilities so that more water is available for release during drier periods. Storage
takes many forms including reservoir impoundments, groundwater aquifers, small tanks and ponds onfarmers’ fields.

8
to decrease nonproductive uses of water, thus releasing water for other uses. Reducing flows tosinks or non-beneficial evaporation, for example from waterlogged areas, will lead to water savings.In highly water-stressed areas, such as the Punjab in India or Pakistan, the north China Plains,and Egypt’s Nile Valley, only very aggressive water-conservation practices will free up more water.
A common mistake is to justify projects on the claim of water savings. This is because projectplanners use a narrow point of view of efficiency at the farm or irrigation-system level that ignoreswater recycling and reuse, phenomena that are prevalent in many systems. Oftentimes, byincreasing efficiency at the farm level the amount of water for downstream uses is reduced becauseadditional water gained by the farm-level efficiency increases is used upstream. As discussed below,seepage from canals and fields is often a major source of domestic water, and increasing efficiencyby reducing seepage can have negative health impacts. The major recommendation then is to bewary of claims for water savings based only on irrigation-system or field-level studies. Only abasin analysis will reveal whether water savings are really possible.
Improving irrigation services. Providing reliable irrigation services is the key to improving theperformance of irrigation. With a reliable service, farmers invest more in improved technologiesand practices, and are thus able to produce more. With unreliable services, farmers choosestrategies that minimize risks, and are thus not necessarily profitable or productive. And farmersare rightfully not willing to pay for poor services.
Many past efforts in irrigation have focused on rehabilitation and modernization, or providinginfrastructure to make sure that there is sufficient capacity to control water to provide moreflexibility in supply to the farmers. We feel that in many poorly performing irrigation systems,providing a stable, predictable water environment is a first priority, far above providing the capacityfor flexible services. This may initially translate into relatively simple operating procedures andstructures. When communities get irrigation water under control, the next payoff will come interms of the demand and implementation of more flexible systems.
How can reliable services be realized? Building accountability mechanisms between serviceproviders and users is a first key step. This requires clear rules for the provision of services atdelivery points between providers and users, and mechanisms for recourse in case services arenot provided per agreements. Many levels of service, from delivering water at a fixed amount ofwater on a rotational basis, to providing water on demand, are capable of supporting productiveagriculture. When moving to more on-demand systems, costs and complexity of operations andmaintenance typically increase. With the participation of service providers and users, it is importantto develop clear definitions on the desired level of service. In previously dysfunctional areas,targeting for simple, low-cost service specifications is a good strategy for achieving reliableservices. Infrastructure design follows the service specifications. It should not dictate the type ofservice provision. In the design of new and modernized systems, many mistakes are made in designand construction that cause irrigation systems to be unmanageable.
In summary, bank assistance should target reliable delivery services by building accountabilitymechanisms, clarifying the level of services to be provided with the participation of serviceproviders and users, and by supporting acceptable designs that will support the level of servicesdesired.
It is commonly noted that farmers with access to pumping technology are more productivewith water. The explanation is that when farmers own pumps they are both the service providersand the users. The service is reliable and farmers can get water when they want. Because pumpingof groundwater is so important in irrigated agriculture, it will be discussed in more detail below.

9
Rain-fed agriculture. A popular idea is to concentrate food production in rain-fed, rather thanin irrigated areas. The total cultivated area of the world is about one billion hectares, of whichonly about one-third is irrigated. Thus, a 10-percent increase in the productivity of rain-fedagriculture would have twice the impact as the same increase in irrigated agriculture. As thebeneficial impact would be largely on poor farmers in marginal areas, this is an enormouslyattractive idea.
It should be recognized that this is by no means a new idea. The goal of increasing productivityof marginal rain-fed areas has been energetically pursued, using all the tools of agronomic science,for at least a century, with highly disappointing results. We believe that the sciences andtechnologies of agronomy and water management have now advanced to the point where thereare grounds for optimism in this field—and, indeed, there are notable cases of success on theground.
However, under specific agroclimatic conditions, small-scale farming can be productive inmarginal rain-fed areas through supplemental irrigation. Of course, all irrigation is supplementalirrigation because it is designed only to “top up” effective precipitation on the crops. Butsupplemental irrigation is a technique specifically designed for water-scarce regions, where scarcewater is stored and used only in limited quantities at the critical growth stages of crops. In manyareas, for example, there is sufficient average rainfall over the crop season to obtain good yields,but yields are greatly reduced by short-term, 15- to 30-day, droughts at critical growth stages ofthe plant. Water stress at the flowering stage of maize, for example, will reduce yields by 60percent, even if water is adequate during all the rest of the crop season. If there is a way to storesurplus water before these critical stages and apply it in these stages if the rain fails, cropproduction would increase dramatically. This is such an important area that IWMI has devotedthe entire theme of smallholder water and land management systems, discussed more below, toaddress this issue.
Smallholder Water and Land Management Systems
Where other conditions are favorable, smallholders have shown themselves to be willing to adoptnew technologies that can help them increase production even when water is scarce. In recentyears, there has been an upsurge in adoption of technologies such as treadle pumps, low-cost bucketand drop lines, small portable pump sets, supplemental irrigation, sustainable land managementpractices in rain-fed areas, recharge and use of groundwater and water-harvesting systems. Thiswide range of technologies, collectively referred to as smallholder water and land managementsystems, enable producers to access hitherto unusable water supplies and to compensate for poorlevels of service in large-scale irrigation systems.
Clearly, this is an area where targeted support can be invaluable in the fight against poverty.These systems give the chance for poor people to gain access to water to gain more income. Thereare many indications that, by gaining access to water through these approaches, women have greatlybenefited. There are possibilities to benefit the poor by designing interventions that recognize theinterwoven nature of water and land rights in smallholder irrigation systems. Typically,landownership is a prerequisite for water rights. There may be opportunities to help those withlimited access by swapping land and water rights: landowners with limited water rights, andlandless with water rights.
But it has always been difficult for large agencies to provide effective support for thesefragmented and diverse production systems. In many cases, initiatives for developing and

10
introducing these systems come from the producers themselves, often with support from NGOs,rather than through formal government channels: their success is often the direct result of theirdiversity and flexibility of approach. Care has to be taken in finding appropriate ways in whichto foster the continued development and adoption of these locally oriented innovations and avoidthe risk of too much top-down control.
Changing the technological basis of smallholder water management also carries with it risksand threats. One risk is inherent in the process of “scaling up.” While each individual piece ofequipment has little overall impact on basin-level water resources, widespread adoption can haveunexpected consequences because water rights of downstream users may not be taken into account.
Groundwater
Realizing potential gains in productivity from groundwater use. Sustainable management ofgroundwater offers major opportunities for promoting food and livelihood securities in regionsof the world with dense concentration of rural poverty. Groundwater is accessible to a large numberof users; it can provide cheap, convenient, individual supplies; it is generally less capital-intensiveto develop, and does not depend upon mega-water projects. Groundwater development is alsolargely self-financing; its largely private development and use ensure automatic cost recovery.Compared to surface water, which is flashy in nature, groundwater offers better insurance againstdrought because of the long lag between changes in recharge and responses in groundwater levelsand well yields.
Irrigation with groundwater is also generally more productive compared to much surfaceirrigation; groundwater is produced at the point of use, needing little transport; it offers individualfarmers irrigation “on demand” that few surface systems can offer; and because its use entailssignificant incremental cost of lift, farmers tend to economize on its use and maximize applicationefficiency. Evidence in India suggests that productivity per cubic meter of water supplied to farmsirrigated with groundwater tends to be 1.2 to 3 times higher than those irrigated with surface water.Similar evidence is available from other parts of the world as well.
Finally, compared to large surface systems whose design is driven by topography andhydraulics, groundwater development is often much more amenable to poverty targeting. Nowonder, then, that in developing countries of Asia and Africa, groundwater development hasbecome the central element of livelihood creation programs for the poor.
There is enormous room for institutional and technological innovations that can putgroundwater irrigation at the service of the poor. In South Asia, emergence and spread of watermarkets have helped improve poor people’s access to groundwater. Tube wells owned and operatedby groups of poor farmers also offer possibilities. Micro-diesel pumps made in China have becomeextremely popular with smallholders in Bangladesh because they cost less to buy as well as torun compared to 5-hp diesel pumps that have become industry-standard in India. Among the mostexciting are innovations in manual irrigation technologies; the treadle pump—selling as KrishakBandhu (Farmer’s Friend) in South Asia and “Money Maker” in Africa—costs US$12–25 a pieceand can be operated by anyone including children. Treadle pumps have become quite popular inBangladesh where already over a million pumps have been sold. It is spreading to eastern Indiaand Nepal terai where water tables are in the range of 2–5 m. Treadle pumps are particularlypopular with vegetable growers who combine small amounts of land with large volumes ofdisguisedly unemployed family labor to generate disproportionately large cash incomes. Equallypopular in this segment are likely to be the new range of low-cost bucket and drum-based dripirrigation technologies that have recently begun coming into the market. Thus affordable

11
technologies and competitive water markets are key to targeting groundwater development forthe poor.
Groundwater overdraft. If underdeveloped groundwater in the Ganges basin and parts of Africapresents an opportunity for the poor, depletion and contamination of groundwater elsewhere holdout a big threat for them. Depletion has far-reaching social as well as environmental dimensionsresulting in the immiserization of the people, especially of the already poor more than of the rich.In South Asia, when muscle-driven traditional water lifts went out of business with the onslaughtof tube wells, it was the poor who got hit the hardest. New siting and licensing policies reinforcethe rights of the early tube-well owners and exclude the late comers, who typically are the poor.One of the most serious ill effects of depletion is from seawater intrusion in coastal aquifers as inEgypt, Turkey, China and India. In the Saurashtra coast of the West Indian State of Gujarat,sustained overpumping by private farming communities during the 1960s and 70s generatedpreviously unseen prosperity, earning the coastal strip the name of “Green Creeper.” Rapid intrusionof seawater in coastal aquifers, which extended from 1 km to 7 km inland in a decade, however,caused a similar rapid collapse of the region’s unsustainably bloated tube-well economy. Thosewell-off farmers who saw the writing on the wall early used their resources to make a careful andplanned transition from farming to off-farm occupation in nearby towns. The less foresighted and/or the less resourceful stayed behind and took the full brunt of the fall of the socio-ecology. Manykept eking out a living by selling tender coconuts; but this too became difficult as the coconutsshrank in size and contained saline water. In recent years, tens of villages got depopulated everyyear, as those left behind proceeded towards the towns to join the ranks of the wage laborers.
We have only rough estimates of the contribution of groundwater irrigation to agriculture,and the amount of unsustainable groundwater use. Sandra Postel estimated that the annual overdraftis around 200 km3 per year, the equivalent of approximately three and a half years of water supplyreleased from Egypt’s High Aswan Dam. Even if this is a gross overestimate, clearly there is stilla problem. In many of the most pump-intensive areas of India and China, water tables are fallingat rates of 1 to 3 meters per year.
It is no exaggeration to say that the food security of India, Pakistan, China and many othercountries will largely depend on how they manage this groundwater problem. Reducing the amountof pump irrigation is no answer; this simply reduces the most productive agriculture. Groundwaterrecharge is one solution, but it is not easy, and in some areas there is no water remaining torecharge. A second answer is to increase water productivity to achieve the same production butwith less water.
Regulating groundwater overdraft is a far more complex and tricky issue compared tostimulating groundwater use where it is abundant. The crucial issue here is not so much of resourcemobilization but of catalyzing appropriate legal and institutional changes. Regrettably, much workin these directions is deeply influenced by European and North American experience, which doesnot fit very well with the peculiar conditions in some of the poor regions. For example, groundwaterlaw is widely prescribed as an effective remedy for the problem of overexploitation; however, inregions like South Asia and North China, effective enforcement of such regulatory frameworkspresents insurmountable problems because of the sheer numbers involved. In South Asia, forexample, the total stock of private tube wells probably exceeds 20 million and is growing at therate of 1 million year. These are not even registered, leave alone licensed; in such a situation,regulating groundwater use through a law is likely to be difficult when not counterproductive. Amore careful learning-process approach is needed to tackle the problem of groundwater overdraft.

12
Environment and Health
Comanagement of water for food and nature. Sectoral interests have dominated water resourcesdevelopment in most developing countries. Drinking water, hydropower and irrigation facilitiesare planned and constructed, commonly without regard to other needs. When water is plentiful,this approach can deliver quick results with unnoticed impact.
By building infrastructure to tap water for human purposes, we take water from nature. Nowof course, environmental impact statements are required before development efforts. But how wateris managed in agriculture has influence on downstream natural uses. Similarly, management ofupstream catchment areas influences water use in agriculture, and in cities. It is rarely thatmanagement of water in developing countries has considered upstream and downstream needs ofhuman and natural uses. As a result, there are too many confrontational situations resulting inwin-lose situations.
We feel there are many situations where, with comanagement of water for food and nature,we can have win-win situations, and increase the overall productivity of basin-wide waterresources. There are some prerequisites to comanagement. First, we have to know what therequirements of nature are. Second, we have to have resources management that integrates concernsacross sectors. Third, there must be an institutional allocation mechanism that ensures water forenvironmental needs. For example, an environmentally sensitive area could obtain a right to waterand an associated allocation of water.
One of the critical issues for water management in the twenty-first century is to understandthe water requirements of ecosystems. We need to know much more than we do now about thesewater requirements in terms of minimum flows, maximum flows and peak flows, and water qualitycan be maintained in river basins where human water needs also have to be satisfied. Whilesignificant progress has been made in the developed world, this type of analysis is often of lowpriority in many developing countries. Clearly, this is an area requiring support.
Health. A large part of the disease burden in developing countries is associated with inadequatequantities of safe water for domestic use, lack of facilities to dispose of human feces in a sanitaryway and poor hygienic standards. The most important of the water-associated diseases is diarrhea,which causes high child mortality in many developing countries. For low-income communitiesthe conventional approach to improve water supply has been the exploitation of shallowgroundwater with low-cost technologies. The problem of falling groundwater levels is now widelyrecognized as a threat to food security. The wealthier farmers can continue to drill deeper tubewells with larger, more expensive pumps, but poor farmers will not be able to do so. Less obviousand less talked-about is that groundwater depletion also causes the shallow drinking water wellsof poor communities to run dry. Deepening these wells is very costly and beyond the resourcesof the poor.
While the exploitation of groundwater through pumping is largely unregulated, other deliberateattempts to make irrigation more efficient influence this water resource as well. These measuresinclude the lining of canals with concrete to reduce seepage losses and diversification of cropsfrom rice to less-water-demanding crops. However, seepage water from canals and high percolationrates from paddy fields recharge the groundwater and thereby improve the availability of shallowgroundwater sources for domestic use. At policy level there is an urgent need to address the impactof the falling groundwater levels on both future agricultural output and supply of water forhouseholds. The government institutions and the donor organization have to review their practiceswhen promoting groundwater irrigation or implementing irrigation rehabilitation with potentialimpacts on the local household water supply.

13
The prevailing opinion has long been that groundwater is safe for drinking whereas surfacewater is not. This approach is not appropriate for all areas of the world. In South Asia there areimportant regions where groundwater cannot be utilized for drinking because of its chemicalcomposition. The most dramatic example is from Bangladesh and West Bengal, India, wherethousands of recently constructed drinking water wells are producing water with very high arseniclevels. In other areas, fluoride and salt levels of groundwater are too high to make it suitable fordrinking. If rainfall is very low, people often have to use surface water from natural courses andcanal irrigation systems in these areas.
Faced with water scarcity, the agricultural and nonagricultural uses of water are increasinglyinterdependent. To translate this into appropriate policy, the use of surface water for domesticpurposes should be reevaluated. There is an urgent need to bridge the gap between the irrigationand domestic water-supply sectors. Institutional and technical solutions are needed to provide safedrinking water from surface-water sources, including irrigation canals and reservoirs. Theinternationally accepted concept of integrated water resources management could be very usefulif elaborated and applied in rural areas and at local levels.
Water Resources Institutions and Policies
Water management institutions require radical reform if they are to meet the challenges facingthem during the next few decades. The challenges include increasing food production from irrigatedagriculture to meet growing demand, coping with escalating water demands in other sectors andsustaining the quality of soils and water, and improving the equity of water distribution. The fivemost important institutional changes required are: replacement of administrative with financiallyself-reliant service delivery organizations; conversion of irrigation systems into multiuse waterservice systems; transcending the infrastructure dependency-deterioration trap; establishing legaland regulatory frameworks for sustainable water management; and implementing integrated water-basin management. The central challenge will be to design institutions that ensure accountabilityof water-service providers to users. These institutions need to be adaptable to meet the changingneeds of water management that come about with increasing scarcity. Effective, sustainable andintegrated water management in the future requires adaptive, new or revitalized institutions toensure that the world can meet the twin imperatives of dramatically increasing the productivityof water and halting water-related environmental degradation.
Sound water laws and policies are necessary for integrated water resources management. Thereare many areas where these are deficient. In many countries, groundwater legislation is nonexistent,inappropriate or outdated. Also, water laws can be very sector-specific and do not integrate theconcerns of many sectors very well. Protecting the rights or allocating new rights to very poorwater users is often not very well developed. Clearly, in these cases there is a need for changes inwater laws.
In other cases though, there are relevant laws, but the implementation is very poor becausethe organizational capacity to do so is nonexistent, or because the laws are just not well thoughtout or they are inappropriate. It is important when thinking about water rights and water laws tomake sure that relevant laws exist, and in addition that there are organizations that can do somethingwith the laws, and that they do support operational functions.
In IWMI’s analysis, institutional reforms must create the right combination of incentives toinduce an optimal mix of state and local private investment to achieve sustainable infrastructuremaintenance. The following is a list of hypothesized essential incentives, which should be inherentin such reform. The reform should:
14
1. Integrate decision making about both short- and long-term investments in irrigationinfrastructure so that trade-offs between the two can be optimized.
2. Give users the incentive to maximize efficiency of the total investment in infrastructure.
3. Give the government the incentive to maximize the efficiency of its investment ininfrastructure.
4. Ensure that government interventions stimulate, rather than discourage, private investmentin infrastructure.
5. Give users the incentive and confidence to make long-term investments.
We are unaware of any developing country with a major irrigation sector where all fiveessential incentives are present in the formal sector. In contrast, in the informal irrigation sectordominated by groundwater irrigation in India for example, all these incentives are fully operational;in fact, private incentives in groundwater irrigation are so strong that overexploitation ofgroundwater resources and all its attendant dysfunctions have emerged as a big policy challengein Asia. To a somewhat lesser extent, indigenous farmer-managed systems in developing countriesincluded some of these incentives until a few decades ago when governments played a minor role.However, government interventions in recent years have, in many cases, undermined theseincentives, leading to deterioration of infrastructure. In many developed countries, the incentiveswere, and largely remain, present. But as the beneficiaries of “environmental” investments, topreserve wetlands for example, are also increasingly seen as the general public and not the wateruser association members alone, doubts have arisen about the long-term sustainability of theinfrastructure currently financed entirely by association members.
It must be emphasized that any approach that involves realization of the five types of incentivesmentioned above will require a relatively radical reform, i.e., relative to the institutional frameworkexisting today in most developing countries. The persistent problem of non-sustainable waterservice infrastructure will not go away with mere enhancements of business-as-usual. A fundamental problem requires a fundamental solution.
Recommendations
We recommend that the following issues be taken into serious consideration when developing astrategy on rural development:
1. There is a need to take a basin perspective when designing programs for developmentand management of water resources.
2. In water-scarce areas of MENA and SA, key water issues are water scarcity andcompetition, pollution, protecting nature, preventing groundwater depletion, protectingaccess of water by the poor, increasing productivity of water, and developing basin-levelinstitutions to deal with these issues.

15
3. In high potential areas of EAP, LAC and SA, key issues are tapping the potential ofgroundwater, providing appropriate smallholder water management systems to poor womenand men, improving water delivery services and improving productivity.
4. In high need areas, particularly in sub-Saharan Africa (SSA), there are additionalrequirements beyond those of high potential areas including infrastructure developmentto provide access to water, and developing capacity to construct, maintain, operate andmanage infrastructure.
5. There is a need to focus on productivity of water, particularly in agriculture, as this willrelieve scarcity, help the poor, and free up water for the environment and cities.
6. A basin perspective should be taken when assessing the potential of water savings.Increasing local farm and irrigation efficiency does not necessarily lead to water savings,and can result in fewer benefits.
7. Within irrigation systems, promote a service focus and promote reliability. Do this bybuilding accountability mechanisms, clarifying the level of service to be provided withthe participation of service providers and users, and by supporting acceptable designs thatwill support the level of services desired.
8. Supplemental irrigation in dominantly rain-fed areas shows great potential for increasingthe productivity of water and addressing poverty and local food-security issues.
9. Encourage appropriate smallholder land and water management systems. Water harvesting,treadle pumps, and bucket and drip sets provide tremendous opportunity to help the poor,and to increase the productivity of water. Some caution is required in developing programsof widespread support. Success has come because of private and community developmentefforts, and inappropriate support may lead to a counterproductive top-down means ofimplementation.
10. A huge potential exists for groundwater exploitation in high potential and high need areas.There is enormous room for institutional and technological innovations that can putgroundwater irrigation at the service of the poor.
11. In water-scarce areas such as northwest India and the North China Plains there is a seriousthreat of groundwater overdraft. Unfortunately, it is not easy to translate institutionalsolutions from developed to developing countries, so we are still searching for solutionsto this problem.
12. In situations of scarcity and competition, there is a need to comanage water for agricultureand water for nature. One critical concern is that while we have a good understanding ofagricultural water needs, there is little knowledge of the water requirements for nature.
13. Faced with water scarcity, agricultural and nonagricultural uses of water are increasinglyinterdependent in rural areas. There is an urgent need to bridge the gap between theirrigation and domestic water supply sectors to ensure water for food and water for drinkingand health.

16
14. Water scarcity in rural areas has important implications for health. In addition tothreatening food security, groundwater overdraft has health consequences when peoplelose their access to water due to falling water tables.
15. In areas where the same source of water is used for food production as well as drinking,bathing, and for livestock, there is a need to manage water for multiple uses, and a needto assess interventions in light of human-health consequences.
16. Building institutions remains a priority. We understand now that for productive watermanagement in agriculture, there is a need for a more comprehensive institutionalframework that provides for input and output services. With increasing scarcity, there isa need for this framework to evolve to address important issues that arise including:protecting access of water by the poor, reducing pollution and groundwater overdraft, andallocating water between competing sectors.
17. The five most important institutional changes required are: replacement of administrativewith service delivery organizations; conversion of irrigation systems into multiuse waterservice systems; transcending the infrastructure dependency-deterioration trap; establishinglegal and regulatory frameworks for sustainable water management; and implementingintegrated water-basin management. The central challenge will be to design institutionsthat ensure accountability of water-service providers to users.
18. There is a need for a comprehensive assessment of the benefits and costs of irrigation inorder to clarify the future directions for irrigated agriculture. We feel that there is a needto address concerns about irrigation brought about by several nonagricultural stakeholders,especially those representing environmental interests, and better address these in ourinterventions to improve water management. We feel that if we put our knowledge together,and address the issues outlined above as well as other key issues, we can reinvent theway we manage water for food and environmental security.
The issues discussed in this part are based on the findings of research conducted by IWMIover the last few years. The following IWMI publications are recommended for further reading.
Barker, R.; Babara van Koppen; and Thushaar Shah. 2000. A global perspective on water scarcity/poverty. Achieve-ments and challenges for water resources management. Colombo: International Water Management Institute.
IWMI (International Water Management Institute). 2000. 1999 Annual report. Colombo, Sri Lanka.
IWMI. 2000. Water issues for 2025. A research perspective. Colombo, Sri Lanka.
IWMI. 2000. World water supply and demand, 1995 to 2025. Colombo, Sri Lanka.
Keller, A.; Jack Keller; and David Seckler. 1996. Integrated water resources systems: Theory and policy implications.Colombo, Sri Lanka: International Irrigation Management Institute.
Keller, A.; R. Sakthivadivel; and David Seckler. 2000. Water scarcity and the role of storage in development.Colombo, Sri Lanka: International Water Management Institute.
Merry, D. J. 1997. Expanding the frontiers of irrigation management research. Colombo, Sri Lanka: International Ir-rigation Management Institute.

17
Merry, D. J.; and Chris J. Perry. 1999. New directions in water research: IWMI at the threshold of the twenty-firstcentury. International Journal of Water Resources Development 15 (1): 2. March/June 1999.
Molden, D. 1997. Accounting for water use in productivity. Colombo, Sri Lanka: International Irrigation ManagementInstitute.
Molden, D. J.; and R. Sakthivadivel. 1998. Water accounting to assess use and productivity of water. InternationalJournal of Water Resources Development 15 (½): 55-71.
Molden, D. J.; R. Sakthivadivel; and Z. Habib. 1999. Basin water use, conservation and productivity: Examples fromSouth Asia. In Transactions of the 17th Congress of the International Commission on Irrigation and Drainage.Graneda, Spain: International Commission on Irrigation and Drainage.
Oweis, T.; Ahmed Hachum; and Jacob Kijne. 1999. Water harvesting and supplemental irrigation for improved wateruse efficiency in dry areas. SWIM Paper 7. Colombo, Sri Lanka: International Water Management Institute.
Perry, C. J. 1999. The IWMI water resources paradigm: Definitions and implications. Agricultural Water Manage-ment 40 (1): 45–50.
Perry, C. J.; David Seckler; and Michael Rock. 1997. Water as an economic good: A solution, or a problem? Co-lombo, Sri Lanka: International Irrigation Management Institute.
Rijsberman, Frank R. 2000. World water scenarios: Analysis. London: Ersthscan Publication Ltd.
Seckler, D. 1996. The new era of water resources management: From “dry” to “wet” water savings. Colombo, SriLanka: International Irrigation Management Institute.
Shah, T.; David Molden; R. Sakthivadivel; and David Seckler. 2000. The global situation of groundwater. Overviewof opportunities and challenges. Colombo, Sri Lanka: International Water Management Institute.
Shah, Tushaar; M. Alam; M. Dinesh Kumar; R. K. Nagar; and Mahendra Singh. 2000. Pedaling out of poverty: So-cial impact of a manual irrigation technology in South Asia. Colombo, Sri Lanka: International Water Manage-ment Institute.
Shah, T.; I. Makin; and R. Sakthivadivel. 2000. Limits to leapfrogging: Issues in transposing successful river basinmanagement institutions in the developing world. Paper presented at the Workshop on Integrated Water Manage-ment in Water-Stressed River Basins in Developing Countries: Strategies for Poverty Alleviation and Agricul-tural Growth. South Africa, 16–21 October 2000.
Van Koppen, B. 1999. More crops and jobs per drop. Managing water for gendered poverty alleviation and agricul-tural growth. Colombo, Sri Lanka: International Water Management Institute.
Van Koppen, B. 2000. From bucket to basin: Poverty/gender. Managing river basins to alleviate water deprivation.Colombo, Sri Lanka: International Water Management Institute.
Vermillion, D. L.; and Doug Merry 1998. What the 21st century will demand of water management institutions. Jour-nal of Applied Irrigation Science 33 (2).

18

19
PPPPPARARARARART IIT IIT IIT IIT II
Background Paper on Water for Rural Development

20

21
Global Water Resources
General
Most of the world’s total water resources are too salty to be used for beneficial uses, includingdirect human use and agriculture. Only less than 3 percent of the total water resources is availableas freshwater resources (figure 1), of which over 70 percent is locked in the ice caps. Of theremainder, most are in deep aquifers, which are not accessible for humans, or stay as soil moisture.It is estimated that only less than 1 percent of the freshwater resources in the world (UN 1998) isavailable for direct human use (figure 1), which on average constitute about 43,000 km3. This isavailable year in year out as flows in the rivers, and is called the world’s internally renewablefreshwater resources (IRWR) (Shiklomonav 1999).
Not all of the IRWR can be controlled by humans. It is estimated that even with most feasibletechnical, social, environmental and economic means, only about one-third of the IRWR can bepotentially controlled (figure 1). The potentially utilizable water resources (PUWR) of the IRWRare estimated to be around 9,000 km3 to 14,000 km3 (UN 1999; Seckler 1993).
At present, about 2,370 km3 of the PUWR are developed and are being diverted as the primarywater supply (PWS) or the “virgin” or the first water supply for human use (IWMI 2000). A partof the PWS is evaporated in its first use. The other part returns to rivers or streams as returnflows (RF) and in many instances this part is again withdrawn for human use. This is known asthe recycled portion of PWS.
The PWS and the recycled water supply, about 3,300 km3, constitute the water diverted foruse in the different sectors. At present, three-quarters of the TWS in the world are diverted toagriculture, with only one-quarter being used for domestic and industrial sectors(figure 1).
Regional Variations
If distributed evenly, the total IRWR is translated to about 7,500 m3 per person in 1995(figure 2). This is a drop of 41 percent from the 1965 level of per capita IRWR. If the growth ofthe world’s population follows the United Nations (UN) medium projection path, this will furtherdecrease by 28 percent, i.e., to about 5,500 m3 in 2025. This is still a substantial amount to meetwater needs of each person in the world.
While the total available water resources at the global level are sufficient to fulfill humanneeds, their distribution across countries and regions is very uneven. Water resources vary fromlittle or no rains in extreme arid agro-climatic regions to abundant rainfall in the humid agro-climatic regions.
For the purpose of this study, to understand the implications of regional variations in waterresources endowments, we classify the countries into the following regions as specified by theWorld Bank: Africa (AFR), Middle East and North Africa (MENA), South Asia (SA), East Asiaand Pacific (EAP), Europe and Central Asia (ECA) and Latin America and the Caribbean (LAC).North America (NAME), European Union (EU), and also Australia and New Zealand (AUNZ)are classified into one category.

22
Figure 1. World’s water supply.
Figure 2. World’s population and per capita internally renewable water resources.

23
Internally Renewable Water Resources
Figure 3 shows the regional variations of the IRWR. The EAP region, with more than one-thirdof the world’s population, has about 19 percent of the IRWR. The SA region with 22 percent ofthe world’s total population is endowed with only 5 percent of the renewable water resources.On the other extreme, the LAC countries with 8 percent of the world’s total population are endowedwith 34 percent of the world’s IRWR. The North American region, with only 5 percent of theworld’s population, has 16 percent of the total IRWR.
While regional aggregates provide an overall picture of regional water endowments, substantialvariations could exist within regions. For example, almost half of the IRWR in the LAC region isgenerated in the Amazon basin in Brazil where only one-third of the LAC people live. The percapita IRWR in Brazil is about 29,000 m3. The Central American and Caribbean countries, withone-third of the LAC region’s population and 9 percent of the IRWR, had less than 5,000 m3 ofthe per capita IRWR in 1995. Also, the central African countries, with only 12 percent of thetotal population, generate more than 40 percent of the IRWR of the African region. The southernAfrican countries, with 15 percent of the total African population, generate only 8 percent of the IRWR.
The regional IRWR variations along with the capacity to control them give rise to substantialvariations in PUWR. The level of inter- and intra-annual variations of rainfall and the economic,technical and social feasibility of water resources development are determining factors for PUWR.In India, most of the annual rainfall falls within 100 hours spanning over a few months (Agarwal1998). It is estimated that only 38 percent of the IRWR can be potentially controlled for humanuse (CWC 1998). Most of the rains in China are received in the monsoonal months, mainly inthe Yangtze river basin in the south. Since a large part of it cannot be controlled, it flows to thesea without being used for urban or agricultural purposes. A similar situation prevails elsewhereincluding the Congo basin in the African region, and in the Amazon basin in Brazil in the LACregion.
Figure 3. Distribution of population and internally renewable water resources (in %).

24
Total Water Withdrawals
The estimates of total water supply to various regions and the diversions to major water-usingsectors are given in table 1. At present, about 3,400 km3 of water are diverted to the agriculture,domestic and the industrial sectors of the world. The African countries have the smallest share oftotal water withdrawals. This is reflected in their very low per capita water supply of 119 m3,constituting only one-fifth of the world average.
The world’s agriculture sector accounts for the largest share of total water diversions. Onaverage, over 85 percent of the total water supply in the developing regions is diverted to theagriculture sector. The agriculture sector of the South Asian region receives about 96 percent ofthe total diversions. The agriculture sectors of MENA and African regions follow closely with 90and 84 percent of total diversions, respectively.
Irrigation development in the past has played a significant role in enhancing national foodproductions, increasing food security, alleviating poverty, and contributing to overall ruraldevelopment of many countries in most regions. However, while the agriculture sector remainsthe largest user of the developed water resources, there is evidence that water use in other sectorsis growing rapidly—due mainly to population growth, expansion in urbanization andindustrialization in the developing world. These trends are expected to continue in the future.
Table 1. Water withdrawals and distribution between different sectors.
Past Developments and Trends
Food Consumption
As a result of agricultural and rural development efforts over the past three decades the worldhas been able to produce more food than required. The world’s average per capita calorie supplyfrom cereal products, animal-based products and non-cereal crop products (such as tubers, fruits,vegetables, etc.) has increased by 16 percent—from 2,356 kcal in 1965 to 2,733 kcal in 1995
Region TWS1 Per Capita Distribution of TWS between Sectors
(1995) TWS (1995) Agriculture Domestic Industrial
km3 m3 % % %
World 3,371 596 74 8 18
Developing countries 73% 517 85 6 9
Developed countries 27% 1,001 42 14 44
AFR 2% 119 84 11 5
MENA 7% 851 90 6 4
SA 26% 701 96 2 2
EAP 26% 466 83 7 10
ECA 11% 790 61 10 29
LAC 6% 413 73 16 11
Other countries2 22% 1,034 36 14 501Total water resources for different regions are given as a percent of the world’s TWS.2Other countries include North America, European Union, Japan, Australia and New Zealand.Sources: IWMI 2000; Gleick 1998.

25
(table 2). With an increase in population of 70 percent from 3.3 billion in 1965 to 5.7 billion in1995, the world’s total cereal consumption over this period has increased by 92 percent—from942 million metric tons (M mt) in 1965 to 1,811 M mt in 1995.
Table 2. Total population, per capita calorie supply and total cereal consumption of the world.
Year Population Per Capita Calorie Supply Total Cereal ConsumptionTotal Annual Total Annual Total Annual
growth1 growth1 growth1
Million % Kcal % M mt %
1965 3,337 - 2,356 - 942 -
1975 4,075 2.0 2,428 0.3 1,234 2.71985 4,837 1.8 2,642 0.9 1,605 2.71995 5,666 1.6 2,733 0.3 1,811 1.2Growth2
1965–95 - 1.8 - 0.5 - 2.21Entries in the first three rows of this column indicate the total growth from the previous year.2Entries in this row indicate the total growth between 1965 and 1995.Source: FAO 1998.
On average, two-thirds of the total calorie supply in the daily diet come from food cereal andanimal products (figure 4). Since feed cereals (such as maize and barley) contribute a major partof feed rations, especially in the commercial production of animal products, changes in cerealconsumption constitute a good indicator of the changes in total calorie supply and vice versa.The calorie supply from food cereal products and animal products in the three decades hasincreased by 15 and 22 percent, respectively. A higher growth in animal product consumptionmeans even a higher growth in feed cereal consumption and an overall higher growth in the totalcereal consumption. Indeed, the world’s total cereal consumption has increased at an annual rateof 2.2 percent, overall 92 percent over the 30-year period (table 2). Despite these increases, theworld, as a whole, was able to increase production to stay ahead of consumption growth.
Figure 4. Composition of the world’s per capita per day calorie supply (in %).

26
Figure 5. Trends of world’s crop area, yield and production and net irrigated area indices.
Food production. Figure 5 shows the trends in crop production.1 The total world crop productionhas almost doubled since 1965. While the total crop area in the 30-year period has increased atan annual rate of 0.33 percent, crop yields have increased at 1.9 percent per annum (table 3). It isvery clear that productivity growth has been a major driving force for increased overall foodproduction in the world.
Irrigation development. Several factors have contributed to the growth in crop productivity inthe last three decades. Foremost among them are expansion in irrigation, adoption of high-yieldingvarieties and better agronomic practices. While the exact contribution of these factors to the growthof productivity is difficult to quantify, it is well recognized that growth in irrigation has played amajor role.2 Over the last three decades, the world’s net irrigated area3 has increased by 73 percent,from 150 million ha in 1965 to 260 million ha in 1995 (FAO 1998).
1These are crop production indices with 1989–1991 average as the base derived from FAO data.2In the next few years, IWMI will be conducting a comprehensive assessment of the cost and benefits of irrigation, tofood, environment, social and rural livelihood security. Within these activities, IWMI hopes to quantify the contribu-tion of irrigation to the growth in crop yields in different regions of the world.3The net irrigated area is defined as the area irrigated at least once during the calendar year (FAO 1998).
Table 3. Annual growth of the world’s crop production, area and yield and the irrigated area.
Annual Growth (%)Period Crop Crop Crop Irrigated
production area yield area
1965–1975 2.4 0.3 2.0 2.3
1975–1985 2.6 0.5 2.2 1.8
1985–1995 1.8 0.2 1.6 1.5
1965–1995 2.3 0.3 1.9 1.9
Source: FAO 1998.

27
The world’s irrigated cereal area at present accounts for 31 percent of the total harvested area,but accounts for 43 percent of the total production (figure 6). This indicates that the productivityin irrigated cereal lands is 60 percent higher than that in rain-fed cereal lands. In South Asia andEAP regions, productivity in irrigated cereal lands is 172 and 100 percent, respectively, higherthan the respective productivities in the rain-fed cereals lands.
The irrigation water supply at present accounts for 74 percent of the total water withdrawals.Much of the growth in irrigation withdrawals in the last three decades was achieved through acombination of large- to medium-scale water-development projects. These included multipurposelarge reservoir storages to extensive tube-well extractions.
Benefits of irrigation development, whether surface water or groundwater are many, foremostamong them being the food security. This is especially true for most developing countries.According to the World Bank, the irrigation development projects that the bank was associatedwith in the last decades have brought direct benefits, in terms of improved food security andincreased incomes, to more than 46 million farming families (World Bank 1997). Also, newirrigation development was strongly associated with creating on-farm and off-farm employmentopportunities for large masses. In addition, indirect links of irrigation development withinfrastructure developments including roads, schools and markets have contributed to thedevelopment of rural areas.
The majority of the world’s population is still rural and depends on agriculture. About 55percent of the total population in 1995 was estimated to be rural (table 4). In 1995, 45 percent ofthe total population (more than 2.5 billion people) was estimated to depend directly or indirectlyon agriculture for its livelihood. Half of this population is the economically active labor force,and 43 percent of it constitutes the female labor force.
Figure 6. Irrigated cereal area and production; total harvested area and production (in %).

28
The total cereal production in South Asia has grown by 146 percent, from 92 M mt in 1965to 226 M mt in 1995 (table 6). The growth from 1965 to 1995 was so impressive that the regionas a whole was able to wipe out regular cereal production deficits that were recorded before themid-seventies (figure 8). After the 1980s, the region was able to keep its production surpluses ordeficits within 5 percent of the consumption needs even under extreme climatic conditions.Production surpluses in good climatic years have helped replenish year-ending stocks for the usein bad years. As a result, the region was able to achieve trend self-sufficiency in cereals over thelast one and a half decades.
Table 5. Total population, per capita calorie supply and total cereal consumption.
Year Population Per Capita Calorie Supply Total Cereal Consumption
Total Annual Total Annual Total Annualgrowth1 growth1 growth1
Million % kcal % M mt %
1965 645 - 2,020 - 106 -
1975 815 2.3 1,984 -0.2 133 2.3
1985 1,017 2.3 2,182 1.0 176 2.9
1995 1,249 2.1 2,369 0.9 231 2.7
Growth2
1965–95 - 2.2 - 0.5 - 2.61Entries in the first three rows of this column indicate the total growth from the previous year.2Entries in this row indicate the total growth between 1965 and 1995.Source: FAO 1998.
Trends
South Asia. Over the period 1965 to 1995, total per capita calorie supply in South Asia (SA) hasincreased by 17 percent, from 2,020 kcal in 1965 to 2,369 kcal in 1995 (table 5). The neardoubling of the population in the same period from 645 million in 1965 to 1,249 million in 1995,and increases in animal products in the diets have resulted in a substantial growth in total cerealconsumption. Cereal products, which comprise 65 percent of the per capita calorie supply,dominate the South Asian’s daily diets (figure 7). The total cereal consumption in the regionshas increased substantially by about 118 percent. The contributions to the daily diet from cerealand animal products have increased by 13 and 48 percent, respectively.
Table 4. Total, rural and agricultural population of the world.
Population Distribution
Total Rural Agriculture Labor Force1 Female Labor Force2
Year % of % of % of % oftotal total agriculture total
labor force
Million Million % Million % Million % Million %
1965 3,337 2,157 65 1,889 57 887 47 359 411975 4,075 2,538 62 2,117 52 1,000 47 418 42
1985 4,837 2,850 59 2,348 49 1,148 49 489 43
1995 5,666 3,113 55 2,533 45 1,279 50 552 431This is the economically active population in agriculture.2This is the economically active female population in agriculture.Sources: FAO 1998; UN 1999.

29
Figure 7. Composition of per capita per day calorie supply, South Asian region (in %).
Table 6. Cereal production, area, yield and the net irrigated area.
Year Production Area Yield Irrigated Area
Total Growth1 Total Growth1 Average Growth1 Total Growth1
M mt % M ha % Tons/ha % M ha %
1965 92 - 117 - 0.8 - 41
1975 130 3.5 127 0.8 1.0 2.7 52 2.3
1985 176 3.1 133 0.5 1.3 2.7 64 2.1
1995 226 2.5 130 -0.2 1.7 2.7 78 2.1
Growth2
1965–95 - 3.0 - 0.3 - 2.7 - 2.21Entries in the first three rows of these columns indicate the growth from the previous season.2Entries in this row indicate the growth between 1965 and 1995.Source: FAO 1998.
Figure 8. Cereal production and production surplus/deficit, South Asian region.

30
Table 7. Total, rural and agriculture population.
Population Distribution
Total Rural Agriculture Labor Force1 Fem. Labor Force2
Year % of % of % of % of totaltotal total agriculture labor force
Million Million % Million % Million % Million %
1965 645 531 82 456 71 215 47 84 39
1975 815 650 80 551 68 252 46 100 40
1985 1,017 780 77 641 63 288 45 112 39
1995 1,249 917 73 719 58 328 46 126 381This is the economically active population in agriculture.2This is the economically active female population in agriculture.Sources: FAO 1998; UN 1999.
More than 70 percent of South Asia’s present population, i.e., more than 900 million people,live in rural areas (table 7). This is equivalent to 30 percent of the world’s rural population. Almostthe whole of this population depends for its livelihood on agriculture. New irrigation developmentin this region has had substantial benefits to its rural agricultural population. Productivity growth,associated with irrigation development, has brought not only food security to rural households butalso increased incomes, employment opportunities and, hence, increased stability to their livelihoods.
Figure 9. Cereal area, yield, production and net irrigated area indices, South Asian region.
The growth in total cereal area in the region has more or less flattened out since the mid-eighties (table 6; figure 9). The growth in productivity was the major contributing factor toincreased production. In the 30-year period, the total cereal area increased only at an annual rateof 0.3 percent while the average yield increased at an annual rate of 2.7 percent. With extremefluctuations of rainfall under monsoonal climatic conditions, South Asia would not have realizedsuch yield increases without irrigation. The net irrigated area in the region increased at an annualrate of 2.2 percent in the 30-year period (table 6). About half of the total cereal area is irrigatedat present, and contributes to three-fourths of the total cereal production (IWMI 2000).

31
Table 8. Total population, per capita calorie supply and total cereal consumption.
Population Per Capita Calorie Total CerealSupply Consumption
Year Total Annual Total Annual Total Annualgrowth1 growth1 growth1
Million % kcal % M mt %
1965 1,025 - 1,950 1861975 1,307 2.4 2,091 0.7 274 3.9
1985 1,535 1.6 2,543 1.8 403 3.9
1995 1,773 1.5 2,735 0.7 507 2.3
Growth2
1965–95 - 1.8 1.1 3.41Entries in the first three rows of this column indicate the total growth from the previous year.2Entries in this row indicate the total growth between 1965 and 1995.Source: FAO 1998.
Figure 10. Composition (%) of per capita per day calorie supply, EAP region.
East Asia and Pacific. The average per capita calorie supply in East Asia and Pacific (EAP) hassubstantially increased by 37 percent, from 1,950 kcal in 1965 to 2,735 kcal in 1995 (table 8).Composition of the animal products in the daily calorie supply alone has increased by 238 percent,from 5.9 percent (about 115 kcal) in 1965 to 14.2 percent (about 389 kcal) in 1995 (figure 10).Increased consumption of animal products combined with 73 percent growth in population hasresulted in a substantial growth in cereal consumption.
Total cereal consumption in the EAP region has increased from 186 M mt in 1965 to 507 Mmt in 1995 at an annual rate of 3.4 percent. However, total cereal production in the 30-year periodhas increased from 183 M mt in 1965 to 476 M mt in 1995, at an annual rate of 3.2 percent.Production growth was not fast enough to keep pace with consumption growth, resulting insignificant production deficits over time (figure 11).

32
It should also be noted that industrial and service sectors of some countries in the EAP regionsuch as Malaysia, Indonesia and Philippines were growing rapidly during the 1980s and the 1990s.These countries have been net cereal importers.
The total cereal area in the 30-year period has increased only at an annual rate of 0.2 percent(table 9; figure 12). Virtually all of the increase in production in the region was due to productivitygrowth. The average cereal productivity has increased at an annual rate of 3.0 percent since 1965.Much of the productivity growth in the region has been associated with increase in irrigated area,which has grown at an annual rate of 2.2 percent over this period. The irrigation withdrawals atpresent account for more than 80 percent of the total withdrawals. Irrigation development in theEAP region has not only contributed to the growth in productivity and hence to overall productionbut also brought significant benefits to most rural people as well.
Of the 1995 population, more than two-thirds lived in rural areas (table 10), a drop of13 percent from the 1965 level. However, in absolute terms, the rural population has increasedfrom 833 million in 1965 to 1,191 million in 1995.
Figure 11. Cereal production and production surplus/deficit, EAP region.
Table 9. Cereal production, area and yield and the net irrigated area.
Production Area Yield Irrigated Area
Year Total Annual Total Annual Average Annual Total Annualgrowth1 growth1 growth1 growth1
M mt % M ha % Tons/ha % M ha %
1965 183 - 134 - 1.36 - 44
1975 266 3.8 142 0.6 1.87 3.2 55 2.3
1985 391 3.9 140 -0.2 2.80 4.1 60 2.1
1995 476 2.0 142 0.2 3.36 1.8 68 2.1
Growth2
1965–95 - 3.2 - 0.2 - 3.0 - 2.21Entries in the first three rows of these columns indicate the growth from the previous season.2Entries in this row indicate the growth between 1965 and 1995.Source: FAO 1998.

33
Figure 12. Cereal area, yield and production and net irrigated area indices, EAP region.
Table 10. Total, rural and agriculture population of EAP.
Population Distribution
Total Rural Agriculture Labor Force1 Fem. Labor Force2
Year % of % of % of % of totaltotal rural agriculture labor force
Million Million % Million % Million % Million %
1965 1,025 833 81 800 78 401 50 170 42
1975 1,307 1,046 80 922 71 473 51 209 44
1985 1,535 1,145 75 1,037 68 571 55 261 46
1995 1,773 1,191 67 1,111 63 641 58 299 471This is the economically active population in agriculture.2This is the economically active female population in agriculture.Sources: FAO 1998; UN 1998.
Europe and Central Asia. Europe and Central Asia (ECA) have the highest per capita per daycalorie supply in the developing world. The average per capita calorie supply in 1995 was 3,349kcal. This is an increment of only 6 percent from the 1965 level (table 11). However, thecomposition of cereals, animal and other crop products in the daily diet shows drastic changesduring this period. There was a tendency to shift from more animal products in the daily diet to amore vegetarian diet. The contribution of cereal products in the daily calorie supply in this periodhas increased by 13 percent (figure 13), while the contribution of animal products in the dailycalorie supply has decreased by 46 percent. The contribution from other crop products to dailycalorie supply has increased by 55 percent. These shifts are reflected in changes in the total cropconsumption.
The growth of total cereal consumption in the region stayed barely above the populationgrowth. The cereal production deficits have widened and the region became a net importer ofcereals after the early 1970s (figure 14). However, more drastic changes observed after 1985 wereassociated with the collapse of the former Soviet Union.

34
Figure 14. Cereal production and production surplus/deficit, ECA region.
Figure 13. Composition (%) of per capita per day calorie supply, ECA region.
Table 11. Total population, per capita calorie supply and total cereal consumption.
Population Per Capita Calorie Total Cereal Supply Consumption
Year Total Annual Total Annual Total Annualgrowth1 growth1 growth1
Million % Kcal % M mt %
1965 347 - 3,159 - 176 -
1975 387 1.1 3,366 0.7 248 3.4
1985 428 1.0 3,384 0.1 290 1.6
1995 455 0.6 3,349 -0.1 252 -1.4
Growth2
1965–95 - 0.9 - 0.2 - 1.21Entries in the first three rows of this column indicate the total growth from the previous year.2Entries in this row indicate the total growth between 1965 and 1995.Source: FAO 1998.

35
The decrease in total cereal area indicates that productivity growth has been the sole contributorfor production growth in this region (table 12; figure 15). The productivity in the region hasincreased by 45 percent. The contribution of irrigation to the total cereal production is very low,and rain-fed farming accounts for over 75 percent.
The rural population in the ECA region (34% in 1995; table 13) is smaller than in most otherregions. Thus irrigation development in this region may have brought direct benefits to a smallerportion of the total population.
Population DistributionTotal Rural Agriculture Labor Force1 Female Labor Force2
Year % of % of % of % of totaltotal rural agriculture labor force
Million Million % Million % Million % Million %1965 347 176 51 132 38 65 49 34 52
1975 387 170 44 115 30 57 50 28 49
1985 428 165 39 105 25 53 50 25 46
1995 455 155 34 92 20 48 52 21 44?This is the economically active population in agriculture.2This is the economically active female population in agriculture.Sources: FAO 1998; UN 1998.
Table 13. Population distribution.
Production Area Yield Irrigated AreaYear Total Annual Total Annual Average Annual Total Annual
growth1 growth1 growth1 growth1
M mt % M ha % Tons/ha % M ha %1965 180 - 152 - 1.18 - 13 -
1975 233 2.7 152 0.0 1.53 2.6 20 4.4
1985 249 0.7 142 -0.7 1.76 1.4 28 3.3
1995 222 -1.2 129 -0.9 1.72 -0.2 29 0.5
Growth2
1965-95 - 0.7 - -0.5 - 1.2 - 2.71Entries in the first three rows of these columns indicate the growth from the previous season.2Entries in this row indicate the growth between 1965 and 1995.Source: FAO 1998.
Table 12. Cereal area, yield and production and the net irrigated area.
Figure 15. Cereal area, yield and production and net irrigated area indices, ECA region.

36
Africa. Over the period 1965 to 1995, the African population is estimated to have grown at anannual rate of 2.8 percent, which is much higher than growth rates experienced in most otherregions (table 14). However, average per capita calorie supply over the same period is estimated tohave grown only by an annual rate of 0.2 percent, which is much lower than in the other regions.Cereals, and roots and tubers contribute 46 percent and 19 percent, respectively, to daily diets (figure16). The calorie supply from cereal products has increased by 13 percent while that from roots andtubers show only a 7-percent growth. The contribution of animal products to daily calorie supplyhas decreased from 13 percent (about 281 kcal) in 1965 to 11 percent (about 172 kcal) in 1995.
Table 14. Total population, per capita calorie supply and total cereal consumption.
Population Per Capita Calorie Total Cereal Supply Consumption
Year Total Annual Total Annual Total Annualgrowth1 growth1 growth1
Million % kcal % M mt %1965 249 - 2,144 - 39 -
1975 323 2.7 2,155 0.1 52 2.91985 432 2.9 2,101 -0.3 66 2.51995 566 2.7 2,298 0.9 91 3.1Growth2
1965–95 - 2.8 - 0.2 - 2.91Entries in the first three rows of this column indicate the total growth from the previous year.2Entries in this row indicate the total growth between 1965 and 1995.Source: FAO 1998.
Figure 16. Composition (%) of per capita per day calorie supply, African region.
The growth of cereal production in Africa has not kept pace with the increasing demandresulting from high population growth. Although the cereal production over the 30-year periodhas more than doubled, the production deficit has increased over time and is estimated to be15 percent of the consumption in the mid-nineties (figure 17).
Unlike in most other regions, the productivity growth in Africa has been very low, with onlya little contribution to overall production growth (figure 18; table 15). The production growthmainly resulted from expansion in cereal area, which is estimated to have grown at an annualrate of 1.6 percent over the 30-year period. The total irrigated area, though increased at an annualrate of 1.8 percent, is only a small part of the total crop area, with rain-fed cultivation dominatingthe crop production. Only 5 percent of the total cereal area was irrigated in 1995, which contributedonly 12 percent to the production growth.

37
Figure 17. Cereal production and production surplus/deficit, African region.
Figure 18. Cereal area, yield and production and net irrigated area indices, African region.
Table 15. Cereal area, yield and production and the net irrigated area.
Production Area Yield Irrigated Area
Year Total Annual Total Annual Average Annual Total Annualgrowth1 growth1 growth1 growth1
M mt % M ha % Tons/ha % M ha %
1965 38 - 50 - 0.75 - 4
1975 52 3.3 55 0.8 0.96 2.4 4 1.8
1985 59 1.1 60 1.0 0.98 0.2 6 2.3
1995 80 3.2 80 2.9 1.00 0.3 6 1.2
Growth2
1965-95 - 2.5 - 1.6 - 1.0 - 1.81Entries in the first three rows of these columns indicate the growth from the previous season.2Entries in this row indicate the growth between 1965 and 1995.Source: FAO 1998.

38
Table 17. Total population, per capita calorie supply and total cereal consumption.
Population Per Capita Calorie Total CerealSupply Consumption
Year Total Annual Total Annual Total Annualgrowth1 growth1 growth1
Million % kcal % M mt %1965 249 - 2,144 - 39 -
1965 121 - 2102 - 26 -
1975 159 2.8 2451 1.6 40 4.1
1985 218 3.2 2870 1.6 69 5.8
1995 283 2.7 2951 0.3 93 2.9
Growth2
1965–95 - 2.9 - 1.1 - 4.31Entries in the first three rows of this column indicate the total growth from the previous year.2Entries in this row indicate the total growth between 1965 and 1995.Source: FAO 1998.
Table 16. Total, rural and agriculture population distribution
Population Distribution
Total Rural Agriculture Labor force1 Female labor force2
Year % of % of % of % of totaltotal rural agriculture labor force
Million Million % Million % Million % Million %1965 249 215 86 203 82 97 48 44 461975 323 264 81 246 76 115 47 53 46
1985 432 330 76 300 70 138 46 64 47
1995 566 404 71 368 65 168 46 79 471This is economically active population in agriculture.2This is economically active female population in agriculture.Sources: FAO 1998, UN 1999.
This region has the highest percentage of rural population (71% in 1995), most of whomdepend on agriculture (table 16). In addition, almost half of the active population in agricultureis female. Overall, it appears that most of the rural poor men and women in Africa have benefitedvery little from the global wave of new irrigation development in the past three decades.
Middle East and North Africa. The population growth in the Middle East and North Africa(MENA) was the highest among all regions. The total population of 283 million in 1995 was anincrement of 135 percent from the 1965 level (table 17). Fueled by substantial increases in theconsumption of food cereal products and animal products in the daily diets (30% and 39%,respectively) (figure 19), the total per capita calorie supply has increased by 4.3 percent annually.Increases in food cereals and animal products in the diet have resulted in the increase of the totalcereal consumption at a substantially higher rate than that of the total population.
However, the growth in food production was not large enough to keep pace with increasingfood demand. The cereal production deficit has increased over time and stood around 40 percentof the cereal consumption in the nineties (figure 20). As in most other regions, the productivitygrowth is the major driving force behind substantial growth in production (table 18; figure 21)

39
Figure 20. Cereal production and production surplus/deficit, MENA region.
Figure 19. Composition (%) of per capita per day calorie supply, MENA region.
Table 18. Cereal production, area, yield and production and net irrigated area.
Production Area Yield Irrigated Area
Year Total Annual Total Annual Average Annual Total Annualgrowth1 growth1 growth1 growth1
M mt % M ha % Tons/ha % M ha
1965 21 - 23 - 0.93 - 12 -
1975 29 3.1 26 1.3 1.12 1.8 14 1.6
1985 35 1.8 27 0.2 1.30 1.6 16 1.5
1995 54 4.5 30 1.0 1.84 3.5 20 2.7
Growth2
1965-95 - 3.1 - 0.8 - 2.3 - 1.91Entries in the first three rows of these columns indicate the growth from the previous season.2Entries in this row indicate the growth between 1965 and 1995.Source: FAO 1998.

40
Table 19. Total, rural and agriculture population.
Population Distribution
Total Rural Agriculture Labor Force1 Female Labor Force2
Year % of % of % of % of totaltotal rural agriculture labor force
Million Million % Million % Million % Million %
1965 121 73 61 72 59 23 32 6 28
1975 159 85 54 79 50 25 31 8 33
1985 218 103 47 83 38 26 31 10 37
1995 283 120 42 85 30 28 32 12 421This is the economically active population in agriculture.2This is the economically active female population in agriculture.Sources: FAO 1998; UN 1999.
Rural population of the MENA region (table 19) is comparatively smaller than that of South Asia,EAP or the African region. However, as irrigation is essential for agriculture in most countries in theregion, the rural population may have benefited substantially from increased irrigation development.
Figure 21. Cereal area, yield and production and net irrigated area indices, MENA region.
Latin America and the Caribbean. The total population in the Latin American and the Caribbeancountries has increased more than 90 percent from the 1965 level (table 20). The growth inconsumption of food cereals (9%) and the substantial growth in the consumption of animal products(36%) have resulted in a total cereal consumption growth of 162 percent (figure 22; table 21).
The growth of cereal production in the region, however, has not kept pace with the consumptiongrowth. The region as a whole has recorded substantial production deficits in the 1990s (figure23), which is a significant change from the situation that prevailed until the mid-1970s when theregion achieved production surpluses. While there was a turnaround in the production situations,the total cereal production has more than doubled during the 30-year period (figure 24; table 21).The major factor contributing to production growth was the productivity growth. The total cerealarea increased only by 16 percent while the productivity grew by 82 percent. As in Asia, the growthin irrigation in this region has made a significant contribution to the average yield growth.

41
Table 20. Total population, per capita calorie supply and total cereal consumption
Population Per Capita Calorie Total CerealSupply Consumption
Year Total Annual Total Annual Total Annualgrowth1 growth1 growth1
Million % kcal % M mt %
1965 250 - 2,394 - 51 -
1975 322 2.6 2,545 0.6 76 4.1
1985 401 2.3 2,687 0.6 106 3.3
1995 480 1.8 2,774 0.3 134 2.4
Growth2
1965–95 - 2.2 - 0.5 - 3.31Entries in the first three rows of this column indicate the total growth from the previous year.2Entries in this row indicate the total growth between 1965 and 1995.Source: FAO 1998.
Figure 22. Composition (%) of per capita per day calorie supply, LAC region.
Table 21. Cereal production, area, yield and net irrigated area.
Production Area Yield Irrigated Area
Year Total Annual Total Annual Average Annual Total Annualgrowth1 growth1 growth1 growth1
M mt % M ha % Tons/ha % M ha
1965 56 43 - 1.30 - 9 -
1975 77 3.3 50 1.5 1.55 1.8 12 3.0
1985 102 2.8 52 0.3 1.98 2.5 15 1.9
1995 117 1.4 50 -0.3 2.36 1.8 18 2.1
Growth2
1965–95 - 2.5 - 0.5 - 2.0 2.41Entries in the first three rows of these columns indicate the growth from the previous season.2Entries in this row indicate the growth between 1965 and 1995.Source: FAO 1998.

42
Unlike in Asia and the Pacific countries, the impact of irrigation development may have broughtdirect benefits to a small part of the LAC population. The reason for this is that only a little overone quarter of the population lives in rural areas, and a little under one quarter of the populationdepends for their livelihoods on agriculture (table 22).
The rural population is still the majority in most developing regions. Most of the ruralpopulation is employed in agriculture. Past trends indicate that irrigation development hadcontributed substantially for increasing crop productivity and, hence, production in most developingregions. Increased crop production has brought several benefits to most regions. The South Asianregion as a whole became self-sufficient in their cereal requirement in the EAP region and wouldhave recorded massive food deficits had there been no irrigation development. Also, increasedfood security at rural households and increased income for the rural population have been commonfeatures in most developing regions. Therefore, the agricultural development will still play a majorrole in future strategies of rural developments in the regions with a substantial rural population.
Figure 23. Cereal production and production surplus/deficit, LAC region.
Figure 24. Cereal area, yield, production and net irrigated area indices, LAC region.

43
4PODIUM, the policy dialogue model, is designed to explore the technical, social and economic aspects of alternativevisions for the future. A brief discussion of the steps of computation in the PODIUM is given in the appendix.
Table 22. Total, rural and agriculture population.
Population Distribution
Total Rural Agriculture Labor Force1 Female Labor Force2
Year % of % of % of % of totaltotal rural agriculture labor force
Million Million % Million % Million % Million %1965 250 116 46 116 46 38 33 5 14
1975 322 124 39 125 39 42 34 7 16
1985 01 127 32 122 30 44 36 8 17
1995 480 127 26 114 24 44 39 7 171This is the economically active population in agriculture.2This is the economically active female population in agriculture.Sources: FAO 1998; UN 1999.
Water Supply and Demand 1995–2025: Issues and Scenarios
In this section, we discuss water supply and demand projections for various regions. The periodof projection is from 1995 to 2025. The discussion here is mainly based on the studies on world’sfuture water supply and demand conducted by IWMI (Seckler et al. 1998; IWMI 2000). For thepast few years, IWMI has been conducting research and developing different scenarios of watersupply and demand for different countries. Results presented here are based on the IWMI basescenario, developed from the PODIUM,4 the policy dialogue model.
For countries with a substantial rural population, the base scenario reflects targets to achievethe following four major objectives:
• Provide an adequate level of per capita food consumption to reduce extreme forms ofnutritional poverty.
• Provide basic human needs of domestic and industrial activities.
• Increase food security and rural income through agricultural development with a focus onreducing food imports.
• Improve water quality and support environmental uses of water.
Activities for achieving these objectives include growth in agricultural area and cropproductivity. The base scenario is rather more optimistic, in the sense that if the above objectivescould be achieved within the constraints of available resources, countries have done their best asthey could with these resources. A rather pessimistic scenario would be no growth in area and slowergrowth in productivity. The impact on food production from such a scenario will also be discussed.
The analysis in this section is based on 100 countries, which comprise 96 percent of the world’stotal population. Results presented here are aggregated at the regional level. The 100-country sample

44
contains 94, 96, 100, 99, 85 and 96 percents of the total population of the AFR, MENA, SA,EAP, EAC and LAC regions, respectively. The countries in North America, the European Union,Australia, New Zealand and Japan are aggregated into a single category.
Base Scenario
Water for food projections in the IWMI base scenario consists of four major steps. Future fooddemand for a country is projected first, followed by food supply projections. Water demand forfood production is projected next. Water for food is combined with water for domestic andindustrial sectors to project the total water demand. We discuss these steps in greater detail in thefollowing sections.
Food Demand
Total food demand projections depend on three crucial factors:
• population growth
• increase in per capita consumption
• changes in the composition of diet
The importance of these three components on projections is discussed next.
Population growth. Population growth is a crucial factor in any future water development strategiesfor food and for domestic or industrial consumption. Large-scale water development projects, whichstart now, take several years for completion. The actual population at the time of completion ofprojects may be much larger than these projects are predicted to cater for. Some of these costlydevelopment projects may not be meaningful then. Therefore, assessing a reasonable populationgrowth path is very important for deciding future water strategies.
The United Nations (UN) has three population projection paths: high, medium and low (UN1999). While most agree that high projection is not realistic, some debate about the possible pathfrom the medium to low projections. The UN believes that medium projection is reasonable butsome argue for a low growth trajectory (Seckler and Rock 1995). Until this becomes clear, wetake a compromise path: the average of UN’s medium and low projections.
Even under the average growth scenario some developing country regions still havesubstantially high population growth than others. For example, the African region will have 87percent more people in 2025 than in 1995; the MENA region will have 66 percent more peoplein 2025. Though the growth rates are smaller, the SA and EAP regions would have an addedpopulation of 529 and 398 million, respectively, by 2025. Overall, more than 95 percent of thetotal population increases are projected to be in the developing countries.
Nutritional consumption. The average daily per capita calorie supply from food is a good indicatorof nutritional consumption. An important objective in the base scenario is to provide sufficientcalorie supply per person per day to reduce extreme forms of food poverty. Most developingcountries fall in this category.
A reasonably high calorie supply through a varied daily diet provides not only the minimumcalorie requirements but also enough protein, mineral and vitamin needs. For developing countries,a calorie supply of 2,200 kcal per person per day would be sufficient for meeting most of theabove requirements.

45
The present average per capita per day calorie supply of all regions is more than 2,200 kcal(table 23). Due to differences in income, substantial variations in per capita calorie intake existbetween regions, and also between countries within regions. The consumption of at least 2,200kcal per person per day requires a substantially high average per capita supply at the nationallevel. A rule of thumb is that an average calorie supply of 2,700 to 3,000 kcal per person per daywould be sufficient to meet the minimum requirement, even to most of the poorest of the poorpeople. [Note that while distribution of food may still be an issue, increased overall domesticsupply can be expected to improve the access to food by poor people]
Table 23. Population and calorie supply (per capita per day).
Population Per Capita Calorie Supply
Region 1995 2025 Annual 1995 2025 Annual
growth growth
Million Million % Million Million %
All countries (45) 5,422 7,217 1.0 2,722 2,964 0.3
Developed counties 893 984 0.3 3,342 3,579 0.2Developing countries 4,529 6,232 1.1 2,599 2,867 0.3
AFR 533 989 2.1 2,197 2,413 0.3MENA 271 443 1.7 2,954 3,035 0.1
SA 1,233 1,762 1.2 2,360 2,741 0.5EAP 1,759 2,158 0.7 2,740 3,034 0.3CA 386 401 0.1 2,995 3,075 0.1LAC 461 644 1.1 2,791 3,196 0.5Other countries1 779 818 0.2 3,356 3,649 0.31North America, European Union, Australia, New Zealand and Japan are in this category.
The African and South Asian regions had the lowest average per capita calorie supplies in1995, estimated at 2,197 kcal and 2,360 kcal, respectively. This indicates that a substantial numberof poor people in these regions have been suffering from food poverty-nutritional deficiencies.The target average per capita calorie supplies in 2025 in these regions are 2,413 kcal and 2,741,respectively, still the lowest among all the regions (since these regions begin with a low base in1995). The African region is projected to have the highest annual growth in total calorieconsumption (2.3% annually) followed by MENA (1.8%) and South Asia (1.7%). The 2025 targetsfor other regions are more than 3,000 kcal. The world-level target for average daily calorie supplyis above 2,700 kcal.
Composition of daily diet. Cereals dominate the daily diet of people in most countries. More than65 percent of the daily calorie supply is provided by cereals: directly through cereal productsand indirectly through animal products. However, the composition of cereal and meat productsdoes vary across regions. In general, the poor regions such as South Asia and EAP still consumemore cereal products, while rich countries consume more meat products.
More meat products in the diet mean more consumption of equivalent crop products.Production of one kilogram of meat product requires several kilograms of equivalent crop products.Under commercial production settings, the average ratios are more than 3 times for poultryproducts and more than 6 times for red meat products. Thus the changes in composition of dietshave important implications for overall crop production.

46
Figure 25b. Per capita calorie supply from animal products, % of total.
In general, the tendency in developing countries (presently low-calorie-consuming countries)is to reduce direct cereal consumption (food) and increase the share of animal products in thedaily diets (due to increase in incomes).5 This is resulting in a shift from food to feed use of cereals.In the longer term, demand for feed can be expected to increase in these countries. However, inhigh-calorie-consuming countries, especially in developed countries there is a tendency to shiftform red meats to white meat—with overall less meat consumption—and to increase the share ofvegetables, pulses and fruits (mainly due to health concerns). These shifts, along with significantimprovement in efficiency of converting feed into animal products, can be expected to free upsome feed cereals.
The projected changes in the share of cereals and animal products in South Asia (64 to 60%from cereal products, and 8 to 11% from animal products), and in the EAP region (60 to 52% incereals, 14 to 20% in animal products) are prominent (figure 25).
5The income elasticity of animal products is generally high in the early stages of economic development.
Figure 25a. Per capita calorie supply from cereal products, % of total.

47
At present, most of the animal products in developing countries are produced throughtraditional forms of feeding such as from pastures and other lands not suitable for crops or fromwaste products. This trend will change in the future. Most of the pasturelands for grazing areexploited to the full potential. The feeding mode through waste will reduce. The commercial formsof feeding, i.e., mainly feeds using maize, barley, soybean meal, etc., will increase.
Cereal consumption. Cereals form the dominant form of feed stuffs in commercial forms of animalhusbandry. At present, almost 70 percent of the feed stuffs are from cereals. An increase inconsumption of animal products in the human diet requires more feed cereals (table 24). The basescenario shows that all regions, except the ECA region, will have substantial increases in feedcereal consumption. The ECA region already has a rich calorie supply from animal products. Onaverage, the food cereal consumption in developing countries is expected to increase at an annualrate of 1.1 percent, while feed cereal consumption is expected to increase at an annual rate of 2.1percent.
Table 24. Food, feed and total cereal consumption.
Food Cereals Feed Cereals Total Cereals
Region 1995 2025 Annual 1995 2025 Annual 1995 2025 Annualgrowth growth growth
M ha M ha % M ha M ha % M ha M ha %
All countries (45) 865 1,172 1.0 615 938 1.4 1,718 2,419 1.1
Developed countries 113 132 0.5 304 363 0.6 505 600 0.6Developing countries 752 1040 1.1 311 575 2.1 1,213 1,819 1.4
AFR 66 134 2.4 8 16 2.4 87 178 2.4MENA 59 91 1.5 25 55 2.6 93 161 1.8SA 201 309 1.4 4 11 3.6 227 356 1.5EAP 326 385 0.6 130 297 2.8 511 755 1.3ECA 66 69 0.1 106 118 0.4 220 236 0.2LAC 58 85 1.3 55 109 2.3 124 210 1.8Other countries 89 99 0.3 288 334 0.5 455 523 0.5
Food Supply
In the base scenario, the additional food production, to meet increasing demand will be achievedmainly through productivity improvements with some growth in crop area. The growth inagricultural area and productivity in the base scenario depend on several factors:
• availability of utilizable water resources
• trade
• rural livelihood security and development policies
• irrigation and productivity growth
• domestic and industrial water supply
• water for the environment

48
6A country is categorized as “severe water scarce” if it has developed more than 60 percent of its utilizable water resources.
Utilizable water resources. Growth in area in the future is constrained by the current level ofdevelopment of utilizable water resources. Some countries have already developed a substantialportion of their utilizable water resources and are thus categorized as physically water scarce.6
Some of these countries will have to import food for meeting increasing demand. Some countriesmay shift from low- to high-value crops, and increase trade for meeting increasing demand. Someof the other countries may have reached their development potential, yet have low water useefficiencies. These countries may have enough room for improving efficiencies and, thus, cansave water and increase their crop area through higher cropping intensities.
Trade. Countries with no water scarcities may also shift from low- to high-value crops or improveother sectors of production. Some can meet their future food demand by exporting high-valuecrops. Yet, the world as a whole or even a region as a whole has limits in production increases ofhigh-value crops. If production increases to such an extent that may glut the markets with surpluses,prices will be driven down. This will not help the countries, especially those in the developingworld, that are supposed to benefit from shifts in cropping patterns.
The other alternative here is to reduce attention on the agriculture sector, and develop industrialand service sectors to pay for food imports. Until the industrial and service sectors can expandand absorb most rural labor, and also provide sufficient income, this alternative may not really beviable. The main reason for this is that a large part of the population in the developing regioneven by 2025 is projected to be still rural.
Rural livelihood security. In the short term, countries with a substantial rural population willperhaps be the most affected by possible increases in food trade. Until the other sectors can pay,these countries will have to spend their foreign exchange for importing food, which otherwisewould have been spent on rural development activities. Therefore, the livelihood security of therural population should be a major factor in the growth of agriculture into the next quarter century.For countries with a substantial rural population, the IWMI base scenario assumes an increase infood security and rural income through agricultural development and fewer imports. Thisassumption is very important for regions such as the SA, EAP and Africa. In these regions, morethan 50 percent of the total population will still live in rural areas by 2025; and most of them willdepend on agriculture for their livelihood.
Irrigation. The productivity growth during the last few decades has contributed most to the totalincrease in production. Irrigation, acting synergistically with high-yielding varieties and with betteragronomic practices has contributed substantially to productivity growth. Though the contributionof irrigation to productivity growth is recognized, its extent is not exactly clear. Irrigation hascontributed to yield increase in two ways. It increases average yield by providing more watersupplies to marginal rain-fed lands in a predictable manner. This induces farmers to use more ofother inputs such as better seeds, fertilizers and pesticide, etc., in a less-risky environment andimprove their yields. Therefore, the knowledge of the interaction between irrigation andproductivity growth is important for projecting future productivity growth.
In the base scenario, yield growth projections are based on past trends in yields, the yieldgap (from the current to the technically and economically potential yield), yields of similar agro-climatic conditions, percent irrigated area and fertilizer use.

49
Domestic and industrial supply. With increasing income, urbanization and rapid industrialization,demand for water in the domestic and industrial sectors is increasing. Given that water is a basichuman need in the domestic sector, and has a high value in the industrial sector, water use inthese sectors generally attracts higher priority. In the base scenario, the basic requirements of thesesectors are met first. If sufficient water resources remain after meeting domestic and industrialneeds, the growth of irrigation is considered.
Water for the environment. The environmental sector is commonly neglected in most waterresources planning. Even in this analysis we have not considered the environment sector separately.Yet we have taken precaution to constrain other sectors of water consumption, i.e., total evaporationof primary water supply, so that part of the developed water resources is available directly or asreturn flows for environmental uses such as supplies to estuaries and coastal areas, and suppliesto flush salt and other pollutants, etc. In the base scenario, the total evaporation from the primarywater supply to all sectors cannot exceed 75 percent.
Subject to the constraints and issues raised here, we have assumed values in growth of cerealarea and yield for each country to project its cereal supply in 2025.
Cereal Supply
In the base scenario, the food supply projections are achieved through a combination of yieldand area growth. First we discuss the growth in cereal supply. Then we discuss growth of cerealyield and area. The cereal production and the production surplus or deficit of cereals for differentregions are presented in table 25. The production deficit/surplus is defined as the differencebetween total domestic production and consumption.
With the objective of self-sufficiency, developing countries will increase their domesticproduction and reduce production deficits with respect to consumption. The IWMI base scenarioprojects a slight increase in production deficit (106 M mt deficit in 1995 to 119 M mt deficit in2025) for developing countries. However, this is an improvement in production deficit with respect
Table 25. Cereal production and production surplus or deficit.Cereal Production Cereal Production Surplus or Deficit
Region 1995 2025 Annual 1995 % of total 2025 % of totalgrowth consumption consumption
M mt M mt % M mt % M Mt %
All countries (45) 1,724 2,410 1.1 7 0.4 -9 -0.3
Developed countries 618 710 0.5 113 22 110 18
Developing countries 1,107 1,700 1.4 -106 -9 -119 -7
AFR 79 150 2.1 -8 -9 -27 -15
MENA 54 79 1.3 -40 -42 -82 -51
SA 229 344 1.4 2 1 -11 -3
EAP 475 752 1.5 -36 -7 -3 0
ECA 199 244 0.7 -21 -10 8 3
LAC 113 182 1.6 -11 -9 -29 -14
Other countries 576 660 0.5 120 26 136 26

50
Table 26. Growth of cereal yield.
Irrigated Cereal Yield Rain-Fed Cereal Yield Total Cereal Yield
Region 1995 2025 Annual 1995 2025 Annual 1995 2025 Annualgrowth growth growth
M ha M ha % M ha M ha % M ha M ha %All countries (100) 3.32 4.65 1.1 2.08 2.33 0.4 2.47 3.22 0.9
Developed countries 5.17 6.48 0.8 3.76 4.47 0.6 4.05 4.99 0.7
Developing countries 3.01 4.38 1.3 1.52 1.70 0.4 2.03 2.80 1.1
AFR 2.25 3.19 1.2 0.97 1.26 0.9 1.03 1.35 0.9
MENA 3.08 4.29 1.1 0.81 0.93 0.5 1.85 2.39 0.9
SA 2.55 3.41 1.0 0.94 1.15 0.7 1.77 2.59 1.3
EAP 3.29 5.00 1.4 2.41 2.44 0.0 2.91 4.35 1.3
ECA 3.27 4.10 0.8 1.58 1.91 0.6 1.66 2.02 0.7
LAC 3.96 5.29 1.0 2.08 2.66 0.8 2.34 3.27 1.1
Other countries 5.27 6.60 0.8 4.11 4.89 0.6 4.37 5.36 0.7
to their consumption (a deficit of 9% of consumption in 1965 to a deficit of 7% of consumptionin 2025). On the other hand, developed countries will continue to increase their production but ata slower pace than in the past, resulting in decrease in their production surpluses from 22 percentin 1995 to 18 percent in 2025.
Regions with substantial rural populations, except those in Africa, will be more or less self-sufficient in their cereal production. South Asia will have a small deficit (only 3% of consumption).This is mainly due to Pakistan’s inability to meet its projected cereal demand in 2025. Othercountries in the region will stay at the level of trend self-sufficiency. The East Asian and Pacificregion will convert its production deficits in 1995 to a small surplus in 2025.
The African region’s production deficit will increase from 9 percent of its consumption in1995 to 15 percent of its consumption in 2025. The main reason for this is its high populationgrowth. Also, the MENA region will have to increase its volume of imports, due mainly to existingwater scarcities.
The ECA region is projected to reduce its production deficits and be self-sufficient in 2025.This is mainly due to production increases in transition economies in this region. They will dobetter and increase their growth in production in most sectors in the future than those recordedsince the mid-eighties.
The Latin America and Caribbean region is projected to have minor production deficits in2025. This region, with a smaller proportion of rural population will concentrate more on high-value crops and place more emphasis on other sectors. The region is expected to meet its cerealdemand in the future through imports. However, Argentina, which has been a major cereal exporterin the past, will still have substantial surpluses for export in the future.
Growth in Cereal Yield
The irrigated cereal yield in all countries is projected to increase at an annual rate of 1.1 percentover the 30-year period (table 26). The gap between potential and actual yields in developingcountries is much wider than that in developed countries. This implies that developing countrieshave room for further improvement through better water and land management. Irrigated yieldsin developing countries are projected to increase at an annual rate of 1.3 percent. The averagecereal yield of all countries is projected to increase at an annual rate of 0.9 percent.

51
Table 27. Growth of cereal area. Irrigated Cereal Area Rain-Fed Cereal Area Total Cereal Area
Region 1995 2025 Annual 1995 2025 Annual 1995 2025 Annualgrowth growth growth
M ha M ha % M ha M ha % M ha M ha %
All countries (100) 219 286 0.9 479 463 -0.1 698 749 0.2
Developed countries 31 37 0.5 121 106 -0.4 152 142 -0.2
Developing countries 188 250 1.0 358 357 0.0 546 607 0.4
AFR 4 5 1.2 74 106 1.2 77 112 1.2MENA 13 14 0.2 16 19 0.6 29 33 0.4
SA 67 85 0.8 62 48 -0.8 129 133 0.1
EAP 94 129 1.1 69 44 -1.5 163 173 0.2
ECA 6 6 0.4 114 114 0.0 120 121 0.0
LAC 7 13 2.2 41 43 0.1 48 56 0.5Other countries 29 34 0.5 103 89 -0.5 132 123 -0.2
Growth in Irrigation
The base scenario assumes that growth in cereal irrigated area is an indicator of the total growthof irrigated area. A substantial part of the total gross area growth is due to increase in the irrigationintensity. The net irrigated area of the world is projected to increase by 24 percent—from 253M ha in 1995 to 312 M ha in 2025. The total increase in gross irrigated area over the 30-yearperiod is projected to be 30 percent—from 354 M ha in 1995 to 466 M ha in 2025 (table 28).The difference between the projected gross irrigated area and the net irrigated area, i.e., 53 millionha, is due to increase in irrigation intensity. More than 85 percent of the area gain due to intensityincrease is in developing countries. The countries with a substantial rural population such asthose in South Asia and East Asian and Pacific regions are expected to substantially benefit fromthe intensity increase.
Part of the additional water requirement can be met from the existing supplies throughimprovements in irrigation efficiency or more recycling or both. The remaining waterrequirements, which cannot be met from the existing supplies, will have to be developed asprimary irrigation water supplies. The primary irrigation water supply of the 100 countries isprojected to increase from 1,708 km3 to 2,021 km3.
Growth in Cereal Area
Following the past trends, the cereal area in developed countries is projected to continue to decline.With projected increase in cereal area in developing countries (mainly in Africa) the total cerealarea in all countries will more than offset the area reduction in developed countries, resulting inan overall 3 percent area increase by 2025 (table 27).
The growth in irrigated area of all regions, except in Africa, will be at the expense of marginalrain-fed lands. At present, almost all cereal production in Africa is on rain-fed lands. More newland will be brought under rain-fed cultivation than under irrigation in Africa. A substantial amountof rain-fed cultivated area in South Asia and East Asia will be converted to irrigation. Latin Americaand the Caribbean region has the highest growth in irrigation, almost double the level in 1995.This is mainly due to irrigated area increases in Brazil, where the potential for bringing new areaunder irrigation is high.
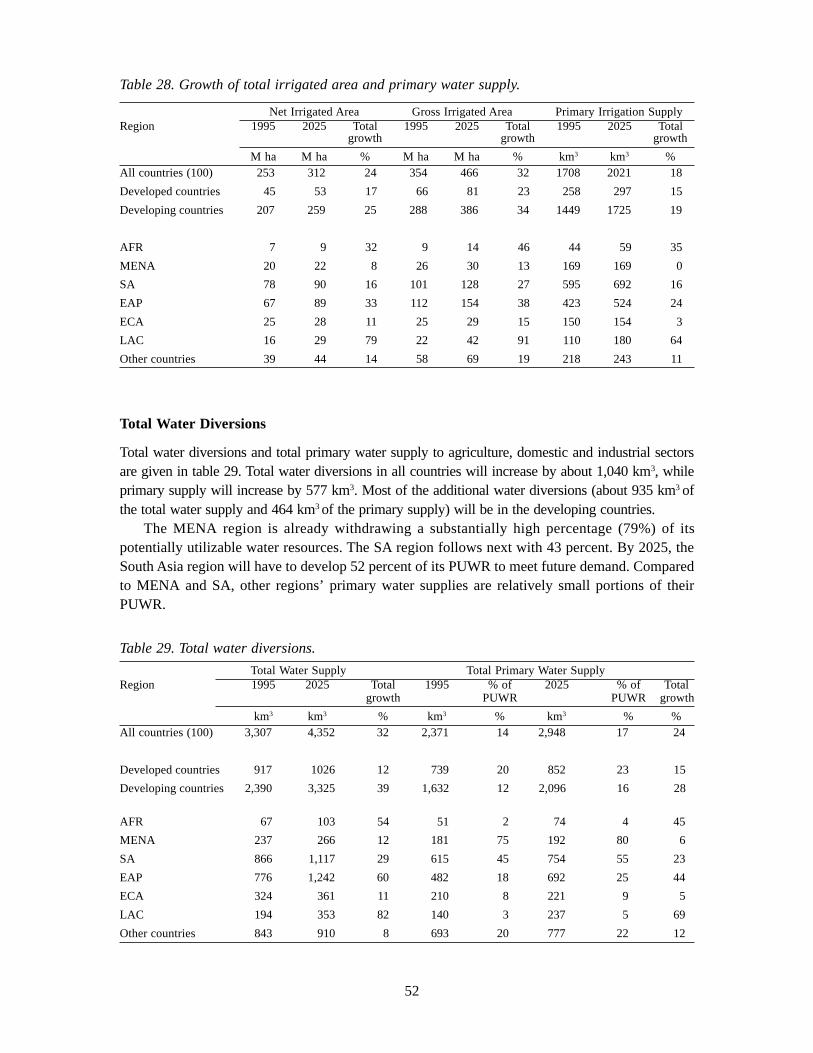
52
Table 29. Total water diversions.
Total Water Supply Total Primary Water SupplyRegion 1995 2025 Total 1995 % of 2025 % of Total
growth PUWR PUWR growth
km3 km3 % km3 % km3 % %All countries (100) 3,307 4,352 32 2,371 14 2,948 17 24
Developed countries 917 1026 12 739 20 852 23 15
Developing countries 2,390 3,325 39 1,632 12 2,096 16 28
AFR 67 103 54 51 2 74 4 45
MENA 237 266 12 181 75 192 80 6
SA 866 1,117 29 615 45 754 55 23
EAP 776 1,242 60 482 18 692 25 44
ECA 324 361 11 210 8 221 9 5
LAC 194 353 82 140 3 237 5 69
Other countries 843 910 8 693 20 777 22 12
Table 28. Growth of total irrigated area and primary water supply.
Net Irrigated Area Gross Irrigated Area Primary Irrigation SupplyRegion 1995 2025 Total 1995 2025 Total 1995 2025 Total
growth growth growth
M ha M ha % M ha M ha % km3 km3 %All countries (100) 253 312 24 354 466 32 1708 2021 18
Developed countries 45 53 17 66 81 23 258 297 15
Developing countries 207 259 25 288 386 34 1449 1725 19
AFR 7 9 32 9 14 46 44 59 35
MENA 20 22 8 26 30 13 169 169 0
SA 78 90 16 101 128 27 595 692 16
EAP 67 89 33 112 154 38 423 524 24
ECA 25 28 11 25 29 15 150 154 3
LAC 16 29 79 22 42 91 110 180 64
Other countries 39 44 14 58 69 19 218 243 11
Total Water Diversions
Total water diversions and total primary water supply to agriculture, domestic and industrial sectorsare given in table 29. Total water diversions in all countries will increase by about 1,040 km3, whileprimary supply will increase by 577 km3. Most of the additional water diversions (about 935 km3 ofthe total water supply and 464 km3 of the primary supply) will be in the developing countries.
The MENA region is already withdrawing a substantially high percentage (79%) of itspotentially utilizable water resources. The SA region follows next with 43 percent. By 2025, theSouth Asia region will have to develop 52 percent of its PUWR to meet future demand. Comparedto MENA and SA, other regions’ primary water supplies are relatively small portions of theirPUWR.

53
Water Scarcity
Countries are grouped into three categories of water scarcity: physical water scarcity, economicwater scarcity and little or no water scarcity (figure 26).
Physical water scarcity. This is defined in terms of the magnitude of primary water supply (PWS)development with respect to potentially utilizable water resources (PUWR). The physical water-scarce condition is reached if primary water supply of a country exceeds 60 percent of its PUWR.This means that even with the highest feasible efficiency and productivity, PUWR of a country isnot sufficient to meet the demand of agriculture, domestic and industrial sectors while satisfyingits environmental needs. Countries in this category will have to transfer water from agriculture toother sectors and import food or invest in costly desalinization plants.
Economic water scarcity. Economic water-scarce countries have sufficient water resources to meettheir additional PWS needs, but they require increasing their PWS through additional storage andconveyance facilities by more than 25 percent. Most of these countries face severe problems relatedto both finance and the capacity for development for increasing PWS to those levels.
The third category includes countries with little or no water scarcity. These countries are notphysically water scarce and also need to develop less than 25 percent of additional PWS to meettheir 2025 needs.
The MENA region as a whole is already physically water scarce (table 29). Indeed mostcountries in this region are physically water scarce, and they already import a substantial amountof their food requirements. Some countries such as Saudi Arabia and Kuwait are already investingin costly desalinization plants (WRI 1998).
Though other regions are not physically water scarce, substantial variations exist withinregions. For example, the South Asian region as a whole is projected to be physically water scarce.But, India, the largest country in the region, is projected to reach the threshold of physical waterscarcity by 2025. Pakistan is already severely water scarce. The EAP region as a whole is endowedwith abundant water resources to meet its increasing water demands. Yet, China is expected topass the threshold of physical water scarcity by 2025. The African region as a whole has sufficientwater resources, but Southern Africa will be in the same situation as China.
It is also important to note that though individual countries face physical water scarcitiessubstantial variations can exist within countries. For example, half of the Indian population livesin the arid northwest and southeast while the other half lives in regions with abundant waterresources. Substantial variations also exist between north and south China. Some parts of Mexicoare physically water scarce while others are not (Barker et al. 2000).
Another important aspect is temporal variation. Some countries, especially those in monsoonalAsia receive most of their rainfall in a few months in the wet season. These countries face severewater-scarce conditions in the other period (Amarasinghe et al.1999; Barker et al. 2000).
No Area Growth Scenario
This scenario assumes no growth in irrigated or rain-fed cereal area and a slower growth in irrigatedyield. We assume half of the irrigated yield growth in the base scenario for the no-growth scenario.This is a rather pessimistic scenario that shows the negative impact of no growth in agriculturalareas on food production. Such a scenario will cause less strain on water resources but will createsubstantial deficits in cereal production.

54
Figure 26. Projected water scarcity in 2025.

55
Figure 27 shows that all regions in the developing world will have substantial cereal deficitsin 2025 under the no area growth scenario. All countries will have a production deficit of 419 Mmt, equivalent to about 17 percent of their consumption. The greatest impact under the no areagrowth scenario will be in South Asia and EAP regions. In South Asia, the production deficitsare projected to increase from 11 M mt under the base scenario to 89 M mt under the no areagrowth scenario. In East Asia, production deficit is projected to increase from 3 M mt under thebase scenario to 182 M mt under the no area growth scenario. These regions being home to alarge number of poor people will be affected the most under the no area growth scenario. Indeed,this scenario shows the significant role of irrigation on future food production in the developingregion.
As mentioned at the beginning of the chapter, for countries with substantial rural populationsthe base scenario projections reflect an increase in food security and rural income through increasedagricultural development. Indeed, the base scenario requires some increases in area developmentor increases in agricultural productivity or both. The no growth area scenario projects thatdeveloping regions would experience substantial food production deficits. As these regions arehome to most of the rural population, it is expected that no agricultural area development wouldmostly affect the rural population. Therefore, it is expected that the level of future agriculturaldevelopment could be strongly associated with future rural-development strategies.
Figure 27. Cereal production surplus or deficit.

56
Table 30. Rural population by region—past and future trends.
Rural PopulationRegion 1965 % of 1965 1995 % of 1995 2025 % of 2025
Total Total Total
All countries 2,157 65 3,113 55 3,303 42
Developed counties 226 31 213 23 164 16
Developing countries 1,931 74 2,900 61 3,139 46
AFR 215 86 404 71 633 58
MENA 73 61 120 42 145 30
SA 531 82 917 73 1,082 57
EAP 833 81 1,191 67 1,053 47
ECA 176 51 155 34 113 23
LAC 116 46 127 26 123 18
Other countries1 213 30 198 23 156 171Percent with respect to the UN medium projection.Sources: UN 1999; FAO 1998.
Water for Rural Development
Rural Population
A large majority of the world’s population still lives in rural areas, and this majority dependsdirectly or indirectly on agriculture. In 1995, the world’s rural population was estimated to be 55percent of its total population. While this represents a decline of 10 percent from the proportionof rural population in 1965 (estimated to be 65%), in absolute terms, the rural population hasincreased from 2.1 billion in 1965 to 3.1 billion in 1965 (table 30). Much of the growth in ruralpopulation has been in Africa, South Asia, MENA and the EAP regions, which experienced growthrates of 88 percent, 73 percent, 66 percent and 43 percent, respectively, over this period. Thesefour regions are home to 85 percent of the 1995 rural population. However, proportions of ruralpopulations in the ECA and LAC regions have been declining.
The world’s rural population is projected to grow at a slower rate over the coming decades,due to rapid urbanization and industrialization, particularly in developing countries. The total ruralpopulation over the next 30 years is projected to increase only by 6 percent, from 3.1 billion in1995 to 3.3 billion in 2025. While the rural population in Africa, South Asia and MENA regionsis projected to grow by 56 percent, 18 percent and 20 percent, respectively, the rural populationin the EAP, LAC and ECA regions is projected to decline by 12 percent, 4 percent, and 27 percent,respectively. However, even with the projected slow growth in the overall rural population, morethan 3.3 billion people are projected to live in rural areas by 2025, with over 90 percent of themprojected to live in South Asia, EAP, Africa and the MENA regions.
Water and Rural Development: Past Links
As mentioned earlier, a large majority of the rural population of developing countries depends onagriculture. The development of irrigated agriculture in the past has helped in reducing ruralunemployment and poverty, contributing to rural development, and in achieving partially or fullythe goal of food self-sufficiency. For example, India, home to 25 percent of the world’s ruralpopulation, has been more or less self-sufficient in food since the mid-seventies. China, another

57
country with a substantial proportion of the world’s rural population, produces more than two-thirds of its cereal from irrigated agriculture.
While irrigation development has been a major priority to expand agricultural frontiers, therehas been relatively less attention towards domestic-sector water-development works in developingcountries. In 1995, the developed and developing countries are estimated to have diverted 14percent and 6 percent, respectively, of the total withdrawals for domestic use. South Asia, EAPand Africa, with the highest concentration of the world’s rural population, have diverted only 2percent, 6 percent and 10 percent of the total withdrawals, respectively, for domestic uses.
The annual average per capita domestic diversion in the developed and developing countriesis estimated at 140 m3 and 31 m3, respectively. The per capita domestic withdrawals of somedeveloping regions are even smaller than 20 m3, which is recommended as the basic waterrequirement (BWR7) for a human being (Gleick 1996). For example, in 1995, Africa and SouthAsia are estimated to have withdrawn about 15 m3 annually per person for domestic use. Thesevalues reflect the national averages, and since most domestic water supply developments havetaken place in urban areas, the rural population has received domestic supplies that are considerablylower than the national averages.
Water for Rural Development: Future Directions
Industrial and urban sectors in most developing countries are continuing to expand and overallgrowth in these sectors is projected to be much higher in the future than in the past. The urbanpopulation in all regions except South Asia and Africa are projected to outnumber the ruralpopulation over the next 30 years. However, because of the large base population, the number ofpeople living in rural areas is projected to be as high as the present levels. Consequently, thepressures on available water resources will continue to increase.
The vision for the future, according to the recently concluded second World Water Forum(Cosgrove and Rijsberman 2000) in The Hague is:
In the regional consultations leading to the final vision at The Hague Forum, all regions haveagreed that providing safe and adequate drinking water supply and adequate sanitation facilitiesfor all human beings will have the highest priority in the coming decades.
Domestic water supply. At present, more than 40 percent of the rural population is estimated tohave no access to safe drinking water supply and a significant number of people do not have accessto the minimum required levels (World Bank 2000; WRI 1998). Moreover, 80 percent of the ruralpopulation is estimated to have no access to adequate sanitation. This means that about 1.8 billionpeople in rural areas are yet to receive new and increased domestic water supply facilities overthe next three decades, which will require substantial increases in domestic withdrawals.
In the IWMI base scenario, most developing regions are projected to more than double theirdomestic water supply (table 31). Except for the African region, this level of increase would ensure
7BWR is the recommended basic water requirement for domestic needs—drinking, sanitation, bathing and cooking,independent of climate, technology and culture—and per person per day it is 50 liters (Gleick 1996).
A world in which all people have access to safe and sufficient waterresources to meet their needs, including food, in ways that maintain theintegrity of freshwater ecosystems.

58
Table 31. Per capita domestic and industrial withdrawals and growth in total domestic andindustrial withdrawals.
Region Per Capita Domestic Per Capita Industrial Growth1 in WaterWithdrawals Withdrawals Withdrawals
1995 2025 1995 2025 Domestic Industrialm3 m3 m3 m3 % %
All countries (100) 52 74 119 148 87 62
Developed counties 140 153 437 455 20 15
Developing countries 31 56 44 82 147 154
AFR 15 20 7 10 140 140
MENA 55 66 40 49 100 105
SA 13 28 15 45 219 326
EAP 27 78 31 119 251 370
ECA 85 105 240 259 29 12
LAC 68 95 46 75 95 125
Other countries1 155 162 511 542 11 121Growth of water withdrawals from 1995 to 2025 estimated under the IWMI base scenario.Sources: WRI 2000; World Bank 2000; IWMI 2000.
an average per capita domestic supply above the basic water requirement (BWR). In Africa,however, per capita domestic water withdrawals at present are significantly below the BWR. Toraise average per capita domestic supply even to the level of BWR, Africa will have to increaseits total domestic water supply by 140 percent.
Irrigation water supply. Despite the expected large growth in water withdrawals for the domesticsector, the agriculture sector will still remain the dominant water user in developing countries.Thelevel of water use in the agriculture sector will be influenced by goals of self-sufficiency andfood security at local, regional and national levels. In the past, food self-sufficiency has been themajor goal of most developing countries. This has helped developing countries in increasing foodproduction, improving overall food availability for rural households and reducing ruralunemployment and has had overall positive effects in terms of reducing poverty.
However, as stated earlier, a significant proportion of the rural population in low-incomedeveloping countries is still below the poverty line. These countries are expected to continue topursue a food self-sufficiency policy. In the consultations leading to The Hague Water Forum,some regions have agreed on food self-sufficiency goals over the next 30 years (WWC 2000).
The past trends indicate that in most regions, except Africa, agricultural area expansions havereached their potential limits. With the closing of land frontiers, future increases in food productionin these regions are expected to come mainly from productivity increases and by supplementaryirrigation of marginal rain-fed lands. In the IWMI base scenario, the EAP and ECA regions areprojected to be self-sufficient in cereals (table 25). South Asia and LAC regions are projected toexperience slight deficits, while Africa and MENA regions are projected to have substantial deficits.
Rain-fed cultivation dominates cereal production in the African region, and most countries inthis region are operating at a level that is far below their true irrigation potential (WWC 2000).Productivity in irrigated lands is twice that in the rain-fed lands, and the average productivitylevels are much lower than those in most other regions. Also, due to unreliable rainfall patterns,rain-fed crop failures are common in the region. Therefore, with a combination of expansion of

59
irrigation over marginal rain-fed lands, whether through surface storage or through micro-scaleirrigation techniques, an increase in productivity would have a substantial impact on food andlivelihood security of the African rural population.
The MENA region is projected to have substantial deficits in cereal production (table 25).Utilizable water resource availability is a severe constraint in this region. Only a few options areavailable in the future for most MENA countries. These countries will need to transfer water tohigh-value sectors, and in an agriculture sector they will need to shift cropping patterns to high-value crops, and import more grains.
South Asia is also projected to have a slight deficit in cereal production. This region is expectedto have the largest rural population in the world by 2025. As in the past, agriculture, and hence,water, will be crucial for rural development. However, the inadequacy of the availability ofutilizable water resources is projected to be a major constraint for future irrigation expansions.For example, Pakistan is already severely water scarce, and some regions in India are expected toreach their irrigation potential soon. The productivity of both irrigated and rain-fed agriculture inmost of South Asia is substantially lower than in other regions with similar agro-climatic conditions(Molden et al. 2001). A slight increase in productivity over and above the base scenario wouldensure food self-sufficiency for the South Asian region. Because of the large rural population inSouth Asia and the small size of landholding per person actively engaged in agriculture, the ruralpopulation would benefit substantially from increasing water productivity, i.e., increasing cropper drop.
Unlike other developing regions, the contribution of the agriculture sector to the gross domesticproduction in the ECA and LAC regions is much smaller. Rain-fed farming is the dominantcontributor to the agriculture production. For example, the irrigated cereal area in the ECA andLAC regions are only 5 percent and 14 percent, respectively, of the total cereal area and no majorshift from rain-fed farming is expected in the future. Yet, there is considerable scope for improvingwater productivity in both regions.
Other water supply. There is evidence that the industrial and service sectors of developing countriesare expanding and that competition for scarce water resource is increasing. In view of the increasingdemand, the IWMI base scenario projects that withdrawals for the industrial sector will be greaterthan those for the domestic sector in most developing countries. South Asia and EAP regions areprojected to quadruple their industrial supplies over the next 30 years. In Africa, MENA and LACregions, industrial water withdrawals are projected to double over the next 30 years.
Similarly, the water allocation to the environment sector, which has received little attentionin the past, is projected to increase significantly. Reliable past data on water needs in theenvironment sector are not available. Yet there is evidence that a substantial part of the primarywithdrawals that were not used beneficially in the intended sectors are being used beneficially inthe environment sector (Renault 1999). However, in the future, countries will have to allocatepart of their developed water resources to the environment sector to flush out salt and otherpollutants, to keep minimum levels of water flow in the rivers, and to maintain natural ecosystems.Further research is required to determine the level of water requirements in these sectors.
Summary
Only less than 1 percent (or 43,000 km3) of the world’s freshwater resources is available forbeneficial human uses. In 1995, the average annual per capita renewable water resources was

60
estimated at 7,500 m3, which decreased by 41 percent from the 1965 level. With increasing worldpopulation, average annual per capita water availability is projected to further decrease to 5,500 m3
in 2025. While the available water resources at the global level may be sufficient to fulfill humanneeds, their distribution across countries and regions is very uneven. On one extreme, LatinAmerican and the Caribbean countries with only 8 percent of the world’s population are endowedwith 34 percent of the world’s total renewable water resources. On the other extreme, South Asiawith over one-fifth of the world’s population has only 5 percent of the renewable water resources.Also, there are significant variations in water resource endowments within each of these regions.
Agriculture is the dominant user of water, accounting for 74 percent of the total water suppliesin 1995. However, water diversions to the agriculture sector in developing countries are twicethose in developed countries. South Asia, Middle East and North Africa (MENA) and Africaregions divert the largest proportions of their water supplies to agriculture, with the smallestproportions diverted to their industrial sectors. However, with the rapid growth in urban andindustrial sectors in these countries, water diversions to these sectors will increase over the nexttwo and a half decades.
As a result of agricultural and rural development efforts, the world has been able to producemore food than its consumption requirements. The world food production has almost doubledsince 1965, and the total calorie consumption has increased by 86 percent over the past threedecades. With the closing of land frontiers, crop areas have expanded only marginally. Productivitygrowth has been a major driving force for increased food production. Expansion in irrigation,adoption of high-yielding varieties, use of chemical fertilizers and better agronomic practices werethe major contributing factors to productivity increases. At present, the world’s irrigated cerealarea accounts for 30 percent of the total harvested area but it contributes up to 43 percent of thetotal cereal production. On average, productivity on irrigated cereal lands is 60 percent higherthan that on rain-fed lands. However, there are substantial variations in irrigated cereal productivityacross regions and countries. For example, productivity of irrigated cereals in South Asia, andthe East Asia and Pacific (EAP) regions is 172 percent and 100 percent, respectively, higher thanthat of rain-fed cereal lands.
After the 1980s, the South Asian region was able to keep its production surpluses or deficits(difference between domestic production and consumption) within 5 percent of the consumptionneeds even under extreme climatic conditions. In the EAP region, average per capita calorie supplyincreased by 37 percent over the period 1965 to 1995. While the region has been a net cerealimporter, total production has increased from 183 M mt in 1965 to 476 M mt in 1995, due mainlyto productivity increases associated with irrigated area expansions in the region. Similarly,irrigation-induced productivity growth in MENA and LAC regions has contributed significantlyto the overall increase in food production in these regions.
Unlike in other regions, productivity growth in Africa has been very low. While cerealproduction over the past 30 years has more than doubled, it has resulted mainly from area expansionwith a relatively smaller contribution from productivity growth. Only 5 percent of the total cerealarea is estimated to be irrigated in 1995. This region has benefited the least from the global waveof irrigation development over the past three decades.
Looking ahead, cereal area in developed countries is projected to continue to decline in theIWMI base case scenario. However, it is expected to increase in developing countries, mainly inAfrica. A significant part of the rain-fed area in South Asia and East Asia is projected to beconverted to irrigated areas, and more new lands are expected to be brought under rain-fedcultivation in Africa. Irrigated cereal yield in all countries is expected to grow by 1.1 percent perannum over the next 25 years in the IWMI base case. With the objective of self-sufficiency,

61
developing countries are projected to increase their domestic production and reduce their deficits.Developed countries will continue to increase their production but at a slower pace than in thepast, resulting in decreases in their production surpluses by 2025. South Asia is projected toexperience a small deficit due mainly to a projected increase in cereal demand in Pakistan by2025. The EAP and Europe and Central Asia (ECA) regions are projected to reduce their productiondeficits and achieve self-sufficiency or a situation of small surplus by 2025. However, productiondeficits in Africa are projected to increase from 16 percent in 1995 to 21 percent in 2025. Similarly,production deficits in the MENA region are projected to increase due to water scarcities.
In the water-scarce, production-deficit regions, land degradation is also a major issue. AnIBSRAM study on land degradation indicates that this problem has been moderate in Africa andLAC, strong in EAP, and severe in MENA and SA. The study further suggests that, while largeinvestments will be required to bring new lands under cultivation in Africa, major interventionswill be needed in EAP, MENA and SA to increase production and to prevent further landdegradation. While, both this and the IBSRAM study reach the same conclusion that MENA andSA will experience a food deficit, the projected magnitudes are different in the studies (the formerprojecting moderate imports, the latter indicating massive food imports by these regions).
Most of the growth in water supply will occur in the developing countries. However, MENA,which is already physically water scarce, and South Asia are projected to experience water scarcity.While EAP and Africa will have sufficient water resources, China and Southern Africa are projectedto pass the threshold of physical water scarcity.
The following key points regarding the future water situation should be noted.
• Water is becoming an extremely scarce resource in many countries, with growing demandsand increasing competition across sectors and uses.
• With rapid growth in urbanization and industrialization in most developing countries,demand for water in these sectors is expected to continue to grow, which will requiretransfer of water from agriculture to these sectors.
• Water allocations to the environmental sector, which received little attention in the past,are expected to increase with growing recognition of the need and benefits of water inthis sector.
• Despite the expected large growth in water withdrawals for the above sectors, agriculturewill remain the dominant water user in most developing countries.
• Even with projected slow growth in the overall rural population, over 3.3 billion peoplewill live in rural areas by 2025, with over 90 percent of them projected to live in SouthAsia, EAP, MENA and the Africa regions.
• Sustainable agricultural development and crop productivity enhancements will remainimportant for rural poverty alleviation and overall rural development in the developingregions. Sustainable and environmentally friendly irrigation development will be the keydriving force to achieve growth in productivity.
• Countries facing economic water scarcity will need to develop additional water suppliesthrough investments in additional water storage infrastructure or micro-scale irrigationdevelopments. Those under physical water-scarcity conditions will need to invest intechniques to improve the productivity of water and in the overall improved managementof water resources.

62
Table 33. Region–MENA.
Factor Units 1995 2025 Annual Growth (%)Value Projection 1995–2025
Population Million 271 443 1.7Cereal demand M mt 93 161 1.8
Cereal production – Total M mt 54 79 1.3– Irrigation M mt 41 61 1.3– Rain-fed M mt 13 18 1.0
Growth in total irrigated area M ha 26 30 0.4
Primary Water supply (PWS) km3 181 192 0.2PWS - % of PUWR % 75 80
Water diversions – Total km3 237 267 0.4– Irrigation km3 214 219 0.1– Domestic km3 13 27 2.3– Industrial km3 10 20 2.4
Water-scarcity level Physically Water Scarce (2025 PWS>60% of PUWR)
Table 32. Region–Africa.Factor Units 1995 2025 Annual Growth (%)
Value Projection 1995–2025Population Million 583 989 2.1Cereal demand M mt 87 178 2.4
Cereal production – Total M mt 79 150 2.1– Irrigation M mt 8 16 2.4– Rain-fed M mt 71 134 2.1
Growth in total irrigated area M ha 9 14 1.3
Primary water supply km3 51 74 1.2PWS1, % of PUWR2 % 2 4
Water diversions – Total m3 66.9 103.2 1.5– Irrigation km3 56.4 76.8 1.0– Domestic km3 7.3 18.3 3.1– Industrial km3 3.3 8.1 3.1
Water-scarcity level 3 Economic water scarcity (Total PWS<60% of PUWR but totalgrowth in PWS is>25%)
1PWS = Primary water supply.2PUWR = Potentially utilizable water resources.3Physical water scarce: If 2,025 PWS>60% of PUWR. Economic water scarce: If 2,025 PWS<60% PUWR but the ratio, 2,025PWS/1995 PWS>125%.
• Irrigation-induced environmental problems are increasing in many countries, particularlyAsian countries, and need to be addressed on a priority basis, as these problems haveserious consequences for productivity and poverty.
In concluding, we present the summary of the projections of key variables, the majorconclusions on projected food and water situation, and the issues that are important to be consideredin designing rural development strategies for different regions (see tables 32 to 37 and theconclusions).

63
Table 34. Region–South Asia.
Factor Units 1995 2025 Annual Growth (%)Value Projection 1995–2025
Population Million 1,233 1,762 1.2Cereal demand M mt 227 356 1.5
Cereal production – Total M mt 229 344 1.3– Irrigation M mt 170 289 1.8– Rain-fed M mt 58 55 -0.2
Growth in total irrigated area M ha 101 128 0.8
Primary Water supply (PWS) km3 615 754 0.7
PWS - % of PUWR % 45 55
Water diversions – Total km3 866 1117 0.9– Irrigation km3 831 988 0.6– Domestic km3 16 50 3.9– Industrial km3 19 80 4.9
Water-scarcity level No water scarcity (Total PWS<60% of PUWR and total growthin PWS is<25%)
Table 35. Region–EAP.
Factor Units 1995 2025 Annual Growth (%)Value Projection 1995–2025
Population Million 1,759 2,158 0.7Cereal demand M mt 511 755 1.3
Cereal production – Total M mt 475 752 1.5– Irrigation M mt 308 644 2.5– Rain-fed M mt 168 107 -1.5
Growth in total irrigated area M ha 112 154 1.1
Primary Water supply (PWS) km3 492 692 1.2 PWS - % of PUWR % 17 25
Water diversions – Total km3 776 1,242 1.6– Irrigation km3 674 818 0.6– Domestic km3 47 168 4.3– Industrial km3 55 256 5.3
Water-scarcity level Economic water scarcity (Total PWS<60% of PUWR but totalgrowth in PWS is>25%)
Table 36. Region–ECA.
Factor Units 1995 2025 Annual Growth (%)Value Projection 1995–2025
Population Million 386 401 0.1Cereal demand M mt 220 236 0.2
Cereal production – Total M mt 199 244 0.7– Irrigation M mt 19 26 1.1– Rain-fed M mt 180 218 0.6
Growth in total irrigated area M ha 25 29 0.5
Primary Water supply (PWS) km3 210 221 0.2 PWS - % of PUWR % 8 9
Water diversions – Total km3 324 361 0.4– Irrigation km3 199 216 0.3– Domestic km3 33 42 0.8– Industrial km3 93 104 0.4
Water-scarcity level No water scarcity (Total PWS < 60% of PUWR and total growthin PWS is<25%)

64
Table 37. Region–LAC.
Factor Units 1995 2025 Annual Growth (%)Value Projection 1995–2025
Population Million 461 644 1.1Cereal demand M mt 124 210 1.8
Cereal production – Total M mt 113 182 1.6– Irrigation M mt 27 68 3.2– Rain-fed M mt 86 113 0.9
Growth in total irrigated area M ha 22 42 2.2
Primary Water supply (PWS) km3 140 237 1.8 PWS - % of PUWR % 3 5
Water diversions – Total km3 194 352 2.0– Irrigation km3 141 243 1.8– Domestic km3 31 61 2.3– Industrial km3 21 48 2.7
Water-scarcity level Economic scarcity (Total PWS<60% of PUWR but total growthin PWS is>25%)
Major Conclusions—Africa
• The cereal production deficit (production minus demand) is projected to widen from 9percent of the total demand in 1995 to 15 percent of the total demand in 2025.
• The African region is endowed with substantial renewable water resources not yet tappedfor human use. Even though there is a projected increase of 45 percent in primary watersupply (PWS), PWS is projected to be only 4 percent of potentially utilizable waterresources. Therefore, the region as a whole is projected to be economic water scarcebecause of the need of financial and human resources to develop the resource. Much ofsub-Saharan Africa is like this with the notable exception of much of southern Africa andSouth Africa, which as a country is physically water scarce.
• Irrigation is a small contributor to total food needs. There is apparently scope for expandingirrigation, but much effort is required in designing sustainable irrigation practices suitedto African conditions.
Issues of Importance
• Most countries in the region can be categorized into high potential/high need areas. Onlythe southern-most Africa is water scarce.
• Substantial contribution of rain-fed agriculture to total production despite low landproductivity.
• Scope for productivity improvements through supplemental irrigation in marginal rain-fed lands.

65
• Innovative smallholders’ water and land management systems may offer solutions for poorsmallholder farmers, especially if the institutional arrangements relating to land/waterrights are adequately understood.
• Groundwater development opportunities.
• Concerns for environment and human health.
Major Conclusions—MENA Region
• Cereal production deficit (production minus demand) as a percent of total demand isprojected to increase from 42 percent in 1995 to 51 percent in 2025.
• The MENA region is already physically water scarce (1995 primary water supply>60%of potentially utilizable water resources). The primary water supply is projected to increaseby only 11 km3 while total water diversions are projected to increase by 30 km3. Thedomestic and industrial sectors are projected to account for two-thirds of the total diversionincrease. Most of the increases in total diversion to domestic and industrial sectors areexpected to be realized through recycling, or transfers of water from the agriculture sector.
Issues of Importance
• Most of the countries fall into the water-scarce category.
• Competition between sectors.
• Deteriorating water quality.
• Groundwater overdraft.
• The need for water productivity increases.
• The importance of trade.
Major Conclusions—South Asia
• A small deficit of cereal production is projected in 2025 (3% of total demand) from asmall production surplus of 1% of the 1995 demand. The region as a whole is projectedto be self-sufficient.
• The region as a whole is not water scarce because of the substantially high waterendowment of a few countries like Bangladesh. The region can be split into two broadcategories. A substantial part of South Asia, including Pakistan and the arid regions ofIndia are physically water scarce. Other parts are economically water scarce.

66
• In the physically water-scarce regions, sustainable increases in the productivity of waterin agriculture are a key focus. In other regions, there remains considerable scope foractivities of pro-poor water-resources development.
Issues of Importance
• Most parts of South Asia are categorized into water-scarce areas. Other parts are highpotential areas.
• Competition between sectors is projected to increase in water-scarce areas.
• There are opportunities in groundwater development in high potential areas.
• Groundwater overdevelopment in water-scarce areas.
• Deteriorating water quality.
• Concerns for environment and human health.
Major Conclusions—EAP Region
• The EAP region is projected to be self-sufficient in cereals in 2025 (a production deficitof 0.3% of the total demand in 2025 from a production deficit of 7% of the total demandin 1995).
• The region as a whole is only economically water scarce. However, the arid parts of China,the largest country in the region, is projected to be physically water scarce.
Issues of Importance
• The major part of EAP, especially the arid region of China, is water scarce. Other partsfall into the category of high-potential area.
• There is some concern about national food security in China because of unsustainableirrigation practices, including groundwater overdraft, in North China.
• Competition between sectors will increase.
• There are opportunities for water-resources development in high-potential areas.
• Groundwater overdevelopment in water-scarce areas is a major threat.
• Deteriorating water quality.
• Concerns for environment and human health.

67
Major Conclusions—ECA Region
• The ECA region is projected to have a small production surplus in 2025 (3% of the totaldemand) from a substantial production deficit in 1995 (10% of the 1995 demand).
• The region is not water scarce.
Issues of Importance
• Most parts of the region fall into the category of high-potential area.
• There is a substantial contribution from rain-fed agriculture to total production.
• Productivity improvements through supplemental irrigation in marginal rain-fed lands.
• Opportunities for groundwater development.
• Threats of groundwater overdevelopment.
• Deterioration of water quality.
Major Conclusions—LAC Region
• The LAC region is projected to stay in the cereal production deficit side (9% of the totaldemand in 1995 to 14% of the total demand in 2025).
• The region is endowed with substantial renewable water resources. The primary watersupply is only a small portion of the renewable water resources. However, the region isprojected to be economically water scarce because of the heavy water-related investmentsrequired to increase food production.
• Irrigation development and management continue to be an important issue.
Issues of Importance
• Most parts of the region fall into the category of high-potential area.
• Substantial contribution from rain-fed agriculture to total production.
• Supplemental irrigation in marginal rain-fed lands.
• Smallholder land and water-management systems.
• Opportunities of groundwater development.
• Threats of groundwater overdevelopment.
• Deterioration of water quality.

68
Figure A1. Cereal requirement variables in the PODIUM.
Appendix A
The PODIUM Model
The computations of the PODIUM model involve three major steps. First, the national cerealrequirement of country, based on population, daily calorie intake and composition of diets areestimated (figure A1). Second, the cereal production, based on expected yields, and areas underboth irrigated and rain-fed conditions are estimated (figure A2). Third, the water demand for theprojected food production is estimated (figure A3). The PODIUM is developed in two versions:country-level PODIUM model (available at IWMI’s website http://www.iwmi.org) and global- levelPODIUM model. The country-level PODIUM data are entered into the global-level PODIUM andaggregated at a desired level. (Please refer to IWMI 2000, for more information on the computationin PODIUM).
The PODIUM projections for 100 countries under the base scenario (as displayed in tablesB1 to B7 for regions) are given in appendix B.

69
Figure A2. Cereal production variables in the PODIUM.
Figure A3. Water requirement variables in the PODIUM.

70
Angola AFR 11.0 24.4 2.7 1927 2127 0.3 0.7 1.8 3.22 0.0 0.1 4.4 0.8 2.1 3.3
Benin AFR 5.3 10.8 2.4 2363 2607 0.3 0.6 1.4 2.88 0.0 0.1 4.0 0.8 1.9 2.9
Burkina Faso AFR 10.4 22.9 2.7 2254 2482 0.3 2.2 5.5 3.16 0.0 0.0 0.0 2.6 6.5 3.2
Burundi AFR 6.2 11.3 2.0 1711 1953 0.4 0.2 0.4 2.44 0.0 0.0 3.5 0.3 0.7 2.5
Cameroon AFR 13.2 25.3 2.2 2200 2425 0.3 1.3 2.8 2.70 0.0 0.0 3.8 1.5 3.3 2.7
Cent Afr Rep AFR 3.3 5.5 1.7 1928 2126 0.3 0.1 0.3 2.24 0.0 0.0 3.4 0.2 0.3 2.3
Chad AFR 6.7 13.5 2.4 1902 2100 0.3 0.8 2.0 2.87 0.0 0.1 4.0 1.0 2.4 2.9
Congo, Dem R AFR 45.4 101.9 2.7 1879 2072 0.3 1.6 4.1 3.25 0.0 0.1 4.4 1.8 4.8 3.3
Congo, Rep AFR 2.6 5.5 2.6 2125 2344 0.3 0.1 0.3 3.11 0.0 0.0 4.3 0.1 0.3 3.1
Côte d’Ivoire AFR 13.5 22.5 1.7 2378 2623 0.3 1.5 2.9 2.22 0.1 0.2 3.4 1.9 3.7 2.3
Dominican Rep AFR 7.8 10.8 1.1 2323 2724 0.5 0.6 0.9 1.33 0.7 1.5 2.7 1.3 2.5 2.1
Ethiopia AFR 55.4 111.8 2.4 1781 2035 0.4 8.1 18.5 2.78 0.1 0.5 3.9 9.2 21.1 2.8
Ghana AFR 17.6 35.6 2.4 2562 2824 0.3 1.5 3.6 2.86 0.1 0.2 4.0 2.0 4.8 2.9
Guinea AFR 7.2 12.3 1.8 2134 2353 0.3 0.8 1.6 2.32 0.0 0.0 0.0 0.9 1.9 2.3
Kenya AFR 27.2 39.9 1.3 1990 2271 0.4 3.3 5.5 1.69 0.1 0.3 2.8 3.7 6.2 1.7
Madagascar AFR 13.7 28.2 2.4 1991 2272 0.4 1.5 3.4 2.83 0.1 0.4 3.9 1.9 4.6 2.9
Mali AFR 9.9 20.5 2.4 2099 2314 0.3 2.0 4.7 2.96 0.0 0.0 0.0 2.2 5.4 3.0
Mauritania AFR 2.3 4.6 2.3 2975 2902 -0.1 0.4 0.9 2.96 0.0 0.1 4.1 0.4 1.1 3.0
Mozambique AFR 17.4 29.9 1.8 1718 1929 0.4 1.5 2.9 2.25 0.0 0.0 3.4 1.6 3.1 2.3
Niger AFR 9.2 21.1 2.8 2090 2305 0.3 1.9 5.2 3.34 0.1 0.4 4.5 2.5 6.9 3.4
Nigeria AFR 99.0 178.7 2.0 2554 2822 0.3 14.2 28.8 2.39 2.0 5.0 3.2 21.0 43.7 2.5
Senegal AFR 8.3 16.3 2.3 2392 2638 0.3 1.4 3.1 2.77 0.0 0.1 3.9 1.6 3.7 2.8
Somalia AFR 8.2 20.5 3.1 1579 1802 0.4 0.4 1.1 3.52 0.0 0.0 0.0 0.4 1.2 3.5
South Africa AFR 37.5 43.9 0.5 2882 2996 0.1 7.7 9.2 0.63 3.6 4.8 1.0 12.3 15.2 0.7
Sudan AFR 26.6 45.0 1.8 2354 2704 0.5 4.3 8.2 2.19 0.1 0.3 3.2 4.9 9.4 2.2
Tanzania AFR 29.9 55.3 2.1 2017 2302 0.4 3.2 6.7 2.48 0.2 0.4 3.6 4.3 9.1 2.5
Table B 1. Population and per capita per day Table B 2. Food, feed and total cereal consumption. calorie supply.
Population Per Capita Calorie Supply Food Cereal Feed Cereal Total Cereal
Country Region 1995 2025 Annual 1995 2025 Annual 1995 2025 Annual 1995 2025 Annual 1995 2025 Annualgrowth growth growth growth growth
Million Million % kcal kcal % M mt M mt % M mt M mt % M mt M mt %

71
Malaysia EAP 20.1 29.7 1.3 2848 3137 0.3 2.6 4.0 1.44 2.3 5.1 2.7 5.2 9.7 2.1
Myanmar EAP 42.9 55.5 0.9 2711 2929 0.3 9.9 13.0 0.91 0.6 1.6 3.4 11.6 16.1 1.1
Philippines EAP 68.4 104.2 1.4 2366 2688 0.4 8.7 13.3 1.43 3.9 10.7 3.4 13.7 25.9 2.1
Thailand EAP 58.6 70.4 0.6 2330 2473 0.2 7.3 8.0 0.28 5.1 11.2 2.7 14.2 21.4 1.4
Vietnam EAP 73.9 105.5 1.2 2449 2715 0.3 13.3 19.8 1.33 0.4 1.2 3.4 15.7 24.1 1.4
Hungary ECA 10.2 8.7 -0.5 3359 3454 0.1 1.2 1.0 -0.68 6.6 7.5 0.5 10.0 10.5 0.2
Kazakhstan ECA 16.5 16.7 0.0 3117 3284 0.2 4.0 4.1 0.11 4.3 5.2 0.7 11.9 13.2 0.3
Kyrgyzstan ECA 4.6 7.6 1.7 2398 2526 0.2 0.8 1.3 1.78 0.5 1.1 2.4 1.5 2.8 2.0
Poland ECA 38.6 38.6 0.0 3309 3401 0.1 6.0 5.7 -0.16 16.1 19.7 0.7 25.9 29.4 0.4
Romania ECA 22.7 19.8 -0.5 2927 3008 0.1 3.9 3.2 -0.63 10.5 10.2 -0.1 17.2 15.9 -0.3
Russian Fed ECA 148.1 134.5 -0.3 2814 2894 0.1 22.2 19.8 -0.38 42.9 45.7 0.2 84.2 83.1 0.0
Tajikistan ECA 5.8 8.5 1.3 2231 2351 0.2 1.1 1.7 1.36 0.0 0.1 1.9 1.2 1.8 1.4
Turkey ECA 61.3 83.5 1.0 3563 3501 -0.1 13.9 17.7 0.81 6.4 10.2 1.6 29.8 40.3 1.0
Turkmenistan ECA 4.1 6.1 1.3 2583 2721 0.2 0.7 1.1 1.38 0.5 0.8 2.0 1.4 2.2 1.6
Ukraine ECA 51.4 45.1 -0.4 2880 2962 0.1 8.4 7.2 -0.49 17.3 16.2 -0.2 31.8 28.8 -0.3
Uzbekistan ECA 22.5 32.1 1.2 2565 2703 0.2 4.3 6.2 1.25 0.5 0.9 1.8 5.4 8.0 1.3
Argentina LAC 34.8 45.2 0.9 3117 3471 0.4 4.5 6.0 1.01 5.4 8.3 1.5 12.6 18.2 1.2
Bolivia LAC 7.4 12.6 1.8 2161 2534 0.5 0.9 1.6 2.03 0.2 0.6 3.4 1.3 2.7 2.3
Brazil LAC 159.3 208.2 0.9 2878 3378 0.5 17.3 23.3 0.99 28.2 54.7 2.2 52.2 88.0 1.8
Chile LAC 14.2 18.8 0.9 2766 3244 0.5 1.9 2.7 1.19 1.6 3.3 2.5 3.7 6.4 1.8
Colombia LAC 38.5 57.9 1.4 2735 3164 0.5 3.6 5.8 1.61 1.7 3.7 2.6 5.6 10.0 2.0
Costa Rica LAC 3.6 5.7 1.6 2814 3301 0.5 0.4 0.7 1.86 0.3 0.8 3.2 0.7 1.6 2.5
Cuba LAC 11.0 11.6 0.2 2349 2754 0.5 1.2 1.4 0.44 0.4 0.7 1.8 1.7 2.2 0.8
Ecuador LAC 11.5 17.1 1.4 2533 2971 0.5 1.2 2.0 1.61 0.3 0.7 2.9 1.8 3.2 1.9
El Salvador LAC 5.7 8.7 1.4 2540 2980 0.5 0.9 1.5 1.71 0.3 0.7 3.1 1.3 2.3 2.1
Guatemala LAC 10.0 19.1 2.2 2250 2637 0.5 1.5 3.1 2.45 0.2 0.5 3.8 1.8 3.8 2.6
Table B 1. Population and per capita per day Table B 2. Food, feed and total cereal consumption. calorie supply.
Population Per Capita Calorie Supply Food Cereal Feed Cereal Total Cereal
Country Region 1995 2025 Annual 1995 2025 Annual 1995 2025 Annual 1995 2025 Annual 1995 2025 Annualgrowth growth growth growth growth

72
Cambodia EAP 10.0 15.8 1.5 1979 2240 0.4 1.7 3.0 1.86 0.0 0.1 3.4 2.0 3.6 1.9
China EAP 1220.5 1437.2 0.5 2766 3112 0.4 231.3 259.3 0.38 107.1 241.2 2.7 379.9 553.8 1.3
Indonesia EAP 197.5 260.2 0.9 2880 3067 0.2 39.9 53.5 0.98 2.1 5.3 3.1 46.3 64.8 1.1
Korea D P Rep EAP 22.2 28.6 0.8 2395 2595 0.3 3.2 4.2 0.88 0.7 1.8 3.0 5.1 7.5 1.3
Korea Rep EAP 44.9 51.1 0.4 3302 3350 0.0 7.6 7.1 -0.21 7.8 18.5 2.9 17.4 28.0 1.6
Malaysia EAP 20.1 29.7 1.3 2848 3137 0.3 2.6 4.0 1.44 2.3 5.1 2.7 5.2 9.7 2.1
Myanmar EAP 42.9 55.5 0.9 2711 2929 0.3 9.9 13.0 0.91 0.6 1.6 3.4 11.6 16.1 1.1
Philippines EAP 68.4 104.2 1.4 2366 2688 0.4 8.7 13.3 1.43 3.9 10.7 3.4 13.7 25.9 2.1
Thailand EAP 58.6 70.4 0.6 2330 2473 0.2 7.3 8.0 0.28 5.1 11.2 2.7 14.2 21.4 1.4
Vietnam EAP 73.9 105.5 1.2 2449 2715 0.3 13.3 19.8 1.33 0.4 1.2 3.4 15.7 24.1 1.4
Hungary ECA 10.2 8.7 -0.5 3359 3454 0.1 1.2 1.0 -0.68 6.6 7.5 0.5 10.0 10.5 0.2
Kazakhstan ECA 16.5 16.7 0.0 3117 3284 0.2 4.0 4.1 0.11 4.3 5.2 0.7 11.9 13.2 0.3
Kyrgyzstan ECA 4.6 7.6 1.7 2398 2526 0.2 0.8 1.3 1.78 0.5 1.1 2.4 1.5 2.8 2.0
Poland ECA 38.6 38.6 0.0 3309 3401 0.1 6.0 5.7 -0.16 16.1 19.7 0.7 25.9 29.4 0.4
Romania ECA 22.7 19.8 -0.5 2927 3008 0.1 3.9 3.2 -0.63 10.5 10.2 -0.1 17.2 15.9 -0.3
Russian Fed ECA 148.1 134.5 -0.3 2814 2894 0.1 22.2 19.8 -0.38 42.9 45.7 0.2 84.2 83.1 0.0
Tajikistan ECA 5.8 8.5 1.3 2231 2351 0.2 1.1 1.7 1.36 0.0 0.1 1.9 1.2 1.8 1.4
Turkey ECA 61.3 83.5 1.0 3563 3501 -0.1 13.9 17.7 0.81 6.4 10.2 1.6 29.8 40.3 1.0
Turkmenistan ECA 4.1 6.1 1.3 2583 2721 0.2 0.7 1.1 1.38 0.5 0.8 2.0 1.4 2.2 1.6
Ukraine ECA 51.4 45.1 -0.4 2880 2962 0.1 8.4 7.2 -0.49 17.3 16.2 -0.2 31.8 28.8 -0.3
Uzbekistan ECA 22.5 32.1 1.2 2565 2703 0.2 4.3 6.2 1.25 0.5 0.9 1.8 5.4 8.0 1.3
Argentina LAC 34.8 45.2 0.9 3117 3471 0.4 4.5 6.0 1.01 5.4 8.3 1.5 12.6 18.2 1.2
Bolivia LAC 7.4 12.6 1.8 2161 2534 0.5 0.9 1.6 2.03 0.2 0.6 3.4 1.3 2.7 2.3
Table B 1. Population and per capita per day Table B 2. Food, feed and total cereal consumption. calorie supply.
Population Per Capita Calorie Supply Food Cereal Feed Cereal Total Cereal
Country Region 1995 2025 Annual 1995 2025 Annual 1995 2025 Annual 1995 2025 Annual 1995 2025 Annualgrowth growth growth growth growth
Million Million % kcal kcal % M mt M mt % M mt M mt % M mt M mt %

73
Angola AFR 0.4 1.1 3.8 -0.4 -55 -1.0 -48 0.00 0.00 0.0 0.43 0.73 1.8 0.43 0.73 1.8
Benin AFR 0.7 1.7 3.0 -0.1 -13 -0.2 -10 1.68 2.43 1.3 1.01 1.70 1.8 1.02 1.72 1.7
Burkina Faso AFR 2.4 6.2 3.2 -0.2 -6 -0.4 -6 2.37 3.44 1.3 0.75 1.22 1.6 0.78 1.28 1.7
Burundi AFR 0.2 0.5 2.3 -0.1 -22 -0.2 -27 1.50 2.02 1.0 1.22 1.78 1.3 1.24 1.80 1.2
Cameroon AFR 1.1 2.2 2.2 -0.3 -23 -1.1 -33 4.02 4.67 0.5 1.26 1.70 1.0 1.29 1.73 1.0
Cent Afr Rep AFR 0.1 0.3 2.8 -0.1 -33 -0.1 -22 1.50 1.74 0.5 0.90 1.30 1.3 0.90 1.30 1.3
Chad AFR 1.0 2.2 2.8 -0.1 -5 -0.2 -9 1.82 2.65 1.3 0.63 0.91 1.3 0.63 0.91 1.2
Congo,Dem R AFR 1.5 4.3 3.5 -0.3 -16 -0.5 -10 1.72 2.00 0.5 0.72 1.30 2.0 0.73 1.30 2.0
Congo, Rep AFR 0.0 0.0 1.5 -0.1 -95 -0.3 -97 2.98 4.02 1.0 0.26 0.31 0.5 0.26 0.31 0.5
Côte d’Ivoire AFR 1.3 2.3 2.0 -0.6 -33 -1.4 -38 2.42 3.26 1.0 0.81 1.10 1.0 0.86 1.17 1.0
Dominican Rep AFR 0.3 0.7 2.5 -1.0 -74 -1.7 -70 3.08 3.58 0.5 1.39 1.62 0.5 2.56 2.97 0.5
Ethiopia AFR 9.2 14.5 1.5 0.0 0 -6.6 -31 2.20 3.98 2.0 1.33 1.54 0.5 1.34 1.57 0.5
Ghana AFR 1.7 2.6 1.5 -0.4 -18 -2.2 -46 2.95 3.43 0.5 1.31 1.52 0.5 1.31 1.52 0.5
Guinea AFR 0.6 1.4 2.9 -0.3 -37 -0.5 -24 2.23 2.59 0.5 0.85 1.15 1.0 0.91 1.19 0.9
Kenya AFR 3.2 7.8 3.0 -0.5 -13 1.6 26 4.02 4.67 0.5 1.77 2.39 1.0 1.79 2.40 1.0
Madagascar AFR 1.8 3.5 2.2 -0.1 -7 -1.1 -24 1.75 2.74 1.5 1.21 1.63 1.0 1.36 1.96 1.2
Mali AFR 2.2 6.0 3.5 -0.1 -3 0.6 12 1.33 1.79 1.0 0.74 1.33 2.0 0.76 1.35 1.9
Mauritania AFR 0.2 0.7 4.0 -0.2 -54 -0.4 -39 2.05 3.20 1.5 0.65 1.18 2.0 0.69 1.23 1.9
Mozambique AFR 1.1 2.6 3.0 -0.5 -33 -0.5 -17 0.81 1.27 1.5 0.64 1.15 2.0 0.65 1.16 2.0
Niger AFR 2.3 5.6 3.0 -0.2 -9 -1.3 -19 2.56 4.00 1.5 0.32 0.50 1.5 0.33 0.51 1.5
Nigeria AFR 19.9 38.8 2.2 -1.0 -5 -4.9 -11 3.07 4.14 1.0 1.00 1.25 0.8 1.12 1.39 0.7
Senegal AFR 0.9 2.5 3.3 -0.7 -41 -1.2 -33 1.77 2.77 1.5 0.72 1.21 1.8 0.75 1.26 1.7
Somalia AFR 0.3 0.9 3.3 -0.1 -25 -0.4 -31 0.84 1.31 1.5 0.43 0.72 1.8 0.44 0.73 1.7
South Africa AFR 13.0 16.6 0.8 0.7 6 1.3 9 2.50 3.37 1.0 1.92 2.41 0.8 1.96 2.50 0.8
Sudan AFR 4.6 7.8 1.8 -0.3 -7 -1.6 -17 1.49 2.33 1.5 0.40 0.47 0.5 0.52 0.66 0.8
Tanzania AFR 4.1 7.5 2.0 -0.2 -5 -1.6 -18 2.29 3.57 1.5 1.26 1.70 1.0 1.28 1.75 1.0
Table B 3. Cereal production and production Table B 4. Growth of irrigated, rain-fed and average surplus/deficit. cereal yield.
Cereal Production Cereal Production Surplus/Deficit Irrigated Cereal Yield Rain-Fed Cereal Yield Average Cereal Yield
Country Region 1995 2025 Annual 1995 % of 2025 Annual 1995 2025 Annual 1995 2025 Annual 1995 2025 Annualgrowth consum. growth growth growth growth
M mt M mt % M mt % M mt % t/ha t/ha % t/ha t/ha % t/ha t/ha %
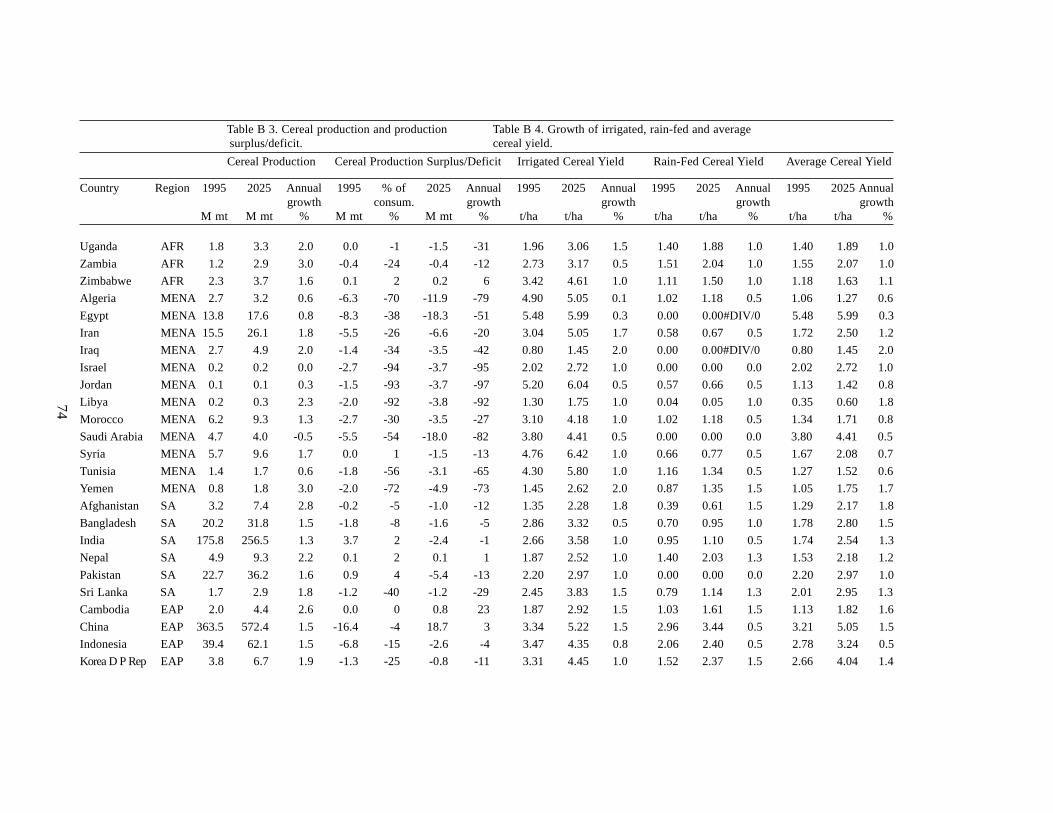
74
Uganda AFR 1.8 3.3 2.0 0.0 -1 -1.5 -31 1.96 3.06 1.5 1.40 1.88 1.0 1.40 1.89 1.0
Zambia AFR 1.2 2.9 3.0 -0.4 -24 -0.4 -12 2.73 3.17 0.5 1.51 2.04 1.0 1.55 2.07 1.0
Zimbabwe AFR 2.3 3.7 1.6 0.1 2 0.2 6 3.42 4.61 1.0 1.11 1.50 1.0 1.18 1.63 1.1
Algeria MENA 2.7 3.2 0.6 -6.3 -70 -11.9 -79 4.90 5.05 0.1 1.02 1.18 0.5 1.06 1.27 0.6
Egypt MENA 13.8 17.6 0.8 -8.3 -38 -18.3 -51 5.48 5.99 0.3 0.00 0.00#DIV/0 5.48 5.99 0.3
Iran MENA 15.5 26.1 1.8 -5.5 -26 -6.6 -20 3.04 5.05 1.7 0.58 0.67 0.5 1.72 2.50 1.2
Iraq MENA 2.7 4.9 2.0 -1.4 -34 -3.5 -42 0.80 1.45 2.0 0.00 0.00#DIV/0 0.80 1.45 2.0
Israel MENA 0.2 0.2 0.0 -2.7 -94 -3.7 -95 2.02 2.72 1.0 0.00 0.00 0.0 2.02 2.72 1.0
Jordan MENA 0.1 0.1 0.3 -1.5 -93 -3.7 -97 5.20 6.04 0.5 0.57 0.66 0.5 1.13 1.42 0.8
Libya MENA 0.2 0.3 2.3 -2.0 -92 -3.8 -92 1.30 1.75 1.0 0.04 0.05 1.0 0.35 0.60 1.8
Morocco MENA 6.2 9.3 1.3 -2.7 -30 -3.5 -27 3.10 4.18 1.0 1.02 1.18 0.5 1.34 1.71 0.8
Saudi Arabia MENA 4.7 4.0 -0.5 -5.5 -54 -18.0 -82 3.80 4.41 0.5 0.00 0.00 0.0 3.80 4.41 0.5
Syria MENA 5.7 9.6 1.7 0.0 1 -1.5 -13 4.76 6.42 1.0 0.66 0.77 0.5 1.67 2.08 0.7
Tunisia MENA 1.4 1.7 0.6 -1.8 -56 -3.1 -65 4.30 5.80 1.0 1.16 1.34 0.5 1.27 1.52 0.6
Yemen MENA 0.8 1.8 3.0 -2.0 -72 -4.9 -73 1.45 2.62 2.0 0.87 1.35 1.5 1.05 1.75 1.7
Afghanistan SA 3.2 7.4 2.8 -0.2 -5 -1.0 -12 1.35 2.28 1.8 0.39 0.61 1.5 1.29 2.17 1.8
Bangladesh SA 20.2 31.8 1.5 -1.8 -8 -1.6 -5 2.86 3.32 0.5 0.70 0.95 1.0 1.78 2.80 1.5
India SA 175.8 256.5 1.3 3.7 2 -2.4 -1 2.66 3.58 1.0 0.95 1.10 0.5 1.74 2.54 1.3
Nepal SA 4.9 9.3 2.2 0.1 2 0.1 1 1.87 2.52 1.0 1.40 2.03 1.3 1.53 2.18 1.2
Pakistan SA 22.7 36.2 1.6 0.9 4 -5.4 -13 2.20 2.97 1.0 0.00 0.00 0.0 2.20 2.97 1.0
Sri Lanka SA 1.7 2.9 1.8 -1.2 -40 -1.2 -29 2.45 3.83 1.5 0.79 1.14 1.3 2.01 2.95 1.3
Cambodia EAP 2.0 4.4 2.6 0.0 0 0.8 23 1.87 2.92 1.5 1.03 1.61 1.5 1.13 1.82 1.6
China EAP 363.5 572.4 1.5 -16.4 -4 18.7 3 3.34 5.22 1.5 2.96 3.44 0.5 3.21 5.05 1.5
Indonesia EAP 39.4 62.1 1.5 -6.8 -15 -2.6 -4 3.47 4.35 0.8 2.06 2.40 0.5 2.78 3.24 0.5
Korea D P Rep EAP 3.8 6.7 1.9 -1.3 -25 -0.8 -11 3.31 4.45 1.0 1.52 2.37 1.5 2.66 4.04 1.4
Table B 3. Cereal production and production Table B 4. Growth of irrigated, rain-fed and average surplus/deficit. cereal yield.
Cereal Production Cereal Production Surplus/Deficit Irrigated Cereal Yield Rain-Fed Cereal Yield Average Cereal Yield
Country Region 1995 2025 Annual 1995 % of 2025 Annual 1995 2025 Annual 1995 2025 Annual 1995 2025 Annualgrowth consum. growth growth growth growth
M mt M mt % M mt % M mt % t/ha t/ha % t/ha t/ha % t/ha t/ha %

75
Korea Rep EAP 5.0 12.5 3.1 -12.4 -71 -15.6 -55 4.43 6.93 1.5 2.40 5.04 2.5 4.21 6.72 1.6
Malaysia EAP 1.5 4.2 3.5 -3.7 -72 -5.5 -57 2.38 4.31 2.0 1.61 2.16 1.0 2.10 3.25 1.5
Myanmar EAP 12.1 17.9 1.3 0.5 4 1.8 11 2.75 3.19 0.5 1.76 2.05 0.5 1.99 2.36 0.6
Philippines EAP 11.2 18.0 1.6 -2.5 -18 -7.9 -31 2.18 3.62 1.7 1.47 1.84 0.8 1.76 2.82 1.6
Thailand EAP 19.0 24.5 0.8 4.8 34 3.1 14 2.68 3.61 1.0 1.32 1.42 0.2 1.75 2.62 1.4
Vietnam EAP 17.8 29.2 1.7 2.0 13 5.1 21 3.17 4.27 1.0 2.02 2.34 0.5 2.44 2.97 0.7
Hungary ECA 11.4 17.9 1.5 1.4 15 7.4 71 4.75 5.52 0.5 4.03 4.69 0.5 4.04 4.69 0.5
Kazakhstan ECA 12.3 14.3 0.5 0.4 3 1.1 8 1.80 2.09 0.5 0.61 0.71 0.5 0.65 0.76 0.5
Kyrgyzstan ECA 1.2 2.1 1.9 -0.4 -24 -0.7 -25 2.50 3.37 1.0 0.86 1.00 0.5 1.99 2.64 0.9
Poland ECA 23.8 32.1 1.0 -2.1 -8 2.7 9 2.80 3.77 1.0 2.83 3.82 1.0 2.83 3.82 1.0
Romania ECA 17.7 20.5 0.5 0.5 3 4.7 29 4.00 4.65 0.5 2.64 3.07 0.5 2.81 3.26 0.5
Russian Fed ECA 69.2 80.3 0.5 -15.0 -18 -2.8 -3 2.70 3.14 0.5 1.26 1.46 0.5 1.30 1.51 0.5
Tajikistan ECA 0.3 0.5 1.7 -0.9 -74 -1.3 -72 1.68 2.62 1.5 0.93 1.08 0.5 1.12 1.37 0.7
Turkey ECA 29.7 40.2 1.0 -0.2 -1 -0.2 0 4.82 6.03 0.8 1.87 2.34 0.8 2.01 2.63 0.9
Turkmenistan ECA 0.9 1.6 1.9 -0.5 -34 -0.6 -26 2.36 3.19 1.0 1.35 1.57 0.5 1.58 1.80 0.4
Ukraine ECA 29.6 29.9 0.0 -2.2 -7 1.1 4 4.60 5.34 0.5 2.26 2.62 0.5 2.42 2.84 0.5
Uzbekistan ECA 3.0 4.7 1.5 -2.4 -45 -3.3 -42 2.50 3.37 1.0 1.52 1.77 0.5 1.78 2.08 0.5
Argentina LAC 24.6 33.5 1.0 12.0 95 15.3 84 4.82 5.59 0.5 2.52 2.92 0.5 2.76 3.23 0.5
Bolivia LAC 1.0 2.3 2.8 -0.3 -23 -0.4 -13 1.79 3.01 1.8 1.42 2.39 1.8 1.46 2.45 1.7
Brazil LAC 42.6 63.3 1.3 -9.7 -18 -24.8 -28 2.95 5.35 2.0 2.16 2.91 1.0 2.21 3.28 1.3
Chile LAC 2.6 5.3 2.4 -1.1 -30 -1.1 -17 6.08 7.06 0.5 2.77 3.74 1.0 4.33 4.90 0.4
Colombia LAC 2.9 6.1 2.5 -2.7 -48 -3.9 -39 3.40 4.58 1.0 1.83 2.46 1.0 2.19 3.93 2.0
Costa Rica LAC 0.1 0.3 1.9 -0.6 -80 -1.3 -84 2.98 4.02 1.0 1.69 2.28 1.0 2.39 3.09 0.9
Cuba LAC 0.3 0.6 2.5 -1.5 -85 -1.6 -74 1.86 2.50 1.0 0.96 1.29 1.0 1.53 1.78 0.5
Ecuador LAC 1.5 2.8 2.0 -0.3 -17 -0.4 -14 2.54 3.42 1.0 1.13 1.42 0.8 1.51 1.76 0.5
Table B 3. Cereal production and production Table B 4. Growth of irrigated, rain-fed and average surplus/deficit. cereal yield.
Cereal Production Cereal Production Surplus/Deficit Irrigated Cereal Yield Rain-Fed Cereal Yield Average Cereal Yield
Country Region 1995 2025 Annual 1995 % of 2025 Annual 1995 2025 Annual 1995 2025 Annual 1995 2025 Annualgrowth consum. growth growth growth growth
M mt M mt % M mt % M mt % t/ha t/ha % t/ha t/ha % t/ha t/ha %

76
El Salvador LAC 0.8 1.5 2.0 -0.4 -36 -0.9 -37 3.24 4.37 1.0 1.82 2.45 1.0 1.86 2.50 1.0
Guatemala LAC 1.2 2.5 2.5 -0.6 -33 -1.3 -35 3.04 3.52 0.5 1.84 2.13 0.5 1.85 2.15 0.5
Haiti LAC 0.4 1.0 3.5 -0.4 -54 -0.3 -25 1.58 2.13 1.0 0.78 1.22 1.5 0.86 1.32 1.4
Honduras LAC 0.7 1.6 2.7 -0.3 -27 -0.5 -25 2.57 3.47 1.0 1.31 1.90 1.3 1.45 2.05 1.2
Mexico LAC 26.4 43.1 1.6 -0.5 -2 -2.6 -6 4.66 5.41 0.5 1.82 2.12 0.5 2.48 3.48 1.1
Nicaragua LAC 0.5 1.0 2.2 -0.2 -27 -0.6 -35 3.00 4.04 1.0 1.36 1.98 1.3 1.49 2.13 1.2
Panama LAC 0.3 0.6 2.6 -0.3 -54 -0.4 -44 2.90 5.26 2.0 1.39 2.18 1.5 1.48 2.36 1.6
Paraguay LAC 1.1 2.2 2.3 0.1 10 -0.3 -13 2.79 4.35 1.5 2.10 3.05 1.3 2.13 3.11 1.3
Peru LAC 1.9 5.0 3.3 -2.5 -57 -2.7 -35 3.03 5.48 2.0 1.03 2.01 2.3 2.23 5.42 3.0
Uruguay LAC 1.6 2.8 2.0 0.7 74 1.4 104 3.69 4.97 1.0 2.29 3.08 1.0 2.66 3.55 1.0
Venezuela LAC 2.0 6.3 3.8 -2.5 -55 -2.1 -25 3.36 6.55 2.3 2.17 3.65 1.8 2.50 4.25 1.8
Australia OTHER 24.7 33.2 1.0 16.4 195 22.1 198 4.50 6.07 1.0 1.63 2.05 0.8 1.76 2.36 1.0Bulgaria OTHER 5.4 10.5 2.2 0.2 3 5.8 120 3.50 4.06 0.5 2.59 3.01 0.5 2.66 3.07 0.5
Canada OTHER 52.5 53.1 0.0 22.9 78 19.6 59 4.00 6.25 1.5 2.70 3.13 0.5 2.72 3.20 0.5
France OTHER 57.6 57.6 0.0 27.5 91 20.0 53 7.50 8.71 0.5 6.70 7.78 0.5 6.70 7.78 0.5
Germany OTHER 40.8 47.4 0.5 6.4 19 7.8 20 7.10 8.25 0.5 6.08 7.06 0.5 6.08 7.06 0.5
Greece OTHER 4.9 7.2 1.3 0.1 1 2.0 37 5.50 6.39 0.5 0.62 0.72 0.5 3.67 4.05 0.3
Italy OTHER 19.2 19.8 0.1 -3.4 -15 -2.6 -12 7.20 7.42 0.1 3.50 4.06 0.5 4.65 5.56 0.6
Japan OTHER 9.3 9.2 0.0 -28.6 -76 -31.4 -77 4.25 4.93 0.5 0.00 0.00 0.0 4.25 4.93 0.5
Netherlands OTHER 1.5 2.4 1.5 -3.9 -72 -3.5 -60 0.00 0.00 0.0 7.76 9.01 0.5 7.76 9.01 0.5
Portugal OTHER 1.5 2.4 1.5 -2.0 -57 -1.5 -39 3.00 4.69 1.5 1.05 1.42 1.0 2.22 3.44 1.5
Spain OTHER 16.2 19.2 0.6 -4.1 -20 -1.9 -9 4.00 5.39 1.0 1.56 1.81 0.5 2.45 3.38 1.1
UK OTHER 21.6 21.6 0.0 2.6 14 1.3 7 8.00 8.24 0.1 6.93 8.05 0.5 6.93 8.05 0.5
USA OTHER 320.3 376.0 0.5 86.5 37 98.7 36 5.50 6.88 0.8 4.91 6.14 0.8 5.10 6.46 0.8
Table B 3. Cereal production and production Table B 4. Growth of irrigated, rain-fed and average surplus/deficit. cereal yield.
Cereal Production Cereal Production Surplus/Deficit Irrigated Cereal Yield Rain-Fed Cereal Yield Average Cereal Yield
Country Region 1995 2025 Annual 1995 % of 2025 Annual 1995 2025 Annual 1995 2025 Annual 1995 2025 Annualgrowth consum. growth growth growth growth
M mt M mt % M mt % M mt % t/ha t/ha % t/ha t/ha % t/ha t/ha %

77
Table B 5. Growth of irrigated, rain-fed and total cereal area.
Country Region Irrigated Cereal Area Rain-Fed Cereal Area Total Cereal Area
1995 2025 Annual 1995 2025 Annual 1995 2025 Annualgrowth growth //////*growth
M ha M ha % M ha M ha % M ha M ha %
Angola AFR 0.00 0.00 0.0 0.84 1.52 2.0 0.84 1.52 2.0
Benin AFR 0.01 0.02 2.5 0.67 0.97 1.2 0.68 0.99 1.3
Burkina Faso AFR 0.04 0.13 4.0 3.05 4.70 1.5 3.09 4.83 1.5
Burundi AFR 0.01 0.03 2.1 0.18 0.24 0.9 0.20 0.26 1.0
Cameroon AFR 0.01 0.01 1.0 0.87 1.26 1.3 0.88 1.28 1.3
Cent Far Rep AFR 0.00 0.00 0.0 0.13 0.20 1.5 0.13 0.20 1.5
Chad AFR 0.00 0.00 1.1 1.51 2.37 1.5 1.51 2.37 1.5
Congo, Dem R AFR 0.02 0.04 2.0 2.11 3.30 1.5 2.13 3.33 1.5
Congo, Rep AFR 0.00 0.00 0.0 0.03 0.03 1.0 0.03 0.03 1.0
Côte d’Ivoire AFR 0.04 0.07 1.5 1.44 1.93 1.0 1.48 2.00 1.0
Dominican Rep AFR 0.09 0.17 2.0 0.04 0.08 2.0 0.14 0.25 2.0
Ethiopia AFR 0.09 0.12 1.0 6.76 9.11 1.0 6.84 9.22 1.0
Ghana AFR 0.00 0.00 0.0 1.27 1.71 1.0 1.27 1.71 1.0
Guinea AFR 0.03 0.03 0.7 0.63 1.16 2.0 0.66 1.19 2.0
Kenya AFR 0.02 0.02 1.0 1.78 3.23 2.0 1.79 3.25 2.0
Madagascar AFR 0.35 0.53 1.3 0.97 1.27 0.9 1.33 1.79 1.0
Mali AFR 0.12 0.16 1.0 2.75 4.32 1.5 2.87 4.48 1.5
Mauritania AFR 0.01 0.01 1.3 0.28 0.52 2.0 0.29 0.53 2.0
Mozambique AFR 0.10 0.14 1.2 1.54 2.07 1.0 1.64 2.21 1.0
Niger AFR 0.03 0.05 2.1 6.94 10.83 1.5 6.97 10.89 1.5
Nigeria AFR 1.06 1.43 1.0 16.75 26.41 1.5 17.81 27.84 1.5
Senegal AFR 0.04 0.06 1.5 1.22 1.90 1.5 1.25 1.96 1.5
Somalia AFR 0.01 0.03 1.8 0.73 1.14 1.5 0.75 1.17 1.5
South Africa AFR 0.43 0.64 1.3 6.20 5.99 -0.1 6.63 6.63 0.0
Sudan AFR 0.91 1.22 1.0 7.91 10.67 1.0 8.82 11.89 1.0
Tanzania AFR 0.06 0.11 1.7 3.11 4.17 1.0 3.18 4.28 1.0
Uganda AFR 0.01 0.02 0.5 1.29 1.74 1.0 1.30 1.75 1.0

78
Zambia AFR 0.02 0.04 2.0 0.75 1.37 2.0 0.78 1.41 2.0
Zimbabwe AFR 0.06 0.09 1.6 1.88 2.16 0.5 1.94 2.26 0.5
Algeria MENA 0.03 0.06 2.5 2.48 2.45 0.0 2.51 2.51 0.0
Egypt MENA 2.52 2.93 0.5 0.00 0.00 0.0 2.52 2.93 0.5
Iran MENA 4.18 4.36 0.1 4.82 6.09 0.8 9.00 10.45 0.5
Iraq MENA 3.36 3.36 0.0 0.00 0.00 0.0 3.36 3.36 0.0
Israel MENA 0.09 0.07 -1.0 0.00 0.00 0.0 0.09 0.07 -1.0
Jordan MENA 0.01 0.01 0.0 0.09 0.08 -0.6 0.10 0.09 -0.5
Libya MENA 0.12 0.17 1.4 0.35 0.36 0.2 0.46 0.54 0.5
Morocco MENA 0.72 0.96 1.0 3.94 4.45 0.4 4.65 5.40 0.5
Saudi Arabia MENA 1.23 0.91 -1.0 0.00 0.00 0.0 1.23 0.91 -1.0
Syria MENA 0.84 1.07 0.8 2.56 3.52 1.1 3.40 4.59 1.0
Tunisia MENA 0.04 0.04 0.4 1.05 1.04 0.0 1.09 1.09 0.0
Yemen MENA 0.22 0.32 1.2 0.50 0.71 1.2 0.72 1.04 1.2
Afghanistan SA 2.34 3.19 1.0 0.18 0.21 0.6 2.52 3.39 1.0
Bangladesh SA 5.67 8.87 1.5 5.67 2.47 -2.7 11.34 11.34 0.0
India SA 46.97 58.65 0.7 53.85 42.16 -0.8 100.82 100.82 0.0
Nepal SA 0.89 1.28 1.2 2.28 2.99 0.9 3.17 4.27 1.0
Pakistan SA 10.30 12.17 0.6 0.00 0.00 0.0 10.30 12.17 0.6
Sri Lanka SA 0.63 0.67 0.2 0.23 0.32 1.2 0.86 0.99 0.5
Cambodia EAP 0.22 0.38 1.9 1.59 2.05 0.9 1.80 2.43 1.0
China EAP 73.93 102.50 1.1 39.36 10.80 -4.2 113.30 113.30 0.0
Indonesia EAP 7.18 8.33 0.5 7.03 10.83 1.4 14.21 19.16 1.0
Korea D P Rep EAP 0.91 1.33 1.3 0.51 0.33 -1.4 1.43 1.66 0.5
Korea Rep EAP 1.06 1.65 1.5 0.13 0.20 1.5 1.19 1.86 1.5
Malaysia EAP 0.45 0.65 1.2 0.26 0.63 3.1 0.71 1.28 2.0
Myanmar EAP 1.41 2.08 1.3 4.64 5.50 0.6 6.05 7.58 0.8
Table B 5. Growth of irrigated, rain-fed, and total cereal area.
Country Region Irrigated Cereal Area Rain-Fed Cereal Area Total Cereal Area
1995 2025 Annual 1995 2025 Annual 1995 2025 Annualgrowth growth //////*growth
M ha M ha % M ha M ha % M ha M ha %

79
Philippines EAP 2.61 3.51 1.0 3.76 2.87 -0.9 6.37 6.37 0.0
Thailand EAP 3.44 5.12 1.3 7.44 4.25 -1.9 10.88 9.37 -0.5
Vietnam EAP 2.66 3.21 0.6 4.64 6.62 1.2 7.29 9.83 1.0
Hungary ECA 0.01 0.01 1.5 2.83 3.81 1.0 2.83 3.82 1.0
Kazakhstan ECA 0.64 0.64 0.0 18.21 18.21 0.0 18.85 18.85 0.0
Kyrgyzstan ECA 0.41 0.55 1.0 0.18 0.24 1.0 0.59 0.79 1.0
Poland ECA 0.08 0.08 0.0 8.32 8.32 0.0 8.40 8.40 0.0
Romania ECA 0.78 0.78 0.0 5.52 5.52 0.0 6.30 6.30 0.0
Russian Fed ECA 1.61 1.61 0.0 51.48 51.48 0.0 53.09 53.09 0.0
Tajikistan ECA 0.07 0.07 0.0 0.21 0.31 1.3 0.28 0.38 1.0
Turkey ECA 0.69 1.18 1.8 14.04 14.10 0.0 14.73 15.27 0.1
Turkmenistan ECA 0.13 0.13 0.0 0.45 0.78 1.8 0.58 0.91 1.5
Ukraine ECA 0.85 0.85 0.0 11.36 9.65 -0.5 12.21 10.51 -0.5
Uzbekistan ECA 0.44 0.44 0.0 1.22 1.79 1.3 1.66 2.23 1.0
Argentina LAC 0.95 1.21 0.8 7.95 9.13 0.5 8.91 10.34 0.5
Bolivia LAC 0.08 0.09 0.5 0.62 0.86 1.1 0.70 0.94 1.0
Brazil LAC 1.21 2.94 3.0 18.09 16.35 -0.3 19.29 19.29 0.0
Chile LAC 0.28 0.38 1.0 0.32 0.71 2.7 0.60 1.09 2.0
Colombia LAC 0.31 1.08 4.3 1.04 0.48 -2.5 1.35 1.56 0.5
Costa Rica LAC 0.03 0.04 0.5 0.03 0.04 1.5 0.06 0.08 1.0
Cuba LAC 0.11 0.13 0.5 0.06 0.19 3.7 0.18 0.32 2.0
Ecuador LAC 0.27 0.27 0.0 0.74 1.31 1.9 1.01 1.58 1.5
El Salvador LAC 0.01 0.02 0.6 0.42 0.57 1.0 0.43 0.58 1.0
Guatemala LAC 0.01 0.01 2.2 0.64 1.15 2.0 0.64 1.17 2.0
Haiti LAC 0.04 0.08 2.3 0.38 0.68 2.0 0.42 0.76 2.0
Honduras LAC 0.06 0.07 1.0 0.45 0.71 1.6 0.50 0.79 1.5
Mexico LAC 2.46 5.11 2.5 8.21 7.28 -0.4 10.67 12.39 0.5
Table B 5. Growth of irrigated, rain-fed and total cereal area.
Country Region Irrigated Cereal Area Rain-Fed Cereal Area Total Cereal Area
1995 2025 Annual 1995 2025 Annual 1995 2025 Annualgrowth growth //////*growth
M ha M ha % M ha M ha % M ha M ha %

80
Nicaragua LAC 0.03 0.04 0.7 0.33 0.45 1.0 0.36 0.48 1.0
Panama LAC 0.01 0.01 1.0 0.17 0.22 1.0 0.18 0.24 1.0
Paraguay LAC 0.02 0.03 1.2 0.51 0.68 1.0 0.53 0.72 1.0
Peru LAC 0.51 0.90 2.0 0.34 0.02 -9.3 0.84 0.92 0.3
Uruguay LAC 0.16 0.20 0.7 0.43 0.59 1.1 0.59 0.79 1.0
Venezuela LAC 0.23 0.31 1.0 0.59 1.17 2.3 0.82 1.48 2.0
Australia OTHER 0.62 1.11 2.0 13.43 12.94 -0.1 14.05 14.05 0.0
Bulgaria OTHER 0.16 0.20 0.8 1.89 3.24 1.8 2.04 3.44 1.8
Canada OTHER 0.36 0.36 0.0 18.94 16.25 -0.5 19.29 16.60 -0.5
France OTHER 0.02 0.02 0.0 8.59 7.39 -0.5 8.60 7.40 -0.5
Germany OTHER 0.00 0.00 0.0 6.72 6.72 0.0 6.72 6.72 0.0
Greece OTHER 0.83 1.05 0.8 0.50 0.74 1.3 1.32 1.79 1.0
Italy OTHER 1.29 1.59 0.7 2.85 1.97 -1.2 4.14 3.56 -0.5
Japan OTHER 2.18 1.87 -0.5 0.00 0.00 0.0 2.18 1.87 -0.5
Netherlands OTHER 0.00 0.00 0.0 0.19 0.26 1.0 0.19 0.26 1.0
Portugal OTHER 0.42 0.43 0.1 0.28 0.27 -0.2 0.69 0.69 0.0
Spain OTHER 2.41 2.50 0.1 4.20 3.19 -0.9 6.61 5.69 -0.5
UK OTHER 0.00 0.00 0.0 3.11 2.68 -0.5 3.12 2.68 -0.5
USA OTHER 20.93 25.05 0.6 41.83 33.16 -0.8 62.76 58.22 -0.2
Table B 5. Growth of irrigated, rain-fed and total cereal area.
Country Region Irrigated Cereal Area Rain-Fed Cereal Area Total Cereal Area
1995 2025 Annual 1995 2025 Annual 1995 2025 Annualgrowth growth //////*growth
M ha M ha % M ha M ha % M ha M ha %

81
Angola AFR 0.1 0.1 0.5 0.1 0.1 0.7 0.3 0.3 20
Benin AFR 0.0 0.0 2.0 0.0 0.0 2.5 0.1 0.1 93
Burkina Faso AFR 0.0 0.1 4.0 0.0 0.1 4.0 0.3 0.9 189
Burundi AFR 0.0 0.0 1.5 0.0 0.0 2.1 0.0 0.1 86
Cameroon AFR 0.0 0.0 0.5 0.0 0.0 0.5 0.0 0.0 -2
Cent Far Rep AFR 0.0 0.0 1.0 0.0 0.0 1.0 0.0 0.0 28
Chad AFR 0.0 0.0 1.0 0.0 0.0 1.1 0.1 0.1 33
Congo, Dem R AFR 0.0 0.0 2.0 0.0 0.0 2.0 0.0 0.1 53
Congo, Rep AFR 0.0 0.0 0.0 0.0 0.0 0.0 0.0 0.0 -5
Côte d’Ivoire AFR 0.1 0.1 1.5 0.1 0.2 1.5 0.3 0.5 37
Dominican Rep AFR 0.3 0.5 2.0 0.5 0.9 2.0 2.3 3.8 62
Ethiopia AFR 0.2 0.2 0.8 0.3 0.5 1.0 0.8 1.1 33
Ghana AFR 0.0 0.0 0.0 0.0 0.0 0.0 0.1 0.1 -10
Guinea AFR 0.1 0.1 0.5 0.2 0.2 0.7 0.4 0.5 18
Kenya AFR 0.1 0.1 1.0 0.1 0.2 1.0 0.7 0.8 22
Madagascar AFR 1.1 1.5 1.0 1.1 1.6 1.3 1.5 2.4 62
Mali AFR 0.1 0.1 1.0 0.2 0.2 1.0 0.9 1.2 29
Mauritania AFR 0.0 0.1 1.0 0.0 0.1 1.3 0.5 0.7 34
Mozambique AFR 0.1 0.1 1.0 0.1 0.2 1.2 0.5 0.6 39
Niger AFR 0.1 0.1 1.5 0.1 0.1 2.1 0.6 1.1 73
Nigeria AFR 1.0 1.2 0.6 1.3 1.8 1.0 4.4 5.7 32
Senegal AFR 0.1 0.1 1.5 0.1 0.2 1.5 0.8 1.2 45
Somalia AFR 0.2 0.3 1.5 0.2 0.3 1.8 1.4 2.5 73
South Africa AFR 1.3 1.7 1.0 2.0 2.9 1.3 10.1 13.3 32
Sudan AFR 1.9 2.3 0.5 1.9 2.6 1.0 15.7 19.4 23
Tanzania AFR 0.2 0.3 1.5 0.3 0.5 1.7 0.7 1.1 64
Uganda AFR 0.0 0.0 0.5 0.0 0.0 0.5 0.0 0.0 2
Table B 6. Growth of total irrigated area and primary irrigation supply.
Country Region Net Irrigated Area Gross Irrigated Area Primary Irrigation Supply
1995 2025 Total 1995 2025 Total 1995 2025 Totalgrowth growth growth
M ha M ha % M ha M ha % km3 km3 %

82
Zambia AFR 0.0 0.1 2.0 0.1 0.2 2.0 0.3 0.5 63
Zimbabwe AFR 0.1 0.2 1.5 0.2 0.3 1.6 0.9 1.2 44
Algeria MENA 0.6 1.0 2.0 0.6 1.2 2.5 1.6 3.4 109
Egypt MENA 3.3 3.7 0.4 5.1 6.0 0.5 27.9 29.4 5
Iran MENA 7.3 7.3 0.0 8.4 8.7 0.1 73.2 65.4 -11
Iraq MENA 3.5 3.7 0.2 4.9 5.3 0.3 27.4 29.2 7
Israel MENA 0.2 0.2 0.0 0.2 0.2 0.0 0.8 0.8 -4
Jordan MENA 0.1 0.1 0.0 0.1 0.1 0.0 0.7 0.6 -21
Libya MENA 0.5 0.6 1.0 0.6 0.9 1.4 2.4 3.7 55
Morocco MENA 1.3 1.5 0.6 1.9 2.5 1.0 7.4 9.0 22
Saudi Arabia MENA 1.5 1.1 -1.0 1.9 1.4 -1.0 11.3 7.5 -34
Syria MENA 1.1 1.4 0.7 1.6 2.1 0.8 9.9 11.9 20
Tunisia MENA 0.4 0.4 0.4 0.4 0.4 0.4 1.6 1.6 0
Yemen MENA 0.5 0.7 1.0 0.7 0.9 1.2 5.1 7.0 38
Afghanistan SA 2.8 4.4 1.5 3.2 5.7 1.9 24.4 37.2 52
Bangladesh SA 3.4 5.2 1.4 5.7 8.9 1.5 20.2 26.7 32
India SA 54.3 63.1 0.5 72.3 90.2 0.7 368.0 428.9 17
Nepal SA 0.9 1.2 1.0 1.2 1.7 1.2 3.4 4.7 41
Pakistan SA 16.0 16.0 0.0 17.6 20.8 0.6 172.1 188.1 9
Sri Lanka SA 0.6 0.6 0.0 0.8 0.9 0.2 6.8 6.2 -8
Cambodia EAP 0.2 0.3 1.5 0.2 0.4 1.9 0.6 1.1 95
China EAP 49.7 67.0 1.0 87.0 120.6 1.1 325.8 406.4 25
Indonesia EAP 4.6 5.0 0.3 7.6 8.8 0.5 32.9 34.8 6
Korea D P Rep EAP 1.5 2.1 1.3 1.5 2.1 1.3 5.4 6.8 26
Korea Rep EAP 1.2 1.9 1.5 1.2 1.9 1.5 8.0 10.1 27
Malaysia EAP 0.3 0.5 1.0 0.5 0.7 1.2 2.2 2.7 23
Table B 6. Growth of total irrigated area and primary irrigation supply.
Country Region Net Irrigated Area Gross Irrigated Area Primary Irrigation Supply
1995 2025 Total 1995 2025 Total 1995 2025 Totalgrowth growth growth
M ha M ha % M ha M ha % km3 km3 %

83
Myanmar EAP 1.6 2.2 1.0 1.8 2.6 1.3 1.9 4.2 118
Philippines EAP 1.6 1.9 0.7 2.6 3.5 1.0 13.9 17.1 23
Thailand EAP 4.7 6.4 1.0 6.9 10.2 1.3 14.0 21.5 53
Vietnam EAP 2.0 2.3 0.4 2.8 3.4 0.6 17.9 18.9 6
Hungary ECA 0.2 0.3 1.5 0.2 0.3 1.5 0.8 1.2 51
Kazakhstan ECA 2.3 2.3 0.0 2.3 2.3 0.0 15.7 13.8 -13
Kyrgyzstan ECA 1.1 1.4 1.0 1.1 1.4 1.0 9.0 11.0 23
Poland ECA 0.1 0.1 0.0 0.1 0.1 0.0 0.3 0.3 -13
Romania ECA 3.1 3.1 0.0 3.1 3.1 0.0 15.7 13.7 -13
Russian Fed ECA 5.4 5.4 0.0 5.4 5.4 0.0 22.3 20.0 -10
Tajikistan ECA 0.7 0.7 0.0 0.7 0.7 0.0 6.0 5.4 -10
Turkey ECA 4.2 6.6 1.5 4.6 7.9 1.8 21.5 35.2 64
Turkmenistan ECA 1.3 1.3 0.0 1.3 1.3 0.0 10.9 10.1 -8
Ukraine ECA 2.6 2.6 0.0 2.6 2.6 0.0 13.9 12.4 -10
Uzbekistan ECA 4.0 4.0 0.0 4.0 4.0 0.0 33.6 31.0 -8
Argentina LAC 1.7 2.0 0.5 2.7 3.5 0.8 12.0 13.4 12
Bolivia LAC 0.1 0.1 0.5 0.2 0.2 0.5 0.9 1.0 6
Brazil LAC 3.1 6.9 2.7 4.8 11.8 3.0 16.9 36.4 115
Chile LAC 1.3 1.7 1.0 2.3 3.2 1.0 9.8 12.0 23
Colombia LAC 1.0 3.4 4.0 1.4 4.7 4.3 0.6 2.1 279
Costa Rica LAC 0.1 0.1 0.5 0.3 0.3 0.5 0.8 0.8 5
Cuba LAC 0.9 1.0 0.2 1.5 1.7 0.5 7.8 8.1 4
Ecuador LAC 0.2 0.2 0.0 0.5 0.5 0.0 3.3 3.0 -10
El Salvador LAC 0.1 0.1 0.5 0.2 0.2 0.6 0.6 0.6 12
Guatemala LAC 0.1 0.2 2.0 0.2 0.4 2.2 0.2 0.5 105
Haiti LAC 0.1 0.2 2.0 0.1 0.2 2.3 0.3 0.6 88
Honduras LAC 0.1 0.1 1.0 0.1 0.2 1.0 0.4 0.4 19
Table B 6. Growth of total irrigated area and primary irrigation supply.
Country Region Net Irrigated Area Gross Irrigated Area Primary Irrigation Supply
1995 2025 Total 1995 2025 Total 1995 2025 Totalgrowth growth growth
M ha M ha % M ha M ha % km3 km3 %

84
Mexico LAC 5.0 9.1 2.0 5.2 10.7 2.5 50.5 92.4 83
Nicaragua LAC 0.1 0.1 0.5 0.1 0.2 0.7 0.3 0.4 22
Panama LAC 0.0 0.0 1.0 0.1 0.1 1.0 0.2 0.2 22
Paraguay LAC 0.1 0.1 1.0 0.1 0.1 1.2 0.4 0.5 32
Peru LAC 1.7 3.1 2.0 2.0 3.9 2.3 2.0 4.7 129
Uruguay LAC 0.1 0.2 0.5 0.2 0.3 0.7 1.0 1.1 10
Venezuela LAC 0.2 0.3 1.0 0.3 0.5 1.0 1.6 1.8 16
Australia OTHER 2.3 3.8 1.7 3.4 6.2 2.0 14.4 23.9 66
Bulgaria OTHER 0.8 0.8 0.0 0.8 0.8 0.0 3.2 3.1 -6
Canada OTHER 0.7 0.7 0.0 0.7 0.7 0.0 2.0 1.8 -8
France OTHER 1.6 1.6 0.0 1.6 1.6 0.0 5.6 5.6 0
Germany OTHER 0.5 0.5 0.0 0.5 0.5 0.0 1.3 1.3 0
Greece OTHER 1.3 1.6 0.5 1.5 1.9 0.8 2.9 3.8 29
Italy OTHER 2.7 3.3 0.7 5.1 6.3 0.7 17.3 19.3 12
Japan OTHER 2.7 2.4 -0.5 2.7 2.4 -0.5 18.4 14.4 -22
Netherlands OTHER 0.6 0.7 0.5 0.6 0.7 0.5 0.8 0.9 11
Portugal OTHER 0.6 0.6 0.0 1.1 1.1 0.1 2.0 2.0 1
Spain OTHER 3.6 3.6 0.0 4.8 5.0 0.1 17.6 17.7 0
UK OTHER 0.1 0.1 0.0 0.1 0.1 0.0 0.2 0.2 -9
USA OTHER 21.4 24.9 0.5 34.9 41.8 0.6 132.2 148.9 13
Table B 6. Growth of total irrigated area and primary irrigation supply.
Country Region Net Irrigated Area Gross Irrigated Area Primary Irrigation Supply
1995 2025 Total 1995 2025 Total 1995 2025 Totalgrowth growth growth
M ha M ha % M ha M ha % km3 km3 %

85
Angola AFR 0.47 0.94 2.3 0.4 0.5 0.6 0.8 66 Economic
Benin AFR 0.14 0.38 3.4 0.1 0.6 0.2 1.3 138 Economic
Burkina Faso AFR 0.52 1.65 3.9 0.4 3.4 1.1 10.3 199 Economic
Burundi AFR 0.13 0.30 3.0 0.1 0.4 0.1 1.0 118 Economic
Cameroon AFR 0.31 0.85 3.4 0.2 0.2 0.4 0.5 129 Economic
Cent Far Rep AFR 0.02 0.07 3.5 0.0 0.0 0.0 0.0 127 Economic
Chad AFR 0.17 0.32 2.0 0.1 0.5 0.2 0.8 61 Economic
Congo, Dem R AFR 0.35 1.41 4.8 0.2 0.1 0.7 0.2 238 Economic
Congo, Rep AFR 0.04 0.15 4.9 0.0 0.0 0.1 0.0 269 Economic
Côte d’Ivoire AFR 0.76 1.45 2.2 0.5 1.3 0.9 2.2 75 Economic
Dominican Rep AFR 3.20 5.59 1.9 2.6 25.8 4.3 43.9 70 Economic
Ethiopia AFR 1.25 2.47 2.3 0.9 2.1 1.5 3.4 59 Economic
Ghana AFR 0.23 0.66 3.6 0.2 0.7 0.4 1.6 141 Economic
Guinea AFR 0.73 1.07 1.3 0.5 0.8 0.7 1.1 44 Economic
Kenya AFR 1.35 2.28 1.8 1.0 5.7 1.6 8.6 51 Economic
Madagascar AFR 2.54 4.32 1.8 1.6 1.3 2.8 2.4 78 Economic
Mali AFR 1.18 1.56 0.9 1.0 1.3 1.3 1.7 35 Economic
Mauritania AFR 0.74 1.16 1.5 0.6 5.2 0.9 8.0 54 Economic
Mozambique AFR 0.66 1.03 1.5 0.5 0.3 0.8 0.5 51 Economic
Niger AFR 0.99 1.96 2.3 0.7 2.4 1.3 4.6 90 Economic
Nigeria AFR 8.29 14.56 1.9 5.0 3.1 7.6 4.8 53 Economic
Senegal AFR 1.18 1.95 1.7 0.9 4.8 1.4 7.5 58 Economic
Somalia AFR 1.93 3.40 1.9 1.5 11.9 2.6 20.9 76 Economic
South Africa AFR 16.49 21.05 0.8 14.1 47.1 18.6 62.1 32 Physical
Sudan AFR 19.84 26.52 1.0 16.0 16.2 20.2 20.4 26 Economic
Tanzania AFR 1.09 2.03 2.1 0.8 1.0 1.4 1.7 78 Economic
Table B 7. Total water withdrawals, primary water supply.
Country Region Total Water Withdrawals Total Primary Water Supply
1995 2025 Total 1995 % of 2025 % of Total Scarcitygrowth PUWR PUWR growth level
k3 km3 % km3 % km3 % %

86
Uganda AFR 0.09 0.31 4.1 0.1 0.2 0.2 0.5 161 Economic
Zambia AFR 0.80 1.56 2.2 0.5 1.0 0.9 1.7 73 Economic
Zimbabwe AFR 1.42 2.24 1.5 1.0 1.6 1.5 2.5 52 Economic
Algeria MENA 3.97 7.55 2.2 2.8 32.2 5.3 61.7 92 Physical
Egypt MENA 46.14 56.36 0.7 31.3 53.7 36.1 62.0 15 Physical
Iran MENA 96.63 96.96 0.0 75.3 91.2 69.0 83.6 -8 Physical
Iraq MENA 36.84 38.82 0.2 28.8 63.6 30.7 67.9 7 Physical
Israel MENA 1.46 1.59 0.3 1.1 61.1 1.1 64.3 5 Physical
Jordan MENA 1.08 1.45 1.0 0.8 150.7 0.8 150.6 0 Physical
Libya MENA 3.79 5.41 1.2 2.7 554.9 4.0 836.5 51 Physical
Morocco MENA 11.46 15.88 1.1 7.9 40.6 10.2 52.3 29 Economic
Saudi Arabia MENA 14.35 13.01 -0.3 13.0 677.5 12.8 666.3 -2 Physical
Syria MENA 12.68 16.35 0.9 10.2 65.0 12.6 79.9 23 Physical
Tunisia MENA 2.25 2.77 0.7 1.7 72.3 1.8 76.8 6 Physical
Yemen MENA 6.31 9.37 1.3 5.2 184.4 7.4 262.8 42 Physical
Afghanistan SA 31.01 49.26 1.6 24.6 69.4 37.7 106.6 54 Physical
Bangladesh SA 24.20 35.71 1.3 20.8 7.5 28.3 10.2 36 Economic
India SA 617.44 811.76 0.9 381.2 49.2 473.0 61.1 24 Physical
Nepal SA 5.10 7.37 1.2 3.4 7.3 5.0 10.7 46 Economic
Pakistan SA 177.67 203.35 0.5 177.7 89.3 203.4 102.2 14 Physical
Sri Lanka SA 10.17 9.97 -0.1 6.9 20.1 6.7 19.4 -3 Little or no
Cambodia EAP 0.80 1.58 2.3 0.6 0.3 1.1 0.6 99 Economic
China EAP 581.62 916.82 1.5 359.0 44.3 504.2 62.3 40 Physical
Indonesia EAP 65.17 82.76 0.8 34.8 6.7 40.8 7.8 17 Little or no
Korea D P Rep EAP 10.90 14.44 0.9 8.0 30.3 10.0 37.7 25 Economic
Korea Rep EAP 17.91 26.58 1.3 12.7 22.9 17.2 30.9 35 Economic
Malaysia EAP 8.39 29.99 4.3 5.5 2.4 16.4 7.2 199 Economic
Table B 7. Total water withdrawals, primary water supply.
Country Region Total Water Withdrawals Total Primary Water Supply
1995 2025 Total 1995 % of 2025 % of Total Scarcitygrowth PUWR PUWR growth level
k3 km3 % km3 % km3 % %

87
Myanmar EAP 2.66 6.32 2.9 2.1 0.7 4.6 1.6 119 Economic
Philippines EAP 34.20 69.66 2.4 21.4 13.4 37.9 23.7 78 Economic
Thailand EAP 20.69 42.23 2.4 16.0 16.8 30.0 31.5 88 Economic
Vietnam EAP 33.97 51.43 1.4 22.1 5.7 30.1 7.7 36 Economic
Hungary ECA 5.49 7.94 1.2 4.8 5.1 7.1 7.5 48 Economic
Kazakhstan ECA 25.24 23.85 -0.2 18.3 24.5 16.1 21.5 -12 Little or no
Kyrgyzstan ECA 11.41 14.27 0.7 9.2 31.4 11.4 38.7 23 Little or no
Poland ECA 9.75 13.25 1.0 3.3 9.9 3.8 11.2 13 Little or no
Romania ECA 29.55 31.66 0.2 19.1 15.6 17.6 14.3 -8 Little or no
Russian Fed ECA 90.94 80.72 -0.4 52.1 3.0 43.5 2.5 -17 Little or no
Tajikistan ECA 8.06 7.77 -0.1 6.3 8.4 5.8 7.7 -9 Little or no
Turkey ECA 51.42 92.85 2.0 27.0 21.0 52.3 40.6 94 Economic
Turkmenistan ECA 13.61 13.18 -0.1 11.1 19.6 10.3 18.3 -7 Little or no
Ukraine ECA 34.94 31.87 -0.3 23.4 18.6 20.4 16.2 -13 Little or no
Uzbekistan ECA 43.79 43.36 0.0 34.9 41.8 32.7 39.2 -6 Little or no
Argentina LAC 24.90 34.19 1.1 17.0 3.2 22.7 4.2 34 Economic
Bolivia LAC 1.35 1.72 0.8 1.0 0.4 1.3 0.5 23 Little or no
Brazil LAC 47.97 102.33 2.6 28.3 3.5 55.6 6.8 97 Economic
Chile LAC 13.83 20.54 1.3 11.0 6.2 15.1 8.5 38 Economic
Colombia LAC 4.03 11.26 3.5 2.5 0.5 6.3 1.3 149 Economic
Costa Rica LAC 1.13 1.41 0.7 0.9 1.7 1.1 2.0 17 Little or no
Cuba LAC 9.61 10.93 0.4 8.4 48.5 9.3 53.6 11 Little or no
Ecuador LAC 4.95 5.28 0.2 3.7 2.3 3.9 2.4 4 Little or no
El Salvador LAC 0.79 1.07 1.0 0.6 5.5 0.8 6.9 25 Economic
Guatemala LAC 0.46 1.19 3.2 0.4 0.7 0.8 1.5 133 Economic
Haiti LAC 0.42 0.79 2.1 0.3 6.4 0.6 12.2 91 Economic
Table B 7. Total water withdrawals, primary water supply.
Country Region Total Water Withdrawals Total Primary Water Supply
1995 2025 Total 1995 % of 2025 % of Total Scarcitygrowth PUWR PUWR growth level
k3 km3 % km3 % km3 % %

88
Honduras LAC 0.61 0.99 1.6 0.5 1.7 0.7 2.4 45 Economic
Mexico LAC 71.34 137.35 2.2 57.0 27.3 104.6 50.2 83 Economic
Nicaragua LAC 0.80 1.57 2.2 0.6 0.7 0.9 1.0 48 Economic
Panama LAC 0.51 0.93 2.1 0.4 0.5 0.6 0.8 60 Economic
Paraguay LAC 0.62 0.97 1.5 0.5 0.2 0.7 0.2 45 Economic
Peru LAC 4.59 10.50 2.8 3.2 0.6 6.9 1.4 116 Economic
Uruguay LAC 1.73 2.01 0.5 1.1 1.2 1.2 1.4 13 Little or no
Venezuela LAC 4.38 7.78 1.9 2.9 0.4 4.4 0.6 50 Economic
Australia OTHER 27.38 40.50 1.3 24.4 11.5 36.3 17.2 49 Economic
Bulgaria OTHER 9.91 12.43 0.8 8.7 10.3 10.5 12.4 20 Little or no
Canada OTHER 43.61 52.95 0.6 43.0 6.3 52.5 7.7 22 Little or no
France OTHER 37.27 38.42 0.1 33.6 28.7 34.6 29.6 3 Little or no
Germany OTHER 43.97 42.44 -0.1 40.2 39.7 38.8 38.3 -3 Little or no
Greece OTHER 5.65 8.25 1.3 4.3 8.9 6.1 12.6 43 Economic
Italy OTHER 43.93 42.68 -0.1 35.8 37.3 35.6 37.1 0 Little or no
Japan OTHER 108.52 90.22 -0.6 60.9 41.5 54.6 37.2 -10 Little or no
Netherlands OTHER 6.37 6.48 0.1 5.8 7.4 5.9 7.6 2 Little or no
Portugal OTHER 6.58 8.20 0.7 4.6 14.3 5.8 18.4 28 Economic
Spain OTHER 32.29 33.31 0.1 28.5 50.5 29.7 52.4 4 Little or no
UK OTHER 11.67 11.66 0.0 9.5 14.7 9.5 14.7 0 Little or no
USA OTHER 465.90 522.79 0.4 393.8 21.5 457.5 25.0 16 Little or no
Table B 7. Total water withdrawals, primary water supply.
Country Region Total Water Withdrawals Total Primary Water Supply
1995 2025 Total 1995 % of 2025 % of Total Scarcitygrowth PUWR PUWR growth level
k3 km3 % km3 % km3 % %

89
Literature Cited
Agarwal. 1998. Coping with dry spells and drought years—India’s traditions in water harvesting. Stockholm WaterFront, No. 1–2, May 1998. Stockholm, Sweden.
Amarasinghe, U.A.; Lal Mutuwatta; and R. Sakthivadivel. 1999. Water scarcity variations within a country: A casestudy of Sri Lanka. Colombo, Sri Lanka: International Water Management Institute.
Barker, R.; C. A. Scott; C. de Fraiture; and U. Amarasinghe. 2000. Global water shortages and the challenge facingMexico. International Journal of Water Resources Development 16 (4): 525–542.
Cosgrove, W. J.; and Frank R. Rijsberman. 2000. World water vision: Making water everybody’s business. UK: WorldWater Vision.
CWC (Central Water Commission). 1998. Water and related statistics. India: Central Water Commission.
FAO (Food and Agriculture Organization). 1998. FAOSTAT statistical database in CD-ROM. Rome: FAO.
Gleick, P. H. 1996. Basic water requirements for human activities: Meeting basic needs. Water International 21(2):83–92.
Gleick, P. H. 1998. The world’s water 1998–1999. The Biennial Report on Freshwater Resources. Washington, D.C.:Island Press.
IWMI (International Water Management Institute). 2000. World water supply and demand: 1995 to 2025. Colombo,Sri Lanka: International Water Management Institute.
Molden, D. J.; R. Sakthivadivel; and Z. Habib. 2000. Basin-level use and productivity of water: Examples from SouthAsia. Research Report 49. Colombo, Sri Lanka: International Water Management Institute.
Seckler, D. 1993. Designing water resources strategies for the twenty-first century. Discussion Paper 16. WaterResources and Irrigation Division. Arlington, Virginia, USA: Winrock International.
Seckler, David; and Michael Rock. 1995. World population growth and food demand to 2025. Discussion Paper.Water Resources and Irrigation Division. Arlington, Virginia, USA: Winrock International.
Seckler, D.; U. Amarasinghe; David Molden; R. de Silva; and Randy Barker. 1998. World water demand and supply:1995 to 2025, scenarios and issues. Colombo, Sri Lanka: International Water Management Institute.
Shiklomonav. 1999. World water resources: A new appraisal and assessment for the 21st century. InternationalHydrological Program Report. Paris: United Nations Educational, Scientific, and Cultural Organization.
UN (United Nations). 1999. World population prospect: 1998 revision. New York: UN Department of PolicyCoordination and Sustainable Development.
World Bank. 1997. From vision to action. Environmentally and Socially Sustainable Development Studies andMonograph Series 12. Washington, D.C.
World Bank. 2000. Entering the 21st century, world development report 1999/2000. New York: Oxford UniversityPress.
WRI (World Resources Institute). 1998. World resources 1998–99. A Guide to the Global Environment. New York:Oxford University Press.
WWC (World Water Council). 2000. Second world water forum and ministerial conference, 17–22 March 2000,The Hague, The Netherlands: “From vision to action” –Final report. The Hague, The Netherlands: The Council.
Water forRural Development
David Molden, Upali Amarasingheand Intizar Hussain
WORKING PAPER 32
Postal Address
Location
Telephone
Fax
Website
P O Box 2075ColomboSri Lanka
127, Sunil MawathaPelawattaBattaramullaSri Lanka
94-1-867404, 784084
94-1-866854
www.iwmi.org
SM
IWMI is a Future Harvest Centersupported by the CGIAR
SM
Water ManagementI n t e r n a t i o n a l
I n s t i t u t eWater ManagementI n t e r n a t i o n a l
I n s t i t u t e
Background Paper on Water forRural Development Preparedfor the World Bank