working paper 280 - icrieri working paper 280 india-korea cepa: harnessing the potential in services...
TRANSCRIPT
i
Working Paper 280
India-Korea CEPA: Harnessing the
Potential in Services
Nisha Taneja
Neetika Kaushal Nagpal
Saon Ray
July 2014
INDIAN COUNCIL FOR RESEARCH ON INTERNATIONAL ECONOMIC RELATIONS
i
Table of Contents
Abstract ..................................................................................................................................... ii
1. Introduction ......................................................................................................................... 1
2. Understanding Trade in Services ....................................................................................... 2
3. WTO vs. CEPA: A Comparative Analysis ........................................................................ 4
3.1 Comparative Analysis: ............................................................................................. 5
4. Performance and Composition ........................................................................................... 7
5. Trade Possibilities .............................................................................................................. 10
6. Sectoral Trade Possibilities and Regulatory Barriers .................................................... 12
6.1 Computer and Information Services (C&I) ........................................................... 12
6.2 Transportation ....................................................................................................... 15
6.3 Construction Services ............................................................................................ 18
6.4 Audio-Visual Services ............................................................................................ 21
7. Way Forward and Conclusion ......................................................................................... 24
References ............................................................................................................................... 27
APPENDIX ............................................................................................................................. 33
List of Tables and Figures
Table 3.1: Commitments in Doha Round and CEPA ............................................................... 4
Table 4.1: Service Sector Overview ......................................................................................... 8
Table 4.2: Structure of Export (US$ billions) ........................................................................... 9
Table 5.1: RCA Comparison for Service Sectors ................................................................... 11
Figure 4.1: Export of Services (USUS$ billions) ..................................................................... 8
ii
Abstract
Under India-Korea Comprehensive Economic Partnership Agreement, both India and Korea
have offered trade liberalisation commitments in services. This paper examines the CEPA
with the objective of identifying potential areas for harnessing services trade between the two
countries. Using the Revealed Comparative Advantage (RCA) index, the paper shortlists four
sectors of interest and identifies possibilities of bilateral trade flows in these sectors in the
purview of existing domestic regulatory regime. Through a qualitative examination, it
highlights the market access barriers and suggests areas of co-operation for enhanced trade in
services. The paper also draws a comparison between the schedules of commitments offered
by India and Korea under WTO revised offer and CEPA to analyse the extent of liberalisation
undertaken in the bilateral agreement. The paper concludes that there are strong
complementarities for services trade in sectors such as IT, transportation, construction and
audiovisual services. By collaborating in these areas, India and Korea can not only strengthen
their trade ties but can also gain a competitive advantage in the global market.
_______________
JEL Classification: L80, F13, F14.
Keywords: Services, Trade, India, Korea, CEPA
Authors Emails: [email protected], [email protected], [email protected]
_________________
Disclaimer: Opinions and recommendations in the paper are exclusively of the author(s) and
not of any other individual or institution including ICRIER

1
India-Korea CEPA: Harnessing the Potential in Services
Nisha Taneja, Neetika Kaushal Nagpal and Saon Ray1
1. Introduction
The services sector is a major contributor to GDP, international trade and employment in not
just developed economies but also in emerging economies. With rapid expansion of the
services sector in most countries, any trade liberalisation is considered incomplete without
liberalisation of the services sector. Realising this, the World Trade Organisation (WTO)
broadened the scope of negotiation during the Uruguay Round in 1995 to include trade in
services by establishing the General Agreement on Trade in Services (GATS).2 However,
limited success of Uruguay Round and sluggish progress of Doha Development Agenda
(launched in November 2001) in multilateral trade negotiations accelerated the process of
bilateral and regional trade agreements (RTAs). Many WTO members embraced RTAs as
“trade policy instruments and as complimentary to MFN” (Crawford and Fiorentino, 2005).
A distinct feature of these agreements, also called the “New Age FTAs” is that they extend
beyond merchandise trade to include services, investments, government procurement and a
range of other co-operation issues apart from trade in goods. The purpose of these
comprehensive trade agreements is not only to enhance bilateral trade flows but also
strengthen strategic ties or overcome historic animosities (Fink and Molinuevo, 2007).3 Fink
et al. (2007) note that though services were previously considered non-tradable, technological
progress and trend towards private and competitive provision of infrastructure services have
enabled trade in a wide range of service activities. The services sector has come to account
for the fastest growing segment of international commerce (World Bank, 2002) .4
In line with this pattern of bilateralism/regionalism, India and Korea have been signing a
number of Comprehensive Economic Partnership Agreements (CEPA) with several countries
and regions. Some of these agreements are with neighbours while others are in the inter-
regional framework of economic cooperation ranging from bilateralism to sub-regionalism to
regionalism. Apart from Korea, India has a CEPA with Japan, and CECA with Singapore and
Malaysia. Korea has a CEPA only with India and is negotiating RCEP.5
1 We would like to acknowledge Ms. Divya Satija for her valuable comments and Mr. Nitesh Kumar for his
research assistance in the paper. 2 GATS established the rules and discipline governing trade in services in a multilateral framework. It has the
objective of creating a credible and reliable system of international trade rules; ensuring fair and equitable
treatment of all participants (principle of non-discrimination); stimulating economic activity through
guaranteed policy bindings; and promoting trade and development through progressive liberalization. 3 “Liberalisation of Trade in Services”, C.Fink and M.Molinuevo, World Bank (2007)
4 World Bank (2002). “Global Economic Prospects 2002: Making Trade Work for the World’s Poor.”
(Washington, DC: The World Bank) 5 RCEP is the Regional Comprehensive Economic Partnership between the ten member states of ASEAN and
six states with which ASEAN has FTAs (Australia, China, India, Japan, Korea and New Zealand)
2
The feasibility of signing a CEPA between India and Korea were examined by a Joint Study
Group in 2005. The Indo-Korea CEPA was concluded in 2009 and implemented in 2010. The
agreement covers goods, services, investments, bilateral cooperation, intellectual property
rights and competition. Since its operation, the CEPA has unleashed economic growth
impulses as a result of which two-way trade has increased from US$12 billion in 2009-10 to
US$17 billion in 2012-13, an increase of 42 percent. The trade volume is expected to cross
US$40 billion by 2015. This surge can be attributed to strong economic growth in India that
offers growing opportunities for trade and investment to Korean firms, particularly in
automotives, steel and electronic industries.
Recently in January 2014, the finance ministers of the two governments met to discuss
bilateral trade, investments and possibilities of upgrading the CEPA. Korea is pressing on
getting a zero-tariff access into India's market for auto and steel, among other goods. In
addition, Korea wants to evaluate the process to obtain permission for establishing branches
of Korean commercial banks in India. However, India is undertaking a study examining its
existing FTA/CEPA. The findings of the study will determine which way the India-Korea
CEPA revision will go.
With the objective of identifying the potential areas for harnessing services trade between
India and Korea, this paper attempts to describe the performance and composition of the
service sector in both countries, assess liberalisation commitments under CEPA and examine
the extent to which these are more liberal than the unilateral commitments, assess trade
possibilities in sectors for detailed analysis. The qualitative examination of the sectors
highlights the market access barriers and suggests areas for co-operation for enhanced trade
in services in identified sectors under the CEPA.
2. Understanding Trade in Services
The comparison of commitments that India and Korea have undertaken under WTO and
India-Korea CEPA are examined using the GATS framework which provides member
countries with a structure for negotiating removal of external and domestic barriers. GATS
categorises services trade into four modes of supply depending on the location of supplier and
consumer. Mode 1 (cross-border supply) is the delivery of services across countries without
the physical movement of supplier or buyer of the service. Mode 2 (consumption abroad)
refers to the physical movement of service consumer to the territory of service provider for
consumption. Mode 3 (commercial presence) pertains to establishment of foreign affiliates
and subsidiaries of foreign service companies, joint ventures, partnerships, representative
offices and branches and Mode 4 (presence of natural persons) refers to natural persons who
themselves are service suppliers, as well as natural persons who are employees of service
suppliers temporarily present in other Member’s market to provide the service.
Unlike goods, barriers to trade in services are not in the form of import tariffs. Instead,
service trade barriers take the form of restrictions, prohibitions, government regulations, etc.
Service trade liberalisation is henceforth, dependent on removal and relaxation of these non-
tariff barriers. GATS identifies two broad categories of barriers – market access (MA) and

3
national treatment (NT). Market access barriers exist when a country does not allow (or
partially allows with some restriction) foreign service providers to enter and operate in its
markets. Restrictions in market access include barriers such as limitations on number of
foreign service providers, total quantity of service output, valuation of transactions and
assets, number of persons to be employed, etc. A country is said to have imposed a national
treatment barrier if it accords a treatment less favourable to other country service providers
than to its own domestic service providers. These barriers include discriminatory taxes,
residency requirements, registration and licensing, etc.6
Based on this framework, member countries can offer commitments for each of the four
modes of supply of services across all sectors (horizontal commitments) or in specific
sectors/sub-sectors (sectoral commitments). For each sector under each mode, member
country can impose market access and/or national treatment barriers. If the country imposes
no barriers in a particular mode, it is said to have “full” commitment. If the county imposes
some restrictions in a mode, then it is said to have offered “partial” commitments. If a
country does not make any commitment to liberalise the sector in a mode and reserves the
rights to impose restrictions in the future, the country is said to have kept the sector
“unbound”. On the basis of this categorization, countries offer liberalisation commitments on
service trade sectors using the services sectoral classification list by GATS
(MTN.GNS/W/120 – July 1991). This list, with 12 broad sectors, has been in turn drawn
from the United Nations Central Product Classification (UNCPC) which provides a
comprehensive coverage of all services sectors.
Estimates and data for trade in commercial services in mode 1, 2 and 4 are derived from a
country’s balance of payment account and for Mode 3 using the Foreign Affiliates Trade in
Services (FATS) statistics.7 However, export and import of commercial services is classified
and recorded using the concepts, definition and classifications under the fifth edition of the
International Monetary Fund (IMF) Balance of Payment Manual (1993). Under this
classification, the current account of balance of payment (BoP) is sub-divided into goods,
services, (including government services, not included elsewhere), income (investment
income and compensation of employees), and current transfers.
Commercial services are defined as all services minus government services not included
elsewhere. It is further sub-divided into three categories – transportation, travel and other
commercial services. Transportation service covers air, maritime, rail, road, and pipeline
transport services that involves freight, passenger and other auxiliary services such as
warehousing, cargo handling, etc. Travel consists of hotels and restaurants, travel agencies,
tour operators and tourist guides. Unlike other services, travel is not a specific type of service
but is an assortment of goods and services consumed by travellers. Other commercial services
comprises of nine sub-sectors - insurance, financial services, computer and information,
6 Taneja, Mukherjee, Jayanetti and Jayawardane (2004) “Indo Sri Lanka Trade in Services: FTAII and Beyond”,
ICRIER Working Paper No. 145
7 Metadata, WTO International Trade Statistics
4
construction, communications, royalty and license fees, other business services, and personal,
cultural and recreational services.
The data on trade in services is available only at the country level and not at the bilateral
level. For the period under study (2000-2011), the data is available for almost all categories
and sub-categories with a few exceptions. The data for secondary analysis is extracted from
WTO, UNCTAD and World Bank at the aggregate level.
3. WTO vs. CEPA: A Comparative Analysis
The process of services trade liberalisation began with the formulation of GATS, which was a
landmark achievement under the Uruguay Round (1995).8 In this round, member countries
submitted schedule of commitments for selected service sectors. This was followed by the
Doha Round (commenced in 2001) which marked the beginning of first round of negotiations
under the Council for Trade in Services. Its objective was to lower trade barriers around the
world in order to facilitate trade in services. As a part of this round, member countries
submitted a revised offer for negotiations that is still under discussion.
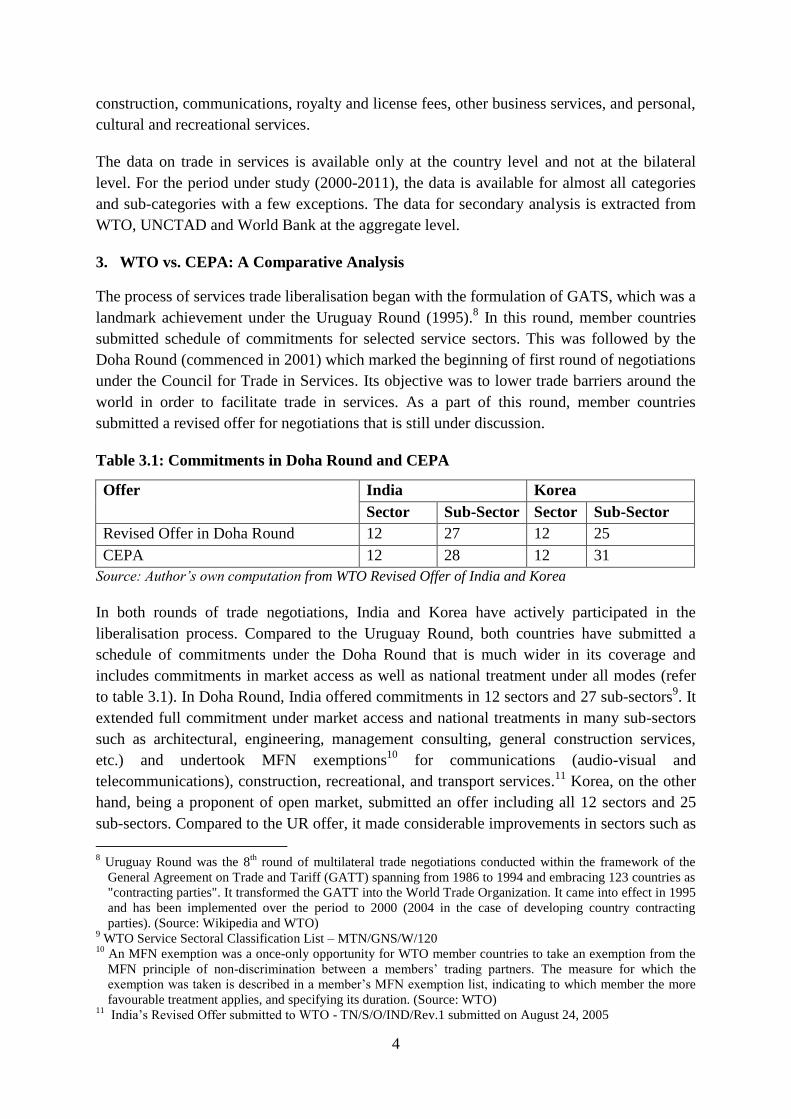
Table 3.1: Commitments in Doha Round and CEPA
Offer India Korea
Sector Sub-Sector Sector Sub-Sector
Revised Offer in Doha Round 12 27 12 25
CEPA 12 28 12 31
Source: Author’s own computation from WTO Revised Offer of India and Korea
In both rounds of trade negotiations, India and Korea have actively participated in the
liberalisation process. Compared to the Uruguay Round, both countries have submitted a
schedule of commitments under the Doha Round that is much wider in its coverage and
includes commitments in market access as well as national treatment under all modes (refer
to table 3.1). In Doha Round, India offered commitments in 12 sectors and 27 sub-sectors9. It
extended full commitment under market access and national treatments in many sub-sectors
such as architectural, engineering, management consulting, general construction services,
etc.) and undertook MFN exemptions10
for communications (audio-visual and
telecommunications), construction, recreational, and transport services.11
Korea, on the other
hand, being a proponent of open market, submitted an offer including all 12 sectors and 25
sub-sectors. Compared to the UR offer, it made considerable improvements in sectors such as
8 Uruguay Round was the 8
th round of multilateral trade negotiations conducted within the framework of the
General Agreement on Trade and Tariff (GATT) spanning from 1986 to 1994 and embracing 123 countries as
"contracting parties". It transformed the GATT into the World Trade Organization. It came into effect in 1995
and has been implemented over the period to 2000 (2004 in the case of developing country contracting
parties). (Source: Wikipedia and WTO) 9 WTO Service Sectoral Classification List – MTN/GNS/W/120
10 An MFN exemption was a once-only opportunity for WTO member countries to take an exemption from the
MFN principle of non-discrimination between a members’ trading partners. The measure for which the
exemption was taken is described in a member’s MFN exemption list, indicating to which member the more
favourable treatment applies, and specifying its duration. (Source: WTO) 11
India’s Revised Offer submitted to WTO - TN/S/O/IND/Rev.1 submitted on August 24, 2005
5
business services, construction, distribution, education, financial and transportation services.
It also allowed complete market access and national treatment in several sectors such as legal,
wholesale trade, retailing services, etc under mode 2, 3 and 4. Moreover, it participated in the
extended GATS negotiations on financial services and telecommunications and became a
member and observer, respectively, of the plurilateral Agreements in Government
Procurement12
and Trade in Civil Aircraft.13
Under the CEPA, both countries have offered liberal commitments in services trade. They
have offered commitments in all sectors classified under the GATS according to the
MTN.GNS/W/12014
document. A comparison of the offers made by India and Korea in WTO
and the CEPA is presented in Appendix 1A. The schedule of commitments under the CEPA
has the same framework as GATS. The commitments on 12 sectors cover national treatment,
market access, domestic obligations, exceptions, definitions and scope but it does not venture
into safeguards, subsidies and procurement. In terms of sub-sectors, the Indian schedule
includes 28 sub-sectors and Korean schedule includes 31 sub-sectors. In addition, it also has
separate chapters on telecommunications, financial services, audio-visual services and
movement of natural persons (mode 4) enlisting additional commitments and terms for trade.
3.1 Comparative Analysis:
This section draws a comparison between commitments offered under the Doha Round and
under CEPA for each sub-sector. The focus is on assessing the possible additional gains that
the two countries can have in each other’s markets under the CEPA and the extent of
liberalisation in the bilateral agreement vis-à-vis multilateral agreement. Refer to appendix
1A for a detailed comparison of the commitments by the two countries.
Mode 1: As compared to the revised offer, India has not made many changes to its
commitments under CEPA for cross-border services. It has offered to give full commitments
in research and development (R&D) in natural sciences and biotechnology, hotels and other
lodging services, and travel agency and tour operator services and partial commitment in
advertising services. Korea, on the other hand, offered more liberal commitments for cross-
border services under its revised offer (submitted in 2003) than under CEPA. In the former, it
fully liberalised sub-sectors like engineering, urban planning, advertising, environmental
testing, audio-visual services, etc. It also gave partial commitments in courier, adult
education, life insurance, non-life insurance, and reinsurance services. However, under the
CEPA, Korea has added the requirement of ‘local presence’ in all these services as a
condition for foreign individuals or juridical persons wishing to provide services within the
12
The Agreement on Government procurement (GPA) is based the only legally binding agreement in the WTO
focusing on the subject of government procurement. It is a plurilateral treaty administered by a Committee on
Government Procurement, which includes the WTO Members that are Parties to the GPA, and thus have
rights and obligations under the Agreement. (Source: WTO) 13
Plurilateral Agreement on Trade in Civil Aircraft was entered into force on January 1, 1980 and has 31
signatories. It eliminates import duties on all aircraft, other than military aircraft, as well as on all other
products covered by the agreement — civil aircraft engines and their parts and components, all components
and sub-assemblies of civil aircraft, and flight simulators and their parts and components. (Source: WTO) 14
www.wto.org/english/tratop_e/serv_e/mtn_gns_w_120_e.doc
6
territory. This requirement is often made in case of services that require close supervision to
guarantee consumer protection15
. However, it may hinder international trade because it is
likely to impose financial cost on foreign service providers. This requirement has made
Korea’s commitments under CEPA more restrictive than the multilateral agreement as in the
latter, there is no such requirement of local presence for foreign entities.
Mode 2: Trade through consumption abroad primarily takes place in education, travel and
tourism, and healthcare services. In both revised offer as well as CEPA, India has offered
liberal commitments for trade in these services. Korea on the other hand, has offered liberal
commitments in only two out of these three services – education and travel & tourism. It has
not included healthcare services in both the schedules, implying that market access is
restricted in this sector.
Mode 3: India offered liberal commitments in commercial presence under the revised offer
including sectors such as engineering, computer and related services, rental and leasing,
construction services, etc. It further liberalised trade in this mode under the CEPA by offering
commitments in all the above sectors as in the revised offers and in addition including some
others such as R&D on natural sciences, advertising, internet, factoring, and services
incidental to mining. Korea has offered liberal commitments in the revised offer as well as
under CEPA. In the revised offer, it allowed conditional access to foreign investors in 18 sub-
sectors and full access in the remaining sub-sectors. However, it limited investment in stocks
to companies listed under the Korea Stock Exchange with an upper ceiling of 6 percent of the
company’s total stock by individual foreign investors and an aggregate 23 percent of foreign
investment per company. Under the CEPA, it offered more liberal commitments in
comparison to the revised offer by including sub-sectors such as building, cleaning, technical
and analysis services of physical properties, and sporting and other recreational services (only
for national treatment). Moreover, both countries have agreed to give preference to
application of partner country’s banks for establishment of branches if they meet the industry
requirement.
Mode 4: Under the revised offer, both India and Korea have specified their commitments in
the movement of natural persons in horizontal commitments section. In the revised offer,
India has included four categories of persons – business visitors (BV), intra-corporate
transferees (ICT), contractual service suppliers (CSS) and independent professionals (IP). In
the latter two categories, it specifies a list of sub-sectors in which the persons can obtain a
service contract. The Korean revised offer allowed ICT, BV and services salespersons (SS)
who can temporarily stay in Korea with a visa but restricted CSS. Under the CEPA, however,
movement of natural persons is covered in a separate chapter. It covers four categories of
natural persons – ICT, BV, CSS and IP, as defined under WTO/GATS (see appendix 2A for
definition). For the latter two categories, the countries have prepared a positive list of 163
professions that professionals from two countries can engage in, provided the person
complies with applicable immigration measures. In the case of ICT, India has agreed to grant
15
“Development, Trade and the WTO – A Handbook”, Edited by Bernard Hoekman, Aaditya Mattoo and Philip
English, World Bank (2002)

7
a visa for a temporary stay for an initial period of up to one year as against Korea which has
agreed for a visa of up to two years. For BVs, India has agreed to grant a temporary stay for a
period of not more than 180 days while Korea has agreed for a period of only 90 days. The
commitments also cover employment of spouse and dependents, regulatory transparency,
resolution of problems, dispute settlement and reservations.
Overall, both India and Korea have offered more liberal commitments under the bilateral
agreement than the revised offer by covering a larger number of sectors and sub-sectors in
respective schedules. However, Korea’s requirement of local presence in Mode 1 is
restrictive. It has similar requirements in other FTAs as well such as the Korea-EU FTA but
not under the Korea-US and Korea-Singapore FTA.
4. Performance and Composition
In recent years, both Indian and Korean economy have undergone major economic and
structural changes which has resulted in the emergence of services as a leading sector
contributing significantly to GDP and international trade. Previously, the service sector in
both economies was subject to substantial barriers in trade and investments. The policy of
liberalisation was adopted with the objective of lowering prices, improving quality,
increasing competitiveness and ultimately reducing the loss to consumer surplus. Services
accounted for 56 percent of GDP in India and 58 percent of GDP in Korea in 2012. The size
of the sector increased almost five times from US$241 billion in 2000 to US$970 billion in
2012 in India, and more than doubled from US$306 billion to almost US$600 billion during
the same period in Korea.
The share of the sector in total trade of goods and services has also accelerated in both
countries. During 2000-12, it contributed around 28-30 percent in India’s and 16-18 percent
in Korea’s total trade of goods and services. In 2012, service trade for India was US$274
billion accounting for 15 percent of GDP while that of Korea was US$216 billion accounting
for 19 percent of GDP. Exports of service also increased more than six times in India from
US$16 billion to US$145 billion and tripled in Korea from US$30 billion in 2000 to US$110
billion in 2012. While India is a net exporter of services since 2004, Korea’s trade balance
worsened from US$2.4 billion in 2000 to US$6 billion in 2011 but actually turned favourable
US$2 billion in 2012.

8
Table 4.1: Service Sector Overview
Source: Compiled from World Development Indicators (2012), World Bank
Figure 4.1: Export of Services (USUS$ billions)
Source: Compiled from WTO
The lag in the growth of service trade in Korea as compared to India is explained by its
economic policy and structure. After putting an end to its inward-looking policy in 1990’s,
India adopted a service-export led development policy primarily driven by IT-ITeS services.
0.00
20.00
40.00
60.00
80.00
100.00
120.00
140.00
160.00
1 2 3 4 5 6 7 8 9 10 11 12 13
India’s Exports (billion US$ current prices) Korea’s Exports (billion US$ current prices)
India Korea
2002 2004 2006 2008 2011 2012 2002 2004 2006 2008 2011 2012 GDP
(USUS$
billion at
current
prices)
523 722 949 1224 1873 1858 576 722 952 931 1116 1130
Services as
percent of
GDP 53.0 53.0 52.9 53.9 55.7 56.2 59.8 58.1 59.7 60.8 58.1 58.2
Annual
Growth of
Services
(in
percentage)
7.0 8.1 10.1 10.0 8.2 7.0 7.7 2.5 4.4 2.7 2.7 2.5
Trade in
Services as
percent of
GDP
7.7 10.2 13.5 16.0 14.0 15.0 11.7 13.1 13.3 20.1 17.4 19.4
Trade in
Services as
percent of
Trade in
Goods &
Services
27.7 29.9 30.7 28.5 25.8 26.9 17.7 16.5 16.5 17.8 15.3 17.4

9
Korea, on the other hand, has concentrated comparatively more on manufacturing sector led
export policy over the last 40 years. However, the Korean services sector has now gained a
strong foothold in merchandise exports by providing cost efficient solutions through
inventory control, sales, marketing, etc. This has created a “manufacturing-services
continuum”, a phenomenon particularly evident in South Korea.16
Unlike schedule of commitments which use service sector classification list by GATS
(MTN.GNS/W/120-July 1991), export and import of services trade is based on classification
under the fifth edition of International Monetary Fund (IMF) Balance of Payment (BoP)
Manual (1993). Under this classification, commercial service is sub-divided into three
categories - transportation, travel and other commercial services. Looking at composition of
service trade, India’s trade basket has remained rather concentrated in the last decade with
other commercial services (OCS) accounting for a majority share followed by travel and
transportation (Table 4.2). During 2000-11, the share of OCS in total commercial services
export increased substantially from 66 percent in 2000 to 74 percent in 2011. On the other
hand, the share of travel declined from 21 percent in 2000 to 13 percent in 2011. The share of
transportation has remained unchanged at around 12 percent during the period. Within the
nine sub-sectors of OCS, computer and information and other business services together
accounted for about 70 percent in total services export. This is indicative of India’s
concentrated trade basket.
Table 4.2: Structure of Export (US$ billions)
Source: World Development Indicator, World Bank. *Figures in parenthesis indicate share of
category export in total commercial service export.
Unlike India, Korean trade basket has changed in the last decade. In 2000, transportation
accounted for a majority share followed by OCS and travel. The share of transport services
has declined to 39.5% in 2011 while that of OCS has risen to 47.4%. It is led by an increase
in exports of construction and other business services. While OCS accounts for the largest
share in total commercial services export in India as well as Korea, the sub-sectors within
OCS leading exports are different for both countries. Computer and Information services
accounts for a majority share in India’s and construction services accounts for a majority
share in Korea’s export of OCS.
16
“South Korea braves the knowledge economy”, Scott B Macdonald, Korea Investment Forum
(http://ncta.osu.edu/lessons/korea/econ/Koreanpercent20Economicpercent20Developmentpercent20Flaig.pdf)
Service Category India Korea
2000 2006 2011 2000 2006 2011
A. Transportation 2.5
(12.9)
7.6
(10.9)
17.5
(12.8)
13.2
(44.8)
25.8
(46.6)
37.0
(39.5)
B. Travel 3.1
(16.2)
8.6
(12.4)
17.5
(12.8)
5.9
(20.1)
5.8
(10.5)
12.3
(13.1)
C. Other Commercial
Services
13.5 (70.8) 53.3
(76.7)
101.5
(74.4)
10.4
(35.1)
23.7
(42.9)
44.4
(47.4)
Total 16.0
(100)
69.5
(100)
136.5
(100)
29.7
(100)
55.3
(100)
93.9
(100)

10
5. Trade Possibilities
A majority of studies conducted to assess the bilateral trade possibilities between two
countries use two conventional tools – Revealed Comparative Advantage (RCA) index17
and
Trade Complementarity Index (TCI)18
. The prospects of trade expansion are likely to be
strong for countries that have either comparative advantage for dissimilar products, or trade
structures that exhibit high complementarity. Such indices, although widely used in the goods
context, have not been used often in the context of trade in services primarily due to
shortcomings in the available data.19
The RCA index is a ratio of the share of a product in a country’s export to the share of the
product in world exports. A value of more (less) than unity indicates that a country has a
revealed comparative advantage (disadvantage) in that product. The TCI measures trade
complementarity at the bilateral level in terms of the overall export-import structure of the
trading partners. While the RCA index is a measure of comparative advantage that a
particular country has vis-à-vis the rest of the world, the TCI is a bilateral measure in the
context of bilateral trade. Hence, the TCI may be more appropriate to analyse trade
possibilities between the two countries. However, lack of data on bilateral trade flows in
services explains why this index is not used very often. In the context of the present study
also, data is available on trade carried out by India and Korea with the rest of the world but
not bilaterally, making it possible to compute RCA index but not TCI.
But use of RCA index in case of identifying trade possibilities in services has a limitation.
Being a market share index, RCA can be an indicator of true competitiveness only under
condition of free trade. Since trade in services is governed by a plethora of non-tariff barriers,
this indicator becomes weak. Hence, in the context of the present study, the RCA index will
be applied only to identify potential service sectors with trade possibilities. This will sectors
where one of the two countries has competitiveness and supplemented with a qualitative
survey which would help in identifying trade possibilities and barriers.
There are various ways of constructing the RCA indices but the one most commonly used is
the Balassa index (Balassa 1965, 1977, 1979, 1986). Balassa’s definition of RCA pertains to
the relative trade performance of individual countries in particular commodities (Batra and
Khan, 2005)20
. It is based on the assumption that trade pattern reflects differences in relative
costs and non-price factors at country level, thereby, revealing the comparative advantage of
the trading partners. The factors that contribute to changes in RCA are economic - structural
change, improved world demand and trade specialization.
17
Balassa (1965) 18
Michaely (1994) 19
Taneja, Mukherjee, Jayanetti and Jayawardane (2004) “Indo Sri Lanka Trade in Services: FTAII and
Beyond”, ICRIER Working Paper No. 145 20
“Revealed Comparative Advantage – An Analysis for India and China, Batra A. and Khan Z., ICRIER
Working Paper 168, August 2005
11
Hoekman (1995) uses CA for trade in services and conclude that developed economies are
more specialised in commercial services that are capital intensive while developing countries
are specialised in labour intensive commercial activities. Wickramasinghe (2000) examines
the RCA co-efficient for South Asian countries both at an aggregate and dis-aggregated level
of trade in services. A study by Batra and Khan (2005) highlights that the advantage of using
the revealed comparative advantage index is that it takes into account the inherent advantage
of exporting a particular commodity/service and is consistent with changes in relative factor
endowment and productivity of an economy. The limitation of the index is that it is unable to
differentiate between improvements in factor endowments and implementation of appropriate
trade policies by a country.
Balassa’s (1965) RCA index is calculated as follows:
RCAij = (xij/Xit) / (xwj/Xwt)
Where, xij – Country i’s export of service j, xwj – World exports of service j, Xit – Total
services exports of country i, Xwt – Total services exports of world.
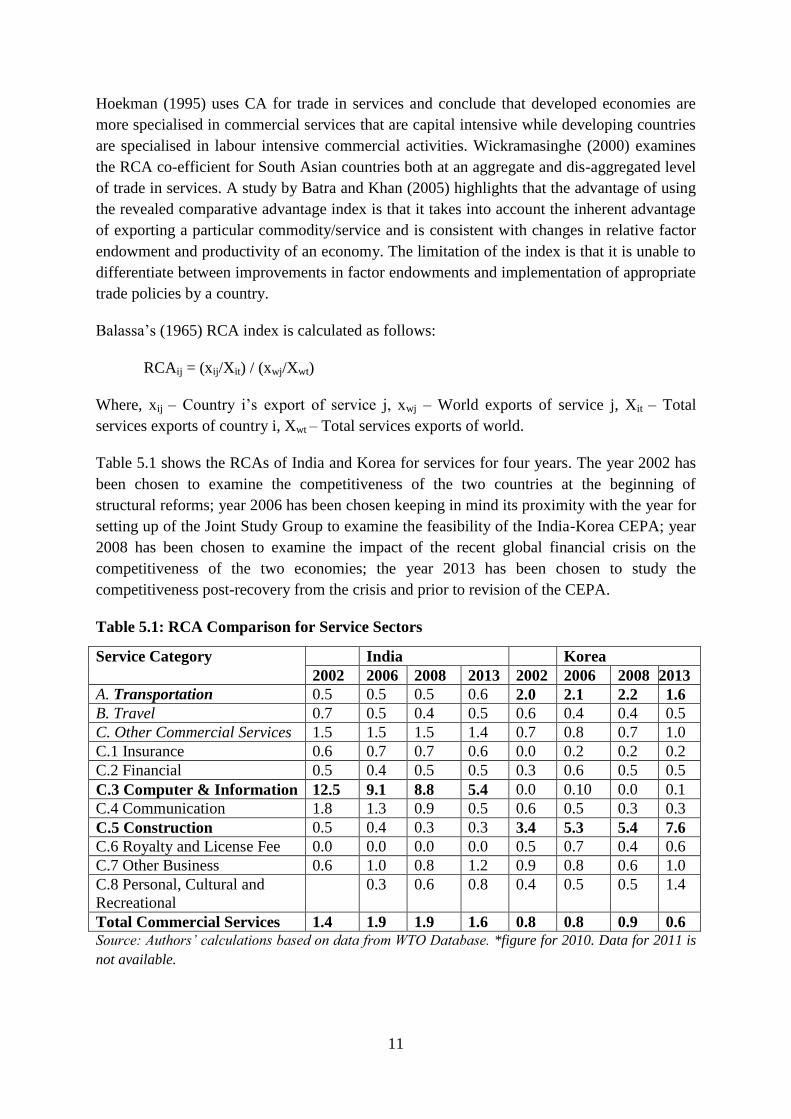
Table 5.1 shows the RCAs of India and Korea for services for four years. The year 2002 has
been chosen to examine the competitiveness of the two countries at the beginning of
structural reforms; year 2006 has been chosen keeping in mind its proximity with the year for
setting up of the Joint Study Group to examine the feasibility of the India-Korea CEPA; year
2008 has been chosen to examine the impact of the recent global financial crisis on the
competitiveness of the two economies; the year 2013 has been chosen to study the
competitiveness post-recovery from the crisis and prior to revision of the CEPA.
Table 5.1: RCA Comparison for Service Sectors
Service Category India Korea
2002 2006 2008 2013 2002 2006 2008 2013
A. Transportation 0.5 0.5 0.5 0.6 2.0 2.1 2.2 1.6
B. Travel 0.7 0.5 0.4 0.5 0.6 0.4 0.4 0.5
C. Other Commercial Services 1.5 1.5 1.5 1.4 0.7 0.8 0.7 1.0
C.1 Insurance 0.6 0.7 0.7 0.6 0.0 0.2 0.2 0.2
C.2 Financial 0.5 0.4 0.5 0.5 0.3 0.6 0.5 0.5
C.3 Computer & Information 12.5 9.1 8.8 5.4 0.0 0.10 0.0 0.1
C.4 Communication 1.8 1.3 0.9 0.5 0.6 0.5 0.3 0.3
C.5 Construction 0.5 0.4 0.3 0.3 3.4 5.3 5.4 7.6
C.6 Royalty and License Fee 0.0 0.0 0.0 0.0 0.5 0.7 0.4 0.6
C.7 Other Business 0.6 1.0 0.8 1.2 0.9 0.8 0.6 1.0
C.8 Personal, Cultural and
Recreational
0.3 0.6 0.8 0.4 0.5 0.5 1.4
Total Commercial Services 1.4 1.9 1.9 1.6 0.8 0.8 0.9 0.6 Source: Authors’ calculations based on data from WTO Database. *figure for 2010. Data for 2011 is
not available.

12
An examination of the computed RCA indices indicates that India has a comparative
advantage (RCA >1) while Korea does not have a comparative advantage (RCA<1) in
commercial services (see Table 5.1). At a disaggregated level, India specialises in computer
and information while Korea specialises in transportation and construction services. This
is in conformity with the export structure of the two countries analysed in the previous
section.
Three sectors have been taken up for an in-depth analysis - computer and information,
construction, and transportation. While computer and information will be examined from
India’s export and Korea’s import point of view, construction and transportation will be
examined from Korea’s export and India’s import point of view. In addition, the audio-visual
sector is also covered, partly because Korea shows a competitive advantage in this sector
during 2011-2013 and partly because it has received a special mention under the CEPA as a
separate chapter under which both countries agree to enter into a co-production agreement for
national treatment and better market access for joint products.
6. Sectoral Trade Possibilities and Regulatory Barriers
This section provides a qualitative examination of the shortlisted four sectors. The analysis
discusses the potential areas of collaboration and engagement between the two countries.
Both the governments should pursue the task of deepening mutual cooperation in areas of
mutual interest and take measures to provide more effective market access by removing
substantial barriers to the bilateral trade in services.
6.1 Computer and Information Services (C&I)
In the last decade, India has emerged as a significant player in the world C&I market on
account of software, information technology (IT) and information technology enabled
services (ITeS).21
This phenomenal growth has come about with the rise of India as a major
outsourcing hub on account of its proficient, english-speaking technically skilled and cost
effective human capital base (Ghibutiu and Dumitriu, 2008). Export of computer and
information services increased from USD 5 billion in 2000 to USD 51 billion in 2013. In
Korea as well, this sector has gained momentum. During the same period, its exports
increased from USD 10 million to close to USUS$1 billion.
In India, the sector has attracted considerable foreign direct investment (FDI) inflows.
Cumulative FDI inflows in computer services (including hardware and software) from April
2000 to February 2012 were US$12.6 billion, which accounted for 7 percent of the total FDI
21
IT services are those services that are directly related to computer software/hardware. For example, providing
custom software will be classified as an IT service.An ITeS service is one that uses
computers/telecommunications systems to provide the service for a non-IT field such as banking, finance, etc.
Some of the examples of ITeS are medical transcription, back-office accounting, insurance claim, credit card
processing. Business process outsourcing (BPO) involves the contracting of the operations and
responsibilities of specific business functions (or processes) to a third-party service provider. It can be back
office outsourcing (such as accounting) or front office outsourcing (customer-related services). BPO services
are often termed as ITeS-BPO services because it indicates the provision of BPO services using IT services.

13
inflows22
. India allowed 100 percent through the automatic route23
in various segments of the
industry in 2008 with the implementation of the Information Technology Act (Amendments)
2008. The FDI statistics24
show that Samsung India Software Operations is one of the Korean
companies, which has invested worth US$8 million in data processing and software
development services. Samsung has set up its R&D centre in India and has employed about
3,000 engineers and experts.25
LG has also gained a presence in electronic services and has
set up an R&D centre in India.
Given the importance of IT/ITeS industry and its growth trends in both India and Korea, there
are numerous possibilities for mutual cooperation. The expansion of the ICT sector in Korea
has led to an increase in demand for English-speaking highly-skilled IT professionals. India,
with a huge English speaking labour force can offer these services.
Over a period, India has moved up the value chain from being mere application development
and maintenance units to becoming strategic partners providing testing, infrastructure, and
consulting and system integration services (Satija and Mukherjee, 2013). At the same time,
Korean software firms are also engaged in providing innovative IT products and solutions
such as gaming and smart-phone applications, defence robotics control platforms and ‘green’
energy software applications. This difference in product segments can be another area of
partnership where companies can set up operations in the partner country for service delivery.
India can provide a platform to Korean firms for catering to third world countries and Korea
can provide a platform to Indian firms to cater to the innovative solution requirements of
Asian, European and American technology companies. In a geographical context, while India
can serve as a regional hub for Korean companies targeting the South Asian market, Korea
can serve as a hub for Indian companies targeting the North and North-Eastern Asian market.
Korean firms can invest in India and set up operations in services like government, banking,
retail, travel, transportation, etc. Satija and Mukherjee (2013) note that with the evolution of
Indian domestic market from captive dominated market structure to third party
transformational outsourcing relationships, there is an increase in domestic demand for
software services. With the India-EU BTIA (Broad based Trade and Investments Agreement)
and India-Taiwan ECA (Economic Cooperation Agreement) negotiations in process, Korea
needs to act fast in its engagements with the Indian IT industry to avoid competitive pressure
and gain a major share of the market.
The government of Korea is also investing into digitizing its services and adopting cloud
computing. For instance, Ministry of Public Administration and Security is investing in cloud
technologies for national computing resources and the Ministry of Knowledge Economy has
22
DIPP Factsheet on Foreign Direct Investment for April 2000 to March 2012 23
FDI is allowed through two routes in India - automatic route under which foreign investors are not required to
take any approvals from the government authority, and the FIPB route, under which the foreign investor is
required to take an approval. 24
‘FDI Synopsis on South Korea’, Department for Industrial Policy and Promotion, Ministry of Commerce,
Government of India 25
‘South Korea looks at Punjab as preferred investment destination’, August 19, 2011, Confederation of
Indian Industry
14
launched a study on how to combine green IT with cloud platforms. Korea has put in place a
successful e-governance project that has enabled it to gain the top position on the E-
Government Development Index26
conducted under the UN Global E-Government Survey
(2010). Its exports of e-government solutions surpassed US$200 million on the basis of its
leading position in the evaluation of e-governments by the UN. On the other hand, though
there is an increase in the use of IT in delivery of Indian government services, the process is
still at a nascent stage of digitization. Indian government departments and agencies have not
yet resorted to usage of advanced technologies like cloud computing, an area where it can
collaborate with Korean companies. As new cloud computing offerings increase the demand
from companies to utilize this technology, the need for fuelling investments in datacenters
will also rise. This can be another opportunity for Indian investors.
There are also complementarities between the Indian software industry and the Korean
hardware and manufacturing industry.27
Korea has a comparative advantage in
microelectronics and semiconductor production. This expertise can be leveraged with Indian
software development with a specific focus on applications like telecom software, broadband
networking solutions, banking and insurance, multimedia and system integration, etc.
Furthermore, Korea can also take advantage of India’s advanced and developed business
process outsourcing (BPO) services. Korean software market is engaged in providing
specialized vertical-specific application packages for industries such as autos,
pharmaceuticals, healthcare, and financial services. Part of this process can be outsourced to
India.
This complimentarity can be synergised by allowing easy cross-border movement of IT/ITeS
professionals. CEPA allows for movement of business visitors as well as intra-corporate
transferees. The positive list of professionals under CEPA for movement of independent
professionals and contractual service suppliers also includes IT consultants, computer system
designers and analysts, database consultants, and many more IT related professions under
which people from both countries can move across borders to render their services.
In the backdrop of these multiple possibilities of trade, the requirement of local presence by
Korea for trade in mode 1 can be a possible barrier. It can hinder business as the financial
cost of enterprises providing only cross-border services will increase if they are mandatorily
required to establish office and hire staff in Korea. Another significant barrier for Indian
software and BPO entities interested in doing business in Korea will be language. Indians
providing these services in Korea will have to learn Korean to converse with the locals.
26
E-Government Development Index, compiled by the United Nations, is a measure of the capacity and
willingness of a country to use e-government for ICT-led development. Along with an assessment of the website
development patterns in a country, the E-Government Development index incorporates the access
characteristics, such as the infrastructure and educational levels, to reflect how a country is using information
technologies to promote access and inclusion of its people. E-Government Development Index is a composite
index comprising the Web measure index, the Telecommunication Infrastructure index and the Human Capital
index. (http://www.un.org/en/development/desa/publications/connecting-governments-to-citizens.html) 27
http://www.kdcstaffs.com/it/main_view.php?mode=view&nNum=5126&parts=Country
15
6.2 Transportation
In this section, transportation and logistics are used interchangeably based on the definition of
‘transportation’ services in the IMF BoP Manual (1993). Transportation forms a part of the
larger logistics sector. The demand for transportation and logistics sector28
services is derived
from its synergy with other economic activities that expand as a country moves up the growth
trajectory. Korea has well developed transportation and logistics infrastructure comparable to
that of many other OECD (Organisation for Economic Co-operation and Development)
countries 29
. Korea was ranked 4th
and 8th
in the WTO list of top fifteen leading exporters and
importers respectively of transportation services in 2012.30
Korea had a high index value of
101.7 in 2012 on the UNCTAD Liner Connectivity Index indicating its excellent connectivity
with the global shipping network and was ranked 23rd
in the World Bank Logistics
Performance Index.
On the other hand, in India, despite inflow of huge investments from both domestic as well as
international sources, demand is still unmatched by an equivalent supply of logistics services.
It ranked 10th
and 4th
in the WTO list of top fifteen leading exporters and importers of
transportation services respectively in 2012.31
It had a low index value of 41.3 in 2012 on the
UNCTAD Liner Connectivity Index32
, and was ranked 47th
by the World Bank Logistic
Performance Index33
(2010), indicating a huge demand-supply gap in logistic services. Indian
logistics costs are among the highest in the world at about 10-20 percent of GDP and 14
percent of the total value of goods. Since India is not a single market, there are several
impediments to intra-state movement of goods. These high costs are attributable to
infrastructure bottlenecks, a multi-layered tax regime, delays in processing documents and
other inefficiencies that are a part of doing business in the economy.34
28
Logistics services include integration of information, transportation, inventory, warehousing, material
handling and packaging. However, the IMF BOP manual (fifth edition) and WTO service sector
classifications list logistics services such as warehousing and cargo handling as auxiliary services under
transportation services. For the purpose of the paper, we have used the larger definition of logistics, which
encompasses transportation and thus, the two terms have been used interchangeably. 29
India is not a member of the OECD countries 30
Table III.4, International Trade Statistics (2013), WTO 31
Table III.4, International Trade Statistics (2013), WTO 32
UNCTAD Liner Shipping Connectivity Index captures how well countries are connected to global shipping
networks. Its computation is based on five components of the maritime transport sector: number of ships,
their container-carrying capacity, maximum vessel size, number of services, and number of companies that
deploy container ships in a country's ports. For each component a country's value is divided by the maximum
value of each component in 2004, the five components are averaged for each country, and the average is
divided by the maximum average for 2004 and multiplied by 100. The index generates a value of 100 for the
country with the highest average index in 2004. 33
World Bank Logistic Performance Index (LPI) is an interactive benchmarking tool created to help countries
identify the challenges and opportunities they face in their performance on trade logistics and what they can
do to improve their performance. It is based on a worldwide survey of operators on the ground (global
freight forwarders and express carriers), providing feedback on the logistics “friendliness” of the countries in
which they operate and those with which they trade. They combine in-depth knowledge of the countries in
which they operate with informed qualitative assessments of other countries with which they trade, and
experience of global logistics environment.
34 “Logistics and Infrastructure – Exploring Opportunities”, Report by Deloitte
16
Given India’s increasing demand for integrated logistics infrastructure and Korea’s expertise
in supplying it, there is a strong possibility of expansion in trade and investment between the
two countries.
India allows 100 percent FDI under the automatic route in services such as ports and harbour
services, storage and warehousing services, and transport and transport services. Currently,
over 70 percent of the world’s top 50 logistics firms have a presence in India and are
providing freight forwarding services, having entered the market through a variety of modes
including acquisitions, JVs, and the establishment of local subsidiaries.35
However, Indian
FDI statistics show that the transportation and logistics sector is not amongst the top five
sectors attracting investments from Korea.36
There are very few Korean logistics and cargo
firms with presence across India providing services such as freight forwarding, customs
clearance, warehousing, domestic airfreight, cargo marking, door-to-door delivery, etc.37
According to a recent survey on the management of domestic logistics businesses in foreign
markets conducted by the Korean Chamber of Commerce and Investment38
, a majority of
firms select and base their businesses in foreign logistics markets based on its growth
potential. Given that India is likely to invest a cumulative amount of US$1 trillion under the
ongoing Twelfth Five Year Plan (2012-17) to develop an organised logistics market and meet
the demand for integrated logistic infrastructure solutions, India can prove to be a strong
potential market for Korean logistics and freight firms.
The significant presence of various other Korean businesses such as Hyundai, Samsung, etc
in Indian destinations, especially Chennai, has also led to an increase in demand for direct
flights between the two countries. Currently, India’s international carriers – Air India and Jet
Airways – have direct flights to Seoul. Air India also signed a Code Sharing Agreement39
with Asiana Airways40
in 2012 which allows both airlines to share flight codes by each other
on the India-South Korea (Seoul) and vice-versa sectors, on a free flow basis41
. This
development is indicative of facilitation of trade relations between India and Korea as it
ensures direct connectivity of different Indian destinations with Seoul.
With CEPA in place, Indian businesses can also take advantage of Korea’s well connected
logistics network. Korea operates as an international logistics hub for north-eastern Asia and
offers frequent sea and air transport services to and from some of the key regions of the world
such as north-eastern China, the western coastal areas of Japan and the far eastern region of
Russia. The world's major marine transportation channels i.e. the European, American,
Southeast Asian, Korea-China, and Korea-Japan routes are directly connected to Korea's
35
“Logistics in India” Part 3, KPMG (2011) 36
The DIPP note FDI Synopsis on South Korea dated February 28, 2011 shows that the top five sectors
attracting FDI from South Korea are metallurgy, automobile, industrial machinery, electronics and electrical
equipment. 3737
The Korea Desk webpage on DIPP 38
http://english.korcham.net/sub02/report_view.asp?nKey=1424&searchfield=&searchtext= 39
Code-share is a business arrangement where two or more airlines share the same flight. A seat can be
purchased on one airline but the flight is actually operated by a cooperating airline under a different flight
number or code. 40
Asiana Airways is a major South Korean airline 41
http://www.airindia.com/SBCMS/Webpages/air_india_and_asiana_airways_April_29_2012.aspx
17
seaports. Its Incheon International Airport42
(handling the world’s 2nd
largest international air
cargo volume) and Busan Port43
(world’s 5th
busiest container port) are amongst the world’s
leading international trade gateways. Indian businesses can use Korea’s airports and seaports
to participate in efficient supply chains that connect a large number of cities within Northeast
Asia.
Korea has an efficient custom clearance system. According to the World Bank's evaluation of
customs-related administrative services for 2009, South Korea was ranked 8th
among 183
countries. India, on the other hand, has a complicated custom clearance system, which raises
the cost of doing business considerably. India can counter this problem by collaborating with
Korea to put in place a custom clearance system similar to Korea’s UNI-PASS which is a
one-stop logistics information and custom clearance system enabling export clearance within
2 minutes, import clearance within 2.5 minutes, custom drawbacks within 5.2 hours and tax
payment within 10 hours.44
Through the pre-declaration system in UNI-PASS, importers can
obtain complete clearance before entry into the port. If India implements a similar system, it
will ease customs procedures, increase the capacity of ports and airports to handle cargo, and
stop evasion of duty considerably, thereby decreasing the loss to the exchequer.
With the implementation of new reform measures such as FDI in multi-brand retail and
implementation of GST, the demand for Third Party Logistics (3PL) is likely to surge. On the
other hand, Korean logistics industry has a fast-growing 3PL logistics sector, which is
engaged in providing 3PL services solutions to businesses all over the world. India can be
another potential market for business gains for such Korean companies. Further, Indian
manufacturers can also outsource their entire reverse logistics flow to Korean firms.
Korea can also gain from India in this sector. By 2020, the Korean government aims to
strengthen the domestic software-oriented logistics system to promote the efficiency of the
national logistics system. This could be another area of collaboration, where Korea can
engage with Indian IT-services firms. Thus, Korean logistics and transportation companies
can outsource their IT-related operations to India while India can allow Korean logistics
companies to set up operations in India to support the growing need for infrastructure, given
greater merchandise and overall economic growth.
Though the Indian logistic industry is in its infancy and there is potential for growth, it has
some regulatory barriers that make it unattractive for investments. Given the high-cost low-
margin nature of the business, the problem for organised players in the industry is
compounded by the existence of unfair competition from unorganised players, who are often
able to provide services at competitive prices by evading paying taxes and flouting the norms
under the Motor Vehicles Act. High cost of operation and delays caused by cumbersome
42
Incheon airport provides an extensive network connecting 172 cities in 53 countries via 67 airlines. 43
Busan Port is the largest trans-shipment port in northeast Asia. Located on the world’s main marine
transportation route, the port handles more than 13 million TEU (Twenty Feet Equivalent Unit which represents
a unit for containers) annually through an active exchange with 500 ports in 100 countries. It handles a massive
volume of trans-shipment to China and Japan. 44
Korea Trade and Investment Promotion Agency

18
documentation requirements of different states makes the business unattractive.45
Poor
physical and inadequate communications infrastructure in the sector also restricts seamless
flow of information.
Rising investments, rapidly evolving regulatory policies, mega infrastructure projects and
many other developments in recent times have driven the Indian logistics market. The
industry is simultaneously overcoming infrastructural constraints and logistic-centric
inefficiency. To attract higher FDI, India will have to combat these barriers through uniform
progress across segments.46
It must work a policy roadmap per mode of transportation that
aims to increase investment and capacity. The processes across various levels of government,
both horizontally and vertically, must be streamlined to reduce compliance burden of
operators. This will reduce stoppages and touch points of cargo movements as well as
increase the speed at which goods are transported within and outside the country. Another
policy initiative can be to set benchmarks and standards for the industry that drives
uniformity of warehouses, storage and transport equipment. Currently, all cargo clearance
activities are undertaken at ports and airports. This imposes a high cost that can be reduced
by decongesting these activities at inland locations. Further, an improved IT platform can
help reduce documentation burden.
6.3 Construction Services
The second largest contributor to GDP after agriculture in India, construction services
accounted for export of USD1.1 billion and import of USD1.3 billion in 2013. The DIPP47
data shows that Indian construction industry is the second largest sector in terms of FDI
inflows with a cumulative inflow of 12 percent during 2000-1248
. A report by EC Harris
Research (2011) estimates that growth rates for the construction industry is likely to exceed
overall GDP growth over the next 2 years, underlying a continued strong demand.
In the global construction market, India is ranked 12th
and accounts for 17.5 percent of the
$3.4 trillion global market. According to a global economic survey, India is ranked the sixth –
fastest growing country in terms of construction (Ministry of commerce, Government of
India).49
Construction overseas particularly occupied an important position in India’s export
portfolio after the early seventies with the spurt in construction activity in oil-exporting
region of Middle East. The thrust of India's project export bids has exhibited a significant
shift towards cash-terms projects, and Multilaterally Funded Project Overseas (MFPO).50
There is a growing emphasis amongst Indian construction companies on competitive pricing
and aggressive strategic marketing for securing contracts. Contracts secured in the recent
45
Subrata Mishra “Logistics Industry: Global and Indian Perspectives”, European Business and Technology
Centre 46
KPMG Report “Logistics Game-Changers – Transforming India’s logistics industry” 47
DIPP uses NIC definition which means that construction sector includes goods and services pertaining to the
real estate sector. 48
Department of Industrial Policy and Promotion (DIPP) FDI Factsheet from April 2000 to December 2012
available at http://dipp.nic.in/English/Publications/FDI_Statistics/2012/india_FDI_December2012.pdf. The
data uses DIPP FDI data base and considers equity capital components only. 49
http://commerce.nic.in/annual2004-05/englishhtml/lesson-11.htm accessed on October 13, 2013. 50
Ministry of Commerce
19
years have been quite diverse in nature, indicating the growing versatility and technological
capabilities of Indian project exporters. Regions that continue to be potential markets for
Indian construction sector include Asia (South, West and East), Africa, Middle East, Russia,
CIS (Commonwealth of Independent States), and Latin American countries.
For Korea as well, this sector holds a vital position. Korean overseas construction industry
has grown rapidly in the last four decades and particularly in the last five years. With the
second largest exporter of construction services, Korea’s exports amounted to around USD2
billion with a share of 17 percent in commercial service export in 2013. This surge in exports
can be attributed to increase in overseas construction. By region, Middle East accounts for the
largest share of 60 percent followed by the Asia with a share of 30 percent in Korean
construction exports. By construction type, plant construction orders account for the largest
share of 54 percent of cumulative overseas orders.
However, growth in this sector has been volatile and has seen a slump in the recent years in
both countries due to a rise in material costs, higher interests outgo and declining profit
margins.51
But given the infrastructure and real estate needs, trade in this sector has soared as
government and private sector companies collaborate through the Public-Private Partnership
(PPP) models to bridge the gap.
Though a bulk of trade in this sector continues to take place under mode 3 and mode 4 given
the capital intensiveness and specialised skill requirement of the industry, advancement in
technology and communication has also made trade under mode 1 possible.
A look at India’s inward FDI data shows that construction is not amongst the leading sectors
attracting FDI from Korea. Investments by Korean firms in construction activities in India are
limited when compared to investment in other industries (such as automobile, metallurgical
industry, electronics, etc). As India prepares to bridge the demand and supply gap in
infrastructure by investing a cumulative amount of USD1 trillion under the ongoing twelfth
five year plan (2012-17), it puts forth opportunities for Korean firms to make investments and
collaborate with Indian construction firms.
After the Indian construction industry received ‘industry’ status in 2000, a number of
initiatives in infrastructure related projects on PPP basis were undertaken. This resulted in
expansion of private ownership of build-operate-transfer (BOT), build-operate-own-transfer
(BOOT), and build-operate-lease-transfer (BOLT) projects. Indian private construction
majors engage with foreign construction and real estate companies for project financing,
technical assistance and management support. Korea, with its experience in overseas
construction projects, can play an active role by participating in these projects. The potential
of this collaboration is particularly large in urban infrastructure, mass rapid transport system
(MRTS) and water management. Moreover, FDI up to 100 percent is allowed under the
automatic route for townships, housing, built-up infrastructure and construction of
51
Economic Survey of India, 2011-12

20
development projects. Many Indian states such as Haryana and Gujarat are also taking
significant steps towards industrial development.
Not only the large Korean firms but even small and medium Korean construction firms are
engaged in overseas construction activity. The Korean government has provided initiatives to
ease financing of projects and entry of SMEs into foreign construction markets. With the
government aiming to make Korea one of the five powerhouses in overseas construction
industry by 2014, the Ministry of Land, Transport and Maritime Affairs (MLTM) is likely to
reinforce its support and policies.52
It is planning to expand the number of professional
workers it fosters and allocate 150 billion Won for the water industry to support companies
advancing into developing countries, continued from the formation of a global infrastructure
fund of 400 billion Won in 2010. MLTM has also listed India on its priority list of core
partners for the upcoming financial year where it will focus on providing financial and
diplomatic assistance to companies bidding for overseas projects in these countries (Jessica
Seoyoung Choi for Korea.net, 2012). This effort will strategically push forward Korea’s
plans to boost overseas construction projects in India.
International trade in construction is subject to a plethora of regulatory barriers and
institutional constraints which are applied not only at the national but also at regional and
local levels (Mukherjee, 2001). World Bank’s Doing Business Report 2012 shows that while
India is among the top countries in terms of housing and work space needs, it is ranked 181st
in construction permission processes. There are 34 procedures and average time taken is 227
days. Therefore, in order to make most of its prospective collaboration with Korea in
construction sector, India will have to ease some of its regulatory and infrastructure barriers.
For instance, one major barrier pertains to land acquisition that require approvals from
multiple agencies (such as central and state government ministries), high stamp duty and
cumbersome paper procedures. While India has eased some of the barriers related to land
acquisition through Land Acquisition Bill (2013), the cumbersome procedures that
construction companies will have to undergo to acquire land from farmers can pose a
problem and make investments unattractive in the sector. Another example can be sited of
India’s lagging environmental clearances, which have put many critical investments (such as
by Korea’s steel giant Posco) on the backburner.
In order to be a favourite investment destination, India will have to make amends to its policy
and regulatory mechanisms. Infrastructure and contraction projects are highly costly with a
long gestation period. The companies investing are highly leveraged. A delay of a week in
these clearances can substantially burden their book-of-accounts. A possible solution can be
of using a single-shop model for all governmental clearances. This model is already in
practice in Gujarat and is highly successful. A similar model at the central level can prove to
be highly beneficial for businesses as well the government.
52
“Korea’s overseas construction orders exceed US$ 500 billion”, Jessica Seoyoung Choi, published on July 10,
2012 in Korea.net (http://www.korea.net/NewsFocus/Business/view?articleId=101184)
21
Despite existence of these challenges, India can still be a huge investment opportunity to
Korean construction firms to set up projects and engage in collaborations for infrastructure
development. Both countries signed a Civil Cooperation Agreement on July 26, 2011 after
which Korea has already asked India to allot land for its nuclear industry to build power
plants in which it specializes.53
Korean firms have also shown interest in building the Dighi
port and in the Delhi-Mumbai Industrial Corridor (DMIC).
6.4 Audio-Visual Services
Audio-visual services include services and fees related to the production of motion pictures,
radio and television programmes, and musical recordings. The IMF BoP Manual (1993)
categorises audio-visual services under personal, cultural and recreational services but the
WTO Services Sectoral Classification List (MTN.GNS/W/120) is based on UNCPC (United
Nations Provisional Central Product Classifications). This WTO classification, which is used
for making commitments, lists audio-visual services as a sub-sector of communication
services. Since this paper uses IMF BoP classification to compute the RCA index, we assume
that audio-visual service is a sub-category of personal, cultural and recreational services.
Neither India nor Korea has a comparative advantage in personal, cultural and recreational
services. In spite of this why this paper picks this sector for an analysis is that both countries
agree to sign a co-production agreement under the CEPA. According to the agreement, India
and Korea will collaborate to produce films and audio, animation, TV programmes, etc to
strengthen cultural ties. The co-production agreement accords national treatment with
concomitant of national benefits (including government support) to products of the partner
country. The agreement enables not just easy access to finance but also ensures transfer of
technology, investment in infrastructure and increased market access.
The industry is expanding and engaging in providing a variety of services to international
production studios. Even during the times of financial crisis, the Indian media and
entertainment (M&E) industry managed to grow at a rate of 11 percent from US$12.9 billion
in 2009 to US$14.4 billion in 2010.54
Factors such as high demand for India-specific
products, both domestically and from non-resident Indians (NRIs), and other South Asian
markets, increase in export of television content and films and availability of high-skilled
labour at competitive prices have contributed to the growth of the sector. For Korea, the
sector gained significance with the beginning of its flagship “Korean Wave”, an initiative to
promote Korean culture across Asia by way of export. The country was the 5th
largest
exporter and 10th
largest importer of audio-visual services in 2012.55
Its export of audio-
visual and related services increased from US$13 million in 2000 to US$359 million in 2012.
Imports during the same period increased from US$79 million to US$357 million. The
country has the fifth largest film industry and is a pioneer of TV via mobile devices and the
internet.
53
“India seeks S Korean funding for clean energy, infrastructure”, Elizabeth Roche published in Live Mint on
March 26, 2012 54
http://www.indiainbusiness.nic.in/industry-infrastructure/service-sectors/media-entertainment.htm 55
Table III.40, WTO (2013)
22
In India, the entertainment sector has been free from any significant regulations for a very
long time. This has helped the sector grow mainly through investments by private
entrepreneurs with minimum efforts from the government. On the contrary, dictatorship-era
regulations have dominated the Korean media industry with the government practicing strict
protectionist policies. Recently in 2011 President Lee Myung-bak took significant steps in
spite of resistance from regulators, unions and other political parties to loosen the grip and
allow five privately owned television stations to go on air. The new stations are free of some
government restrictions to which the older ones adhere.56
Mukherjee, et. al. (2007) point out that other than providing access to subsidised finance, a
co-production treaty signed with one country permits both parties to avail advantage of the
co-production treaties with other countries that the respective country may have. India
presently has a co-production agreement with France, Brazil, Germany, New Zealand, Italy,
UK, Poland and Spain. Korea has a co-production agreement with New Zealand, EU and
France, under which it grants benefits such as screen quota and selective financial support for
production and distribution to co-produced products. While Korea can avail of the benefits of
other co-production agreements signed by India, India already has a co-production treaty with
all of Korea’s co-production treaty partners. Moreover, India was one of the few countries to
undertake MFN exemption under GATS that allows it to offer preferential treatment to
motion pictures and television programmes from countries with which it has a co-production
agreement.57
This move was driven by the objective to promote cultural exchange and was
applicable for an unspecified period of time.
Sub-sectors such as animation, films and television are likely to benefit the most from this
collaboration. Korea has a vast (valued at US$0.9 billion in 2008 with more than US$80
million worth of exports) and technological advanced animation industry producing original
cartoons and animations. The Indian animation industry, though close to Korean industry in
terms of market size (valued at US$0.5 billion in 2009), is primarily engaged in catering to
the demands of domestic end user segments (such as feature films, television programmes,
advertisements and commercials, and computer games), and processing outsourced work of
various international studios(especially from US) and gaming companies. A co-production
agreement between the two countries will enable Indian and Korean companies to collaborate
and engage in all activities from pre-production to post-production. While Korean animators
can work on innovation and content, Indian animators can provide production and post-
production services. This collaboration will not only lead to production of more culture-
oriented and varied animations but also provide Indian companies with human and financial
capital to venture into high-quality animations such as 3D, 4D and other new animation types
for the new age.
The film industry in India (2nd
largest in the world) and Korea (5th
largest in the world) is
well developed across the value chain, from development to exhibition. While domestic films
56
“South Korea Loosens Grip on Media Industry”, published in the Wall Street Journal dated December 1, 2011
available at http://online.wsj.com/news/articles/SB10001424052970204397704577071810413535758 57
Mukherjee, Gupta, Ahuja (2007) ‘India-US FTA: Prospects for Audiovisual Services”
23
have been a prime source of entertainment in both countries, the emergence of multiplexes
has increased the demand for foreign cinema including films, documentaries and short
movies. The India-Korea co-production agreement entitles co-produced products to avail the
benefits provided to local firms such as financing and screen space in movie theatres in
accordance with the screen quota. Korea has given similar benefits under its co-production
agreements with New Zealand and France. The Korean government has recently launched a
supporting programme and incentives for filming in Korea or foreign films which plan to
shoot in Korea. This will benefit the Indian company participating in co-production
agreement58
who can partner with Korean companies to select, get permissions and shoot in
Korean locations.
There has been a rapid development of television industry sector in both countries with the
change in regulatory regime and adoption of liberal policies. With the co-production
agreement in place, broadcasters from India and Korea can showcase programmes in each
other’s language to promote cultural ties. As India is becoming a content exporter, many
Indian broadcasters are now catering to the requirements of local audiences around the world.
By producing programmes for the local Korean audience, Indian enterprises can utilise the
development fund and improve advanced production facilities. The Indian advertising
industry can also enter Korea as regulations in advertising have been eased. Korea can
continue to provide India with technical consulting services to encourage import of Korean
technologies and services. Further, Indian agencies and authorities can learn from Korean
broadcasting and communications policies that have made Korea a broadcasting and
communications powerhouse. Korea has bigger industries than any other nation in the
communications technology segment like digital multimedia broadcasting, digital TV, etc.
To enhance co-operation in this sector, the Federation of Indian Chambers of Commerce and
Industry (FICCI) and Korea Creative Content Agency (KCCA)59
jointly signed a
Memorandum of Understanding (MoU) in 2011. The agreement specified that the two
countries would co-operate on overseas marketing of Indian and Korean content in each
country and exchange information, statistical data and expertise about the Indian and Korean
content market. Further, the two would collaborate in educating and training professionals of
content industry and organise events such as seminars, conferences, stakeholder
consultations, etc. This MoU is valid for five years and at the end of the period, the
organisations will discuss and extend it further if required.
58
Recently, Indian film distribution house Eros International Plc. signed a multi-film agreement with Korea’s
second largest mobile carrier KT Corp. to showcase 50 of its film titles on multiple digital platforms. Under
the arrangement, KT Corp through its Olleh TV will showcase 50 films from Eros’s library on a revenue
sharing basis. With a strong slate of film titles under its banner, Eros recently listed its unit Eros
International Media Ltd on the BSE. 59
KOCCA under the Ministry of Culture, Sports and Tourism, Government of Korea is an agency dedicated to
promoting all areas of media and entertainment including broadcasting, film, gaming and animation. It is
responsible for providing a comprehensive support system to nurture the industry along with conducting
various support businesses to help M&E corporations and aims to make Korea one of the top 5 content
powerhouses in the world.
24
But for constructive trade to take place in this sector Korea will have to contemplate
mitigating entry barriers and regulations In spite of efforts by the incumbent government to
loosen the grip, there still remain certain elements that are restrictive to trade in the sector.
For instance, to promote the Korean animation industry, the Korean government has put in
place a broadcasting quota (under the Korean Broadcasting Act) for domestic animation to
provide the industry with opportunities to promote domestic animation through the TV
network. Foreign animation is restricted to only 55 percent and 65 percent of all animation
content for terrestrial and cable and satellite broadcasts respectively. This is an area of
contention that has not been discussed in the MoU signed between FICCI and KCCA in
2011. The quota can prove to be a hindrance for an Indian company that wishes to broadcast
its product in Korea.
Further, India and Korea must make sincere efforts towards promoting the country’s heritage
in partner’s land as a tourist destination. A plethora of Indian movies are shot in foreign
locations. To keep up with the Indian viewer’s global awareness, the industry is shifting from
clichéd European destinations to explore newer lands. Korea can be an attractive option here.
It can draw lessons from Australia Tourism’s strategy that has drawn many Indians to the
land and gained popularity.
7. Way Forward and Conclusion
With opening of the global economy and advancement in information technology, the
significance of service sector has increased in almost all economies, including India and
Korea. This has resulted in the inclusion of this sector in many recent trade liberalisation
agreements including India-Korea CEPA. In services, both India and Korea have undertaken
liberalising commitments in 11 service sectors along with additional commitments in audio-
visual, financial and telecommunication services as well as in movement of natural persons.
An analysis of the services sector in the above sections shows that there are strong
complementarities in services sectors such as IT, transportation, construction and audiovisual
services which can be accentuated by further liberalising trade and movement of natural
persons.
Often, the commitments made under these comprehensive trade agreements (CEPA, CECA,
FTA and PTA) are more liberal than those made under GATS or the Doha Round. Under the
India-Korea CEPA, bilateral commitments have gone beyond the revised offers in the Doha
Round with both countries offering more liberal commitments. However, both countries have
also imposed some restrictions which hinder trade. Korea has imposed a restriction of local
presence in Mode 1 in a number of sub-sectors. India, while being more liberal in its bilateral
commitments under CEPA than multilateral commitments under revised offer, has put some
restrictions on foreign participation (mode 3). These areas of contention must be addressed in
the near future to allow free trade.
Nevertheless, India-Korea CEPA provides numerous trade possibilities through which both
countries are largely benefiting and can do so more by addressing market barriers. The paper
discusses existing trade, future trade complementarities and market access barriers in four
25
sectors of mutual interest – information technology, transportation, construction and audio-
visual services. India has a competitive advantage in information technology and can provide
sophisticated testing, consulting and system solutions to Korean clients. Korea is one of the
leading exporters of transportation services with a highly advanced logistics network. India,
with a huge demand-supply gap, can synergize with Korean logistic service providers to meet
its shortfall. India can also prove to be a huge investment opportunity for Korean construction
firms who have garnered rich experience in overseas construction services. With the CEPA in
place, the two countries can develop inter-industry linkages to collaborate rather than
compete in the future. For instance, Korean logistics and transportation companies can
outsource their IT-related operations to India while India can allow these companies to set up
operations in its territory to meet the growing need for infrastructure. Both countries can also
promote their culture and heritage through audio-visual services.
Governments, agencies and consulates are taking a number of steps to take advantage of the
CEPA and boost trade. To ease movement of people, both countries signed an agreement on
visa simplification in March 2012 in the presence of Indian PM and Korean President. Korea
has also established business centres of Korea Trade and Investment Agency (KOTRA) in
New Delhi, Mumbai and Chennai to render support existing and prospective Korean
businesses with operations in India. A number of MoUs and agreements have been signed
since 2009 to improve relations in different aspects including strategic partnership. An MoU
was signed between Defence Research and Development Organisation (DRDO) of India and
Defence Acquisition Programme Administration (DAPA) of Korea to for cooperation in
R&D. To create Indian culture awareness amongst Koreans, an Indian Cultural Centre (ICC)
was also established in 2011. ICC holds special programmes, yoga classes, cookery lessons
and traditional dance training in Korea, catering to popular demand among people.
To realise all trade possibilities, both countries will have to address some urgent issues
restricting trade. They must work together on expanding the positive list of professionals to
include more professions that allows greater movement of people. Presently, Indian
community in Korea is estimated at only 7500 which include businessmen, IT professionals,
scientists, research fellows, students and workers (Ministry of External Affairs, Government
of India)60
. This is much smaller when compared to other countries such as USA, UK,
Australia and Canada where Indians are present in large numbers.
Another possible barrier in services trade, especially mode 1, is language. Indians are well
versed in English but will have to learn Korean to render services to and in Korea. Similarly,
Koreans will have to learn English to do business in India. This barrier will hold for all
services requiring communication directly between parties of two countries.
The two countries are contemplating upgrading the CEPA as well as India-Korea Double
Taxation Avoidance agreement to meet each other’s needs for increasing trade and
investments. By pursuing the task of deepening mutual cooperation in areas of mutual interest
60
http://www.mea.gov.in/Portal/ForeignRelation/India-Korea_ROK__Relations.pdf accessed on October 21,
2013

26
and taking measures to provide more effective market access by removing substantial barriers
to bilateral trade in services, both countries can benefit by gaining a competitive advantage in
the global supply chain. The India-Korea CEPA can go a long way in increasing bilateral
flow of services between the two countries.
27
References
Balassa, B. (1965) ‘Trade Liberalisation and Revealed Comparative Advantage’, The
Manchester School of Economic and Social Studies, Vol. 33, 99-123
Bank of Korea, March 2012, ‘Current Economic and Financial Movements’, Quarterly
Bulletin, Chapter 1
Batra, A. and Khan, Z. (2005) ‘Revealed Comparative Advantage – An analysis for India
and China’, ICRIER Working Paper 168
Chanda, R. (2002) ‘Globalisation of Services – India’s Opportunities & Constraints’, Oxford
University Press
Chandra, P. and Jain, N. (2007) ‘The Logistics Sector in India: Overview and Challenges’,
Indian Institute of Management, Working Paper No. 2007-03-07
Choi J., ‘Korea’s overseas construction orders exceed US$500 billion’, published on July 10,
2012in Korea.net
CMM-I Report, ‘Trade in Audio Visuals Market: China, Mongolia and South Korea’,
UNESCO
Confederation of Indian Industry (2011) ‘South Korea looks at Punjab as preferred
investment destination’
Crawford, J. and Fiorentino, R. (2005) ‘The Changing Landscape of Regional Trade
Agreements’. World Trade Organisation, Discussion Paper No. 8
Deloitte ‘Logistics and Infrastructure – Exploring Opportunities’ last accessed on January 13,
2012 available at
http://www.deloitte.com/assets/Dcom
India/Local%20Assets/Documents/aLogistics%20and%20infrastructure%206%20Au
g.pdf
Department of Industrial Policy and Promotion (DIPP), ‘FDI Synopsis of South Korea’,
Ministry of Commerce, Government of India available at
http://dipp.gov.in/English/Investor/Korea_Desk/FDI_Synopsis_KoreaSouth_31Augus
t2012.pdf
Department of Industrial Policy and Promotion (DIPP) Factsheet on Foreign Direct
Investment (FDI) (April 2000 to March 2012), Department of Industrial Policy and
Promotion, Ministry of Commerce, Government of India, 2012, last accessed on
December 1, 2012 available at
http://dipp.nic.in/English/Publications/FDI_Statistics/2012/india_FDI_March2012.pdf
Department of Information Technology (2011) ‘Annual Report 2010-11’, Ministry of
Communication and Information Technology, Government of India

28
Dewan P.N. Chopra Consultants Private Limited ‘The Indian Logistics Industry: An
Overview’ available at http://www.dpncindia.com/news/Logistics.pdf
FICCI-KPMG Report (2011) ‘India Media & Entertainment Industry to touch US$ 28
billion by 2015’ available at
http://www.kpmg.com/IN/en/Press%20Release/FICCI_KPMG_M_E.pdf
Findlay, C. and Warren, T. (2000) ‘Impediments to Trade in Services: Measurement and
Policy Implications’, Routledge, London and New York
Fink, C. and Molinuevo, M. (2007) ‘East Asian Free Trade Agreements in Services:
Roaring Tigers or Timid Pandas?’, East Asia and Pacific Region Poverty Reduction
and Economic Management, World Bank
Fitch Ratings (2012) ‘2012 Outlook: Indian Logistics Industry’
Ghibutiu A. and Dumitriu I. (2008) ‘The Effects of Offshoring on Trade in Services -
Evidence from Romania’, Working Paper, European Trade Study Group available at
http://www.etsg.org/ETSG2007/papers/dumitriu.pdf.
Hoekman, B. (1995), “An Assessment of the General Agreement on Trade in Services”, in
Will Martin and L. Alan Winters (eds), The Uruguay Round and the Developing
Economies, The World Bank, Cambridge University Press, Cambridge, UK
Hoekman B., Mattoo A. and English P. (2002) ‘Development, Trade and the WTO – A
Handbook’, World Bank
Hufbauer, G. and Warren, T. (1999) ‘The Globalisation of Services: What has happened?
What are the implications?’, Peterson Institute for International Economics, Working
Paper available at http://www.piie.com/publications/wp/99-12.pdf
Hulme-Jones, L. (2011) ‘South Korea-Telecoms, Mobile, Broadband and Forecasts’, Paul
Budde Communication Pty Ltd., 17th Edition
Investment Technology Promotion Division (2007) ‘Dynamic Business Partner: Investor
Friendly Destination - Media and Entertainment Industry’, Ministry of External
Affairs, Government of India available at http://www.indiainbusiness.nic.in/Book.pdf
International Monetary Fund (1993) ‘Balance of Payment Manual’ last accessed on
October 15, 2012 available at
http://www.imf.org/external/pubs/ft/bopman/bopman.pdf
Interview of Ambassador. Nagesh R. Parthasarathi (2008) ‘Ambassador Explains India’s
IT Policy’, Country Report, Korea IT Times
Invest Korea (2009) ‘Promising Investment Opportunities – Logistics’
29
Kathuria, R. (2008) ‘Prospects for the Telecommunication Sector under the India-EU Trade
and Investment Agreement’, Final Report, Indian Council for Research in
International Economic Relations (ICRIER)
Kathuria, R. and Kedia, M. (2012) ‘India: Evolution of Telecommunications and
Information Technology since Independence’, Yojna, Publication of Ministry of
Information and Broadcasting, Vol. 56
Kim, H. (2001) ‘The audiovisual sector in another part of the world’, Audiovisual Industry
Seminar, WTO
Kim, J. and Kim, J. (2003) ‘Liberalisation of Trade in Services and Productivity Growth in
Korea’, Conference Volume-NBER, University of Chicago Press, Chapter 6, 179-207
Korea Chamber of Commerce and Industry (2012) ‘Survey on Management of Domestic
Logistics Businesses in Foreign markets’
Korea Communication Commission, Annual Report, 2008 and 2010
Korea Communication Commission, “KCC Plan for 2011”
KPMG (2011) ‘Logistics in India’, Part 1, 2 and 3 available at
http://storenmove.com/links/news/Logistics-in-India-Part-1.pdf
http://www.kpmg.com/Global/en/IssuesAndInsights/ArticlesPublications/Documents/
Logistics-in-India-Part-2.pdf
http://www.kpmg.com/Global/en/IssuesAndInsights/ArticlesPublications/Documents/
Logistics-in-India-Part-3.pdf
Kwak, K. (2009) ‘Broadcasting Deregulation in Korea’, Academia Paper Series available
http://keia.org/publication/broadcasting-deregulation-south-korea
Lee, N. and Lie, H. (2003) ‘Korea’s Telecom Services Reform through Trade Negotiations’,
Conference Volume – NBER, University of Chicago Press, 243-281 available at
http://www.nber.org/chapters/c10161.pdf
Macdonald, S. (2006) ‘South Korea Braves the Knowledge Economy’, Korea Investment
Forum available at http://www.atimes.com/atimes/Korea/HF28Dg03.html
Michaely, M. (1994) ‘Trade Preferential Agreements in Latin America: Ex-ante Assessment’
Washington, D.C.: The World Bank Latin America and Caribbean Region available at
http://www-
wds.worldbank.org/servlet/WDSContentServer/WDSP/IB/1996/03/01/000009265_39
61019193227/Rendered/PDF/multi0page.pdf
Ministry of Commerce, Industry and Energy (MOCIE), Korea Trade Investment
Promotion Agency (KOTRA) and Deloitte & Touche Corporate Finance, ‘A Guide to
Investment in Korea’
30
Ministry of Foreign Affairs and Trade, Republic of Korea
Mukherjee, A. (2001) ‘Trade in Construction and Consultancy Services: India and the
GATS’, ICRIER Working Paper No. 75
Mukherjee, A. (2003) ‘Audio-visual policies and international trade: the case of India’,
HWWA-Report, Hamburg Institute of International Economics available at
http://ec.europa.eu/culture/media/media-content/media-mundus/india_2003_en.pdf
Mukherjee, A., Gupta, A. and Ahuja P. (2007) ‘India-U.S. FTA: Prospects for Audiovisual
Services’, Working Paper No. 192, ICRIER
Mukherjee, A., Ray S. and Rai, D. (2010) ‘Trade in Services’, India-Turkey FTA Report,
ICRIER
Mukherjee, A., and Miglani, S. (2010) ‘Non-tariff barriers in the transport and logistics
sectors: India’, Research Report – European Business and Technology Centre
Mukhopadhyay S. (2002) ‘Globalisation and Indian Services Sector’, Economic and
Political Weekly, 4097-4098
Mishra S. “Logistics Industry: Global and Indian Perspective”, European Business and
Technology Centre
NASSCOM (2012a), ‘The IT-BPO Sector in India’, Strategic Review 2012, India
NASSCOM Strategic Review 2010
NASSCOM ‘Indian Animation Market’, Fact Sheet
National Information Society Agency, ‘Global IT Initiatives of Korea’, Republic of Korea
National Information Society Agency – Korea 2010, ‘Yearbook of Information Society
Statistics’, Republic of Korea
National Information Technology Promotions Agency ‘IT Industry Annual Report - 2010’
http://www.nipa.kr/eng/boardView.it?boardNo=110&contentNo=1&page=2 last
accessed on November 4, 2012
Organisation for Economic Cooperation and Development (2000) ‘Regulatory Reform in
Korea’ available at http://www.oecd.org/gov/regulatory-
policy/oecdreviewofregulatoryreformkorea.htm
Park, K. and Kim, Y. (2011) ‘Korea’s International Comparative Legal Guide to:
Telecommunication Laws and Regulations 2011’, Global Legal Group, Chapter 16,
109-115
Price Waterhouse Coopers (2010) ‘India Entertainment and Media Outlook 2010’ available
at http://www.pwc.com/gx/en/entertainment-
media/pdf/PwC_India_EM_Outlook_2010.pdf
31
Raipuria, K. (2001) ‘Service Exports: ‘Knowledge Bowl’ yet to yield major gains’,
Economic and Political Weekly, 3351-3352
Rausas, M., Manyika, J., Hazan, E., Bughin, J., Chui, M. and Sai, R. (2011) ‘Internet
Matters: The Net’s sweeping impact on growth, jobs, and prosperity’, McKinsey
Global Institute
Rim, K. (2011) ‘30 Korean Software Worthy of Global Recognition in 2012’, Korea IT
Times available at http://www.koreaittimes.com/story/15607/30-korean-software-
worthy-global-recognition-2012
Roche, E. ‘India seeks S Korean funding for clean energy, infrastructure’, Live Mint
published on March 26, 2012
Satija D. and Mukherjee A. (2013) ‘Movement of IT Professionals between India and the
EU: Issues and the Way Forward’, Working Paper No. 391, Indian Institute of
Management Bangalore
Sinha, A. (2011) ‘Banking on Technology’, Reserve Bank of India Bulletin, Volume LXV,
Number 6
Sungeun, S. (2008) ‘Behind the Korean Broadcasting Boom’, NHK Broadcasting Studies,
Number 6
Taneja, N., Mukherjee, A., Jayanetti, S. and Jayawardane, T. (2004) ‘India-Sri Lanka
Trade in Services: FTA II and Beyond’, ICRIER Working Paper No. 145
Telecom Regulatory Authority of India (TRAI) 2009-10, Annual Report
Thomas, P. (2003) ‘GATS and Trade in Audio-Visuals: Culture, Politics and Empire’,
Economic and Political Weekly, 3485-3493
Trade Policy Report (August 10, 2011), submitted to WTO by Secretariat of India
Trade Policy Review (August 10, 2011) submitted to WTO by Secretariat of India
(WT/TPR/S/249)
UNESCAP ‘National Policies and Strategies for Infrastructure Development’, Chapter III,
Country Infrastructure Reports
United States Trade Representative Report, South Korea
Vaidyanathan, G (February 2007) ‘Current Status of Logistics in India’, PIANC Magazine
Veluree, M ‘Key success factors of Korean TV industry structure that leads to the popularity
if Korean TV dramas in a global market’, Journal of East Asian studies available at
http://www.asia.tu.ac.th/journal/EA_Journal2_50/B5.pdf
Wickramsinghe, U. (2000), “Services Trade as a New Frontier in South Asia: Is Optimism
Warranted”? South Asia Economic Journal, Sage Publications, New Delhi
32
World Bank (2002). ‘Global Economic Prospects 2002: Making Trade Work for the World’s
Poor’, Washington, DC: The World Bank available at
http://econ.worldbank.org/external/default/main?pagePK=64165259&piPK=6416542
1&theSitePK=469382&menuPK=64216926&entityID=000094946_0202020411334
World Trade Organisation (2010) ‘Measuring Trade in Services’, Training Manual
produced by WTO/OMC
World Trade Organisation (2011) World Trade Report 2011
Website Links
Korea Software Industry Association (http://www.sw.or.kr/) last accessed on
February 2, 2013
Electronics and Telecommunications Research Institute, Korea
http://www.etri.re.kr/eng/ last accessed on November 14, 2012
http://dipp.gov.in/English/Investor/Korea_Desk/Resource.aspx last accessed on June
5, 2013
http://www.kotra.in/index.jsp
http://www.indembassy.or.kr/BilateralTrade.aspx?Cul=en-US last accessed on
October 20, 2012
http://www.mofat.go.kr/english/regions/intorganization/wto/index.jsp last accessed on
September 2, 2012
http://www.ficci.com/PressRelease/755/press-21mar-entertainment.pdf last accessed
on December 17, 2012
http://www.bok.or.kr/contents/total/eng/boardView.action?boardBean.brdid=10782&
boardBean.rnum=1&menuNaviId=744&boardBean.menuid=744&boardBean.cPage=
1&boardBean.categorycd=0&boardBean.sdt=&boardBean.edt=&boardBean.searchC
olumn=&boardBean.searchValue=

33
APPENDIX
Appendix 1A: Comparison of Doha Round Revised Offer and CEPA: India and Korea
Categories of services India Korea
MA NT MA NT
1. BUSINESS SERVICES
A. Professional Services a. Legal Services x x = = b. Accounting, auditing and book-keeping services = = = = c. Taxation Services x x = = d. Architectural services = = - = e. Engineering services + = - = f. Integrated engineering services + = - = g. Urban planning and landscape architectural
services + = - =
h. Medical and dental services + = - = i. Veterinary services + = - = j. Services provided by midwives, nurses,
physiotherapists and para-medical personnel + = x x
B. Computer and Related Services a. Consultancy services related to the installation of
computer hardware + = = =
b. Software implementation services + = = = c. Data processing services + = = = d. Database services + = = = e. Other + = = =
C. Research and Development Services a. R&D services on natural sciences + + = = b. R&D services on social sciences and humanities = = = = c. Interdisciplinary R&D services x x = =
D. Real Estate Services a. Brokerage Services x x × × b. Appraisal Services + = - =
E. Rental/Leasing Services without Operators a. Relating to ships + = = = b. Relating to aircraft + = = = c. Relating to other transport equipment + = - = d. Relating to other machinery and equipment = = - = e. Other + = = =
F. Other Business Services a. Advertising services * * - = b. Market research and public opinion polling services x x = = c. Management consulting service + = = = d. Project management services + = = = e. Composition and purity testing and analysis + = = = e. Technical inspection + = = = e. Testing and analysis services of physical properties + = + + e. Testing and analysis services of integrated
mechanical and electrical systems + = + +
f. Consulting related to agriculture and animal
husbandry x x = =
f. Services incidental to forestry excluding aerial fire x x = =

34
Categories of services India Korea
MA NT MA NT fighting and disinfection
g. Services incidental to fishing + = + = h. Services incidental to mining * * = = i. Services incidental to manufacturing x x = =
j. Services incidental to energy distribution + = k. Placement services of personnel + = - = m. Related scientific and technical consulting services x x + = n. Maintenance and repair of equipment + = - = o. Building-cleaning services + = + + p. Photographic services + = + = q. Packaging services + = = = r. Printing, publishing x x = = s. Convention services + = = = t. Translation, interpretation and speciality design
services + = = =
2. COMMUNICATION SERVICES B. Courier services x x = =
C. Telecommunication services a. Voice telephone services = = = = b. Packet-switched data transmission services = = = = c. Circuit-switched data transmission services = = = = d. Telex services x x = = e. Telegraph services x x = = f. Facsimile services = = = = g. Private leased circuit services = = = = h. Electronic mail = = = = i. Voice mail = = = = j. On-line information and database retrieval = = = = k. Electronic data interchange x x = = l. Enhanced/value-added facsimile services = = = = m. Code and protocol conversion x x = = n. On-line information and/or data processing = = = = o. Other = = = =
D. Audiovisual services a. Motion picture and video-tape production and
distribution services = = - =
e. Sound recording x x = = 3. CONSTRUCTION AND RELATED ENGINEERING
SERVICES - =
A. General construction work for buildings + = x x B. General construction work for civil engineering + = x x C. Installation and assembly work + = x x D. Building completion and finishing work + = x x E. Other + = x x
4. DISTRIBUTION SERVICES A. Commission agents’ services + = = = B. Wholesale trade services + = - = C. Retailing services x x - = D. Franchising x x = =
5. EDUCATIONAL SERVICES
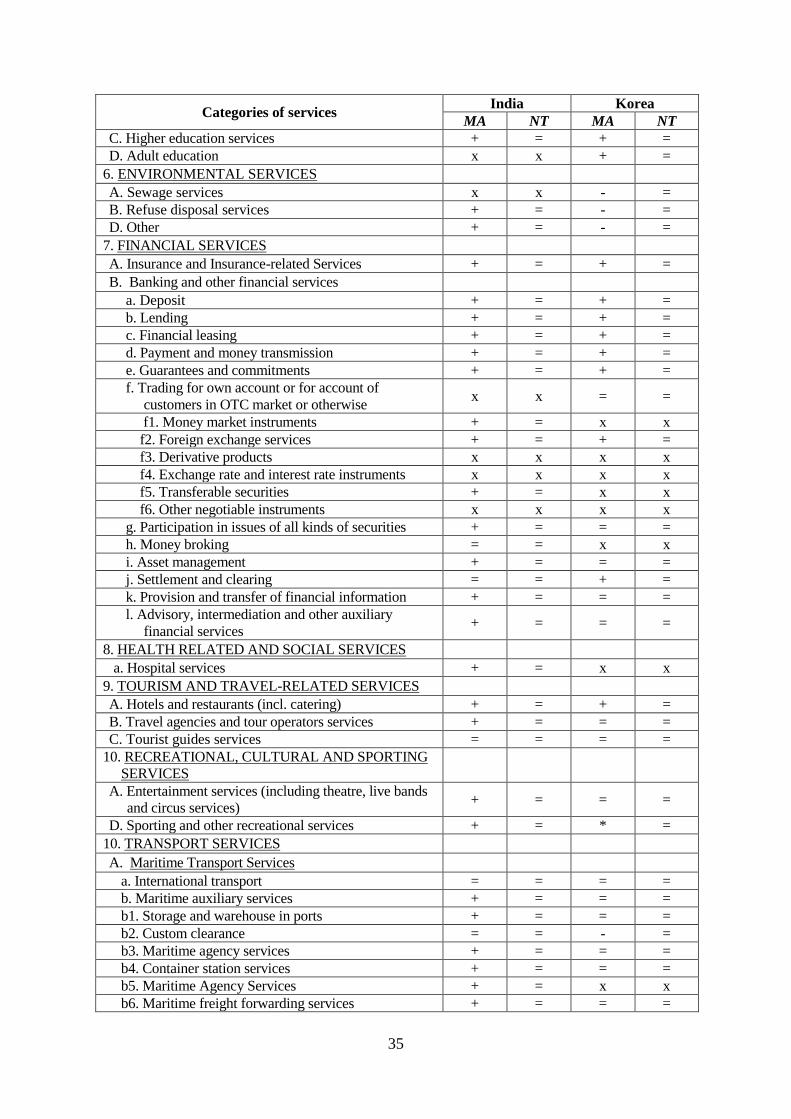
35
Categories of services India Korea
MA NT MA NT C. Higher education services + = + = D. Adult education x x + =
6. ENVIRONMENTAL SERVICES A. Sewage services x x - = B. Refuse disposal services + = - = D. Other + = - =
7. FINANCIAL SERVICES A. Insurance and Insurance-related Services + = + =
B. Banking and other financial services a. Deposit + = + = b. Lending + = + = c. Financial leasing + = + = d. Payment and money transmission + = + = e. Guarantees and commitments + = + = f. Trading for own account or for account of
customers in OTC market or otherwise x x = =
f1. Money market instruments + = x x f2. Foreign exchange services + = + = f3. Derivative products x x x x f4. Exchange rate and interest rate instruments x x x x f5. Transferable securities + = x x f6. Other negotiable instruments x x x x g. Participation in issues of all kinds of securities + = = = h. Money broking = = x x i. Asset management + = = = j. Settlement and clearing = = + = k. Provision and transfer of financial information + = = = l. Advisory, intermediation and other auxiliary
financial services + = = =
8. HEALTH RELATED AND SOCIAL SERVICES a. Hospital services + = x x
9. TOURISM AND TRAVEL-RELATED SERVICES A. Hotels and restaurants (incl. catering) + = + = B. Travel agencies and tour operators services + = = = C. Tourist guides services = = = =
10. RECREATIONAL, CULTURAL AND SPORTING
SERVICES
A. Entertainment services (including theatre, live bands
and circus services) + = = =
D. Sporting and other recreational services + = * =
10. TRANSPORT SERVICES
A. Maritime Transport Services a. International transport = = = = b. Maritime auxiliary services + = = = b1. Storage and warehouse in ports + = = = b2. Custom clearance = = - = b3. Maritime agency services + = = = b4. Container station services + = = = b5. Maritime Agency Services + = x x b6. Maritime freight forwarding services + = = =

36
Categories of services India Korea
MA NT MA NT b7. Shipping brokerage + = = = c. Rental of vessels with crew = = = = d. Maintenance and repair of sea going vessels + = + + l. Pushing and towing x x = = m. Tally, measuring and survey x x = =
C. Air Transport Services a. Computer reservation x x = = b. Selling and marketing of air transport services x x = = d. Maintenance and repair of aircraft + = = =
E. Rail Transport Services a. Passenger transportation x x = = b. Freight transportation x x = =
F. Road Transport Services x x = = G. Pipeline Transport x x = =
H. Services auxiliary to all modes of transport b. Storage and warehouse services x x = =
I. Other Transport Services x x = =
*Description of Symbols:
No commitment ×
Improvement in CEPA +
No improvement in CEPA =
No commitment in revised offer but in CEPA *
Reduction from revised offer commitment _
Appendix 2A: Definition of categories under Mode 4
Under the GATS Mode 4 negotiations there are four broad categories of temporary movement of
professionals. These include:
a) Business visitor is a person who visits another country for a short duration specifically for
business negotiations and/or for preparatory work towards establishing a business;
b) Intra corporate transferee is an employee of a company who is transferred from an office
in the country of origin to an office of the same company in another country;
c) Contractual service supplier (CSS) is an employee of a foreign company who enters
another country temporarily in order to perform a service pursuant to a contract;
d) Independent professional (IP) is a self-employed person based in the territory of another
country who supplies a service on the basis of a services contract with a consumer in the
host country.

1
LATEST ICRIER’S WORKING PAPERS
NO. TITLE Author YEAR
279 SALIENT FEATURES OF
MEASURING, INTERPRETING AND
ADDRESSING INDIAN INFLATION
KIRTI GUPTA
FAHAD SIDDIQUI
JULY 2014
278 THE ECONOMIC IMPACTS OF
TEMPERATURE ON INDUSTRIAL
PRODUCTIVITY: EVIDENCE FROM
INDIAN MANUFACTURING
ANANT
SUDARSHAN
MEENU TEWARI
JULY 2014
277 JOINING THE SUPPLY CHAIN: A
FIRM-LEVEL PERSPECTIVE FROM
SOUTHEAST ASIA
GANESHAN
WIGNARAJA
JUNE 2014
276 EL NIÑO AND INDIAN DROUGHTS-
A SCOPING EXERCISE SHWETA SAINI
ASHOK GULATI JUNE 2014
275 INDIA-PAKISTAN TRADE: AN
ANALYSIS OF THE
PHARMACEUTICAL SECTOR
MANOJ PANT
DEVYANI PANDE
JUNE 2014
274 ENHANCING INDIA-PAKISTAN
ECONOMIC COOPERATION:
PROSPECTS FOR INDIAN
INVESTMENT IN PAKISTAN
PALAKH JAIN AND
SAMRIDHI BIMAL
MAY 2014
273 SECURITIES TRANSACTION TAX-
CASE STUDY OF INDIA
NEHA MALIK APRIL 2014
272 IMPACT OF TRANSACTION TAXES
ON COMMODITY DERIVATIVES
TRADING IN INDIA
SAON RAY
NEHA MALIK
MARCH 2014
271 FEEDSTOCK FOR THE
PETROCHEMICAL INDUSTRY
SAON RAY
AMRITA GOLDAR
SWATI SALUJA
FEBRUARY
2014
270 USING IPRS TO PROTECT NICHES?
EVIDENCE FROM THE INDIAN
TEXTILE AND APPAREL INDUSTRY
SUPARNA
KARMAKAR MEENU
TEWARI
JANUARY
2014
269 MONSOON 2013: ESTIMATING THE
IMPACT ON AGRICULTURE
ASHOK GULATI
SHWETA SAINI
SURBHI JAIN
DECEMBER
2013

2
About ICRIER
Established in August 1981, ICRIER is an autonomous, policy-oriented, not-for-profit,
economic policy think tank. ICRIER's main focus is to enhance the knowledge content of
policy making by undertaking analytical research that is targeted at informing India's policy
makers and also at improving the interface with the global economy. ICRIER's office is
located in the institutional complex of India Habitat Centre, New Delhi.
ICRIER's Board of Governors includes leading academicians, policymakers, and
representatives from the private sector. Dr. Isher Ahluwalia is ICRIER's chairperson. Dr.
Rajat Kathuria is Director and Chief Executive.
ICRIER conducts thematic research in the following seven thrust areas:
Macro-economic Management in an Open Economy
Trade, Openness, Restructuring and Competitiveness
Financial Sector Liberalisation and Regulation
WTO-related Issues
Regional Economic Co-operation with Focus on South Asia
Strategic Aspects of India's International Economic Relations
Environment and Climate Change
To effectively disseminate research findings, ICRIER organises workshops, seminars and
conferences to bring together academicians, policymakers, representatives from industry and
media to create a more informed understanding on issues of major policy interest. ICRIER
routinely invites distinguished scholars and policymakers from around the world to deliver
public lectures and give seminars on economic themes of interest to contemporary India.