working paper 20 26 - clevelandfed.org
TRANSCRIPT

w o r k i n g
p a p e r
F E D E R A L R E S E R V E B A N K O F C L E V E L A N D
20 26
Average Inflation Targeting and Household Expectations
Olivier Coibion, Yuriy Gorodnichenko, Edward S. Knotek II, and Raphael Schoenle
ISSN: 2573-7953
Working papers of the Federal Reserve Bank of Cleveland are preliminary materials circulated to stimulate discussion and critical comment on research in progress. They may not have been subject to the formal editorial review accorded official Federal Reserve Bank of Cleveland publications. The views stated herein are those of the authors and not necessarily those of the Federal Reserve Bank of Cleveland, the Board of Governors of the Federal Reserve System, or any other institution with which the authors are affiliated.
Working papers are available on the Cleveland Fed’s website at:
www.clevelandfed.org/research.
Working Paper 20-26 September 2020
Average Inflation Targeting and Household ExpectationsOlivier Coibion, Yuriy Gorodnichenko,
Edward S. Knotek II, and Raphael Schoenle
Using a daily survey of U.S. households, we study how the Federal Reserve’s announcement of its new strategy of average inflation targeting affected households’ expectations. Starting with the day of the announcement, there is a very small uptick in the minority of households reporting that they had heard news about monetary policy relative to prior to the announcement, but this effect fades within a few days. Those hearing news about the announcement do not seem to have understood the announcement: they are no more likely to correctly identify the Fed’s new strategy than others, nor are their expectations different. When we provide randomly selected households with pertinent information about average inflation targeting, their expectations still do not change in a different way than when households are provided with information about traditional inflation targeting.
JEL classification codes: E3, E4, E5. Keywords: Inflation targeting, inflation expectations, surveys, communication, randomized controlled trial.
Suggested citation: Coibion, Olivier, Yuriy Gorodnichenko, Edward S. Knotek II, and Raphael Schoenle. 2020. “Average Inflation Targeting and Household Expectations.” Federal Reserve Bank of Cleveland, Working Paper No. 20-26. https://doi.org/10.26509/frbc-wp-202026.
Olivier Coibion is at the University of Texas at Austin and the National Bureau of Economic Research. Yuriy Gorodnichenko is at the University of California, Berkeley, and the National Bureau of Economic Research. Edward S. Knotek II is at the Federal Reserve Bank of Cleveland. Raphael Schoenle is at Brandeis University, CEPR, and the Federal Reserve Bank of Cleveland. The authors thank Daniela Dean Avila for excellent research assistance. The randomized controlled trial is registered at the AER RCT Registry (#AEARCTR-0006425).
1
“[I]f inflation runs below 2 percent following economic downturns but never moves above 2 percent
even when the economy is strong, then, over time, inflation will average less than 2 percent.
Households and businesses will come to expect this result, meaning that inflation expectations would
tend to move below our inflation goal and pull realized inflation down. To prevent this outcome and
the adverse dynamics that could ensue, our new statement indicates that we will seek to achieve
inflation that averages 2 percent over time. Therefore, following periods when inflation has been
running below 2 percent, appropriate monetary policy will likely aim to achieve inflation moderately
above 2 percent for some time.” Jerome H. Powell, August 27, 20201
1. Introduction
Monetary policy regimes rarely change. On August 27, 2020, in a public webcast speech at the annual
Jackson Hole symposium, the Federal Reserve’s most visible conference, Federal Reserve Chair Jerome
H. Powell announced such a change. The Federal Reserve was formally adopting a new strategy that he
termed a “flexible form of average inflation targeting” (AIT) to try to ensure that the Fed’s inflation
objective of 2% is obtained on average. Following more than a year of internal discussions, conferences
with academics, and meetings with the general public as part of a Fed Listens series, this announcement
received extensive news coverage. As described by Powell, the main difference between AIT and
traditional inflation targeting (IT) is that, under the former regime, a period of below-target inflation
should be followed by a period in which inflation is systematically above the target, whereas under the
latter regime, inflation should move to its target regardless of how long it had deviated from it previously.
This promise of higher-than-normal future inflation under AIT during times of economic distress (when
inflation is low) should raise inflation expectations, thereby reducing ex-ante real rates and stimulating
the economy as households increase their consumption. Consistent with this mechanism, AIT and similar
regimes such as price-level targeting have long been found to have a profound stabilizing role in New
Keynesian models (Woodford 2003).
At the heart of this mechanism is the notion that the specific inflation targeting strategy followed
by the central bank is known and understood by households and firms, leading to materially different
dynamics of inflation expectations. Was this the case following Powell’s speech officially announcing
AIT? We study this question using a daily survey of U.S. households running before and after Powell’s
speech. The survey can answer three specific, related questions. First, did the announcement make its
way to the general public? Second, did those households that heard or read about the announcement
understand it and incorporate it into their expectations? Third, if we sidestep the thorny issue of how to
reach the broader public and instead directly provide pertinent information to households about average
1 Powell (2020).
2
inflation targeting, does this meaningfully affect their beliefs relative to traditional inflation targeting?
Our survey evidence suggests that the answers to these questions are no, no, and no.2
We study the extent to which households heard about and understood the AIT announcement
using a module inside of a larger daily survey of consumers sponsored by the Federal Reserve Bank of
Cleveland. We detect only a very small uptick in the fraction of the population that reported having heard
news about the Federal Reserve in the days immediately following the announcement. This finding
suggests that the announcement did not significantly affect the general public’s perception of monetary
policy. The share of households reporting that they heard any news about monetary policy or the Federal
Reserve rises from 24% on the day prior to the announcement to a high of just 33% on the day after the
announcement, before falling thereafter. While some respondents claimed to have heard Fed-related news
from official sources, most reported having read about it in the newspaper or on social media. Less than
half of the people who heard Fed-related news after the announcement reported that the news was about
a new strategy by the Federal Reserve. Despite extensive coverage in the news media, Powell’s speech
apparently did not reach or register with the vast majority of the population.
Even for those who heard news about monetary policy following the announcement, the news had
little impact. For example, those who reported hearing news about monetary policy after the announcement
were no more likely to report AIT as a Fed strategy than respondents prior to the announcement. Both
before and after the announcement, respondents were more likely to select IT as a Fed strategy than AIT.
They were also no more likely to report that maximum employment and price stability were the two main
objectives of the Federal Reserve. Instead, both before and after the announcement, respondents’ two most
commonly perceived objectives of the Federal Reserve were maintaining a strong dollar and keeping
interest rates low to reduce the government’s cost of borrowing. Conditional on receiving news after the
announcement, households’ expectations about inflation, output growth, and personal income were
effectively unchanged as well. In short, we find no evidence that being exposed to news about monetary
policy or the Fed after Powell’s speech changed households’ perceptions of what the Federal Reserve will
do nor did it affect their broader economic outlook.
While this announcement may not have had any meaningful effect on the public’s perception of
the monetary policy strategy, it does not rule out the possibility that, when presented directly and
concisely to individuals, information about AIT could lead households to change their beliefs in a manner
2 In its “Renewal of the Inflation-Control Target,” the Bank of Canada (2011) concluded that the gains of switching to price-
level targeting (PLT) are not clear enough because the success of this regime relies on the assumption that “… agents are
forward-looking, fully conversant with the implications of PLT and trust policy-makers to live up to their commitments” and
it is not clear whether this assumption “… [is] sufficiently satisfied in the real world for the Bank to have confidence that PLT
could improve on the current inflation-targeting framework.”
3
consistent with the theory. We use a randomized controlled trial (RCT) to address this question.
Specifically, we provide some individuals with information explaining AIT, others with information
explaining IT, and a third group with no information (control group). Both treatments lead average
Americans to have lower medium-term expectations for future inflation, future GDP growth, and their
own personal household income growth. Importantly, we find no meaningful differences in expectations
between individuals who are provided information about AIT vs. IT. Even when information about the
new inflation strategy is presented directly to households and the strategy is clearly explained to them, it
does not lead to discernibly different expectations than traditional inflation targeting. This suggests that
AIT is unlikely to provide many of the economic benefits that theory often attributes to it.
This paper builds on a growing literature studying how households’ expectations respond to
policy decisions at high frequencies. Lamla and Vinogradov (2019), for example, document that
household inflation expectations are unaffected by FOMC interest rate decisions. Binder (2020) finds
that few households were aware of the Fed’s large policy decisions in March 2020 in response to the
impacts of the coronavirus on the U.S. economy and financial markets. Lewis, Makridis, and Mertens
(2020) find that households’ perceptions of the broader economic outlook respond immediately to interest
rate decisions but that other monetary policy announcements (e.g., QE, forward guidance) have little
discernible effect. Relative to these papers, we focus on a more consequential policy announcement
involving the overall inflation targeting strategy, which should have an immediate and large discernible
effect on inflation expectations. We also combine this with an RCT strategy to go beyond the question
of how expectations responded to the announcement and address the broader question of how much of
an effect one might expect if the announcement had reached the broader public.
With the latter, our paper also relates to a growing literature applying RCT methods to
macroeconomic topics, building on earlier work by Armantier et al. (2016), Cavallo, Cruces, and Perez-
Truglia (2017), and others. Coibion, Gorodnichenko, and Weber (2019), for example, study how different
types of information about inflation or monetary policy affect households’ inflation expectations. Binder
and Rodrigue (2018) provide information about the inflation target to characterize the response of long-
run inflation expectations. Roth and Wohlfart (2019) assess how information about the broader economic
outlook affects households’ expectations. Relative to this literature, we are the first to assess the effect of
treating households with information about average inflation targeting, a key policy innovation that
should meaningfully affect households’ inflation expectations.
The paper is organized as follows. Section 2 describes the survey we use as well as the specific
questions and treatments applied. Section 3 characterizes the extent to which households received news
about the Federal Reserve and its new inflation strategy. Section 4 studies whether households that were
4
exposed to news about monetary policy around the time of Powell’s speech understood it and incorporated
its effects into their expectations. Section 5 describes the RCT that assesses how households respond to
information about AIT when it is directly presented to them and clearly explained. Section 6 concludes.
2. Data and Survey Design
Our survey results come from a daily survey of consumers sponsored by the Federal Reserve Bank of
Cleveland which has been running since March 11, 2020. The survey is administered by Qualtrics
Research Services, which representatively draws respondents from several actively managed, double-
opt-in market research panels, complemented using social media (Qualtrics 2019). In all results, we
weight our respondents to ensure that our sample is representative of the U.S. population by gender, age,
income, ethnicity, and Census region. This survey includes a standard block of questions on consumers’
demographic characteristics, a standard block of questions on their expectations, and an ongoing block
of questions related to consumers’ perceptions surrounding COVID-19 and its impact on their behaviors,
as described in Dietrich et al. (2020) and Knotek et al (2020). The questions in the standard block about
expectations ask about expectations for inflation, output growth, and changes to personal income over
the next 12 months (see Appendix B for a detailed list of questions). Questions about inflation
expectations are asked both as a point forecast and as a distribution question in which respondents assign
weights to a wide range of possible binned outcomes.3
After these three blocks of questions, the survey asked another set of questions in anticipation of
a possible announcement at the Jackson Hole meeting of a new monetary policy strategy at the Federal
Reserve. A few news articles had noted over the previous week that a formal change in the policy strategy
could be announced at the Jackson Hole meeting, given that this setting had previously been used for
policy announcements and that the Federal Reserve was concluding a well-publicized review of its
objectives and strategies.4 On August 20, the Federal Reserve Board of Governors released the topic for
Powell’s speech as “Monetary Policy Framework Review,” which raised speculation in the financial
press that the Chair would discuss the framework review in his scheduled remarks at Jackson Hole.5
Hence, it was clear to any Fed-watcher that a significant policy announcement was likely at this speech.
This publicly available information provided the basis for adding questions to the Cleveland Fed’s
consumer survey starting on the day prior to Powell’s speech and to increase the sample size. The target
number of respondents was increased to 1,000 on Wednesday, August 26 (the day before the speech),
3 Appendix Table 6 reports demographic statistics for respondents. 4 See, e.g., Cox (2020), Smialek (2020), and Timiraos (2020). 5 See Saphir (2020).
5
and Thursday, August 27 (the day of the speech), and it was increased further to 1,500 on Friday, August
28 (the day after the speech). The sample size was then reduced to 500 for Saturday, August 29, and
Sunday, August 30, and reduced again to 300 for Monday, August 31, and Tuesday, September 1. The
RCT was implemented on all days, with two groups on August 26 and August 27, and three groups from
August 28 through September 1, as described below.
In the set of questions, the first two asked respondents where they generally received news about
the economy or monetary policy (e.g., Twitter, newspapers, official websites, etc.) as well as how
frequently they generally saw such news (e.g., hourly, daily, weekly, etc.). Subsequently, respondents
were asked whether they had heard any news about monetary policy or the Federal Reserve in the last
week. Those responding “Yes” were then asked five follow-up questions. The first was about how many
pieces of news they had seen or heard over that time. The second presented them with different types of
media as to where they had seen or heard this information. The third asked about when they had received
the most recent news (last few hours, that day, previous day, etc.). The fourth question involved selecting
from among several choices what the news had been. These choices included (in randomized order):
a) There was an international meeting of central bankers.
b) There was a change in interest rates announced.
c) There was a change in leadership at the Federal Reserve.
d) There was an announcement about new strategies at the Federal Reserve.
e) The Federal Reserve put in place new lending facilities to fight the recession.
f) Other (write-in)
g) I don’t remember.
The fifth news-specific question was about whom they had heard news, with the following possible
options (in randomized order):
a) Jerome Powell
b) Christine Lagarde
c) Alan Greenspan
d) Janet Yellen
e) None of the above
f) I don’t remember their names.
Jointly, these questions provide a comprehensive overview of the extent of news about the Federal
Reserve heard by survey participants, their news sources, and the contents of what they heard.
The next block of questions were asked of all respondents and targeted their understanding of the
Federal Reserve’s objectives and strategies. The first question in this vein asked:
6
“In terms of the Federal Reserve’s broad economic objectives, what do you think it views as most
important among the following? Please select up to 2.”
They were presented with the following options (in randomized order):
a) Keeping interest rates low to reduce the government’s cost of borrowing
b) Promoting maximum employment
c) Keeping stock prices high
d) Bailing out failing financial institutions
e) Ensuring price stability
f) Maintaining a strong dollar
g) Reducing economic inequality
h) Fighting climate change.
The second question was the following:
“In terms of prices in the economy, which do you think best represents what the Federal Reserve
is trying to do? Select all that apply.”
The available options included the following:
a) Keep the inflation rate as close as possible to a specific target at all times
b) Make inflation, on average, be approximately equal to a target rate
c) Keep prices from rising over time
d) Ensure inflation is sufficiently high to erode the value of government debt
e) Keep the inflation rate low enough to promote a strong dollar
f) None of the above
g) I don’t know.
The third question in this block asked:
“What inflation rate do you think the Federal Reserve tries to achieve in the long run?”
These three questions characterize respondents’ understanding of the Federal Reserve’s broad objectives,
its specific strategy with respect to prices, and their knowledge of the Fed’s numerical inflation target.
We then asked a hypothetical question meant to characterize how they thought the Federal
Reserve would respond to different inflation rates. A randomly selected half of respondents were asked
the following question:
“Suppose that the inflation rate in 2021 turns out to be around 1%. What inflation rate do you
think the Federal Reserve will try to achieve over the following year or two?”
If an individual thinks the inflation target is 2%, then he or she should expect an inflation rate of about
2% if he or she believes the Fed is pursuing a traditional inflation targeting strategy (i.e., letting “bygones
be bygones”). However, those who believe the Fed is pursuing a strategy of average inflation targeting
should expect an inflation rate of more than 2% to compensate for below-target inflation. The other half
7
of respondents were asked the same question but with a hypothetical inflation rate of 3% for 2021. For
this scenario, an individual who believes the inflation target is 2% should predict 2% inflation under IT
and less than 2% under AIT.
Following these questions, we implemented a randomized controlled trial (RCT). Respondents
were randomly assigned to one of several groups.6 On Wednesday, August 26 (the day prior to Powell’s
speech) and Thursday, August 27 (the day of Powell’s speech), one control group received no information
and one treatment group was told about the Federal Reserve’s existing inflation target and strategy as
follows:
“As of January 2020, the Federal Reserve was targeting an inflation rate of 2% per year.
Effectively, this means that when inflation is below the target, the Federal Reserve will try
to push inflation back up to the target. And vice versa, when inflation is above the target,
the Federal Reserve will try to push inflation back down to the target.”
Starting on Friday, August 28 (the day after Powell’s speech) and continuing through Tuesday, September
1, there were three groups in the RCT. One remained a control group that received no information. The
second was a traditional inflation targeting group that received the same treatment as before. The third
group received information about the inflation target and average inflation targeting as follows:
“The Federal Reserve targets an average inflation rate of 2% per year. Effectively, this
means that when inflation is below the target, the Federal Reserve will try to push inflation
above the target for some time. And vice versa, when inflation is above the target, the
Federal Reserve will try to push inflation below the target for some time.”
The terms in bold in each treatment emphasize the key elements of each inflation strategy and were
shown in boldface to respondents. The wording was chosen to make as clear as possible what each
strategy entailed and hewed closely to the specific language used by Chair Powell.
Following the RCT, respondents were presented with a final block of questions designed to
measure their posterior beliefs. To avoid survey fatigue, we elicited their expectations using a slightly
different wording of questions. For example, we asked respondents about what they expected inflation
would be, on average, over the next five years, while priors at the beginning of the survey elicited inflation
expectations at the one-year horizon. The same time horizon was applied to follow-up questions on GDP
growth and personal income growth. Finally, respondents were asked about when they expected
mortgage rates would start to rise in a significant way; to rate the credibility of the Federal Reserve on a
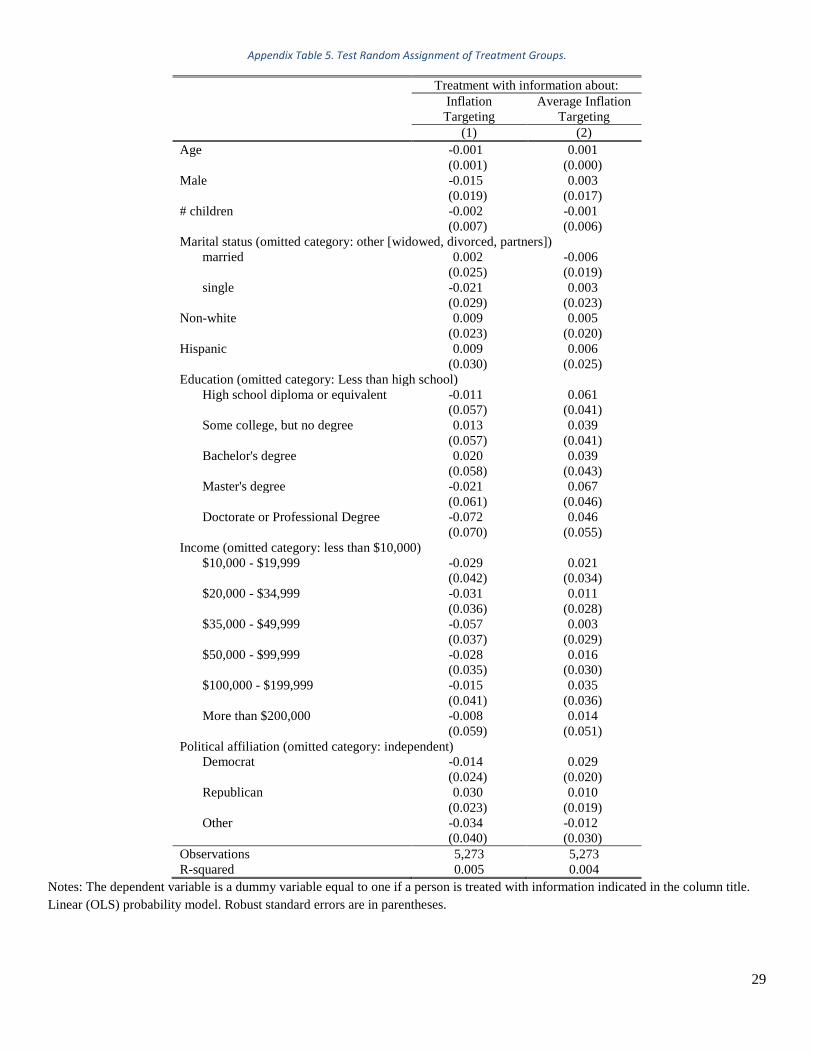
6 We verify in Appendix Table 5 that selection into each group is not predictable conditional on any of the observable
demographics of the respondent.
8
sliding scale running from 0 (very low credibility) to 100 (very high credibility); and the chance that
inflation will be more than 5% in the next 12 months from 0 (no chance) to 100 (sure thing).
3. Did U.S. Households Hear about the Federal Reserve’s Policy Announcement?
We first consider the degree to which households report having heard news about the announcement.
Specifically, households were asked whether they had heard any news about monetary policy or the
Federal Reserve over the previous week. In Table 1, we report the average frequency of respondents
saying “Yes” the day before the announcement (8/26), both the morning and the afternoon of the
announcement (8/27), and the day after the announcement (8/28), as well as the average across the next
four days (8/29-9/1). We pool across the last four days, since the samples on these days were much
smaller. Note that Powell’s speech was given and released at 9:10 a.m. EDT on August 27, so splitting
that day into two equal-size subsamples allows us to track the speed of news coverage reaching
households at a high (intraday) frequency.
Prior to the announcement, around one in four respondents claimed to have heard news about
monetary policy in the previous week. We see no change during the morning of the day on which the
announcement was made. However, by the end of the day, there is a small (and statistically significant)
uptick in the share of people who reported having heard news about monetary policy, to 30% of
respondents. The highest fraction of positive responses occurs the following day, with the share of positive
responses peaking at 33%. However, the share of people who reported having heard news begins to decline
within the next few days, falling back to 29% on average between 8/29 and 9/1, even though the question
asks about news over the previous week, which is consistent with consumers rapidly forgetting about news
they had previously heard. Hence, we see only a small, and likely transitory, effect on reports of news heard
about monetary policy following this big announcement. We stress that the vast majority of our sample
reported having heard no monetary policy news.
This small rise in exposure to news about monetary policy seems to be limited to the extensive
margin. When people are asked to report how many pieces of news they heard, there are few changes
relative to the day prior to the announcement. The fraction of people who reported having seen just one
piece of news rises from 36% prior to the announcement to 41% on the afternoon of the day of the
announcement, consistent with more people being exposed to this news, but the difference is not statistically
significant. After a few days, there is a statistically significant increase in the share of those who reported
having read five or more articles, but it is quantitatively very small (rising from 3% prior to the
9
announcement to 6% several days later). Thus, there is no evidence of a strong intensive margin in acquiring
and retaining news coverage. Instead, only some small movements along the extensive margin of exposure
to news about monetary policy take place after the announcement.
How do people get these news reports? Interestingly, we find a large decrease in the share of people
reporting that they received their information from news programs on television and radio (from 56% prior
to the announcement to 38% in the afternoon after the announcement). Instead, we see a large spike in the
share of people who reported being told the news by friends and relatives on the morning of the
announcement (from 20% to 35%), with the effect fading by the afternoon, as well as an increase in the
share of those who received the news from official sources (from 20% to 32%). We also see smaller
increases that first morning in Twitter and other social media reports (from 27% to 34%), from coworkers
(from 12% to 16%), and from “other” internet sources (from 9% to 13%), although these changes are not
statistically significant. By the afternoon of the announcement, however, traditional media seemed to have
recovered some of their role as transmitters of the information. The role of friends and relatives and
coworkers had returned to pre-announcement levels, while the share of news coming from newspapers rose
to 53% (from 42% in the morning). By Monday or Tuesday, the news sources were very close to their pre-
announcement allocation. Together, these results suggest that the news initially traveled by word-of-mouth
either in person or online through social media and blogs, with some role played by official sources. This
illustrates the influence of social networks, be they in-person or online, in transmitting news.
The timing of the transmission and acquisition of information can also be seen from questions
asking respondents when they heard the most recent news. As reported in Table 1, on the morning of
Powell’s announcement, there were small increases compared with the prior day in the share of people
saying they had heard news in the last couple of hours or earlier in the day (to 15% and 24%, from 11%
and 20%, respectively). By that afternoon, those fractions had increased even further, to 21% and 29%,
respectively. The day following the announcement, we see an uptick in the share of people reporting that
they had heard news “yesterday,” to 35% from 28% prior to the announcement. In contrast, those reporting
they had heard the news that day fell back to the same general levels as on the day before the announcement.
This indicates that much of the information was transmitted on the day of the announcement, with little
additional coverage reaching people in subsequent days. Consistent with this, by Saturday through Tuesday,
we see an uptick in the share of people reporting they had heard news two to three days before, indicating
that respondents’ precise recall of when they heard the news is imperfect after a little while.7
7 Appendix Figure 1 reports the intensity of media coverage on Fed-related topics. For each topic, news coverage spikes on
August 27, the day of the Chair’s speech.
10
When asked about the content of the news they had heard, about one in three of those who had
heard news about monetary policy prior to the announcement reported that the news concerned an
announcement about new strategies by the Federal Reserve. Nearly 30% claimed that the news they had
heard was that there was a new lending facility to fight the recession. One in five reported that there was
an international meeting of central bankers, the same proportion reporting that there had been a change in
interest rates or a change of leadership at the Fed. Following the announcement, there is a mild increase in
the share of people hearing news specifically about new strategies by the Federal Reserve, to about 45%
consistently over the next few days. This evidence suggests that the news content received by households
was related to Powell’s Jackson Hole speech and the switch to average inflation targeting. Additional
evidence in this spirit comes from the fact that, after the announcement, households that heard news more
frequently reported that the news involved Jerome Powell.
In short, we find clear evidence that the Federal Reserve’s announcement of a new strategy was
heard by a small segment of the U.S. population. We see some upticks in the fraction of people who reported
having heard news about monetary policy, and both the timing of when they heard the news and the topics
in the news they heard do indeed suggest that this announcement was the source. However, the extent to
which this information was understood by those who received it remains to be determined.
4. How Did the Policy Announcement Shape the Beliefs of Households Who Heard It?
Average inflation targeting can yield better economic outcomes than traditional inflation targeting if it
induces households and firms to anticipate higher inflation when inflation is running below the target,
especially if monetary policy is constrained at that time by the effective lower bound on interest rates.
While the Fed’s announcement does not appear to have reached much of the U.S. population, one can
still ask to what extent the announcement affected the expectations of the individuals who were exposed
to it. As discussed in Section 2, our survey included a number of questions that characterize respondents’
understanding of monetary policy and that can therefore help identify the effect of the news.
Table 2 presents summary results for two of these questions. First, we report the average daily
distribution of responses to the question about the Fed’s major objectives, with a morning/afternoon
breakdown for the day of the announcement and pooling across Saturday-Tuesday responses as before.
One element of Powell’s speech emphasized that the Fed would move away from its previous focus on
eliminating “deviations” of employment from its maximum level (more commonly modeled as deviations
of unemployment from its natural rate) and toward a focus on “shortfalls” of employment from its
maximum level. Despite this change in language surrounding “maximum employment” in his speech, we
do not see any rise in the share of people reporting that promoting maximum employment is a major
11
objective of the Federal Reserve. There is a mild increase in the share of people pointing to “ensuring price
stability,” but it is both rapidly reversed and not statistically significant. The only striking change
following the speech is a larger share of respondents who say that “keeping stock prices high” is a major
objective of the Fed and a commensurate reduction in the share of people who say that “bailing out failing
financial institutions” is a primary objective. Neither had much to do with Powell’s speech.
Similarly, when we look at average responses to the question on the strategy for price stability,
we see a small decrease in the share of people responding with traditional inflation targeting and a
commensurate increase in the share of people responding with average inflation targeting. But in both
cases, the quantitative changes are small and are eliminated within two days of the announcement.
However, given that few people were aware of any monetary policy announcements in the first place, the
absence of strong effects on the perceived objectives and strategies of the Federal Reserve on average
across households could simply reflect the fact that the news was not widely disseminated.
To more precisely identify the policy announcement’s effect on those who received it, we employ
a difference-in-difference strategy that compares the difference in beliefs between those who received
news and those who did not before and after the policy announcement. One cannot just look at the
difference in beliefs after the announcement between those who heard news and those who did not
because of selection effects: Households that follow news about the economy or monetary policy tend to
be more highly educated, have higher incomes, and so forth, all variables that are correlated with
knowledge of monetary policy and economic expectations (see, e.g., Drager, Lamla, and Pfajfar, 2016,
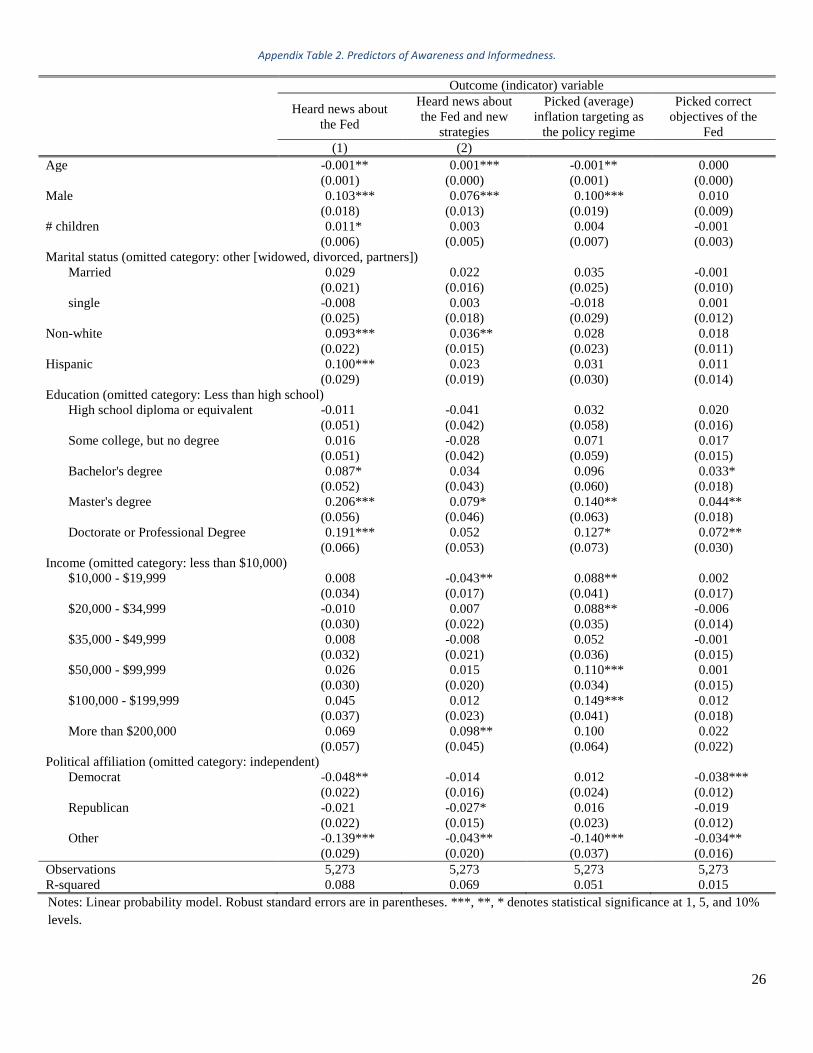
and Appendix Table 2). In addition, one cannot restrict the analysis only to those who heard news both
before and after the announcement, since other factors could affect expectations during this time period.
For example, Hurricane Laura made landfall in Louisiana on August 27 and risked potential disruptions
to the oil industry that could have raised gasoline prices. To control for both issues, we effectively take
the difference between individuals who heard news and those who did not, and assess whether this
difference changed after the announcement was made. Specifically, for a given outcome variable 𝑦𝑖𝑡 at
time t for individual i, we use:
𝑦𝑖𝑡 = 𝛼 + 𝜷𝑿𝒊 + 𝛾𝕀𝑡𝑝𝑜𝑠𝑡 + 𝛿𝕀𝑖𝑡
𝑛𝑒𝑤𝑠 + 𝜃𝕀𝑡𝑝𝑜𝑠𝑡𝕀𝑖𝑡
𝑛𝑒𝑤𝑠 + 𝑒𝑟𝑟𝑜𝑟𝑖𝑡 (1)
where 𝑿 is a vector of demographic controls (age, income, number of children, marital status, education,
political affiliation, race, ethnicity, sources and frequency of getting economic news), 𝕀𝑡𝑝𝑜𝑠𝑡
is an indicator
variable if the survey was done after the announcement, and 𝕀𝑖𝑡𝑛𝑒𝑤𝑠 is an indicator variable if respondent
𝑖 reports having heard news about monetary policy. 𝜃 is the coefficient of interest in this setting.
12
The main threat to our identification strategy would be if news of the announcement was already
widely known and captured in household beliefs prior to Powell’s speech. For example, if there had been
extensive and widespread reporting that the Federal Reserve was going to adopt an average inflation
target in the days leading up to the actual announcement, then one might observe no change in beliefs
after the announcement simply because the change in beliefs had happened earlier and was already
incorporated into respondents’ expectations as of Wednesday, August 26. We think this is extremely
unlikely. While there were some news articles speculating about a coming policy shift prior to Powell’s
speech (as discussed in Section 2), the number of such articles was small compared with the press
coverage on the day of the speech. Thus, some avid Fed-watchers were likely anticipating the content of
the announcement by Wednesday, but the vast majority of the population was not and remained deeply
uninformed about monetary policy overall.8
We report results from these regressions in Table 3. We use Huber-robust regressions that
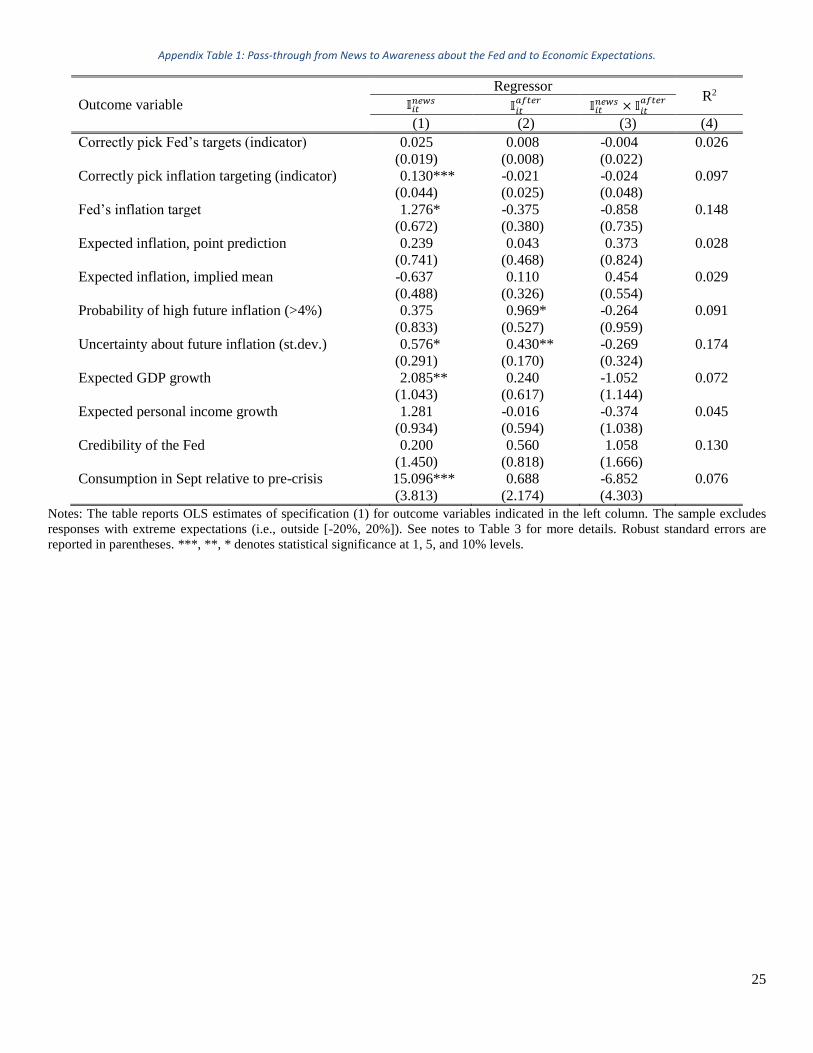
automatically control for outliers (Appendix Table 1 reports equivalent results when we drop extreme
observations manually by restricting the sample to the [−20%, 20%] range). The first row considers the
probability that respondents correctly identify the Fed’s two main objectives as price stability and
maximum employment. There is little evidence that this probability changed more for those receiving
news after the announcement. We obtain a similar result when we look at the probability that someone
correctly identifies average inflation targeting as the Fed’s strategy with respect to prices: We find no
statistically significant change following the announcement. If we use respondents’ perceived value of
the inflation target as the dependent variable, we again find no statistically detectable effect of receiving
news of the announcement. Jointly, these results suggest that news of the announcement had little
discernible effect on respondents’ understanding of monetary policy objectives and strategies.
We can also assess whether news of the announcement affected survey participants’ economic
expectations via specification (1). In Table 3 we report results using two measures of inflation
expectations (point forecasts and means from distribution questions), inflation uncertainty, the
probability of inflation rising above 4% in 12 months, GDP growth, and their expected personal income
growth. We again find little effect from the news announcement, with all but one of the estimated
coefficients statistically indistinguishable from zero. News of the announcement also had no effect on
what households planned to spend in the coming month, as measured by their September consumption
plans relative to their pre-pandemic levels.
8 For example, on August 26, 2020 (before the announcement), of those who correctly said that the Fed was doing traditional
inflation targeting (40 percent of the sample), only 25 percent correctly stated that the Fed’s inflation target was 2 percent. In
other words, only 10 percent of the sample could correctly identify the policy regime and the target.
13
Finally, we consider whether news exposure affected how respondents thought the Federal
Reserve might respond to different hypothetical levels of inflation. As described in Section 2, respondents
were asked what they thought the Federal Reserve would try to do with inflation in future years if inflation
in 2021 turned out to be either 1% or 3%.9 Someone who thinks that the Fed pursues traditional (strict)
inflation targeting should respond that inflation should just immediately go to the inflation target in each
case. As a result, one would expect the average difference in responses between those getting the 3%
question versus those getting the 1% question to be zero when people think traditional inflation targeting
is in place. By contrast, those who think that the Fed pursues average inflation targeting should respond
that inflation would likely overshoot the inflation target in order to offset the past miss. For a given
positive inflation target, this means their answer to the 3% question should always be smaller than their
answer to the 1% question.
We can test these predictions by examining the average difference between responses to the 3%
inflation question and responses to the 1% question. Figure 1 plots these differences conditional on
respondents’ belief about the inflation target. Panel A does so for all respondents. We consistently find
that the differences are positive, contrary to the implications of either traditional inflation targeting or
average inflation targeting. Panel B does so only for the potentially more informed respondents who
claim to have recently heard news about monetary policy or the Federal Reserve (approximately a quarter
of the sample). The results are similar, albeit less precise. In Panel C, we separately plot results for those
who think that traditional inflation targeting (IT) characterizes the Fed’s strategy with respect to price
stability and those who think it is average inflation targeting (AIT). For those picking IT (a little more
than one-third of the sample), the difference is consistently positive for low to moderate perceived
inflation targets—the prevalent inflationary environment—and we can reject the null of zero difference.
For AIT respondents (a little less than one-third of the sample), the average difference is somewhat
smaller but less precisely estimated. Importantly, the two lines are not significantly different from one
another, so we find little evidence that those who believe the Fed is pursuing AIT are drawing different
implications about monetary policy and inflation dynamics than those who believe the Fed is pursuing
IT.
Taken together, these results paint a relatively bleak picture of households’ understanding of the
announcement of a move to AIT. Most Americans never heard the news. Those who reported having
heard news about monetary policy after the announcement are no more likely to think that AIT is what
the Fed is doing than prior to the announcement, nor are their macroeconomic expectations meaningfully
9 Serial correlation for U.S. CPI inflation at an annual frequency for the 2000-2019 period is effectively zero.
14
affected. In short, we find no evidence around the time of the announcement that the change in strategy
to AIT is having any of the desired effects on household expectations.10
5. Is Average Inflation Targeting Likely to Significantly Influence Households’ Expectations?
The fact that the AIT announcement had little effect on households’ expectations need not imply that AIT
cannot work in the expected direction. The announcement’s lack of reach to the general public, for
example, could reflect the fact that news coverage on monetary policy is hard to sell when hurricanes are
landing on U.S. soil and the U.S. president is accepting his nomination for a second term on the same day
as the announcement. And the fact that those exposed to the news did not respond to it could reflect a poor
communication of Powell’s message by either the mainstream media or more informal news sources.
To assess whether AIT could have larger effects on expectations, we rely on an RCT strategy in
which survey respondents were provided information treatments either about traditional inflation
targeting or average inflation targeting (or were in a control group that got no information). As described
in Section 2, each of the treatments clearly emphasizes the key dimension of the respective strategies. In
the case of IT, that means focusing on the fact that the Fed will aim to push the inflation rate back to the
target regardless of whether it was initially above or below. In the case of AIT, that means emphasizing
the fact that, depending on the starting point for inflation, the Fed will systematically seek to undershoot
or overshoot the inflation target to achieve its target inflation rate on average. In other words, it is as if
we knock on the doors of the general public and provide pertinent information directly.
To quantify how the treatments affect expectations, we regress outcome variables (e.g., post-
treatment inflation expectations) on indicator variables for whether individuals were in the IT treatment
group or the AIT treatment group:
𝑦𝑖𝑡 = 𝑏0 + 𝑏1 × 𝑇𝑟𝑒𝑎𝑡𝑚𝑒𝑛𝑡𝐼𝑇𝑖𝑡 + 𝑏2 × 𝑇𝑟𝑒𝑎𝑡𝑚𝑒𝑛𝑡𝐴𝐼𝑇𝑖𝑡 + 𝑒𝑟𝑟𝑜𝑟𝑖𝑡 (2)
where we use outcome variables 𝑦𝑖𝑡 collected after the information treatment.11 As a result of the question
ordering in the survey, the appropriate time horizons for macroeconomic expectations are somewhat
different than those used previously; i.e., these are 5-year expectations vs. 1-year expectations. In each
case, we use Huber regressions to automatically control for outlier observations. Table 4 presents
regression results.
10 Using lab experiments, Amano, Engle-Warnick, and Shukayev (2011) find that, with enough practice, subjects can partially
learn that price-level targeting implies a negative serial correlation for inflation. 11 Appendix Figure 2 plots figures for the effects of treatments conditional on priors. Results are qualitatively similar for both
intercepts and slopes across treatments.

15
Our key finding is that there is no systematic difference in the size of the effects across treatments.
In general, we find significant effects of the information treatments on respondents’ economic
expectations. For example, both AIT and IT treatments lead to lower average inflation expectations by
about 0.5 percentage point per year. This reduction in average inflation expectations after being told
about the Fed’s inflation target is consistent with prior evidence in Coibion, Gorodnichenko, and Weber
(2019). Both treatments also point toward reduced probabilities of seeing inflation above 5%, although
neither effect is precisely estimated. With both treatments, we also observe significant declines in
expected GDP growth (by about 0.5 percentage point per year) and in personal income growth (by about
0.8 percentage point per year). Neither treatment seems to affect when households expect mortgage rates
to start rising, nor do we see any important difference (relative to the control group) in how they affect
the credibility of the Federal Reserve. Hence, both information treatments lead to significant reductions
in expected inflation, expected growth in output, and expected growth in personal income.
Along every outcome metric we consider, the two treatments are effectively indistinguishable,
with no systematic differences in the size of the effects across treatments. Although economic theory
predicts that AIT can typically generate better economic outcomes than IT when policy is constrained at
the zero lower bound (by committing to higher future inflation in order to make up for current or past
downside misses), we find no evidence that real-world consumers see this mechanism at work.
6. Conclusion
In one of the most significant policy changes in recent decades, Chair Powell’s speech on August 27,
2020, announced the Federal Reserve’s adoption of a “flexible form of average inflation targeting”
strategy. In New Keynesian models, AIT can offer significant advantages over IT through inflation
expectations: The promise of future above-target inflation when inflation is currently running persistently
lower than the target boosts inflation expectations, thereby reducing real interest rates and stimulating
economic activity. This mechanism becomes particularly powerful when countries are facing the lower
bound on interest rates, as the U.S. currently is.
Does this mechanism work? Ultimately, this depends on whether households and firms
understand the policy strategy and incorporate it into their expectations and actions. Using a daily survey
of U.S. households around the time of Powell’s speech, we find little evidence of AIT having an
immediate impact on household expectations. First, very few households seem to have even been aware
of the policy announcement. Second, those who were do not seem to have understood what it meant or
incorporated its implications into their expectations. These results could be interpreted as a reflection on
16
how the information was communicated, but they could also reflect the fact that other, more pressing
news events were dominating the news cycle. Perhaps more worryingly, we find that even in RCT designs
that clearly illustrate the point of AIT, this type of strategy seems to have no marginal effect on
expectations relative to IT. This finding suggests that even if the announcement had been able to reach
the general public in a more systematic fashion, it likely would have had no more effect than simply
reiterating to the public the Fed’s previous IT strategy.
There are several caveats to bear in mind. First, the time horizon since the announcement is very
short: A sustained communications campaign may be more successful in reaching the broader public.
Second, our information treatments were brief: Perhaps sharing an entire speech would lead to a more
pronounced effect on expectations. Future work can also consider whether alternative formulations of
how AIT works are more successful in connecting with the public and shaping their expectations.
More broadly, we view our results as a call for caution to those who expect AIT to work as well
in practice as it does in New Keynesian models. A large body of work has documented the existence and
importance of numerous information frictions that can hamper the forward-looking mechanisms that
drive New Keynesian models (see Angeletos, Huo, and Sastry, forthcoming, for a recent example). Our
results build on this literature and provide new evidence on the limited pass-through of central bank
communications to the broader public. While the “Fed Listens,” the public may not.
References
Amano, Robert, Jim Engle-Warnick, and Malik Shukayev. 2011. “Price-Level Targeting and Inflation
Expectations: Experimental Evidence.” Working Paper 2011-18. Bank of Canada.
http://hdl.handle.net/10419/53961.
Angeletos, George-Marios, Zhen Huo, and Karthik A. Sastry. forthcoming. “Imperfect Macroeconomic
Expectations: Evidence and Theory.” In NBER Macroeconomics Annual. National Bureau of
Economic Research.
Armantier, Olivier, Scott Nelson, Giorgio Topa, Wilbert van der Klaauw, and Basit Zafar. 2016. “The
Price Is Right: Updating Inflation Expectations in a Randomized Price Information
Experiment.” Review of Economics and Statistics 98(3): 503–523.
https://doi.org/10.1162/REST_a_00499.
Bank of Canada. 2011. “Renewal of the Inflation-Control Target: Background Information.” Bank of
Canada. https://www.bankofcanada.ca/wp-content/uploads/2011/11/background_nov11.pdf.
17
Binder, Carola. 2020. “Coronavirus Fears and Macroeconomic Expectations.” The Review of
Economics and Statistics, May, 1–10. https://doi.org/10.1162/rest_a_00931.
Binder, Carola, and Alex Rodrigue. 2018. “Household Informedness and Long-Run Inflation
Expectations: Experimental Evidence.” Southern Economic Journal 85(2): 580–598.
https://doi.org/10.1002/soej.12306.
Cavallo, Alberto, Guillermo Cruces, and Ricardo Perez-Truglia. 2017. “Inflation Expectations,
Learning, and Supermarket Prices: Evidence from Survey Experiments.” American Economic
Journal: Macroeconomics 9(3): 1–35. https://doi.org/10.1257/mac.20150147.
Coibion, Olivier, Yuriy Gorodnichenko, and Michael Weber. 2019. “Monetary Policy Communications
and Their Effects on Household Inflation Expectations.” Working Paper 25482. National
Bureau of Economic Research. https://doi.org/10.3386/w25482.
Cox, Jeff. 2020. “Powell Set to Deliver ‘Profoundly Consequential’ Speech, Changing How the Fed
Views Inflation.” CNBC. August 24, 2020. https://www.cnbc.com/2020/08/24/powell-set-to-
deliver-profoundly-consequential-speech-changing-how-the-fed-views-inflation.html.
Dietrich, Alexander, Keith Kuester, Gernot J. Müller, and Raphael S. Schoenle. 2020. “News and
Uncertainty about COVID-19: Survey Evidence and Short-Run Economic Impact.” Working
Paper 20–12. Federal Reserve Bank of Cleveland. https://doi.org/10.26509/frbc-wp-202012.
Dräger, Lena, Michael J. Lamla, and Damjan Pfajfar. 2016. “Are Survey Expectations Theory-
Consistent? The Role of Central Bank Communications and News,” European Economic
Review 85(June): 84–111. https://doi.org/10.1016/j.euroecorev.2016.01.010.
Knotek, Edward S., II, Raphael S. Schoenle, Alexander M. Dietrich, Keith Kuester, Gernot J. Muller,
Kristian Ove R. Myrseth, and Michael Weber. 2020. “Consumers and COVID-19: A Real-Time
Survey,” Federal Reserve Bank of Cleveland Economic Commentary Number 2020-08.
https://doi.org/10.26509/frbc-ec-202008. .
Lamla, Michael J., and Dmitri V. Vinogradov. 2019. “Central Bank Announcements: Big News for
Little People?” Journal of Monetary Economics 108(December): 21–38.
https://doi.org/10.1016/j.jmoneco.2019.08.014.
Lewis, Daniel J., Christos Makridis, and Karel Mertens. 2020. “Do Monetary Policy Announcements
Shift Household Expectations?” Staff Reports 897, Federal Reserve Bank of New York.
https://ideas.repec.org/p/fip/fednsr/897.html.
Powell, Jerome H. 2020. “New Economic Challenges and the Fed’s Monetary Policy Review,” remarks
delivered at “Navigating the Decade Ahead: Implications for Monetary Policy,” an economic
policy symposium sponsored by the Federal Reserve Bank of Kansas City, Jackson Hole,

18
Wyoming (via webcast),
https://www.federalreserve.gov/newsevents/speech/powell20200827a.htm.
Qualtrics. 2019. “ESOMAR 28: 28 Questions to Help Buyers of Online Samples.” April 2019,
Technical Report.
https://www.iup.edu/WorkArea/linkit.aspx?LinkIdentifier=id&ItemID=274179&libID=274203.
Roth, Christopher, and Johannes Wohlfart. 2019. “How Do Expectations about the Macroeconomy
Affect Personal Expectations and Behavior?” The Review of Economics and Statistics, August,
1–18. https://doi.org/10.1162/rest_a_00867.
Saphir, Ann. 2020. “Fed Chair Powell to Speak on Fed’s Framework Review Next Thursday,” Reuters.
August 20, 2020. https://www.reuters.com/article/us-usa-fed-powell/fed-chair-powell-to-speak-
on-feds-framework-review-next-thursday-idUSKBN25G2GP.
Smialek, Jeanna. 2020. “Fed Officials Said the Economy Needed More Help From Congress.” New
York Times. August 19, 2020, https://www.nytimes.com/2020/08/19/business/economy/fed-
meeting-minutes-coronavirus.html.
Timiraos, Nick. 2020. “Fed Sees Need for Additional Support but Is Vague on Timing,” Wall Street
Journal. August 19, 2020. https://www.wsj.com/articles/fed-resumed-deliberations-over-policy-
setting-revamp-11597860000.
Woodford, Michael. 2003. Interest and Prices: Foundations of a Theory of Monetary Policy. Princeton,
N.J.: Princeton University Press.
19
Table 1. Time Series of Perceptions and Awareness.
Date
Question Share of people choosing a listed response 8/26
8/27 AM (announce)
8/27 PM (announce)
8/28 8/29 – 9/1
(1) (2) (3) (4) (5)
Have you heard any news about
monetary policy or the Federal
Reserve in the last week?
“Yes” 0.24 0.22 0.30** 0.33*** 0.29**
How many news articles,
TV/radio reports, or other
pieces of news about monetary
policy or the Federal Reserve
did you hear or read?
Just one 0.36 0.36 0.41 0.37 0.37
2 0.22 0.23 0.18 0.20 0.26
3 to 5 0.03 0.09 0.06 0.05 0.03
5+ 0.03 0.05 0.02 0.04 0.06**
I don’t remember 0.35 0.27 0.33 0.33 0.28*
Where did you hear this news
about monetary policy or the
Federal Reserve?
Articles in either general-interest newspapers or specialized econ. & fin. newspapers 0.47 0.42 0.53 0.43 0.43
Online or in print (like the USA Today, NYT, WSJ, Economist) 0.47 0.42 0.53 0.43 0.43
Twitter, Facebook, or other social media 0.27 0.34 0.35 0.28 0.30
News or other programs on television and radio 0.56 0.42** 0.38*** 0.47* 0.45**
Other internet sources (blogs, discussion forums) 0.09 0.13 0.08 0.09 0.11
Coworkers 0.12 0.16 0.09 0.11 0.16
Friends and relatives 0.20 0.35** 0.18 0.17 0.20
Official sources (like the web pages of the gov’t, stat. agencies, or the FRBs) 0.20 0.32 0.31* 0.22 0.27*
When did you hear the most
recent news about monetary
policy or the Federal Reserve?
In the last few hours 0.11 0.15 0.21* 0.08 0.06*
Earlier today 0.20 0.24 0.29 0.15 0.15
Yesterday 0.28 0.26 0.27 0.35 0.27
Two days ago 0.18 0.17 0.12 0.21 0.24
Three days ago 0.05 0.05 0.04 0.09* 0.12***
More than three days ago 0.10 0.07 0.05* 0.09 0.11
I don’t remember 0.07 0.05 0.02** 0.03** 0.06
What was the main news about
monetary policy or the Federal
Reserve that you heard most
recently?
There was an international meeting of central bankers 0.22 0.27 0.24 0.16 0.22
There was a change in interest rates announced 0.19 0.28 0.20 0.23 0.24
There was a change in the leadership at the Federal Reserve 0.20 0.30 0.16 0.21 0.19
There was an announcement about new strategies at the Federal Reserve 0.36 0.42 0.45 0.46** 0.45**
The Federal Reserve put in place new lending facilities to fight the recession 0.28 0.33 0.26 0.27 0.23
I don’t remember 0.08 0.08 0.08 0.07 0.08
Whom did you hear news
about?
Jerome Powell 0.41 0.56* 0.46 0.52** 0.46
Christine Lagarde 0.22 0.29 0.19 0.20 0.19
Alan Greenspan 0.17 0.25 0.18 0.15 0.18
Janet Yellen 0.17 0.21 0.28* 0.16 0.17
None of the above 0.00 0.00 0.00 0.00 0.00
I don’t remember their names 0.31 0.23 0.20* 0.23 0.27
Notes: ***, **, * denotes statistically significant difference from August 26 values at 1, 5, and 10% levels.
20
Table 2. Knowledge about the Fed’s Objectives and Policy Regime, All Respondents.
Question Share of people choosing a listed response
Date
8/26 8/27 AM (announce)
8/27 PM (announce)
8/28 8/29 – 9/1
(1) (2) (3) (4) (5)
In terms of the Federal Reserve’s
broad economic objectives, what do
you think it views as most important
among the following:
(please pick up to 2)
Keeping interest rates low to reduce the govt ’s cost of borrowing 0.30 0.33 0.27 0.31 0.32
Promoting maximum employment 0.25 0.23 0.23 0.24 0.25
Keeping stock prices high 0.16 0.15 0.24** 0.13* 0.16
Bailing out failing financial institutions 0.15 0.13 0.07*** 0.13 0.10**
Ensuring price stability 0.27 0.24 0.30 0.30 0.27
Maintaining a strong dollar 0.33 0.36 0.32 0.31 0.35
Reducing economic inequality 0.18 0.18 0.15 0.19 0.15
Fighting climate change 0.12 0.09 0.13 0.12 0.13
In terms of prices in the economy,
which do you think best represents
what the Federal Reserve is trying to
do:
(select all that apply)
Keep the inflation rate as close as possible to a specific target at all times 0.40 0.32** 0.33* 0.37 0.38
Make inflation, on average, be approximately equal to a target rate 0.27 0.29 0.32 0.30 0.27
Keep prices from rising over time 0.35 0.32 0.32 0.37 0.36
Ensure inflation is sufficiently high to erode the value of government debt 0.19 0.22 0.20 0.21 0.21
Keep the inflation rate low enough to promote a strong dollar 0.50 0.50 0.49 0.46 0.49
None of the above 0.00 0.00 0.00 0.00 0.00
I don’t know 0.00 0.00 0.00 0.00 0.00
Notes: ***, **, * denotes statistically significant difference from August 26 values at 1, 5, and 10% levels.
21
Table 3. Pass-through from News to Awareness about the Fed and to Economic Expectations.
Outcome variable
Regressor R2
𝕀𝑖𝑡𝑛𝑒𝑤𝑠 𝕀𝑖𝑡
𝑎𝑓𝑡𝑒𝑟 𝕀𝑖𝑡
𝑛𝑒𝑤𝑠 × 𝕀𝑖𝑡𝑎𝑓𝑡𝑒𝑟
(1) (2) (3) (4)
Correctly pick Fed’s targets (indicator) 0.025 0.008 -0.004 0.026
(0.019) (0.008) (0.022)
Correctly pick inflation targeting (indicator) 0.130*** -0.021 -0.024 0.097
(0.044) (0.025) (0.048)
Fed’s inflation target 0.025 -0.241* 0.167 0.090
(0.188) (0.123) (0.208)
Expected inflation, point prediction, 1-year ahead 0.521 0.511* -0.428 0.050
(0.486) (0.298) (0.539)
Expected inflation, implied mean, 1-year ahead -0.517** 0.319** 0.035 0.083
(0.238) (0.154) (0.264)
Probability of high future inflation (>4%) -1.736 5.587*** -1.175 0.077
(2.026) (1.306) (2.274)
Uncertainty about future (1-year ahead) inflation (st.dev.) 0.730*** 0.534*** -0.398* 0.279
(0.215) (0.125) (0.236)
Expected GDP growth, 1-year ahead 2.906*** 0.338 0.712 0.087
(1.083) (0.628) (1.192)
Expected personal income growth, 1-year ahead 1.443* 0.577 -0.906 0.061
(0.768) (0.441) (0.847)
Credibility of the Fed 5.500*** -2.453** 2.591 0.179
(2.040) (1.228) (2.268)
Consumption in September relative to pre-crisis 6.433*** -1.790 0.967 0.079
(2.166) (1.156) (2.380)
Notes: The table reports Huber-robust estimates of specification (1) for outcome variables indicated in the left column. Controls (age,
gender, education, etc.) are included but not reported. 𝕀𝑖𝑡𝑛𝑒𝑤𝑠 is an indicator variable equal to one if respondent 𝑖 reports hearing news
about the Fed on day 𝑡. 𝕀𝑖𝑡𝑎𝑓𝑡𝑒𝑟
is an indicator variable if respondent 𝑖 is surveyed after the Fed’s announcement. “Credibility of the Fed”
includes only respondents in the control group. Credibility is measured on a scale of 0 (very low credibility) to 100 (very high credibility);
the survey question is “How would you rate the credibility of the Federal Reserve in terms of its ability to achieve maximum employment
and stable prices?” “Consumption in September relative to pre-crisis” is measured (from 0 to 200) relative to monthly consumer
spending in January/February 2020; e.g., 80 (120) means consumer spending is 20% below (above) the pre-crisis level. “Correctly pick
Fed’s targets” is an indicator variable equal to one if a respondent selects “maximum employment” and “stable prices” from the menu
of offered options. “Correctly pick inflation targeting” is an indicator variable equal to one if a respondent selects “Keep the inflation
rate as close as possible to a specific target at all times” or “Make inflation, on average, be approximately equal to a target rate.”
“Probability of high future inflation (>4%)” is the sum of probabilities that a respondent assigns to inflation bins with more than 4%
inflation expected over the next 12 months (the bins are “4% to 8%,” “8% to 12%,” “more than 12%”). “Expected inflation, implied
mean” is the mean expected inflation implied by the inflation distribution reported by a respondent. “Uncertainty about future inflation”
is the standard deviation for expected inflation implied by the inflation distribution reported by a respondent. Robust standard errors are
reported in parentheses. ***, **, * denotes statistical significance at 1, 5, and 10% levels.
22
Table 4. The Effect of Information Treatments on Expectations.
Regressor p-value N obs. R2
Outcome variable 𝕀(𝑡𝑟𝑒𝑎𝑡𝐼𝑇) 𝕀(𝑡𝑟𝑒𝑎𝑡𝐴𝐼𝑇) (1) (2) (3) (4) (5)
Expected inflation, 5-years ahead -0.475*** -0.467*** 0.944 4,266 0.006
(0.096) (0.117)
Probability of expected (1-year ahead) inflation being greater than 5% -0.863 -0.779 0.935 5,278 0.000
(0.869) (1.017)
Expected GDP growth, 5-years ahead -0.463** -0.485** 0.921 4,618 0.002
(0.184) (0.218)
Expected growth of personal disposable income, 5-years ahead -0.812*** -0.785*** 0.919 4,639 0.003
(0.226) (0.265)
Credibility of the Fed 0.380 -1.028 0.073 5,275 0.001
(0.658) (0.781)
Time when mortgage rates are expected to increase 0.031 0.070 0.422 4,170 0.001
(0.041) (0.049)
Unsure when mortgage rates are expected to increase 0.004 -0.019 0.206 5,279 0.000
(0.015) (0.018)
Notes: The table reports Huber-robust estimations of outcome variables on indicator variables for each treatment, specification (2).
Outcome variables are indicated in the left column. Column (3) reports the p-value for the null hypothesis that the treatment effects for
inflation targeting (IT) and average inflation targeting (AIT) are the same. “Time when mortgage rate expected to increase” is coded as
follows: 0 = “Second half of 2020,” 1 = “First half of 2021,” 2 = “Second half of 2021,” 3 = “Sometime in 2022,” 4 = “Sometime in
2023,” 5 = “In 2024 or later,” 6 = “They are unlikely to rise.” “Unsure when mortgage rates are expected to increase” is an indicator
variable equal to one if a respondent reported that he/she is unsure about when mortgage rates are going to increase. “Credibility of the
Fed” is measured on a scale of 0 (very low credibility) to 100 (very high credibility); the survey question is “How would you rate the
credibility of the Federal Reserve in terms of its ability to achieve maximum employment and stable prices?” Robust standard errors are
reported in parentheses. ***, **, * denotes statistical significance at 1, 5, and 10% levels.
23
Figure 1. Future Inflation Responses to Hypothetical Scenarios for Inflation Realizations.
Notes: Each panel of the figure plots the difference between the average response across selected respondents to hypothetical questions about where they would expect inflation to be in coming years if the inflation rate in 2021 was 3% or 1%. This is done conditional on respondents’ beliefs about the inflation target, as shown on the x-axis. Local differences are computed using local averaging with Epanechnikov kernel. Dashed lines or dark-shaded regions show 90% confidence intervals (CI). Panel A shows results for all respondents with beliefs about the target running from 0 to 10%. Panel B uses only survey respondents who report having heard news about monetary policy over the last week. Panel C adds subsets including only respondents who identify traditional inflation targeting as the main price strategy for the Fed (IT) and only respondents who identify average inflation targeting as the main price strategy for the Fed (AIT). The light-shaded region in Panel C shows outcomes consistent with AIT.
24
ONLINE APPENDIX
25
Appendix Table 1: Pass-through from News to Awareness about the Fed and to Economic Expectations.
Outcome variable
Regressor R2
𝕀𝑖𝑡𝑛𝑒𝑤𝑠 𝕀𝑖𝑡
𝑎𝑓𝑡𝑒𝑟 𝕀𝑖𝑡
𝑛𝑒𝑤𝑠 × 𝕀𝑖𝑡𝑎𝑓𝑡𝑒𝑟
(1) (2) (3) (4)
Correctly pick Fed’s targets (indicator) 0.025 0.008 -0.004 0.026
(0.019) (0.008) (0.022)
Correctly pick inflation targeting (indicator) 0.130*** -0.021 -0.024 0.097
(0.044) (0.025) (0.048)
Fed’s inflation target 1.276* -0.375 -0.858 0.148
(0.672) (0.380) (0.735)
Expected inflation, point prediction 0.239 0.043 0.373 0.028
(0.741) (0.468) (0.824)
Expected inflation, implied mean -0.637 0.110 0.454 0.029
(0.488) (0.326) (0.554)
Probability of high future inflation (>4%) 0.375 0.969* -0.264 0.091
(0.833) (0.527) (0.959)
Uncertainty about future inflation (st.dev.) 0.576* 0.430** -0.269 0.174
(0.291) (0.170) (0.324)
Expected GDP growth 2.085** 0.240 -1.052 0.072
(1.043) (0.617) (1.144)
Expected personal income growth 1.281 -0.016 -0.374 0.045
(0.934) (0.594) (1.038)
Credibility of the Fed 0.200 0.560 1.058 0.130
(1.450) (0.818) (1.666)
Consumption in Sept relative to pre-crisis 15.096*** 0.688 -6.852 0.076
(3.813) (2.174) (4.303)
Notes: The table reports OLS estimates of specification (1) for outcome variables indicated in the left column. The sample excludes
responses with extreme expectations (i.e., outside [-20%, 20%]). See notes to Table 3 for more details. Robust standard errors are
reported in parentheses. ***, **, * denotes statistical significance at 1, 5, and 10% levels.
26
Appendix Table 2. Predictors of Awareness and Informedness.
Outcome (indicator) variable
Heard news about
the Fed
Heard news about
the Fed and new
strategies
Picked (average)
inflation targeting as
the policy regime
Picked correct
objectives of the
Fed
(1) (2)
Age -0.001** 0.001*** -0.001** 0.000
(0.001) (0.000) (0.001) (0.000)
Male 0.103*** 0.076*** 0.100*** 0.010
(0.018) (0.013) (0.019) (0.009)
# children 0.011* 0.003 0.004 -0.001
(0.006) (0.005) (0.007) (0.003)
Marital status (omitted category: other [widowed, divorced, partners])
Married 0.029 0.022 0.035 -0.001 (0.021) (0.016) (0.025) (0.010) single -0.008 0.003 -0.018 0.001
(0.025) (0.018) (0.029) (0.012) Non-white 0.093*** 0.036** 0.028 0.018 (0.022) (0.015) (0.023) (0.011) Hispanic 0.100*** 0.023 0.031 0.011 (0.029) (0.019) (0.030) (0.014) Education (omitted category: Less than high school)
High school diploma or equivalent -0.011 -0.041 0.032 0.020 (0.051) (0.042) (0.058) (0.016) Some college, but no degree 0.016 -0.028 0.071 0.017 (0.051) (0.042) (0.059) (0.015) Bachelor's degree 0.087* 0.034 0.096 0.033* (0.052) (0.043) (0.060) (0.018) Master's degree 0.206*** 0.079* 0.140** 0.044** (0.056) (0.046) (0.063) (0.018) Doctorate or Professional Degree 0.191*** 0.052 0.127* 0.072** (0.066) (0.053) (0.073) (0.030)
Income (omitted category: less than $10,000)
$10,000 - $19,999 0.008 -0.043** 0.088** 0.002 (0.034) (0.017) (0.041) (0.017) $20,000 - $34,999 -0.010 0.007 0.088** -0.006 (0.030) (0.022) (0.035) (0.014) $35,000 - $49,999 0.008 -0.008 0.052 -0.001 (0.032) (0.021) (0.036) (0.015) $50,000 - $99,999 0.026 0.015 0.110*** 0.001 (0.030) (0.020) (0.034) (0.015) $100,000 - $199,999 0.045 0.012 0.149*** 0.012 (0.037) (0.023) (0.041) (0.018) More than $200,000 0.069 0.098** 0.100 0.022
(0.057) (0.045) (0.064) (0.022) Political affiliation (omitted category: independent)
Democrat -0.048** -0.014 0.012 -0.038*** (0.022) (0.016) (0.024) (0.012) Republican -0.021 -0.027* 0.016 -0.019 (0.022) (0.015) (0.023) (0.012) Other -0.139*** -0.043** -0.140*** -0.034**
(0.029) (0.020) (0.037) (0.016) Observations 5,273 5,273 5,273 5,273
R-squared 0.088 0.069 0.051 0.015
Notes: Linear probability model. Robust standard errors are in parentheses. ***, **, * denotes statistical significance at 1, 5, and 10%
levels.
27
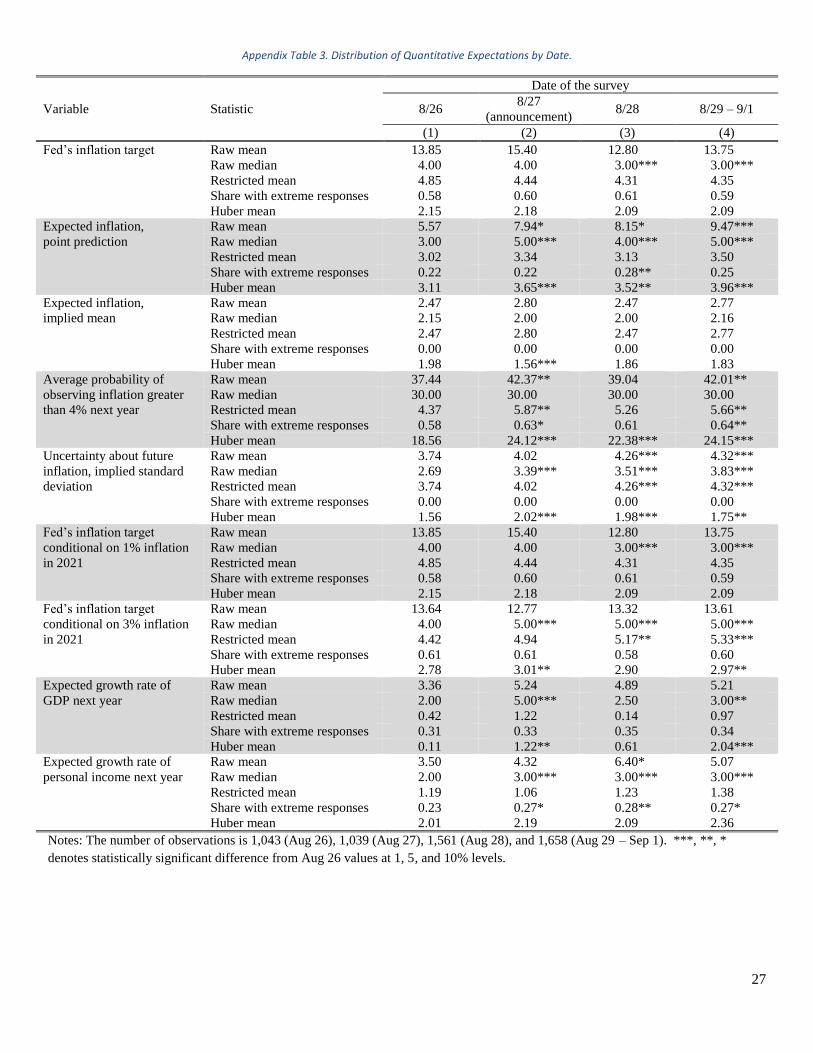
Appendix Table 3. Distribution of Quantitative Expectations by Date.
Variable Statistic
Date of the survey
8/26 8/27
(announcement) 8/28 8/29 – 9/1
(1) (2) (3) (4)
Fed’s inflation target Raw mean 13.85 15.40 12.80 13.75
Raw median 4.00 4.00 3.00*** 3.00***
Restricted mean 4.85 4.44 4.31 4.35
Share with extreme responses 0.58 0.60 0.61 0.59
Huber mean 2.15 2.18 2.09 2.09
Expected inflation,
point prediction
Raw mean 5.57 7.94* 8.15* 9.47***
Raw median 3.00 5.00*** 4.00*** 5.00***
Restricted mean 3.02 3.34 3.13 3.50
Share with extreme responses 0.22 0.22 0.28** 0.25
Huber mean 3.11 3.65*** 3.52** 3.96***
Expected inflation,
implied mean
Raw mean 2.47 2.80 2.47 2.77
Raw median 2.15 2.00 2.00 2.16
Restricted mean 2.47 2.80 2.47 2.77
Share with extreme responses 0.00 0.00 0.00 0.00
Huber mean 1.98 1.56*** 1.86 1.83
Average probability of
observing inflation greater
than 4% next year
Raw mean 37.44 42.37** 39.04 42.01**
Raw median 30.00 30.00 30.00 30.00
Restricted mean 4.37 5.87** 5.26 5.66**
Share with extreme responses 0.58 0.63* 0.61 0.64**
Huber mean 18.56 24.12*** 22.38*** 24.15***
Uncertainty about future
inflation, implied standard
deviation
Raw mean 3.74 4.02 4.26*** 4.32***
Raw median 2.69 3.39*** 3.51*** 3.83***
Restricted mean 3.74 4.02 4.26*** 4.32***
Share with extreme responses 0.00 0.00 0.00 0.00
Huber mean 1.56 2.02*** 1.98*** 1.75**
Fed’s inflation target
conditional on 1% inflation
in 2021
Raw mean 13.85 15.40 12.80 13.75
Raw median 4.00 4.00 3.00*** 3.00***
Restricted mean 4.85 4.44 4.31 4.35
Share with extreme responses 0.58 0.60 0.61 0.59
Huber mean 2.15 2.18 2.09 2.09
Fed’s inflation target
conditional on 3% inflation
in 2021
Raw mean 13.64 12.77 13.32 13.61
Raw median 4.00 5.00*** 5.00*** 5.00***
Restricted mean 4.42 4.94 5.17** 5.33***
Share with extreme responses 0.61 0.61 0.58 0.60
Huber mean 2.78 3.01** 2.90 2.97**
Expected growth rate of
GDP next year
Raw mean 3.36 5.24 4.89 5.21
Raw median 2.00 5.00*** 2.50 3.00**
Restricted mean 0.42 1.22 0.14 0.97
Share with extreme responses 0.31 0.33 0.35 0.34
Huber mean 0.11 1.22** 0.61 2.04***
Expected growth rate of
personal income next year
Raw mean 3.50 4.32 6.40* 5.07
Raw median 2.00 3.00*** 3.00*** 3.00***
Restricted mean 1.19 1.06 1.23 1.38
Share with extreme responses 0.23 0.27* 0.28** 0.27*
Huber mean 2.01 2.19 2.09 2.36
Notes: The number of observations is 1,043 (Aug 26), 1,039 (Aug 27), 1,561 (Aug 28), and 1,658 (Aug 29 – Sep 1). ***, **, *
denotes statistically significant difference from Aug 26 values at 1, 5, and 10% levels.

28
Appendix Table 4. Distribution of Quantitative Expectations by Date, Conditional on Hearing about the Fed.
Variable Statistic
Date of the survey
8/26 8/27
(announcement) 8/28 8/29 – 9/1
(1) (2) (3) (4)
Fed’s inflation target Raw mean 19.64 21.59 15.38 19.34
Raw median 4.00 5.00 4.00 3.00
Restricted mean 5.67 4.45 4.42 4.31
Share with extreme responses 0.58 0.62 0.65 0.61
Huber mean 2.19 2.15 2.29 1.96*
Expected inflation,
point prediction
Raw mean 10.96 13.78 13.26 11.80
Raw median 3.00 5.00*** 4.00 5.00***
Restricted mean 3.36 4.47 3.24 3.98
Share with extreme responses 0.25 0.26 0.30 0.27
Huber mean 2.86 3.49** 2.91 3.32*
Expected inflation,
implied mean
Raw mean 2.00 2.61 2.67 1.87
Raw median 1.60 1.47 2.00 1.14
Restricted mean 2.00 2.61 2.67 1.87
Share with extreme responses 0.00 0.00 0.00 0.00
Huber mean 1.68 1.13*** 1.53 1.39**
Average probability of
observing inflation greater
than 4% next year
Raw mean 33.63 40.44* 37.24 34.02
Raw median 30.00 30.00 30.00 30.00
Restricted mean 4.44 5.47 5.69 5.08
Share with extreme responses 0.57 0.65 0.63 0.57
Huber mean 18.35 22.08** 21.38** 17.52
Uncertainty about future
inflation, implied standard
deviation
Raw mean 4.14 4.20 4.64 4.48
Raw median 2.80 3.51 4.31*** 3.94**
Restricted mean 4.14 4.20 4.64 4.48
Share with extreme responses 0.00 0.00 0.00 0.00
Huber mean 1.52 1.92** 2.16*** 2.01***
Fed’s inflation target
conditional on 1% inflation
in 2021
Raw mean 19.64 21.59 15.38 19.34
Raw median 4.00 5.00 4.00 3.00
Restricted mean 5.67 4.45 4.42 4.31
Share with extreme responses 0.58 0.62 0.65 0.61
Huber mean 2.19 2.15 2.29 1.96*
Fed’s inflation target
conditional on 3% inflation
in 2021
Raw mean 20.00 21.23 15.01 18.02
Raw median 5.00 8.00* 4.00 5.00
Restricted mean 4.44 5.82 4.66 5.57
Share with extreme responses 0.67 0.71 0.62 0.66
Huber mean 2.66 2.71 2.70 2.86
Expected growth rate of
GDP next year
Raw mean 8.77 14.00 10.27 11.91
Raw median 3.00 5.00* 5.00** 4.00
Restricted mean 1.91 2.63 1.72 1.29
Share with extreme responses 0.32 0.38 0.38 0.31
Huber mean 1.89 4.07*** 3.08* 2.78
Expected growth rate of
personal income next year
Raw mean 10.15 9.63 10.76 10.64
Raw median 4.00 5.00* 5.00* 4.00
Restricted mean 2.36 2.55 2.69 1.79
Share with extreme responses 0.27 0.32 0.32 0.28
Huber mean 2.62 3.99** 3.00 2.95
Notes: The number of observations is 260 (Aug 26), 258 (Aug 27), 483 (Aug 28), and 458 (Aug 29 – Sep 1). ***, **, * denotes
statistically significant difference from Aug 26 values at 1, 5, and 10% levels.
29
Appendix Table 5. Test Random Assignment of Treatment Groups.
Treatment with information about:
Inflation
Targeting
Average Inflation
Targeting
(1) (2)
Age -0.001 0.001
(0.001) (0.000)
Male -0.015 0.003
(0.019) (0.017)
# children -0.002 -0.001
(0.007) (0.006)
Marital status (omitted category: other [widowed, divorced, partners])
married 0.002 -0.006
(0.025) (0.019)
single -0.021 0.003
(0.029) (0.023)
Non-white 0.009 0.005
(0.023) (0.020)
Hispanic 0.009 0.006
(0.030) (0.025)
Education (omitted category: Less than high school)
High school diploma or equivalent -0.011 0.061
(0.057) (0.041)
Some college, but no degree 0.013 0.039
(0.057) (0.041)
Bachelor's degree 0.020 0.039
(0.058) (0.043)
Master's degree -0.021 0.067
(0.061) (0.046)
Doctorate or Professional Degree -0.072 0.046
(0.070) (0.055)
Income (omitted category: less than $10,000)
$10,000 - $19,999 -0.029 0.021
(0.042) (0.034)
$20,000 - $34,999 -0.031 0.011
(0.036) (0.028)
$35,000 - $49,999 -0.057 0.003
(0.037) (0.029)
$50,000 - $99,999 -0.028 0.016
(0.035) (0.030)
$100,000 - $199,999 -0.015 0.035
(0.041) (0.036)
More than $200,000 -0.008 0.014
(0.059) (0.051)
Political affiliation (omitted category: independent)
Democrat -0.014 0.029
(0.024) (0.020)
Republican 0.030 0.010
(0.023) (0.019)
Other -0.034 -0.012
(0.040) (0.030)
Observations 5,273 5,273
R-squared 0.005 0.004
Notes: The dependent variable is a dummy variable equal to one if a person is treated with information indicated in the column title.
Linear (OLS) probability model. Robust standard errors are in parentheses.
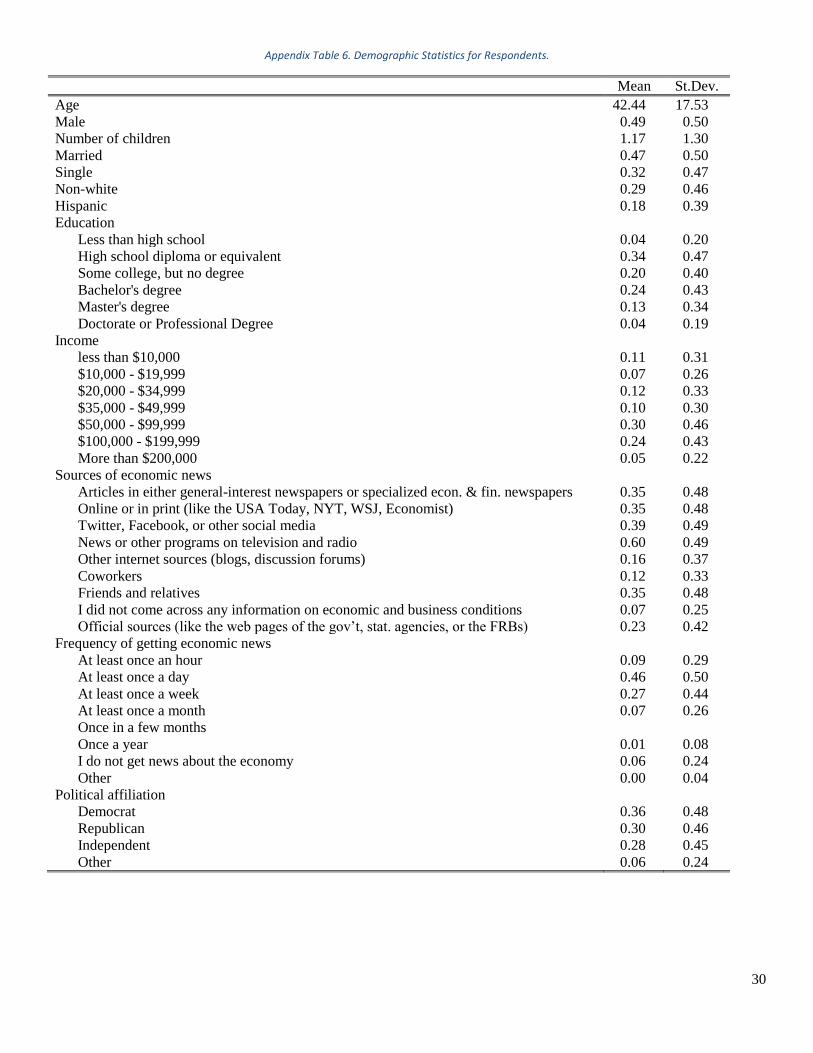
30
Appendix Table 6. Demographic Statistics for Respondents.
Mean St.Dev.
Age 42.44 17.53
Male 0.49 0.50
Number of children 1.17 1.30
Married 0.47 0.50
Single 0.32 0.47
Non-white 0.29 0.46
Hispanic 0.18 0.39
Education
Less than high school 0.04 0.20
High school diploma or equivalent 0.34 0.47
Some college, but no degree 0.20 0.40
Bachelor's degree 0.24 0.43
Master's degree 0.13 0.34
Doctorate or Professional Degree 0.04 0.19
Income
less than $10,000 0.11 0.31
$10,000 - $19,999 0.07 0.26
$20,000 - $34,999 0.12 0.33
$35,000 - $49,999 0.10 0.30
$50,000 - $99,999 0.30 0.46
$100,000 - $199,999 0.24 0.43
More than $200,000 0.05 0.22
Sources of economic news
Articles in either general-interest newspapers or specialized econ. & fin. newspapers 0.35 0.48
Online or in print (like the USA Today, NYT, WSJ, Economist) 0.35 0.48
Twitter, Facebook, or other social media 0.39 0.49
News or other programs on television and radio 0.60 0.49
Other internet sources (blogs, discussion forums) 0.16 0.37
Coworkers 0.12 0.33
Friends and relatives 0.35 0.48
I did not come across any information on economic and business conditions 0.07 0.25
Official sources (like the web pages of the gov’t, stat. agencies, or the FRBs) 0.23 0.42
Frequency of getting economic news
At least once an hour 0.09 0.29
At least once a day 0.46 0.50
At least once a week 0.27 0.44
At least once a month 0.07 0.26
Once in a few months
Once a year 0.01 0.08
I do not get news about the economy 0.06 0.24
Other 0.00 0.04
Political affiliation
Democrat 0.36 0.48
Republican 0.30 0.46
Independent 0.28 0.45
Other 0.06 0.24

31
Appendix Figure 1. Media (Newspaper) Coverage of Fed-related Topics.
Notes: The figure shows time series for document count for a given search query (e.g., “Federal Reserve”) in Factiva, a business
information and research tool owned by Dow Jones & Company. Only U.S. newspapers are included in the counts.
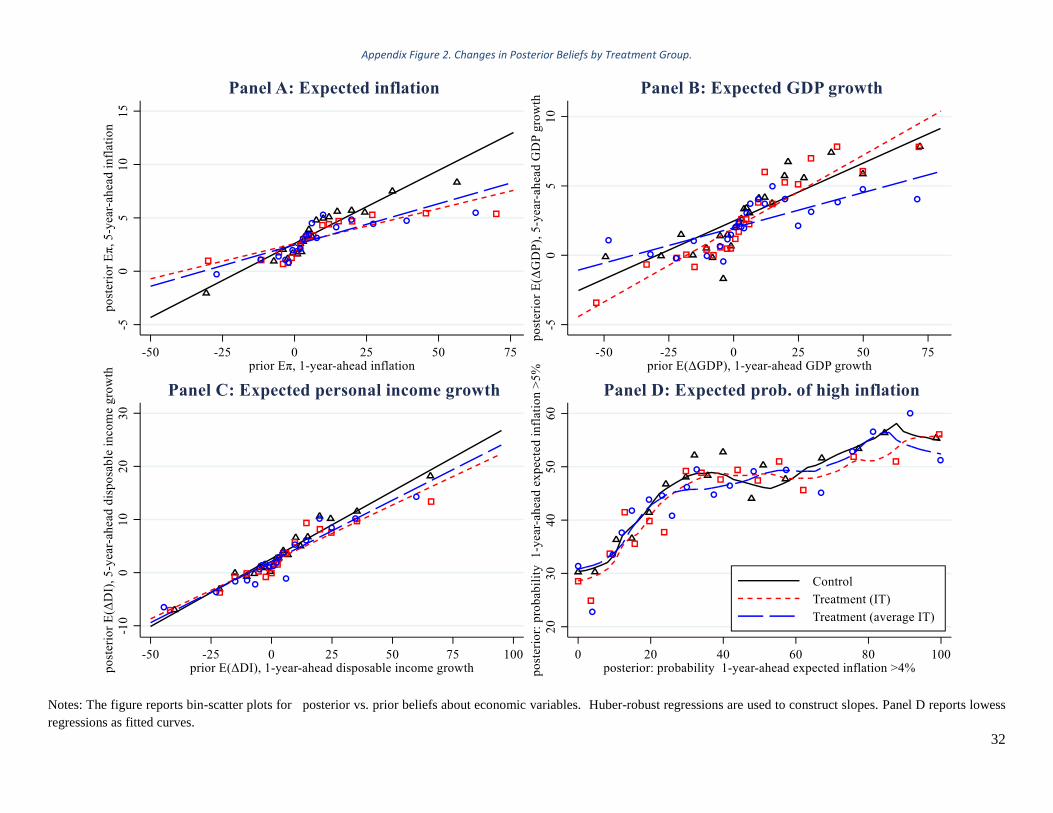
32
Appendix Figure 2. Changes in Posterior Beliefs by Treatment Group.
Notes: The figure reports bin-scatter plots for posterior vs. prior beliefs about economic variables. Huber-robust regressions are used to construct slopes. Panel D reports lowess
regressions as fitted curves.
33
Survey Questionnaire:
Q1 Please enter your age:
________________________________________________________________
Q2 What is your level of English?
o Native (1)
o Fluent (2)
o Less than fluent (3)
Q3 Please indicate your gender.
o Male (1)
o Female (2)
o Other (3)
Q48 What is the highest level of school you have completed, or the highest degree you have achieved?
o Less than high school (1)
o High school diploma or equivalent (2)
o Some college, but no degree (3)
o Bachelor's degree (4)
o Master's degree (5)
o Doctorate or Professional Degree (6)
34
Q49 Please indicate the range of your yearly net disposable income
o Less than $10,000 (1)
o $10,000 - $19,999 (2)
o $20,000 - $34,999 (3)
o $35,000 - $49,999 (4)
o $50,000 - $99,999 (5)
o $100,000 - $199,999 (6)
o More than $200,000 (7)
Q50 What is the postal (zip) code for the address of your permanent residence?
________________________________________________________________
Q124 In which state do you currently reside?
▼ Alabama (1) ... I do not reside in the United States (53)
Q51 How would you identify your ethnicity?
Please select all that apply.
▢ Asian/Asian American (1)
▢ Black/African American (2)
▢ White/Caucasian (3)
▢ Other (4)
▢ Prefer not to say (5)
35
Q52 Do you consider yourself of Hispanic, Latino or Spanish origin?
o Yes (1)
o No (2)
Q5T In some of the following questions, we will ask you to think about the percent chance of something happening in the
future. Your answers can range from 0 to 100, where 0 means there is absolutely no chance, and 100 means that it is
absolutely certain. For example, numbers like: 2 and 5 percent may indicate "almost no chance," 18 percent or so may
mean "not much chance," 47 or 52 percent chance may be a "pretty even chance," 83 percent or so may mean a "very
good chance," 95 or 98 percent chance may be "almost certain."
Q134.1 The next few questions are about economic output.
Over the next 12 months, do you think that there will be an increase or decrease in GDP?
o Increase (1)
o Decrease (2)
Q134.2I What do you expect the rate of increase in GDP to be over the next 12 months? Please give your best guess.
I expect the rate of increase to be ___ percent over the next 12 months.
Q134.2D What do you expect the rate of decrease in GDP to be over the next 12 months? Please give your best guess.
I expect the rate of decrease to be ___ percent over the next 12 months.
QA1.1 In your view, will the total income of all members of your household (including you), after taxes and deductions,
increase or decrease over the next 12 months?
o Increase (4)
o Decrease (5)
QA1.2I By how much do you expect total income of all members of your household to increase over the next 12 months?
Please give your best guess.
Over the next 12 months, I expect total income of all members of my household to increase by ___ percent.
36
QA1.2D By how much do you expect total income of all members of your household to decrease over the next 12
months? Please give your best guess.
Over the next 12 months, I expect total income of all members of my household to decrease by ___ percent.
Q11.1 The next few questions are about inflation.
Over the next 12 months, do you think that there will be inflation or deflation?
o Inflation (1)
o Deflation (opposite of inflation) (2)
Q11.2I What do you expect the rate of inflation to be over the next 12 months? Please give your best guess.
I expect the rate of inflation to be ___ percent over the next 12 months.
Q11.2D What do you expect the rate of deflation to be over the next 12 months? Please give your best guess.
I expect the rate of deflation to be ___ percent over the next 12 months.
Q13 Now we would like you to think about what may happen to inflation over the next 12 months. We realize that this
question may take a little more effort. In your view, what would you say is the percent chance that, over the next 12
months. . .
the rate of inflation will be 12% or higher : _______ (1)
the rate of inflation will be between 8% and 12% : _______ (2)
the rate of inflation will be between 4% and 8% : _______ (3)
the rate of inflation will be between 2% and 4% : _______ (4)
the rate of inflation will be between 0% and 2% : _______ (5)
the rate of deflation (opposite of inflation) will be between 0% and 2% : _______ (6)
the rate of deflation (opposite of inflation) will be between 2% and 4% : _______ (7)
the rate of deflation (opposite of inflation) will be between 4% and 8% : _______ (8)
the rate of deflation (opposite of inflation) will be between 8% and 12% : _______ (9)
the rate of deflation (opposite of inflation) will be 12% or higher : _______ (10)
Total : ________
37
Q15.1 Now we would like you to think about inflation further into the future. Over the 12-month period between
September 2022 and September 2023 do you think that there will be inflation or deflation?
o Inflation (1)
o Deflation (opposite of inflation) (2)
Q15.2I What do you expect the rate of inflation to be over the 12-month period between September 2022 and September
2023? Please give your best guess.
I expect the rate of inflation to be ___ percent.
Q15.2D What do you expect the rate of deflation to be over the 12-month period between September 2022 and September
2023? Please give your best guess.
I expect the rate of deflation to be ___ percent.
Q164 Compared with your normal level of spending before the coronavirus outbreak in, say, January or February, what
percentage of that level of spending did you do or do you anticipate doing in the following months?
Essentially None About the same Double or much
higher
0 20 40 60 80 100 120 140 160 180 200
July ()
August ()
September ()
38
QJH1 How do you usually get news about the economy? Select all that apply.12
▢ Official sources (like the web pages of the government, statistical agencies, or the Federal Reserve Banks) (1)
▢ Articles in either general-interest newspapers or specialized economics and finance newspapers, online or in print
(like the USA Today, New York Times, Wall Street Journal, Economist) (2)
▢ Twitter, Facebook, or other social media (3)
▢ News or other programs on television and radio (5)
▢ Coworkers (7)
▢ Friends and relatives (8)
▢ Other internet sources (blogs, discussion forums) (4)
▢ I did not come across any information on economic and business conditions (9)
▢ Another source: (10) ______________________________________________
12 Immediately before this question is a block of questions related to the COVID-19 outbreak.
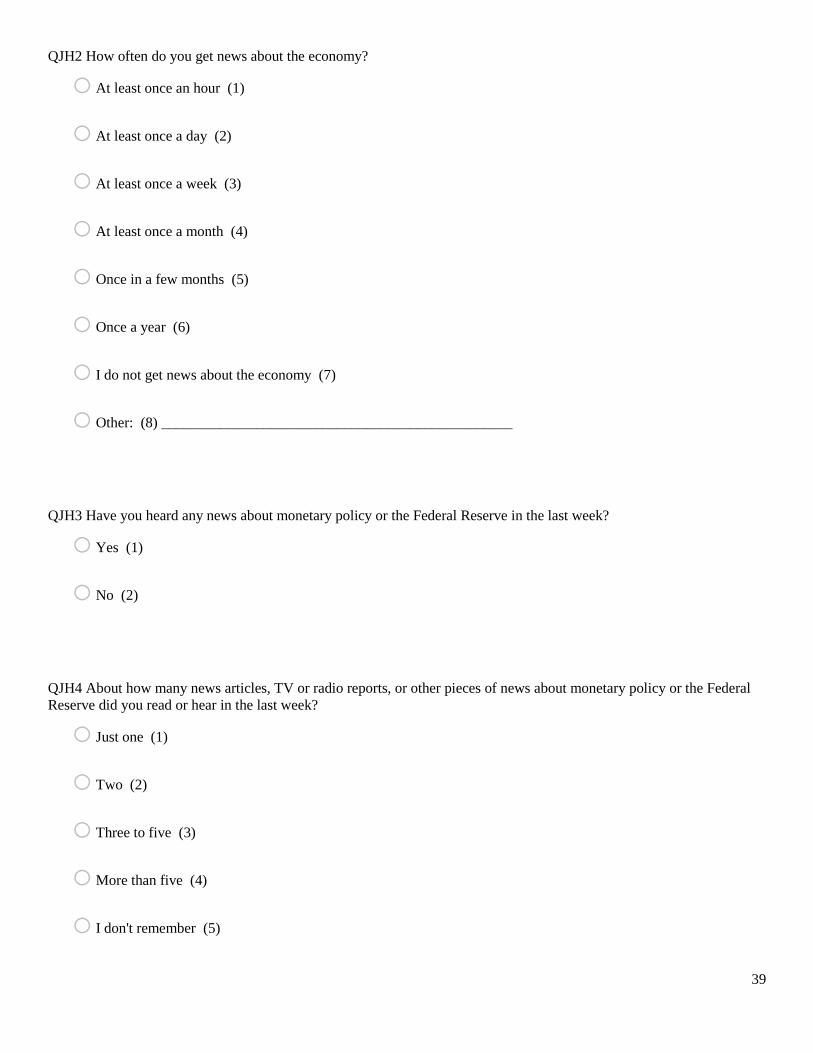
39
QJH2 How often do you get news about the economy?
o At least once an hour (1)
o At least once a day (2)
o At least once a week (3)
o At least once a month (4)
o Once in a few months (5)
o Once a year (6)
o I do not get news about the economy (7)
o Other: (8) ________________________________________________
QJH3 Have you heard any news about monetary policy or the Federal Reserve in the last week?
o Yes (1)
o No (2)
QJH4 About how many news articles, TV or radio reports, or other pieces of news about monetary policy or the Federal
Reserve did you read or hear in the last week?
o Just one (1)
o Two (2)
o Three to five (3)
o More than five (4)
o I don't remember (5)
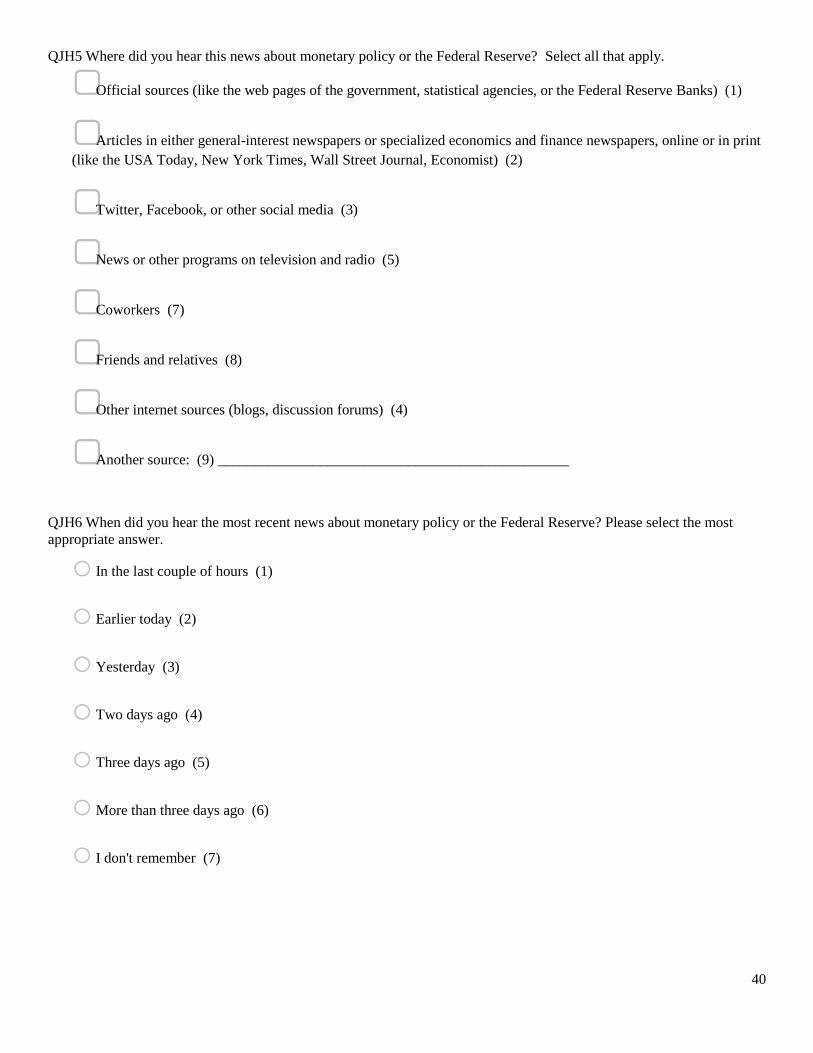
40
QJH5 Where did you hear this news about monetary policy or the Federal Reserve? Select all that apply.
▢ Official sources (like the web pages of the government, statistical agencies, or the Federal Reserve Banks) (1)
▢ Articles in either general-interest newspapers or specialized economics and finance newspapers, online or in print
(like the USA Today, New York Times, Wall Street Journal, Economist) (2)
▢ Twitter, Facebook, or other social media (3)
▢ News or other programs on television and radio (5)
▢ Coworkers (7)
▢ Friends and relatives (8)
▢ Other internet sources (blogs, discussion forums) (4)
▢ Another source: (9) ________________________________________________
QJH6 When did you hear the most recent news about monetary policy or the Federal Reserve? Please select the most
appropriate answer.
o In the last couple of hours (1)
o Earlier today (2)
o Yesterday (3)
o Two days ago (4)
o Three days ago (5)
o More than three days ago (6)
o I don't remember (7)
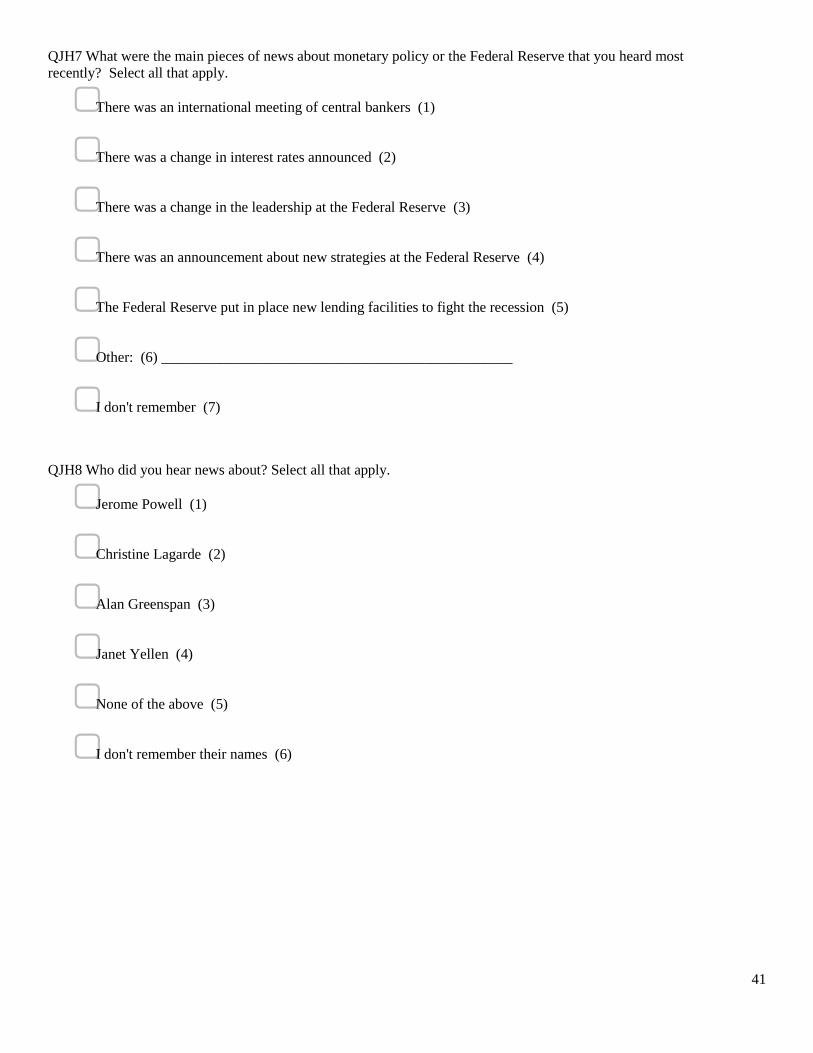
41
QJH7 What were the main pieces of news about monetary policy or the Federal Reserve that you heard most
recently? Select all that apply.
▢ There was an international meeting of central bankers (1)
▢ There was a change in interest rates announced (2)
▢ There was a change in the leadership at the Federal Reserve (3)
▢ There was an announcement about new strategies at the Federal Reserve (4)
▢ The Federal Reserve put in place new lending facilities to fight the recession (5)
▢ Other: (6) ________________________________________________
▢ I don't remember (7)
QJH8 Who did you hear news about? Select all that apply.
▢ Jerome Powell (1)
▢ Christine Lagarde (2)
▢ Alan Greenspan (3)
▢ Janet Yellen (4)
▢ None of the above (5)
▢ I don't remember their names (6)

42
QJH9 In terms of the Federal Reserve’s broad economic objectives, what do you think it views as most important among
the following? Please select up to 2.
▢ Keeping interest rates low to reduce the government’s cost of borrowing (1)
▢ Promoting maximum employment (2)
▢ Keeping stock prices high (3)
▢ Bailing out failing financial institutions (4)
▢ Ensuring price stability (5)
▢ Maintaining a strong dollar (6)
▢ Reducing economic inequality (7)
▢ Fighting climate change (8)
QJH10 In terms of prices in the economy, which do you think best represents what the Federal Reserve is trying to
do? Select all that apply.
▢ Keep the inflation rate as close as possible to a specific target at all times (1)
▢ Make inflation, on average, be approximately equal to a target rate (2)
▢ Keep prices from rising over time (3)
▢ Ensure inflation is sufficiently high to erode the value of government debt (4)
▢ Keep the inflation rate low enough to promote a strong dollar (5)
▢ None of the above (6)
▢ I don't know (7)
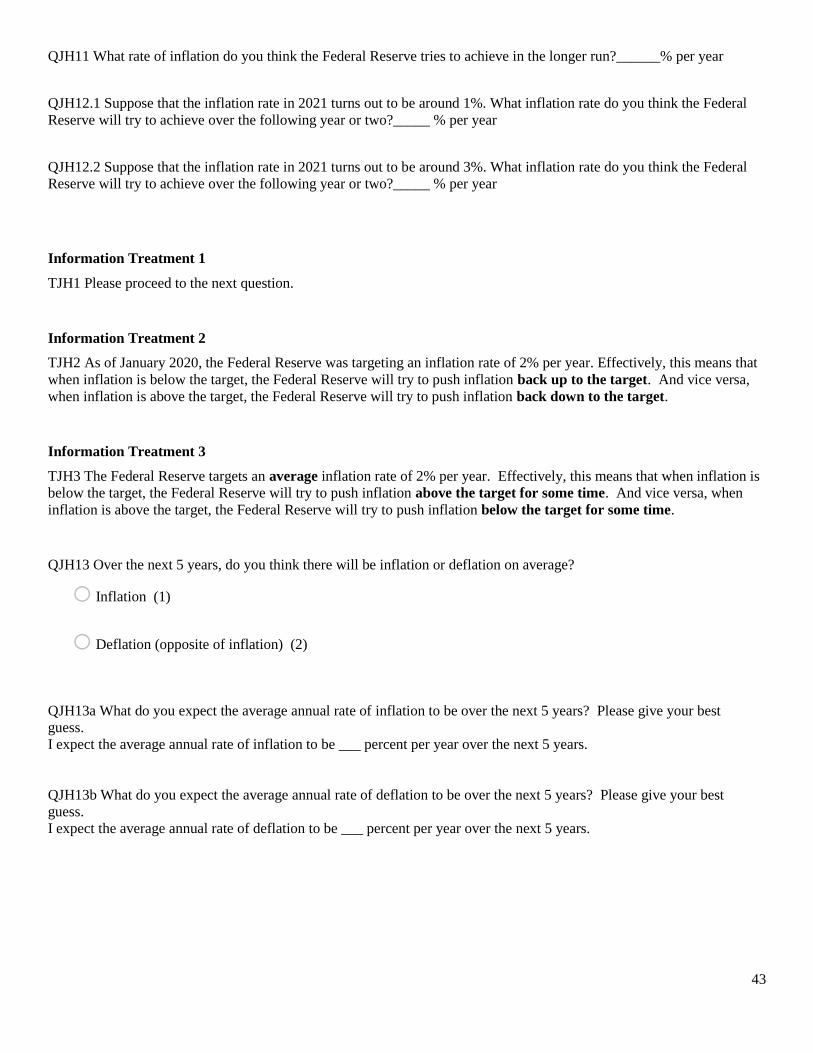
43
QJH11 What rate of inflation do you think the Federal Reserve tries to achieve in the longer run?______% per year
QJH12.1 Suppose that the inflation rate in 2021 turns out to be around 1%. What inflation rate do you think the Federal
Reserve will try to achieve over the following year or two?_____ % per year
QJH12.2 Suppose that the inflation rate in 2021 turns out to be around 3%. What inflation rate do you think the Federal
Reserve will try to achieve over the following year or two?_____ % per year
Information Treatment 1
TJH1 Please proceed to the next question.
Information Treatment 2
TJH2 As of January 2020, the Federal Reserve was targeting an inflation rate of 2% per year. Effectively, this means that
when inflation is below the target, the Federal Reserve will try to push inflation back up to the target. And vice versa,
when inflation is above the target, the Federal Reserve will try to push inflation back down to the target.
Information Treatment 3
TJH3 The Federal Reserve targets an average inflation rate of 2% per year. Effectively, this means that when inflation is
below the target, the Federal Reserve will try to push inflation above the target for some time. And vice versa, when
inflation is above the target, the Federal Reserve will try to push inflation below the target for some time.
QJH13 Over the next 5 years, do you think there will be inflation or deflation on average?
o Inflation (1)
o Deflation (opposite of inflation) (2)
QJH13a What do you expect the average annual rate of inflation to be over the next 5 years? Please give your best
guess.
I expect the average annual rate of inflation to be ___ percent per year over the next 5 years.
QJH13b What do you expect the average annual rate of deflation to be over the next 5 years? Please give your best
guess.
I expect the average annual rate of deflation to be ___ percent per year over the next 5 years.

44
QJH14 Over the next 5 years, do you think that there will be an increase or decrease in GDP on average?
o Increase (1)
o Decrease (2)
QJH14a What do you expect the average annual rate of increase in GDP will be over the next 5 years? Please give your
best guess.
I expect the average annual rate of increase to be ___ percent per year over the next 5 years.
QJH14b What do you expect the average annual rate of decrease in GDP will be over the next 5 years? Please give your
best guess.
I expect the average annual rate of decrease to be ___ percent per year over the next 5 years.
QJH15 In your view, will the total income of all members of your household (including you), after taxes and deductions,
increase or decrease over the next 5 years on average?
o Increase (1)
o Decrease (2)
QJH15a What do you expect the average annual rate of increase in the total income of all members of your household will
be over the next 5 years? Please give your best guess.
I expect the average annual rate of increase in the total income of all members of my household to be ___ percent per year
over the next 5 years.
QJH15b What do you expect the average annual rate of decrease in the total income of all members of your household
will be over the next 5 years? Please give your best guess.
I expect the average annual rate of decrease in the total income of all members of my household to be ___ percent per year
over the next 5 years.
45
QJH16 When do you expect that mortgage rates will start to rise in a significant way?
o Second half of 2020 (1)
o First half of 2021 (2)
o Second half of 2021 (3)
o Sometime in 2022 (4)
o Sometime in 2023 (5)
o In 2024 or later (6)
o They are unlikely to rise (7)
o Not sure (8)
QJH17 How would you rate the credibility of the Federal Reserve in terms of its ability to achieve maximum employment
and stable prices?
Very low credibility Very high credibility
0 10 20 30 40 50 60 70 80 90 100
Rating ()
QJH18 What do you think is the chance that inflation will be more than 5% in the next 12 months?
No chance Sure thing
0 10 20 30 40 50 60 70 80 90 100
Probability ()

46
Q27 Which fraction of your income do you invest?
o I spend more money than I earn. I often use credit cards or other loans to supplement my monthly income (1)
o I spend all of my income each month (2)
o I save around 10% of my monthly income (3)
o I save around 25% of my monthly income (4)
o I save at least 50% of my monthly income (5)
Q53 What is your civil status?
o Single (1)
o Partner (not co-habiting) (2)
o Partner (co-habiting) (3)
o Married (4)
o Divorced (5)
o Widowed (6)
Q121 What would you say is your political affiliation?
o Democrat (1)
o Independent (2)
o Republican (3)
o Other (4)
Q54 How many children do you have?
________________________________________________________________
47
Q55 What is the percent chance that you will leave any inheritance?
________________________________________________________________