working capital study 20/21: react to recover
TRANSCRIPT

pwc.co.uk/services/business-restructuring#ActNowToRecover
Working Capital Study 20/21: Act Now to Recover

Contents
Executive summary 1
Were companies ready for the pandemic from a cash perspective 3
How has the COVID-19 pandemic changed the working capital landscape? 10
Where the pandemic hurt the most 12
It will get worse before it gets better 16
The road ahead: cash must become a longer-term prerogative 17
The role of trade and supply chain financing: a view from the market 19
How we can help 21
Authors 22
Contacts 23

Daniel Windaus Partner, PwC UK
Stephen Tebbett Partner, PwC UK
Why it matters
The COVID-19 pandemic has brought the importance of cash and working capital sharply into focus.
As economies emerge from their initial lockdown periods, the route to recovery is unlikely to be smooth, and businesses need to be in the best possible shape for the journey. Economic conditions will most likely remain challenging for the foreseeable future. This means a laser-like focus on liquidity, including the optimisation of working capital, is vital to navigating the months ahead.
Every year, PwC UK reviews the financial performance of some of the largest global companies. This year’s review included 19,547 companies, assessing their working capital performance and related key indicators. In this year's report, we have continued to review five-year trends (2015 – 2019), as well as increasing the sample size of our research to include smaller business. We have also looked at shifts in performance on a quarterly basis to highlight the impact that the COVID-19 pandemic has had on working capital and liquidity in 2020.
Across sectors, there has been a rapid shift in working capital requirements, driven by disruptions of both supply and demand. Normal lead times and replenishment frequencies are elongated even for regional supply chains, meaning safety stock and inventory policies need to be adapted. Payment morale, as well as credit worthiness and insurability, are continuing to impact the ability to get paid or trade. As economies come out of lockdown and start back up, the drain on working capital will likely get worse before it gets better. Looking ahead, many of the ‘business as usual’ processes to manage working capital will therefore need to be reconfigured.
Executive summary
1Working Capital Study 20/21: Act Now to Recover

increase in NWC days from Q2 2019 to Q2 2020
5 daysincrease in inventory days to Q2 2020
+15 %with deteriorating performance in NWC days to Q2 2020
14/17 sectors
What’s the story?Companies saw working capital improvements at the end of 2019, which were fortuitous in light of the cash drain in Q2 2020. However, inventory is the only dimension of working capital that deteriorated from the previous year, and overall debt ratios were the highest in five years going into the pandemic.
The impact of the COVID-19 pandemic has been significant. A quarterly comparison between Q2 2020 and Q2 2019 shows that revenue has decreased by 16%. In comparison, tied up cash in businesses’ working capital has reduced by only 6%, leading to a five day increase in net working capital (NWC) days. The most significant shift is visible in inventory, where inventory holding days increased a further eight days, representing a swing of 15% year-on-year.
Three quarters of all sectors have seen a deterioration in working capital performance in the second quarter of 2020 compared to 2019. Four sectors in particular have suffered double digit increases in working capital days, including aerospace, automotive, hospitality and leisure, and industrial manufacturing.
To date, Europe looks to be the hardest hit region based on the financials of companies surveyed. Revenues for European companies have declined by 23% in Q2 2020 compared to the same quarter in 2019. Moreover, working capital performance has deteriorated by eight days in the same period.
As economies come out of lockdown, the pull on working capital is likely going to get worse before it gets better, especially in producing industries or highly seasonal sectors, where there will be a lag between the cash outflows from sourcing materials and producing inventories ready to sell, and the cash collected from sales. Ensuring operational working capital processes and accurate cash flow forecasting will be key for the next six to twelve months.
1 4
52
3
2 PwC

The best way to weather a storm is to be prepared. Strong liquidity and working capital performance provide companies with the stamina to face any headwinds. So how prepared were companies ahead of the pandemic? This year, we have increased the sample size of our analysis to include companies with revenues above €50m. Our research has revealed that while working capital had increased by €100bn (1.7%) in 2019, working capital performance improved year-on-year, with a 0.6 day reduction in NWC days to 42.4 days. This resulted in working capital days returning to a level of performance last achieved in 2015. The improvement of 0.6 days meant companies freed €81bn from their balance sheets. Globally, companies have been more focused on working capital and provided themselves some well needed breathing space going into the COVID-19 pandemic.
This shift has been driven primarily by improvements in days sales outstanding (DSO), which is a measure of trade receivables performance. DSO has improved over the last two years, and represented the best performance for four years ahead of the COVID-19 pandemic.
Additionally, days payables outstanding (DPO), measuring payables performance, has also improved slightly, after two years of contraction from the 2016 high. We mentioned in previous reports that the reliance on stretching creditor days was not a sustainable long-term or ethical solution, and with supply chain resilience coming more into focus through the pandemic, the need to ensure a balanced approach will continue.
Inventory is the only dimension of working capital that has deteriorated from the previous year, with days inventory outstanding (DIO) increasing marginally to 57.3 days. In our experience, inventory is also the slowest indicator to react to large swings in demand, and long supply chains can be slow to react – especially where materials and products are sourced globally, with long lead times.
While there has been an improvement in performance over the last year, we believe the total global cash opportunity that companies could release, through better working capital management and eliminating excess, is €1.5 trillion. This would give companies further breathing space and ability to weather further shocks.
14/17 sectors
Were companies ready for the pandemic from a cash perspective?
Net working capital and working capital days
42.4 days
43.1 days
4.7 5.2 5.6 5.7
43.2 days
43 days
42.4 days
4.5
2015 2016 2017 2018 2019
NWC days NWC total €tr
3Working Capital Study 20/21: Act Now to Recover

DSO, DIO and DPO trend
While the companies we surveyed performed the best in four years when it came to generating cash from operations relative to revenue, no other data point is as reassuring. Companies showed lower margins in 2019, with a four-year low in performance. Additionally, debt was high in 2019 compared to earnings before interest, tax, depreciation and amortisation (EBITDA): going into the pandemic, and before any extraordinary measures or loans, the relative level of debt that companies needed to service was already high.
In recent years, we have seen companies accumulating significant cash reserves, with the value of cash on hand increasing from €5.1 trillion to €6.4 trillion over the last five years. While this cash on balance sheets will provide some breathing space, it only represents enough cash to cover operating expenses for 52 days on average, the same number of days as 2015.
DSO
2.70.4
-1.0 -0.4
47.6
50.3 50.749.7 49.2
DIO
2.5
-1.3 -1.0
0.2
56.959.5 58.1 57.1 57.3
DPO
2015 2016 2017 2018 2019
5.4
-1.0 -2.2
0.4
64.2
69.668.6
66.4 66.8
Days change year on year
4 PwC

Liquidity and resilience trend
2.3 2.3 2.1 2.1 2.5
12.3%11.5% 11.9% 12.4%12.5%
2015 2016 2017 2018 2019
14.5%14.9% 15.0%
14.4%14.0%
Net Debt/EBITDA EBITDA Margin Ops Cash Flow/Rev
5Working Capital Study 20/21: Act Now to Recover
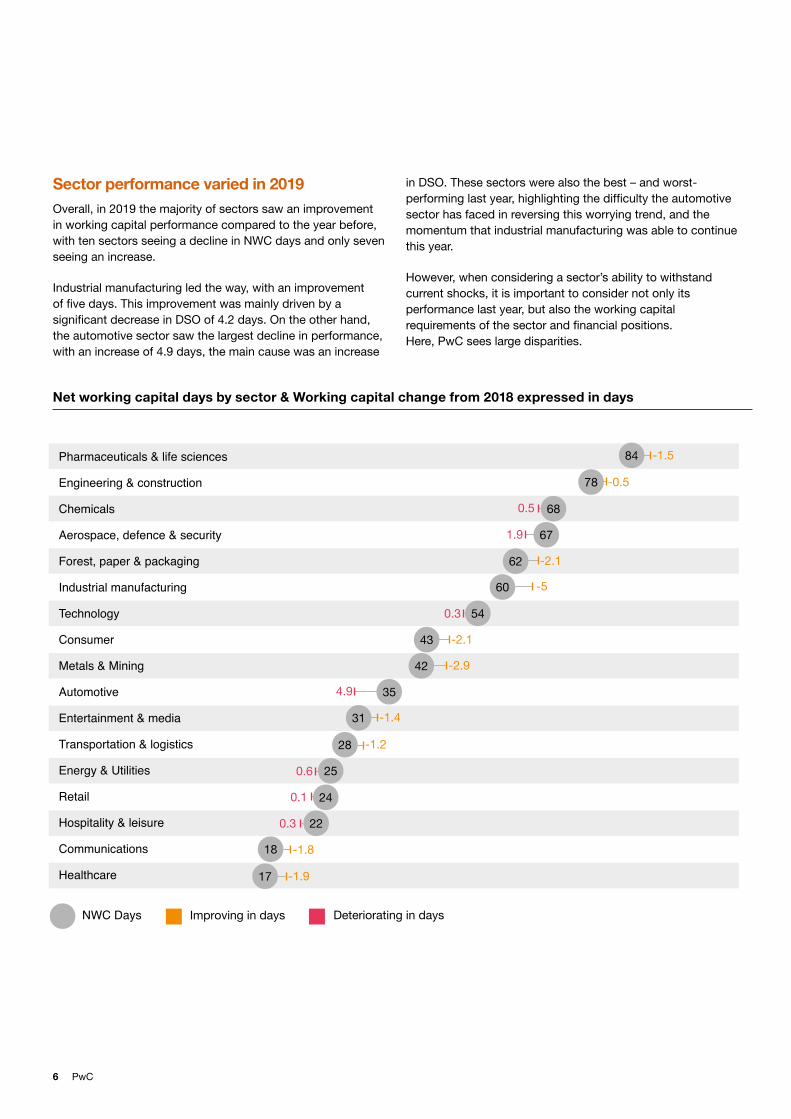
Sector performance varied in 2019Overall, in 2019 the majority of sectors saw an improvement in working capital performance compared to the year before, with ten sectors seeing a decline in NWC days and only seven seeing an increase.
Industrial manufacturing led the way, with an improvement of five days. This improvement was mainly driven by a significant decrease in DSO of 4.2 days. On the other hand, the automotive sector saw the largest decline in performance, with an increase of 4.9 days, the main cause was an increase
in DSO. These sectors were also the best – and worst-performing last year, highlighting the difficulty the automotive sector has faced in reversing this worrying trend, and the momentum that industrial manufacturing was able to continue this year.
However, when considering a sector’s ability to withstand current shocks, it is important to consider not only its performance last year, but also the working capital requirements of the sector and financial positions. Here, PwC sees large disparities.
Pharmaceuticals & life sciences
Engineering & construction
Chemicals
Aerospace, defence & security
Forest, paper & packaging
Industrial manufacturing
Technology
Consumer
Metals & Mining
Automotive
Entertainment & media
Transportation & logistics
Energy & Utilities
Retail
Hospitality & leisure
Communications
Healthcare
84
NWC Days Deteriorating in daysImproving in days
78
68
62
60
54
31
28
25
24
22
18
17
-1.5
-0.5
0.5
1.9
-2.1
-5
0.3
-2.1
-2.9
4.9
-1.4
-1.2
0.6
0.1
0.3
-1.8
-1.9
35
43
42
67
Net working capital days by sector & Working capital change from 2018 expressed in days
6 PwC

Asset days/DPO days
Deterioration in NWCD 2018 to 2019Improvement in NWCD 2018 to 2019
Aerospace, defence & security
Automotive
Chemicals
Communications
Consumer
Energy & Utilities
Engineering & construction
Entertainment & media
Forest, paper & packaging
Healthcare
Hospitality & leisure
Industrial manufacturing
Metals & Mining
Pharmaceuticals & life sciences
Retail
Technology
Transportation & logistics
Di�erence in NWC Days from the '2018' along Relative Filing Period1
Diff
eren
ce in
DPO
-4
-3
-1
0
-2
-5
-6
3
4
6
5
2
1
Difference in Asset Days
-1.0 0.0 1.0-2.0-3.0-4.0-5.0 2.0 3.0 4.0 5.0
Automotive
Industrial manufacturing
Healthcare
Pharmaceuticals & life sciences
Entertainment& media
Forest, paper & packaging
Hospitality & leisure
Retail
Transportation & logistics
Technology
Metals & MiningEngineering & construction
Energy & Utilities
Consumer
Communications
Chemicals
Aerospace, defence& secutity
7Working Capital Study 20/21: Act Now to Recover

The troubles of the automotive sector have been well documented over the past couple of years and the sector came into 2020 in a poor position. The sector is highly leveraged with net debt to EBITDA of 3.5x, as well as low profit margins and operating cash flow generation of only 7.9% of revenue. This poor financial position is coupled with a relatively high working capital requirement of 34.5 days, which has been increasing in recent years.
Retail similarly entered 2020 on the back of a tough couple of years, and this is reflected in our analysis, with the sector having the second-lowest margin, and a sharp increase in
leverage to 2.3x (in 2018 this was 1.5x net debt/EBITDA). The sector also only has 30 days of cash on hand, lower than the 52 days average across the study. However, unlike the automotive sector, it has a relatively low working capital requirement of 24 days.
At the other end of the spectrum, the technology sector entered the year well positioned to weather the pandemic. Due to large cash balances, the sector has very low net debt and enough to cover operating expenses for 82 days.
Sector liquidity and financial performance
Aerospace, defence & security
Automotive
Chemicals
Communications
Consumer
Energy & Utilities
Engineering & construction
Entertainment & media
Forest, paper & packaging
Healthcare
Hospitality & leisure
Industrial manufacturing
Metals & Mining
Pharmaceuticals & life sciences
Retail
Technology
Transportation & logistics 1.5
0.1
2.3
1.4
2.9
4.1
3.3
2.4
3.1
2.9
2.5
2.9
1.9
2.2
2.4
3.5
2.8
0 1 2 3 4 5
9.8%
18.0%
9.0%
23.6%
12.4%
12.8%
16.4%
9.0%
14.3%
14.8%
9.8%
19.5%
13.5%
24.4%
13.2%
8.8%
12.6%
0 10 20 30
Ops Cash Flow/Rev Net Debt/EBITDA EBITDA Margin Cash Days (to opex)
84.9
82.5
29.6
91.9
46.8
60.7
55.5
29.8
42.9
69.7
65.7
35.4
50.4
64.2
46.0
45.1
58.3
0 20 40 60 80 100
8.7%
17.1%
7.6%
18.8%
10.2%
11.9%
14.5%
7.3%
11.8%
10.8%
6.5%
15.9%
11.0%
23.2%
11.7%
7.9%
12.2%
0 10 20 30
42.9
8 PwC

9Working Capital Study 20/21: Act Now to Recover
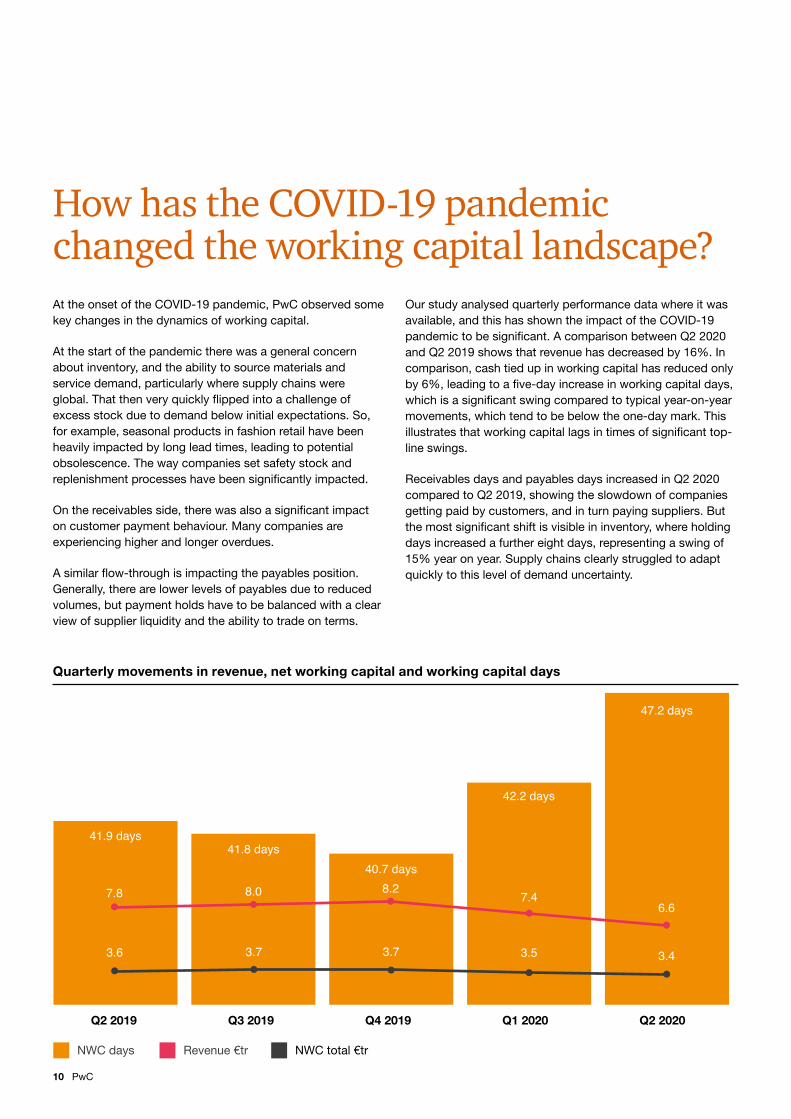
At the onset of the COVID-19 pandemic, PwC observed some key changes in the dynamics of working capital.
At the start of the pandemic there was a general concern about inventory, and the ability to source materials and service demand, particularly where supply chains were global. That then very quickly flipped into a challenge of excess stock due to demand below initial expectations. So, for example, seasonal products in fashion retail have been heavily impacted by long lead times, leading to potential obsolescence. The way companies set safety stock and replenishment processes have been significantly impacted.
On the receivables side, there was also a significant impact on customer payment behaviour. Many companies are experiencing higher and longer overdues.
A similar flow-through is impacting the payables position. Generally, there are lower levels of payables due to reduced volumes, but payment holds have to be balanced with a clear view of supplier liquidity and the ability to trade on terms.
Our study analysed quarterly performance data where it was available, and this has shown the impact of the COVID-19 pandemic to be significant. A comparison between Q2 2020 and Q2 2019 shows that revenue has decreased by 16%. In comparison, cash tied up in working capital has reduced only by 6%, leading to a five-day increase in working capital days, which is a significant swing compared to typical year-on-year movements, which tend to be below the one-day mark. This illustrates that working capital lags in times of significant top-line swings.
Receivables days and payables days increased in Q2 2020 compared to Q2 2019, showing the slowdown of companies getting paid by customers, and in turn paying suppliers. But the most significant shift is visible in inventory, where holding days increased a further eight days, representing a swing of 15% year on year. Supply chains clearly struggled to adapt quickly to this level of demand uncertainty.
How has the COVID-19 pandemic changed the working capital landscape?
Quarterly movements in revenue, net working capital and working capital days
41.9 days
40.7 days
42.2 days
47.2 days
8.0 8.27.4
6.67.8
Q2 2019 Q3 2019 Q4 2019 Q1 2020 Q2 2020
3.7 3.7 3.5 3.43.6
41.8 days
NWC days Revenue €tr NWC total €tr
10 PwC

Days change quarter on quarter
Q2 2019 Q3 2019 Q4 2019 Q1 2020 Q2 2020
-0.9-2.1
3.1 3.6
48.6 47.745.6
48.752.3
DSO
0.7
-2.4
3.5
6.2
52.9 53.751.2
54.7
60.9DIO
-0.2-4.0
5.6 4.2
62.6 62.358.3
63.968.1DPO
Quarterly DSO, DIO and DPO trend
11Working Capital Study 20/21: Act Now to Recover

The COVID-19 pandemic’s impact on business varies significantly by industry and location. Working capital performance and supply chain resilience differ greatly by industry, with sectors like industrial manufacturing consuming 60 days of working capital on average, compared to retail at 24 days. The impact on demand has also varied significantly across sectors, and even individual businesses.
On the whole, every sector has felt similar decreases in revenue and an inability to decrease working capital to match, leading to an increase in NWC days. Four sectors – aerospace, automotive, industrial manufacturing and hospitality and leisure – stand out due to double-digit growth in NWC days between Q2 2019 and Q2 2020.
While industrial manufacturing experienced the largest improvement in 2019, it has been hit hard by the early phases of the COVID-19 pandemic, with an 11-day year-on-year increase in NWC days to 76 days in Q2 2020. The sector saw a decline in performance due to an eight-day increase in DIO. This increase is likely to have been driven by supply chain disruption and a drop in demand, meaning inventories have built up.
Automotive continued its trend of poor performance in 2019 into 2020 with a 22-day (45%) increase in NWC days from Q2 2019. Again, this has been driven by a 20-day increase in DSO and 25-day increase in DIO, although somewhat offset by successfully delaying non-essential payments to suppliers, which can be seen by a 12-day increase in DPO.
While traditionally, the hospitality and leisure industry has a relatively low working capital requirement, it has experienced significant disruption from the pandemic and is likely to take a while to fully recover. DSO has grown by 61% over the year to 37 days in Q2 2020: this has been the main contributor to the increase in NWC days to 37 (Q2 2019: 20 days). The sector needs to ensure robust collection practices are in place to ensure the increase in DSO does not lead to irrecoverable debts and bad debt charges in the future.
Unsurprisingly, due to the impact of the pandemic on travel and airlines in particular, the Aerospace sector has experienced the most significant decrease in net working capital performance with a 77-day increase in NWC days to 153 (Q2 2019: 76 days). The sector has seen a 47% reduction in revenue from 2019 and has not been able to reduce working capital to compensate for this shock, and has experienced significant increases in both DSO and DIO.
Where the pandemic hurt the most
12 PwC

Where the pandemic hurt the mostChange in revenue and NWC days between Q2 2019 and Q2 2020 by sector
Aerospace, defence & security
Automotive
Hospitality & leisure
Industrial manufacturing
Energy & Utilities
Chemicals
Metals & Mining
Entertainment & media
Engineering & construction
Forest, paper & packaging
Transportation & logistics
Consumer
Pharmaceuticals & life sciences
Retail
Technology
Healthcare
Communications
-3
-39%
-45%
-18%
-38%
-14%
-20%
-23%
-9%
-11%
-4%
0.5
-6%
-8%
-1
-4
77
31
17
11
8
6
6
5
3
2
1
0
1
1%
-47%
Q2 2019 to 2020 change in revenue (%)
Q2 2019 to 2020 change change in NWC days
1%
1%
6%
13Working Capital Study 20/21: Act Now to Recover

Size has not been an advantage during the COVID-19 pandemicThe actual or perceived differences in working capital in smaller companies has long been in focus. Our working capital studies from previous years have shown that working capital days tend to be higher for small and mid-sized companies compared to larger corporates. While this fact still holds true, available quarterly data shows that the impact of the COVID-19 pandemic on larger organisations has been more profound compared to smaller companies. This may be driven by a combination of smaller supply chains and lower levels of organisational complexity.
However, while the rain seems to have fallen less heavily for smaller companies, this needs to be considered in the context of a lesser ability to buffer liquidity shortfalls through external liquidity, be that via debt packages or equity raises.
Small Company<€500m Revenue
Q2 2019 to 2020 change in revenue (%) Q2 2019 to 2020 change in NWC days
-11% 7
-12%
-17% 5
Medium Company€500m – €1bn Revenue
Large Company>€1bn Revenue
6
Change in revenue and NWC days between Q2 2019 and Q2 2020 by size
14 PwC
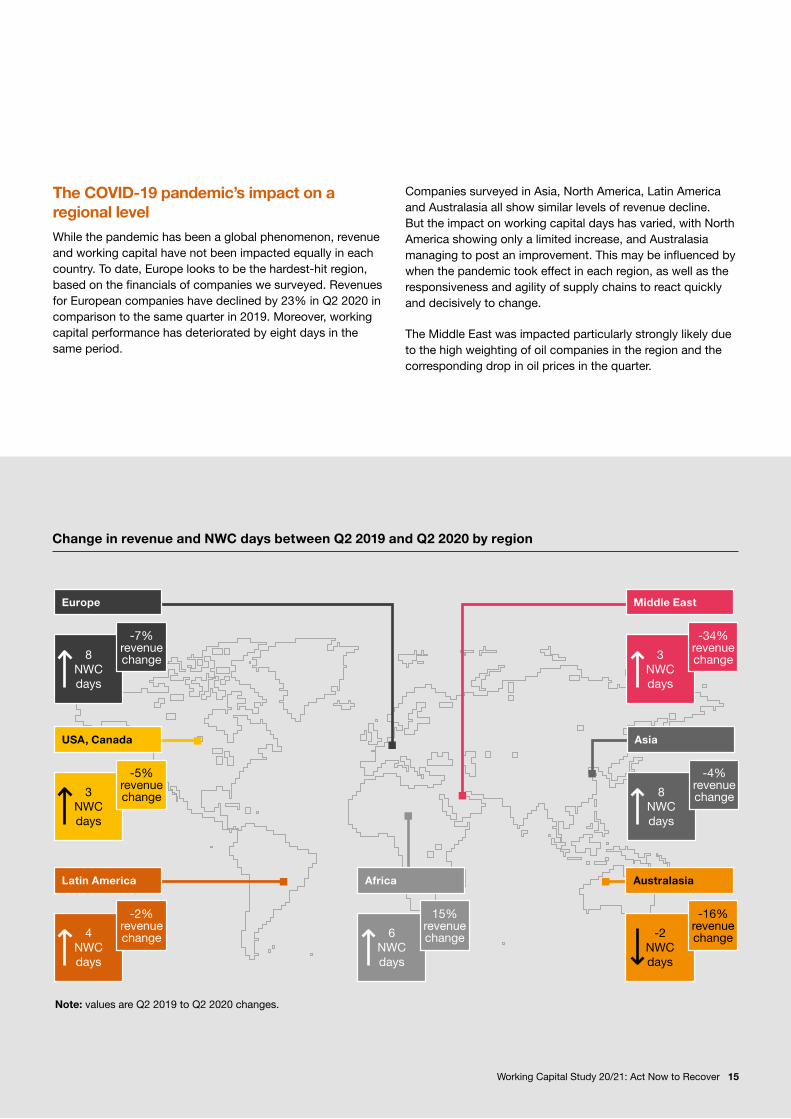
The COVID-19 pandemic’s impact on a regional levelWhile the pandemic has been a global phenomenon, revenue and working capital have not been impacted equally in each country. To date, Europe looks to be the hardest-hit region, based on the financials of companies we surveyed. Revenues for European companies have declined by 23% in Q2 2020 in comparison to the same quarter in 2019. Moreover, working capital performance has deteriorated by eight days in the same period.
Companies surveyed in Asia, North America, Latin America and Australasia all show similar levels of revenue decline. But the impact on working capital days has varied, with North America showing only a limited increase, and Australasia managing to post an improvement. This may be influenced by when the pandemic took effect in each region, as well as the responsiveness and agility of supply chains to react quickly and decisively to change.
The Middle East was impacted particularly strongly likely due to the high weighting of oil companies in the region and the corresponding drop in oil prices in the quarter.
Change in revenue and NWC days between Q2 2019 and Q2 2020 by region
8NWCdays
Europe
-7%revenue change 3
NWCdays
Middle East
-34%revenue change
3NWCdays
USA, Canada
-5%revenue change 8
NWCdays
Asia
-4%revenue change
4NWCdays
Latin America
-2%revenue change -2
NWCdays
Australasia
-16%revenue change6
NWCdays
Africa
15%revenue change
Note: values are Q2 2019 to Q2 2020 changes.
15Working Capital Study 20/21: Act Now to Recover

Many of the ‘business as usual’ processes to manage working capital are simply not fit for purpose when it comes to dealing with the fast-changing and volatile nature of the pandemic. However, the incentive schemes instigated by governments around the world to support local economies has helped delay, if not avert, the likely cash crunch. As economies come out of lockdown and start back up, the drain on working capital is expected to get worse before it gets better. This will be felt especially keenly in producing industries or highly seasonal sectors, where there will be a lag between the cash out (from sourcing materials and producing inventories ready to sell), and the cash collected from sales.
The lag between cash position and the impact on the P&L is difficult to predict, but looking at the working capital cycle provides some insights. To service potential future demand, companies will have to attempt to forecast that demand, order necessary materials while accounting for uncertainty in lead times, produce and hold the inventory, and then wait for payment. Especially in a more optimistic rebound scenario, the medium-term drain on cash will be significant.
The theoretical model above illustrates the impact a typical company might experience during the pandemic and the relationship between revenue, net working capital and cash. As the impact of the COVID-19 pandemic was first felt, a company typically saw a sharp decline in revenue. However, companies weren’t able to reduce their net working capital at the same rate, leading to a much shallower decline in NWC.
As companies recover from the initial shock and pursue growth again, they must fight the tendency to overinvest, leading to a growth in net working capital. The dynamics between the two may be key for companies to translate top line recovery into cash. As the illustration shows, there is a significant lag in converting sales to cash – around 42 days for companies in our study at the end of 2019. Any overinvestment in working capital will cause a further delay between returning to growth and converting this to cash. There is also the risk there will be a permanent increase in net working capital, meaning cash is tied up on the balance sheet. In previous pandemics like SARS and MERS, in the Global Financial Crisis and the aftermath of the September 11 attacks, many companies focused on top line return and cost base and inadvertently stumbled into a cash crisis.
It will get worse before it gets better
Relationship between revenue, NWC and cash during recovery
Time
Valu
e (€
)
Revenue
NWC overinvestment NWC normal investment
Cash
Cashpinchpoint
Cash decline
16 PwC

The uncertainty and rapidly-changing working capital requirements created by the COVID-19 pandemic required a focus on short-term liquidity as part of the immediate pandemic response in Q2 2020. As economies exit lockdown and consumption returns, businesses need to reconfigure operational processes to ensure they are fit-for-purpose and can deal with increased uncertainty.
The road ahead: cash must become a longer-term prerogative
• Understand impacts• Ensure business continuity• Short term cash
forecasting• Engage Stakeholders
• Protect liquidity• Manage supply impacts• Short term payment
controls• Bolster credit collection
efforts
• Identify forward working capital profile
• Ensure operational processes are fit for purpose
• Implement necessary infrastructure & controls
• Ensure business continuity across the supply chain
1. Repair
Key Focus Areas
2. Rethink 3. Reconfigure
Wave of Crisis Response
Cash is an invaluable asset in this environment. Operational plans need to be funded, bills have to be met, and any emergency government loans that have been received will need to be repaid. Therefore, the next phase of the cash conversation needs to be focused on the medium – to long term operational cash position. Ensuring that companies have medium-term forecasts, that they are reliable, and sophisticated enough to tailor to a rapidly evolving situation will remain important.
Equally, people in all parts of the business need to re-evaluate which decisions have direct implications for cash and liquidity. Payments are committed to and contracts are written that dictate the timing of cash outflow. Some functions might incentivise behaviour that could compromise liquidity: the priority for procurement, for example, will be price rather than cashflow.
It’s essential that everyone making these decisions understands the vital importance of protecting liquidity. Building a cash culture means, more than highlighting cash as a metric – a cash conscious culture needs to permeate through the entire organisation, so everyone assesses every decision through a liquidity lens. Keeping the focus on cash will help to protect businesses on the bumpy road ahead. Improving the ways of working and enablers around working capital will become a key part of the reconfigure phase for businesses, which needs to cover five dimensions to be effective:
17Working Capital Study 20/21: Act Now to Recover

Do policies, targets & incentives drive the right decisions? Governance frameworks will need to be aligned to ensure the right trade-off decisions are taken and that the organisation has the right guidance to operate within.
Are processes still fit for purpose? Operational working capital processes need to be alignment to adjust for the ‘new normal’
Receivables• Re-align & focus collections• Credit limits, insurance &
ability to trade• Terms renegotiation &
payment plans• Availability of factoring capacity• Focused dispute resolution
Inventory• Reconfigure demand
forecasting model• Update replenishment triggers
& lead times• Realigned safety stocks calculation• Align production campaigns
and plans
Payables• Increased payment controls• Manage credit terms change
requests• Understand supplier stability
and health• Supply chain financing options
Do people have the guidance & skills to take the right actions? Operational functions will require guidance and enable staff to execute and prevent ‘business as usual’ behaviours.
Is the right operational data available to enable fast decision making? Limited usefulness on historical models that most processes rely on. Real time bottom up transparency is necessary to inform action.
How resilient is my supply chain? The surety of supply and financial health of critical suppliers needs to be clear ahead of ramp-up and contingency plans put in place.
Process Elasticity
Supply Chain
Resilience
Data & Transparency
People Enablement
Cash Governance Framework
Ensuring Working Capital management is fit for purpose
18 PwC

While not a substitute for good operational working capital management, trade finance solutions such as receivables factoring and supply chain financing provide additional sources for cash.
The availability and viability of these are dependent to a large extent on the availability of funds and the appetite for risk. As seen in the debt markets since the beginning of the COVID-19 pandemic, nearly all lenders adopted a ‘wait and see’ approach to funding new debt transactions and sought to focus on managing risk in their existing portfolios instead. A potential shift can also be seen in the trade finance market. PwC has invited a number of providers in the market to share their observations.
The role of trade and supply chain financing: a view from the market
Funding – A Changing Approach by
Adam Barrett, Head of Distribution, Demica
Bank funders have undoubtedly become more selective as they prioritise relationships and key targets, with opportunistic lending mostly frowned upon. Even for long-standing clients, the approval for a given transaction takes much longer than it did before, requiring borrowers to allow for this in their horizon planning.
Certain sectors are out of favour; these include commodity trade finance for other than top tier names. Several banks have withdrawn from financing even existing clients in sectors affected by COVID-19, such as physical retail and air travel that have become difficult, even at a very high cost of funds. We expect caution, and for the relationship banking model to remain important post-COVID-19, given the extended recession that is likely to follow.
Banks are also going to be motivated to distribute risk to others on deals they originate both to manage risk and drive returns. At Demica, we see increased demand for such functionality from our platform clients who use our technology to monitor and administer receivables and payables financing transactions.
The rise of non-bank investors in the asset class is much talked-about but still nascent. Whilst there has been activity in supply chain finance, this is mostly restricted to deals with full credit insurance. In receivables securitisations they are still active in mezzanine tranches. In more vanilla receivables financings, there is growing appetite both from factors, insurers and private equity-backed operators, but total Assets Under Management (AUM) is still relatively modest.
There are grounds for optimism. Banks are now actively investing in new products and platforms through which they can more efficiently deliver working capital solutions. The range of products available is evolving as the mix of trade finance shifts from traditional trade finance to the funding of open account trade.
19Working Capital Study 20/21: Act Now to Recover

Small businesses are most at risk from late payments by
Paul Christensen, CEO, Previse
The economic fallout from coronavirus is intensifying the problem of slow payments in a crisis that threatens the survival of small businesses. A perfect storm of falling demand, late and frozen invoice payments, reduced availability of trade credit and working capital finance has created a hostile environment for the sector of businesses that is the biggest employer and generates the most GDP in almost every developed country.
Previse data shows that over 70% of suppliers are paid late. Meanwhile, payment times for smaller suppliers have increased by up to 20% in the last six months, whilst purchasing has decreased by 20% or has been postponed into the future.
A recent study from the Federation of Small Businesses of over 4,000 SMEs in the UK showed that 61% of respondents have seen late payments worsen since the start of the COVID-19 pandemic, with many experiencing frozen payments. 64% of SME suppliers contacted by Previse have expressed challenges with their working capital. Comments such as “I just don’t see how [buyer] can sit on my invoices for almost half a year” and “I send an invoice in and it disappears” have become all too common.
Working capital solutions such as factoring and overdraft products simply do not address the needs of many SMEs: they are either not available or too expensive. Some large corporates have been taking temporary steps to support their SME suppliers during the COVID-19 crisis by making payments earlier than terms. However, slow payments are returning.
Recent engagement from large corporates are indicative of an emerging trend. Many want to support their supply chain to create resilience and become the customer of choice, but traditional solutions like Supply Chain Finance (SCF) require considerable effort to implement and are not cost-effective for SMEs.
20 PwC

How we can help
We help our clients to:
• Identify and realise cash and cost benefits across the end-to-end value chain
• Improve operational processes that underpin the working capital cycle
• Implement digital working capital solutions and data analytics
• Achieve cash conservation in crisis situations
• Create a ‘cash culture’ and upskill the organisation through our working capital academy
• Roll out trade and supply chain financing solutions
• Create short term cash flow forecasting and related action plans
• Stand up surge teams and resolve backlogs
Where and how we could help you to release cash from Working Capital
Accounts receivable• Tailored, proactive collections
• Credit risk policies
• Aligned and optimised customer terms
• Billing timeliness & quality
• Contract & milestone management
• Systematic dispute resolution
• Dispute root cause elimination
• “Surge” operational bandwidth
• Negotiation strategy and support
Inventory• Lean & agile supply
chain strategies
• Global coordination
• Forecasting techniques
• Production planning
• Inventory tracking
• Balancing cost, cash and service level considerations
• Inventory parameters & controls defining target stock
Accounts payable• Consolidated spending
• Increasing control with centre led procurement
• Helping avoid leakage with purchasing channels
• Payment terms
• Supply chain finance benefits assessment & implementation
• Helping eradicate early payments
• Payment methods
• Negotiation strategy and support
Our Working Capital improvement approach
Quick scan DesignDiagnostic Implementation
21Working Capital Study 20/21: Act Now to Recover

Authors
Daniel WindausPartner, PwC UKT: +44 7725 633 420E: [email protected]
Henry RosierWorking Capital, PwC UKT: +44 7808 796 915E: [email protected]
Andrew BradyWorking Capital, PwC UKT: +44 7483 417 068E: [email protected]
Special contributions from:Paul ChristensenCEO, Previse
Adam BarrettHead of Distribution, Demica
Roland Hartley-UrquhartVice Chairman, Greensill Capital
22 PwC

Contacts
Global Centre of Excellence, UK:Daniel WindausE: [email protected]
Stephen TebbettE: [email protected]
Local contacts:CanadaJoe RafuseE: [email protected]
DenmarkRene Brandt JensenE: [email protected]
FinlandMichael HardyE: [email protected]
FranceArthur WastynE: [email protected]
Germany and AustriaRob KortmanE: [email protected]
Hong Kong & ChinaPeter GreavesE: [email protected]
IrelandDamien HuntE: [email protected]
ItalyPaolo MenafoglioE: [email protected]
JapanYusuke OnishiE: [email protected]
Malaysia/VietnamGanesh GunaratnamE: [email protected]
Middle EastMihir BhattE: [email protected]
NorwayRobert DijkstraE: [email protected]
PolandPawel DżurakE: [email protected]
Russia & CISVadim KhrapounE: [email protected]
SpainArnaud OjedaE: [email protected]
SwitzerlandBenjamin RutzE: [email protected]
The NetherlandsDanny [email protected]
USARob VettorettiE: [email protected]
23Working Capital Study 20/21: Act Now to Recover

pwc.co.uk/workingcapitalstudyAt PwC, our purpose is to build trust in society and solve important problems. PwC is a network of firms in 157 countries with over 276,000 people who are committed to delivering quality in assurance, advisory and tax services. Find out more and tell us what matters to you by visiting us at www.pwc.com/uk.
This content is for general information purposes only, and should not be used as a substitute for consultation with professional advisors.
© 2020 PricewaterhouseCoopers LLP. All rights reserved. PwC refers to the UK member firm, and may sometimes refer to the PwC network. Each member firm is a separate legal entity. Please see www.pwc.com/structure for further details.
Mitie Design RITM3449922 (09/20).