working capital management of ual industries ltd
TRANSCRIPT
ATUAL Industries Ltd, Dhenkanal (Orissa),
SUBMITTED
AS A PARTIAL FULLMENT OF PGDM
CORPORATE GUIDE ACADEMIC GUIDEMR. S.N. BHATTACHARYA DR. U.C. PATTNAIK(ACCT. GENERAL MANAGER, (DIRECTOR OF ISBM)COMMERCIAL)
SUBMITED BY:SAUMENDRA NANDAROLL NO-MB05017
ISBM (BHUBANESWAR)
ATUAL Industries Ltd, Dhenkanal (Orissa),
SUBMITTED
AS A PARTIAL FULLMENT OF PGDM
CORPORATE GUIDE ACADEMIC GUIDEMR. S.N. BHATTACHARYA DR. U.C. PATTNAIK(ACCT. GENERAL MANAGER, (DIRECTOR OF ISBM)COMMERCIAL)
SUBMITED BY:SAUMENDRA NANDAROLL NO-MB05017
ISBM (BHUBANESWAR)
ATUAL Industries Ltd, Dhenkanal (Orissa),
SUBMITTED
AS A PARTIAL FULLMENT OF PGDM
CORPORATE GUIDE ACADEMIC GUIDEMR. S.N. BHATTACHARYA DR. U.C. PATTNAIK(ACCT. GENERAL MANAGER, (DIRECTOR OF ISBM)COMMERCIAL)
SUBMITED BY:SAUMENDRA NANDAROLL NO-MB05017
ISBM (BHUBANESWAR)
I
DECLARATION
I do here by declare that this piece of project report entitled “A Study onWorking capital Management practices in UAL INDUSTRIES LTD.” forpartial fulfilment of the requirements for the award of the degree of “POSTGRADUATE DIPLOMA IN MANAGEMENT “is a record of original work doneby me under the supervision and guidance of DR. U.C PATTNAIK, ISBM.This project work is my own and has neither been submitted norpublished elsewhere.
Place: Bhubaneswar SAUMENDRA NANDADATE: REG. NO.MB05017

ii
ACKNOWLEDGEMENTANY WORK EITHER SMALL OR BIG OWES A GREAT DEAL TO OTHERSOTHERS, MINE IS NO EXCEPTION TO ITSuccess is not destination, but a journey – it is often said. I realized it even better duringmy summer internship program at UAL INDUSTRIES LTD. I may not have come this farwithout help, guidance and support of certain people who acted as guides, friends andtorch bearers along the way.Training is an indispensable part of a person joining a company as an employee. Itprovides the students an opportunity to gain experience on the practical applications oftheir knowledge. My training at UAL INDUSTRIES has been very fruitful. I am sure thatthe hands of experience I have gained here will go a long way towards my rest of life.I specially and most sincerely acknowledge with deep sense of gratitude to thecompany’s managing director, Mr. Arun k Saraf, and the HR, Mr. Dasgupta for give methe chance to go to the Dhenkanel factory and learn, experience and gather the insightsfrom the employees at the factory /floor level which helped me to understand the entireworking capital management.I am greatly indebted to my guides DR.U.C.PATTNAIK, faculty guide for Finance(summer internship), INTERNATIONAL SCHOOL OF BUSINESS MANAGEMENT &Mr.S.N.Bhattacharya, Asst. Manager (commercial) UAL INDUSTRIES LTD.DHENKANAL for their constant guidance, advice and help which enabled me to finishthis project report properly in time.Last but not the least, I would like to forward my gratitude to my friends & other facultymembers who always endured me and stood with me and without whom I could nothave completed the project.
SAUMENDRA NANDAISBM, BBSR
iii
PREFACE
To start any business, First of all we need finance and the success of that business entirelydepends on the proper management of day-to-day finance and the management of this short-term capital or finance of the business is calledWorking capital Management.Working Capital is the money used to pay for the everyday trading activities carried out by thebusiness - stationery needs, staff salaries and wages, rent, energy bills, payments for suppliesand so on. I have tried to put my best effort to complete this task on the basis of skill that I haveachieved during the last one year study in the institute. I have tried to put my maximum effort toget the accurate statistical data. However I would appreciate if any mistakes are brought to myby the reader

TABLE OF CONTENT
CHAPTER-1
INTRODUCTIONPAGENO.
1.1 objective of study 1.11.2 Scope of the study 1.11.3 Limitation of the study 1.11.4 Research methodology 1.11.5 Methods of data collection 1.2
CHAPTER-2COMPANY PROFILE
2.1 HISTORY OF UAL INDUSTRIES LTD. 2.12.2 UNIT OF UAL INDUSTRIES LTD. 2.22.3 BORD OF DIRECTORS 2.32.4 ORGANISATION STRUCTURE OF UAL INDUSTRIES LTD. 2.42.5 VISION & MISSION OF UAL INDUSTRIES LTD. 2.52.6 MANAGEMENT INFORMATION SYTEM 2.52.7 CORPORATE SACIAL RESPONSIBILITIES 2.62.8 FACTS & MYTHS 2.72.9 PRODUCT OF UAL INDUSTRIES LTD. 2.9
2.10 INSTALLATION PROCEDURE & PROCEDURE OF MITRING 2.122.11 SERVISES 2.132.12 TRAINING 2.142.13 QUALITY POLICIES 2.152.14 ENVIRONMENT POLICIES 2.162.15 ENVIRONMENT AUDIT 2.162.16 AWARDS 2.172.17 CERTIFICATES 2.182.18 DISTRIBUTION NETWORK 2.19
CHAPTER-33.1 MEANING OF WORKING CAPITAL 3.13.2 CONCEPT OF WORKING CAPITAL 3.13.3 SIGNIFICANCE OF WORKING CAPITAL 3.23.4 CIRCULATION OF WORKING CAPITAL 3.33.5 CLASSIFICATION OF WORKING CAPITAL 3.33.6 FACTORS INFLUENCING WORKING CAPITAL REQUIREMENT 3.43.7 COMPONENTS OF WORKING CAPITAL 3.63.8 FORECASTING OF WORKING CAPITAL 3.8
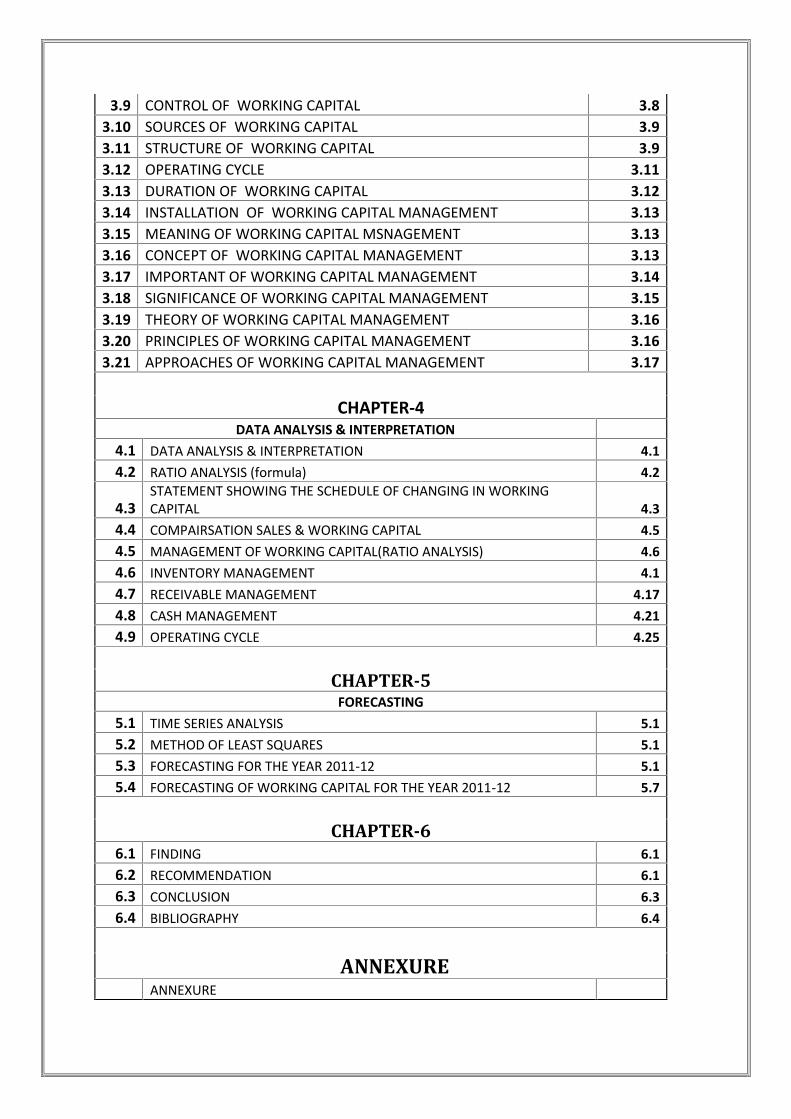
3.9 CONTROL OF WORKING CAPITAL 3.83.10 SOURCES OF WORKING CAPITAL 3.93.11 STRUCTURE OF WORKING CAPITAL 3.93.12 OPERATING CYCLE 3.113.13 DURATION OF WORKING CAPITAL 3.123.14 INSTALLATION OF WORKING CAPITAL MANAGEMENT 3.133.15 MEANING OF WORKING CAPITAL MSNAGEMENT 3.133.16 CONCEPT OF WORKING CAPITAL MANAGEMENT 3.133.17 IMPORTANT OF WORKING CAPITAL MANAGEMENT 3.143.18 SIGNIFICANCE OF WORKING CAPITAL MANAGEMENT 3.153.19 THEORY OF WORKING CAPITAL MANAGEMENT 3.163.20 PRINCIPLES OF WORKING CAPITAL MANAGEMENT 3.163.21 APPROACHES OF WORKING CAPITAL MANAGEMENT 3.17
CHAPTER-4DATA ANALYSIS & INTERPRETATION
4.1 DATA ANALYSIS & INTERPRETATION 4.14.2 RATIO ANALYSIS (formula) 4.2
4.3STATEMENT SHOWING THE SCHEDULE OF CHANGING IN WORKINGCAPITAL 4.3
4.4 COMPAIRSATION SALES & WORKING CAPITAL 4.54.5 MANAGEMENT OF WORKING CAPITAL(RATIO ANALYSIS) 4.64.6 INVENTORY MANAGEMENT 4.14.7 RECEIVABLE MANAGEMENT 4.174.8 CASH MANAGEMENT 4.214.9 OPERATING CYCLE 4.25
CHAPTER-5FORECASTING
5.1 TIME SERIES ANALYSIS 5.15.2 METHOD OF LEAST SQUARES 5.15.3 FORECASTING FOR THE YEAR 2011-12 5.15.4 FORECASTING OF WORKING CAPITAL FOR THE YEAR 2011-12 5.7
CHAPTER-66.1 FINDING 6.16.2 RECOMMENDATION 6.16.3 CONCLUSION 6.36.4 BIBLIOGRAPHY 6.4
ANNEXUREANNEXURE

OBJECTIVE OF THE STUDYOBJECTIVE OF THE STUDYOBJECTIVE OF THE STUDY

P o w e r e d b y : - S A U M E N D R A N A N D A ISBM
WORKING CAPITA MANAGEMENT OF UAL INDUSTRIES LTD. 2012
1.1 OBJECTIVE OF THE STUDY:Study of the working capital management is important because unless the Working capital ismanaged effectively, monitored efficiently planed properly and reviewed periodically atregular intervals to remove bottlenecks if any the Company cannot earn profits and increaseits turnover. With this primary Objective of the study, the following further objectives areframed for a depth Analysis.
To study the working capital management of UAL INDUSTRIES LTD. To study the optimum level of current assets and current liabilities of the Company. To study the liquidity position through various working capital related Ratios. To study the working capital components such as receivables accounts, Cash
management. To estimate the working capital requirement of UAL INDUSTRIES LTD. To study the operating and cash cycle of the company
1.2 SCOPE OF THE STUDY:The scope of the study is identified after and during the study is conducted. The Study ofworking capital is based on tools like trend Analysis, Ratio Analysis, Working capitalleverage, operating cycle etc.Further the study is based on last 5 years UAL INDUSTRIES LTD.And even factors like Competitor’s analysis, industry analysis were not considered whilepreparing this project.
1.3 LIMITATIONS OF THE STUDY:Following limitations were encountered while preparing this project:
1.3.1 Limited data:-
This project has completed with annual reports; it just constitutes one part of Datacollection i.e. Secondary. There were limitations for primary data Collection because ofconfidentiality.
1.3.2 Limited period:-
This project is based on five year annual reports. Conclusions and Recommendations arebased on such limited data. The trend of last five-year May or may not reflect the realworking capital position of the company
1.3.2 Limited area:-
Also it was difficult to collect the data regarding the competitors and their financialinformation. Industry figures were also difficult to get.
1.4 RESEARCH METHODOLOGY
INTRODUCTION: Research methodology is a way to systematically solve the researchproblem. It may be understood as a science of studying now research is done systematically.In that various steps, those are generally adopted by a researcher in studying his problemalong with the logic behind them.
1.1

P o w e r e d b y : - S A U M E N D R A N A N D A ISBM
WORKING CAPITA MANAGEMENT OF UAL INDUSTRIES LTD. 2012
It is important for research to know not only the research method but also knowmethodology. The procedures by which researchers go about their work of describing,explaining and predicting phenomenon are called methodology. Methods comprise theprocedures used for generating, collecting and evaluating data. All this means that it isnecessary for the researcher to design his methodology for his problem as the same maydiffer from problem to problem. Data collection is important step in any project and successof any project will be largely depend upon now much accurate you will be able to collectand how much time, money and effort will be required to collect that necessary data, this isalso important step. Data collection plays an important role in research work. Withoutproper data available for analysis you cannot do the research work accurately.1.5 METHODS OF DATA COLLECTION:There are two types of data collection methods available.
• Primary data collection
• Secondary data collection
1.5.1 Primary Data:
The primary data is that data which is collected fresh or first hand, and for first time which isoriginal in nature. Primary data can collect through personal interview, questionnaire etc. tosupport the secondary data.
1.5.2 Secondary Data Collection Method:The secondary data are those which have already collected and stored. Secondary dataeasily get those secondary data from records, journals, annual reports of the company etc. Itwill save the time, money and efforts to collect the data. Secondary data also madeavailable through trade magazines, balance sheets; books etc.This project is based onprimary data collected through personal interview of head of account department, head ofSQC department and other concerned staff member of finance department. But primarydata collection had limitations such as matter confidential information thus project is basedon secondary information collected through five years annual report of the company,supported by various books and internet sides. The data collection was aimed at study ofworking capital management of the company.
Project is based on
Annual report of UAL INDUSTRIES LTD 2011-10
Annual report of UAL INDUSTRIES LTD 2009-10
Annual report of UAL INDUSTRIES LTD 2008-09
Annual report of UAL INDUSTRIES LTD 2007-08
Annual report of UAL INDUSTRIES LTD 2006-07
1.2

COMPANY PROFILE

WORKING CAPITAL MANAGEMENT OF UAL INDUSTRIES LTD.
Powered by:-SAUMENDRA NANDA ISBM
2.1 HISTORY OF THE COMPANYUAL Industries Ltd., formerly known as Utkal Asbestos Limited, is in the business ofmanufacturing Fibre Cement Corrugated sheets and accessories under the brand name“Konark. The company has manufacturing units in 3 locations namely Dhenkanal (Orissa),Tungadhowa (Midnapore, West Bengal) and Baramanpur (Uttar Pradesh).The mother Plant was set up at Dhenkanal, Orissa with the initial installed capacity of30,000 MT per annum in the year 1980. To the day, in 2010, the production capacity of thecompany is 4.30 Lacs MT per annum. The company’s products are sold and distributedunder the brand name “Konark” which is synonymous with Orissa. The company maintainsits leadership in Eastern India with the “Konark” brand established as a superior Brandbased on quality, strength, and durability. The company received the ISO 9001:2008, ISO14001:2004 and OSHAS 18001:2007 certifications from Bureau Veritas QualityInternational (BVQI) and TUV which exhibit the highest quality standards.UAL Industries Ltd. is a professionally managed company. Shri S M Shroff is the non –executive Chairman and Shri A K Saraf is the Managing Director who manages overallfunctioning of the company along with Executive Director, Sri K N P Sinha and otherprofessionally qualified Non-executive Directors, unit heads and a dedicated team ofOfficers and Executives.UAL Industries Limited is the largest Fibre Cement Sheet manufacturer and marketer inEastern India with a 40% market share in East India. The National average is 10%. Thecompany provides opportunity of direct employment to more than 700 personnel andindirectly to nearly 1500 persons.It may be worthwhile to mention that after a lot of R & D the company has started using FlyAsh as a major Raw Material to the extent of 37% in the Raw Material Mix since 1992 andthereby helping in tackling the environment problem created by emission of fly ash. TheCompany is recipient of Environment Excellence Awards from Govt. of West Bengal, Orissaand TERI on various occasions.A new green field Fibre Cement Sheet manufacturing facility is being set up in the State ofBihar in the district of Vaishali near Patna. The land has been acquired and projectclearance from the Ministry of Environment & Forests, New Delhi is awaited. The Capitalinvestment in initial phase of the project shall be of the order of Rs. 30 Corers. It is likely tobe commissioned during the first quarter of next financial year 2011–12. With addition tothis plant, the total production capacity would stand enhanced to 5.50 Lacs MT per annum.
2.1

WORKING CAPITAL MANAGEMENT OF UAL INDUSTRIES LTD.
Powered by:-SAUMENDRA NANDA ISBM
2.2 UNIT OF UAL INDUSTRIES LTD.
The mother factory was set up in the year 1980 and is located about 60 Km away from Cuttack onthe National Highway No. 42 on Cuttack-Sambalpur Road. The plant operates with a productioncapacity of 30,000MT.
ORISSA FACTORYAt+Po - KorianP.Box No - 8Dhenkanal - 759001Orissa
As a measure of expansion, Utkal Asbestos Ltd. set up its second unit at village: Tungadhowa nearGuptamani, District: Midnapore, West Bengal, under the name and style “UAL- BENGAL" in the year1999. The Midnapore unit at village Tungadhowa is located about 20 Km from the town ofKharagpur on the National Highway 6, on Kolkata - Mumbai Road. The production capacity of thePlant has gone up from 1, 40,000 TPA to 2, 50,000 TPA.
UAL Bengal, Tungadhowa Works received ISO: 9001-2008, ISO: 14001-2004 and OHSAS:18001-2008from BVQI, accredited by UKAS, London.
UAL BENGAL FACTORYKonark NagarTungadhowaWest Midnapore - 721513West Bengal
The company set up its third works at Village Baramanpur, District: Jaunpur near Varanasi in U.P. formanufacturing. A new milestone is our UAL- U.P. set up in the year 2005 at Village BaramanpurDistrict Jaunpur. The unit is about 30km away from Varanasi city. Production capacity of plant is 1,20,000 T.P.A.UAL-UP works has started the process of certification of ISO 9001-2001, 14000 OHSAS: 18001-2007
U. P. FACTORYVill - BaramanpurTeshil - KeraketDist – Jaunpur
2.2
WORKING CAPITAL MANAGEMENT OF UAL INDUSTRIES LTD.
Powered by:-SAUMENDRA NANDA ISBM
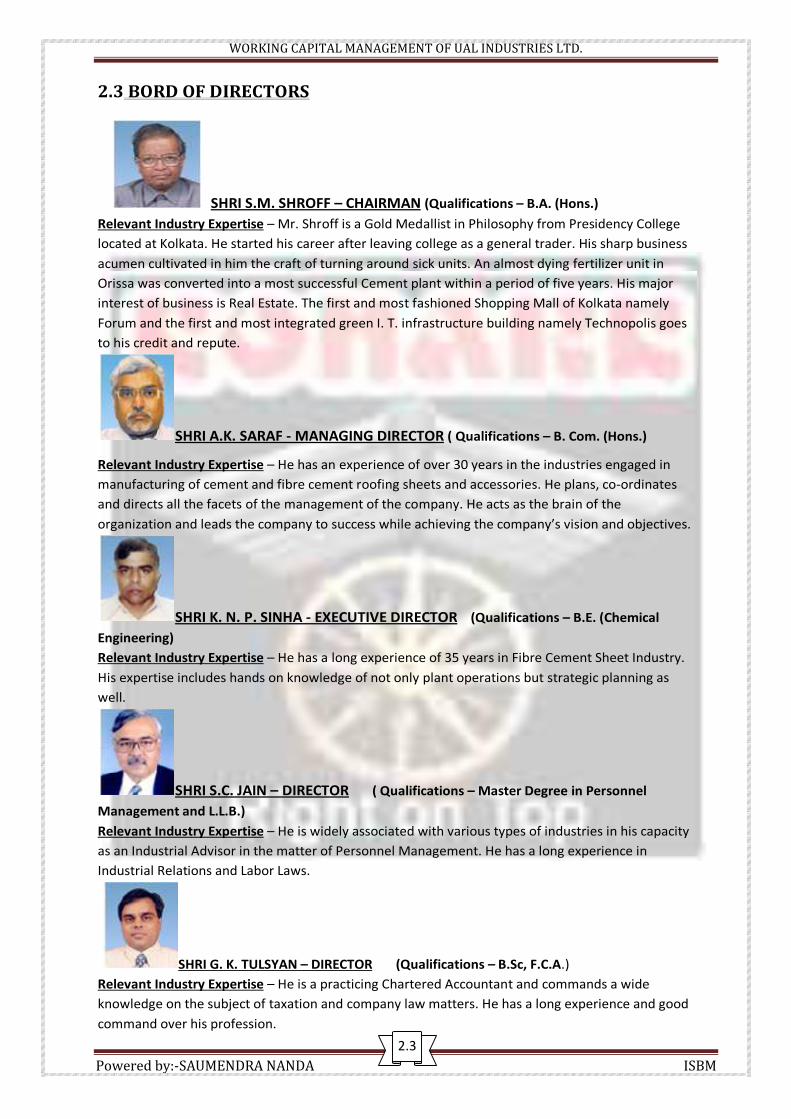
2.3 BORD OF DIRECTORS
SHRI S.M. SHROFF – CHAIRMAN (Qualifications – B.A. (Hons.)Relevant Industry Expertise – Mr. Shroff is a Gold Medallist in Philosophy from Presidency Collegelocated at Kolkata. He started his career after leaving college as a general trader. His sharp businessacumen cultivated in him the craft of turning around sick units. An almost dying fertilizer unit inOrissa was converted into a most successful Cement plant within a period of five years. His majorinterest of business is Real Estate. The first and most fashioned Shopping Mall of Kolkata namelyForum and the first and most integrated green I. T. infrastructure building namely Technopolis goesto his credit and repute.
SHRI A.K. SARAF - MANAGING DIRECTOR ( Qualifications – B. Com. (Hons.)
Relevant Industry Expertise – He has an experience of over 30 years in the industries engaged inmanufacturing of cement and fibre cement roofing sheets and accessories. He plans, co-ordinatesand directs all the facets of the management of the company. He acts as the brain of theorganization and leads the company to success while achieving the company’s vision and objectives.
SHRI K. N. P. SINHA - EXECUTIVE DIRECTOR (Qualifications – B.E. (ChemicalEngineering)Relevant Industry Expertise – He has a long experience of 35 years in Fibre Cement Sheet Industry.His expertise includes hands on knowledge of not only plant operations but strategic planning aswell.
SHRI S.C. JAIN – DIRECTOR ( Qualifications – Master Degree in PersonnelManagement and L.L.B.)Relevant Industry Expertise – He is widely associated with various types of industries in his capacityas an Industrial Advisor in the matter of Personnel Management. He has a long experience inIndustrial Relations and Labor Laws.
SHRI G. K. TULSYAN – DIRECTOR (Qualifications – B.Sc, F.C.A.)Relevant Industry Expertise – He is a practicing Chartered Accountant and commands a wideknowledge on the subject of taxation and company law matters. He has a long experience and goodcommand over his profession.
2.3

WORKING CAPITAL MANAGEMENT OF UAL INDUSTRIES LTD.
Powered by:-SAUMENDRA NANDA ISBM2.4
WORKING CAPITAL MANAGEMENT OF UAL INDUSTRIES LTD.
Powered by:-SAUMENDRA NANDA ISBM
2.5.1 VISION To be the country’s largest and most trusted eco friendly low cost Fibre cement
sheet manufacturer and marketer through customer satisfaction and sustainablegrowth.
2.5.2 MISSION Achieve Market Leadership in FCC Sheets Drive long term profitable growth Delight customers by providing enhanced satisfaction Adopt state of art technology to further enhance the philosophy of Zero Waste
Management and Zero Effluent Discharge from the plant. Research & Development activity is carried on a regular basis to innovate upgraded
technology to optimize the raw material mix thereby increasing product efficiency atoptimum cost.
Make UAL Industries Limited a great place to work for all its employees.
2.6 MANAGEMENT INFORMATION SYSTAMUAL Industries Ltd. runs Third Party Developed customized ERP (Enterprise
Resource Planning) Application. The Modules run are:• Financial Management• Material Management• Payroll & HR Management• Sales & Dispatch Management
All The Factories, Depot and H.O are interconnected with MPLS VPN for online data transferand connectivity. In near future, Video Conferencing and tele-communication would becharted through WAN. Special policies have been adopted for the following:
2.6.1 DATA SECURITY
Data Security has been given prime importance with introduction of Business ContinuityPlanning (BCP) and Disaster Recovery Planning (DRP) ensuring minimal downtime with datareplication methodology. Automated Backing up of user documents has been regulated.
2.6.2 NETWORK SECURITY
Internal Network of UAL Industries Ltd. has been made secured from outside threatthrough introduction of UTM at Internet Gateway Point to filter unwanted packets andinstalling Anti-Virus Software. The independent network structure is getting converted tocentrally controlled network to facilitate better network government.
2.5
WORKING CAPITAL MANAGEMENT OF UAL INDUSTRIES LTD.
Powered by:-SAUMENDRA NANDA ISBM
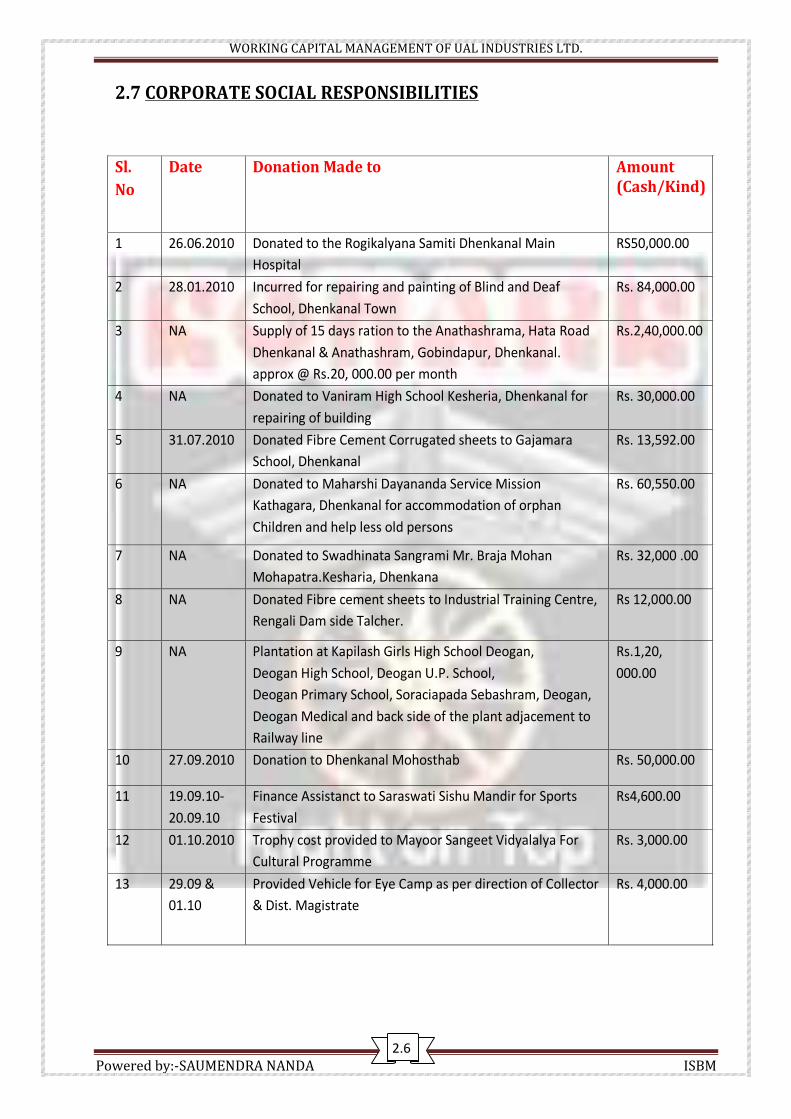
2.7 CORPORATE SOCIAL RESPONSIBILITIES
Sl.No
Date Donation Made to Amount(Cash/Kind)
1 26.06.2010 Donated to the Rogikalyana Samiti Dhenkanal MainHospital
RS50,000.00
2 28.01.2010 Incurred for repairing and painting of Blind and DeafSchool, Dhenkanal Town
Rs. 84,000.00
3 NA Supply of 15 days ration to the Anathashrama, Hata RoadDhenkanal & Anathashram, Gobindapur, Dhenkanal.approx @ Rs.20, 000.00 per month
Rs.2,40,000.00
4 NA Donated to Vaniram High School Kesheria, Dhenkanal forrepairing of building
Rs. 30,000.00
5 31.07.2010 Donated Fibre Cement Corrugated sheets to GajamaraSchool, Dhenkanal
Rs. 13,592.00
6 NA Donated to Maharshi Dayananda Service MissionKathagara, Dhenkanal for accommodation of orphanChildren and help less old persons
Rs. 60,550.00
7 NA Donated to Swadhinata Sangrami Mr. Braja MohanMohapatra.Kesharia, Dhenkana
Rs. 32,000 .00
8 NA Donated Fibre cement sheets to Industrial Training Centre,Rengali Dam side Talcher.
Rs 12,000.00
9 NA Plantation at Kapilash Girls High School Deogan,Deogan High School, Deogan U.P. School,Deogan Primary School, Soraciapada Sebashram, Deogan,Deogan Medical and back side of the plant adjacement toRailway line
Rs.1,20,000.00
10 27.09.2010 Donation to Dhenkanal Mohosthab Rs. 50,000.00
11 19.09.10-20.09.10
Finance Assistanct to Saraswati Sishu Mandir for SportsFestival
Rs4,600.00
12 01.10.2010 Trophy cost provided to Mayoor Sangeet Vidyalalya ForCultural Programme
Rs. 3,000.00
13 29.09 &01.10
Provided Vehicle for Eye Camp as per direction of Collector& Dist. Magistrate
Rs. 4,000.00
2.6
WORKING CAPITAL MANAGEMENT OF UAL INDUSTRIES LTD.
Powered by:-SAUMENDRA NANDA ISBM
FACTS & MYTHS
2.8.1 What is Asbestos?
Asbestos is a naturally occurring fibrous mineral commonly found in underground rockformations. For commercial purposes, it is recovered by mining and rock crushing. Fineparticles, invisible to the eye, are present in the air and water, everywhere. All of us maybe inhaling them and ingesting them through drinking water every day for our life withoutany adverse effect on health. Asbestos is commercially used since 1900 and is classifiedinto 2 groups. One category is called "Chrysotile" (white) Asbestos and the other group istermed as Amphiboles consisting of Crocidolite (blue), Amosite (brown) etc.
White asbestos (chrysotile) constitutes 98% of world production for its commercial use.Indian asbestos cement sheet and pipe manufacturers import all their requirements ofchrysotile fibres from Canada, Brazil, Russia, Zimbabwe and Kazakistan for production ofAC sheets and pipes. India imports only 20% of world production from above countries.Asbestos is also mined in India, but quantity and quality-wise it is of no relevance to ourasbestos cement production. It is generally found in large concentrations in the naturalbedrock of the earth crust.
The Chemical composition of Crocidolite, Amosite and Chrysotile are different. Asbestos fibre, (composed mainly of magnesium and silica), is a great reinforcing agent.
While its tensile strength is greater than steel, it has other rare and highly valued fireretardant, chemical resistant and heat insulating qualities. In fact it is a magic mineral andno other substitute can match its properties.
2.8.2 What are Asbestos Cement (AC) Products? Because of its exceptional strength and ability to cover inside area as reinforcement only
8.9% of chrysotile fibres are adequate to combine with cement and other raw materials.Over 90% of asbestos fibre imports of India go into AC sheet and pipe production.
AC Sheets have used in India for 70 years. Being weather proof and corrosion resistant,these sheets are practically ageless and maintenance free, whereas metal sheets corrodeand deteriorate with age and exposure.
AC Sheets have also proven to be the most cost effective, easy-to-install, strong anddurable roofing material for warehouses, factories, low-cost housing, and practically, anystructure needing a roof. Apart from India, Russia, China, Indonesia, Thailand and Brazil aresome of the largest users of AC Sheets.
AC Sheets and pipes, being corrosion and erosion-free, once properly laid and jointed,need no maintenance or replacement. They are also very cost effective.
AC products, which consume low energy in manufacture and do not in any way deplete thenatural resources, meet the needs of the country in its developing economy in the contextof rapidly rising population and limited resources.
2.7

WORKING CAPITAL MANAGEMENT OF UAL INDUSTRIES LTD.
Powered by:-SAUMENDRA NANDA ISBM
AC products are manufactured under (ISI) license strictly conforming to the standards ofBureau of Indian Standards- IS 459/1992 for Corrugated Roofing Sheets, IS2098/ 1997 forFlat Sheets and IS 1626 (Part 111)/1994 for Roofing Accessories.
2.8.3 Explain the negative reports on asbestos: The bias against the use of asbestos in few countries is due to the adverse Western media
coverage relating to altogether different types and usages of asbestos in the past in thosecountries i.e. sprayed-on asbestos and friable low-density asbestos insulation used underuncontrolled conditions at that time due to lack of adequate scientific knowledge. Forexample usage of amphibole (blue) variety in such applications. Though these particularusages have since been discontinued in the West, the claims relating to the past keepappearing in the media resulting in general confusion. In India Asbestos Fibre was neverused as sprayed insulation.
But, once the scientific research into the risks of asbestos was set in motion, developmentand installation of pollution control systems took place, enabling the asbestos mining andasbestos cement industries to maintain safe and acceptable levels of dust pollution at thework places.
Once the safety fears were defined, the Governments have stepped in and laid downpollution control regulations and the mechanisms to enforce their compliance. Compliancewith these regulations and standards assured the workers in asbestos cement industries arisk free environment.
2.8
WORKING CAPITAL MANAGEMENT OF UAL INDUSTRIES LTD.
Powered by:-SAUMENDRA NANDA ISBM
PRODUCT
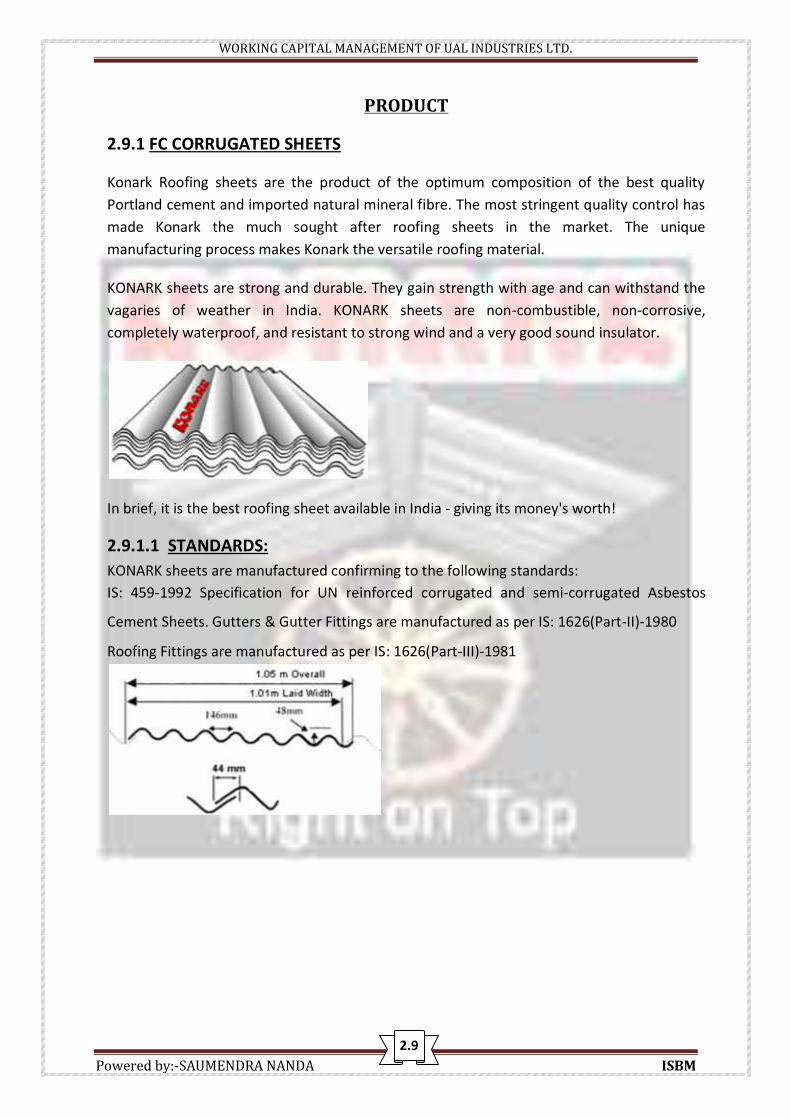
2.9.1 FC CORRUGATED SHEETS
Konark Roofing sheets are the product of the optimum composition of the best qualityPortland cement and imported natural mineral fibre. The most stringent quality control hasmade Konark the much sought after roofing sheets in the market. The uniquemanufacturing process makes Konark the versatile roofing material.
KONARK sheets are strong and durable. They gain strength with age and can withstand thevagaries of weather in India. KONARK sheets are non-combustible, non-corrosive,completely waterproof, and resistant to strong wind and a very good sound insulator.
In brief, it is the best roofing sheet available in India - giving its money's worth!
2.9.1.1 STANDARDS:KONARK sheets are manufactured confirming to the following standards:IS: 459-1992 Specification for UN reinforced corrugated and semi-corrugated Asbestos
Cement Sheets. Gutters & Gutter Fittings are manufactured as per IS: 1626(Part-II)-1980
Roofing Fittings are manufactured as per IS: 1626(Part-III)-1981
2.9
WORKING CAPITAL MANAGEMENT OF UAL INDUSTRIES LTD.
Powered by:-SAUMENDRA NANDA ISBM
2.9.2 PLAIN SHEET
APPLICATIONS IDEAL INWall Claddings Multi Story BuildingPartition Walls Textile MillsFalse Ceilings Chemical IndustriesPaneling Kitchen & BathroomShelves Hotels, Hospitals, Departmental Stores
TABLE TOPS UNIQUE FEATURESIroning Boards Easy WorkabilityCupboards Dimensionally StableInternal Linings To Wardrobes DurableSignboards Light
FIXINGCENTRTE OF SUPPORTINGThickness Horizontal Vertical4mm 1.20 M 0.40 M6mm 1.20 M 0.60 MCENTRTE OF SUPPORTINGThickness At Perimeter At Intermediate Support4mm 0.30 M 0.6 M6mm 0.30 M 0.6 MEDGE CLEARENCE: 20mm
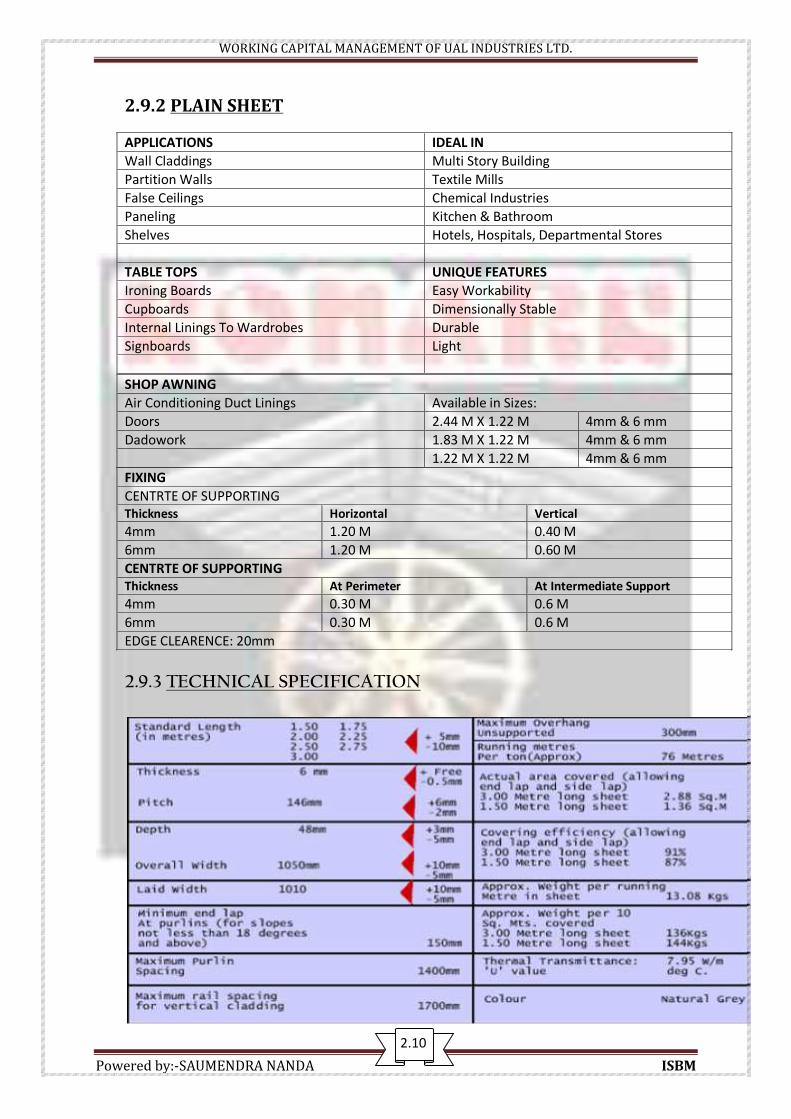
2.9.3 TECHNICAL SPECIFICATION
SHOP AWNINGAir Conditioning Duct Linings Available in Sizes:Doors 2.44 M X 1.22 M 4mm & 6 mmDadowork 1.83 M X 1.22 M 4mm & 6 mm
1.22 M X 1.22 M 4mm & 6 mm
2.100
WORKING CAPITAL MANAGEMENT OF UAL INDUSTRIES LTD.
Powered by:-SAUMENDRA NANDA ISBM
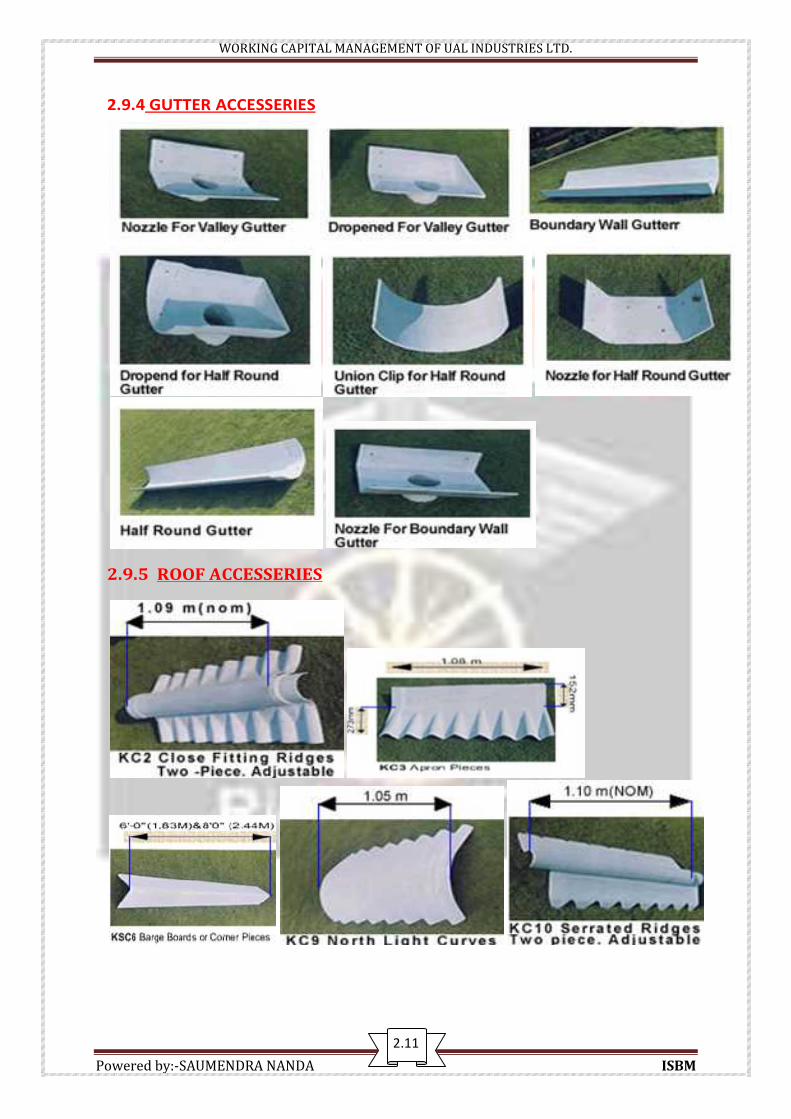
2.9.4 GUTTER ACCESSERIES
2.9.5 ROOF ACCESSERIES
2.11

WORKING CAPITAL MANAGEMENT OF UAL INDUSTRIES LTD.
Powered by:-SAUMENDRA NANDA ISBM
2.10 INSTALLATION PROCEDURE
1. Do not stack more than 150 sheets, one over the other. If possible, do not expose tosunlight.
2. To lift hold the sheets only in the places marked 'L'.3. Improper storage of sheets may result in to damage of the sheets. The damage will
be noticed only after installation.4. Always store sheets on three even level supports. Sheets of varying length should be
stacked separately.5. Always carry the sheets lengthwise, not width wise. If sheets have to be stored for
long, keep indoors.6. The distance between two purlins should not be more than 1.40 meters for roofing
and 1.70 meters for side cladding. Clamp with a purlin at the end of each sheet.7. Do not make holes in the sheet by punching, always drill holes. The drilled hole
should be 3mm. Bigger than the bolt. Use a Bitumen washer to seal holes.8. The hole should be drilled at least 2.95mm. away from the edge of the sheet. Initially
tighten nut bolts with the hand only. After 13-14 sheets are installed then all the nutbolds should be tightened together.
9. Tighten the nut in such a way that the bitumen - washer can seal the space betweenthe bolt and the hole. Do not tighten the bolt too much, otherwise the sheet willcrack. Use a spanner to tighten nut finally.
10. For a secure fitting, wherever 4 sheets have to be joined the corners should bemitred. The cut corners should be 150mm. in length and 44mm. in breadth. Use asaw to cut corners. Do not use a cutter.
11. Put bolts only in crowns, not in valleys.12. The bolt should pass through the second and the last sheet.13. Use a cat ladder for working on the roof.14. The outlet of the gutter line should not more than 15meters away.15. The length of the free overhang should more than300mm.
2.122

WORKING CAPITAL MANAGEMENT OF UAL INDUSTRIES LTD.
Powered by:-SAUMENDRA NANDA ISBM
2.10.1 PROCEDURE OF MITRING:
For the bottom row A, the first sheet should be cut; DDG. -- Cut in the upper leftcorner.
For the second and middle rows B cut the bottom right corner of the first sheet. E--upper left-hand corners and bottom right hand corners to be cut. H--cut only upper left corner of the last sheet. For the upper row cut bottom right corners of C, F and F. Fix I without any cut.
2.11 SERVISES
In an ambition to always focus on customer needs, we provide prompt pre and post salessupport.
We also provide technical support and training to our dealers and distributors forproper handling Fibre Cement Corrugated Sheets and accessories.
Once an order is placed, it is executed within 48 hours and delivered at clients' place. We believe in quick delivery, efficient and best quality service to our customers and
dealers. Our service as a whole is also directed towards the society in creating employment
and providing high class products for creating solid housing and industrialinfrastructure.
2.13

WORKING CAPITAL MANAGEMENT OF UAL INDUSTRIES LTD.
Powered by:-SAUMENDRA NANDA ISBM
2.12 TRAININGUAL Industries Limitedimparts training to theMasons/ Carpenters forproper fixation of FibreCement Sheets on theroof. For this purpose,the Company organisesthe Masons/ CarpentersMeet at various marketplaces in rural areaswhere the training forproper fixation of FibreCement Sheets,estimation of differentsizes of sheets for arequired sizes of house,selection of accessoriessuch as - BitumenWashers, Nut Bolts, etc.,minimum per line spacingrequired are highlightedto be taken care forlonger life of the FibreCement Sheet Roof.As a welfare measure theCompany arranges "Janata Personal AccidentInsurance Policy " ofRs.25,000.00 for one yearfor all the Masons/Carpenters attending thetraining program
.
2.14
WORKING CAPITAL MANAGEMENT OF UAL INDUSTRIES LTD.
Powered by:-SAUMENDRA NANDA ISBM
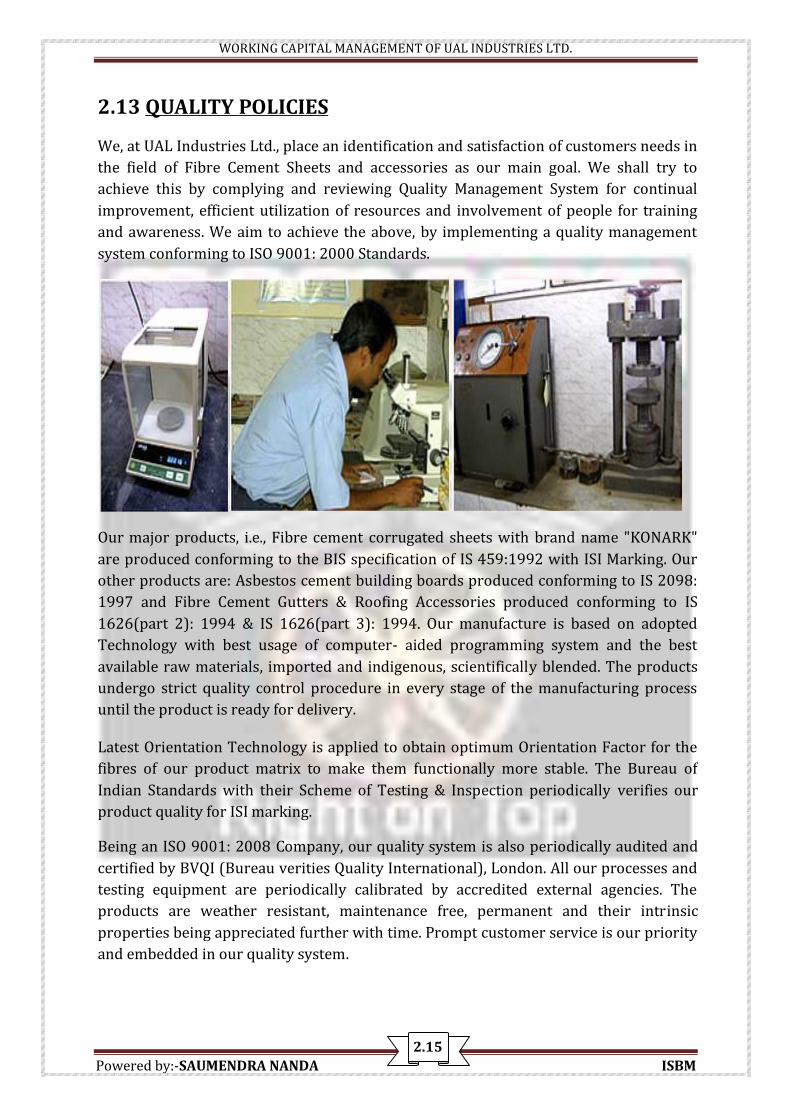
2.13 QUALITY POLICIESWe, at UAL Industries Ltd., place an identification and satisfaction of customers needs inthe field of Fibre Cement Sheets and accessories as our main goal. We shall try toachieve this by complying and reviewing Quality Management System for continualimprovement, efficient utilization of resources and involvement of people for trainingand awareness. We aim to achieve the above, by implementing a quality managementsystem conforming to ISO 9001: 2000 Standards.
Our major products, i.e., Fibre cement corrugated sheets with brand name "KONARK"are produced conforming to the BIS specification of IS 459:1992 with ISI Marking. Ourother products are: Asbestos cement building boards produced conforming to IS 2098:1997 and Fibre Cement Gutters & Roofing Accessories produced conforming to IS1626(part 2): 1994 & IS 1626(part 3): 1994. Our manufacture is based on adoptedTechnology with best usage of computer- aided programming system and the bestavailable raw materials, imported and indigenous, scientifically blended. The productsundergo strict quality control procedure in every stage of the manufacturing processuntil the product is ready for delivery.Latest Orientation Technology is applied to obtain optimum Orientation Factor for thefibres of our product matrix to make them functionally more stable. The Bureau ofIndian Standards with their Scheme of Testing & Inspection periodically verifies ourproduct quality for ISI marking.Being an ISO 9001: 2008 Company, our quality system is also periodically audited andcertified by BVQI (Bureau verities Quality International), London. All our processes andtesting equipment are periodically calibrated by accredited external agencies. Theproducts are weather resistant, maintenance free, permanent and their intrinsicproperties being appreciated further with time. Prompt customer service is our priorityand embedded in our quality system.2.15

WORKING CAPITAL MANAGEMENT OF UAL INDUSTRIES LTD.
Powered by:-SAUMENDRA NANDA ISBM
2.14 ENVIRONMENT POLICIESWe at UAL Industries Ltd. undertake necessary measures to maintain an Eco-friendlyenvironment. We follow an effective Environment Management System.
The Thermal Power Plants emit millions of tons of fly ash annually, which are hazardous andcause a serious challenge to Ecosystem. It may be worthwhile to mention that after lot ofR&D, we are using Fly Ash as a major raw material since 1992 for safeguarding theenvironment from pollution and stop health hazards.
Manufacturing of AC Products consumes nearly 36 times less energy than its alternativemetallic substitute thereby saving environment and atmosphere from addition of moretoxins. Therefore our products are most cost effective and competitive.
We have installed pollution control devices at the plant and all our pollution controlequipment are interlocked with the plant operations. In case of failure of any pollutioncontrol devices, the process functioning will automatically stop. We have installed separateenergy meters for each and every pollution control devices.
The industry is running with the concept of "ZERO" effluent management. Processed wastewater is recycled in the manufacturing process and domestic waste is discharged throughseptic tanks and soaks pits and reused in the green belt development.
Ambient and stack air monitoring, work zone monitoring and health monitoring of allemployees are being conducted periodically. The company has well planned solid wastemanagement as all discards and rejects of sheet are pulverized and recycled back in theprocess. The company works on "ZERO" Waste Management Principle.
It is relevant to mention that our products are Eco-friendly as the company is ISO 14001:1996 certified by BVQI (Bureau verities Quality International), London for EnvironmentalManagement System under accreditation from UKAS, UK.
2.15 ENVIRONMENT AUDIT
Environmental Audit as per ISO 14001: 1996 schedule Internal Audit conducted by trained / certified officers of the company Results of environmental audit – discussed in environmental management review
meeting Appropriate action initiated.
2.16
WORKING CAPITAL MANAGEMENT OF UAL INDUSTRIES LTD.
Powered by:-SAUMENDRA NANDA ISBM
2.16 AWARDS
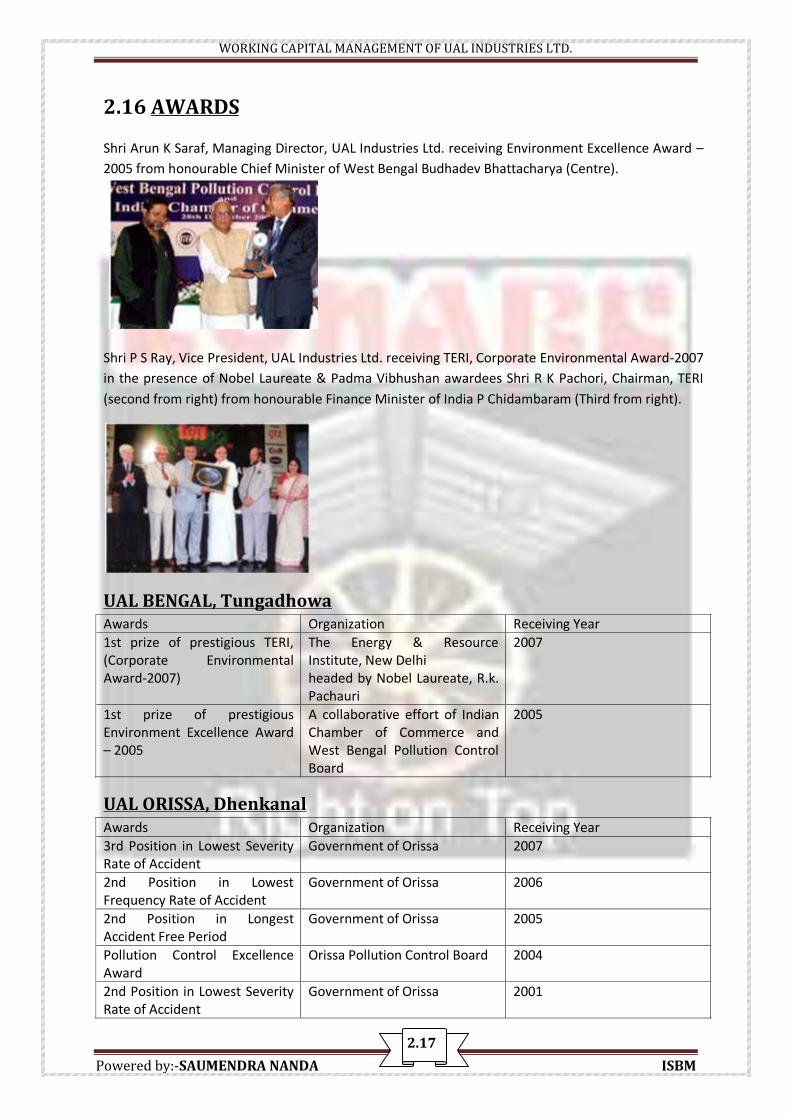
Shri Arun K Saraf, Managing Director, UAL Industries Ltd. receiving Environment Excellence Award –2005 from honourable Chief Minister of West Bengal Budhadev Bhattacharya (Centre).
Shri P S Ray, Vice President, UAL Industries Ltd. receiving TERI, Corporate Environmental Award-2007in the presence of Nobel Laureate & Padma Vibhushan awardees Shri R K Pachori, Chairman, TERI(second from right) from honourable Finance Minister of India P Chidambaram (Third from right).
UAL BENGAL, TungadhowaAwards Organization Receiving Year1st prize of prestigious TERI,(Corporate EnvironmentalAward-2007)
The Energy & ResourceInstitute, New Delhiheaded by Nobel Laureate, R.k.Pachauri
2007
1st prize of prestigiousEnvironment Excellence Award– 2005
A collaborative effort of IndianChamber of Commerce andWest Bengal Pollution ControlBoard
2005
UAL ORISSA, DhenkanalAwards Organization Receiving Year3rd Position in Lowest SeverityRate of Accident
Government of Orissa 2007
2nd Position in LowestFrequency Rate of Accident
Government of Orissa 2006
2nd Position in LongestAccident Free Period
Government of Orissa 2005
Pollution Control ExcellenceAward
Orissa Pollution Control Board 2004
2nd Position in Lowest SeverityRate of Accident
Government of Orissa 2001
2.17

WORKING CAPITAL MANAGEMENT OF UAL INDUSTRIES LTD.
Powered by:-SAUMENDRA NANDA ISBM
2.17 CERTIFICATESUAL ORISSA, DHENKANALCertification Organization Receiving YearISO 9001:2008 TUV India Pvt. Ltd. 2008OHSAS-18001-2007 TUV India Pvt. Ltd. 2008ISO 14001-2004 TUV India Pvt. Ltd. 2004
UAL BENGAL, TUNGADHOWACertification Organization Receiving YearISO 9001:2008 & ISO14001:2004
Bureau Veritas 2008
OHSAS-18001-2007 Bureau Veritas 2008ISO 14001-2004-2008 BVQI (Bureau Veritas Quality International) accredited
by UKAS, London2008
ISO 9001:2000 BVQI (Bureau Veritas Quality International) accreditedby UKAS, London
2004
CERTIFICATES FOR CORPORATE SOCIAL RESPONSIBILITYCertification Organization Receiving YearShabujtama Silpa Pratisthan West Bengal Govt. (Aranya Saptaha) 2010Shabujtama Silpa Pratisthan West Bengal Govt. (Aranya Saptaha) 2010
2.18
WORKING CAPITAL MANAGEMENT OF UAL INDUSTRIES LTD.
Powered by:-SAUMENDRA NANDA ISBM
2.18 DISTRIBUTION NETWORK
ODISHA
SALES DEPOTS
BALASORENear Assam Oil Petrol PumpNh-5, Vill- Biruan GaonP.O- Sergarh, Dist- BalasorePin-756060, ODISHA
SAMBALPURJoshi GardenCuttack RoadP.O-DhanupalliSambalpur - 768005
SALES OFFICE
DHENKANALAt+Po - KorianP.Box No - 8Dhenkanal - 759001ODISHA
BHUBANESWAR165 Cuttack RoadBomikhalBhubaneswar-751006
ASSAM
SALES DEPOTS
GUWAHATINH: 37, GorchukNear Tirupati Weigh BridgeGuwahatiAssam – 781035
BIHAR
SALES DEPOTSSIWANChap Tola, Teghra,Chhapra Road
Siwan - 841226Bihar
PATNA3 Sf -A, 5/6, Hig Bhoot NathRoadBahadurpur Housing ColonyPatna - 801505Bihar
MOTIHARIDevraha Baba ChowkKoluharawa, MotihariEast Champaran - 845401Bihar
CHATTISGARH
CHATTISGARHAman NagarMowa, RaipurChattisgarh-490023
JHARKHAND
BOKARORanchi Ramghar RoadNear- Durga Mandir, BalidihBokaro Steel City -14BokaroJharkhand
RANCHINh-33, Bargawa, NamkumRanchi, Jharkhand
TATANh-33 Pardih KumrumP.O- Kapali, JamshedpurDist- Singhbhum (East)Jharkhand
MADHYA PRADESHMADHYAPRADESHKatniMadhya Pradesh
UTTAR PRADESH
VARANASI11/4 Kuber ComplexD/58/2, Rathajatra
KOLKATA
BURDWANC/O. M/S. Nazrul Saw MillSadar Ghat RoadP.O- Sri PallyBurdwan
BARRACKPOREUAL-BengalProp. UAL Industries Ltd.Vill. KonkaporeP.O. NIlgunj Bazar,P.S. Barasat, Dist. 24 Pgs.,Kolkata-700121
RAIGANJBARODUARI, SAHARAI, NH-34(Opp- Ibp Petrol Pump)RaigunjMadhpur-733134Uttardinajpur
BARUIPURRamnagar, ShanibattalaCanning Road,24 Pgs(S)Baruipur,Kolkata-700144
2.19

WORKING CAPITAL MANAGEMENT
WORKING CAPITAL MANAGEMENT OF UAL INDUSTRIES LTD.
Powered by:-SAUMENDRA NANDA ISBM
WORKING CAPITAL
3.1 MEANING OF WORKING CAPITALWorking capital (abbreviated WC) is a financial metric which represents operatingliquidity available to a business, organization or other entity, including governmentalentity. Along with fixed assets such as plant and equipment, working capital isconsidered a part of operating capital. Net working capital is calculated as currentassets minus current liabilities. It is a derivation of working capital that is commonlyused in valuation techniques such as DCFs (Discounted cash flows). If current assets areless than current liabilities, an entity has a working capital deficiency, also called aworking capital deficit.A company can be endowed with assets and profitability but short of liquidity if itsassets cannot readily be converted into cash. Positive working capital is required toensure that a firm is able to continue its operations and that it has sufficient funds tosatisfy both maturing short-term debt and upcoming operational expenses. Themanagement of working capital involves managing inventories, accounts receivable andpayable, and cash.3.2 CONCEPTS OF WORKING CAPITALThere are two concepts of working capital, namely Gross concept and Net concept.Gross Working Capital According to this concept; working capital refers to the firm’sinvestment in current assets. The amount of current liabilities is not deducted from thetotal of current assets. This concept views Working Capital and aggregate of CurrentAssets as two inter-changeable terms. This concept is also referred to as `CurrentCapital' or `Circulating Capital'.The proponents of the gross working capital concept advocate this for the followingreasons:I. Profits are earned with the help of assets, which are partly fixed and partlycurrent. To a certain degree, similarity can be observed in fixed and currentassets so far as both are partly financed by borrowed funds, and are expected toyield earnings over and above the interest costs. Logic then demands that theaggregate of current assets should be taken to mean the working capital.II. Management is more concerned with the total current assets as they constitutethe total funds available for operating purposes than with the sources fromwhich the funds come.III. An increase in the overall investment in the enterprise also brings about anincrease in the working capital.Net Working CapitalThe net working capital refers to the difference between current assets and currentliabilities. Current liabilities are those claims of outsiders, which are expected to maturefor payment within an accounting year and include creditor’s dues, bills payable, bank
3.1
WORKING CAPITAL MANAGEMENT OF UAL INDUSTRIES LTD.
Powered by:-SAUMENDRA NANDA ISBM
overdraft and outstanding expenses. Net working capital can be positive or negative. Anegative net working capital occurs when current liabilities are in excess of currentassets."Whenever working capital is mentioned it brings to mind current assets and currentliabilities with a general understanding that working capital is the difference betweenthe two".‘Net working capital’ is a qualitative concept, which indicates the liquidity position ofthe firm and the extent to which working capital needs may be financed by permanentsources of finds. This needs some explanation.Current assets should be sufficiently in excess of current liabilities to constitute amargin or buffer for obligations maturing within the ordinary operating cycle of abusiness. A weak liquidity position poses a threat to the solvency of the company andmakes it unsafe. Excessive liquidity is also bad. It may be due to mismanagement ofcurrent assets. Therefore, prompt and timely action should be taken by management toimprove and correct the imbalance in the liquidity position of the firm.The net working capital concept also covers the question of a judicious mix of long-term and short-term funds for financing current assets. Every firm has a minimumamount of net working capital, which is permanent. Therefore, this portion of theworking capital should be financed with permanent sources of funds such as owners'capital, debentures, long-term debt, preference capital and retained earnings:Management must decide the extent to which current assets should be financed withequity capital and/or borrowed capital.Several economists uphold the net working capital concept. In support of their stand,they state that: In the long run what matters is the surplus of current assets over currentliabilities. It is this concept which helps creditors and investors to judge the financialsoundness of the enterprise. It is the excess of current assets over current liabilities, which can be relied uponto meet contingencies since this amount is not liable to be returned. It helps to ascertain the correct comparative financial position of companieshaving the same amount of current assets.
It may be stated that gross and net concepts of working capital are two important facetsof working capital management. Both the concepts have operational significance for themanagement and therefore neither can be ignored. While the net concept of workingcapital emphasizes the qualitative aspect, the gross concept underscores thequantitative aspect.3.3 SIGNIFICANCE OF WORKING CAPITALYou will hardly find a running business firm, which does not require some amount ofworking capital. Even a fully equipped manufacturing firm is sure to collapse without(a) An adequate supply of raw materials to process,(b) Cash to meet the wage bill,
3.2

WORKING CAPITAL MANAGEMENT OF UAL INDUSTRIES LTD.
Powered by:-SAUMENDRA NANDA ISBM
(c) The capacity to wait for the market for its finished products, and(d) The ability to grant credit to its customers.Similarly, a commercial enterprise is virtually good for nothing without merchandise tosell. Working capital, thus, is the life-blood of a business. As a matter of fact, anyorganisation, whether profit-oriented or otherwise, will not be able to carry on day-to-day activities without adequate working capital.3.4 Circulation of Working CapitalAt one given time both the current assets and current liabilities exist in the business.The current assets and current liabilities are flowing round in a business like an electriccurrent. However, “The working capital plays the same role in the business as the role ofheart in human body. Working capital funds are generated and these funds arecirculated in the business. As and when this circulation stops, the business becomeslifeless. It is because of this reason that he working capital is known as the circulatingcapital as it circulates in the business just like blood in the human body.”The chart depicting ‘Working Capital Cycle’ makes it clear that the amount of cash isobtained mainly from issue of shares, borrowing and operations. Cash funds are used topurchase fixed assets, raw materials and used to pay to creditors. The raw materials areprocessed; wages and overhead expenses are paid which in result produce finishedgoods for sale.
The sale of goods may be for cash or credit. In the former case, cash is directly receivedwhile in later case cash is collected from debtors. Funds are also generated fromoperation and sale of fixed assets. A portion of profit is used for payment of interest, taxand dividends while remaining is retained in the business. This cycle continuesthroughout the life of the business firm.3.5 Classification of Working CapitalThe quantitative concept of Working Capital is known as gross working capital whilethat under qualitative concept is known as net working capital.Working capital can be classified in various ways. The important classifications are asgiven below:
3.3
WORKING CAPITAL MANAGEMENT OF UAL INDUSTRIES LTD.
Powered by:-SAUMENDRA NANDA ISBM
Conceptual classification – There are two concept of working capital viz.,quantitative and qualitative. The quantitative concept takes into account as the currentassets while the qualitative concept takes into account the excess of current assets overcurrent liabilities. Deficit of working capital exists where the amount of currentliabilities exceeds the amount of current assets. The above can be summarised asfollows:(i) Gross Working Capital = Total Current Assets(ii) Net Working Capital = Excess of Current Assets over Current Liabilities(iii) Working Capital Deficit = Excess of Current Liabilities over Current Assets.Classification on the basis of financial reports – The information of working capitalcan be collected from Balance Sheet or Profit and Loss Account; as such the workingcapital may be classified as follows:(i) Cash Working Capital – This is calculated from the information contained in profitand loss account. This concept of working capital has assumed a great significance inrecent years as it shows the adequacy of cash flow in business. It is based on ‘OperatingCycle Concept’s which is explained later in this chapter.(ii) Balance Sheet Working Capital – The data for Balance Sheet Working Capital iscollected from the balance sheet. On this basis the Working Capital can also be dividedin three more types, viz., gross Working Capital, net Working Capital and WorkingCapital deficit.
Classification on the Basis of Variability – Gross Working Capital can bedivided in two categories viz., (i) permanent or fixed working capital, and (ii)Temporary, Seasonal or variable working capital. Such type of classification is veryimportant for hedging decisions.(i) Temporary Working Capital – Temporary Working Capital is also called asfluctuating or seasonal working capital. This represents additional investment neededduring prosperity and favourable seasons. It increases with the growth of the business.”Temporary working capital is the additional assets required to meet the variations insales above the permanent level.” This can be calculated as follows:Temporary Working Capital = Total Current Assets – permanent Current Assets(ii) Permanent Working Capital – It is a part of total current assets which is notchanged due to variation in sales. There is always a minimum level of cash, inventories,and accounts receivables which is always maintained in the business even if sales arereduced to a minimum. Amount of such investment is called as permanent workingcapital. “Permanent Working Capital is the amount of working capital that persists overtime regardless of fluctuations in sales.”This is also called as regular working capital.3.6 Factors Influencing Working Capital RequirementNumerous factors can influence the size and need of working capital in a concern. So noset rule or formula can be framed. It is rightly observed that, “There is no precise way todetermine the exact amount of gross or net working capital for every enterprise. Thedata and problem of each company should be analysed to determine the amount ofworking capital.Briefly, the optimum level of current assets depends upon following determinants.
Nature of business--Trading and industrial concerns require more funds forworking capital. Concerns engaged in public utility services need less working capital.For example, if a concern is engaged in electric supply, it will need less current assets,firstly due to cash nature of the transactions and secondly due to sale of services.However, it will invest more in fixed assets.3.4

WORKING CAPITAL MANAGEMENT OF UAL INDUSTRIES LTD.
Powered by:-SAUMENDRA NANDA ISBM
In addition to it, the investment varies concern to concern, depending upon thesize of business, the nature of the product, and the production technique.Conditions of supply-- If the supply of inventory is prompt and adequate, lessfunds will be needed. But, if the supply is seasonal or unpredictable, more funds will beinvested in inventory. Investment in working capital will fluctuate in case of seasonalnature of supply of raw materials, spare parts and stores.Production policy-- In case of seasonal fluctuations in sales, production willfluctuate accordingly and ultimately requirement of working capital will also fluctuate.However, sales department may follow a policy of off-season discount, so that sales andproduction can be distributed smoothly throughout the year and sharp, variations inworking capital requirement are avoided.Seasonal Operations-- It is not always possible to shift the burden ofproduction and sale to slack period. For example, in case of sugar mill more workingcapital will be needed at the time of crop and manufacturing.Credit Availability- If credit facility is available from banks and suppliers onfavourable terms and conditions, less working capital will be needed. If such facilitiesare not available more working capital will be needed to avoid risk.Credit policy of enterprises-- In some enterprises most of the sale is at cashand even it is received in advance while, in other sales is at credit and payments arereceived only after a month or two. In former case less working capital is needed thanthe later. The credit terms depend largely on norms of industry but enterprise someflexibility and discretion. In order to ensure that unnecessary funds are not tied up inbook debts, the enterprise should follow a rationalized credit policy based on the creditstanding of the customers and other relevant factors. Growth and expansion-- Theneed of working capital is increasing with the growth and expansion of an enterprise. Itis difficult to precisely determine the relationship between volume of sales and theworking capital needs. The critical fact, however, is that the need for increased workingcapital funds does not follow growth in business activities but precedes it. It is clear thatadvance planning is essential for a growing concern.Price level change─ With the increase in price level more and more workingcapital will be needed for the same magnitude of current assets. The effect of risingprices will be different for different enterprises.Circulation of working capital─ Less working capital will be needed with theincrease in circulation of working capital and vice-versa. Circulation means timerequired to complete one cycle i.e. from cash to material, from material to work-in-progress, form work-in-progress to finished goods, from finished goods to accountsreceivable and from accounts receivable to cash.Volume of sale-- This is directly indicated with working capital requirement,with the increase in sales more working capital is needed for finished goods anddebtors, its vice versa is also true.Liquidity and profitability-- There is a negative relationship between liquidityand profitability. When working capital in relation to sales is increased it will reducerisk and profitability on one side and will increase liquidity on the other side.Management ability ─ Proper co-ordination in production and distribution ofgoods may reduce the requirement of working capital, as minimum funds will beinvested in absolute inventory, non-recoverable debts, etc.
External Environment ─ With development of financial institutions, means ofcommunication, transport facility, etc., needs of working capital is reduced because itcan be available as and when needed.3.5
WORKING CAPITAL MANAGEMENT OF UAL INDUSTRIES LTD.
Powered by:-SAUMENDRA NANDA ISBM
3.7 COMPONENTS OF WORKING CAPITALYou have already noted that working capital has two components: Current assets andCurrent liabilities. Current assets comprise several items. The typical items are:I. Cash to meet expenses as and when they occur.II. Accounts Receivables or sundry trade debtorsIII. Inventory of:a) Raw materials, stores, supplies and spares,b) Work-in-process, andc) Finished goodsd) Advance payments towards expenses or purchases, and other short-termadvances which are recoverable.e) Temporary investment of surplus funds which could be converted intocash whenever needed.A part of the need for funds to finance the current assets may be met from supply of.Goods on credit, and deferment, on account of custom, usage or arrangement, ofpayment for expenses. The remaining part of the need for working capital may be metfrom short-term borrowing from financiers like banks. These items are collectivelycalled current liabilities. Typical items of current liabilities are:I. Goods purchased on creditII. Expenses incurred in the course of the business of the organisation (e.g.,wages or salaries, rent, electricity bills, interest etc.) which are not yetpaid for.III. Temporary or short term borrowings from banks, financial institutionsor other partiesIV. Advances received from parties against goods to be sold or delivered, oras short term deposits.V. Other current liabilities such as tax and dividends payable. Some of themajor components of current assets are explained here in brief:Cash: All of us know that the basic input to start any business is cash. Cash is initiallyrequired for acquiring fixed assets like plants and machinery which enables a firm toproduce products and generate cash by selling them. Cash is also required and investedin working capital. An investment in working capital is required, as firms have to storecertain quantity of raw materials and finished goods and also for providing credit termsto the customers.A minimum level of cash helps in the conduct of everyday ordinary business such asmaking of purchases and sales as well as for meeting the unexpected payments,developments and other contingencies. As discussed earlier cash invested at thebeginning of-the operating cycle gets released at the end of the cycle to fund freshinvestments. However, additional cash is required by the firm when it needs to buymore fixed assets, increase the level of operations or for bringing out change in workingcapital cycle such as extending credit period to the customers.The demand for cash is affected by several factors, some of them are within the controlof the managers and some are outside their control. It is not possible to operate thebusiness without holding cash but at the same time holding it without a purpose alsocosts a firm either directly in the form of interest or loss of income that could be earnedout of the cash.
3.6

WORKING CAPITAL MANAGEMENT OF UAL INDUSTRIES LTD.
Powered by:-SAUMENDRA NANDA ISBM
In the context of working capital management, cash management refers to optimizingthe benefit and cost associated with holding cash. The objective of cash management isbest achieved by speeding up the working capital cycle, particularly the collectionprocess and investing surplus cash in short term assets in most profitable avenues.We will be subsequently discussing certain issues like the management of cash flowsand determination of optimal cash balance, etc.Accounts Receivable: Firms rather prefer to sell for cash than on credit, butcompetitive pressures force most firms to offer credit. Today the use of credit in thepurchase f goods and services is so common that it is taken for granted. Selling goods orproviding services on credit basis leads to accounts receivable. When consumers expectcredit, business units in turn expect credit from their suppliers to match theirinvestment in credit extended to consumers. The granting of credit from one businessfirm to another for purchase of goods and services is popularly known as trade credit.Though commercial banks provide a significant part of requirements for workingcapital, trade credit continues to be a major source of funds for firms and accountsreceivable that result from granting trade credit are major investment for the firm.Both direct and indirect costs are associated with carrying receivables, but it has animportant benefit for increasing sales. Excessive levels of accounts receivables result indecline of cash flows and much result in bad debts which in turn may reduce the profitof the firm. Therefore, it is very important to monitor and manage receivables carefullyand regularly. We would be dealing with this topic in MS-41: Working CapitalManagement.Inventory: Three things will come to your mind when you think of a manufacturingunit - machines, men and materials. Men using machines and tools convert the materialsinto finished goods. The success of any business unit depends on the extent to whichthese are efficiently managed. Inventory is an asset to the organisation like othercomponents of current assets.Inventory constitutes a very significant part of working capital or current assets inmanufacturing organisation. It is essential to control inventories (physical/quantitycontrol and value control) as these are significant elements in the costing processconstituting sometimes more than 60% of the current assets.Inventory holding is desirable because it meets several objectives and needs but anexcessive inventory is undesirable because it costs a lot to firms.Inventory which consists of raw material components and other consumables, work inprocess and finished goods, is an important component of `current assets'. There areseveral factors like nature of industry, availability of material, technology, businesspractices, price fluctuation, etc. that determines the amount of inventory holding.Holding inventory ensures smooth production process, price stability and immediatedelivery to customers. Since inventory is like any other form of assets, holding inventoryhas a cost. The cost includes opportunity cost of funds blocked in inventory, storagecost, stock out cost, etc. The benefits that come from holding inventory should exceedthe cost to justify a particular level of inventory.Marketable Securities: Cash and marketable securities are normally treated as oneitem in any analysis of current assets although these are not the same as cash they canbe converted to cash at a very short notice. Holding cash in excess of immediate
3.7
WORKING CAPITAL MANAGEMENT OF UAL INDUSTRIES LTD.
Powered by:-SAUMENDRA NANDA ISBM
requirement means the firm is missing out an opportunity income. Excess cash isnormally invested in marketable securities, which serves two purposes namely, provideliquidity and, also earn a return.3.8 Forecasting of Working CapitalTo forecast the working capital requirement for the next year the followingformula may be used:(Estimated cost of goods sold x Operating Cycle) + Desired Cash Balance3.9 Control of Working CapitalWorking capital requirement depends upon the level of operation and the length ofoperating cycle. Monitoring the duration of the operating cycle is an importantingredient of working capital control. In this context, the following points should bornein mind:1. The duration of the raw material stage depends on regularity of supply,transportation time, price fluctuations and economy of bulk purchase. Forimported materials it takes a longer time.
Example – X Ltd. expects its cost of goods sold for the forthcoming year to be Rs.2 crore. The present operating cycle of the firm is 78 days. The firm plans toreduce its operating cycle to 73 days and desired cash balance is Rs. 5 lakh.The expected working capital requirement would be,2,00,00,000 x 73/365 + 5,00,000 = Rs. 45,00,0002. The duration of the work-in-process depends on the length of manufacturing cycle,consistency in capacities at different stages, and efficient coordination of variousinputs.3. The duration of the finished goods depends on the pattern of production and sales.If production is fairly uniform throughout the year but sales are highly seasonalor vice versa. The duration of finished goods tends to be long.4. The duration at the debtor’s stage depends on the credit period granted, discountsoffered for prompt payment, and efficiency and rigour of collection efforts.It is helpful to monitor the behaviour of overall operating cycle and its individualcomponents. For this purpose time series analysis and cross section analysis may bedone. In time series analysis the duration of the operating cycle and its individualcomponents is compared over a period of time for same firm. In cross section analysisthe duration of the operating cycle and its individual components is compared with thatof other firms of a comparable nature.Adequacy of Working CapitalThe importance of adequacy of working capital can hardly be over-emphasized. John L.O. Donnell and Milton S. Gladberg observe “Many a times business failure takes place due to lackof working capital.” Hence, working capital is considered as the life blood and the controllingnerve centre of a business. Inadequate working capital is business ailment. Therefore, a firm hasto maintain a sound working capital. It should be adequate foe the following reasons:(1) It protects a business form the adverse effects of shrinkage in the values of current assets.
3.8

WORKING CAPITAL MANAGEMENT OF UAL INDUSTRIES LTD.
Powered by:-SAUMENDRA NANDA ISBM
(2) It is possible to pay all the current obligations promptly and to take advantage ofcash discounts.(3) It ensures, to a greater extent, the maintenance of a company’s credit standing andprovides for such emergencies as strikes, floods, fires etc.(4) It permits the carrying of inventories at a level that would enable a business to servesatisfactorily the needs of its customers.(5)` It enables a company to extend favourable credit terms to its customers.(6) It enables a company to operate its business more efficiently because there is nodelay in obtaining materials, etc., because of credit difficulties.(7) It enables a business to withstand periods of depression smoothly.(8) There may be operating losses or decreased retained earnings.(9) There may be excessive non-operating or extraordinary losses.(10) The management may fail to obtain funds from other sources for purposes ofexpansion.(11) There may be an unwise dividend policy(12) Current funds may be invested in non-current assets(13) The management may fail to accumulate funds necessary for meeting debentureson maturity.(14) Increasing price may necessitate bigger investments in inventories and fixed asset.3.10 Source of Working CapitalConventional generalizations relating to financing of working capital suggest thatan amount equal to the basic minimum of current assets should be financed from long-term source and that only seasonal needs of working capital should be financed fromshort-term sources. It is obvious that such an arrangement helps to keep the cost ofworking capital finance to the minimum for an enterprise and gives a rise to its rate ofreturn on the total funds employed. Viewed thus, the sources of working finance can beclassified into permanent and the current sources of working capital finance.3.11 Structure of Working CapitalThe study of structure of working capital is another name for the study of workingcapital cycle. In other words, it can be said that the study of structure of working capitalis the study of the elements of current assets viz. inventory, receivable, cash and bankbalances and other liquid resources like short-term or temporary investments. Currentliabilities usually comprise bank borrowings, trade credits, assessed tax and unpaiddividends or any other such things. The following points mention relating to variouselements of working capital deserves:
Inventory– Inventory is major item of current assets. The management ofinventories – raw material, goods-in-process and finished goods is an important factorin the short-run liquidity positions and long-term profitability of the company.Raw material inventories– Uncertainties about the future demand for finishedgoods, together with the cost of adjusting production to change in demand will cause afinancial manager to desire some level of raw material inventory. In the absence of such
3.9
WORKING CAPITAL MANAGEMENT OF UAL INDUSTRIES LTD.
Powered by:-SAUMENDRA NANDA ISBM
inventory, the company could respond to increased demand for finished goods only byincurring explicit clerical and other transactions costs of ordinary raw material forprocessing into finished goods to meet that demand. If changes in demand are frequent,these order costs may become relatively large. Moreover, attempts to purchases hastilythe needed raw material may necessitate payment of premium purchases prices toobtain quick delivery and, thus, raises cost of production. Finally, unavoidable delays inacquiring raw material may cause the production process to shut down and then re-start again raising cost of production. Under these conditions the company cannotrespond promptly to changes in demand without sustaining high costs. Hence, somelevel of raw materials inventory has to be held to reduce such costs. Determining itsproper level requires an assessment of costs of buying and holding inventories and acomparison with the costs of maintaining insufficient level of inventories.Work-in-process inventory– This inventory is built up due to production cycle.Production cycle is the time-span between introduction of raw material into productionand emergence of finished product at the completion of production cycle. Till theproduction cycle is completed, the stock of work-in-process has to be maintained.Finished goods inventory– Finished goods are required for reasons similar tothose causing the company to hold raw materials inventories. Customer’s demand forfinished goods is uncertain and variable. If a company carries no finished goodsinventory, unanticipated increases in customer demand would require suddenincreases in the rate of production to meet the demand. Such rapid increase in the rateof production may be very expensive to accomplish. Rather than loss of sales, becausethe additional finished goods are not immediately available or sustain high costs ofrapid additional production, it may be cheaper to hold a finished goods inventory. Theflexibility afforded by such an inventory allows a company to meet unanticipatedcustomer demands at relatively lower costs than if such an inventory is not held.Thus, to develop successfully optimum inventory policies, the management needs toknow about the functions of inventory, the cost of carrying inventory, economic orderquantity and safety stock. Industrial machinery is usually very costly and it is highlyuneconomical to allow it to lie idle. Skilled labour also cannot be hired and fired at will.Modern requirements are also urgent. Since requirements cannot wait and since thecost of keeping machine and men idle is higher, than the cost of storing the material, it iseconomical to hold inventories to the required extent. The objectives of inventorymanagement are:(1) To minimize idle cost of men and machines causes by shortage of raw materials,stores and spare parts.(2) To keep down:(a) Inventory ordering cost.(b) Inventory carrying cost,(c) Capital investment in inventories.(d) Obsolescence lossesReceivables – Many firms make credit sales and as a result thereof carryreceivable as a current asset. The practice of carrying receivables has severaladvantages viz., (i) reduction of collection costs over cash collection, (ii) Reduction inthe variability of sales, and (iii) increase in the level of near-term sales. While immediate
3.104
WORKING CAPITAL MANAGEMENT OF UAL INDUSTRIES LTD.
Powered by:-SAUMENDRA NANDA ISBM
collection of cash appears to be in the interest of shareholders, the cost of that policymay be very high relative to costs associated with delaying the receipt of cash byextension of credit. Imagine, for example, an electric supply company employing aperson at every house constantly reading electricity meter and collecting cash from himevery minute as electricity is consumed. It is far cheaper for accumulating electricityusage and bill once a month. This of course, is a decision to carry receivables on the partof the company. It may also be true that the extension of credit by the firm to itscustomers may reduce the variability of sales over time. Customers confined to cashpurchases may tend to purchase goods when cash is available to them. Erratic andperhaps cyclical purchasing patterns may then result unless credit can be obtainedelsewhere. Even if customers do obtain credit elsewhere, they must incur additionalcost of search in arranging for a loan costs that can be estimated when credit is given bya supplier. Therefore, extension of credit to customers may well smooth out of thepattern of sales and cash inflows to the firm over time since customers need not wait forsome inflows of cash to make a purchase. To the extent that sales are smoothed, cost ofadjusting production to changes in the level of sales should be reduced. Finally, theextension of credit by firms may act to increase near-term sales. Customers need notwait to accumulate necessary cash to purchase an item but can acquire it immediatelyon credit. This behaviour has the effect of shifting future sales close to the present time.Therefore, the extension of credit by a firm and the resulting investment in receivablesoccurs because it pays a firm to do so. Costs of collecting revenues and adapting tofluctuating customer demands may make it desirable to offer the convenienceassociated with credit to firm’s customers. To the extents that near sales are alsoincreased, extension of credit is made even more attractive for the firm.Cash and interest-bearing liquid assets– Cash is one of the most importanttools of day-to-day operation, because it is a form of liquid capital which is available forassignment to any use. Cash is often the primary factor which decides the course ofbusiness destiny. The decision to expand a business may be determined by theavailability of cash and the borrowing of funds will frequently be dictated by cashposition. Cash-in-hand, however, is a non-earning asset. This leads to the question as towhat is the optimum level of this idle resource. This optimum depends on variousfactors such as the manufacturing cycle, the sale and collection cycle, age of the bills andon the maturing of debt. It also depends upon the liquidity of other current assets andthe matter of expansion. While a liberal maintenance of cash provides a sense ofsecurity, a lack of sufficiency of cash hampers day-to-day operations. Prudence,therefore, requires that no more cash should be kept on hand than the optimumrequired for handling miscellaneous transactions over the counter and pettydisbursements etc.It has not become a practice with business enterprises to avoid too much redundantcash by investing a portion of their earnings in assets which are susceptible to easyconversion into cash. Such assets may include government securities, bonds, debenturesand shares that are known to be readily marketable and that may be liquidated at amoment’s notice when cash is needed.
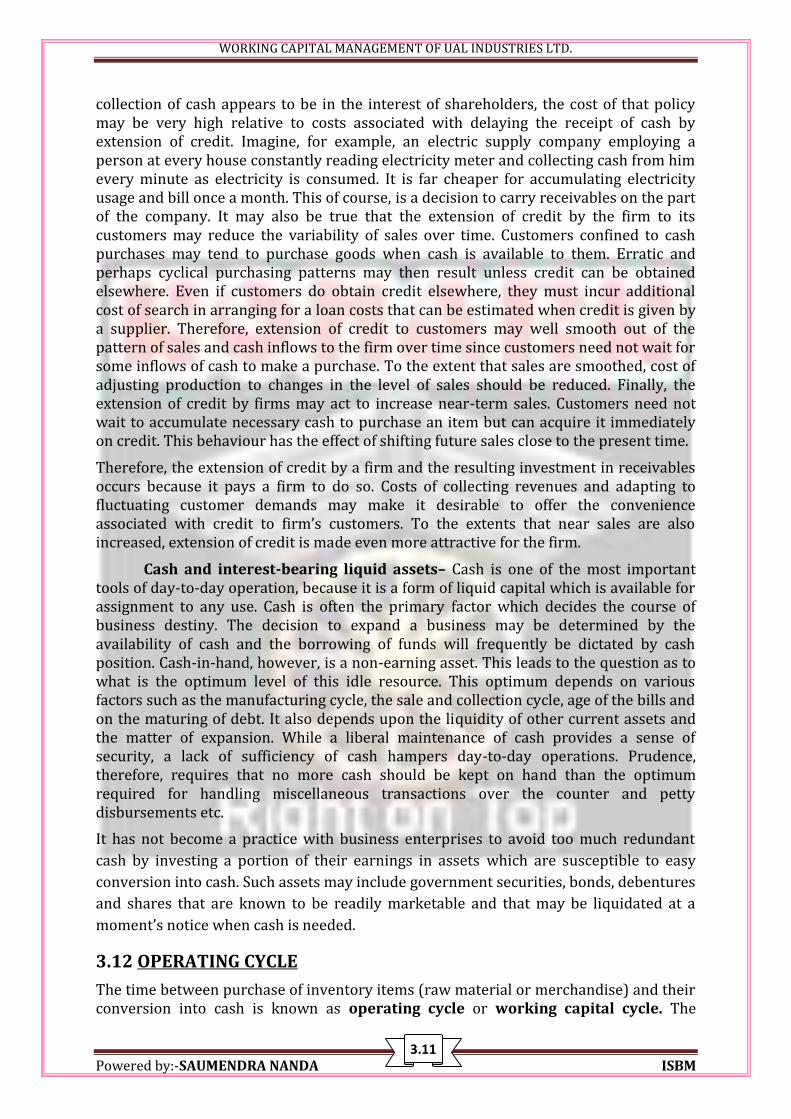
3.12 OPERATING CYCLEThe time between purchase of inventory items (raw material or merchandise) and theirconversion into cash is known as operating cycle or working capital cycle. The3.111
WORKING CAPITAL MANAGEMENT OF UAL INDUSTRIES LTD.
Powered by:-SAUMENDRA NANDA ISBM
successive events which are typically involved in an operating cycle. A perusal of theoperating cycle would reveal that the funds invested in operations are re-cycled backinto cash. The cycle, of course, takes some time to complete. The longer the period ofthis conversion the longer is the operating cycle. A standard operating cycle may be forany time period but does not generally exceed a financial year. Obviously, the shorterthe operating cycle, the larger will be the turnover of funds invested for variouspurposes. The channels of the investment are called current assets. Sometimes theavailable funds may be in excess of the needs for investment in these assets, e.g.,inventory, receivables and minimum essential cash balance. Any surplus may beinvested in government securities rather than being retained as idle cash balance.
3.13 Duration of the Operating CycleThe duration of the operating cycle is equal to the sum of the duration of each of thesestages less the credit period allowed by the suppliers of the firm. In symbols,O = R + W + F + D – CWhere,O = duration of operating cycle.R = raw material storage period.W= work-in-process period.F= finished goods storage period.D=debtors collection period, andC = creditors payment period.The components of the operating cycle may be calculated as follows:R= Average stock of raw materials and storesAverage raw material and stores consumption per dayW= Average work-in-process inventoryAverage cost of production per day3.12

WORKING CAPITAL MANAGEMENT OF UAL INDUSTRIES LTD.
Powered by:-SAUMENDRA NANDA ISBM
F= Average finished goods inventoryAverage cost of goods sold per day per dayD= Average book debtsAverage credit sales per dayC= Average trade creditorsAverage credit purchase per dayWORKING CAPITAL MANAGEMENT
3.14 Introduction of Working Capital ManagementWorking capital management is the device of finance. It is related to manage of currentassets and current liabilities. After learning working capital management, commercestudents can use this tool for fund flow analysis. Working capital is very significant forpaying day to day expenses and long term liabilities.3.15 Meaning of Working Capital ManagementThe management of current assets, current liabilities and inter-relationship betweenthem is termed as working capital management. “Working capital management isconcerned with problems that arise in attempting to manage the current assets, thecurrent liabilities and the inter-relationship that exist between them.” In practice,“There is usually a distinction made between the investment decisions concerningcurrent assets and the financing of working capital.”From the above, the following two aspects of working capital management emerge:(1) To determine the magnitude of current assets or “level of working capital”and(2) To determine the mode of financing or “hedging decisions.”3.16 Concept of Working Capital ManagementThere are two concepts of working capital viz. quantitative and qualitative. Somepeople also define the two concepts as gross concept and net concept. According toquantitative concept, the amount of working capital refers to ‘total of current assets’.What we call current assets? Smith called, ‘circulating capital’. Current assets areconsidered to be gross working capital in this concept.The qualitative concept gives an idea regarding source of financing capital. According toqualitative concept the amount of working capital refers to “excess of current assetsover current liabilities.” L.J. Guthmann defined working capital as “the portion of a firm’scurrent assets which are financed from long–term funds.”The excess of current assets over current liabilities is termed as ‘Net working capital’. Inthis concept “Net working capital” represents the amount of current assets which wouldremain if all current liabilities were paid. Both the concepts of working capital havetheir own points of importance. “If the objectives is to measure the size and extent towhich current assets are being used, ‘Gross concept’ is useful; whereas in evaluating theliquidity position of an undertaking ‘Net concept’ becomes pertinent and preferable.
3.13
WORKING CAPITAL MANAGEMENT OF UAL INDUSTRIES LTD.
Powered by:-SAUMENDRA NANDA ISBM
It is necessary to understand the meaning of current assets and current liabilities forlearning the meaning of working capital, which is explained below.Current assets – It is rightly observed that “Current assets have a short life span.These types of assets are engaged in current operation of a business and normally usedfor short– term operations of the firm during an accounting period i.e. within twelvemonths. The two important characteristics of such assets are, (i) short life span, and (ii)swift transformation into other form of assets. Cash balance may be held idle for a weekor two, account receivable may have a life span of 30 to 60 days, and inventories may beheld for 30 to 100 days.”Fitzgerald defined current assets as, “cash and other assets which are expected to beconverted in to cash in the ordinary course of business within one year or within suchlonger period as constitutes the normal operating cycle of a business.”Current liabilities – The firm creates a Current Liability towards creditors(sellers) from whom it has purchased raw materials on credit. This liability is alsoknown as accounts payable and shown in the balance sheet till the payment has beenmade to the creditors.The claims or obligations which are normally expected to mature for payment within anaccounting cycle are known as current liabilities. These can be defined as “thoseliabilities where liquidation is reasonably expected to require the use of existingresources properly classifiable as current assets, or the creation of other current assets,or the creation of other current liabilities.”
Circulating capital – working capital is also known as ‘circulating capital orcurrent capital.’ “The use of the term circulating capital instead of working capitalindicates that its flow is circular in nature.”3.17 Importance of Working Capital ManagementFor smooth running an enterprise, adequate amount of working capital is very essential.Efficiency in this area can help, to utilize fixed assets gainfully, to assure the firm’s long-term success and to achieve the overall goal of maximization of the shareholders, fund.Shortage or bad management of cash may result in loss of cash discount and loss ofreputation due to non-payment of obligation on due dates. Insufficient inventories maybe the main cause of production held up and it may compel the enterprises to purchaseraw materials at unfavourable rates.Like-wise facility of credit sale is also very essential for sales promotions. It is rightlyobserved that “many a times business failure takes place due to lack of working capital.”Adequate working capital provides a cushion for bad days, as a concern can pass itsperiod of depression without much difficulty.O’ Donnel et al. correctly explained the significance of adequate working capital andmentioned that “to avoid interruption in the production schedule and maintain sales, aconcern requires funds to finance inventories and receivables.”The adequacy of cash and current assets together with their efficient handling virtuallydetermines the survival or demise of a concern. An enterprise should maintain adequateworking capital for its smooth functioning. Both, excessive working capital andinadequate working capital will impair the profitability and general health of a concern.The dangers of excessive working capital are as follows:
3.14

WORKING CAPITAL MANAGEMENT OF UAL INDUSTRIES LTD.
Powered by:-SAUMENDRA NANDA ISBM
Heavy investment in fixed assets – A concern may invest heavily in their fixedasset which is not justified by actual sales. This may create situation of overcapitalisation.Reckless purchase of materials- Inventory is purchased recklessly whichresults in dormant slow moving and obsolete inventory. At the same time it mayincrease the cost due to mishandling, waste, theft, etc.Speculative tendencies - Speculative tendencies may increase and if profit isincreased dividend distribution will also increase. This will hamper the image of aconcern in future when speculative loss may start.Liberal credit - Due to liberal credit, size of accounts receivables will alsoincrease. Liberal credit facility can increase bad debts and wrong practices will start,regarding delay in payments.Carelessness - Excessive working capital will lead to carelessness about costswhich will adversely affect the profitability.
Paucity of working capital is also bad and has the following dangers:1. Implementation of operating plans becomes difficult and a concern may notachieve its profit target.2. It is difficult to pay dividend due to lack of funds.3. Bargaining capacity is reduced in credit purchases and cash discount could notbe availed.4. An enterprise loses its reputation when it becomes difficult even to meet day-to- day commitments.5. Operating inefficiencies may creep in when a concern cannot meet it financialpromises.6. Stagnates growth as the funds are not available for new projects.7. A concern will have to borrow funds at an exorbitant rate of interest in case ofneed.8. Sometimes, a concern may be bound to sale its product at a much reducedrates to collect funds which may harm its image.3.18 Significance of Working Capital ManagementFunds are needed in every business for carrying on day-to-day operations. Workingcapital funds are regarded as the life blood of a business firm. A firm can exist andsurvive without making profit but cannot survive without working capital funds. If afirm is not earning profit it may be termed as ‘sick’, but, not having working capital maycause its bankruptcy working capital in order to survive. The alternatives are notpleasant. Bankruptcy is one alternative. Being acquired on unfavourable term asanother. Thus, each firm must decide how to balance the amount of working capital itholds, against the risk of failure.”Working capital has acquired a great significance and sound position in the recent pastfor the twin objects of profitability and liquidity. In period of rising capital costs andscare funds, the working capital is one of the most important areas requiringmanagement review. It is rightly observed that, “Constant management review isrequired to maintain appropriate levels in the various working capital accounts.” Mainlythe success of a concern depends upon proper management of working capital so“working capital management has been looked upon as the driving seat of financialmanager.”
3.15
WORKING CAPITAL MANAGEMENT OF UAL INDUSTRIES LTD.
Powered by:-SAUMENDRA NANDA ISBM
It consumes a great deal of time to increase profitability as well as to maintain properliquidity at minimum risk. There are many aspects of working capital managementwhich make it an important function of the finance manager. In fact we need to knowwhen to look for working capital funds, how to use them and how measure, plan andcontrol them.A study of working capital management is very important foe internal and externalexperts. Sales expansion, dividend declaration, plants expansion, new product line,increase in salaries and wages, rising price level, etc., put added strain on workingcapital maintenance. Failure of any enterprise is undoubtedly due to poor managementand absence of management skill.Importance of working capital management stems from two reasons, viz., (i) Asubstantial portion of total investment is invested in current assets, and (ii) level ofcurrent assets and current liabilities will change quickly with the variation in sales.Though fixed assets investment and long-term borrowing will also response to thechanges in sales, but its response will be weak.3.19 Theory of Working Capital ManagementThe interaction between current assets and current liabilities is, therefore, the maintheme of the theory of working capital management. Working capital management isconcerned with the problem that arises in attempting to manage the current assets, thecurrent liabilities and the inter-relationship that exist between them. The goal ofworking capital management is to manage a firm’s current assets and current liabilitiesin such a way that a satisfactory level of working capital is maintained.3.20 Principles of Working Capital ManagementThe following are the principles of working capital management:
Principles of the risk variation─ Risk here refers to the inability of firm tomaintain sufficient current assets to pay its obligations. If working capital is variedrelative to sales, the amount of risk that a firm assumes is also varied and theopportunity for gain or loss is increased. In other words, there is a definite relationshipbetween the degree of risk and the rate of return. As a firm assumes more risk, theopportunity for gain or loss increases. As the level of working capital relative to salesdecreases, the degree of risk increases. When the degree of risk increases, theopportunity for gain and loss also increases. Thus, if the level of working capital goes up,amount of risk goes down, and vice-versa, the opportunity for gain is like-wise adverselyaffected.Principle of equity position─ According to this principle, the amount ofworking capital invested in each component should be adequately justified by a firm’sequity position. Every rupee invested in the working capital should contribute to the networth of the firm.Principle of cost of capital─ This principle emphasizes that different sources offinance have different cost of capital. It should be remembered that the cost of capitalmoves inversely with risk. Thus, additional risk capital results in decline in the cost ofcapital.
Principle of maturity of payment─ A company should make every effort to relatematurity of payments to its flow of internally generated funds. There should be the least3.16

WORKING CAPITAL MANAGEMENT OF UAL INDUSTRIES LTD.
Powered by:-SAUMENDRA NANDA ISBM
disparity between the maturities of a firm’s short-term debt instruments and its flow ofinternally generated funds, because a greater risk is generated with greater disparity. Amargin of safety should, however, be provided for any short-term debt payment.3.21 APPROACHES TO MANAGING WORKING CAPITALTwo approaches are generally followed for the management of working capital: (i) theconventional approach, and (ii) the operating cycle approach.The Conventional ApproachThis approach implies managing the individual components of working capital (i.e.inventory, receivables, payables, etc) efficiently and economically so that there areneither idle neither funds nor paucity of funds. Techniques have been evolved for themanagement of each of these components. In India, more emphasis is given to themanagement of debtors because they generally constitute the largest share of theinvestment in working capital. On the other hand, inventory control has not yet beenpractised on a wide scale perhaps due to scarcity of goods (or commodities) and everrising prices.The Operating Cycle ApproachThis approach views working capital as a function of the volume of operating expenses.Under this approach the working capital is determined by the duration of the operatingcycle and the operating expenses needed for completing the cycle. The duration of theoperating cycle is the number of day involved in the various stages, commencing withacquisition of raw materials to the realisation of proceeds from debtors. The creditperiod allowed by creditors will have to be set off in the process. The optimum level ofworking capital will be the requirement of operating expenses for an operating cycle,calculated on the basis of operating expenses required for a year.In India, most of the organisations use to follow the conventional approach earlier, butnow the practice is shifting in favour of the operating cycle approach. The banks usuallyapply this approach while granting credit facilities to their clients.
3.17
DATA ANALYSIS &INTERPRETATION

WORKING CAPITAL MANAGEMENT OF `UAL INDUSTRIES LTD.’
Powered by:-SAUMENDRA NANDA ISBM
4.1 DATA ANALYSIS AND INTERPRETATION
WORKINGCAPITAL
INVENTORYMANAGEMENT
RECEIVABLESMANAGEMENT
CASHMANAGEMEN
T
4.1
WORKING CAPITAL MANAGEMENT OF `UAL INDUSTRIES LTD.’
Powered by:-SAUMENDRA NANDA ISBM
4.1 DATA ANALYSIS AND INTERPRETATION
DATA ANALYSIS ANDINTERPRETATION
WORKINGCAPITAL
MANAGEMENT
OPERATINGCYCLE
INVENTORYMANAGEMENT
RECEIVABLESMANAGEMENT
CASHMANAGEMEN
T
4.1
WORKING CAPITAL MANAGEMENT OF `UAL INDUSTRIES LTD.’
Powered by:-SAUMENDRA NANDA ISBM
4.1 DATA ANALYSIS AND INTERPRETATION
OPERATINGCYCLE
INVENTORYMANAGEMENT
RECEIVABLESMANAGEMENT
CASHMANAGEMEN
T
4.1
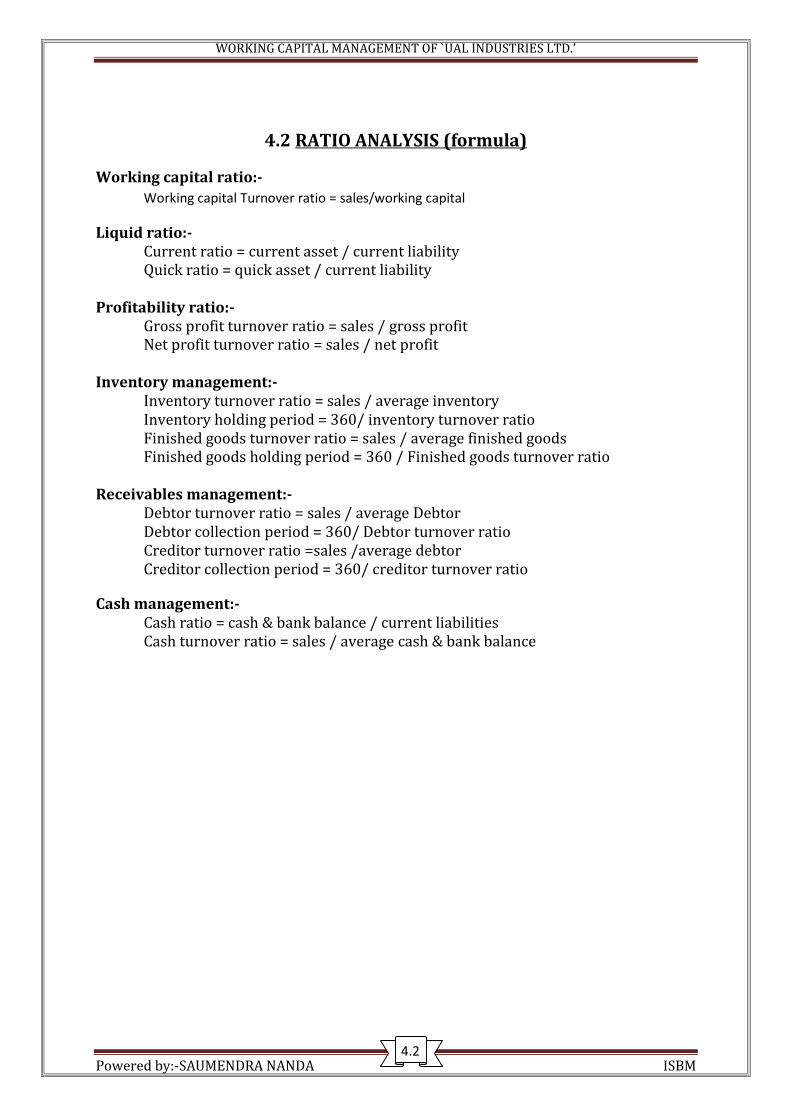
WORKING CAPITAL MANAGEMENT OF `UAL INDUSTRIES LTD.’
Powered by:-SAUMENDRA NANDA ISBM
4.2 RATIO ANALYSIS (formula)
Working capital ratio:-Working capital Turnover ratio = sales/working capital
Liquid ratio:-Current ratio = current asset / current liabilityQuick ratio = quick asset / current liabilityProfitability ratio:-Gross profit turnover ratio = sales / gross profitNet profit turnover ratio = sales / net profitInventory management:-Inventory turnover ratio = sales / average inventoryInventory holding period = 360/ inventory turnover ratioFinished goods turnover ratio = sales / average finished goodsFinished goods holding period = 360 / Finished goods turnover ratioReceivables management:-Debtor turnover ratio = sales / average DebtorDebtor collection period = 360/ Debtor turnover ratioCreditor turnover ratio =sales /average debtorCreditor collection period = 360/ creditor turnover ratioCash management:-Cash ratio = cash & bank balance / current liabilitiesCash turnover ratio = sales / average cash & bank balance
4.2

WORKING CAPITAL MANAGEMENT OF `UAL INDUSTRIES LTD.’
Powered by:-SAUMENDRA NANDA ISBM
4.3.1 STATEMENT SHOWING THE SCHEDULE OF CHANGING IN WORKING CAPITAL
FROM THE YEAR 2006-2007
(SOURCES: ANNUAL REPORT OF COMPANY)
INFERENCE: The above table show that there has been increase in the working capital to the
extent of RS 23, 45, 87,479 for the year 2006 to 2007. This increase of working capital happens due to huge increase in the inventory. If we analyze the working capital statement we can see that the requirement of
current asset increase but the company has unable to arrange adequate currentliabilities for which extra finance required for in terms of working capital.
FROM THE YEAR 2007-2008
PARTICULAR 2007(RS) 2008(RS) INCREASE(RS) DECREASE(RS)
CURRENT ASSETINVENTORY 56,60,52,636 53,31,52,143 3,29,00,493
SUNDRY DEBTOR 15,26,87,328 19,83,44,469 4,56,57,141
CASH & BANK BALANCE 8,26,08,765 14,85,08,377 6,58,99,612LOANS & ADVANCES 11,13,73,797 11,82,50,593 68,76,796
TOTAL(A) 91,27,22,526 99,82,55,582CURRENT LIABILITIES
CURRENT LIABILITIES 34,61,54,317 34,79,11,682 3,92,85,57,365PROVISION 9,37,31,746 8,83,99,671 53,32,075
TOTAL(B) 43,98,86,063 43,63,11,353WORKING CAPITAL 47,28,36,463 56,19,44,229 8,91,07,766
(SOURCES: ANNUAL REPORT OF COMPANY)
INFERENCE: The above table show that there has been increase in the working capital to the extent of
RS 8, 91, 07,766 for the year 2007 to 2008.
PARTICULAR 2006 2007(RS) INCREASE(RS) DECREASE(RS)CURRENT ASSETINVENTORY 31,86,55,121.00 56,60,52,636 24,73,97,515SUNDRY DEBTOR 8,03,23,114.00 15,26,87,328 7,23,64,214CASH & BANKBALANCE 10,70,20,652.00 8,26,08,765 2,44,11,887LOANS & ADVANCES 7,49,92,143.00 11,13,73,797 3,63,81,654TOTAL(A) 58,09,91,030.00 91,27,22,526
CURRENT LIABILITIESCURRENT LIABILITIES 27,30,68,001.00 34,61,54,317 3,92,85,57,365PROVISION 6,96,74,045.00 9,37,31,746 53,32,075TOTAL(B) 34,27,42,046.00 43,98,86,063WORKING CAPITAL 23,82,48,984.00 47,28,36,463 23,45,87,479
4.33
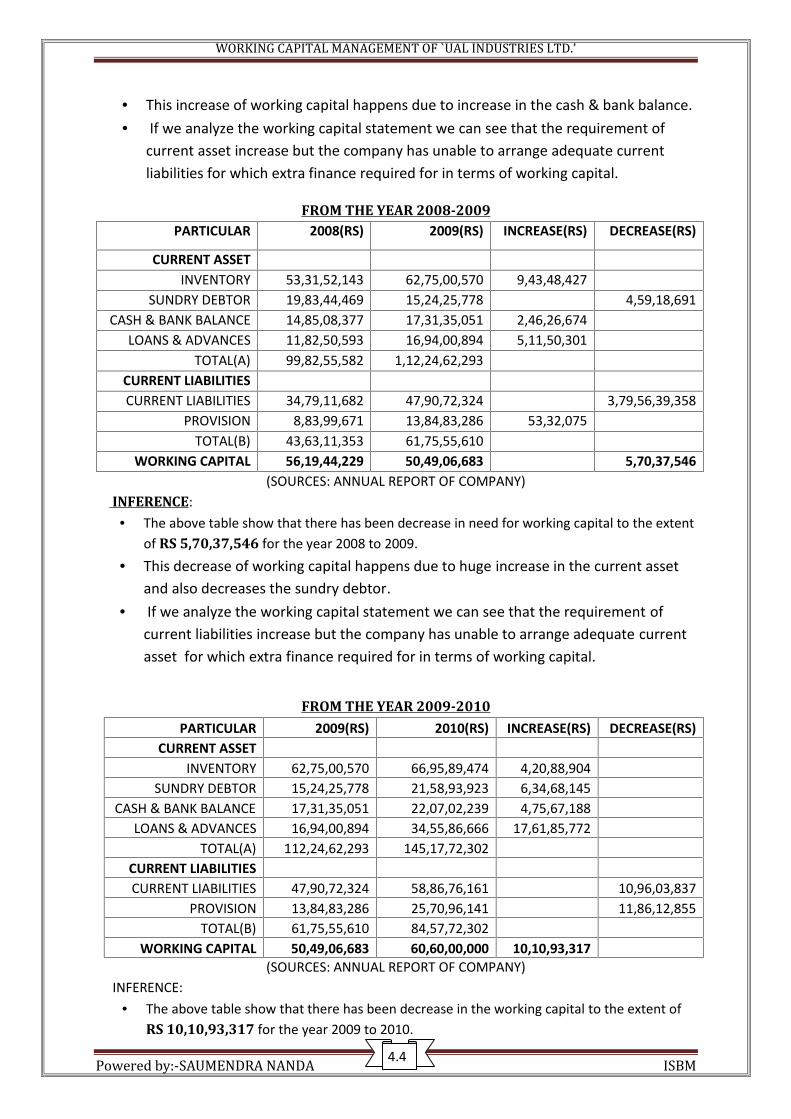
WORKING CAPITAL MANAGEMENT OF `UAL INDUSTRIES LTD.’
Powered by:-SAUMENDRA NANDA ISBM
This increase of working capital happens due to increase in the cash & bank balance. If we analyze the working capital statement we can see that the requirement of
current asset increase but the company has unable to arrange adequate currentliabilities for which extra finance required for in terms of working capital.
FROM THE YEAR 2008-2009PARTICULAR 2008(RS) 2009(RS) INCREASE(RS) DECREASE(RS)
CURRENT ASSETINVENTORY 53,31,52,143 62,75,00,570 9,43,48,427
SUNDRY DEBTOR 19,83,44,469 15,24,25,778 4,59,18,691CASH & BANK BALANCE 14,85,08,377 17,31,35,051 2,46,26,674
LOANS & ADVANCES 11,82,50,593 16,94,00,894 5,11,50,301TOTAL(A) 99,82,55,582 1,12,24,62,293
CURRENT LIABILITIESCURRENT LIABILITIES 34,79,11,682 47,90,72,324 3,79,56,39,358
PROVISION 8,83,99,671 13,84,83,286 53,32,075TOTAL(B) 43,63,11,353 61,75,55,610
WORKING CAPITAL 56,19,44,229 50,49,06,683 5,70,37,546(SOURCES: ANNUAL REPORT OF COMPANY)
INFERENCE: The above table show that there has been decrease in need for working capital to the extent
of RS 5,70,37,546 for the year 2008 to 2009. This decrease of working capital happens due to huge increase in the current asset
and also decreases the sundry debtor. If we analyze the working capital statement we can see that the requirement of
current liabilities increase but the company has unable to arrange adequate currentasset for which extra finance required for in terms of working capital.
FROM THE YEAR 2009-2010PARTICULAR 2009(RS) 2010(RS) INCREASE(RS) DECREASE(RS)
CURRENT ASSETINVENTORY 62,75,00,570 66,95,89,474 4,20,88,904
SUNDRY DEBTOR 15,24,25,778 21,58,93,923 6,34,68,145CASH & BANK BALANCE 17,31,35,051 22,07,02,239 4,75,67,188
LOANS & ADVANCES 16,94,00,894 34,55,86,666 17,61,85,772TOTAL(A) 112,24,62,293 145,17,72,302
CURRENT LIABILITIESCURRENT LIABILITIES 47,90,72,324 58,86,76,161 10,96,03,837
PROVISION 13,84,83,286 25,70,96,141 11,86,12,855TOTAL(B) 61,75,55,610 84,57,72,302
WORKING CAPITAL 50,49,06,683 60,60,00,000 10,10,93,317(SOURCES: ANNUAL REPORT OF COMPANY)
INFERENCE: The above table show that there has been decrease in the working capital to the extent of
RS 10,10,93,317 for the year 2009 to 2010.
4.4
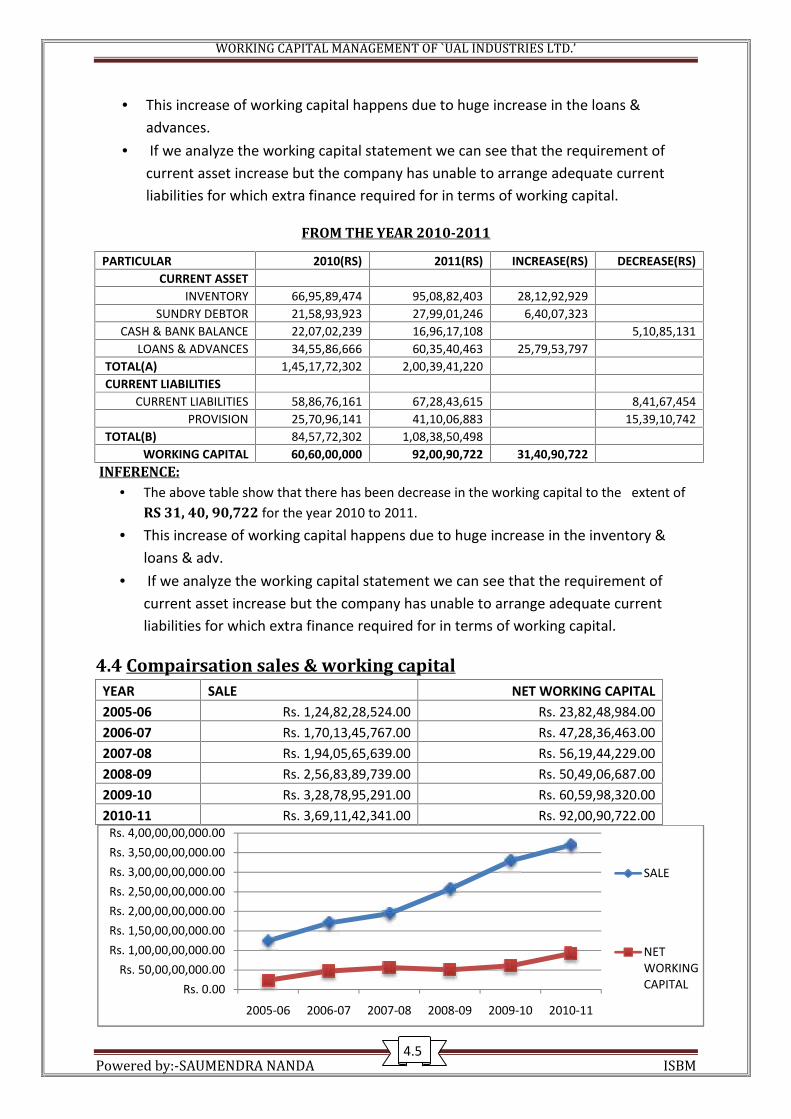
WORKING CAPITAL MANAGEMENT OF `UAL INDUSTRIES LTD.’
Powered by:-SAUMENDRA NANDA ISBM
This increase of working capital happens due to huge increase in the loans &advances.
If we analyze the working capital statement we can see that the requirement ofcurrent asset increase but the company has unable to arrange adequate currentliabilities for which extra finance required for in terms of working capital.
FROM THE YEAR 2010-2011
PARTICULAR 2010(RS) 2011(RS) INCREASE(RS) DECREASE(RS)CURRENT ASSET
INVENTORY 66,95,89,474 95,08,82,403 28,12,92,929SUNDRY DEBTOR 21,58,93,923 27,99,01,246 6,40,07,323
CASH & BANK BALANCE 22,07,02,239 16,96,17,108 5,10,85,131LOANS & ADVANCES 34,55,86,666 60,35,40,463 25,79,53,797
TOTAL(A) 1,45,17,72,302 2,00,39,41,220CURRENT LIABILITIES
CURRENT LIABILITIES 58,86,76,161 67,28,43,615 8,41,67,454PROVISION 25,70,96,141 41,10,06,883 15,39,10,742
TOTAL(B) 84,57,72,302 1,08,38,50,498WORKING CAPITAL 60,60,00,000 92,00,90,722 31,40,90,722
INFERENCE: The above table show that there has been decrease in the working capital to the extent of
RS 31, 40, 90,722 for the year 2010 to 2011. This increase of working capital happens due to huge increase in the inventory &
loans & adv. If we analyze the working capital statement we can see that the requirement of
current asset increase but the company has unable to arrange adequate currentliabilities for which extra finance required for in terms of working capital.
4.4 Compairsation sales & working capitalYEAR SALE NET WORKING CAPITAL2005-06 Rs. 1,24,82,28,524.00 Rs. 23,82,48,984.002006-07 Rs. 1,70,13,45,767.00 Rs. 47,28,36,463.002007-08 Rs. 1,94,05,65,639.00 Rs. 56,19,44,229.002008-09 Rs. 2,56,83,89,739.00 Rs. 50,49,06,687.002009-10 Rs. 3,28,78,95,291.00 Rs. 60,59,98,320.002010-11 Rs. 3,69,11,42,341.00 Rs. 92,00,90,722.00
Rs. 0.00Rs. 50,00,00,000.00
Rs. 1,00,00,00,000.00Rs. 1,50,00,00,000.00Rs. 2,00,00,00,000.00Rs. 2,50,00,00,000.00Rs. 3,00,00,00,000.00Rs. 3,50,00,00,000.00Rs. 4,00,00,00,000.00
2005-06
4.5
WORKING CAPITAL MANAGEMENT OF `UAL INDUSTRIES LTD.’
Powered by:-SAUMENDRA NANDA ISBM
This increase of working capital happens due to huge increase in the loans &advances.
If we analyze the working capital statement we can see that the requirement ofcurrent asset increase but the company has unable to arrange adequate currentliabilities for which extra finance required for in terms of working capital.
FROM THE YEAR 2010-2011
PARTICULAR 2010(RS) 2011(RS) INCREASE(RS) DECREASE(RS)CURRENT ASSET
INVENTORY 66,95,89,474 95,08,82,403 28,12,92,929SUNDRY DEBTOR 21,58,93,923 27,99,01,246 6,40,07,323
CASH & BANK BALANCE 22,07,02,239 16,96,17,108 5,10,85,131LOANS & ADVANCES 34,55,86,666 60,35,40,463 25,79,53,797
TOTAL(A) 1,45,17,72,302 2,00,39,41,220CURRENT LIABILITIES
CURRENT LIABILITIES 58,86,76,161 67,28,43,615 8,41,67,454PROVISION 25,70,96,141 41,10,06,883 15,39,10,742
TOTAL(B) 84,57,72,302 1,08,38,50,498WORKING CAPITAL 60,60,00,000 92,00,90,722 31,40,90,722
INFERENCE: The above table show that there has been decrease in the working capital to the extent of
RS 31, 40, 90,722 for the year 2010 to 2011. This increase of working capital happens due to huge increase in the inventory &
loans & adv. If we analyze the working capital statement we can see that the requirement of
current asset increase but the company has unable to arrange adequate currentliabilities for which extra finance required for in terms of working capital.
4.4 Compairsation sales & working capitalYEAR SALE NET WORKING CAPITAL2005-06 Rs. 1,24,82,28,524.00 Rs. 23,82,48,984.002006-07 Rs. 1,70,13,45,767.00 Rs. 47,28,36,463.002007-08 Rs. 1,94,05,65,639.00 Rs. 56,19,44,229.002008-09 Rs. 2,56,83,89,739.00 Rs. 50,49,06,687.002009-10 Rs. 3,28,78,95,291.00 Rs. 60,59,98,320.002010-11 Rs. 3,69,11,42,341.00 Rs. 92,00,90,722.00
2005-06 2006-07 2007-08 2008-09 2009-10 2010-11
4.5
WORKING CAPITAL MANAGEMENT OF `UAL INDUSTRIES LTD.’
Powered by:-SAUMENDRA NANDA ISBM
This increase of working capital happens due to huge increase in the loans &advances.
If we analyze the working capital statement we can see that the requirement ofcurrent asset increase but the company has unable to arrange adequate currentliabilities for which extra finance required for in terms of working capital.
FROM THE YEAR 2010-2011
PARTICULAR 2010(RS) 2011(RS) INCREASE(RS) DECREASE(RS)CURRENT ASSET
INVENTORY 66,95,89,474 95,08,82,403 28,12,92,929SUNDRY DEBTOR 21,58,93,923 27,99,01,246 6,40,07,323
CASH & BANK BALANCE 22,07,02,239 16,96,17,108 5,10,85,131LOANS & ADVANCES 34,55,86,666 60,35,40,463 25,79,53,797
TOTAL(A) 1,45,17,72,302 2,00,39,41,220CURRENT LIABILITIES
CURRENT LIABILITIES 58,86,76,161 67,28,43,615 8,41,67,454PROVISION 25,70,96,141 41,10,06,883 15,39,10,742
TOTAL(B) 84,57,72,302 1,08,38,50,498WORKING CAPITAL 60,60,00,000 92,00,90,722 31,40,90,722
INFERENCE: The above table show that there has been decrease in the working capital to the extent of
RS 31, 40, 90,722 for the year 2010 to 2011. This increase of working capital happens due to huge increase in the inventory &
loans & adv. If we analyze the working capital statement we can see that the requirement of
current asset increase but the company has unable to arrange adequate currentliabilities for which extra finance required for in terms of working capital.
4.4 Compairsation sales & working capitalYEAR SALE NET WORKING CAPITAL2005-06 Rs. 1,24,82,28,524.00 Rs. 23,82,48,984.002006-07 Rs. 1,70,13,45,767.00 Rs. 47,28,36,463.002007-08 Rs. 1,94,05,65,639.00 Rs. 56,19,44,229.002008-09 Rs. 2,56,83,89,739.00 Rs. 50,49,06,687.002009-10 Rs. 3,28,78,95,291.00 Rs. 60,59,98,320.002010-11 Rs. 3,69,11,42,341.00 Rs. 92,00,90,722.00
2010-11
SALE
NETWORKINGCAPITAL
4.5
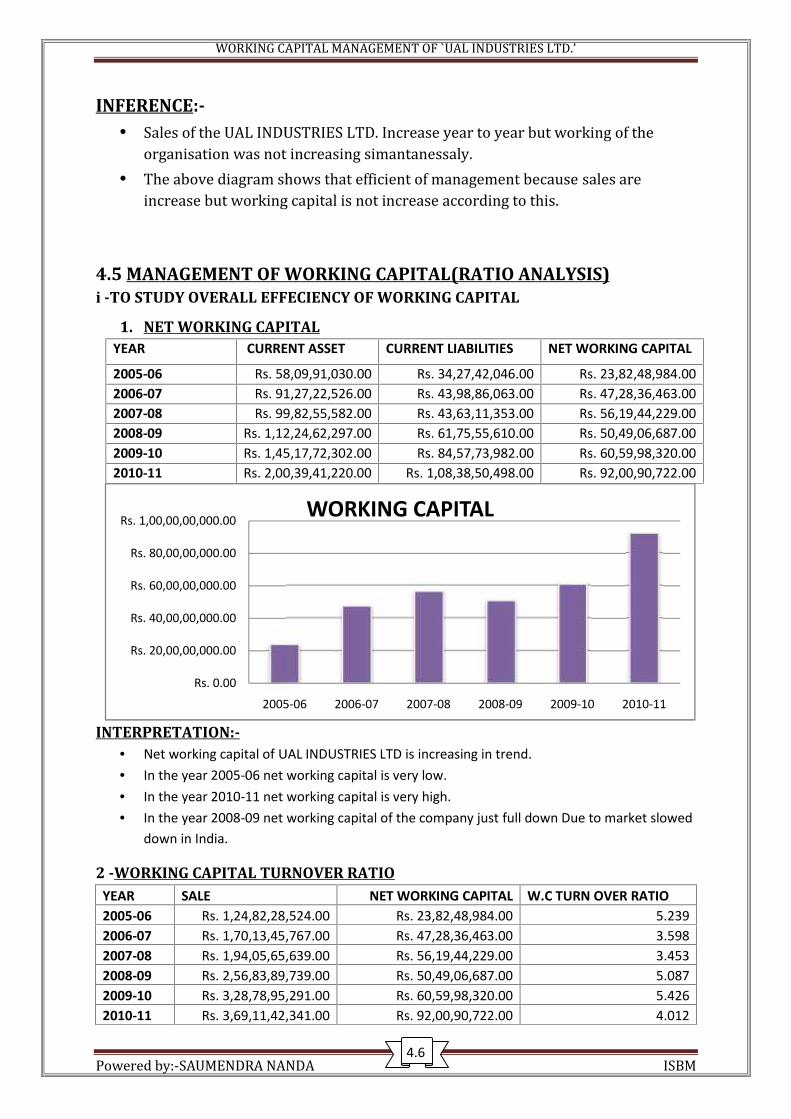
WORKING CAPITAL MANAGEMENT OF `UAL INDUSTRIES LTD.’
Powered by:-SAUMENDRA NANDA ISBM
INFERENCE:- Sales of the UAL INDUSTRIES LTD. Increase year to year but working of theorganisation was not increasing simantanessaly. The above diagram shows that efficient of management because sales areincrease but working capital is not increase according to this.
4.5 MANAGEMENT OF WORKING CAPITAL(RATIO ANALYSIS)i -TO STUDY OVERALL EFFECIENCY OF WORKING CAPITAL
1. NET WORKING CAPITALYEAR CURRENT ASSET CURRENT LIABILITIES NET WORKING CAPITAL
2005-06 Rs. 58,09,91,030.00 Rs. 34,27,42,046.00 Rs. 23,82,48,984.002006-07 Rs. 91,27,22,526.00 Rs. 43,98,86,063.00 Rs. 47,28,36,463.002007-08 Rs. 99,82,55,582.00 Rs. 43,63,11,353.00 Rs. 56,19,44,229.002008-09 Rs. 1,12,24,62,297.00 Rs. 61,75,55,610.00 Rs. 50,49,06,687.002009-10 Rs. 1,45,17,72,302.00 Rs. 84,57,73,982.00 Rs. 60,59,98,320.002010-11 Rs. 2,00,39,41,220.00 Rs. 1,08,38,50,498.00 Rs. 92,00,90,722.00
INTERPRETATION:- Net working capital of UAL INDUSTRIES LTD is increasing in trend. In the year 2005-06 net working capital is very low. In the year 2010-11 net working capital is very high. In the year 2008-09 net working capital of the company just full down Due to market slowed
down in India.
2 -WORKING CAPITAL TURNOVER RATIOYEAR SALE NET WORKING CAPITAL W.C TURN OVER RATIO2005-06 Rs. 1,24,82,28,524.00 Rs. 23,82,48,984.00 5.2392006-07 Rs. 1,70,13,45,767.00 Rs. 47,28,36,463.00 3.5982007-08 Rs. 1,94,05,65,639.00 Rs. 56,19,44,229.00 3.4532008-09 Rs. 2,56,83,89,739.00 Rs. 50,49,06,687.00 5.0872009-10 Rs. 3,28,78,95,291.00 Rs. 60,59,98,320.00 5.4262010-11 Rs. 3,69,11,42,341.00 Rs. 92,00,90,722.00 4.012
Rs. 0.00
Rs. 20,00,00,000.00
Rs. 40,00,00,000.00
Rs. 60,00,00,000.00
Rs. 80,00,00,000.00
Rs. 1,00,00,00,000.00
2005-06
4.6
WORKING CAPITAL MANAGEMENT OF `UAL INDUSTRIES LTD.’
Powered by:-SAUMENDRA NANDA ISBM
INFERENCE:- Sales of the UAL INDUSTRIES LTD. Increase year to year but working of theorganisation was not increasing simantanessaly. The above diagram shows that efficient of management because sales areincrease but working capital is not increase according to this.
4.5 MANAGEMENT OF WORKING CAPITAL(RATIO ANALYSIS)i -TO STUDY OVERALL EFFECIENCY OF WORKING CAPITAL
1. NET WORKING CAPITALYEAR CURRENT ASSET CURRENT LIABILITIES NET WORKING CAPITAL
2005-06 Rs. 58,09,91,030.00 Rs. 34,27,42,046.00 Rs. 23,82,48,984.002006-07 Rs. 91,27,22,526.00 Rs. 43,98,86,063.00 Rs. 47,28,36,463.002007-08 Rs. 99,82,55,582.00 Rs. 43,63,11,353.00 Rs. 56,19,44,229.002008-09 Rs. 1,12,24,62,297.00 Rs. 61,75,55,610.00 Rs. 50,49,06,687.002009-10 Rs. 1,45,17,72,302.00 Rs. 84,57,73,982.00 Rs. 60,59,98,320.002010-11 Rs. 2,00,39,41,220.00 Rs. 1,08,38,50,498.00 Rs. 92,00,90,722.00
INTERPRETATION:- Net working capital of UAL INDUSTRIES LTD is increasing in trend. In the year 2005-06 net working capital is very low. In the year 2010-11 net working capital is very high. In the year 2008-09 net working capital of the company just full down Due to market slowed
down in India.
2 -WORKING CAPITAL TURNOVER RATIOYEAR SALE NET WORKING CAPITAL W.C TURN OVER RATIO2005-06 Rs. 1,24,82,28,524.00 Rs. 23,82,48,984.00 5.2392006-07 Rs. 1,70,13,45,767.00 Rs. 47,28,36,463.00 3.5982007-08 Rs. 1,94,05,65,639.00 Rs. 56,19,44,229.00 3.4532008-09 Rs. 2,56,83,89,739.00 Rs. 50,49,06,687.00 5.0872009-10 Rs. 3,28,78,95,291.00 Rs. 60,59,98,320.00 5.4262010-11 Rs. 3,69,11,42,341.00 Rs. 92,00,90,722.00 4.012
2005-06 2006-07 2007-08 2008-09 2009-10
WORKING CAPITAL
4.6
WORKING CAPITAL MANAGEMENT OF `UAL INDUSTRIES LTD.’
Powered by:-SAUMENDRA NANDA ISBM
INFERENCE:- Sales of the UAL INDUSTRIES LTD. Increase year to year but working of theorganisation was not increasing simantanessaly. The above diagram shows that efficient of management because sales areincrease but working capital is not increase according to this.
4.5 MANAGEMENT OF WORKING CAPITAL(RATIO ANALYSIS)i -TO STUDY OVERALL EFFECIENCY OF WORKING CAPITAL
1. NET WORKING CAPITALYEAR CURRENT ASSET CURRENT LIABILITIES NET WORKING CAPITAL
2005-06 Rs. 58,09,91,030.00 Rs. 34,27,42,046.00 Rs. 23,82,48,984.002006-07 Rs. 91,27,22,526.00 Rs. 43,98,86,063.00 Rs. 47,28,36,463.002007-08 Rs. 99,82,55,582.00 Rs. 43,63,11,353.00 Rs. 56,19,44,229.002008-09 Rs. 1,12,24,62,297.00 Rs. 61,75,55,610.00 Rs. 50,49,06,687.002009-10 Rs. 1,45,17,72,302.00 Rs. 84,57,73,982.00 Rs. 60,59,98,320.002010-11 Rs. 2,00,39,41,220.00 Rs. 1,08,38,50,498.00 Rs. 92,00,90,722.00
INTERPRETATION:- Net working capital of UAL INDUSTRIES LTD is increasing in trend. In the year 2005-06 net working capital is very low. In the year 2010-11 net working capital is very high. In the year 2008-09 net working capital of the company just full down Due to market slowed
down in India.
2 -WORKING CAPITAL TURNOVER RATIOYEAR SALE NET WORKING CAPITAL W.C TURN OVER RATIO2005-06 Rs. 1,24,82,28,524.00 Rs. 23,82,48,984.00 5.2392006-07 Rs. 1,70,13,45,767.00 Rs. 47,28,36,463.00 3.5982007-08 Rs. 1,94,05,65,639.00 Rs. 56,19,44,229.00 3.4532008-09 Rs. 2,56,83,89,739.00 Rs. 50,49,06,687.00 5.0872009-10 Rs. 3,28,78,95,291.00 Rs. 60,59,98,320.00 5.4262010-11 Rs. 3,69,11,42,341.00 Rs. 92,00,90,722.00 4.012
2009-10 2010-11
4.6
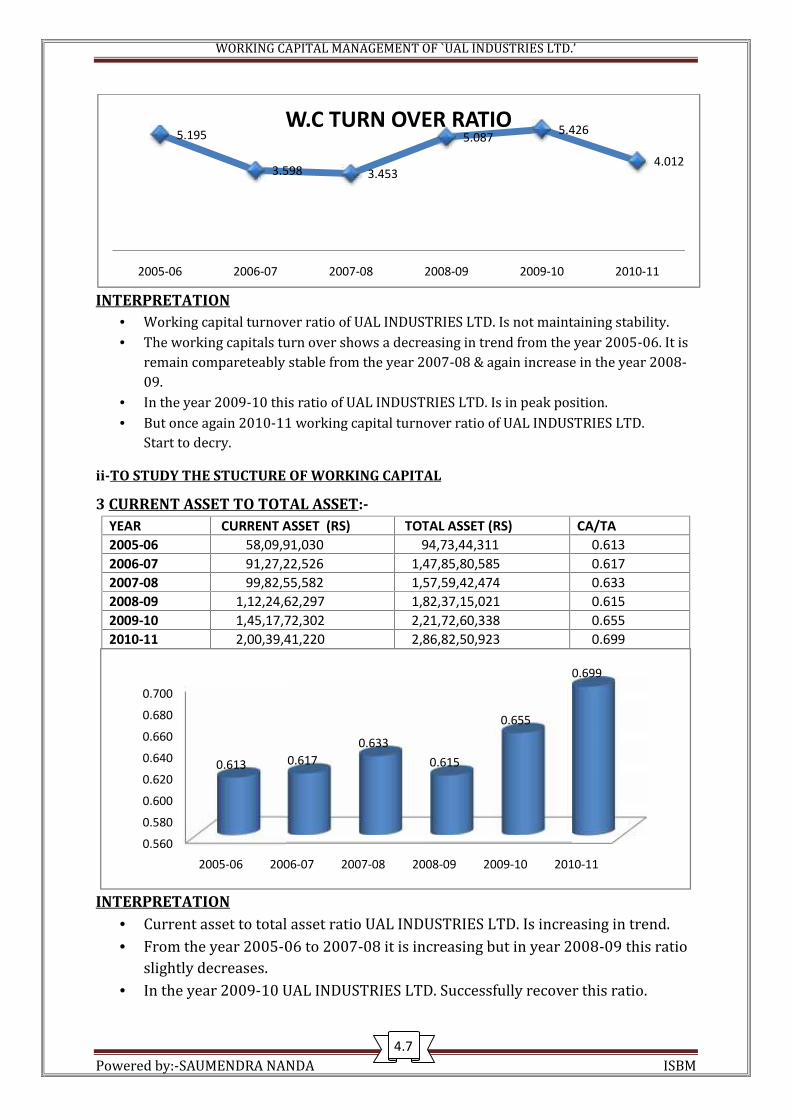
WORKING CAPITAL MANAGEMENT OF `UAL INDUSTRIES LTD.’
Powered by:-SAUMENDRA NANDA ISBM
INTERPRETATION Working capital turnover ratio of UAL INDUSTRIES LTD. Is not maintaining stability. The working capitals turn over shows a decreasing in trend from the year 2005-06. It isremain compareteably stable from the year 2007-08 & again increase in the year 2008-09. In the year 2009-10 this ratio of UAL INDUSTRIES LTD. Is in peak position. But once again 2010-11 working capital turnover ratio of UAL INDUSTRIES LTD.Start to decry.
ii-TO STUDY THE STUCTURE OF WORKING CAPITAL
3 CURRENT ASSET TO TOTAL ASSET:-YEAR CURRENT ASSET (RS) TOTAL ASSET (RS) CA/TA2005-06 58,09,91,030 94,73,44,311 0.6132006-07 91,27,22,526 1,47,85,80,585 0.6172007-08 99,82,55,582 1,57,59,42,474 0.6332008-09 1,12,24,62,297 1,82,37,15,021 0.6152009-10 1,45,17,72,302 2,21,72,60,338 0.6552010-11 2,00,39,41,220 2,86,82,50,923 0.699
INTERPRETATION Current asset to total asset ratio UAL INDUSTRIES LTD. Is increasing in trend. From the year 2005-06 to 2007-08 it is increasing but in year 2008-09 this ratioslightly decreases. In the year 2009-10 UAL INDUSTRIES LTD. Successfully recover this ratio.
5.195
3.598
2005-06 2006-07
W.C TURN OVER RATIO
0.560
0.580
0.600
0.620
0.640
0.660
0.680
0.700
2005-06 2006-07
0.613 0.617
4.7
WORKING CAPITAL MANAGEMENT OF `UAL INDUSTRIES LTD.’
Powered by:-SAUMENDRA NANDA ISBM
INTERPRETATION Working capital turnover ratio of UAL INDUSTRIES LTD. Is not maintaining stability. The working capitals turn over shows a decreasing in trend from the year 2005-06. It isremain compareteably stable from the year 2007-08 & again increase in the year 2008-09. In the year 2009-10 this ratio of UAL INDUSTRIES LTD. Is in peak position. But once again 2010-11 working capital turnover ratio of UAL INDUSTRIES LTD.Start to decry.
ii-TO STUDY THE STUCTURE OF WORKING CAPITAL
3 CURRENT ASSET TO TOTAL ASSET:-YEAR CURRENT ASSET (RS) TOTAL ASSET (RS) CA/TA2005-06 58,09,91,030 94,73,44,311 0.6132006-07 91,27,22,526 1,47,85,80,585 0.6172007-08 99,82,55,582 1,57,59,42,474 0.6332008-09 1,12,24,62,297 1,82,37,15,021 0.6152009-10 1,45,17,72,302 2,21,72,60,338 0.6552010-11 2,00,39,41,220 2,86,82,50,923 0.699
INTERPRETATION Current asset to total asset ratio UAL INDUSTRIES LTD. Is increasing in trend. From the year 2005-06 to 2007-08 it is increasing but in year 2008-09 this ratioslightly decreases. In the year 2009-10 UAL INDUSTRIES LTD. Successfully recover this ratio.
3.598 3.453
5.087 5.426
2007-08 2008-09 2009-10
W.C TURN OVER RATIO
2006-07 2007-08 2008-09 2009-10 2010-11
0.6170.633
0.615
0.655
0.699
4.7
WORKING CAPITAL MANAGEMENT OF `UAL INDUSTRIES LTD.’
Powered by:-SAUMENDRA NANDA ISBM
INTERPRETATION Working capital turnover ratio of UAL INDUSTRIES LTD. Is not maintaining stability. The working capitals turn over shows a decreasing in trend from the year 2005-06. It isremain compareteably stable from the year 2007-08 & again increase in the year 2008-09. In the year 2009-10 this ratio of UAL INDUSTRIES LTD. Is in peak position. But once again 2010-11 working capital turnover ratio of UAL INDUSTRIES LTD.Start to decry.
ii-TO STUDY THE STUCTURE OF WORKING CAPITAL
3 CURRENT ASSET TO TOTAL ASSET:-YEAR CURRENT ASSET (RS) TOTAL ASSET (RS) CA/TA2005-06 58,09,91,030 94,73,44,311 0.6132006-07 91,27,22,526 1,47,85,80,585 0.6172007-08 99,82,55,582 1,57,59,42,474 0.6332008-09 1,12,24,62,297 1,82,37,15,021 0.6152009-10 1,45,17,72,302 2,21,72,60,338 0.6552010-11 2,00,39,41,220 2,86,82,50,923 0.699
INTERPRETATION Current asset to total asset ratio UAL INDUSTRIES LTD. Is increasing in trend. From the year 2005-06 to 2007-08 it is increasing but in year 2008-09 this ratioslightly decreases. In the year 2009-10 UAL INDUSTRIES LTD. Successfully recover this ratio.
5.426
4.012
2010-11
2010-11
0.699
4.7
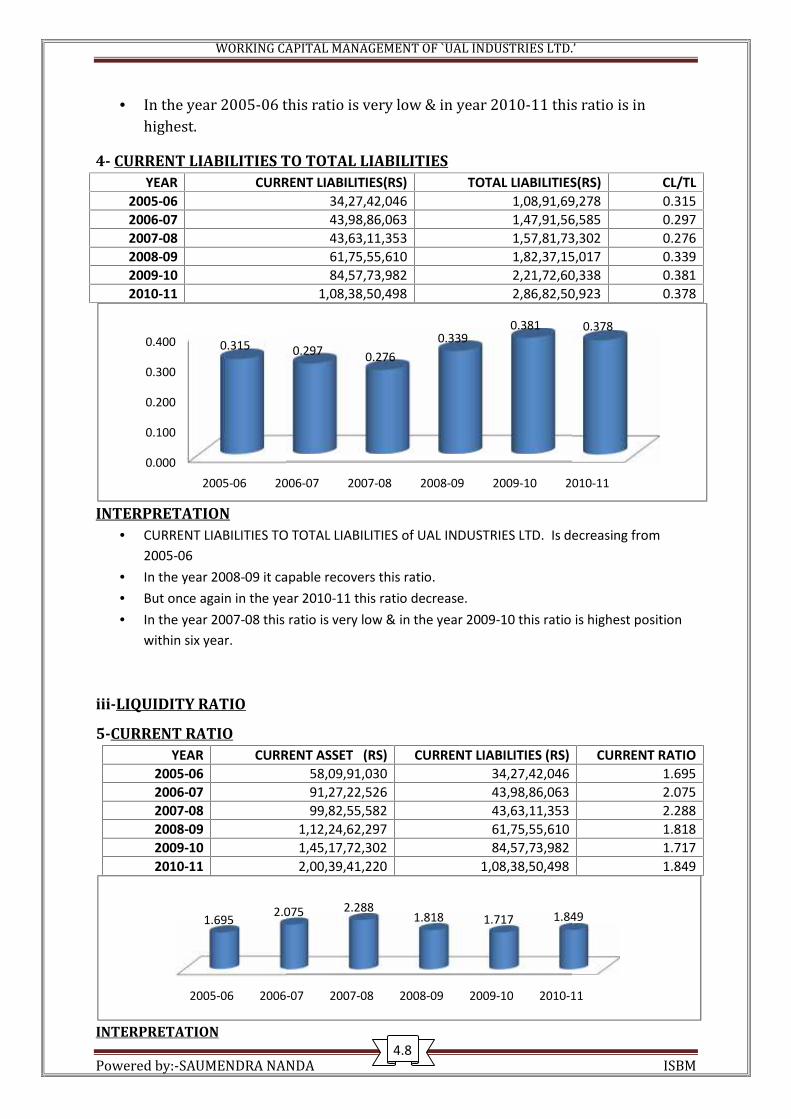
WORKING CAPITAL MANAGEMENT OF `UAL INDUSTRIES LTD.’
Powered by:-SAUMENDRA NANDA ISBM
In the year 2005-06 this ratio is very low & in year 2010-11 this ratio is inhighest.4- CURRENT LIABILITIES TO TOTAL LIABILITIES
YEAR CURRENT LIABILITIES(RS) TOTAL LIABILITIES(RS) CL/TL2005-06 34,27,42,046 1,08,91,69,278 0.3152006-07 43,98,86,063 1,47,91,56,585 0.2972007-08 43,63,11,353 1,57,81,73,302 0.2762008-09 61,75,55,610 1,82,37,15,017 0.3392009-10 84,57,73,982 2,21,72,60,338 0.3812010-11 1,08,38,50,498 2,86,82,50,923 0.378
INTERPRETATION CURRENT LIABILITIES TO TOTAL LIABILITIES of UAL INDUSTRIES LTD. Is decreasing from
2005-06 In the year 2008-09 it capable recovers this ratio. But once again in the year 2010-11 this ratio decrease. In the year 2007-08 this ratio is very low & in the year 2009-10 this ratio is highest position
within six year.
iii-LIQUIDITY RATIO
5-CURRENT RATIOYEAR CURRENT ASSET (RS) CURRENT LIABILITIES (RS) CURRENT RATIO
2005-06 58,09,91,030 34,27,42,046 1.6952006-07 91,27,22,526 43,98,86,063 2.0752007-08 99,82,55,582 43,63,11,353 2.2882008-09 1,12,24,62,297 61,75,55,610 1.8182009-10 1,45,17,72,302 84,57,73,982 1.7172010-11 2,00,39,41,220 1,08,38,50,498 1.849
INTERPRETATION
0.000
0.100
0.200
0.300
0.400
2005-06 2006-07
0.315 0.297
2005-06 2006-07
1.695 2.075
4.8
WORKING CAPITAL MANAGEMENT OF `UAL INDUSTRIES LTD.’
Powered by:-SAUMENDRA NANDA ISBM
In the year 2005-06 this ratio is very low & in year 2010-11 this ratio is inhighest.4- CURRENT LIABILITIES TO TOTAL LIABILITIES
YEAR CURRENT LIABILITIES(RS) TOTAL LIABILITIES(RS) CL/TL2005-06 34,27,42,046 1,08,91,69,278 0.3152006-07 43,98,86,063 1,47,91,56,585 0.2972007-08 43,63,11,353 1,57,81,73,302 0.2762008-09 61,75,55,610 1,82,37,15,017 0.3392009-10 84,57,73,982 2,21,72,60,338 0.3812010-11 1,08,38,50,498 2,86,82,50,923 0.378
INTERPRETATION CURRENT LIABILITIES TO TOTAL LIABILITIES of UAL INDUSTRIES LTD. Is decreasing from
2005-06 In the year 2008-09 it capable recovers this ratio. But once again in the year 2010-11 this ratio decrease. In the year 2007-08 this ratio is very low & in the year 2009-10 this ratio is highest position
within six year.
iii-LIQUIDITY RATIO
5-CURRENT RATIOYEAR CURRENT ASSET (RS) CURRENT LIABILITIES (RS) CURRENT RATIO
2005-06 58,09,91,030 34,27,42,046 1.6952006-07 91,27,22,526 43,98,86,063 2.0752007-08 99,82,55,582 43,63,11,353 2.2882008-09 1,12,24,62,297 61,75,55,610 1.8182009-10 1,45,17,72,302 84,57,73,982 1.7172010-11 2,00,39,41,220 1,08,38,50,498 1.849
INTERPRETATION
2006-07 2007-08 2008-09 2009-10 2010-11
0.297 0.2760.339
0.381
2006-07 2007-08 2008-09 2009-10 2010-11
2.075 2.2881.818 1.717 1.849
4.8
WORKING CAPITAL MANAGEMENT OF `UAL INDUSTRIES LTD.’
Powered by:-SAUMENDRA NANDA ISBM
In the year 2005-06 this ratio is very low & in year 2010-11 this ratio is inhighest.4- CURRENT LIABILITIES TO TOTAL LIABILITIES
YEAR CURRENT LIABILITIES(RS) TOTAL LIABILITIES(RS) CL/TL2005-06 34,27,42,046 1,08,91,69,278 0.3152006-07 43,98,86,063 1,47,91,56,585 0.2972007-08 43,63,11,353 1,57,81,73,302 0.2762008-09 61,75,55,610 1,82,37,15,017 0.3392009-10 84,57,73,982 2,21,72,60,338 0.3812010-11 1,08,38,50,498 2,86,82,50,923 0.378
INTERPRETATION CURRENT LIABILITIES TO TOTAL LIABILITIES of UAL INDUSTRIES LTD. Is decreasing from
2005-06 In the year 2008-09 it capable recovers this ratio. But once again in the year 2010-11 this ratio decrease. In the year 2007-08 this ratio is very low & in the year 2009-10 this ratio is highest position
within six year.
iii-LIQUIDITY RATIO
5-CURRENT RATIOYEAR CURRENT ASSET (RS) CURRENT LIABILITIES (RS) CURRENT RATIO
2005-06 58,09,91,030 34,27,42,046 1.6952006-07 91,27,22,526 43,98,86,063 2.0752007-08 99,82,55,582 43,63,11,353 2.2882008-09 1,12,24,62,297 61,75,55,610 1.8182009-10 1,45,17,72,302 84,57,73,982 1.7172010-11 2,00,39,41,220 1,08,38,50,498 1.849
INTERPRETATION
2010-11
0.378
2010-11
1.849
4.8
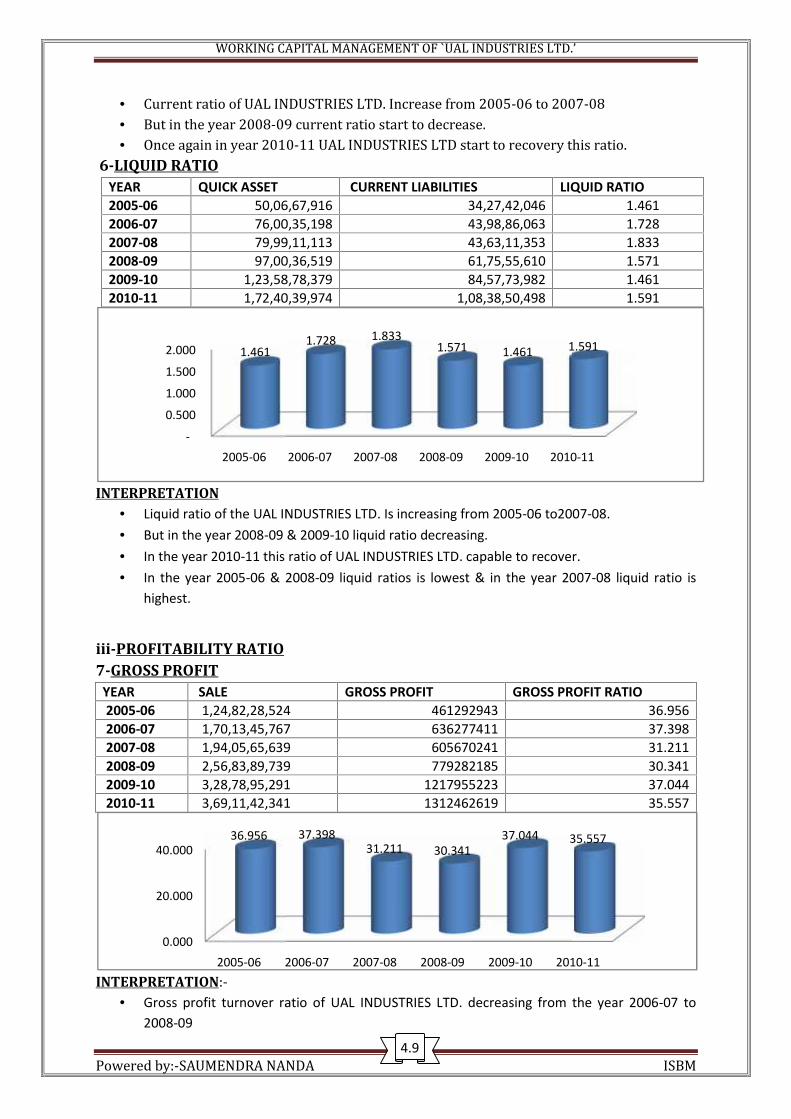
WORKING CAPITAL MANAGEMENT OF `UAL INDUSTRIES LTD.’
Powered by:-SAUMENDRA NANDA ISBM
Current ratio of UAL INDUSTRIES LTD. Increase from 2005-06 to 2007-08 But in the year 2008-09 current ratio start to decrease. Once again in year 2010-11 UAL INDUSTRIES LTD start to recovery this ratio.
6-LIQUID RATIOYEAR QUICK ASSET CURRENT LIABILITIES LIQUID RATIO2005-06 50,06,67,916 34,27,42,046 1.4612006-07 76,00,35,198 43,98,86,063 1.7282007-08 79,99,11,113 43,63,11,353 1.8332008-09 97,00,36,519 61,75,55,610 1.5712009-10 1,23,58,78,379 84,57,73,982 1.4612010-11 1,72,40,39,974 1,08,38,50,498 1.591
INTERPRETATION Liquid ratio of the UAL INDUSTRIES LTD. Is increasing from 2005-06 to2007-08. But in the year 2008-09 & 2009-10 liquid ratio decreasing. In the year 2010-11 this ratio of UAL INDUSTRIES LTD. capable to recover. In the year 2005-06 & 2008-09 liquid ratios is lowest & in the year 2007-08 liquid ratio is
highest.
iii-PROFITABILITY RATIO7-GROSS PROFIT
YEAR SALE GROSS PROFIT GROSS PROFIT RATIO2005-06 1,24,82,28,524 461292943 36.9562006-07 1,70,13,45,767 636277411 37.3982007-08 1,94,05,65,639 605670241 31.2112008-09 2,56,83,89,739 779282185 30.3412009-10 3,28,78,95,291 1217955223 37.0442010-11 3,69,11,42,341 1312462619 35.557
INTERPRETATION:- Gross profit turnover ratio of UAL INDUSTRIES LTD. decreasing from the year 2006-07 to
2008-09
-
0.500
1.000
1.500
2.000
2005-06 2006-07
1.461
0.000
20.000
40.000
2005-06 2006-07
36.956
4.9
WORKING CAPITAL MANAGEMENT OF `UAL INDUSTRIES LTD.’
Powered by:-SAUMENDRA NANDA ISBM
Current ratio of UAL INDUSTRIES LTD. Increase from 2005-06 to 2007-08 But in the year 2008-09 current ratio start to decrease. Once again in year 2010-11 UAL INDUSTRIES LTD start to recovery this ratio.
6-LIQUID RATIOYEAR QUICK ASSET CURRENT LIABILITIES LIQUID RATIO2005-06 50,06,67,916 34,27,42,046 1.4612006-07 76,00,35,198 43,98,86,063 1.7282007-08 79,99,11,113 43,63,11,353 1.8332008-09 97,00,36,519 61,75,55,610 1.5712009-10 1,23,58,78,379 84,57,73,982 1.4612010-11 1,72,40,39,974 1,08,38,50,498 1.591
INTERPRETATION Liquid ratio of the UAL INDUSTRIES LTD. Is increasing from 2005-06 to2007-08. But in the year 2008-09 & 2009-10 liquid ratio decreasing. In the year 2010-11 this ratio of UAL INDUSTRIES LTD. capable to recover. In the year 2005-06 & 2008-09 liquid ratios is lowest & in the year 2007-08 liquid ratio is
highest.
iii-PROFITABILITY RATIO7-GROSS PROFIT
YEAR SALE GROSS PROFIT GROSS PROFIT RATIO2005-06 1,24,82,28,524 461292943 36.9562006-07 1,70,13,45,767 636277411 37.3982007-08 1,94,05,65,639 605670241 31.2112008-09 2,56,83,89,739 779282185 30.3412009-10 3,28,78,95,291 1217955223 37.0442010-11 3,69,11,42,341 1312462619 35.557
INTERPRETATION:- Gross profit turnover ratio of UAL INDUSTRIES LTD. decreasing from the year 2006-07 to
2008-09
2006-07 2007-08 2008-09 2009-10 2010-11
1.728 1.8331.571 1.461 1.591
2006-07 2007-08 2008-09 2009-10 2010-11
37.39831.211 30.341
37.044 35.557
4.9
WORKING CAPITAL MANAGEMENT OF `UAL INDUSTRIES LTD.’
Powered by:-SAUMENDRA NANDA ISBM
Current ratio of UAL INDUSTRIES LTD. Increase from 2005-06 to 2007-08 But in the year 2008-09 current ratio start to decrease. Once again in year 2010-11 UAL INDUSTRIES LTD start to recovery this ratio.
6-LIQUID RATIOYEAR QUICK ASSET CURRENT LIABILITIES LIQUID RATIO2005-06 50,06,67,916 34,27,42,046 1.4612006-07 76,00,35,198 43,98,86,063 1.7282007-08 79,99,11,113 43,63,11,353 1.8332008-09 97,00,36,519 61,75,55,610 1.5712009-10 1,23,58,78,379 84,57,73,982 1.4612010-11 1,72,40,39,974 1,08,38,50,498 1.591
INTERPRETATION Liquid ratio of the UAL INDUSTRIES LTD. Is increasing from 2005-06 to2007-08. But in the year 2008-09 & 2009-10 liquid ratio decreasing. In the year 2010-11 this ratio of UAL INDUSTRIES LTD. capable to recover. In the year 2005-06 & 2008-09 liquid ratios is lowest & in the year 2007-08 liquid ratio is
highest.
iii-PROFITABILITY RATIO7-GROSS PROFIT
YEAR SALE GROSS PROFIT GROSS PROFIT RATIO2005-06 1,24,82,28,524 461292943 36.9562006-07 1,70,13,45,767 636277411 37.3982007-08 1,94,05,65,639 605670241 31.2112008-09 2,56,83,89,739 779282185 30.3412009-10 3,28,78,95,291 1217955223 37.0442010-11 3,69,11,42,341 1312462619 35.557
INTERPRETATION:- Gross profit turnover ratio of UAL INDUSTRIES LTD. decreasing from the year 2006-07 to
2008-09
2010-11
1.591
2010-11
35.557
4.9
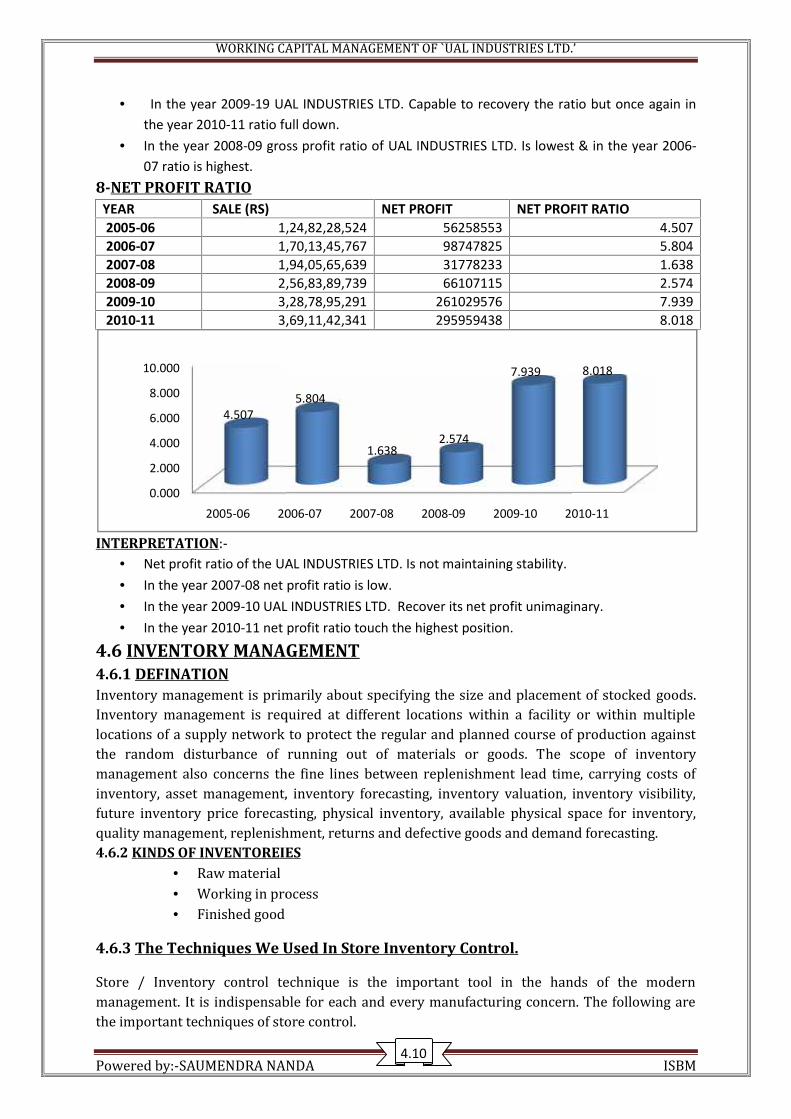
WORKING CAPITAL MANAGEMENT OF `UAL INDUSTRIES LTD.’
Powered by:-SAUMENDRA NANDA ISBM
In the year 2009-19 UAL INDUSTRIES LTD. Capable to recovery the ratio but once again inthe year 2010-11 ratio full down.
In the year 2008-09 gross profit ratio of UAL INDUSTRIES LTD. Is lowest & in the year 2006-07 ratio is highest.
8-NET PROFIT RATIOYEAR SALE (RS) NET PROFIT NET PROFIT RATIO2005-06 1,24,82,28,524 56258553 4.5072006-07 1,70,13,45,767 98747825 5.8042007-08 1,94,05,65,639 31778233 1.6382008-09 2,56,83,89,739 66107115 2.5742009-10 3,28,78,95,291 261029576 7.9392010-11 3,69,11,42,341 295959438 8.018
INTERPRETATION:- Net profit ratio of the UAL INDUSTRIES LTD. Is not maintaining stability. In the year 2007-08 net profit ratio is low. In the year 2009-10 UAL INDUSTRIES LTD. Recover its net profit unimaginary. In the year 2010-11 net profit ratio touch the highest position.
4.6 INVENTORY MANAGEMENT4.6.1 DEFINATIONInventory management is primarily about specifying the size and placement of stocked goods.Inventory management is required at different locations within a facility or within multiplelocations of a supply network to protect the regular and planned course of production againstthe random disturbance of running out of materials or goods. The scope of inventorymanagement also concerns the fine lines between replenishment lead time, carrying costs ofinventory, asset management, inventory forecasting, inventory valuation, inventory visibility,future inventory price forecasting, physical inventory, available physical space for inventory,quality management, replenishment, returns and defective goods and demand forecasting.4.6.2 KINDS OF INVENTOREIES
Raw material Working in process Finished good
4.6.3 The Techniques We Used In Store Inventory Control.Store / Inventory control technique is the important tool in the hands of the modernmanagement. It is indispensable for each and every manufacturing concern. The following arethe important techniques of store control.
0.000
2.000
4.000
6.000
8.000
10.000
2005-06 2006-07
4.507
4.10
WORKING CAPITAL MANAGEMENT OF `UAL INDUSTRIES LTD.’
Powered by:-SAUMENDRA NANDA ISBM
In the year 2009-19 UAL INDUSTRIES LTD. Capable to recovery the ratio but once again inthe year 2010-11 ratio full down.
In the year 2008-09 gross profit ratio of UAL INDUSTRIES LTD. Is lowest & in the year 2006-07 ratio is highest.
8-NET PROFIT RATIOYEAR SALE (RS) NET PROFIT NET PROFIT RATIO2005-06 1,24,82,28,524 56258553 4.5072006-07 1,70,13,45,767 98747825 5.8042007-08 1,94,05,65,639 31778233 1.6382008-09 2,56,83,89,739 66107115 2.5742009-10 3,28,78,95,291 261029576 7.9392010-11 3,69,11,42,341 295959438 8.018
INTERPRETATION:- Net profit ratio of the UAL INDUSTRIES LTD. Is not maintaining stability. In the year 2007-08 net profit ratio is low. In the year 2009-10 UAL INDUSTRIES LTD. Recover its net profit unimaginary. In the year 2010-11 net profit ratio touch the highest position.
4.6 INVENTORY MANAGEMENT4.6.1 DEFINATIONInventory management is primarily about specifying the size and placement of stocked goods.Inventory management is required at different locations within a facility or within multiplelocations of a supply network to protect the regular and planned course of production againstthe random disturbance of running out of materials or goods. The scope of inventorymanagement also concerns the fine lines between replenishment lead time, carrying costs ofinventory, asset management, inventory forecasting, inventory valuation, inventory visibility,future inventory price forecasting, physical inventory, available physical space for inventory,quality management, replenishment, returns and defective goods and demand forecasting.4.6.2 KINDS OF INVENTOREIES
Raw material Working in process Finished good
4.6.3 The Techniques We Used In Store Inventory Control.Store / Inventory control technique is the important tool in the hands of the modernmanagement. It is indispensable for each and every manufacturing concern. The following arethe important techniques of store control.
2006-07 2007-08 2008-09 2009-10 2010-11
5.804
1.6382.574
7.939
4.10
WORKING CAPITAL MANAGEMENT OF `UAL INDUSTRIES LTD.’
Powered by:-SAUMENDRA NANDA ISBM
In the year 2009-19 UAL INDUSTRIES LTD. Capable to recovery the ratio but once again inthe year 2010-11 ratio full down.
In the year 2008-09 gross profit ratio of UAL INDUSTRIES LTD. Is lowest & in the year 2006-07 ratio is highest.
8-NET PROFIT RATIOYEAR SALE (RS) NET PROFIT NET PROFIT RATIO2005-06 1,24,82,28,524 56258553 4.5072006-07 1,70,13,45,767 98747825 5.8042007-08 1,94,05,65,639 31778233 1.6382008-09 2,56,83,89,739 66107115 2.5742009-10 3,28,78,95,291 261029576 7.9392010-11 3,69,11,42,341 295959438 8.018
INTERPRETATION:- Net profit ratio of the UAL INDUSTRIES LTD. Is not maintaining stability. In the year 2007-08 net profit ratio is low. In the year 2009-10 UAL INDUSTRIES LTD. Recover its net profit unimaginary. In the year 2010-11 net profit ratio touch the highest position.
4.6 INVENTORY MANAGEMENT4.6.1 DEFINATIONInventory management is primarily about specifying the size and placement of stocked goods.Inventory management is required at different locations within a facility or within multiplelocations of a supply network to protect the regular and planned course of production againstthe random disturbance of running out of materials or goods. The scope of inventorymanagement also concerns the fine lines between replenishment lead time, carrying costs ofinventory, asset management, inventory forecasting, inventory valuation, inventory visibility,future inventory price forecasting, physical inventory, available physical space for inventory,quality management, replenishment, returns and defective goods and demand forecasting.4.6.2 KINDS OF INVENTOREIES
Raw material Working in process Finished good
4.6.3 The Techniques We Used In Store Inventory Control.Store / Inventory control technique is the important tool in the hands of the modernmanagement. It is indispensable for each and every manufacturing concern. The following arethe important techniques of store control.
2010-11
8.018
4.10
WORKING CAPITAL MANAGEMENT OF `UAL INDUSTRIES LTD.’
Powered by:-SAUMENDRA NANDA ISBM
Fixation of various stock levels: Under this method various stock levels are fixed scientificallyto avoid over stocking and under stocking of materials. Over stocking of materials leads tounnecessary blockage of materials and investment and under stocking of material leads todisputation in production. These are the following stock levels which help for planning ofmaterials.Economic ordering quantity: Economic ordering quantity is that quantity of material which isto be ordered in one time in order to minimize ordering cost, carrying cost as well as cost ofholding stock.Perpetual inventory system: Perpetual inventory system is defined as "a system of recordsmaintained by the controlling department which reflects the physical movement of stocks andtheir current balances."Bin card and store ledger constitute the bedrock of perpetual inventory system. It is a method ofrecording store after every receipt & every issue and their current balances to avoid closingdown the firm for stock taking. To ensure accuracy the physical verification may be made whichmust have to agree with the balance of Bin Card & store ledger. If there is any discrepancybetween the two, it may be adjusted by preparing debit note and credit note.A.B.C. Analysis: A. B. C. analysis is always a better control system. Under this method inventoryitems are classified in to three categories such as A. B. C. basing upon its value and costsignificance. The number of items and the value of each class is expressed as percentage of thetotal and categorize as under.Items of high value and small in numbers termed as 'A'Items of moderate value and moderate in number is termed as 'B'Items of small in value and large in number is termed as 'C'V.E.D. Analysis: This method is used for control of spare parts. VED is the symbol of
Vital spare parts: Are those spares whose cost of stock out is very high. Essential spare parts: Are those spares which are essential for the production tocontinue. Desirable spare parts: Are those spares which are needed but their absence even aweek or more will not lead to stoppage of production.
Inventory turnover ratio: Inventory turnover ratio is one of the methods of store control. itindicates how quickly the stocks are converted in to sale. Low inventory turnover ratio indicatesthe inefficient management in inventory & high inventory turnover ratio is always impliesfavourable situation.What is Purchase Requisition?Purchase requisition is a form used as a formal requisite by the store keeper to the purchasingdepartment to purchase requisite quantity of materials. When store reaches at ordering levelthe store keeper initiates purchase requisition to the purchasing department for fresh supply ofmaterials. The purchase department may not purchase materials according to his own accord.When purchase officer receives purchase requisition. He arranges for purchase of materials.
4.11
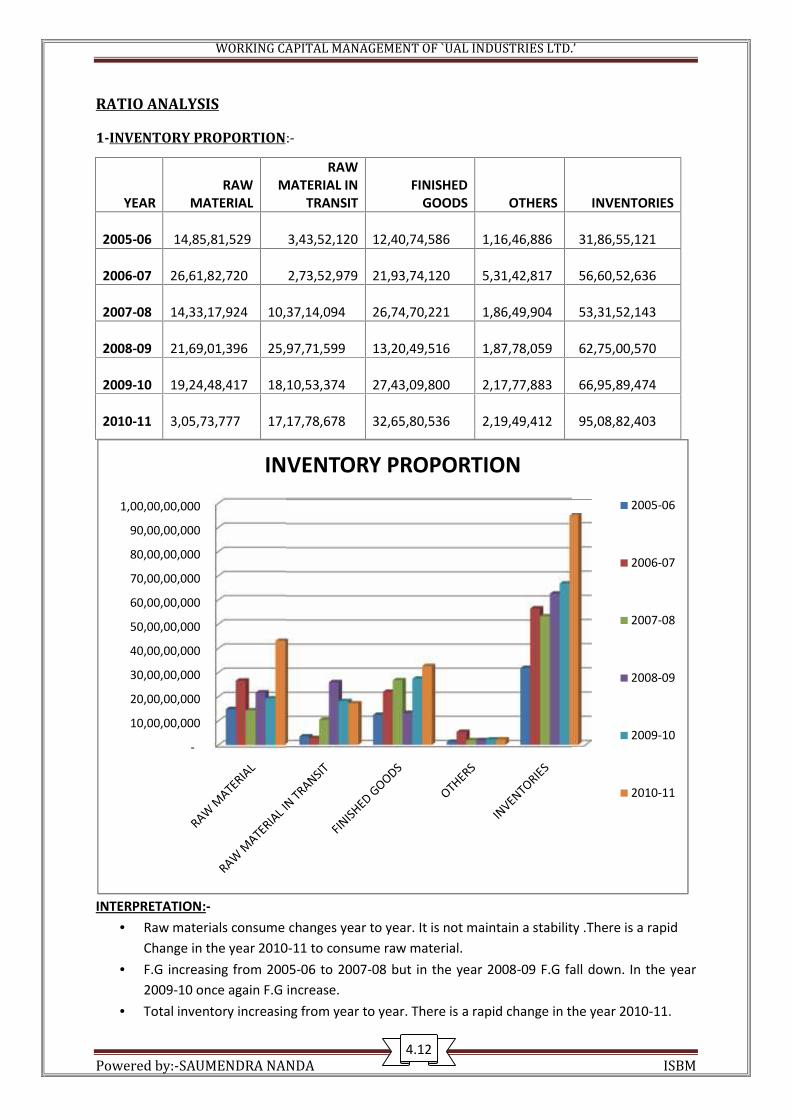
WORKING CAPITAL MANAGEMENT OF `UAL INDUSTRIES LTD.’
Powered by:-SAUMENDRA NANDA ISBM
RATIO ANALYSIS
1-INVENTORY PROPORTION:-
YEARRAW
MATERIAL
RAWMATERIAL IN
TRANSITFINISHED
GOODS OTHERS INVENTORIES
2005-06 14,85,81,529 3,43,52,120 12,40,74,586 1,16,46,886 31,86,55,121
2006-07 26,61,82,720 2,73,52,979 21,93,74,120 5,31,42,817 56,60,52,636
2007-08 14,33,17,924 10,37,14,094 26,74,70,221 1,86,49,904 53,31,52,143
2008-09 21,69,01,396 25,97,71,599 13,20,49,516 1,87,78,059 62,75,00,570
2009-10 19,24,48,417 18,10,53,374 27,43,09,800 2,17,77,883 66,95,89,474
2010-11 3,05,73,777 17,17,78,678 32,65,80,536 2,19,49,412 95,08,82,403
INTERPRETATION:- Raw materials consume changes year to year. It is not maintain a stability .There is a rapid
Change in the year 2010-11 to consume raw material. F.G increasing from 2005-06 to 2007-08 but in the year 2008-09 F.G fall down. In the year
2009-10 once again F.G increase. Total inventory increasing from year to year. There is a rapid change in the year 2010-11.
-
10,00,00,000
20,00,00,000
30,00,00,000
40,00,00,000
50,00,00,000
60,00,00,000
70,00,00,000
80,00,00,000
90,00,00,000
1,00,00,00,000
INVENTORY PROPORTION
4.12
WORKING CAPITAL MANAGEMENT OF `UAL INDUSTRIES LTD.’
Powered by:-SAUMENDRA NANDA ISBM
RATIO ANALYSIS
1-INVENTORY PROPORTION:-
YEARRAW
MATERIAL
RAWMATERIAL IN
TRANSITFINISHED
GOODS OTHERS INVENTORIES
2005-06 14,85,81,529 3,43,52,120 12,40,74,586 1,16,46,886 31,86,55,121
2006-07 26,61,82,720 2,73,52,979 21,93,74,120 5,31,42,817 56,60,52,636
2007-08 14,33,17,924 10,37,14,094 26,74,70,221 1,86,49,904 53,31,52,143
2008-09 21,69,01,396 25,97,71,599 13,20,49,516 1,87,78,059 62,75,00,570
2009-10 19,24,48,417 18,10,53,374 27,43,09,800 2,17,77,883 66,95,89,474
2010-11 3,05,73,777 17,17,78,678 32,65,80,536 2,19,49,412 95,08,82,403
INTERPRETATION:- Raw materials consume changes year to year. It is not maintain a stability .There is a rapid
Change in the year 2010-11 to consume raw material. F.G increasing from 2005-06 to 2007-08 but in the year 2008-09 F.G fall down. In the year
2009-10 once again F.G increase. Total inventory increasing from year to year. There is a rapid change in the year 2010-11.
2005-06
2006-07
2007-08
2008-09
2009-10
2010-11
4.12
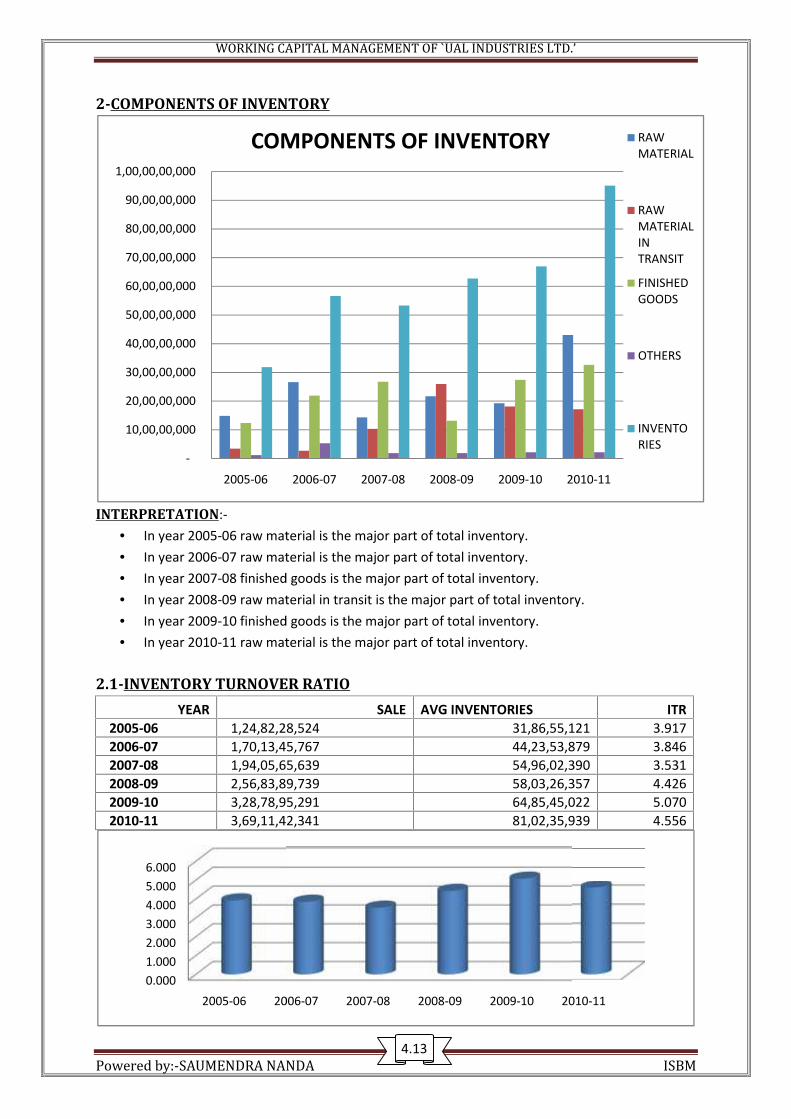
WORKING CAPITAL MANAGEMENT OF `UAL INDUSTRIES LTD.’
Powered by:-SAUMENDRA NANDA ISBM
2-COMPONENTS OF INVENTORY
INTERPRETATION:- In year 2005-06 raw material is the major part of total inventory. In year 2006-07 raw material is the major part of total inventory. In year 2007-08 finished goods is the major part of total inventory. In year 2008-09 raw material in transit is the major part of total inventory. In year 2009-10 finished goods is the major part of total inventory. In year 2010-11 raw material is the major part of total inventory.
2.1-INVENTORY TURNOVER RATIOYEAR SALE AVG INVENTORIES ITR
2005-06 1,24,82,28,524 31,86,55,121 3.9172006-07 1,70,13,45,767 44,23,53,879 3.8462007-08 1,94,05,65,639 54,96,02,390 3.5312008-09 2,56,83,89,739 58,03,26,357 4.4262009-10 3,28,78,95,291 64,85,45,022 5.0702010-11 3,69,11,42,341 81,02,35,939 4.556
-
10,00,00,000
20,00,00,000
30,00,00,000
40,00,00,000
50,00,00,000
60,00,00,000
70,00,00,000
80,00,00,000
90,00,00,000
1,00,00,00,000
2005-06 2006-07
COMPONENTS OF INVENTORY
0.0001.0002.0003.0004.0005.0006.000
2005-06 2006-07
4.13
WORKING CAPITAL MANAGEMENT OF `UAL INDUSTRIES LTD.’
Powered by:-SAUMENDRA NANDA ISBM
2-COMPONENTS OF INVENTORY
INTERPRETATION:- In year 2005-06 raw material is the major part of total inventory. In year 2006-07 raw material is the major part of total inventory. In year 2007-08 finished goods is the major part of total inventory. In year 2008-09 raw material in transit is the major part of total inventory. In year 2009-10 finished goods is the major part of total inventory. In year 2010-11 raw material is the major part of total inventory.
2.1-INVENTORY TURNOVER RATIOYEAR SALE AVG INVENTORIES ITR
2005-06 1,24,82,28,524 31,86,55,121 3.9172006-07 1,70,13,45,767 44,23,53,879 3.8462007-08 1,94,05,65,639 54,96,02,390 3.5312008-09 2,56,83,89,739 58,03,26,357 4.4262009-10 3,28,78,95,291 64,85,45,022 5.0702010-11 3,69,11,42,341 81,02,35,939 4.556
2006-07 2007-08 2008-09 2009-10 2010-11
COMPONENTS OF INVENTORY
2006-07 2007-08 2008-09 2009-10 2010-11
4.13
WORKING CAPITAL MANAGEMENT OF `UAL INDUSTRIES LTD.’
Powered by:-SAUMENDRA NANDA ISBM
2-COMPONENTS OF INVENTORY
INTERPRETATION:- In year 2005-06 raw material is the major part of total inventory. In year 2006-07 raw material is the major part of total inventory. In year 2007-08 finished goods is the major part of total inventory. In year 2008-09 raw material in transit is the major part of total inventory. In year 2009-10 finished goods is the major part of total inventory. In year 2010-11 raw material is the major part of total inventory.
2.1-INVENTORY TURNOVER RATIOYEAR SALE AVG INVENTORIES ITR
2005-06 1,24,82,28,524 31,86,55,121 3.9172006-07 1,70,13,45,767 44,23,53,879 3.8462007-08 1,94,05,65,639 54,96,02,390 3.5312008-09 2,56,83,89,739 58,03,26,357 4.4262009-10 3,28,78,95,291 64,85,45,022 5.0702010-11 3,69,11,42,341 81,02,35,939 4.556
2010-11
RAWMATERIAL
RAWMATERIALINTRANSIT
FINISHEDGOODS
OTHERS
INVENTORIES
2010-11
4.13
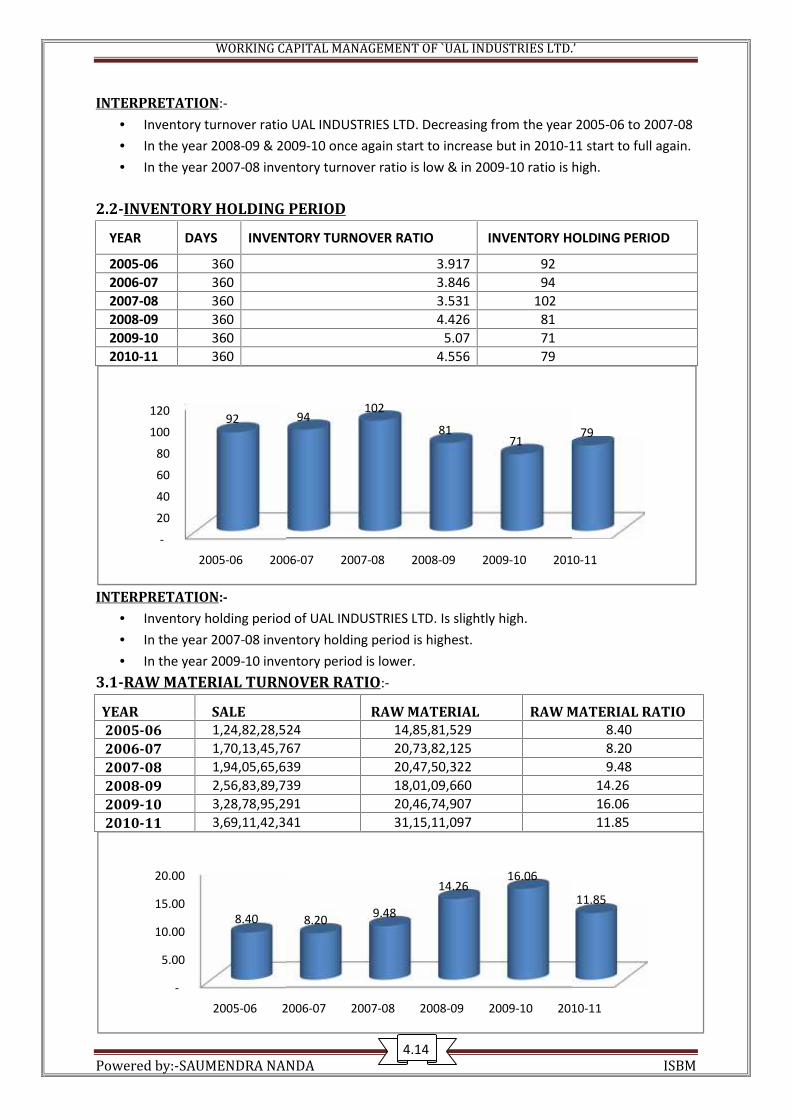
WORKING CAPITAL MANAGEMENT OF `UAL INDUSTRIES LTD.’
Powered by:-SAUMENDRA NANDA ISBM
INTERPRETATION:- Inventory turnover ratio UAL INDUSTRIES LTD. Decreasing from the year 2005-06 to 2007-08 In the year 2008-09 & 2009-10 once again start to increase but in 2010-11 start to full again. In the year 2007-08 inventory turnover ratio is low & in 2009-10 ratio is high.
2.2-INVENTORY HOLDING PERIOD
YEAR DAYS INVENTORY TURNOVER RATIO INVENTORY HOLDING PERIOD
2005-06 360 3.917 922006-07 360 3.846 942007-08 360 3.531 1022008-09 360 4.426 812009-10 360 5.07 712010-11 360 4.556 79
INTERPRETATION:- Inventory holding period of UAL INDUSTRIES LTD. Is slightly high. In the year 2007-08 inventory holding period is highest. In the year 2009-10 inventory period is lower.
3.1-RAW MATERIAL TURNOVER RATIO:-
YEAR SALE RAW MATERIAL RAW MATERIAL RATIO2005-06 1,24,82,28,524 14,85,81,529 8.402006-07 1,70,13,45,767 20,73,82,125 8.202007-08 1,94,05,65,639 20,47,50,322 9.482008-09 2,56,83,89,739 18,01,09,660 14.262009-10 3,28,78,95,291 20,46,74,907 16.062010-11 3,69,11,42,341 31,15,11,097 11.85
-
20
40
60
80
100
120
2005-06 2006-07
92
-
5.00
10.00
15.00
20.00
2005-06 2006-07
8.40
4.14
WORKING CAPITAL MANAGEMENT OF `UAL INDUSTRIES LTD.’
Powered by:-SAUMENDRA NANDA ISBM
INTERPRETATION:- Inventory turnover ratio UAL INDUSTRIES LTD. Decreasing from the year 2005-06 to 2007-08 In the year 2008-09 & 2009-10 once again start to increase but in 2010-11 start to full again. In the year 2007-08 inventory turnover ratio is low & in 2009-10 ratio is high.
2.2-INVENTORY HOLDING PERIOD
YEAR DAYS INVENTORY TURNOVER RATIO INVENTORY HOLDING PERIOD
2005-06 360 3.917 922006-07 360 3.846 942007-08 360 3.531 1022008-09 360 4.426 812009-10 360 5.07 712010-11 360 4.556 79
INTERPRETATION:- Inventory holding period of UAL INDUSTRIES LTD. Is slightly high. In the year 2007-08 inventory holding period is highest. In the year 2009-10 inventory period is lower.
3.1-RAW MATERIAL TURNOVER RATIO:-
YEAR SALE RAW MATERIAL RAW MATERIAL RATIO2005-06 1,24,82,28,524 14,85,81,529 8.402006-07 1,70,13,45,767 20,73,82,125 8.202007-08 1,94,05,65,639 20,47,50,322 9.482008-09 2,56,83,89,739 18,01,09,660 14.262009-10 3,28,78,95,291 20,46,74,907 16.062010-11 3,69,11,42,341 31,15,11,097 11.85
2006-07 2007-08 2008-09 2009-10 2010-11
94102
8171
79
2006-07 2007-08 2008-09 2009-10 2010-11
8.20 9.48
14.2616.06
11.85
4.14
WORKING CAPITAL MANAGEMENT OF `UAL INDUSTRIES LTD.’
Powered by:-SAUMENDRA NANDA ISBM
INTERPRETATION:- Inventory turnover ratio UAL INDUSTRIES LTD. Decreasing from the year 2005-06 to 2007-08 In the year 2008-09 & 2009-10 once again start to increase but in 2010-11 start to full again. In the year 2007-08 inventory turnover ratio is low & in 2009-10 ratio is high.
2.2-INVENTORY HOLDING PERIOD
YEAR DAYS INVENTORY TURNOVER RATIO INVENTORY HOLDING PERIOD
2005-06 360 3.917 922006-07 360 3.846 942007-08 360 3.531 1022008-09 360 4.426 812009-10 360 5.07 712010-11 360 4.556 79
INTERPRETATION:- Inventory holding period of UAL INDUSTRIES LTD. Is slightly high. In the year 2007-08 inventory holding period is highest. In the year 2009-10 inventory period is lower.
3.1-RAW MATERIAL TURNOVER RATIO:-
YEAR SALE RAW MATERIAL RAW MATERIAL RATIO2005-06 1,24,82,28,524 14,85,81,529 8.402006-07 1,70,13,45,767 20,73,82,125 8.202007-08 1,94,05,65,639 20,47,50,322 9.482008-09 2,56,83,89,739 18,01,09,660 14.262009-10 3,28,78,95,291 20,46,74,907 16.062010-11 3,69,11,42,341 31,15,11,097 11.85
2010-11
79
2010-11
11.85
4.14

WORKING CAPITAL MANAGEMENT OF `UAL INDUSTRIES LTD.’
Powered by:-SAUMENDRA NANDA ISBM
INTERPRETATION:- Raw material turnover ratio of UAL INDUSTRIES LTD. is increasing in trend. It starts to decrease in the year 2010-11. In the year 2009-10 it is highest & in the year 2006-07 ratio is lowest.
3.2- RAW MATERIAL HOLDING PERIODYEAR DAYS RAW MATERIAL RATIO RAW MATERIAL HOLDING PERIOD2005-06 360 8.4 432006-07 360 8.2 442007-08 360 9.48 382008-09 360 14.26 252009-10 360 16.06 222010-11 360 11.85 30
INTERPRETATION:- Raw material holding period UAL INDUSTRIES LTD. Is shows decreasing in trend. In year 2006-07 raw material holding period is highest & in the year 2009-10 ratio is lowest.
4.1-FINISHED GOODS TURNOVER RATIO:-YEAR SALE FINISHED GOODS FINISHED GOODS TURNOVER RATIO2005-06 1,24,82,28,524 12,40,74,586 10.0602006-07 1,70,13,45,767 17,17,24,353 9.9072007-08 1,94,05,65,639 24,34,22,171 7.9722008-09 2,56,83,89,739 19,97,59,869 12.8572009-10 3,28,78,95,291 20,31,79,658 16.1822010-11 3,69,11,42,341 30,04,45,168 12.286
INTERPRETATION:- Finished goods turnover ratio of UAL INDUSTRIES LTD. Is not maintaining a stable. Finished goods turnover ratio decrease from 2005-06 to 2007-08 then it start to increase
0
10
20
30
40
50
2005-06 2006-07
43 44
0.000
5.000
10.000
15.000
20.000
2005-06 2006-07
10.060
4.15
WORKING CAPITAL MANAGEMENT OF `UAL INDUSTRIES LTD.’
Powered by:-SAUMENDRA NANDA ISBM
INTERPRETATION:- Raw material turnover ratio of UAL INDUSTRIES LTD. is increasing in trend. It starts to decrease in the year 2010-11. In the year 2009-10 it is highest & in the year 2006-07 ratio is lowest.
3.2- RAW MATERIAL HOLDING PERIODYEAR DAYS RAW MATERIAL RATIO RAW MATERIAL HOLDING PERIOD2005-06 360 8.4 432006-07 360 8.2 442007-08 360 9.48 382008-09 360 14.26 252009-10 360 16.06 222010-11 360 11.85 30
INTERPRETATION:- Raw material holding period UAL INDUSTRIES LTD. Is shows decreasing in trend. In year 2006-07 raw material holding period is highest & in the year 2009-10 ratio is lowest.
4.1-FINISHED GOODS TURNOVER RATIO:-YEAR SALE FINISHED GOODS FINISHED GOODS TURNOVER RATIO2005-06 1,24,82,28,524 12,40,74,586 10.0602006-07 1,70,13,45,767 17,17,24,353 9.9072007-08 1,94,05,65,639 24,34,22,171 7.9722008-09 2,56,83,89,739 19,97,59,869 12.8572009-10 3,28,78,95,291 20,31,79,658 16.1822010-11 3,69,11,42,341 30,04,45,168 12.286
INTERPRETATION:- Finished goods turnover ratio of UAL INDUSTRIES LTD. Is not maintaining a stable. Finished goods turnover ratio decrease from 2005-06 to 2007-08 then it start to increase
2006-07 2007-08 2008-09 2009-10 2010-11
4438
25 2230
2006-07 2007-08 2008-09 2009-10 2010-11
9.9077.972
12.85716.182
12.286
4.15
WORKING CAPITAL MANAGEMENT OF `UAL INDUSTRIES LTD.’
Powered by:-SAUMENDRA NANDA ISBM
INTERPRETATION:- Raw material turnover ratio of UAL INDUSTRIES LTD. is increasing in trend. It starts to decrease in the year 2010-11. In the year 2009-10 it is highest & in the year 2006-07 ratio is lowest.
3.2- RAW MATERIAL HOLDING PERIODYEAR DAYS RAW MATERIAL RATIO RAW MATERIAL HOLDING PERIOD2005-06 360 8.4 432006-07 360 8.2 442007-08 360 9.48 382008-09 360 14.26 252009-10 360 16.06 222010-11 360 11.85 30
INTERPRETATION:- Raw material holding period UAL INDUSTRIES LTD. Is shows decreasing in trend. In year 2006-07 raw material holding period is highest & in the year 2009-10 ratio is lowest.
4.1-FINISHED GOODS TURNOVER RATIO:-YEAR SALE FINISHED GOODS FINISHED GOODS TURNOVER RATIO2005-06 1,24,82,28,524 12,40,74,586 10.0602006-07 1,70,13,45,767 17,17,24,353 9.9072007-08 1,94,05,65,639 24,34,22,171 7.9722008-09 2,56,83,89,739 19,97,59,869 12.8572009-10 3,28,78,95,291 20,31,79,658 16.1822010-11 3,69,11,42,341 30,04,45,168 12.286
INTERPRETATION:- Finished goods turnover ratio of UAL INDUSTRIES LTD. Is not maintaining a stable. Finished goods turnover ratio decrease from 2005-06 to 2007-08 then it start to increase
2010-11
30
2010-11
12.286
4.15
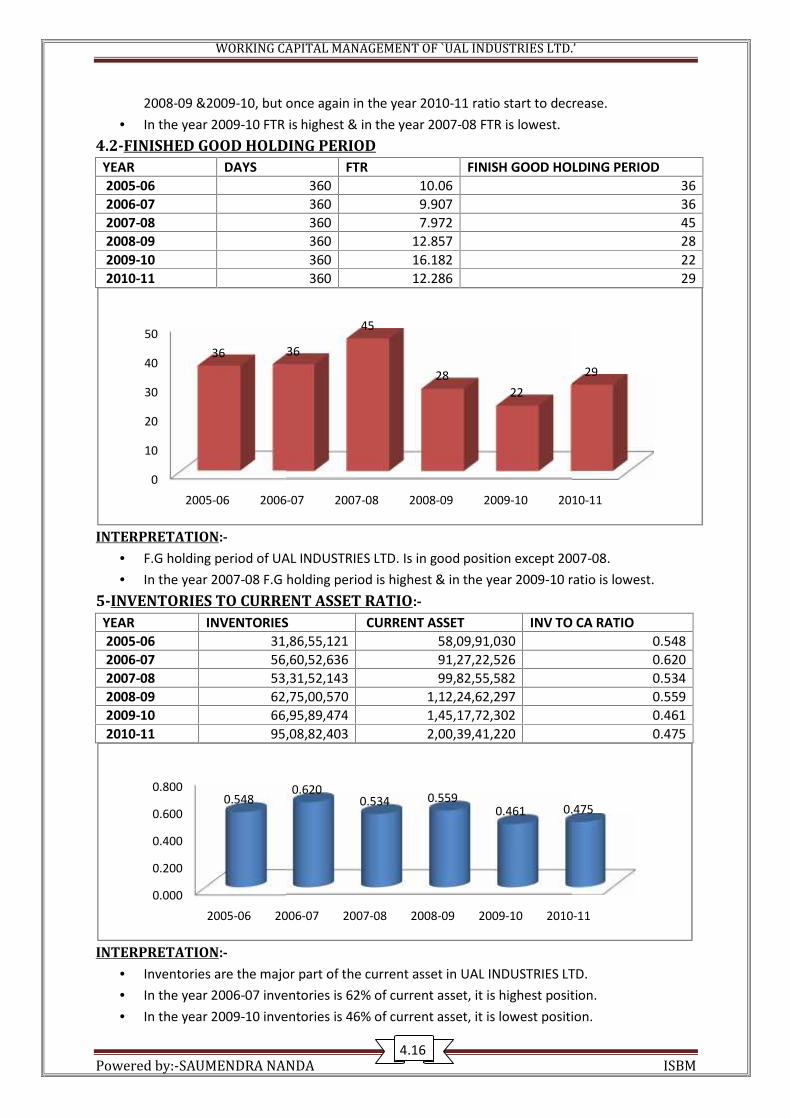
WORKING CAPITAL MANAGEMENT OF `UAL INDUSTRIES LTD.’
Powered by:-SAUMENDRA NANDA ISBM
2008-09 &2009-10, but once again in the year 2010-11 ratio start to decrease. In the year 2009-10 FTR is highest & in the year 2007-08 FTR is lowest.
4.2-FINISHED GOOD HOLDING PERIODYEAR DAYS FTR FINISH GOOD HOLDING PERIOD2005-06 360 10.06 362006-07 360 9.907 362007-08 360 7.972 452008-09 360 12.857 282009-10 360 16.182 222010-11 360 12.286 29
INTERPRETATION:- F.G holding period of UAL INDUSTRIES LTD. Is in good position except 2007-08. In the year 2007-08 F.G holding period is highest & in the year 2009-10 ratio is lowest.
5-INVENTORIES TO CURRENT ASSET RATIO:-YEAR INVENTORIES CURRENT ASSET INV TO CA RATIO2005-06 31,86,55,121 58,09,91,030 0.5482006-07 56,60,52,636 91,27,22,526 0.6202007-08 53,31,52,143 99,82,55,582 0.5342008-09 62,75,00,570 1,12,24,62,297 0.5592009-10 66,95,89,474 1,45,17,72,302 0.4612010-11 95,08,82,403 2,00,39,41,220 0.475
INTERPRETATION:- Inventories are the major part of the current asset in UAL INDUSTRIES LTD. In the year 2006-07 inventories is 62% of current asset, it is highest position. In the year 2009-10 inventories is 46% of current asset, it is lowest position.
0
10
20
30
40
50
2005-06 2006-07
36 36
0.000
0.200
0.400
0.600
0.800
2005-06 2006-07
0.5480.620
4.166
WORKING CAPITAL MANAGEMENT OF `UAL INDUSTRIES LTD.’
Powered by:-SAUMENDRA NANDA ISBM
2008-09 &2009-10, but once again in the year 2010-11 ratio start to decrease. In the year 2009-10 FTR is highest & in the year 2007-08 FTR is lowest.
4.2-FINISHED GOOD HOLDING PERIODYEAR DAYS FTR FINISH GOOD HOLDING PERIOD2005-06 360 10.06 362006-07 360 9.907 362007-08 360 7.972 452008-09 360 12.857 282009-10 360 16.182 222010-11 360 12.286 29
INTERPRETATION:- F.G holding period of UAL INDUSTRIES LTD. Is in good position except 2007-08. In the year 2007-08 F.G holding period is highest & in the year 2009-10 ratio is lowest.
5-INVENTORIES TO CURRENT ASSET RATIO:-YEAR INVENTORIES CURRENT ASSET INV TO CA RATIO2005-06 31,86,55,121 58,09,91,030 0.5482006-07 56,60,52,636 91,27,22,526 0.6202007-08 53,31,52,143 99,82,55,582 0.5342008-09 62,75,00,570 1,12,24,62,297 0.5592009-10 66,95,89,474 1,45,17,72,302 0.4612010-11 95,08,82,403 2,00,39,41,220 0.475
INTERPRETATION:- Inventories are the major part of the current asset in UAL INDUSTRIES LTD. In the year 2006-07 inventories is 62% of current asset, it is highest position. In the year 2009-10 inventories is 46% of current asset, it is lowest position.
2006-07 2007-08 2008-09 2009-10 2010-11
36
45
2822
2006-07 2007-08 2008-09 2009-10 2010-11
0.6200.534 0.559
0.461 0.475
4.166
WORKING CAPITAL MANAGEMENT OF `UAL INDUSTRIES LTD.’
Powered by:-SAUMENDRA NANDA ISBM
2008-09 &2009-10, but once again in the year 2010-11 ratio start to decrease. In the year 2009-10 FTR is highest & in the year 2007-08 FTR is lowest.
4.2-FINISHED GOOD HOLDING PERIODYEAR DAYS FTR FINISH GOOD HOLDING PERIOD2005-06 360 10.06 362006-07 360 9.907 362007-08 360 7.972 452008-09 360 12.857 282009-10 360 16.182 222010-11 360 12.286 29
INTERPRETATION:- F.G holding period of UAL INDUSTRIES LTD. Is in good position except 2007-08. In the year 2007-08 F.G holding period is highest & in the year 2009-10 ratio is lowest.
5-INVENTORIES TO CURRENT ASSET RATIO:-YEAR INVENTORIES CURRENT ASSET INV TO CA RATIO2005-06 31,86,55,121 58,09,91,030 0.5482006-07 56,60,52,636 91,27,22,526 0.6202007-08 53,31,52,143 99,82,55,582 0.5342008-09 62,75,00,570 1,12,24,62,297 0.5592009-10 66,95,89,474 1,45,17,72,302 0.4612010-11 95,08,82,403 2,00,39,41,220 0.475
INTERPRETATION:- Inventories are the major part of the current asset in UAL INDUSTRIES LTD. In the year 2006-07 inventories is 62% of current asset, it is highest position. In the year 2009-10 inventories is 46% of current asset, it is lowest position.
2010-11
29
2010-11
0.475
4.166
WORKING CAPITAL MANAGEMENT OF `UAL INDUSTRIES LTD.’
Powered by:-SAUMENDRA NANDA ISBM
4.7-RECEIVABLE MANAGEMENT
INTRODUCTION:-The receivables represent an important component of the current assets of the firm. Theamount of investment in accounts receivable for most firms. The amount of investment inaccounts receivable for most firms also represents a very substantial portion of current assets.According to I.M.Pandey:Trade credit is the most prominent force of the modern business.´ It isconsidered as an essential marketing tool, acting as a bridge for the movement of goods fromproduction and distribution stages to customers finally. The interval period between the date ofsale and the date of receipt of payment has to be financed out of working capital funds. Thus,trade debtors represent investment. As substantial amount are tied-up in trade debtors orreceivables, it needs careful analysis and proper management.
4.7.1-MEANING OF RECEIVABLES:-
Emerson as has defined the term `receivables’ when goods or services are sold under anarrangement permitting the customers to pay for them at a letter date; the amount due fromthe customer is recorded receivable´. This is an asset account, representing claim to futurepayment of cash from the customer.
4.7.2-OBJECTIVES OF RECEIVABLES MANAGEMENT:-
The basic objective of receivables management is to maximize the value of the firm by achievinga trade off between liquidity and profitability. In fact, the firm should manage its credit in such away that sales are expanded to an extent to which risk remains within an acceptable limit. Thus,to achieve the objective to maximizing the vale, the firm should manage its credit: To obtain optimum volume of sales. To control the cost of credit and keep it at minimum. To maintain investment in debtors at optimum level.
The purpose of credit management is not sales maximization. But efficient and effective creditmanagement does help to expand sales and can prove to be an effective credit management doeshelp to expand sales and can improve to be an effective tool of marketing, thus, the objective ofreceivables management is to promote sales and profits until that pint is reached where the returnon investment in further funding of receivables is less than the cost of funds raised to finance thatadditional credit
4.7.3-SIZE OF RECEIVABLES:-
The size of receivables is closely linked with a firm’s trade terms, which includes the period of credit,the rate of discount and collection policies etc. But the most important factor in determining thevolume of receivables is the level of a firms credit sale. With an increase in the size of sales, it maydecide to bring about a proportionate increase in the magnitude of receivables.
4.17

WORKING CAPITAL MANAGEMENT OF `UAL INDUSTRIES LTD.’
Powered by:-SAUMENDRA NANDA ISBM
RATIO ANALYSIS
i-TO ANALYZE EFFICIENCY
1-ACCOUNT RECEIVABLE TURNOVER RATIOYEAR SALE AVG DEBTORS RECEIVABLE TURNOVER RATIO2005-06 1,24,82,28,524 8,03,23,114 15.5402006-07 1,70,13,45,767 15,26,87,328 11.1432007-08 1,94,05,65,639 19,83,44,469 9.7842008-09 2,56,83,89,739 15,24,25,778 16.8502009-10 3,28,78,95,291 21,58,93,923 15.2292010-11 3,69,11,42,341 27,99,01,246 13.187
INTERPRETATION:- Receivable ratio of UAL INDUSTRIES LTD. Is fluctuation in nature. From 2005-06 to 2007-08 ratio decrease year by year In the year 2008-09 UAL INDUSTRIES LTD. Capable to recover but once again ratio starts to
decrease.1.2-DEBTORS COLLECTION PERIOD:-
YEAR DAYS RTR DEBTOR COLLECTION PERIOD2005-06 360 15.54 232006-07 360 11.14 322007-08 360 9.78 372008-09 360 16.85 212009-10 360 15.23 242010-11 360 13.19 27
INTERPRETATION:- Debtor collection period of UAL INDUSTRIES LTD. Is very efficient. Debtor collection period is high in the year 2007-08 but UAL INDUSTRIES LTD. Soon recover
this period.
0.000
5.000
10.000
15.000
20.000
2005-06 2006-07
0
10
20
30
40
2005-06 2006-07
4.18
WORKING CAPITAL MANAGEMENT OF `UAL INDUSTRIES LTD.’
Powered by:-SAUMENDRA NANDA ISBM
RATIO ANALYSIS
i-TO ANALYZE EFFICIENCY
1-ACCOUNT RECEIVABLE TURNOVER RATIOYEAR SALE AVG DEBTORS RECEIVABLE TURNOVER RATIO2005-06 1,24,82,28,524 8,03,23,114 15.5402006-07 1,70,13,45,767 15,26,87,328 11.1432007-08 1,94,05,65,639 19,83,44,469 9.7842008-09 2,56,83,89,739 15,24,25,778 16.8502009-10 3,28,78,95,291 21,58,93,923 15.2292010-11 3,69,11,42,341 27,99,01,246 13.187
INTERPRETATION:- Receivable ratio of UAL INDUSTRIES LTD. Is fluctuation in nature. From 2005-06 to 2007-08 ratio decrease year by year In the year 2008-09 UAL INDUSTRIES LTD. Capable to recover but once again ratio starts to
decrease.1.2-DEBTORS COLLECTION PERIOD:-
YEAR DAYS RTR DEBTOR COLLECTION PERIOD2005-06 360 15.54 232006-07 360 11.14 322007-08 360 9.78 372008-09 360 16.85 212009-10 360 15.23 242010-11 360 13.19 27
INTERPRETATION:- Debtor collection period of UAL INDUSTRIES LTD. Is very efficient. Debtor collection period is high in the year 2007-08 but UAL INDUSTRIES LTD. Soon recover
this period.
2006-07 2007-08 2008-09 2009-10 2010-11
2006-07 2007-08 2008-09 2009-10 2010-11
4.18
WORKING CAPITAL MANAGEMENT OF `UAL INDUSTRIES LTD.’
Powered by:-SAUMENDRA NANDA ISBM
RATIO ANALYSIS
i-TO ANALYZE EFFICIENCY
1-ACCOUNT RECEIVABLE TURNOVER RATIOYEAR SALE AVG DEBTORS RECEIVABLE TURNOVER RATIO2005-06 1,24,82,28,524 8,03,23,114 15.5402006-07 1,70,13,45,767 15,26,87,328 11.1432007-08 1,94,05,65,639 19,83,44,469 9.7842008-09 2,56,83,89,739 15,24,25,778 16.8502009-10 3,28,78,95,291 21,58,93,923 15.2292010-11 3,69,11,42,341 27,99,01,246 13.187
INTERPRETATION:- Receivable ratio of UAL INDUSTRIES LTD. Is fluctuation in nature. From 2005-06 to 2007-08 ratio decrease year by year In the year 2008-09 UAL INDUSTRIES LTD. Capable to recover but once again ratio starts to
decrease.1.2-DEBTORS COLLECTION PERIOD:-
YEAR DAYS RTR DEBTOR COLLECTION PERIOD2005-06 360 15.54 232006-07 360 11.14 322007-08 360 9.78 372008-09 360 16.85 212009-10 360 15.23 242010-11 360 13.19 27
INTERPRETATION:- Debtor collection period of UAL INDUSTRIES LTD. Is very efficient. Debtor collection period is high in the year 2007-08 but UAL INDUSTRIES LTD. Soon recover
this period.
2010-11
2010-11
4.18
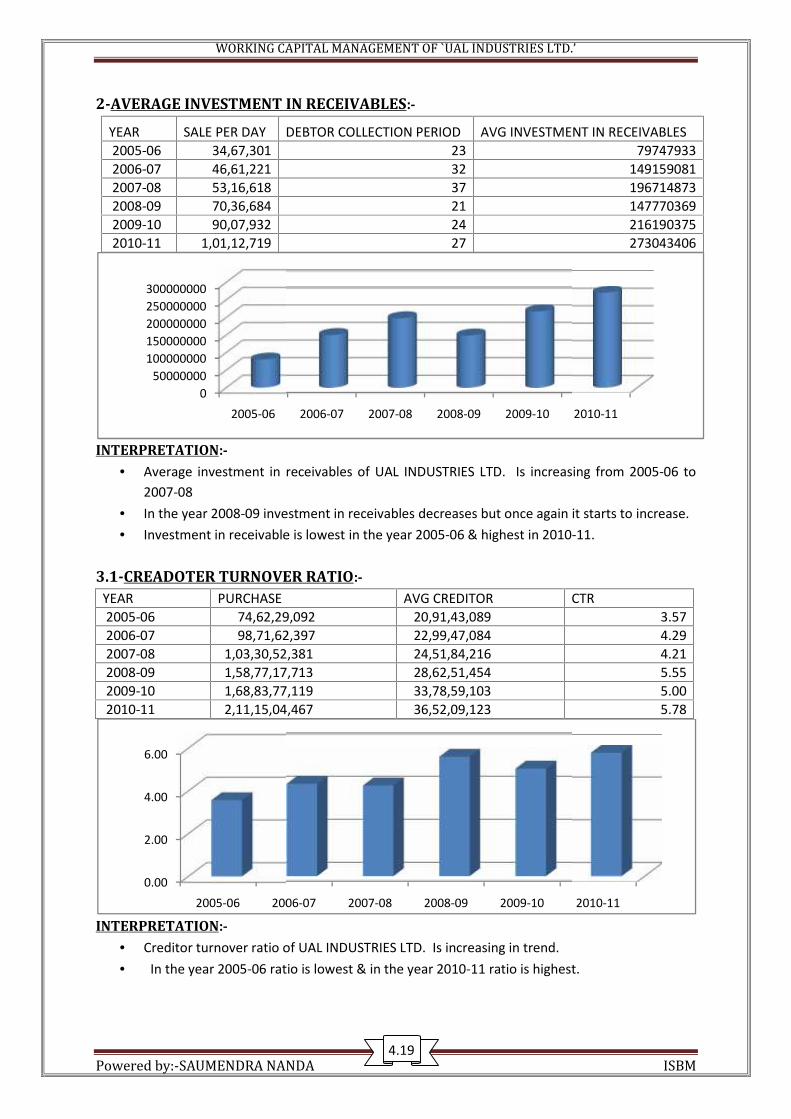
WORKING CAPITAL MANAGEMENT OF `UAL INDUSTRIES LTD.’
Powered by:-SAUMENDRA NANDA ISBM
2-AVERAGE INVESTMENT IN RECEIVABLES:-
YEAR SALE PER DAY DEBTOR COLLECTION PERIOD AVG INVESTMENT IN RECEIVABLES2005-06 34,67,301 23 797479332006-07 46,61,221 32 1491590812007-08 53,16,618 37 1967148732008-09 70,36,684 21 1477703692009-10 90,07,932 24 2161903752010-11 1,01,12,719 27 273043406
INTERPRETATION:- Average investment in receivables of UAL INDUSTRIES LTD. Is increasing from 2005-06 to
2007-08 In the year 2008-09 investment in receivables decreases but once again it starts to increase. Investment in receivable is lowest in the year 2005-06 & highest in 2010-11.
3.1-CREADOTER TURNOVER RATIO:-YEAR PURCHASE AVG CREDITOR CTR2005-06 74,62,29,092 20,91,43,089 3.572006-07 98,71,62,397 22,99,47,084 4.292007-08 1,03,30,52,381 24,51,84,216 4.212008-09 1,58,77,17,713 28,62,51,454 5.552009-10 1,68,83,77,119 33,78,59,103 5.002010-11 2,11,15,04,467 36,52,09,123 5.78
INTERPRETATION:- Creditor turnover ratio of UAL INDUSTRIES LTD. Is increasing in trend. In the year 2005-06 ratio is lowest & in the year 2010-11 ratio is highest.
050000000
100000000150000000200000000250000000300000000
2005-06
0.00
2.00
4.00
6.00
2005-06 2006-07
4.19
WORKING CAPITAL MANAGEMENT OF `UAL INDUSTRIES LTD.’
Powered by:-SAUMENDRA NANDA ISBM
2-AVERAGE INVESTMENT IN RECEIVABLES:-
YEAR SALE PER DAY DEBTOR COLLECTION PERIOD AVG INVESTMENT IN RECEIVABLES2005-06 34,67,301 23 797479332006-07 46,61,221 32 1491590812007-08 53,16,618 37 1967148732008-09 70,36,684 21 1477703692009-10 90,07,932 24 2161903752010-11 1,01,12,719 27 273043406
INTERPRETATION:- Average investment in receivables of UAL INDUSTRIES LTD. Is increasing from 2005-06 to
2007-08 In the year 2008-09 investment in receivables decreases but once again it starts to increase. Investment in receivable is lowest in the year 2005-06 & highest in 2010-11.
3.1-CREADOTER TURNOVER RATIO:-YEAR PURCHASE AVG CREDITOR CTR2005-06 74,62,29,092 20,91,43,089 3.572006-07 98,71,62,397 22,99,47,084 4.292007-08 1,03,30,52,381 24,51,84,216 4.212008-09 1,58,77,17,713 28,62,51,454 5.552009-10 1,68,83,77,119 33,78,59,103 5.002010-11 2,11,15,04,467 36,52,09,123 5.78
INTERPRETATION:- Creditor turnover ratio of UAL INDUSTRIES LTD. Is increasing in trend. In the year 2005-06 ratio is lowest & in the year 2010-11 ratio is highest.
2006-07 2007-08 2008-09 2009-10 2010-11
2006-07 2007-08 2008-09 2009-10 2010-11
4.19
WORKING CAPITAL MANAGEMENT OF `UAL INDUSTRIES LTD.’
Powered by:-SAUMENDRA NANDA ISBM
2-AVERAGE INVESTMENT IN RECEIVABLES:-
YEAR SALE PER DAY DEBTOR COLLECTION PERIOD AVG INVESTMENT IN RECEIVABLES2005-06 34,67,301 23 797479332006-07 46,61,221 32 1491590812007-08 53,16,618 37 1967148732008-09 70,36,684 21 1477703692009-10 90,07,932 24 2161903752010-11 1,01,12,719 27 273043406
INTERPRETATION:- Average investment in receivables of UAL INDUSTRIES LTD. Is increasing from 2005-06 to
2007-08 In the year 2008-09 investment in receivables decreases but once again it starts to increase. Investment in receivable is lowest in the year 2005-06 & highest in 2010-11.
3.1-CREADOTER TURNOVER RATIO:-YEAR PURCHASE AVG CREDITOR CTR2005-06 74,62,29,092 20,91,43,089 3.572006-07 98,71,62,397 22,99,47,084 4.292007-08 1,03,30,52,381 24,51,84,216 4.212008-09 1,58,77,17,713 28,62,51,454 5.552009-10 1,68,83,77,119 33,78,59,103 5.002010-11 2,11,15,04,467 36,52,09,123 5.78
INTERPRETATION:- Creditor turnover ratio of UAL INDUSTRIES LTD. Is increasing in trend. In the year 2005-06 ratio is lowest & in the year 2010-11 ratio is highest.
2010-11
2010-11
4.19

WORKING CAPITAL MANAGEMENT OF `UAL INDUSTRIES LTD.’
Powered by:-SAUMENDRA NANDA ISBM
3.2-CREDITOR COLLECTION PERIOD:-YEAR DAYS CTR CCP
2005-06 360 3.57 1012006-07 360 4.29 842007-08 360 4.21 862008-09 360 5.55 652009-10 360 5 722010-11 360 5.78 62
INTERPRETATION:- Credit collection period of UAL INDUSTRIES LTD. Is decreasing in trend. In the year 2005-06 credit collection periods is highest & in the year 2010-11 credit
collection period is lower.
ii-TO ANALYZE THE STUCTURE
1-RECEVIABLES TO CURRENT ASSET:-
YEAR RECEIVABLE CURRENT ASSET RECEIVABLE TO C.A2005-06 8,03,23,114 58,09,91,030 0.142006-07 15,26,87,328 91,27,22,526 0.172007-08 19,83,44,469 99,82,55,582 0.202008-09 15,24,25,778 1,12,24,62,297 0.142009-10 21,58,93,923 1,45,17,72,302 0.152010-11 27,99,01,246 2,00,39,41,220 0.14
INTERPRETATION:- In the year 2005-06, 2008-09 & 2010-11 receivable is 14% of current asset. So very efficient
work done by UAL INDUSTRIES LTD. In the year 2007-08 receivable is 20% of current asset.
0
20
40
60
80
100
120
2005-06 2006-07
0.00
0.05
0.10
0.15
0.20
2005-06 2006-07
4.20
WORKING CAPITAL MANAGEMENT OF `UAL INDUSTRIES LTD.’
Powered by:-SAUMENDRA NANDA ISBM
3.2-CREDITOR COLLECTION PERIOD:-YEAR DAYS CTR CCP
2005-06 360 3.57 1012006-07 360 4.29 842007-08 360 4.21 862008-09 360 5.55 652009-10 360 5 722010-11 360 5.78 62
INTERPRETATION:- Credit collection period of UAL INDUSTRIES LTD. Is decreasing in trend. In the year 2005-06 credit collection periods is highest & in the year 2010-11 credit
collection period is lower.
ii-TO ANALYZE THE STUCTURE
1-RECEVIABLES TO CURRENT ASSET:-
YEAR RECEIVABLE CURRENT ASSET RECEIVABLE TO C.A2005-06 8,03,23,114 58,09,91,030 0.142006-07 15,26,87,328 91,27,22,526 0.172007-08 19,83,44,469 99,82,55,582 0.202008-09 15,24,25,778 1,12,24,62,297 0.142009-10 21,58,93,923 1,45,17,72,302 0.152010-11 27,99,01,246 2,00,39,41,220 0.14
INTERPRETATION:- In the year 2005-06, 2008-09 & 2010-11 receivable is 14% of current asset. So very efficient
work done by UAL INDUSTRIES LTD. In the year 2007-08 receivable is 20% of current asset.
2006-07 2007-08 2008-09 2009-10 2010-11
2006-07 2007-08 2008-09 2009-10 2010-11
4.20
WORKING CAPITAL MANAGEMENT OF `UAL INDUSTRIES LTD.’
Powered by:-SAUMENDRA NANDA ISBM
3.2-CREDITOR COLLECTION PERIOD:-YEAR DAYS CTR CCP
2005-06 360 3.57 1012006-07 360 4.29 842007-08 360 4.21 862008-09 360 5.55 652009-10 360 5 722010-11 360 5.78 62
INTERPRETATION:- Credit collection period of UAL INDUSTRIES LTD. Is decreasing in trend. In the year 2005-06 credit collection periods is highest & in the year 2010-11 credit
collection period is lower.
ii-TO ANALYZE THE STUCTURE
1-RECEVIABLES TO CURRENT ASSET:-
YEAR RECEIVABLE CURRENT ASSET RECEIVABLE TO C.A2005-06 8,03,23,114 58,09,91,030 0.142006-07 15,26,87,328 91,27,22,526 0.172007-08 19,83,44,469 99,82,55,582 0.202008-09 15,24,25,778 1,12,24,62,297 0.142009-10 21,58,93,923 1,45,17,72,302 0.152010-11 27,99,01,246 2,00,39,41,220 0.14
INTERPRETATION:- In the year 2005-06, 2008-09 & 2010-11 receivable is 14% of current asset. So very efficient
work done by UAL INDUSTRIES LTD. In the year 2007-08 receivable is 20% of current asset.
2010-11
4.20

WORKING CAPITAL MANAGEMENT OF `UAL INDUSTRIES LTD.’
Powered by:-SAUMENDRA NANDA ISBM
4.8-CASH MANAGEMENT
4.8.1-Introduction:-Cash is an important component of current assets and is most essential for business operations.Cash is the basic input needed to keep the business running on a continuous basis. It is also theultimate output expected to be realized by selling the service and product manufactured by the firm.
Cash is both the beginning and the end of the working capital cycle i.e. cash, inventories,receivables and cash. While the management of all the firms should strive hard to secure larger cashat the management of all the firms should strive hard to secure larger cash at the end of the workingcapital cycle than what had been invested into; it at its beginning, they must also make it a bestpossible minimum. This is required to optimally utilize the cash and to avoid the situation of ideacash balances.Its effective management is the key determinant of sufficient working capital. In the keydeterminant of sufficient working capital. In the words of `P.V.Kulkarni’ Cash in the businessenterprise may be compared to the blood of the human body; blood gives life and strength ± profitsand solvency to the business organization.´ Hence, every enterprise has to hold to hold necessarycash for is existence.
In a business firm, ultimately, a transaction results in either an inflow or outflow of cash. In anefficient managed business, static cash balance situation generally does not exist. A firm should keepsufficient cash, neither more nor less. Cash shortage will disrupt the firms manufacturing operation;while excessive cash will simply main idle. Therefore, for its smooth running and maximum in abusiness is of paramount importance.
4.8.2-Motive for Holding Cash:J.M.Keynes a prominent economist pointed out three primary motives for holding cash(i) The transaction motive(ii) The precautionary motive; and(iii) The speculative motive; these motive are explained as under-
(i) The Transaction Motive:-The transaction motive requires a firm to hold cash to conduct its business in the ordinary course.The firm needs cash primarily to make payment for purchases, wages, operating expenses, taxes etc.A firm needs a pool of cash because its receipts and payment are not perfectly synchronized. A poolof cash is also known as transaction balance.
(ii) The Precautionary Motive:-The precaution motive is to hold cash to meet any contingencies in future. It provides a cushion orbuffer to withstand some unexpected emergency. The precautionary amount of cash depends uponthe predictability of cash flows. If cash flows can be predicted with accuracy, less cash will bemaintained against an emergency. On other hand, unpredicted the cash flows, the larger the needfor such balances.
(iii) The Speculative Motive:-The financial manager would like to take advantage of unexploited opportunities. Some reserve ofmoney is always essential to enable the firm to take advantage of cash when such opportunitiesarise.
4.21
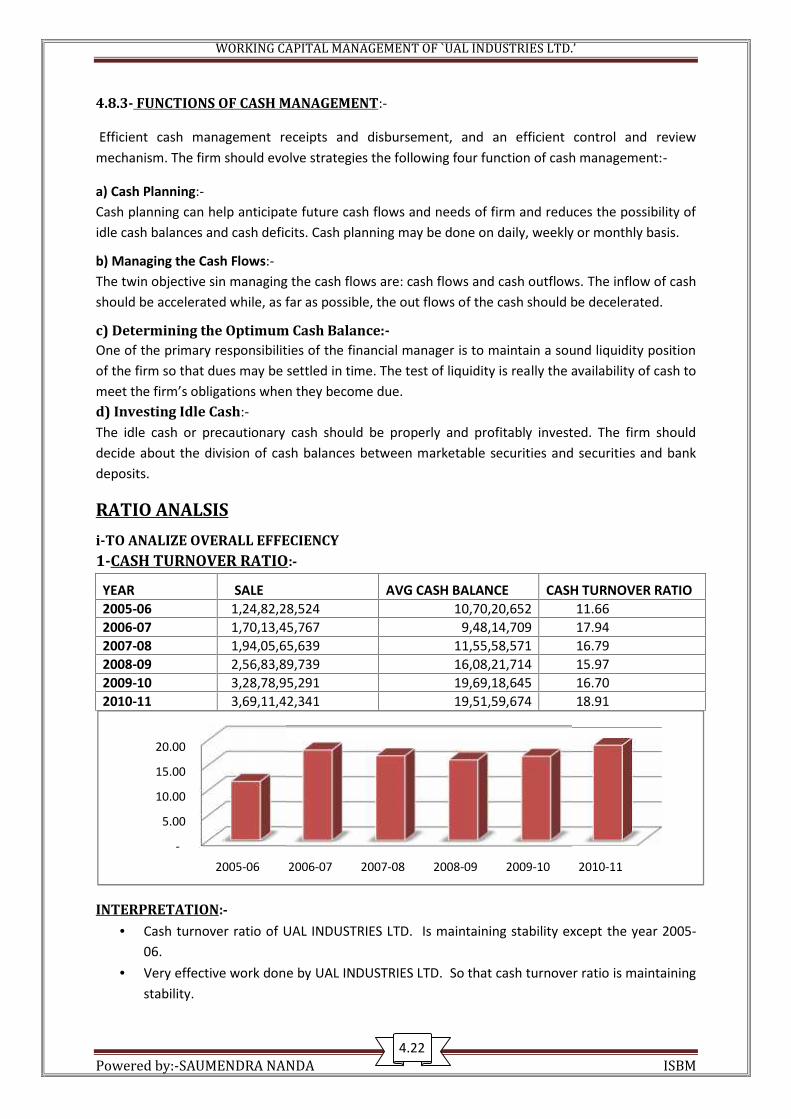
WORKING CAPITAL MANAGEMENT OF `UAL INDUSTRIES LTD.’
Powered by:-SAUMENDRA NANDA ISBM
4.8.3- FUNCTIONS OF CASH MANAGEMENT:-
Efficient cash management receipts and disbursement, and an efficient control and reviewmechanism. The firm should evolve strategies the following four function of cash management:-
a) Cash Planning:-Cash planning can help anticipate future cash flows and needs of firm and reduces the possibility ofidle cash balances and cash deficits. Cash planning may be done on daily, weekly or monthly basis.
b) Managing the Cash Flows:-The twin objective sin managing the cash flows are: cash flows and cash outflows. The inflow of cashshould be accelerated while, as far as possible, the out flows of the cash should be decelerated.
c) Determining the Optimum Cash Balance:-One of the primary responsibilities of the financial manager is to maintain a sound liquidity positionof the firm so that dues may be settled in time. The test of liquidity is really the availability of cash tomeet the firm’s obligations when they become due.d) Investing Idle Cash:-The idle cash or precautionary cash should be properly and profitably invested. The firm shoulddecide about the division of cash balances between marketable securities and securities and bankdeposits.
RATIO ANALSISi-TO ANALIZE OVERALL EFFECIENCY1-CASH TURNOVER RATIO:-
YEAR SALE AVG CASH BALANCE CASH TURNOVER RATIO2005-06 1,24,82,28,524 10,70,20,652 11.662006-07 1,70,13,45,767 9,48,14,709 17.942007-08 1,94,05,65,639 11,55,58,571 16.792008-09 2,56,83,89,739 16,08,21,714 15.972009-10 3,28,78,95,291 19,69,18,645 16.702010-11 3,69,11,42,341 19,51,59,674 18.91
INTERPRETATION:- Cash turnover ratio of UAL INDUSTRIES LTD. Is maintaining stability except the year 2005-
06. Very effective work done by UAL INDUSTRIES LTD. So that cash turnover ratio is maintaining
stability.
-
5.00
10.00
15.00
20.00
2005-06 2006-07
4.22
WORKING CAPITAL MANAGEMENT OF `UAL INDUSTRIES LTD.’
Powered by:-SAUMENDRA NANDA ISBM
4.8.3- FUNCTIONS OF CASH MANAGEMENT:-
Efficient cash management receipts and disbursement, and an efficient control and reviewmechanism. The firm should evolve strategies the following four function of cash management:-
a) Cash Planning:-Cash planning can help anticipate future cash flows and needs of firm and reduces the possibility ofidle cash balances and cash deficits. Cash planning may be done on daily, weekly or monthly basis.
b) Managing the Cash Flows:-The twin objective sin managing the cash flows are: cash flows and cash outflows. The inflow of cashshould be accelerated while, as far as possible, the out flows of the cash should be decelerated.
c) Determining the Optimum Cash Balance:-One of the primary responsibilities of the financial manager is to maintain a sound liquidity positionof the firm so that dues may be settled in time. The test of liquidity is really the availability of cash tomeet the firm’s obligations when they become due.d) Investing Idle Cash:-The idle cash or precautionary cash should be properly and profitably invested. The firm shoulddecide about the division of cash balances between marketable securities and securities and bankdeposits.
RATIO ANALSISi-TO ANALIZE OVERALL EFFECIENCY1-CASH TURNOVER RATIO:-
YEAR SALE AVG CASH BALANCE CASH TURNOVER RATIO2005-06 1,24,82,28,524 10,70,20,652 11.662006-07 1,70,13,45,767 9,48,14,709 17.942007-08 1,94,05,65,639 11,55,58,571 16.792008-09 2,56,83,89,739 16,08,21,714 15.972009-10 3,28,78,95,291 19,69,18,645 16.702010-11 3,69,11,42,341 19,51,59,674 18.91
INTERPRETATION:- Cash turnover ratio of UAL INDUSTRIES LTD. Is maintaining stability except the year 2005-
06. Very effective work done by UAL INDUSTRIES LTD. So that cash turnover ratio is maintaining
stability.
2006-07 2007-08 2008-09 2009-10 2010-11
4.22
WORKING CAPITAL MANAGEMENT OF `UAL INDUSTRIES LTD.’
Powered by:-SAUMENDRA NANDA ISBM
4.8.3- FUNCTIONS OF CASH MANAGEMENT:-
Efficient cash management receipts and disbursement, and an efficient control and reviewmechanism. The firm should evolve strategies the following four function of cash management:-
a) Cash Planning:-Cash planning can help anticipate future cash flows and needs of firm and reduces the possibility ofidle cash balances and cash deficits. Cash planning may be done on daily, weekly or monthly basis.
b) Managing the Cash Flows:-The twin objective sin managing the cash flows are: cash flows and cash outflows. The inflow of cashshould be accelerated while, as far as possible, the out flows of the cash should be decelerated.
c) Determining the Optimum Cash Balance:-One of the primary responsibilities of the financial manager is to maintain a sound liquidity positionof the firm so that dues may be settled in time. The test of liquidity is really the availability of cash tomeet the firm’s obligations when they become due.d) Investing Idle Cash:-The idle cash or precautionary cash should be properly and profitably invested. The firm shoulddecide about the division of cash balances between marketable securities and securities and bankdeposits.
RATIO ANALSISi-TO ANALIZE OVERALL EFFECIENCY1-CASH TURNOVER RATIO:-
YEAR SALE AVG CASH BALANCE CASH TURNOVER RATIO2005-06 1,24,82,28,524 10,70,20,652 11.662006-07 1,70,13,45,767 9,48,14,709 17.942007-08 1,94,05,65,639 11,55,58,571 16.792008-09 2,56,83,89,739 16,08,21,714 15.972009-10 3,28,78,95,291 19,69,18,645 16.702010-11 3,69,11,42,341 19,51,59,674 18.91
INTERPRETATION:- Cash turnover ratio of UAL INDUSTRIES LTD. Is maintaining stability except the year 2005-
06. Very effective work done by UAL INDUSTRIES LTD. So that cash turnover ratio is maintaining
stability.
2010-11
4.22

WORKING CAPITAL MANAGEMENT OF `UAL INDUSTRIES LTD.’
Powered by:-SAUMENDRA NANDA ISBM
1.2-CASH HOLDING PERIOD:-YEAR DAYS CTR CHP2005-06 360 11.66 312006-07 360 17.94 202007-08 360 16.79 212008-09 360 15.97 232009-10 360 16.7 222010-11 360 18.91 19
INTERPRETATION:- Cash holding period of UAL INDUSTRIES LTD. Is very good. Except 2005-06 UAL INDUSTRIES LTD. Maintain stability. In the year 2005-06 cash holding period is 31 days.
ii-TO ANALZE LIQUIDITY1-CASH RATIO:-
YEAR CASH(RS) CURRENT LIABILITIES(RS) CASH RATIO2005-06 107020652 34,27,42,046 0.3122006-07 82608765 43,98,86,063 0.1882007-08 148508377 43,63,11,353 0.3402008-09 173135051 61,75,55,610 0.2802009-10 220702239 84,57,73,982 0.2612010-11 169617108 1,08,38,50,498 0.156
INTERPRETATION:- Cash availability decrease year to year of UAL INDUSTRIES LTD. In the year 2007-08 cash availability is highest & in the year 2010-11 cash availability is
lower.
0
10
20
30
40
2005-06 2006-07
0.000
0.100
0.200
0.300
0.400
2005-06 2006-07
0.312
0.188
4.23
WORKING CAPITAL MANAGEMENT OF `UAL INDUSTRIES LTD.’
Powered by:-SAUMENDRA NANDA ISBM
1.2-CASH HOLDING PERIOD:-YEAR DAYS CTR CHP2005-06 360 11.66 312006-07 360 17.94 202007-08 360 16.79 212008-09 360 15.97 232009-10 360 16.7 222010-11 360 18.91 19
INTERPRETATION:- Cash holding period of UAL INDUSTRIES LTD. Is very good. Except 2005-06 UAL INDUSTRIES LTD. Maintain stability. In the year 2005-06 cash holding period is 31 days.
ii-TO ANALZE LIQUIDITY1-CASH RATIO:-
YEAR CASH(RS) CURRENT LIABILITIES(RS) CASH RATIO2005-06 107020652 34,27,42,046 0.3122006-07 82608765 43,98,86,063 0.1882007-08 148508377 43,63,11,353 0.3402008-09 173135051 61,75,55,610 0.2802009-10 220702239 84,57,73,982 0.2612010-11 169617108 1,08,38,50,498 0.156
INTERPRETATION:- Cash availability decrease year to year of UAL INDUSTRIES LTD. In the year 2007-08 cash availability is highest & in the year 2010-11 cash availability is
lower.
2006-07 2007-08 2008-09 2009-10 2010-11
2006-07 2007-08 2008-09 2009-10 2010-11
0.188
0.3400.280 0.261
4.23
WORKING CAPITAL MANAGEMENT OF `UAL INDUSTRIES LTD.’
Powered by:-SAUMENDRA NANDA ISBM
1.2-CASH HOLDING PERIOD:-YEAR DAYS CTR CHP2005-06 360 11.66 312006-07 360 17.94 202007-08 360 16.79 212008-09 360 15.97 232009-10 360 16.7 222010-11 360 18.91 19
INTERPRETATION:- Cash holding period of UAL INDUSTRIES LTD. Is very good. Except 2005-06 UAL INDUSTRIES LTD. Maintain stability. In the year 2005-06 cash holding period is 31 days.
ii-TO ANALZE LIQUIDITY1-CASH RATIO:-
YEAR CASH(RS) CURRENT LIABILITIES(RS) CASH RATIO2005-06 107020652 34,27,42,046 0.3122006-07 82608765 43,98,86,063 0.1882007-08 148508377 43,63,11,353 0.3402008-09 173135051 61,75,55,610 0.2802009-10 220702239 84,57,73,982 0.2612010-11 169617108 1,08,38,50,498 0.156
INTERPRETATION:- Cash availability decrease year to year of UAL INDUSTRIES LTD. In the year 2007-08 cash availability is highest & in the year 2010-11 cash availability is
lower.
2010-11
2010-11
0.156
4.23

WORKING CAPITAL MANAGEMENT OF `UAL INDUSTRIES LTD.’
Powered by:-SAUMENDRA NANDA ISBM
iii-TO ANALYZE STRUCTURE1-CASH TO CURRENT ASSET RATIO:-
YEAR CASH CURRENT ASSET CASH TO CA RATIO2005-06 10,70,20,652 58,09,91,030 0.1842006-07 8,26,08,765 91,27,22,526 0.0912007-08 14,85,08,377 99,82,55,582 0.1492008-09 17,31,35,051 1,12,24,62,297 0.1542009-10 22,07,02,239 1,45,17,72,302 0.1522010-11 16,96,17,108 2,00,39,41,220 0.085
INTERPRETATION:- Cash is not a major portion of total current asset of UAL INDUSTRIES LTD. In the year 2010-11 cash is only 8% of current asset. In the year 2005-06 cash is 20% out of total current asset.
0.000
0.050
0.100
0.150
0.200
2005-06 2006-07
4.24
WORKING CAPITAL MANAGEMENT OF `UAL INDUSTRIES LTD.’
Powered by:-SAUMENDRA NANDA ISBM
iii-TO ANALYZE STRUCTURE1-CASH TO CURRENT ASSET RATIO:-
YEAR CASH CURRENT ASSET CASH TO CA RATIO2005-06 10,70,20,652 58,09,91,030 0.1842006-07 8,26,08,765 91,27,22,526 0.0912007-08 14,85,08,377 99,82,55,582 0.1492008-09 17,31,35,051 1,12,24,62,297 0.1542009-10 22,07,02,239 1,45,17,72,302 0.1522010-11 16,96,17,108 2,00,39,41,220 0.085
INTERPRETATION:- Cash is not a major portion of total current asset of UAL INDUSTRIES LTD. In the year 2010-11 cash is only 8% of current asset. In the year 2005-06 cash is 20% out of total current asset.
2006-07 2007-08 2008-09 2009-10 2010-11
4.24
WORKING CAPITAL MANAGEMENT OF `UAL INDUSTRIES LTD.’
Powered by:-SAUMENDRA NANDA ISBM
iii-TO ANALYZE STRUCTURE1-CASH TO CURRENT ASSET RATIO:-
YEAR CASH CURRENT ASSET CASH TO CA RATIO2005-06 10,70,20,652 58,09,91,030 0.1842006-07 8,26,08,765 91,27,22,526 0.0912007-08 14,85,08,377 99,82,55,582 0.1492008-09 17,31,35,051 1,12,24,62,297 0.1542009-10 22,07,02,239 1,45,17,72,302 0.1522010-11 16,96,17,108 2,00,39,41,220 0.085
INTERPRETATION:- Cash is not a major portion of total current asset of UAL INDUSTRIES LTD. In the year 2010-11 cash is only 8% of current asset. In the year 2005-06 cash is 20% out of total current asset.
2010-11
4.24

WORKING CAPITAL MANAGEMENT OF `UAL INDUSTRIES LTD.’
Powered by:-SAUMENDRA NANDA ISBM
4.9 OPERATING CYCLE:-Operating cycle = raw material holding period + F.G holding period + debit collection period – credit
Collection periodOPERATING CYCLE
YEAR
RAWMATERIALHOLDINGPERIOD
F.G HOLDINGPERIOD
DEBTORCOLLECTIONPERIOD
CREDITCOLLECTIONPERIOD
OPERATINGCYCLE
2005-06 43 36 23 101 12006-07 44 36 32 84 282007-08 38 45 37 86 342008-09 25 28 21 65 92009-10 22 22 24 72 -42010-11 30 29 27 62 24
INTERPRETATION:- Operating cycle of UAL INDUSTRIES LTD. Is fluctuating in nature. There is rapidly change in operating cycle. In the year 2009-10 it is very low one i.e. -4. It is best one.
1
28
34
9
-4
24
-10-505
10152025303540
2005-06 2006-07 2007-08 2008-09 2009-10 2010-11
4.25

FORECASTING
WOKING CAPITAL MANAGEMENT OF `UAL INDUSTRIES LTD.’
Powered by:-SAUMENDRA NANDA ISBM
5.1TIME SERIES ANALYSISTime series refers to a series in which one variable is time. A time series is an arrangement ofstatistical data in accordance to the time of occurrence or in a chronological analysis is doneprimarily for the purpose of making forecasts for future and also for the purpose of evaluating pastperformances.5.2 METHOD OF LEAST SQUARES:--Let us assume ye= a + b*xWhere a= ∑y / nb=∑xy/∑(x*x)Here we are taking for 5 years that is 2005-06 to 2009-10So the value of `n’= number of yearSo n = 5The base year I am considering for forecasting purpose is 2008-09.So the value of `x’ is = zero for 2008-09Here I am forecasting the values for the year 2011-12.
5.3 FORECASTING FOR THE YEAR 2011-12
i-ESTIMATION SALE PERFOMANCE
YEAR SALE(Y) Xx*x Xy a b Ye=a+bx
2006-07 1,70,13,45,767 -2 4 -3402691534
2,63,78,67,755 53,26,92,280
1,57,24,83,195
2007-08 1,94,05,65,639 -1 1 -1940565639
2,63,78,67,755 53,26,92,280
2,10,51,75,475
2008-09 2,56,83,89,739 0 0 0
2,63,78,67,755 53,26,92,280
2,63,78,67,755
2009-10 3,28,78,95,291 1 1 3287895291
2,63,78,67,755 53,26,92,280
3,17,05,60,035
2010-11 3,69,11,42,341 2 4 7382284682
2,63,78,67,755 53,26,92,280
3,70,32,52,315
TOTAL13,18,93,38,77
7 0 105,32,69,22,80
02011-12 3
2,63,78,67,755 53,26,92,280
4,23,59,44,595
5.1

WOKING CAPITAL MANAGEMENT OF `UAL INDUSTRIES LTD.’
Powered by:-SAUMENDRA NANDA ISBM
INFERENCE:- The estimated value of the sales for the year 2011-12 is Rs 4,23,59,44,595. The above chart shows the accuracy of forecasting. Accuracy of forecasting is very good The chart shows that sales will increase in the year 2011-12. The chart shows that sales increase year to year, so it is very good sign for the company. The chart signified that it is an upward slope.
ii- FORECASTING OF CURRENT ASSET1-INVENTORY
0
50,00,00,000
1,00,00,00,000
1,50,00,00,000
2,00,00,00,000
2,50,00,00,000
3,00,00,00,000
3,50,00,00,000
4,00,00,00,000
4,50,00,00,000
2006-07 2007-08 2008-09 2009-10 2010-11 2011-12
SALE(Y)
y=a+bx
YEAR INVENTORIES(Y) x x*x xY a=∑Y/n b=∑xY/∑x*x ye=a+bx2006-07 56,60,52,636 -2 4 -1,13,21,05,272 66,94,35,446 9,06,09,687 48,82,16,0732007-08 53,31,52,143 -1 1 -53,31,52,143 66,94,35,446 9,06,09,687 57,88,25,7602008-09 62,75,00,574 0 0 - 66,94,35,446 9,06,09,687 66,94,35,4462009-10 66,95,89,474 1 1 66,95,89,474 66,94,35,446 9,06,09,687 76,00,45,1332010-11 95,08,82,403 2 4 1,90,17,64,806 66,94,35,446 9,06,09,687 85,06,54,819TOTAL 3,34,71,77,230 0 10 90,60,96,8652011-12 3 66,94,35,446 9,06,09,687 94,12,64,506
-
10,00,00,000
20,00,00,000
30,00,00,000
40,00,00,000
50,00,00,000
60,00,00,000
70,00,00,000
80,00,00,000
90,00,00,000
1,00,00,00,000
2006-07 2007-08 2008-09 2009-10 2010-11 2011-12
INVENTORIES
ye=a+bx
5.2
WOKING CAPITAL MANAGEMENT OF `UAL INDUSTRIES LTD.’
Powered by:-SAUMENDRA NANDA ISBM
INFERENCE:- The estimation value of inventories for the year 2011-12 is Rs 94, 12, 64, 506. The above chart shows the accuracy of forecasting. Accuracy of forecasting is very good. The chart shows that it is upward slope. Inventories of the UAL INDUSTRIES LTD. decrease year to year. It is good sign for UAL INDUSTRIES LTD. Because inventory increase year to year. It is happen due to more investment in inventory of inventories.
2-CASH
INFERENCE:-
The estimated value of cash for the year 2011-12 is Rs 23, 27, 77,472. The above chart shows the accuracy of forecasting. The accuracy of forecasting is very good. The chart shows that it is upward slope curb. It is good sign for organisation. Because cash is life blood of every organisation. So increasingof cash is a good sign.
3-SUNDRY DEBTORS:-YEAR SD x x*x xY A b Ye=a+bx
2006-07 15,26,87,328-2 4 -305374656 19,98,50,549 2,71,97,729 14,54,55,091
2007-08 19,83,44,469-1 1 -198344469 19,98,50,549 2,71,97,729 17,26,52,820
2008-09 15,24,25,778 0 0 0 19,98,50,549 2,71,97,729 19,98,50,5492009-10 21,58,93,923 1 1 215893923 19,98,50,549 2,71,97,729 22,70,48,2782010-11 27,99,01,246 2 4 559802492 19,98,50,549 2,71,97,729 25,42,46,007TOTAL 99,92,52,744 0 10 27,19,77,2902011-12 3 19,98,50,549 2,71,97,729 28,14,43,736
YEAR CASH x x*x xY a=∑Y/n b=∑xY/∑x*x ye=a+bx2006-07 8,26,08,765 -2 4 -16,52,17,530 15,89,14,308 2,46,21,055 10,96,72,1982007-08 14,85,08,377 -1 1 -14,85,08,377 15,89,14,308 2,46,21,055 13,42,93,2532008-09 17,31,35,051 0 0 - 15,89,14,308 2,46,21,055 15,89,14,3082009-10 22,07,02,239 1 1 22,07,02,239 15,89,14,308 2,46,21,055 18,35,35,3632010-11 16,96,17,108 2 4 33,92,34,216 15,89,14,308 2,46,21,055 20,81,56,418TOTAL 79,45,71,540 0 10 24,62,10,5482011-12 3 15,89,14,308 2,46,21,055 23,27,77,472
-
5,00,00,000
10,00,00,000
15,00,00,000
20,00,00,000
25,00,00,000
2006
-
5,00,00,000
10,00,00,000
15,00,00,000
20,00,00,000
25,00,00,000
2006-07 2007-08 2008-09 2009-10 2010-11 2011-12
CASH
ye=a+bx
5.3
WOKING CAPITAL MANAGEMENT OF `UAL INDUSTRIES LTD.’
Powered by:-SAUMENDRA NANDA ISBM
INFERENCE:-
Estimation value of sundry debtor for the year 2011-12 is Rs 28, 14, 43,736. The above chart shows that the accuracy of forecasting. In the year 2008-09 accuracy of forecasting is less. The chart shows that it is upward trend. It is good sign for the UAL INDUSTRIES LTD. Because increase of sundry debtor directlyaffect to the sale & current asset.
4-LOANS & ADVANCES:--
YEAR LOANS &ADV(Y)
x x*x xY a b Ye=a+bx
2006-07
11,13,73,797 -2 4 -222747594 26,96,30,483 12,11,66,941 2,72,96,602
2007-08
11,82,50,593 -1 1 -118250593 26,96,30,483 12,11,66,941 14,84,63,542
2008-09
16,94,00,894 0 0 0 26,96,30,483 12,11,66,941 26,96,30,483
2009-10
34,55,86,666 1 1 345586666 26,96,30,483 12,11,66,941 39,07,97,424
2010-11
60,35,40,463 2 4 1207080926 26,96,30,483 12,11,66,941 51,19,64,365
TOTAL 1,34,81,52,413 0 10 1,21,16,69,4052011-12
3 26,96,30,483 12,11,66,941 63,31,31,306
5.4

WOKING CAPITAL MANAGEMENT OF `UAL INDUSTRIES LTD.’
Powered by:-SAUMENDRA NANDA ISBM
INFERENCE:--
The estimated value of loans & advances is Rs 63, 31, 31,306. The above chart shows that it is upward slope. Accuracy of forecasting is less in the year 2008-09 & accuracy of forecasting is high in theyear 2010-11. It very good sign for UAL INDUSTRIES LTD. Because loans & advance is a part of currentasset, so increase of current asset is good for organisation.
iii-FORECASTING OF CURRENT LIABILITIES
1-CURRENT LIABILITIES:--
0
10,00,00,000
20,00,00,000
30,00,00,000
40,00,00,000
50,00,00,000
60,00,00,000
70,00,00,000
2006-07 2007-08 2008-09 2009-10 2010-11 2011-12
LOANS &ADV
ye=a+bx
YEAR C.L x x*x xY a=∑Y/n b=∑xY/∑x*x ye=a+bx2006-07 34,61,54,317 -2 4 -69,23,08,634 48,69,39,156 8,94,10,876 30,81,17,4052007-08 34,79,47,682 -1 1 -34,79,47,682 48,69,39,156 8,94,10,876 39,75,28,2802008-09 47,90,72,324 0 0 - 48,69,39,156 8,94,10,876 48,69,39,1562009-10 58,86,77,841 1 1 58,86,77,841 48,69,39,156 8,94,10,876 57,63,50,0312010-11 67,28,43,615 2 4 1,34,56,87,230 48,69,39,156 8,94,10,876 66,57,60,907TOTAL 2,43,46,95,779 0 10 89,41,08,7552011-12 3 48,69,39,156 8,94,10,876 75,51,71,782
-
10,00,00,000
20,00,00,000
30,00,00,000
40,00,00,000
50,00,00,000
60,00,00,000
70,00,00,000
80,00,00,000
2006-07 2007-08 2008-09 2009-10 2010-11 2011-12
C.L
ye=a+bx
5.55
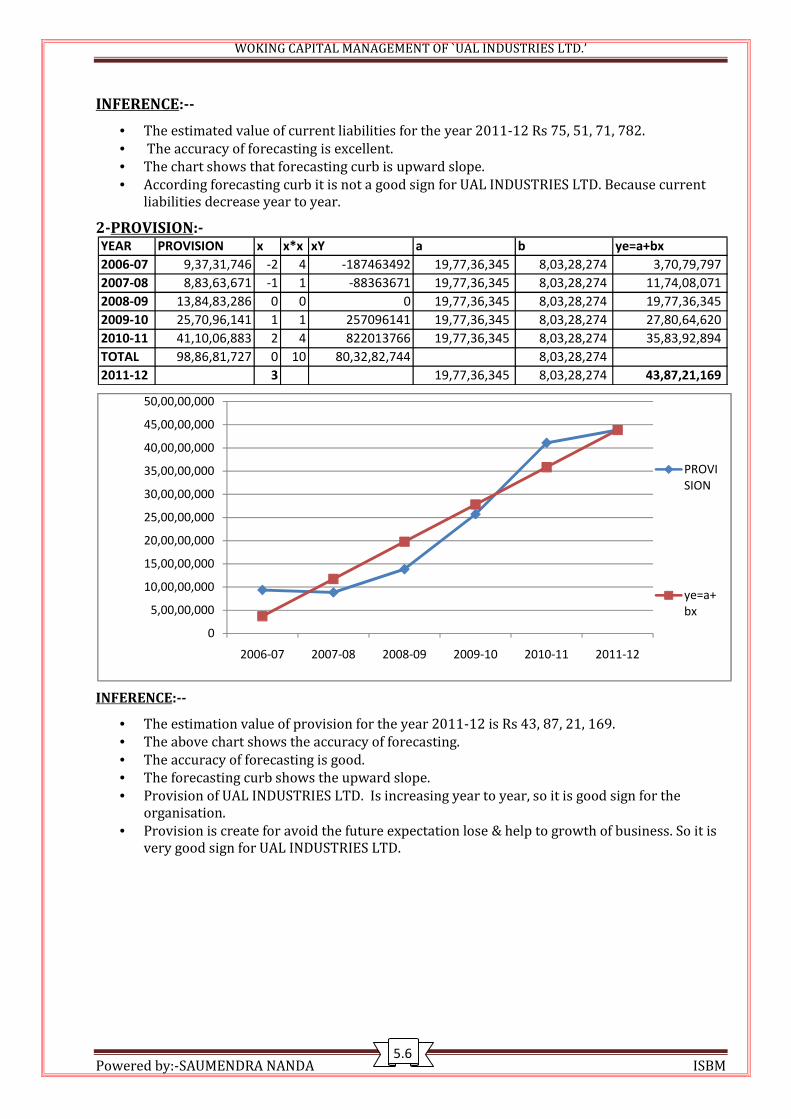
WOKING CAPITAL MANAGEMENT OF `UAL INDUSTRIES LTD.’
Powered by:-SAUMENDRA NANDA ISBM
INFERENCE:-- The estimated value of current liabilities for the year 2011-12 Rs 75, 51, 71, 782. The accuracy of forecasting is excellent. The chart shows that forecasting curb is upward slope. According forecasting curb it is not a good sign for UAL INDUSTRIES LTD. Because currentliabilities decrease year to year.
2-PROVISION:-
INFERENCE:--
The estimation value of provision for the year 2011-12 is Rs 43, 87, 21, 169. The above chart shows the accuracy of forecasting. The accuracy of forecasting is good. The forecasting curb shows the upward slope. Provision of UAL INDUSTRIES LTD. Is increasing year to year, so it is good sign for theorganisation. Provision is create for avoid the future expectation lose & help to growth of business. So it isvery good sign for UAL INDUSTRIES LTD.
YEAR PROVISION x x*x xY a b ye=a+bx2006-07 9,37,31,746 -2 4 -187463492 19,77,36,345 8,03,28,274 3,70,79,7972007-08 8,83,63,671 -1 1 -88363671 19,77,36,345 8,03,28,274 11,74,08,0712008-09 13,84,83,286 0 0 0 19,77,36,345 8,03,28,274 19,77,36,3452009-10 25,70,96,141 1 1 257096141 19,77,36,345 8,03,28,274 27,80,64,6202010-11 41,10,06,883 2 4 822013766 19,77,36,345 8,03,28,274 35,83,92,894TOTAL 98,86,81,727 0 10 80,32,82,744 8,03,28,2742011-12 3 19,77,36,345 8,03,28,274 43,87,21,169
0
5,00,00,000
10,00,00,000
15,00,00,000
20,00,00,000
25,00,00,000
30,00,00,000
35,00,00,000
40,00,00,000
45,00,00,000
50,00,00,000
2006-07 2007-08 2008-09 2009-10 2010-11 2011-12
PROVISION
ye=a+bx
5.6
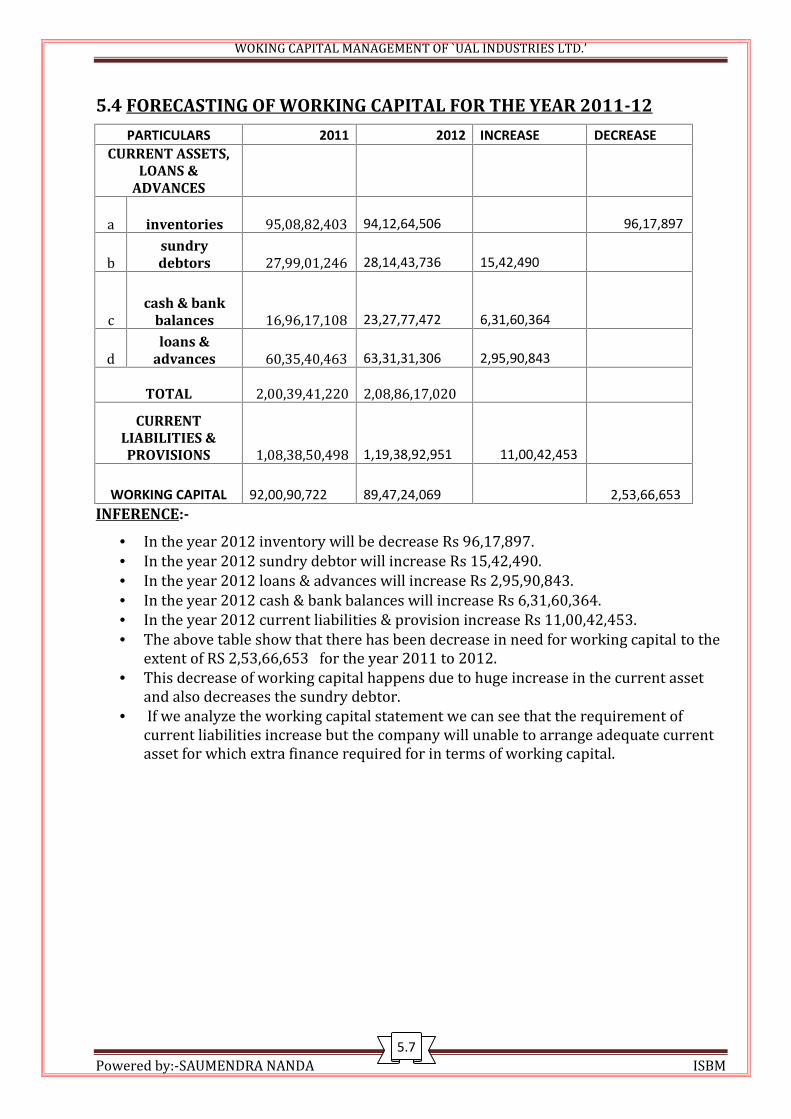
WOKING CAPITAL MANAGEMENT OF `UAL INDUSTRIES LTD.’
Powered by:-SAUMENDRA NANDA ISBM
5.4 FORECASTING OF WORKING CAPITAL FOR THE YEAR 2011-12PARTICULARS 2011 2012 INCREASE DECREASE
CURRENT ASSETS,LOANS &
ADVANCESa inventories 95,08,82,403 94,12,64,506 96,17,897b sundrydebtors 27,99,01,246 28,14,43,736 15,42,490
c cash & bankbalances 16,96,17,108 23,27,77,472 6,31,60,364d loans &advances 60,35,40,463 63,31,31,306 2,95,90,843
TOTAL 2,00,39,41,220 2,08,86,17,020CURRENT
LIABILITIES &PROVISIONS 1,08,38,50,498 1,19,38,92,951 11,00,42,453
WORKING CAPITAL 92,00,90,722 89,47,24,069 2,53,66,653INFERENCE:-
In the year 2012 inventory will be decrease Rs 96,17,897. In the year 2012 sundry debtor will increase Rs 15,42,490. In the year 2012 loans & advances will increase Rs 2,95,90,843. In the year 2012 cash & bank balances will increase Rs 6,31,60,364. In the year 2012 current liabilities & provision increase Rs 11,00,42,453. The above table show that there has been decrease in need for working capital to theextent of RS 2,53,66,653 for the year 2011 to 2012. This decrease of working capital happens due to huge increase in the current assetand also decreases the sundry debtor. If we analyze the working capital statement we can see that the requirement ofcurrent liabilities increase but the company will unable to arrange adequate currentasset for which extra finance required for in terms of working capital.
5.7

WORKING CAPITAL MANAGEMENT OF UAL INDUSTRIES LTD.
Powered by:-SAUMENDRA NANDA ISBM
6.1-FINDING
The profitability of any organisation depends upon the efficient utilization of resources. From thepresent study various aspect of the utilisation of fund in particular working capital management hasrevel.
The regular increases in the working capital indicate a healthy growth of business. Current ratio of UAL INDUSTRIES LTD. We can see that the year 2005-06 & 2009-10is well
below the standard but in other year the current ratio is quite satisfactory. (According to thethumb rule)
The current ratio of the company is very good & quick ratio of the company is also in goodposition. So that company has no liquidity problems.
Gross profit ratio of UAL INDUSTRIES LTD. Shows that a healthy figure which is 30% to 35%. Net profit ratio of UAL INDUSTRIES LTD. Shows very major able figure from 1.638% to
8.078%. The fact & figures of the financial statement of company revels that majority of its resources
(60%) has been utilised in the current asset. In the year 2005-06,2006-07, 2008-09 & 2010-11 raw material is the major part of total
inventory & in the year 2007-08 & 2009-10 finish goods is the major part of total inventory. The inventory holding period of UAL INDUSTRIES LTD. Ranges’ from 70 to 100 days. It
indicates situated of overtrading. From the figures it is observed that the raw material holding period is higher. This results
raw material constitution as a major portion (60%) of current asset. Debtor turnover ratio & debtor collection period is satisfactory. The credit turnover period is low. Receivable forms a small portion of total current asset (14% to 20%). So it shows the
effective management of receivable management. The cash & bank component of current asset is very high.
6.2-RECOMMENDATION
More effort should be made for proper management of the growing workingcapital. As huge gap in gross profit & net profit referee should be made to reduce theoperating expenses. Effort should be made to minimise the holding the period of raw-material & finishedgood. This can be done by give more effort on sales promotional activity, and byfollowing the requisite strategy in terms of operation and production management. Company should follow the strict credit policy so that debtor collection period willdecrease. Company should apply the different credit payment policy. So that company shouldincrease the credit payment period.
6.1

WORKING CAPITAL MANAGEMENT OF UAL INDUSTRIES LTD.
Powered by:-SAUMENDRA NANDA ISBM
Inventory is an important portion of every organisation. So that inventory managementshould be done efficiently. Company should maintain this trend of receivable. High cash balance is not desirable for any organisation. Company should invest itsurplus cash in short term investment. So that company will get more return ratherthan holding of ideal cash.
6.2

WORKING CAPITAL MANAGEMENT OF UAL INDUSTRIES LTD
Powered by:-SAUMENDRA NANDA ISBM
6.3-CONCLUSION
Cash is the life-blood of any business, no matter how large or small. If a businesshas no cash & no way of getting any cash, it will have to close down. Cash flows in a cycle into, around & out of a business. It is the business’s primarytask is to help keep it flowing & to use the cash flow to generate profit. If abusiness is operating profitably, then it should, in theory, generate cashsurpluses. If it doesn’t generate surpluses, the business will eventually run out ofcash & expire. Cash is king, especially at a time when fund raising is harder than even. Letting itslip away is an oversight that investors should not forgive. Analyzing acompany’s working capital can provide excellent insight into how well acompany handles its cash, & whether it is likely to have any on hand to fundgrowth & contribute to shareholder value. Working capital of a business reflects the short-term use of funds these are cashshort-term securities, amount receivable and inventories of raw materials&finished goods. It is also referred as to the funds required for operations of the business. Itfollows a cycle process of conversion of cash into inventory, inventory toreceivable & receivable into cash. The determination of working capital are nature of business manufacturingcycle, credit policies, availability of raw material, availability of credits, growth &expansion activities & other factors. The working in an organisation mainly depends on the analysis of themanagement of receivable, cash & inventories & finally the organisation profit &loss account, balance sheet highlights the working capital status whether it ishealthy or not.
6.3

WORKING CAPITAL MANAGEMENT OF UAL INDUSTRIES LTD.
Powered by:-SAUMENDRA NANDA ISBM
6.4-BIBLIOGRAPHY
REFERENCE BOOKS
Management accounting – S.P.JAIN & K.L.NARANG FINANCIAL MANAGEMENT – R.P.RUSTAGI FINANCIAL MANAGEMENT – DR.S.N.MAHESHWARI FINANCIAL MANAGEMENT – I.M.PANDAY
REPORTS
ANNUAL REPORT OF UAL INDUSTRIES LTD.WEBSITES WWW.google.com www.ual industries.com www.investmentworld.com www.icai.com
6.4

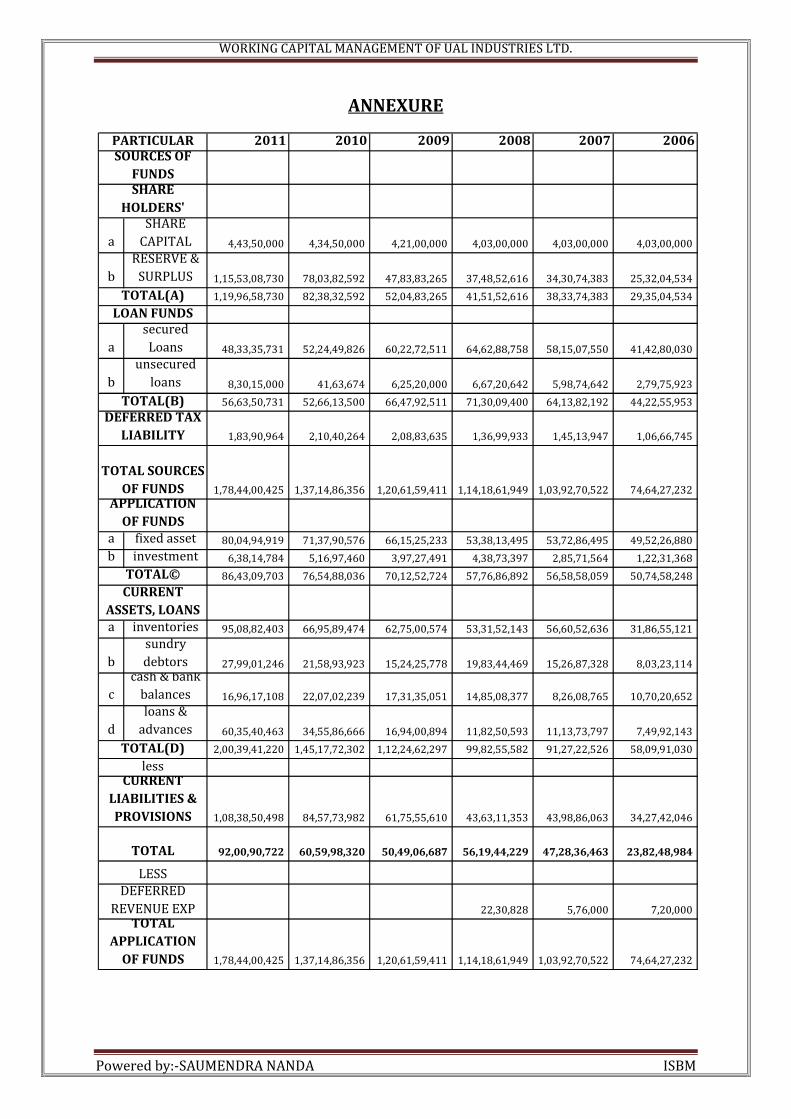
WORKING CAPITAL MANAGEMENT OF UAL INDUSTRIES LTD.
Powered by:-SAUMENDRA NANDA ISBM
ANNEXURE
2011 2010 2009 2008 2007 2006
a SHARECAPITAL 4,43,50,000 4,34,50,000 4,21,00,000 4,03,00,000 4,03,00,000 4,03,00,000b RESERVE &SURPLUS 1,15,53,08,730 78,03,82,592 47,83,83,265 37,48,52,616 34,30,74,383 25,32,04,5341,19,96,58,730 82,38,32,592 52,04,83,265 41,51,52,616 38,33,74,383 29,35,04,534a securedLoans 48,33,35,731 52,24,49,826 60,22,72,511 64,62,88,758 58,15,07,550 41,42,80,030b unsecuredloans 8,30,15,000 41,63,674 6,25,20,000 6,67,20,642 5,98,74,642 2,79,75,92356,63,50,731 52,66,13,500 66,47,92,511 71,30,09,400 64,13,82,192 44,22,55,953
1,83,90,964 2,10,40,264 2,08,83,635 1,36,99,933 1,45,13,947 1,06,66,7451,78,44,00,425 1,37,14,86,356 1,20,61,59,411 1,14,18,61,949 1,03,92,70,522 74,64,27,232
a fixed asset 80,04,94,919 71,37,90,576 66,15,25,233 53,38,13,495 53,72,86,495 49,52,26,880b investment 6,38,14,784 5,16,97,460 3,97,27,491 4,38,73,397 2,85,71,564 1,22,31,36886,43,09,703 76,54,88,036 70,12,52,724 57,76,86,892 56,58,58,059 50,74,58,248a inventories 95,08,82,403 66,95,89,474 62,75,00,574 53,31,52,143 56,60,52,636 31,86,55,121b sundrydebtors 27,99,01,246 21,58,93,923 15,24,25,778 19,83,44,469 15,26,87,328 8,03,23,114c cash & bankbalances 16,96,17,108 22,07,02,239 17,31,35,051 14,85,08,377 8,26,08,765 10,70,20,652d loans &advances 60,35,40,463 34,55,86,666 16,94,00,894 11,82,50,593 11,13,73,797 7,49,92,1432,00,39,41,220 1,45,17,72,302 1,12,24,62,297 99,82,55,582 91,27,22,526 58,09,91,030
1,08,38,50,498 84,57,73,982 61,75,55,610 43,63,11,353 43,98,86,063 34,27,42,04692,00,90,722 60,59,98,320 50,49,06,687 56,19,44,229 47,28,36,463 23,82,48,984
22,30,828 5,76,000 7,20,0001,78,44,00,425 1,37,14,86,356 1,20,61,59,411 1,14,18,61,949 1,03,92,70,522 74,64,27,232
CURRENTASSETS, LOANS
lessCURRENT
LIABILITIES &PROVISIONS
DEFERREDREVENUE EXPTOTAL
TOTAL SOURCESOF FUNDS
TOTAL©
TOTAL(D)
APPLICATIONOF FUNDS
TOTALAPPLICATION
OF FUNDS
LESS
PARTICULARSOURCES OF
FUNDSSHARE
HOLDERS'
LOAN FUNDS
DEFERRED TAXLIABILITY
TOTAL(A)
TOTAL(B)