woody plant encroachment amplifies spatial …...woody plant encroachment amplifies spatial...
TRANSCRIPT

Woody plant encroachment amplifies spatial heterogeneity of soilphosphorus to considerable depth
YONG ZHOU ,1 THOMAS W. BOUTTON , AND X. BEN WU
Department of Ecosystem Science and Management, Texas A&M University, College Station, Texas 77843 USA
Abstract. The geographically extensive phenomenon of woody plant encroachment intograss-dominated ecosystems has strong potential to influence biogeochemical cycles at ecosys-tem to global scales. Previous research has focused almost exclusively on quantifying pool sizesand flux rates of soil carbon and nitrogen (N), while few studies have examined the impact ofwoody encroachment on soil phosphorus (P) cycling. Moreover, little is known regarding theimpact of woody encroachment on the depth distribution of soil total P at the landscape scale.We quantified patterns of spatial heterogeneity in soil total P along a soil profile by taking spa-tially explicit soil cores to a depth of 120 cm across a subtropical savanna landscape that hasundergone encroachment by Prosopis glandulosa (an N2-fixer) and other tree/shrub speciesduring the past century. Soil total P increased significantly following woody encroachmentthroughout the entire 120-cm soil profile. Large groves (>100 m2) and small discrete clusters(<100 m2) accumulated 53 and 10 g P/m2 more soil P, respectively, compared to grasslands.This P accumulation in soils beneath woody patches is most likely attributable to P uplift byroots located deep in the soil profile (>120 cm) and transfer to upper portions of the profile vialitterfall and root turnover. Woody encroachment also altered patterns of spatial heterogeneityin soil total P in the horizontal plane, with highest values at the centers of woody patches,decreasing toward the edges, and reaching lowest values in the surrounding grassland matrix.These spatial patterns were evident throughout the upper 1.2 m of the soil profile, albeit atreduced magnitude deeper in the soil profile. Spatial generalized least squares models indicatedthat fine root biomass explained a significant proportion of the variation in soil total P bothacross the landscape and throughout the profile. Our findings suggest that transfer of P fromdeeper soil layers enlarges the P pool in upper soil layers where it is more actively cycled maybe a potential strategy for encroaching woody species to satisfy their P demands.
Key words: landscape scale; P uplift; soil profile; soil total P; spatial heterogeneity; subtropical savanna;woody encroachment.
INTRODUCTION
In terrestrial ecosystems, nitrogen (N) and phosphorus(P) are generally the most limiting nutrients for primaryproduction and other major biological processes (Vitou-sek et al. 2010). Although P stocks and dynamics are rel-atively well studied in humid ecosystems (i.e., Walker andSyers 1976, Hobbie and Vitousek 2000, Cleveland et al.2002, Vitousek 2004), the P cycle in more water-limitedarid and semiarid ecosystems remains poorly understood(Selmants and Hart 2010), particularly with respect toresponses to anthropogenic disturbances such as woodyencroachment and climate change. Given that drylandscover about 41% of Earth’s land surface (Reynolds et al.2007) and play a major role in global biogeochemicalcycles (Poulter et al. 2014), a more thorough understand-ing of P distribution patterns and dynamics in theseecosystems is essential for the development of integrated
climate-biogeochemical models that incorporate P cycleproperties and processes (Yang et al. 2013, Reed et al.2015, Achat et al. 2016, Sun et al. 2017).Arid and semiarid ecosystems around the world have
experienced woody plant proliferation during the past100 years due to overgrazing, fire suppression, risingatmospheric CO2 concentrations, and/or long-term climatechange (Van Auken 2009, Eldridge et al. 2011, Stevenset al. 2017). In these ecosystems, vegetation patchinessserves as a key regulator of P redistribution during soiland ecosystem development, often resulting in islands offertility beneath tree/shrub canopies (Schlesinger et al.1996). This is especially true for ecosystems dominated orencroached by symbiotic N2-fixing trees or shrubs withhigh canopy area (e.g., Prosopis in North America andAcacia in Africa), which generally have a high P require-ment and accumulate significant amounts of P in their bio-mass (Vitousek et al. 2002, Houlton et al. 2008). UnlikeN, which accumulates rapidly from the atmosphere viabiological N2-fixation, P in terrestrial ecosystems is derivedultimately from weathering of parent material (Walker andSyers 1976, Vitousek 2004, Schlesinger and Bernhardt2013). Since ecosystems begin their existence with a fixed
Manuscript received 11 March 2017; revised 9 September2017; accepted 5 October 2017. Corresponding Editor: SashaC. Reed.
1 E-mail: [email protected]
136
Ecology, 99(1), 2018, pp. 136–147© 2017 by the Ecological Society of America
amount of P from soil parent materials (Walker and Syers1976) and new atmospheric inputs are relatively low(Mahowald et al. 2008), significant accumulation of P inplant biomass could lead to depletion of P within the soil.More recently, some field studies have shown that N2-
fixing woody plants encroaching into grasslands actuallyincrease P storage in topsoil beneath their canopies (e.g.,Kantola 2012, Sitters et al. 2013, Blaser et al. 2014). Thisincrease in surface soil is likely a consequence of P acqui-sition from root activity in deeper portions of the soil pro-file (Kantola 2012, Sitters et al. 2013, Blaser et al. 2014),or from lateral roots in the surface soil that spreadbeyond the woody canopy (Scholes and Archer 1997). Sit-ters et al. (2013) and Blaser et al. (2014) found no evi-dence of depletion of either total or extractable P intopsoil beyond the boundaries of woody patches in grass-lands, suggesting P accrual in the topsoil underneathwoody patches is almost certainly derived from P acquisi-tion by roots located deep in the soil profile. Since trees/shrubs typically have much deeper rooting systems thanherbaceous species (Jackson et al. 1996, Schenk andJackson 2002), it is reasonable to presume that amplifiedP dynamics are occurring not only in topsoil, but alsodeeper in the soil profile following shifts in plant func-tional composition. However, with most studies focusedsolely in surface soils (≤15 cm), there is a knowledge gapregarding the potential for changes in soil P stocks in dee-per portions of the soil profile following grassland towoodland transitions in drylands around the world.Woody encroachment into grass-dominated ecosystems
has been shown to alter patterns of spatial heterogeneityin surface soil C and N storage at scales ranging from thepatch to the landscape (Jackson and Caldwell 1993, Sch-lesinger et al. 1996, Throop and Archer 2008, Liu et al.2011, Zhou et al. 2017a). The fact that the biogeochemi-cal cycles of C, N, and P are interlinked by their strongstoichiometric relationships (Finzi et al. 2011, Reed et al.2015), together with observed accrual of topsoil total Punderneath woody patches (e.g., Kantola 2012, Sitterset al. 2013, Blaser et al. 2014), suggests that spatial pat-terns of total P in surface soil are likely altered by woodyplant encroachment into grasslands, though this has notbeen explicitly investigated. Deep soil cores at the ecosys-tem level (e.g., forestland, grassland, and cropland) haveshown that soil total P decreases gradually with soil depth(McCulley et al. 2004, Yang et al. 2012, Li et al. 2016),implying that potentially strong spatial gradients of soiltotal P may exist throughout the soil profile at the land-scape scale in complex ecosystems with different plant lifeforms. However, no study has assessed the extent to whichwoody encroachment into grasslands alters the spatialpattern of soil total P in deeper portions of the profile atthe landscape scale.The primary purpose of this study was to assess how
woody encroachment into grasslands alters the direc-tion, magnitude, and patterns of spatial heterogeneity insoil total P across the landscape and throughout the soilprofile. To this end, we collected spatially explicit soil
cores to a depth on of 120 cm and analyzed them fortotal P across a 100 9 160 m subtropical savanna land-scape, which has undergone encroachment by Prosopisglandulosa (an N2 fixer) and other trees/shrubs duringthe past century. Our specific objectives were to (1) esti-mate changes in direction and magnitude of soil total Pthroughout the soil profile after woody encroachment,(2) quantify patterns of spatial heterogeneity in soil totalP across this landscape and throughout the soil profile,and (3) elucidate factors responsible for the variance insoil total P across this landscape and throughout the soilprofile. We hypothesized that woody plant encroachmentwould (1) increase soil total P only in surface soils, withno changes or even a decrease in deeper portions of thesoil profile, and correspondingly (2) alter spatial patternsof soil total P only in surface soils, with marginal to noeffects in subsurface soils.
METHODS AND MATERIALS
Study site
This study was conducted at the Texas A&M AgriLifeLa Copita Research Area (27°400 N, 98°120 W), 65 kmwest of Corpus Christi, Texas, USA. The climate is sub-tropical (mean annual temperature is 22.4°C; meanannual precipitation is 680 mm), and rainfall peaksoccur in May and September. Topography is relativelyflat, with gentle slopes (<3%) where well-draineduplands transition to lower-lying drainage woodlands.Elevation ranges from 75 to 90 m above sea level.Upland soils are sandy loams with non-argillic inclu-
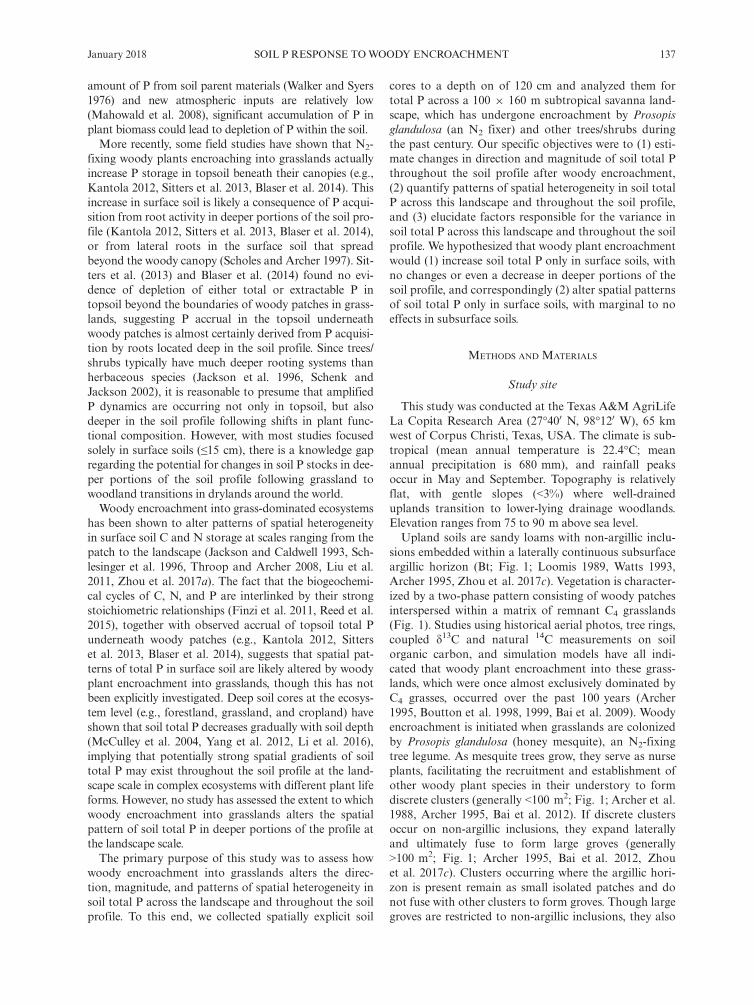
sions embedded within a laterally continuous subsurfaceargillic horizon (Bt; Fig. 1; Loomis 1989, Watts 1993,Archer 1995, Zhou et al. 2017c). Vegetation is character-ized by a two-phase pattern consisting of woody patchesinterspersed within a matrix of remnant C4 grasslands(Fig. 1). Studies using historical aerial photos, tree rings,coupled d13C and natural 14C measurements on soilorganic carbon, and simulation models have all indi-cated that woody plant encroachment into these grass-lands, which were once almost exclusively dominated byC4 grasses, occurred over the past 100 years (Archer1995, Boutton et al. 1998, 1999, Bai et al. 2009). Woodyencroachment is initiated when grasslands are colonizedby Prosopis glandulosa (honey mesquite), an N2-fixingtree legume. As mesquite trees grow, they serve as nurseplants, facilitating the recruitment and establishment ofother woody plant species in their understory to formdiscrete clusters (generally <100 m2; Fig. 1; Archer et al.1988, Archer 1995, Bai et al. 2012). If discrete clustersoccur on non-argillic inclusions, they expand laterallyand ultimately fuse to form large groves (generally>100 m2; Fig. 1; Archer 1995, Bai et al. 2012, Zhouet al. 2017c). Clusters occurring where the argillic hori-zon is present remain as small isolated patches and donot fuse with other clusters to form groves. Though largegroves are restricted to non-argillic inclusions, they also
January 2018 SOIL P RESPONSE TOWOODY ENCROACHMENT 137
expand their canopies laterally beyond these inclusionsto soils with subsurface argillic horizon (Fig. 1) (Archer1995, Zhou et al. 2017c). Species composition can befound in Appendix S1: Table S1.
Field sampling
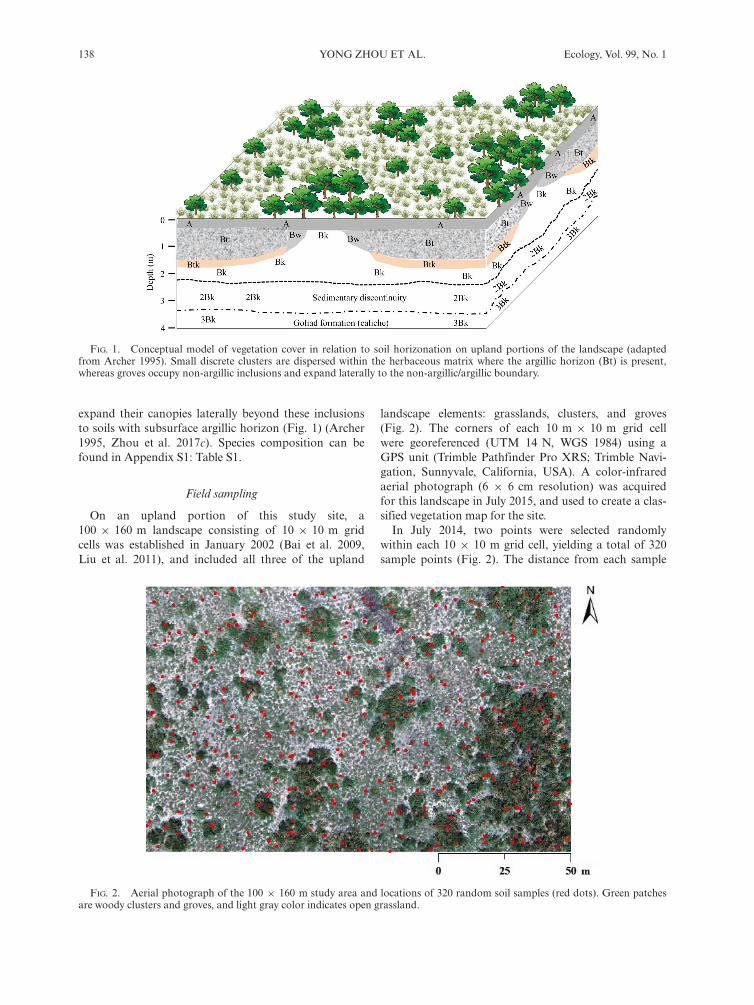
On an upland portion of this study site, a100 9 160 m landscape consisting of 10 9 10 m gridcells was established in January 2002 (Bai et al. 2009,Liu et al. 2011), and included all three of the upland
landscape elements: grasslands, clusters, and groves(Fig. 2). The corners of each 10 m 9 10 m grid cellwere georeferenced (UTM 14 N, WGS 1984) using aGPS unit (Trimble Pathfinder Pro XRS; Trimble Navi-gation, Sunnyvale, California, USA). A color-infraredaerial photograph (6 9 6 cm resolution) was acquiredfor this landscape in July 2015, and used to create a clas-sified vegetation map for the site.In July 2014, two points were selected randomly
within each 10 9 10 m grid cell, yielding a total of 320sample points (Fig. 2). The distance from each sample
FIG. 1. Conceptual model of vegetation cover in relation to soil horizonation on upland portions of the landscape (adaptedfrom Archer 1995). Small discrete clusters are dispersed within the herbaceous matrix where the argillic horizon (Bt) is present,whereas groves occupy non-argillic inclusions and expand laterally to the non-argillic/argillic boundary.
FIG. 2. Aerial photograph of the 100 9 160 m study area and locations of 320 random soil samples (red dots). Green patchesare woody clusters and groves, and light gray color indicates open grassland.
138 YONG ZHOU ET AL. Ecology, Vol. 99, No. 1

point to two georeferenced cell corners were recorded.At each sample point, the landscape element was classi-fied as grassland, cluster, or grove based on the vegeta-tion type and size of woody canopy area, and twoadjacent soil cores (2.8 cm in diameter 9 120 cm inlength) were collected using the PN150 JMC Environ-mentalist’s Subsoil Probe (Clements Associates, New-ton, Iowa, USA). Each soil core was subdivided into sixdepth increments (0–5, 5–15, 15–30, 30–50, 50–80, and80–120 cm). One soil core was oven dried (105°C for48 h) to determine soil bulk density. The other core wasair-dried prior to subsequent analyses. In September2015, fine roots from each plant species occurring onthis landscape were collected by careful soil excavationsthat confirmed linkages to identified plant species.
Lab analyses
Soils used to determine bulk density were subsequentlyused to estimate fine (<2 mm) and coarse (>2 mm) rootbiomass by washing through sieves. Soils from the air-driedcores were passed through a 2 mm sieve; roots and othercoarse organic fragments not passing through the sievewere discarded (Boone et al. 1999, Pierzynski 2000). Nosoils contained rock or gravel-sized particles. Soil pH wasdetermined on a 1:2 (10 g soil: 20 mL 0.01 mol/L CaCl2)mixture using a glass electrode. Soil texture was determinedby the hydrometer method (Sheldrick and Wang 1993). Analiquot of air-dried, sieved soil was dried at 60°C for 48 hand pulverized in a centrifugal mill (Angstrom, Belleville,Michigan, USA) in preparation for subsequent chemicalanalyses. Fine roots from each species were washed care-fully to remove soil particles, dried, and pulverized.Total P concentrations in pulverized soils and fine roots
were determined using the lithium fusion method (Lajthaet al. 1999). Briefly, 0.25 g of pulverized soil or root tis-sue was mixed with 0.75 g of pure lithium metaborate(LiBO2; Spex Sample Prep, Metuchen, New Jersey, USA)in precombusted graphite crucibles, and heated to 1050°Cin a muffle furnace. The molten flux was poured into a150-mL beaker containing a magnetic spin bar and50 mL of 10% HNO3, placed on a stir plate, and a watchglass was placed over the beaker while the flux was stirredand completely dissolved. The dissolved solution was fil-tered (Whatman 42 ashless filters), transferred to a volu-metric flask, and made up to 100 mL with Type 1 water.Then, 30 mL of the solution was pipetted into a 50-mLvolumetric flask and its pH was adjusted by adding4 mol/L NaOH. The P concentration of the solution wasdetermined by the molybdenum blue colorimetry method(Murphy and Riley 1962). The concentration of P wasmeasured on a Spectronic 20D+ spectrophotometer(Thermo Fisher Scientific, Waltham, Massachusetts,USA) and referenced with a standard curve of potassiumphosphate solution (KH2PO4 at 0, 0.125, 0.25, 0.375, 0.5,and 0.625 lg P/mL). To control the quality of soil total Pconcentration analysis, one method blank was includedwithin each batch of samples (1 blank + 11 samples). A
NIST-certified standard reference material (San Joaquinsoil, NIST SRM 2709a with certified total P concentra-tion 688 mg P/kg) was analyzed periodically to check theaccuracy of this method (678.71 � 1.57 mg P/kg [mean� SE], n = 25). In addition, we developed an internal labsoil standard that was analyzed with each batch of 11samples to verify the repeatability of this method(103.10 � 0.14 mg P/kg, maximum = 108.39 mg P/kg,minimum = 98.20 mg P/kg, n = 151).
Data analyses
Since soil P is derived primarily from weathering ofparent material, soil development exerts strong controlover the status of P in an ecosystem. Pedogenic formationof non-argillic inclusions embedded into the laterally con-tinuous subsurface argillic horizon across this landscapemay leave a legacy effect on the distribution pattern oftotal P in soil prior to the encroachment of woody plants.At this site, groves occur exclusively on non-argillic inclu-sions and expand laterally to soils with a subsurface argil-lic horizon (Fig. 1); however, some non-argillic inclusionsin the remnant grassland matrix are still not occupied bygroves across this landscape (Zhou et al. 2017c). Thus, wesubdivided soil cores from grasslands into those on non-argillic inclusions and those on argillic horizons toaddress potential differences in soil total P that might beinherited from soil development. Across this study site,clay illuviation generally starts at approximately 30 cmbelow the surface soil (Archer 1995). According to hori-zons and characteristics diagnostic for the higher cate-gories in USDA Soil Taxonomy (Soil Survey Staff, 1999),we used the following modified criteria to test whetherthere is clay illuviation (or argillic horizon) in the 30–50 cm depth increment: (1) if the clay content in the priordepth increment (i.e., 15–30 cm) is <15%, the 30–50 cmdepth increment must contain at least 3% (absolute) moreclay, or (2) if the clay content in the prior depth increment(i.e., 15–30 cm) is between 15–40%, the 30–50 cm depthincrement must have at least 1.2 times more clay. Thesecriteria were also used to test the 50–80 and 80–120 cmdepth increments. If one or more of these three depthincrements from a soil core have clay illuviation, then weconsidered the argillic horizon to be present at that point.Where the argillic horizon was present, it generally beganwithin the 30–50 cm depth increment; in a few cases, itdid not begin until the 50–80 cm increment.Mixed models were used to compare total P concen-
trations (g P/kg soil), stocks (g P/m2), cumulative stocks,and fine root biomass (g/m2) in different landscape ele-ments within each depth increment. In mixed models,spatial autocorrelation of a variable was considered as aspatial covariance component for adjustment. Post hoccomparisons of these variables in different landscape ele-ments were conducted with Tukey’s test. An unpaired ttest was performed to compare total P concentration ingrasslands occurring on argillic vs. non-argillic soilswithin each depth increment. A cut-off value of P < 0.05
January 2018 SOIL P RESPONSE TOWOODY ENCROACHMENT 139
was used to indicate significant differences. All thesestatistics were performed using JMP pro 12.0 (SAS Insti-tute, Cary, North Carolina, USA).A sample variogram fitted with a variogram model was
constructed to quantify the spatial structure of soil total Pstocks based on 320 random samples for each soil depthincrement using R statistical software (R DevelopmentCore Team 2014; Appendix S1: Table S2 and Fig. S1).Ordinary kriging was used to predict soil total P stocks atunsampled locations based on the best fitting variogrammodel using ArcMap 10.1 (ESRI, Redlands, California,USA), and kriged maps of soil total P stocks with a0.5 9 0.5 m resolution were generated for each soil depthincrement. Lacunarity was used to assess the spatialheterogeneity of soil total P concentration across this land-scape and throughout the soil profile. Lacunarity is ascale-dependent measurement of spatial heterogeneity orthe “gappiness” of a landscape structure (Plotnick et al.1996), with a higher value indicating a more heteroge-neous distribution pattern across the landscape. Briefly,lacunarity was determined using a gliding box algorithmbased on kriged maps of soil total P concentration. Thegliding box of a given size (side length of the gliding box,r) was first placed at one corner of the kriged map and thebox mass S(r) (the sum of total P concentration of eachpixel within the box) was determined. The box was thenmoved through the kriged map one pixel at a time and thebox mass was determined at each location. The lacunarityvalue K(r) for box size r is calculated by adding one to theratio of variance and the mean square of the box mass:K(r) = var[S(r)]/E[S(r)]2 + 1. A log-log plot of lacunarityagainst box size was used to quantify spatial heterogeneityof soil total P at different scales. Lacunarity was calculatedusing R statistical software (R Development Core Team2014). More details can be found in Zhou et al. (2017a).Within each soil depth increment, a spatial generalized
least squares (GLS) model that incorporated spatial struc-ture in the error term of the regression model (Beale et al.2010) was used to analyze the relationships between soiltotal P concentration and explanatory variables, includingfine root biomass, soil bulk density, soil clay and silt con-tents, and soil pH. Values for these explanatory variableshave been presented elsewhere (Zhou et al. 2017a,c). Differ-ent models of spatial structure (i.e., linear, spherical, expo-nential, Gaussian structure) and non-spatial structure weretested, and the best fitting model was selected using theAkaike information criterion (AIC). Parameters were esti-mated based on restricted maximum likelihood (REML).In each full regression model for each soil depth increment,t values for explanatory variables were used to indicate theirrelative importance in explaining the response variable(Diniz-Filho et al. 2003). Analyses were performed using Rstatistical software (R Development Core Team 2014).
RESULTS
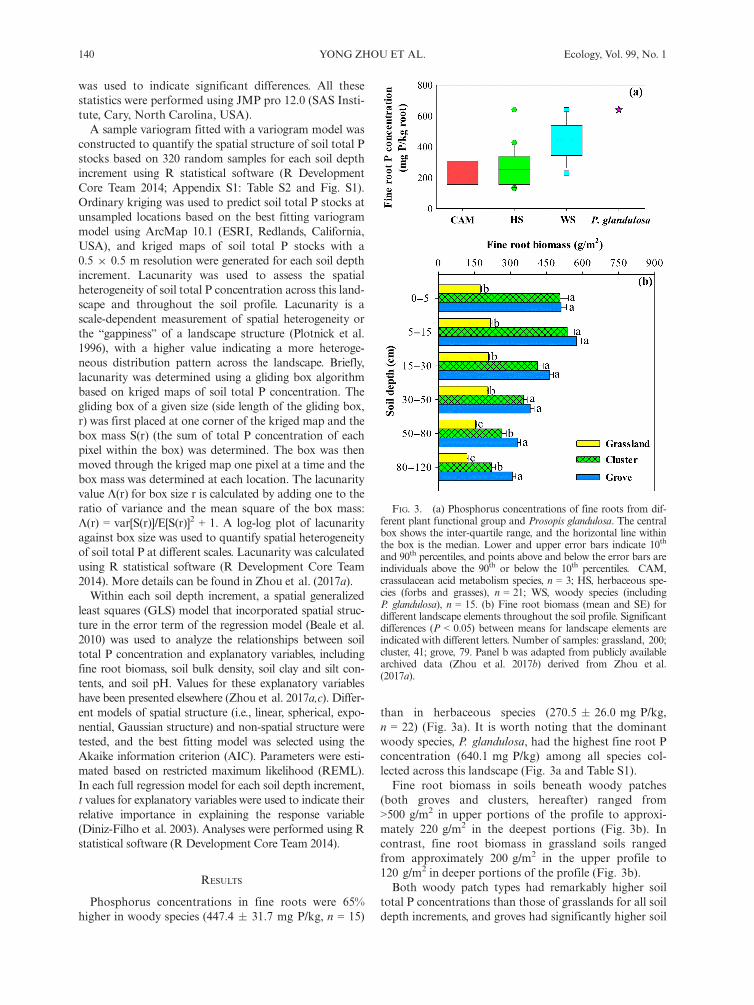
Phosphorus concentrations in fine roots were 65%higher in woody species (447.4 � 31.7 mg P/kg, n = 15)
than in herbaceous species (270.5 � 26.0 mg P/kg,n = 22) (Fig. 3a). It is worth noting that the dominantwoody species, P. glandulosa, had the highest fine root Pconcentration (640.1 mg P/kg) among all species col-lected across this landscape (Fig. 3a and Table S1).Fine root biomass in soils beneath woody patches
(both groves and clusters, hereafter) ranged from>500 g/m2 in upper portions of the profile to approxi-mately 220 g/m2 in the deepest portions (Fig. 3b). Incontrast, fine root biomass in grassland soils rangedfrom approximately 200 g/m2 in the upper profile to120 g/m2 in deeper portions of the profile (Fig. 3b).Both woody patch types had remarkably higher soil
total P concentrations than those of grasslands for all soildepth increments, and groves had significantly higher soil
FIG. 3. (a) Phosphorus concentrations of fine roots from dif-ferent plant functional group and Prosopis glandulosa. The centralbox shows the inter-quartile range, and the horizontal line withinthe box is the median. Lower and upper error bars indicate 10th
and 90th percentiles, and points above and below the error bars areindividuals above the 90th or below the 10th percentiles. CAM,crassulacean acid metabolism species, n = 3; HS, herbaceous spe-cies (forbs and grasses), n = 21; WS, woody species (includingP. glandulosa), n = 15. (b) Fine root biomass (mean and SE) fordifferent landscape elements throughout the soil profile. Significantdifferences (P < 0.05) between means for landscape elements areindicated with different letters. Number of samples: grassland, 200;cluster, 41; grove, 79. Panel b was adapted from publicly availablearchived data (Zhou et al. 2017b) derived from Zhou et al.(2017a).
140 YONG ZHOU ET AL. Ecology, Vol. 99, No. 1
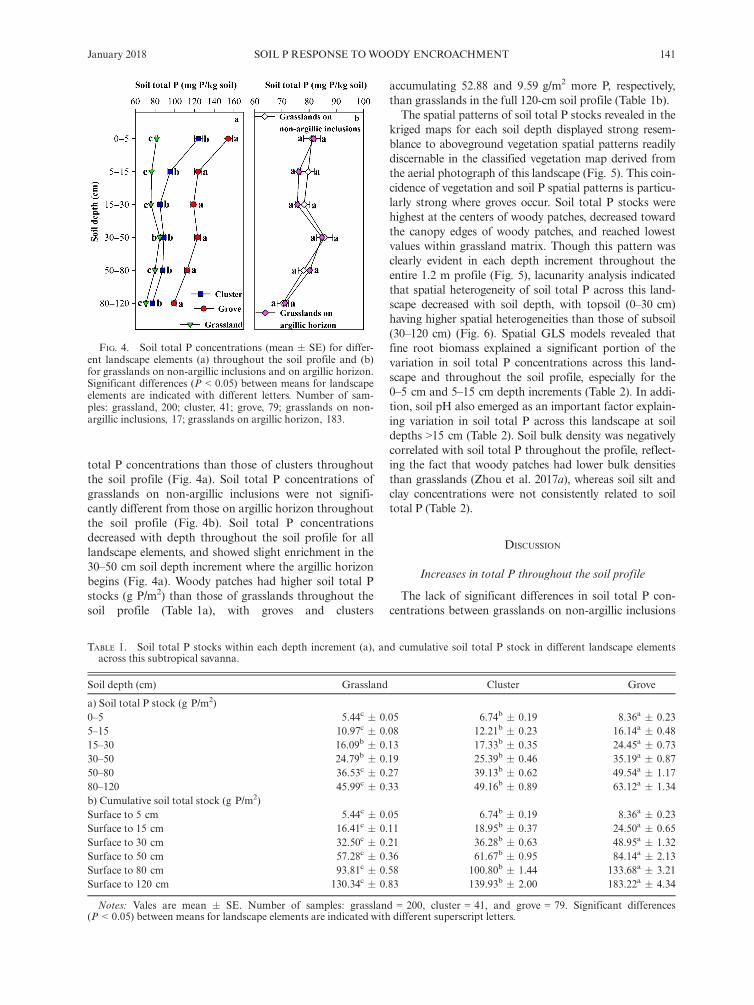
total P concentrations than those of clusters throughoutthe soil profile (Fig. 4a). Soil total P concentrations ofgrasslands on non-argillic inclusions were not signifi-cantly different from those on argillic horizon throughoutthe soil profile (Fig. 4b). Soil total P concentrationsdecreased with depth throughout the soil profile for alllandscape elements, and showed slight enrichment in the30–50 cm soil depth increment where the argillic horizonbegins (Fig. 4a). Woody patches had higher soil total Pstocks (g P/m2) than those of grasslands throughout thesoil profile (Table 1a), with groves and clusters
accumulating 52.88 and 9.59 g/m2 more P, respectively,than grasslands in the full 120-cm soil profile (Table 1b).The spatial patterns of soil total P stocks revealed in the
kriged maps for each soil depth displayed strong resem-blance to aboveground vegetation spatial patterns readilydiscernable in the classified vegetation map derived fromthe aerial photograph of this landscape (Fig. 5). This coin-cidence of vegetation and soil P spatial patterns is particu-larly strong where groves occur. Soil total P stocks werehighest at the centers of woody patches, decreased towardthe canopy edges of woody patches, and reached lowestvalues within grassland matrix. Though this pattern wasclearly evident in each depth increment throughout theentire 1.2 m profile (Fig. 5), lacunarity analysis indicatedthat spatial heterogeneity of soil total P across this land-scape decreased with soil depth, with topsoil (0–30 cm)having higher spatial heterogeneities than those of subsoil(30–120 cm) (Fig. 6). Spatial GLS models revealed thatfine root biomass explained a significant portion of thevariation in soil total P concentrations across this land-scape and throughout the soil profile, especially for the0–5 cm and 5–15 cm depth increments (Table 2). In addi-tion, soil pH also emerged as an important factor explain-ing variation in soil total P across this landscape at soildepths >15 cm (Table 2). Soil bulk density was negativelycorrelated with soil total P throughout the profile, reflect-ing the fact that woody patches had lower bulk densitiesthan grasslands (Zhou et al. 2017a), whereas soil silt andclay concentrations were not consistently related to soiltotal P (Table 2).
DISCUSSION
Increases in total P throughout the soil profile
The lack of significant differences in soil total P con-centrations between grasslands on non-argillic inclusions
TABLE 1. Soil total P stocks within each depth increment (a), and cumulative soil total P stock in different landscape elementsacross this subtropical savanna.
Soil depth (cm) Grassland Cluster Grove
a) Soil total P stock (g P/m2)0–5 5.44c � 0.05 6.74b � 0.19 8.36a � 0.235–15 10.97c � 0.08 12.21b � 0.23 16.14a � 0.4815–30 16.09b � 0.13 17.33b � 0.35 24.45a � 0.7330–50 24.79b � 0.19 25.39b � 0.46 35.19a � 0.8750–80 36.53c � 0.27 39.13b � 0.62 49.54a � 1.1780–120 45.99c � 0.33 49.16b � 0.89 63.12a � 1.34b) Cumulative soil total stock (g P/m2)Surface to 5 cm 5.44c � 0.05 6.74b � 0.19 8.36a � 0.23Surface to 15 cm 16.41c � 0.11 18.95b � 0.37 24.50a � 0.65Surface to 30 cm 32.50c � 0.21 36.28b � 0.63 48.95a � 1.32Surface to 50 cm 57.28c � 0.36 61.67b � 0.95 84.14a � 2.13Surface to 80 cm 93.81c � 0.58 100.80b � 1.44 133.68a � 3.21Surface to 120 cm 130.34c � 0.83 139.93b � 2.00 183.22a � 4.34
Notes: Vales are mean � SE. Number of samples: grassland = 200, cluster = 41, and grove = 79. Significant differences(P < 0.05) between means for landscape elements are indicated with different superscript letters.
FIG. 4. Soil total P concentrations (mean � SE) for differ-ent landscape elements (a) throughout the soil profile and (b)for grasslands on non-argillic inclusions and on argillic horizon.Significant differences (P < 0.05) between means for landscapeelements are indicated with different letters. Number of sam-ples: grassland, 200; cluster, 41; grove, 79; grasslands on non-argillic inclusions, 17; grasslands on argillic horizon, 183.
January 2018 SOIL P RESPONSE TOWOODY ENCROACHMENT 141

and those on argillic horizons (Fig. 4b) excludes thepossibility of spatially non-homogeneous distribution ofsoil P due to pedogenic processes, suggesting thatobserved accumulation of P in soils beneath woodypatches (both clusters and groves) results from woodyplant encroachment into areas that were once grassland.More importantly, this accumulation of soil P under-neath woody patches is occurring throughout the upper1.2 m of the soil profile (Figs. 4a and 5, Table 1). Thus,our first hypothesis that increases in soil total P wouldoccur only in surface soils was rejected.Since there is no gaseous component of the P cycle
(Walker and Syers 1976, Schlesinger and Bernhardt2013), the accumulation of P in soils beneath woodypatches must be derived from the addition or redistribu-tion of P from other potential sources including (1)atmospheric deposition, (2) faunal activities (e.g., large
animals, termites, ants), (3) horizontal transfer fromadjacent soils beyond the woody canopy, and/or (4)uplift by roots located deeper than 1.2 m. AtmosphericP deposition rates in this study area located in south-central USA range from 0.5 to 1.0 mg P�m�2�yr�1
(Mahowald et al. 2008), which is a small fraction of thesoil P accumulation rate (~100 mg P�m�2�yr�1 in the 0–10 cm soil depth increment) under woody patches esti-mated for this ecosystem using a chronosequenceapproach (Kantola 2012). Livestock grazing has beenexcluded from this study area for at least the past30 years (Liu et al. 2011) and is probably not responsi-ble for the soil P patterns described here. Althoughdesert termites (Gnathamitermes perplexus) are presentacross this landscape, their activities are confined tograssland areas, they feed only on grasses and forbs, andthey are absent from wooded portions of the landscape.
FIG. 5. Classified vegetation map derived from aerial photo and kriged maps of soil total P stock (g P/m2) throughout the soilprofile for this 100 9 160 m landscape in a subtropical savanna based on 320 randomly located sampling points.
142 YONG ZHOU ET AL. Ecology, Vol. 99, No. 1

Thus, faunal activity is an unlikely determinant of P spa-tial patterns. Soil total P concentrations in grasslandsare similar regardless of their proximity to woodypatches, suggesting that the woody plants are not usinglateral roots to mine P from the surrounding grasslands.
These results are consistent with other studies reportingno depletion of either total or extractable P in grasslandsoils adjacent to woody patches (Kantola 2012, Sitterset al. 2013, Blaser et al. 2014).Given that atmospheric deposition, faunal activity,
and lateral mining of P from surrounding grasslands bywoody plant roots are unlikely scenarios, we proposethat P increases in the upper 1.2 m of the soil profilebeneath woody patches are due to translocation of deepsoil P via root uptake, and, to a lesser extent, fromhydraulic redistribution of dissolved P. Considerablepotential for nutrient acquisition from deeper soil layersby deep-rooting plants has been reported in a variety ofecosystems (Scholes and Archer 1997, Jobb�agy andJackson 2001, McCulley et al. 2004, Kautz et al. 2013,Sardans and Pe~nuelas 2014). For example, McCulleyet al. (2004) used 87Sr/86Sr isotope ratios of soils andplant tissues to show that roots were able to acquire andtranslocate Sr from deep in the profile to abovegroundplant parts in five semiarid and arid sites across thesouthwestern USA, demonstrating strong potential forthe acquisition of nutrients by deep roots. Similarly, atour study site, d2H values of plant and soil water haveshown that woody species are able to acquire waterlocated 2–4 m below the soil surface, whereas herba-ceous species utilize water exclusively from the upper soillayers (<1.2 m) (Midwood et al. 1998, Boutton et al.1999). Thus, woody plant roots at this site have demon-strated potential to access and acquire P located in dee-per portions of the soil profile that are inaccessible to
FIG. 6. Lacunarity curves throughout the soil profilederived from spatial patterns of soil total P concentrations(mg P/kg). Significant differences (P < 0.05) between differentsoil depth increments were detected based on one-way ANOVA(Student’s t test) and indicated with different letters.
TABLE 2. Best fit regression models for prediction of soil total P concentration (mg P/kg, log10-transformed) by vegetation andsoil variables using spatial generalized least squares (GLS) models with Akaike information criterion (AIC) as model selectionfor each depth increment.
Parameters Fine root biomass
Soil physical variables
SBD Clay Silt pH
0–5 cm depthCoefficient 0.20 �0.23 0.003 0.017 0.005t 10.98*** �6.70*** 0.089 4.04*** 0.35
5–15 cm depthCoefficient 0.09 �0.17 0.002 0.0059 0.003t 5.77*** �5.17*** 0.64 1.54 3.41***
15–30 cm depthCoefficient 0.045 �0.081 0.002 0.005 0.051t 3.15** �2.18* 1.23 1.21 6.17***
30–50 cm depthCoefficient 0.04 �0.10 0.005 0.009 0.11t 2.63** �2.54* 4.11*** 2.58* 11.95***
50–80 cm depthCoefficient 0.28 �0.10 �0.005 0.001 0.099t 2.49* �2.68** �4.29*** 0.19 9.17***
80–120 cm depthCoefficient 0.04 �0.17 �0.0019 0.007 0.13t 3.79*** �2.72** �2.07* 2.11* 4.79***
Note: Explanatory variables are fine root biomass (g/m2) and soil physical variables, including soil bulk density (g/cm3) (SBD),soil clay (%) and silt (%) content, and soil pH.*P < 0.05; **P < 0.01; ***P < 0.001.
January 2018 SOIL P RESPONSE TOWOODY ENCROACHMENT 143

herbaceous species that dominate the grassland portionsof the landscape. This additional P derived from deepsoils by woody species is initially incorporated in planttissues and ultimately delivered to upper portions of thesoil profile via root turnover and aboveground litterfall.Since fine root biomass is the primary source of soilorganic matter input (Rasse et al. 2005) and is signifi-cantly higher underneath woody patches than grasslandsthroughout the entire 1.2-m soil profile (Fig. 3b), moreP should accumulate underneath woody patches via rootturnover. In addition, P. glandulosa trees at this studysite have been shown to transfer deep soil water upwardinto drier portions of the soil profile by hydraulic redis-tribution (Zou et al. 2005). This could create favorablemoisture conditions in the surface soil for organic matterdecay and subsequent biogeochemical processes thatmineralize plant nutrients (including P) and enable plantuptake (Sardans and Pe~nuelas 2014). Alternatively, whendeeper portions of the soil profile are dry but surfacelayers are relatively moist, downward siphoning (theopposite of hydraulic redistribution) via roots maytranslocate water from surface soils into deep soils, solu-bilizing P in the soil matrix and facilitating its uptake bydeep roots (McCulley et al. 2004, Lambers et al. 2006,Sardans and Pe~nuelas 2014).In addition, groves accumulated significantly more soil
total P than clusters even though they are composed ofthe same woody species (Fig. 4a, Table 1). This is proba-bly due to the fact that clusters in this landscape are con-strained in size (mean canopy area = 13.4 m2, n = 121;Zhou et al. 2017c) and are relatively young compared togroves (cluster mean age = 22 yr, grove mean age =48 yr; Boutton et al. 1998). Since P and other nutrients insoils accumulate linearly with age or size of woodypatches (e.g., Liao et al. 2006, McClaran et al. 2008,Throop and Archer 2008, Kantola 2012, Blaser et al.2014), the generally younger and size-constrained clustershave accrued less soil P than the older and larger groves.Although the formation of discrete clusters is initiated bythe colonization of N2-fixing P. glandulosa trees (Archeret al. 1988, Archer 1995, Bai et al. 2012), many of thesemesquite trees in clusters have died (Archer 1995, Bout-ton et al. 1998). Since the process of N2 fixation requiresa substantial supply of P (Treseder and Vitousek 2001,Vitousek et al. 2002, Houlton et al. 2008), the death ofP. glandulosa in discrete clusters may significantly reduceP demand and its rate of accumulation in cluster soils asother woody species have lower P concentrations in theirtissues (433.6 � 30.7 mg P/kg, n = 14) than P. glandu-losa (640.1 mg P/kg; Fig. 3a).Could the increase in soil P in woody patches be influ-
enced by the fact that P. glandulosa is an N2 fixer? Asmentioned above, fast growing N2 fixers have a high Pdemand (Treseder and Vitousek 2001, Vitousek et al.2002, Houlton et al. 2008), and this demand can be ful-filled via deep acquisition. Alternatively, N2-fixing speciesmaintain higher root phosphatase activity than non-N2
fixers (Houlton et al. 2008, Boutton et al. 2009, Blaser
et al. 2014), which may influence their ability to acquire Pand concentrate it within the rooting zone. At our site,acid phosphatase activity is four to eight times greater insoils beneath woody patches with P. glandulosa than ingrassland soils (Boutton et al. 2009). This difference inenzyme activity results in plant-available P pools (i.e.,resin-extractable P) of 3.4 mg P/kg in grasslands vs. 9.0to 14.6 mg P/kg in clusters and groves (Kantola 2012).This is consistent with the hypothesis of Houlton et al.(2008), that symbiotic N-fixation may be a mechanismfor plants to acquire additional N for investment in theproduction of N-rich root phosphatase enzymes that canincrease the P availability in P-limited environments. Ifcorrect, this may be another important mechanism thatleads to P accumulation where N2-fixing woody plantsare encroaching into grassland. Regardless of the exactmechanism by which P accumulates following woodyencroachment, our findings suggest that transfer of Pfrom deeper soil layers enlarges the P pool in upper soillayers where it is more actively cycled may be a potentialstrategy for encroaching woody species to satisfy their Pdemands and enable their ongoing encroachment intoareas that were once grass dominated.
Patterns of spatial heterogeneity in soil total P
Kriged maps revealed that woody encroachment intograsslands altered patterns of spatial heterogeneity in soiltotal P throughout the upper 1.2 m of the soil, albeit atreduced magnitude in deeper portions of the profile(Figs. 5 and 6). Therefore, we reject our second hypothe-sis that spatial patterns of total P would be altered only insurface soils. Although spatial patterns of soil total P dis-played strong resemblance to the distribution of grovevegetation, the same was not true for the smaller woodyclusters (Fig. 5). One possible reason for this is that clus-ters accumulated less P due to their smaller sizes andyounger ages, as discussed above. However, the morelikely reason is that our sampling intensity may not havebeen sufficient to capture the spatial heterogeneity of soiltotal P beneath clusters (Liu et al. 2011). Approximately80% of clusters are <20 m2 (Zhou et al. 2017c), whileonly two soil samples were collected randomly withineach 100-m2 grid cell. Kriged maps also revealed that soiltotal P decreases gradually from the centers of groves tothe edges (Fig. 5). These strong within-grove spatial gra-dients illustrate that the accumulation of soil P is timedependent. Woody plants near the centers of groves aregenerally older (>100 yr) than those closer to the grove/grassland interface (Bai et al. 2012), and have had moretime to concentrate P in soils beneath their canopies.The influence of woody encroachment on patterns of
spatial heterogeneity in soil total P diminishes graduallywith soil depth across this landscape (Fig. 6). Root distri-bution plays an important role in shaping vertical patternsof soil total P (Jobb�agy and Jackson 2001) since much ofthe P in the soil profile is derived from root turnover,although surface soils also receive additional inputs from
144 YONG ZHOU ET AL. Ecology, Vol. 99, No. 1
litterfall. As shown in this study (Fig. 3b) and manyothers (e.g., Jackson et al. 1996, Arora and Boer 2003,Laio et al. 2006), root distribution generally decreasesexponentially with soil depth. Coupled with the fact thatdeeper roots have greater longevity and slower turnoverthan roots near the surface (e.g., Hendrick and Pregitzer1996, Joslin et al. 2006), this suggests that the rate of Paccrual will be slower and less pronounced in deeper por-tions of the soil profile. In terms of spatial arrangement,reduced discrepancies in soil total P between groves andother landscape elements in lower soil layers results indiminished spatial heterogeneity (Figs. 4a and 6). SpatialGLS models also revealed that fine root biomass exp-lained large proportions of the variation in soil total Pthroughout the soil profile (Table 2); however, the strengthof this relationship decreased with depth. In deeper por-tions of the profile, soil pH was strongly correlated withtotal P (Table 2), suggesting P dynamics in topsoil and insubsoil may be controlled by different regulatory mecha-nisms. In this study site, CaCO3 concentrations in subsur-face soils beneath groves are higher than those beneathgrasslands by up to one order of magnitude (Zhou andBoutton, unpublished data). This, taken together with thefact that subsurface soils of this study site have higher pHvalues (Zhou et al. 2017a), may lead to P accumulation byfavoring its fixation into insoluble calcium phosphates(Schlesinger and Bernhardt 2013). Additional experimentsare needed to explore the mechanisms leading to P accrualand storage in upper vs. lower portions of the soil profile.
CONCLUSIONS AND IMPLICATIONS
In this subtropical savanna ecosystem, soil total P inthe upper 1.2 m of the soil profile increases dramaticallyas N2-fixing P. glandulosa trees and associated woodyspecies encroach into the grassland matrix. The accumu-lation of P underneath woody patches is most likely dri-ven by translocation of deep soil P via root uptake.Substantial accrual of soil total P underneath woodypatches alters patterns of spatial heterogeneity in soil Pto considerable depth, albeit at reduced magnitude dee-per in the profile. We speculate that the transfer of Pfrom deeper to shallower portions of the soil profile mayfoster a positive feedback that enables the persistenceand ongoing encroachment of woody species, which haverelatively high tissue P concentrations compared to thegrasses and forbs that once dominated this region.Since P functions as a limiting nutrient and its avail-
ability can impose strong controls on plant and soil Cand N cycles (Vitousek et al. 2010), it is critical toparameterize and represent the P cycle and its interac-tions with C and N cycles in earth system models (Reedet al. 2015, Yang et al. 2016, Sun et al. 2017). Consider-ing the vast geographical extent of woody encroachmentin arid and semiarid regions throughout the world(Eldridge et al. 2011, Stevens et al. 2017), our resultssuggest that further efforts to characterize spatial vari-ability in P storage and dynamics in horizontal and
vertical soil space in response to this vegetation changewould lead to improved efforts to model the interactionsbetween vegetation change, biogeochemistry, and theclimate system.
ACKNOWLEDGMENTS
This research was supported by a Doctoral DissertationImprovement Grant from the U.S. National Science Founda-tion (DEB/DDIG1600790), by USDA/NIFA Hatch Project(1003961), an Exploration Fund Grant from the ExplorersClub, and a Howard McCarley Student Research Award fromthe Southwestern Association of Naturalists. Y. Zhou was sup-ported by a Sid Kyle Graduate Merit Assistantship from theDepartment of Ecosystem Science and Management and a TomSlick Graduate Research Fellowship from the College of Agri-culture and Life Sciences, Texas A&M University. We thankChenghai Yang of USDA/ARS for acquiring the color infraredaerial photograph, and David and Stacy McKown for assistancewith on-site logistics at the Texas A&M AgriLife La CopitaResearch Area. We also thank three anonymous reviewers forhelpful comments, and the editors at Ecology. Y. Zhou, T. W.Boutton, and X. B. Wu formulated the original idea and devel-oped methodology; Y. Zhou conducted field sampling, analyzedsoil samples, and performed statistical analysis; Y. Zhou andT. W. Boutton interpreted data and wrote the manuscript witheditorial advice from X. B. Wu.
LITERATURE CITED
Achat, D. L., L. Augusto, A. Gallet-Budynek, and D. Loustau.2016. Future challenges in coupled C–N–P cycle models forterrestrial ecosystems under global change: a review. Biogeo-chemistry 131:173–202.
Archer, S. 1995. Tree-grass dynamics in a Prosopis-thornscrubsavanna parkland: reconstructing the past and predicting thefuture. Ecoscience 2:83–99.
Archer, S., C. Scifres, C. R. Bassham, and R. Maggio. 1988.Autogenic succession in a subtropical savanna: conversion ofgrassland to thorn woodland. Ecological Monographs58:111–127.
Arora, V. K., and G. J. Boer. 2003. A representation of variableroot distribution in dynamic vegetation models. Earth Inter-actions 7:1–19.
Bai, E., T. W. Boutton, X. B. Wu, F. Liu, and S. R. Archer.2009. Landscape-scale vegetation dynamics inferred fromspatial patterns of soil d13C in a subtropical savanna park-land. Journal of Geophysical Research: Biogeosciences 114:G01019.
Bai, E., T. W. Boutton, F. Liu, X. B. Wu, and S. R. Archer.2012. Spatial patterns of soil d13C reveal grassland-to-wood-land successional processes. Organic Geochemistry 42:1512–1518.
Beale, C. M., J. J. Lennon, J. M. Yearsley, M. J. Brewer, and D.A. Elston. 2010. Regression analysis of spatial data. EcologyLetters 13:246–264.
Blaser, W. J., G. K. Shanungu, P. J. Edwards, and H. O. Ven-terink. 2014. Woody encroachment reduces nutrient limita-tion and promotes soil carbon sequestration. Ecology andEvolution 4:1423–1438.
Boone, R. D., D. F. Grigal, P. Sollins, R. J. Ahrens, and D. E.Armstrong. 1999. Soil sampling, preparation, archiving, andquality control. Pages 3–28 in G. P. Roberts, D. C. Coleman,C. S. Bledsoe and P. Sollins, editors. Standard soil methodsfor long-term ecological research. Oxford University Press,New York, New York, USA.
January 2018 SOIL P RESPONSE TOWOODY ENCROACHMENT 145

Boutton, T. W., S. R. Archer, A. J. Midwood, S. F. Zitzer, andR. Bol. 1998. d13C values of soil organic carbon and their usein documenting vegetation change in a subtropical savannaecosystem. Geoderma 82:5–41.
Boutton, T. W., S. R. Archer, and A. J. Midwood. 1999. Stableisotopes in ecosystem science: structure, function, anddynamics of a subtropical savanna. Rapid Communicationsin Mass Spectrometry 13:1263–1277.
Boutton, T. W., I. B. Kantola, D. E. Stott, S. L. Balthrop, J. E.Tribble, and T. R. Filley. 2009. Soil phosphatase activity andplant available phosphorus increase following grassland inva-sion by N-fixing tree legumes. Eos Transactions of the Ameri-can Geophysical Union 90:B21B-0338.
Cleveland, C. C., A. R. Townsend, and S. K. Schmidt. 2002.Phosphorus limitation of microbial processes in moist tropi-cal forests: evidence from short-term laboratory incubationsand field studies. Ecosystems 5:680–691.
Diniz-Filho, J. A. F., L. M. Bini, and B. A. Hawkins. 2003. Spa-tial autocorrelation and red herrings in geographical ecology.Global Ecology and Biogeography 12:53–64.
Eldridge, D. J., M. A. Bowker, F. Maestre, E. Roger, J. Rey-nolds, and W. G. Whitford. 2011. Impacts of shrub encroach-ment on ecosystem structure and functioning: towards aglobal synthesis. Ecology Letters 14:709–722.
Finzi, A. C., A. T. Austin, E. E. Cleland, S. D. Frey, B. Z. Houl-ton, and M. D. Wallenstein. 2011. Responses and feedbacksof coupled biogeochemical cycles to climate change: examplesfrom terrestrial ecosystems. Frontiers in Ecology and theEnvironment 9:61–67.
Hendrick, R. L., and K. S. Pregitzer. 1996. Temporal anddepth-related patterns of fine root dynamics in northernhardwood forests. Journal of Ecology 84:167–176.
Hobbie, S. E., and P. M. Vitousek. 2000. Nutrient limitation ofdecomposition in Hawaiian forests. Ecology 81:1867–1877.
Houlton, B. Z., Y. P. Wang, P. M. Vitousek, and C. B. Field.2008. A unifying framework for dinitrogen fixation in the ter-restrial biosphere. Nature 454:327–330.
Jackson, R. B., and M. M. Caldwell. 1993. Geostatistical pat-terns of soil heterogeneity around individual perennial plants.Journal of Ecology 81:683–692.
Jackson, R. B., J. Canadell, J. R. Ehleringer, H. A. Mooney, O.E. Sala, and E. D. Schulze. 1996. A global analysis of rootdistributions for terrestrial biomes. Oecologia 108:389–411.
Jobb�agy, E. G., and R. B. Jackson. 2001. The distribution of soilnutrients with depth: global patterns and the imprint ofplants. Biogeochemistry 53:51–77.
Joslin, J. D., J. B. Gaudinski, M. S. Torn, W. J. Riley, and P. J.Hanson. 2006. Fine-root turnover patterns and their relation-ship to root diameter and soil depth in a 14C-labeled hard-wood forest. New Phytologist 172:523–535.
Kantola, I. B. 2012. Biogeochemistry of woody plant invasion:phosphorus cycling and microbial community composition. Dis-sertation. Texas A&MUniversity, College Station, Texas, USA.
Kautz, T., et al. 2013. Nutrient acquisition from arable subsoilsin temperate climates: a review. Soil Biology and Biochem-istry 57:1003–1022.
Laio, F., P. D’Odorico, and L. Ridolfi. 2006. An analyticalmodel to relate the vertical root distribution to climate andsoil properties. Geophysical Research Letters 33:L18401.
Lajtha, K., C. T. Driscoll, W. M. Jarrell, and E. T. Elliott. 1999.1999. Soil phosphorus: characterization and total elementanalysis. Pages 115–142 in G. P. Roberts, D. C. Coleman, C.S. Bledsoe and P. Sollins, editors. Standard soil methods forlong-term ecological research. Oxford University Press, NewYork, New York, USA.
Lambers, H., M. W. Shane, M. D. Cramer, S. J. Pearse, and E. J.Veneklaas. 2006. Root structure and functioning for efficient
acquisition of phosphorus: matching morphological andphysiological traits. Annals of Botany 98:693–713.
Li, C., L. Zhao, P. Sun, F. Zhao, D. Kang, G. Yang, X. Han, Y.Feng, and G. Ren. 2016. Deep soil C, N, and P stocks andstoichiometry in response to land use patterns in the loesshilly region of China. PLoS ONE 11:e0159075.
Liao, J. D., T. W. Boutton, and J. D. Jastrow. 2006. Storage anddynamics of carbon and nitrogen in soil physical fractions fol-lowing woody plant invasion of grassland. Soil Biology andBiochemistry 38:3184–3196.
Liu, F., X. B. Wu, E. Bai, T. W. Boutton, and S. R. Archer.2011. Quantifying soil organic carbon in complex landscapes:an example of grassland undergoing encroachment of woodyplants. Global Change Biology 17:1119–1129.
Loomis, L. E. 1989. Influence of heterogeneous subsoil develop-ment on vegetation patterns in a subtropical savanna park-land, Texas. Dissertation. Texas A&M University, CollegeStation, Texas, USA.
Mahowald, N., et al. 2008. Global distribution of atmosphericphosphorus sources, concentrations and deposition rates, andanthropogenic impacts. Global Biogeochemical Cycles 22:GB4026. https://doi.org/10.1029/2008gb003240
McClaran, M. P., J. Moore-Kucera, D. A. Martens, J. vanHaren, and S. E. Marsh. 2008. Soil carbon and nitrogen inrelation to shrub size and death in a semi-arid grassland.Geoderma 145:60–68.
McCulley, R. L., E. G. Jobbagy, W. T. Pockman, and R. B.Jackson. 2004. Nutrient uptake as a contributing explanationfor deep rooting in arid and semi-arid ecosystems. Oecologia141:620–628.
Midwood, A. J., T. W. Boutton, S. R. Archer, and S. E. Watts.1998. Water use by woody plants on contrasting soils in asavanna parkland: assessment with d2H and d18O. Plant andSoil 205:13–24.
Murphy, J., and J. P. Riley. 1962. A modified single solutionmethod for the determination of phosphate in natural waters.Analytica Chimica Acta 27:31–36.
Pierzynski, G. M. (editor). 2000. Methods of phosphorus analy-sis for soils, sediments, residuals, and waters. Southern Coop-erative Series Bulletin No. 396. USDA-CSREES RegionalCommittee SERA-IEG 17. North Carolina State University,Raleigh, North Carolina, USA.
Plotnick, R. E., R. H. Gardner, W. W. Hargrove, K. Preste-gaard, and M. Perlmutter. 1996. Lacunarity analysis: a gen-eral technique for the analysis of spatial patterns. PhysicalReview E 53:5461.
Poulter, B., et al. 2014. Contribution of semi-arid ecosystems tointerannual variability of the global carbon cycle. Nature509:600–603.
R Development Core Team. 2014. R: a language and environ-ment for statistical computing. R Foundation for StatisticalComputing, Vienna, Austria. http://www.r-project.org/
Rasse, D. P., C. Rumpel, and M. F. Dignac. 2005. Is soil carbonmostly root carbon? Mechanisms for a specific stabilisation.Plant and Soil 269:341–356.
Reed, S. C., X. Yang, and P. E. Thornton. 2015. Incorporatingphosphorus cycling into global modeling efforts: a worth-while, tractable endeavor. New Phytologist 208:324–329.
Reynolds, J. F., et al. 2007. Global desertification: building ascience for dryland development. Science 316:847–851.
Sardans, J., and J. Pe~nuelas. 2014. Hydraulic redistribution byplants and nutrient stoichiometry: shifts under global change.Ecohydrology 7:1–20.
Schenk, H. J., and R. B. Jackson. 2002. Rooting depths, lateralroot spreads and below-ground/above-ground allometries ofplants in water-limited ecosystems. Journal of Ecology90:480–494.
146 YONG ZHOU ET AL. Ecology, Vol. 99, No. 1

Schlesinger, W. H., and E. S. Bernhardt. 2013. Biogeochemistry:an analysis of global change (3rd edn). Academic Press, Else-vier, New York, USA.
Schlesinger, W. H., J. A. Raikes, A. E. Hartley, and A. F. Cross.1996. On the spatial pattern of soil nutrients in desert ecosys-tems. Ecology 77:364–374.
Scholes, R. J., and S. R. Archer. 1997. Tree-grass interactions insavannas. Annual Review of Ecology and Systematics 28:517–544.
Selmants, P. C., and S. C. Hart. 2010. Phosphorus and soildevelopment: Does the Walker and Syers model apply tosemiarid ecosystems? Ecology 91:474–484.
Sheldrick, B. H., and C. Wang. 1993. Particle size distribution.Pages 499–511 in M. R. Carter, editor. Soil sampling andmethods of analysis. Canadian Society of Soil Science, LewisPublishers, Ann Arbor, Michigan, USA.
Sitters, J., P. J. Edwards, and H. O. Venterink. 2013. Increasesof soil C, N, and P pools along an Acacia tree density gradi-ent and their effects on trees and grasses. Ecosystems 16:347–357.
Soil Survey Staff. 1999. Soil taxonomy: a basic system of soilclassification for making and interpreting soil surveys. Sec-ond edition. Natural Resources Conservation Service, U.S.Department of Agriculture, Washington, D.C., USA.
Stevens, N., C. E. Lehmann, B. P. Murphy, and G. Durigan.2017. Savanna woody encroachment is widespread acrossthree continents. Global Change Biology 23:235–244.
Sun, Y., et al. 2017. Diagnosing phosphorus limitations in natu-ral terrestrial ecosystems in carbon cycle models. Earth’sFuture 5:730–749.
Throop, H. L., and S. R. Archer. 2008. Shrub (Prosopis velu-tina) encroachment in a semidesert grassland: spatial-tem-poral changes in soil organic carbon and nitrogen pools.Global Change Biology 14:2420–2431.
Treseder, K. K., and P. M. Vitousek. 2001. Effects of soil nutri-ent availability on investment in acquisition of N and P inHawaiian rain forests. Ecology 82:946–954.
Van Auken, O. W. 2009. Causes and consequences of woodyplant encroachment into western North American grasslands.Journal of Environmental Management 90:2931–2942.
Vitousek, P. M.. 2004. Nutrient cycling and limitation: Hawai’ias a model system. Princeton University Press, Princeton,New Jersey, USA.
Vitousek, P. M., et al. 2002. Towards an ecological understand-ing of biological nitrogen fixation. Biogeochemistry 57:1–45.
Vitousek, P. M., S. Porder, B. Z. Houlton, and O. A. Chadwick.2010. Terrestrial phosphorus limitation: mechanisms, impli-cations, and nitrogen-phosphorus interactions. EcologicalApplications 20:5–15.
Walker, T. W., and J. K. Syers. 1976. The fate of phosphorusduring pedogenesis. Geoderma 15:1–19.
Watts, S. E. 1993. Rooting patterns of co-occurring woodyplants in a subtropical savanna. Thesis. Texas A&M Univer-sity, College Station, Texas, USA.
Yang, W., H. Cheng, F. Hao, W. Ouyang, S. Liu, and C. Lin.2012. The influence of land-use change on the forms of phos-phorus in soil profiles from the Sanjiang Plain of China. Geo-derma 189:207–214.
Yang, X., W. M. Post, P. E. Thornton, and A. Jain. 2013. Thedistribution of soil phosphorus for global biogeochemicalmodeling. Biogeosciences 10:2525–2537.
Yang, X., P. E. Thornton, D. M. Ricciuto, and F. M. Hoffman.2016. Phosphorus feedbacks constraining tropical ecosystemresponses to changes in atmospheric CO2 and climate. Geo-physical Research Letters 43:7205–7214.
Zhou, Y., T. W. Boutton, and X. B. Wu. 2017a. Soil carbonresponse to woody plant encroachment: importance of spatialheterogeneity and deep soil storage. Journal of Ecology105:1738–1749. https://doi.org/10.1111/1365-2745.12770
Zhou, Y., T. W. Boutton, and X. B. Wu. 2017b. Data from: Soilcarbon response to woody plant encroachment: Importanceof spatial heterogeneity and deep soil storage. Dryad DigitalRepository. https://doi.org/10.5061/dryad.ns92q
Zhou, Y., T. W. Boutton, X. B. Wu, and C. Yang. 2017c. Spatialheterogeneity of subsurface soil texture drives landscape-scalepatterns of woody patches in a subtropical savanna. Land-scape Ecology 32:915–929.
Zou, C. B., P. W. Barnes, S. Archer, and C. R. McMurtry. 2005.Soil moisture redistribution as a mechanism of facilitation insavanna tree–shrub clusters. Oecologia 145:32–40.
SUPPORTING INFORMATION
Additional supporting information may be found in the online version of this article at http://onlinelibrary.wiley.com/doi/10.1002/ecy.2051/suppinfo
January 2018 SOIL P RESPONSE TOWOODY ENCROACHMENT 147