women’s autonomy in india and pakistan: the · pdf filewomen’s autonomy in india...
TRANSCRIPT

POPULATION AND DEVELOPMENT REVIEW 27(4) :687–712 (DECEMBER 2001) 687
Women’s Autonomy inIndia and Pakistan:The Influence ofReligion and Region
SHIREEN J. JEJEEBHOY
ZEBA A. SATHAR
THE CULTURES OF South Asia are largely gender stratified, characterized bypatrilineal descent, patrilocal residence, inheritance and succession prac-tices that exclude women, and hierarchical relations in which the patriarchor his relatives have authority over family members. Levels and patterns offemale autonomy vary considerably within the region, however, and thequestion is why. Two arguments have been advanced in the literature tosupport the hypothesis that women in Pakistan have less autonomy andcontrol over their own lives than do women in India. The first argues thatin Pakistan as in other Islamic settings, women occupy a separate and dis-tinctive position that effectively denies them education and autonomy.Women’s lack of control over their own lives has been cited as the centralfactor underlying the poorer mortality outcomes experienced by Islamic so-cieties (Caldwell 1986: 175). The second argument draws on research con-ducted in India that demonstrates the dominant influence of behavior andnorms imprinted by regionally prescribed social systems, and points out thatthe social systems that characterize the southern region provide women moreexposure to the outside world, more voice in family life, and more freedomof movement than do the social systems of the north (Dyson and Moore1983; Basu 1992; Jejeebhoy 2000). In this view, to which we subscribe,region plays the major conditioning role, and once region is controlled, Mus-lim women exert about as much autonomy in their lives as do Hindu women,wherever they reside. The argument in favor of regional social systems asopposed to religion as the driving force is strengthened by evidence sug-gesting wide variations in the ways in which gender and behavioral normsare manifested across a range of Islamic countries (see for example,Obermeyer 1992).

688 W O M E N ’ S A U T O N O M Y I N I N D I A A N D P A K I S T A N
This article explores these assertions empirically, using data drawn fromIndia and Pakistan. First, we compare the lives of women in three settings—one (Punjab) in Pakistan, the other two (Uttar Pradesh and Tamil Nadu) innorth and south India respectively—and assess similarities and differencesin women’s autonomy. Second, we examine the extent to which levels ofautonomy are in fact explained by such commonly available measures ofautonomy as education and economic activity, and such traditional provid-ers of status as age and residence patterns. And third, we explore the con-textual factors underlying observed differences. In particular we try to as-certain whether differences in women’s autonomy are attributable toreligion, to nationality, or to the north–south cultural difference that hasbeen widely acknowledged within India and that can be investigated withthe inclusion of data from Pakistan as an additional cultural identity in thesubcontinent.
Autonomy has been variously defined as “the ability...to obtain infor-mation and to use it as the basis for making decisions about one’s privateconcerns and those of one’s intimates” (Dyson and Moore 1983: 45); and“the degree of women’s access to (and control over) material resources (in-cluding food, income, land, and other forms of wealth) and to social re-sources (including knowledge, power, and prestige) within the family, inthe community, and in the society at large” (Dixon 1978: 6). We defineautonomy here as the control women have over their own lives—the ex-tent to which they have an equal voice with their husbands in matters af-fecting themselves and their families, control over material and other re-sources, access to knowledge and information, the authority to makeindependent decisions, freedom from constraints on physical mobility, andthe ability to forge equitable power relationships within families.
Data are drawn from surveys designed explicitly to measure women’sstatus, and they pertain to women residing in three culturally distinct sitesof South Asia—(1) a rural and periurban setting in the patriarchal PunjabProvince, in Pakistan; (2) an equally patriarchal setting of Uttar Pradesh innorth India; and (3) the more egalitarian setting of Tamil Nadu, in the southof India. We conducted surveys in all three sites in 1993–94. This studyexamines the situation of women in five socio-cultural settings and groups,distinguished by region and religion (north: Uttar Pradesh Muslims and Hin-dus and Punjab Muslims; and south: Tamil Nadu Hindus and Muslims).
The three sites have distinct socioeconomic features. Punjab is the mostpopulous province of Pakistan with 52 percent of the population. The stateis primarily agricultural with the exception of a few large cities— Lahore,Faisalabad, and Gujranwala—in which industrial activities are concentrated.Social conditions are quite advanced in Punjab relative to other provinces.For example, literacy rates (population aged 10 and older) in Punjab were51 percent among males and 25 percent among females, compared to 47
S H I R E E N J . J E J E E B H O Y / Z E B A A . S A T H A R 689
and 21 percent, respectively, in rural Pakistan as a whole. Also, consider-able internal and external migration in Punjab has rendered the state opento wider outside influences than either rural Sind or Baluchistan. Infantmortality at 92 per thousand live births, under-five mortality at 115 perthousand, and a total fertility rate of 5.3 remain high (Hakim, Cleland, andul Hassan Bhatti 1999).
Uttar Pradesh and Tamil Nadu lie at two extremes of the social andcultural spectrum in India, although economically they are similar. Bothstates are poor, with about 37 percent in Uttar Pradesh and 40 percent inTamil Nadu living below the poverty line (compared to 33 percent in In-dia), and both states are largely agricultural (Uttar Pradesh 72 percent, TamilNadu 61 percent, India 70 percent). Yet social development levels differgreatly. Literacy rates (population aged six and older) are much higher inTamil Nadu (63 percent) than in Uttar Pradesh (42 percent), and fertilityand mortality are much lower—for example, the infant mortality rate is 98per thousand live births in Uttar Pradesh compared to 58 in Tamil Nadu;the under-five mortality rate is 141 in Uttar Pradesh and 87 in Tamil Nadu;and the total fertility rate is 5.1 in Uttar Pradesh compared to 2.2 in TamilNadu. Muslims experience higher total fertility rates than Hindus in UttarPradesh (5.3 and 4.8 respectively), but identical rates in Tamil Nadu (2.5each) (Population Research Centre, Gandhigram Institute of Rural Healthand Family Welfare Trust, and International Institute for Population Sci-ences 1994; Population Research Centre, Lucknow University, and Inter-national Institute for Population Sciences 1994).
The few available measures of gender disparities emphasize these re-gional differences in women’s situation and vulnerability. For example, lifeexpectancy at birth in Uttar Pradesh is about five years higher for malesthan for females (54 and 49, respectively); in Tamil Nadu, life expectancyfor both females and males is 61 years. Moreover, the maternal mortalityratio is 931 per 100,000 births in Uttar Pradesh and 319 in Tamil Nadu.And gender disparities in literacy rates are far wider in Uttar Pradesh (25percent for females compared to 56 percent for males) than in Tamil Nadu(51 percent for females compared to 74 percent for males).
Both states of India and Punjab in Pakistan are typically patriarchaland patrilocal, and the region as a whole is well known for inegalitariangender relations. But beyond these broad generalizations, social systems andthe ways in which kinship norms affect women’s lives vary widely. In In-dia, for example, there is considerable ethnographic evidence of regionaldifferences in the situation of women, and female powerlessness is muchmore acute in north India than in south India (Karve 1965; Altekar 1962).Women in the north have relatively little autonomy or freedom of move-ment, limited inheritance rights in practice, and limited opportunities forcontrol over economic resources. After marriage, a young woman is ex-
690 W O M E N ’ S A U T O N O M Y I N I N D I A A N D P A K I S T A N
pected to remain largely invisible to outsiders and under the authority ofher husband’s family. She has little say in domestic decisions and little free-dom of movement. About the only means available to enhance her prestigeand even security in her husband’s home is through her fertility, and par-ticularly the number of sons she bears. The situation in Punjab is similarand well documented (Sathar and Kazi 2000). In contrast, women in southIndia have more autonomy in all of these respects: they have greater deci-sionmaking authority, are less secluded and more likely to work outsidethe home and control resources, and are less likely to perceive sons as theironly source of prestige.
In terms of marriage patterns, all three settings are characterized byarranged marriages, patrilocal residence, and large dowries. The one big dif-ference relates to support from the natal family after marriage. In northIndia, and particularly among Hindus, young girls marry into distant vil-lages and into families with whom previous contact has been limited andsubsequent contacts are usually infrequent; this practice is expected toheighten women’s powerlessness. Women are perceived traditionally as tem-porary members in their natal homes (Dube 1988), who take resources fromtheir natal families in the form of large dowries; even after marriage, thepattern and flow of resources is strictly one way (Das Gupta 1987). By con-trast, in south India as well as Punjab, kin marriage and close natal familyties ensure that women are not cut off from family support to the sameextent as they are in north India. A further distinguishing feature in Punjab,Pakistan, is the greater prevalence of exchange marriages between families.Marriages involving the exchange of female siblings reduce dowry require-ments but can increase tensions between families: in cases where one coupleexperiences discord, the other suffers almost necessarily.
Less can be said about Hindu–Muslim differences. It has been arguedthat Islam restricts women’s freedom to a greater extent than other reli-gions. In India, for example, the general impression is that Muslim womenare more likely than Hindu women to be denied work opportunities out-side the home, a secular education, control over economic resources, re-course in case of abandonment or divorce, and choice in reproductive be-havior. However, Muslim marriage patterns, at least in north India, andparticularly in Pakistan, are less alienating from natal kin than those amongHindus (see, for example, Mandelbaum 1986).
The hypothesis that women exposed to the social system of the south-ern regions of the subcontinent have greater autonomy than women fromthe northern regions must be interpreted keeping in mind that autonomylevels in the subcontinent remain among the lowest in the world. Hencewhile women in Tamil Nadu are expected to have more autonomy thantheir northern counterparts in Uttar Pradesh, their autonomy is far morelimited than that of women in other parts of Asia (Malaysia, the Philip-

S H I R E E N J . J E J E E B H O Y / Z E B A A . S A T H A R 691
pines, and Thailand, for example), and certainly more limited than that ofmen in the same settings (Mason et al. 1995).
Data
The datasets employed in this study are among the first seeking to operationalizeautonomy among women from different cultural and religious settings. Themain objective is to assess the relationship between women’s autonomyand their reproductive behavior. Similar studies have been conducted inMalaysia, the Philippines, and Thailand (Mason et al. 1995).
In Pakistan, Punjab was purposively selected. It is the most developedprovince in the country in terms of agricultural productivity, road struc-ture, sanitation, communications, and availability of health and educationalfacilities. Yet it is by no means homogeneous: the province houses threedistinct agro-economic zones, with central and south Punjab quite differentfrom north Punjab not only in level of development and agricultural pat-terns (rainfed versus irrigated agriculture) but also in terms of feudalismand consequent female autonomy (rainfed rural areas and the periurbanareas are less feudalistic than the irrigated areas). In order to represent thisdiversity, ten communities were selected from the three agro-economiczones. Nine of these were rural and one was periurban. The ten communi-ties are: (1) northern rainfed (barani) districts (Rawalpindi, Attock, andChakwal) and northern semi-irrigated districts (Mianwali and Khushab);(2) central (Faisalabad and Sahiwal) and south Punjab irrigated districts(Multan and Bahawalpur); and (3) a periurban area in central Punjab(Gujranwala district).1
In India, Uttar Pradesh in the north and Tamil Nadu in the south werealso selected to represent a range of gender-related and socio-cultural con-ditions. Within each state, two districts were selected (on the basis of anindex of development, constructed from such indicators as income, percentof roads surfaced, and other economic criteria) so as to maximize differ-ences in socioeconomic conditions, while at the same time allowing for com-parisons of Hindu and Muslim women. And from each district, one taluka(subdistrict) was selected similarly. The four sites thus selected included:from Tamil Nadu, Pollachi taluka from Coimbatore district (ranked 1 of 21)and Mudukulathur taluka from Ramnathpuram district (ranked 18 of 21);and from Uttar Pradesh, Kunda taluka from Meerut district (ranked 2 of63) and Baghpat taluka from Pratapgarh district (ranked 51 of 63).2
From each of the four sites in India, a cluster of contiguous villages ofroughly 1,000–2,000 households was randomly selected, and about 800 cur-rently married women aged 15–39 were randomly selected for interview.Husbands who were present were also interviewed. In each setting, on theassumption that socio-cultural norms governing female autonomy vary

692 W O M E N ’ S A U T O N O M Y I N I N D I A A N D P A K I S T A N
widely between Hindus and Muslims, half of all respondents were selectedto be Hindu and the other half were selected to be Muslim. As a result, atotal of eight communities are covered: four geographical sites and, withineach site, two distinct religious groups, Hindus and Muslims. In one setting,Mudukulathur, in which many husbands migrate out for work and wouldnot be available for interview, a larger Muslim sample was selected to allowfor the inclusion of the required number of husbands; however, to preventMudukulathur Muslims from dominating the findings for all Tamilian Mus-lims or the average for all women from Tamil Nadu, means for these twogroups are weighted to adjust for this disparity. A total of 1,842 women,aged 15–39, constituted the sample.
In Punjab, currently married women were selected from ten commu-nities ranging in size from 2,500 to 5,000 households. In the ten villagesselected, all households were listed and about 100 households were sampledrandomly to interview one currently married woman in each. About halfthe husbands were successfully interviewed. Unlike the Indian sample al-most all women in Punjab were Muslims; 1,036 currently married womenaged 15–39 were interviewed along with 436 husbands.
In the course of interviews with women, respondents were asked notonly about their education and their work status but also about a variety ofdimensions of female autonomy, including their decisionmaking authority,their personal freedom of movement, control over economic resources, andwife–husband power relations.
For ease of analysis, we collapse the 18 communities under study intofive. For India, findings are presented separately for Hindus and Muslims ineach state. In Pakistan, data from the ten communities are combined into asingle figure. Of course, pooling data risks obscuring important influencesof patriarchy, religion, and other conditioning factors. In other articles us-ing these data, within-region levels of female autonomy have been exploredand findings are largely consistent with those reported below (see, for ex-ample, Jejeebhoy 2000, 2001; Kazi and Sathar 2001; Mason et al. 1995).
Table 1 summarizes economic characteristics of households in the fivecommunities. Economic status appears to be similar across sites as mea-sured by per capita income. Land ownership status is closely linked withincome levels, with landlessness being most pronounced in Tamil Nadu andamong Muslims in Uttar Pradesh, followed by Punjab and Hindus in UttarPradesh; it is, however, the Hindus of both Uttar Pradesh and Tamil Nadu,and women in Punjab who report large, that is, six or more acres of land-holdings. Finally, Punjabi women are more likely than other groups to livein pucca homes (made with high-quality materials, including the roof, walls,and floor) and to have electricity and indoor toilets; they also own moreconsumer goods.
Economic status can also be assessed by a profile of husband’s educa-tion and occupation. School attendance levels are highest among the north

S H I R E E N J . J E J E E B H O Y / Z E B A A . S A T H A R 693
Indian Hindus followed by Tamilian Muslims and are lowest among northIndian and Punjabi Muslims. On average, however, husbands’ educationallevels are similar in India and Pakistan, suggesting that educational attain-ment levels of men are sensitive neither to region nor to religion. The occu-pational profile of husbands, by contrast, suggests clear differences by reli-gion in the Indian sites: Hindus are, by and large, more likely to be engagedin agriculture than are Indian Muslims, both as cultivators and, to a lesserextent, laborers. Conversely, Indian Muslims are more likely to be engagedin nonagricultural activities: as salesworkers (mostly petty), skilled work-ers, and unskilled laborers. In Punjab most of the population in rural areasis engaged in agriculture and a substantial proportion is engaged in wagework also.
The situation of women
The most commonly used measures of women’s status are their educationaland economic activity levels. Evidence that disparities are wider when thetwo geographic regions are compared than when either country or religionis considered emerges from the data on women’s educational status in Table 2.Large proportions of women in all five communities have never been toschool, and few have completed primary school; note that these data referto women’s attainment of a secular education only. Considerably larger pro-portions of women in Tamil Nadu have attended school than have womenin either Uttar Pradesh (India) or Punjab (Pakistan). Patterns by religious
TABLE 1 Household characteristics in the study sample, by site
Uttar Pradesh Tamil Nadu
Punjab Muslim Hindu Muslima Hindu
Land ownershipPercent landless 53.9 66.3 25.8 71.9 64.2Percent owning 6+ acres 11.1 3.4 14.1 2.5 12.8
Per capita annual income ($) 89 71 101 68 89Housing: Percent pucca 72.1 55.3 55.7 51.3 34.9Household amenities
Percent with electricity 81.3 35.3 29.8 64.7 41.8Percent with indoor toilet 20.0 16.9 12.1 11.6 10.0
Consumer durablesNo. consumer goods ownedb 3.6 1.5 2.3 2.2 1.9
Number 1,036 421 438 547 436
aWeighted to adjust for larger sample size of Ramnathpuram Muslims.bOf the following nine: any transport (car/tractor/motorcycle), clock, fan, radio, refrigerator, sewing machine,stereo, TV, iron.
694 W O M E N ’ S A U T O N O M Y I N I N D I A A N D P A K I S T A N
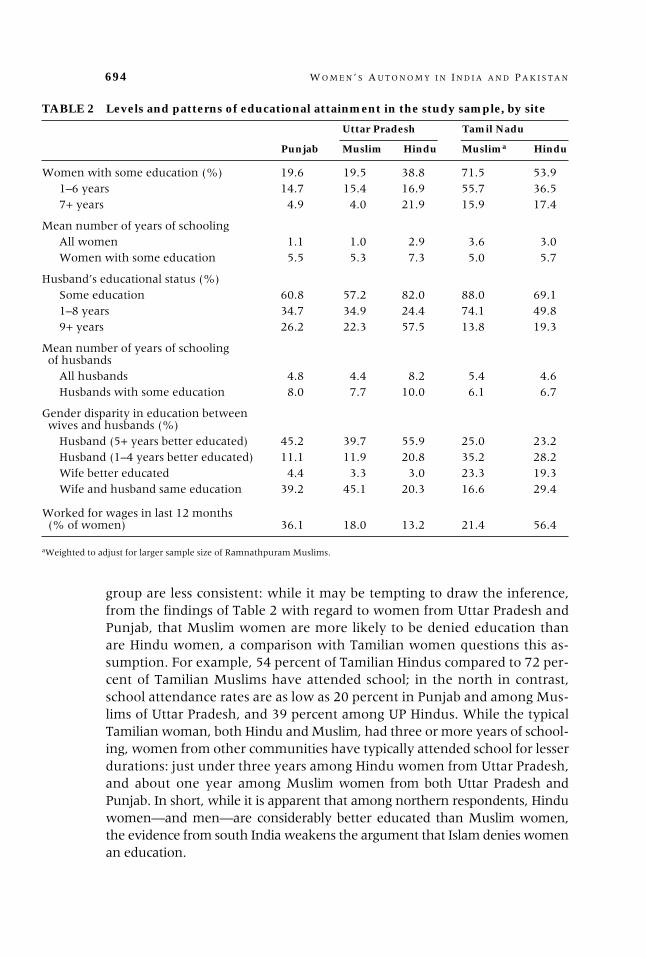
group are less consistent: while it may be tempting to draw the inference,from the findings of Table 2 with regard to women from Uttar Pradesh andPunjab, that Muslim women are more likely to be denied education thanare Hindu women, a comparison with Tamilian women questions this as-sumption. For example, 54 percent of Tamilian Hindus compared to 72 per-cent of Tamilian Muslims have attended school; in the north in contrast,school attendance rates are as low as 20 percent in Punjab and among Mus-lims of Uttar Pradesh, and 39 percent among UP Hindus. While the typicalTamilian woman, both Hindu and Muslim, had three or more years of school-ing, women from other communities have typically attended school for lesserdurations: just under three years among Hindu women from Uttar Pradesh,and about one year among Muslim women from both Uttar Pradesh andPunjab. In short, while it is apparent that among northern respondents, Hinduwomen—and men—are considerably better educated than Muslim women,the evidence from south India weakens the argument that Islam denies womenan education.
TABLE 2 Levels and patterns of educational attainment in the study sample, by site
Uttar Pradesh Tamil Nadu
Punjab Muslim Hindu Muslima Hindu
Women with some education (%) 19.6 19.5 38.8 71.5 53.91–6 years 14.7 15.4 16.9 55.7 36.57+ years 4.9 4.0 21.9 15.9 17.4
Mean number of years of schoolingAll women 1.1 1.0 2.9 3.6 3.0Women with some education 5.5 5.3 7.3 5.0 5.7
Husband’s educational status (%)Some education 60.8 57.2 82.0 88.0 69.11–8 years 34.7 34.9 24.4 74.1 49.89+ years 26.2 22.3 57.5 13.8 19.3
Mean number of years of schoolingof husbands
All husbands 4.8 4.4 8.2 5.4 4.6Husbands with some education 8.0 7.7 10.0 6.1 6.7
Gender disparity in education betweenwives and husbands (%)
Husband (5+ years better educated) 45.2 39.7 55.9 25.0 23.2Husband (1–4 years better educated) 11.1 11.9 20.8 35.2 28.2Wife better educated 4.4 3.3 3.0 23.3 19.3Wife and husband same education 39.2 45.1 20.3 16.6 29.4
Worked for wages in last 12 months(% of women) 36.1 18.0 13.2 21.4 56.4
aWeighted to adjust for larger sample size of Ramnathpuram Muslims.
S H I R E E N J . J E J E E B H O Y / Z E B A A . S A T H A R 695
Gender disparities in educational attainment levels (Table 2) are pro-nounced in all settings, but once again the north–south comparison yieldsthe widest disparities. Among over 40 percent of women in both the northIndian and Pakistani communities, educational attainment of husbands ex-ceeds that of wives by five years or more, and the gender disparity in edu-cation is widest among Hindus from Uttar Pradesh. In comparison, amongsouth Indian women, irrespective of religion, this proportion is about 25percent. Interestingly, about 20 percent of south Indian women are bettereducated than their husbands by about one to four years, compared to anegligible 3–4 percent in Pakistan and north India.
Although women are universally involved in unpaid household work,economic independence is usually measured in terms of wage-earning eco-nomic activity. In India and Pakistan, however, where wage work for womenis often unacceptable and poverty-induced, working for wages is not neces-sarily an indicator of autonomy. Wage-earning women are not likely to havemade the decision to work on their own, nor do they always have controlover their earnings. Nevertheless, even in situations of dire need, familiesin cultures in which women are secluded may be reluctant to allow womento work for wages outside the family farm or business. Work histories sug-gest that in the 12 months preceding the survey, well over half of all womenwere engaged in some form of work other than unpaid household work—either wage-earning activities or unpaid labor on the family farm or planta-tion, in the family business, or tending family livestock. Regional profilessuggest that working women in Punjab and Uttar Pradesh are largely occu-pied in tending animals and working on family farms; in Tamil Nadu, incontrast, agricultural labor occupies the majority of working women, fol-lowed by working on the family farm in the case of Muslims and at skilledand unskilled nonagricultural work among Hindus. Yet, comparatively fewwomen worked for wages, and here it is largely the Tamilian Hindus whostand out compared to the others (Table 2): 56 percent of them were en-gaged in wage work.
Many authors have suggested other measures of women’s status. Promi-nent among them is delayed age at marriage: women who delay marriage areobserved to be more independent and have more autonomy and self-confi-dence than those who marry at earlier ages. Additional measures include spousalage difference (Cain, Khanam, and Nahar 1979), joint family residence, andvillage endogamy.
Data shown in Table 3 bear out the finding that few South Asianwomen have a say in their choice of husband or the timing of their mar-riages. However, Tamilian women are considerably more likely than womenfrom Uttar Pradesh or Punjab to have had a say in choosing their husbands.
Although the large majority of women from all five communitiesresided with their in-laws after marriage, current residential patterns tell adifferent story. In India, women in Uttar Pradesh, both Muslim and Hindu,

696 W O M E N ’ S A U T O N O M Y I N I N D I A A N D P A K I S T A N
are more likely than women in Tamil Nadu to currently reside with theirmother-in-law. In Punjab 57 percent of respondents currently reside in anon-nuclear household. South Indian women are also significantly less likelyto report difficulties in their relationships with their mothers-in-law thanare Punjabi women or those from Uttar Pradesh (not shown in tabular form).
In some instances, however, the situation of Punjabi women resemblesthat of south Indian rather than of north Indian women. Marital age (Table3) varies markedly among the five communities, with southern women—particularly Hindus—reporting higher ages at marriage, and women fromUttar Pradesh reporting the lowest. In Uttar Pradesh, over half of all re-spondents aged 20 and older are married by age 16. In contrast, about one-quarter of Tamilian women and over a third of Punjabi women are marriedby age 16.
Finally, village endogamy (Table 3) is considerably more likely to bepracticed among Tamilian and Punjabi women than among women fromUttar Pradesh. Although Muslims in both Indian settings are more likely
TABLE 3 Family variables in the study sample, by site
Uttar Pradesh Tamil Nadu
Punjab Muslim Hindu Muslima Hindu
Marital age (women aged 20–39)Percent married at 16 or younger 37.1 55.1 48.4 32.3 21.5Mean age at marriage (years) 18.0 16.4 16.6 17.4 18.3
Woman had a say in marriage decision (%) 16.1 12.8 9.8 31.7 42.0
Dowry amount (in US$) 865 488 700 938 769
Living in natal village (village of birthor childhood) (%) 49.4 16.6 5.7 45.9 34.2
Current living arrangementLiving with mother-in-law (%) 57.0b 40.1 58.9 31.9 24.5
Residence after marriageCoresided with in-laws (%) 89.6 87.2 93.6 69.3 75.7
Age difference between spousesMean age difference (years) 5.9 5.4 4.7 6.6 6.0Percent distribution of couples
Wife older 6.0 0.0 0.2 0.2 0.2Same age or husband 1–4 yearsolder 38.2 43.7 47.7 32.8 38.5
Husband 5–9 years older 35.3 48.0 49.1 51.9 47.9Husband 10+ years older 12.6 8.3 3.0 15.1 13.3
NOTE: US$1=Rs 51.2 (Pakistan) and Rs. 43.3 (India).aWeighted to adjust for larger sample size of Ramnathpuram Muslims.bPercent in non-nuclear households.

S H I R E E N J . J E J E E B H O Y / Z E B A A . S A T H A R 697
than Hindus to live in their natal villages, it appears that north Indian Mus-lims, like north Indian Hindus, marry their daughters into distant house-holds; they are considerably less likely to reside in their natal homes thanare Muslim women from Tamil Nadu or Punjab.
The importance of dowry in securing a woman’s place in her husband’shome is increasingly apparent in India, both through the alarming num-bers of dowry harassment and death cases reported in the media, andthrough studies that suggest that women whose dowries are large are lesslikely to have suffered domestic violence than other women (Rao and Bloch1993). Available in our dataset is information obtained from the respon-dent on the size and contents of her dowry: in jewelry and gold, cash, and avariety of other property including expensive consumer goods (vehicle, re-frigerator, stereo, utensils) and (rarely) land. Approximate rupee values havebeen imputed for each of the items in the dowry, and the total value of thedowry in rupees has been assessed. Clearly, this is an approximation, sincewomen—particularly those from Uttar Pradesh—appear not to have beenfully aware of the extent of their dowry. Results suggest that the size of thedowry is generally large in all contexts, but that Punjabi and Tamilian womenreport substantially higher dowries (equivalent to about US$865 and $854respectively) than those from Uttar Pradesh ($594). Again, in this respect,the situation of Punjabi women resembles that of south Indian rather thannorth Indian women.
For the most part, however, a comparison of the conventional mea-sures of the status of women reported in Tables 2 and 3 confirms that dif-ferences are more likely to reflect social systems as marked by region thanby nationality or religion. South Indian women appear to enjoy greater levelsof autonomy than north Indian women. For the most part, the situation ofPunjabi women resembles that of north Indian women—although in somerespects they fall between north and south Indian women.
Measures of women’s autonomy
The literature suggests several separate but interdependent components toautonomy. These include the autonomy conferred by knowledge or expo-sure to the outside world; decisionmaking authority, or the extent to whichwomen have a say in family decisions and decisions concerning their ownlives and well-being; physical autonomy in interacting with the outsideworld, or the extent to which women are free of constraints on their physi-cal mobility; emotional autonomy, or the extent to which women enjoyclose bonds with spouses and are free from the threat of violence and abuse;and economic and social autonomy and self-reliance, namely the extent towhich women have access to and control over their own and theirhousehold’s economic resources (see, for example, Mason 1984; Caldwell

698 W O M E N ’ S A U T O N O M Y I N I N D I A A N D P A K I S T A N
1979; Caldwell, Reddy, and Caldwell 1982; Jejeebhoy 1995). To assess thesecomponents of female autonomy, women in this survey were asked a bat-tery of questions concerning their status within the household. From theseresponses, four dimensions of autonomy were selected and indexes werecreated for each: (1) economic decisionmaking; (2) mobility; (3) freedomfrom threat from husband; and (4) access to and control over economicresources. These and similar measures have been used elsewhere by theauthors and others (see, for example, Jejeebhoy 2000, 2001; Mason et al.1995; Kishor 2000).
Economic decisionmaking authority is represented by information onthe participation of women in three economic decisions, selected to capturea range of decisions, from the routine to the out of the ordinary, and also tocapture the extent to which women simply participate in the decision oractually perceive themselves to have a major say in it. Items include: thepurchase of food, major household goods, and jewelry. The index sums thenumber of these three purchases in which the woman participates, assign-ing a score of 1 if she only participates in the decision and 2 if she also hasthe major say. The index thus ranges from 0 to 6.3
The mobility index sums the number of five places—the health cen-ter, the village community center or market, home of a relative or friend, afair, and the next village—to which the woman can go unescorted. Again,the intent was to select a range of places, both within and outside the vil-lage, both easy and more difficult to access. Hence for example, while acommunity center or market and friend’s home were always within thevillage, the health center and fairs were usually outside the village. Theindex ranges from 0 if the woman must be escorted everywhere to 5 if shecan move about unescorted to each of the five places.
The index of freedom from threat ranges from 0 to 3: 0 is assigned ifthe woman both fears her husband and is beaten by him; 1 if she is beatenbut does not fear her husband; 2 if she fears him but is not beaten; and 3 ifshe neither fears nor suffers beating at the hands of her husband.4 Here,the intention was to capture the continuum of power relations betweenspouses. In focus group discussions participants agreed that women whoexperienced a nonphysical rebuke from their husbands were indeed morelikely to assert themselves than those who feared physical reprisals, and theindex was constructed to reflect this.
The index of access to and control over economic resources covers twoaspects of women’s use of family and own resources: their freedom to useor manage household resources and the extent to which they have inde-pendent control over any resource. The index thus sums responses to sevenquestions. Four of these relate to access to household resources: (1) havinga say in how household income is spent; (2) getting cash to spend; (3) be-ing free to purchase small items of jewelry; and (4) being free to purchase
S H I R E E N J . J E J E E B H O Y / Z E B A A . S A T H A R 699
gifts. Three relate to aspects of women’s expression of independent controlover resources: (1) whether any of the family’s valuables (land/jewelry/utensils) belong to the woman (that is, are in the woman’s name) and arecontrolled by her; (2) whether she has or had some say or the major say(assigned a value of 0.5 and 1.0 respectively) in how the valuables from herdowry are used or spent; and (3) whether she expects to support herself inold age through her own savings. The index ranges from 0 to 7.
In focus group discussions it became clear that women were acutelyaware of these and other aspects of autonomy. They discussed, for example,the extent to which young women’s freedom was curbed by social normsand the watchful eyes of the men and elders in the family. They pointedout that older or educated women exerted more say in their own lives thandid the uneducated; they discussed the ways in which women who coresidedwith their parents-in-law were watched with regard to their behavior andmovements. And in responding to the survey questionnaire, women wereclearly able to outline the limits of their decisionmaking power.
Table 4 presents mean values for each of the four measures, as well asthe distributions of the variables constituting each measure. Results con-firm the limited autonomy of women in all spheres, but suggest strong re-gional differences. Women from both northern sites—Uttar Pradesh andPunjab—fall significantly below women from Tamil Nadu in almost everymeasure of autonomy, a finding that strongly supports the argument thatthe north–south cultural divide described earlier powerfully conditions theextent of women’s autonomy. In contrast, there is far less support for thecommonly held assumption that Muslim women have less autonomy thanHindu women.
Women in general have limited economic decisionmaking authority:large numbers are excluded from even the most routine decisions, and fewhave the major say in any decision. There is a definite pattern to the kindsof decisions in which women participate: they are far more likely to be in-volved in decisions that are perceived as routine in the family economy,such as those relating to food purchases, than in decisions that involve ma-jor purchases. South Indian women exhibit far more decisionmaking au-thority than Punjabi or north Indian women. In contrast, there is no evi-dence of differences in decisionmaking authority among Hindus andMuslims.
Focus group discussions reiterate regional disparities in decisionmak-ing authority.5 Women in Punjab and Uttar Pradesh are far more likely thanTamilian women to recognize and justify their exclusion from householddecisions:
The husband is responsible; after him come the father-in-law and mother-in-law and then come the brothers of the husband. (Muslim, central Punjab)

700 W O M E N ’ S A U T O N O M Y I N I N D I A A N D P A K I S T A N
TABLE 4 Indexes of women’s autonomy in the study sample, by site (percentof respondents)
Uttar Pradesh Tamil Nadu
Punjab Muslim Hindu Muslima Hindu
Mobility: can go unescorted toFriend’s home 57.4 35.1 34.1 77.6 90.3Market or community center in village 35.4 34.8 34.7 81.7 94.7Health center 27.8 38.4 43.0 59.1 76.4Fair 7.9 16.8 19.3 20.9 41.8Neighboring village 11.5 20.2 22.0 15.0 33.5Index (maximum value = 5) 1.40 1.36 1.47 2.00 2.88
Economic decisionmakingParticipates in decisions
Food 71.2 17.8 18.3 84.4 89.0Jewelry 31.1 35.3 32.2 49.9 56.9Major goods 16.5 8.7 12.1 43.6 49.0
Is main decisionmakerFood 51.1 5.7 4.8 69.6 72.4Jewelry 6.9 5.2 4.5 9.3 11.1Major goods 4.6 1.4 0.9 9.5 11.8
Index (maximum value = 6) 1.82 0.74 0.73 2.67 2.90
Access to and control over economicresources
Has a say in household spending 59.0 80.1 75.0 88.9 93.5Gets money to spend 70.4 77.6 72.1 90.9 94.7Is free to purchase small jewelry 16.1 32.3 29.1 24.3 28.0Is free to purchase gifts for relatives 23.7 13.5 14.5 19.0 17.8Owns and controls householdvaluables 61.0 15.5 16.0 26.1 22.6
Plans to use own savings forfuture support 29.9 26.3 28.5 43.9 43.8
Has some say in disbursal of dowry 33.6 16.6 24.2 27.7 29.2Has major say in disbursal of dowry 28.9 23.8 18.0 61.0 62.2Index (maximum value = 7) 3.06 2.60 2.50 3.66 3.71
Freedom from threatHas been beaten by and fears husband 32.0 35.8 38.1 15.7 18.6Has been beaten by husband 34.5 41.6 47.8 35.8 38.6Fears husband 82.0 58.6 59.1 35.6 36.8Neither beaten by nor fears husband 14.9 35.7 26.3 44.3 43.3Index (maximum value = 3) 1.49 1.58 1.45 1.93 1.86
aWeighted to adjust for larger sample size of Ramnathpuram Muslims.

S H I R E E N J . J E J E E B H O Y / Z E B A A . S A T H A R 701
In our village, the woman does not have any value, so most of the decisionsare taken by men only. (Brahmin, Pratapgarh district, Uttar Pradesh)
We do not have any right to make decisions. The one who is uneducated,what decision could she take? She could only fight and quarrel. So it is rightthat the man alone takes decisions. (Jat, Meerut district, Uttar Pradesh)
Tamilian women, in contrast, are more involved in decisionmakingand are also more likely to believe that they are entitled to this authority:
Decisions should be taken jointly. A good decision can be made only whentaken together—three-quarters of the time, decisions are taken by men andone-quarter of the time, they are taken by women and men together. (Sched-uled caste, Ramnathpuram district, Tamil Nadu)
It is we who look after them [children] at home; they [husbands] go out towork, they don’t have the time to look after children, therefore it is the motherwho should take decisions. (Gounder caste, Coimbatore district, Tamil Nadu)
We [women] know more about the difficulties [of childrearing], we have theability to think and see, men don’t see, so we should take the decision re-garding children, thinking that tomorrow our children should not be like us,they should be more than us. (Gounder caste, Coimbatore district, Tamil Nadu)
That women have limited mobility is evident. First, of the five placesincluded in the index, the average woman can visit fewer than two placesunescorted. Second, as expected, there is greater freedom to visit nearby orrelatively friendly places such as the village market or community center,the health center, or the home of a relative or friend in the village thanother more remote places, such as a fair or an adjoining village. Third, re-sults point strongly to the north–south contrast: of the five places includedin the index, the average Tamilian woman can visit 2.4 unescorted, whereasthe average respondent from Uttar Pradesh and Punjab can visit only 1.4places without an escort. And finally, among north Indian respondents,Hindu and Muslim women’s freedom is about equally constrained, whereasTamilian Hindus have moderately greater mobility than Tamilian Muslims.
Women’s access to and control over resources is also limited. Whilethe majority of women have a say in how household income is spent andget cash to spend, few feel free to make small purchases of jewelry or giftson their own. Regional variation persists: Tamilian women are more likelyto have a say in the disbursement of household income and to get cash tospend compared to women from the other sites (about 90 percent com-pared to about 75 percent in Uttar Pradesh and 70 percent in Punjab). SouthIndian women are, however, as unlikely as women from other sites to feelfree to spend the household’s resources on themselves without permissionfrom their husbands or mothers-in-law.

702 W O M E N ’ S A U T O N O M Y I N I N D I A A N D P A K I S T A N
With regard to ownership and control over household valuables andown dowry, some interesting disparities emerge. In the two Indian settings,the majority of Tamilian women, compared to one-quarter of women fromUttar Pradesh, report owning land or household valuables “in their ownname” (not shown here). Tamilian women, however, are considerably morelikely than women from Uttar Pradesh to report also that these are ownedjointly with their husbands and hence that they would not be able to con-trol the disbursal of these assets without the consent of their husbands. Incontrast, Tamilian women, whose dowries are predominantly in the formof gold and jewelry, are considerably more likely to report owning and con-trolling their dowries than are women from Uttar Pradesh (whose dowriesare more likely to consist of household goods). The situation in Punjab isdifferent. Punjabi women in our sample come from higher-income house-holds, and over three-fifths of them report owning and controlling house-hold valuables, some of which come from their dowries, as in the case ofwomen from Uttar Pradesh. As a result of these different patterns, profilesof control over resources also vary. Punjabi women appear more likely toown and control valuables than women from Uttar Pradesh or Tamil Nadu.Yet it is Tamilian women who report greater control over their dowries.And when asked about plans for supporting themselves in the future, it isonce more Tamilian women who are most likely to report expectation ofself-reliance. Despite these differences in patterns of control, the index ofaccess to and control over resources suggests again that Tamilian womenare better off than women from Uttar Pradesh and Punjab. Average scoresrange from 2.5–2.6 (of a possible 7.0) in Uttar Pradesh to 3.1 in Punjab andto 3.7 in Tamil Nadu.
In comparison to the regional disparities recorded for decisionmaking,freedom of movement, and access to and control over economic resources,regional variation in women’s freedom from threat is muted. The index offreedom from threat suggests that south Indian women are slightly freerfrom threat than are northern women from Uttar Pradesh or Punjab.
Focus group discussions underscore the extent to which women inboth settings accept these unequal power relations, and accept beating asthe husband’s prerogative (see Jejeebhoy 1998; Jejeebhoy and Cook 1997).The general impression is that women who are disobedient or who “misbe-have” deserve to be beaten.
A woman is beaten if she does not wash her husband’s clothes, does not cookfood or quarrels with the husband’s mother and sister or argues with thehusband. If the work is done properly the husband does not beat her. (Mus-lim, barani region, Punjab)
If she has committed a sin she should be beaten, although many women arebeaten without any reason. (Muslim, central Punjab)

S H I R E E N J . J E J E E B H O Y / Z E B A A . S A T H A R 703
Beating is for the woman’s own good. If she does something wrong, losessomething, or hits children in anger, the husband must show her [by beat-ing]. (Brahmin, Pratapgarh district, Uttar Pradesh)
If it is a great mistake, then the husband is justified in beating his wife. Whynot? A cow will not be obedient without beatings. (Muslim, Ramnathpuramdistrict, Tamil Nadu)
Even so, Tamilian women argue for greater understanding and less force:
The husband should not beat his wife. He should advise her. It is better toadvise than to beat. (Muslim, Ramnathpuram district)
Men should not beat their wives. But being born as females, we should listento what our husbands say. (Scheduled caste, Ramnathpuram district)
In summary, women in Tamil Nadu have significantly more decision-making authority, mobility, and access to and control over resources thanwomen from Uttar Pradesh and Punjab and somewhat more balanced powerrelations with their husbands. A comparison between women in UttarPradesh and Punjab, however, suggests greater similarities: while Punjabiwomen have more decisionmaking authority and access to and control overresources than women from Uttar Pradesh (irrespective of religion), indexesof mobility and freedom from threat are virtually identical for the twosamples. Such findings offer strong support for the argument that regionrather than religion has the stronger influence on women’s autonomy inSouth Asia.
Dimensions and determinants ofwomen’s autonomy
In patriarchal contexts, tight controls are exerted on women in every sphereof their lives: their free movement, their voice in family affairs, their eco-nomic independence, and their relations with their husbands. In the ab-sence of direct data relating to women’s autonomy, previous studies haverelied on a number of available indicators—years of education, work forceparticipation, marital age, and spousal age difference in particular—as proxiesfor autonomy. On a policy level, moreover, it is often assumed that en-hancing women’s educational attainment and economic activity status andraising their marital age can directly increase their autonomy and the ex-tent to which they have a say in matters concerning their own lives. Ourdataset allows us to assess the effect of these proxies on the various dimen-sions of women’s autonomy. We have constructed a summary index of au-tonomy. This index sums values in the four indexes discussed above and

704 W O M E N ’ S A U T O N O M Y I N I N D I A A N D P A K I S T A N
shown in Table 4. Values on each index are standardized to vary between 0and one; the summary index then combines each of these four values andthus ranges from 0 to 4.
Table 5 presents the results of regression analyses (OLS), which re-gress the summary index of autonomy on three sets of factors assumed tomeasure autonomy. The first set includes indicators usually assumed to mea-sure women’s autonomy, that is, education and wage-work status. The sec-ond includes other factors that may affect women’s status in the gender-stratified settings of South Asia: age, parity, residence pattern, and size ofdowry (in equivalent US dollars). The third is household economic status(as measured by the number of consumer goods owned). For Indian data,moreover, community-level factors (district, religion, state) are included amongthe explanatory variables. Results are presented for all women in Punjab (Pa-kistan) and separately for women from Uttar Pradesh and Tamil Nadu.
The most striking result of Table 5 is the different pattern of correlatesaffecting dimensions of autonomy in Punjab and Uttar Pradesh, on the onehand, and Tamil Nadu on the other. Also notable within each setting is thatthe summary index of autonomy appears to be explained by a different setof determinants. And third, socio-cultural context does indeed appear tocondition the relationship of several correlates with autonomy, as evidentfrom our study sample.
Determinants of the summary index of autonomy highlight the differ-ent patterns in the three sites. In Uttar Pradesh and Punjab, traditional mea-sures of autonomy are far more powerful determinants of this index thanthey are in Tamil Nadu. In both Punjab and Uttar Pradesh, significant de-
TABLE 5 Correlates of the summary index of women’s autonomy inthe study sample: OLS regression coefficients, by site
UttarPunjab Pradesh Tamil Nadu
Attended primary school 0.07 0.10 0.17**Attended secondary school 0.31** 0.19* 0.35**Wage work in last 12 months 0.02 0.29** 0.08†
Age 0.02** 0.02** 0.03**Number of surviving sons 0.01 0.04* –0.02Number of surviving daughters –0.03† 0.02 –0.02Resides with mother-in-law/extended family –0.30** –0.17** –0.06Size of dowry ($) 0.0002** 0.0002** 0.0001Number of goods owned 0.04** 0.05** 0.02*District (ref.=less developed) –0.03 0.04Religion (ref.=Muslim) –0.10* 0.19**Constant 0.89** 0.57** 1.04**Adjusted R-squared 0.13 0.17 0.12
ref. = reference category. ** p<=.01 * p<=.05 † p<=.10

S H I R E E N J . J E J E E B H O Y / Z E B A A . S A T H A R 705
terminants of this summary index include coresidence with mother-in-law,size of dowry, and age; additionally in Uttar Pradesh, autonomy is linkedpositively to the number of sons a woman has, and in Punjab it is relatednegatively to the number of daughters she has. In Tamil Nadu, by contrast,the only traditional factor to play a significant role is age.
Education and wage-work status are also significant determinants ofthe autonomy index, but their influence is generally stronger in Tamil Naduthan in the two northern sites. While in Tamil Nadu even a primary educa-tion significantly influences this index, in the other two sites it is not until asecondary education is attained that autonomy is significantly enhanced.And while wage-work status influences autonomy in all three settings, itsinfluence is most significant in Uttar Pradesh. Finally, economic status isuniformly associated with autonomy in each site.
There is considerable regional variation in the determinants of otherautonomy indicators (data not presented). Within each site, however, a rela-tively common set of socio-cultural factors is important in defining at leastthree indicators of autonomy, namely, decisionmaking authority, mobility,and access to and control over resources. These socio-cultural factors areeconomic activity, age, coresidence with mother-in-law, and size of dowryin Uttar Pradesh; family structure, age, and less consistently secondary edu-cation and wage work status in Punjab; and education, work status, age,and, to a lesser extent, coresidence with mother-in-law in Tamil Nadu.6
Our results therefore suggest that traditional factors conferring authorityon women—age, marital duration, number of surviving sons, nuclear fam-ily residence, and dowry—have a more powerful effect on women’s au-tonomy in Uttar Pradesh and Punjab, the settings with wider gender dis-parities, than in Tamil Nadu, where gender relations are more egalitarian.In contrast, in Tamil Nadu, education (even a primary education) plays aprominent role in enhancing almost every dimension of autonomy; wagework has a positive but less consistent effect. In Uttar Pradesh and Punjab,while both education and especially wage-work status enhance aspects ofautonomy, their effect is less consistent.
Influences of region and religion onwomen’s autonomy
The findings discussed above suggest that socio-cultural and regional con-text makes a difference in shaping factors that determine women’s autonomyin South Asia. Our dataset enables us to discern, moreover, the extent towhich such contextual factors as region, religion, and nationality play a rolein determining the four selected components and the combined index offemale autonomy in the subcontinent. In Table 6, data from the three sitesare pooled, and the regression analysis performed in Table 5 is repeated.The aim is to focus directly on the three contextual factors.
706 W O M E N ’ S A U T O N O M Y I N I N D I A A N D P A K I S T A N
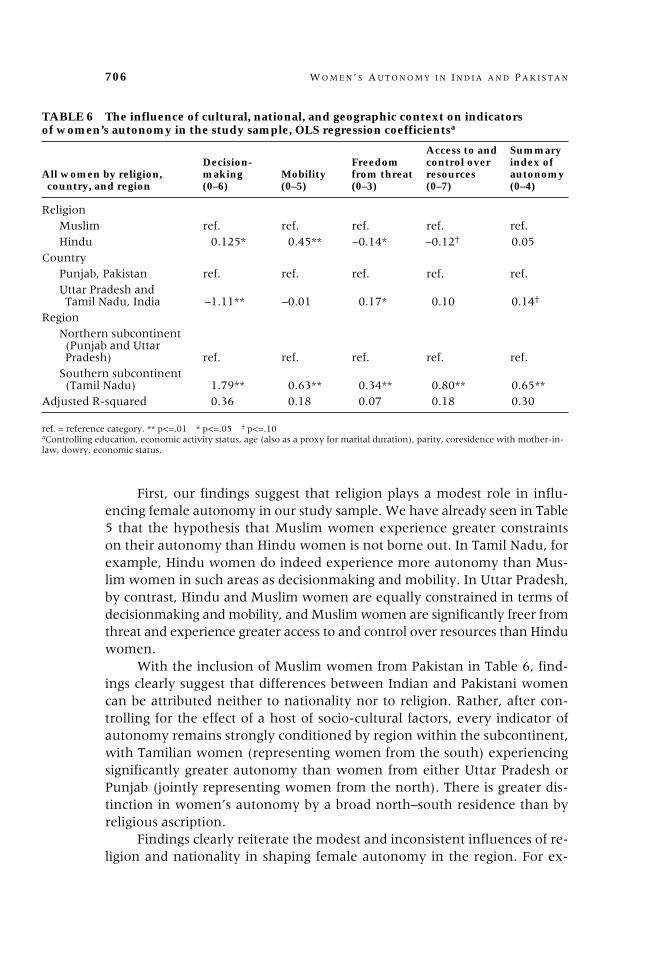
First, our findings suggest that religion plays a modest role in influ-encing female autonomy in our study sample. We have already seen in Table5 that the hypothesis that Muslim women experience greater constraintson their autonomy than Hindu women is not borne out. In Tamil Nadu, forexample, Hindu women do indeed experience more autonomy than Mus-lim women in such areas as decisionmaking and mobility. In Uttar Pradesh,by contrast, Hindu and Muslim women are equally constrained in terms ofdecisionmaking and mobility, and Muslim women are significantly freer fromthreat and experience greater access to and control over resources than Hinduwomen.
With the inclusion of Muslim women from Pakistan in Table 6, find-ings clearly suggest that differences between Indian and Pakistani womencan be attributed neither to nationality nor to religion. Rather, after con-trolling for the effect of a host of socio-cultural factors, every indicator ofautonomy remains strongly conditioned by region within the subcontinent,with Tamilian women (representing women from the south) experiencingsignificantly greater autonomy than women from either Uttar Pradesh orPunjab (jointly representing women from the north). There is greater dis-tinction in women’s autonomy by a broad north–south residence than byreligious ascription.
Findings clearly reiterate the modest and inconsistent influences of re-ligion and nationality in shaping female autonomy in the region. For ex-
TABLE 6 The influence of cultural, national, and geographic context on indicatorsof women’s autonomy in the study sample, OLS regression coefficientsa
Access to and SummaryDecision- Freedom control over index of
All women by religion, making Mobility from threat resources autonomycountry, and region (0–6) (0–5) (0–3) (0–7) (0–4)
ReligionMuslim ref. ref. ref. ref. ref.Hindu 0.125* 0.45** –0.14* –0.12† 0.05
CountryPunjab, Pakistan ref. ref. ref. ref. ref.Uttar Pradesh andTamil Nadu, India –1.11** –0.01 0.17* 0.10 0.14†
RegionNorthern subcontinent(Punjab and UttarPradesh) ref. ref. ref. ref. ref.
Southern subcontinent(Tamil Nadu) 1.79** 0.63** 0.34** 0.80** 0.65**
Adjusted R-squared 0.36 0.18 0.07 0.18 0.30
ref. = reference category. ** p<=.01 * p<=.05 † p<=.10aControlling education, economic activity status, age (also as a proxy for marital duration), parity, coresidence with mother-in-law, dowry, economic status.
S H I R E E N J . J E J E E B H O Y / Z E B A A . S A T H A R 707
ample, as far as religion is concerned, Hindu women have about as muchautonomy (as measured by the summary index) as Muslim women do, par-ticularly in the areas of access to and control over resources; Hindu women,however, have significantly more decisionmaking authority and mobility,and significantly less freedom from threat. Nationality, similarly, has an in-consistent influence: after controlling for region and religion and other socio-cultural factors, Indian women appear to have less decisionmaking powerthan do Pakistani women, greater freedom from threat, and about as muchmobility and access to and control over resources.
In contrast, region plays a strong and consistent role in shaping fe-male autonomy. No matter which indicator of autonomy is considered,women residing in the southern part of the subcontinent consistently dis-play significantly higher levels of autonomy than do women residing in thenorth. Moreover, the influence of social system, as measured by region, inalmost every case is far stronger than that of religion or nationality.
Conclusions and discussion
Our findings, based on a sample from Pakistan’s Punjab Province and fromtwo Indian states, indicate that women’s autonomy—in terms of decision-making, mobility, freedom from threatening relations with husband, andaccess to and control over economic resources—is highly constrained in Pa-kistan and in north and south India. Findings suggest that South Asianwomen are largely excluded from family decisionmaking; they have lim-ited access to, and exercise limited control over resources; their freedom ofmovement is severely constrained; and few are free from threat and vio-lence at the hands of their husbands.
Our findings also confirm considerable variation in the levels and de-terminants of women’s autonomy in this region. The evidence suggests thatin the more gender-stratified settings of Uttar Pradesh and Punjab, autonomyis largely the result of factors that traditionally confer status, notably familystructure or absence of controls implicit in coresidence with mother-in-lawand size of dowry, along with economic activity (in Uttar Pradesh) and asecondary education (in Punjab). In contrast, in the more egalitarian set-ting of Tamil Nadu, education and to a lesser extent economic activity arepowerful determinants of almost every indicator of autonomy. Traditionalforces such as coresidence with mother-in-law and dowry continue to af-fect several measures of autonomy, but these effects are generally modest.The implication, in short, is that in the highly stratified settings of ruralUttar Pradesh and Punjab, autonomy continues to be shaped largely by tra-ditional factors. Although secondary education in Punjab and economic ac-tivity in Uttar Pradesh tend to enhance autonomy also, their effects are lessconsistent, so that they may be relatively poor proxies for autonomy. InTamil Nadu, by contrast, education and to a lesser extent economic activity
708 W O M E N ’ S A U T O N O M Y I N I N D I A A N D P A K I S T A N
tend to raise almost every indicator of autonomy, and the use of educationin particular as a proxy for women’s autonomy is more justified. These find-ings suggest that the cultural context—operationalized here by region—in-fluences the factors associated with autonomy, and they argue for context-specific measures of women’s autonomy.
Our findings demonstrate the centrality of social institutions of genderwithin each community, as defined here by region of South Asia—ratherthan primacy of religion or nationality—in shaping women’s autonomy. Aclear regional divide, net of individual and household characteristics, is evi-dent in almost every index of autonomy: decisionmaking authority, mobil-ity, access to and control over economic resources, and, to a lesser extent,freedom from threat by husbands. Women in Tamil Nadu experience fargreater autonomy than women in either Uttar Pradesh or Punjab. Also strik-ing are the similarities in female autonomy in Uttar Pradesh in India andPunjab in Pakistan. Most convincing are findings from the pooled regres-sion analysis, demonstrating the relative strength of the prevailing socialsystem, as operationalized by region, in conditioning female autonomy lev-els in the subcontinent.
In comparison, the influences of religion and nationality are less con-sistent and powerful. There is little support for the argument that Muslimwomen are disadvantaged in terms of autonomy, at least when comparedto Hindu women from the same region. For example, the pooled regressionanalysis provides further evidence that once region and nationality are con-trolled, the influence of religion is moderate and inconsistent. Also, a com-parison of Hindu and Muslim women in the Indian sample, and a compari-son of Indian and Pakistani women in the pooled sample suggest that, onceregion is controlled, levels of autonomy are not very different among Hin-dus and Muslims. In South India, however, there is moderate support forthe argument that Hindu women have greater autonomy than Muslimwomen. In Uttar Pradesh, by contrast, Hindu–Muslim differences in everydimension of autonomy are insignificant. When women from all three sitesare considered, Tamilian Muslims exhibit far greater levels of autonomythan do either Hindu or Muslim respondents from Uttar Pradesh and re-spondents from Punjab.
Some political and literary commentators have argued that religionremains an important part of the explanation of social conservatism in thesubcontinent and that the greater conservatism in north India can be datedto the advent of Islam in the northern part of the subcontinent and theestablishment of Muslim culture there. Furthermore, in contrast, the directinfluence of Islam has been modest in the south and Hindu culture hasdominated there. This view has been questioned by a number of scholars.For example, as Dyson and Moore (1983: 47) argued: “[W]e note the gen-eral view of scholars that both the essential features of the regional differ-
S H I R E E N J . J E J E E B H O Y / Z E B A A . S A T H A R 709
This article was written with the support of theRockefeller Foundation, for a project entitled“Gender and reproductive health in India andPakistan.” The support of the Foundation isgratefully acknowledged. This is part of a largerstudy of five Asian countries (India, Malaysia,Pakistan, the Philippines, and Thailand), withsupport from the Andrew W. Mellon Foun-dation (India) and the Rockefeller Foundation(Pakistan).
1 A profile of the ten communities inPunjab underscores their agro-ecological andsocioeconomic differences. Corresponding dif-ferences are also observed in farming systems,employment, and land ownership patterns. Inthe northern rainfed (barani) regions, landownership is broad based, with a large major-ity of households owning small parcels of land.Agriculture does not offer a reliable and ad-equate source of income, is constrained by theuncertainty of water supply, and is chieflygeared to subsistence production with the main
crops being wheat, maize, and millet. A largeproportion of men are employed in nonagri-cultural occupations, particularly in the armedforces, and in formal-sector jobs including inthe nearby urban center; subsistence agricul-tural production is managed largely by women.
The northern semi-irrigated villages aresimilar to the northern barani areas except thatsome cash crops are grown and land owner-ship is more concentrated. In contrast, in thecanal-irrigated communities of central andsouthern Punjab, agriculture is market ori-ented and a lucrative source of income. It isalso more feudal, with land concentratedamong a small proportion of the population.Whereas central Punjab is characterized by asubstantial number of medium-sized farms,southern Punjab contains large farmers andfeudal lords. It is not unusual, in southernPunjab, for a family of large landlords to ownthe entire agricultural and residential area ofcertain villages. Correspondingly, households
ences in kinship…, and their broad geographical distribution, are of verylong standing. It is widely held that they mostly predate the Muslim pres-ence, reflecting instead basic differences between northern ‘Aryan’ andsouthern ‘Dravidian’ culture areas.” Our finding that, once region is con-trolled, differences in autonomy between Hindu and Muslim women aremodest is consistent with this latter view.
Our findings also have implications for policy. In particular, the find-ings that education and employment do not necessarily enhance women’sautonomy and that traditional factors conferring status on women remainstrong suggest that strategies to enhance women’s autonomy need to ex-pand beyond education, employment, and delayed marriage. More com-prehensive, direct, and context-specific strategies to increase women’s au-tonomy must simultaneously be sought. These include raising women’sgender consciousness, enabling women to mobilize and access communityresources and public services, providing support for challenging traditionalnorms that underlie gender inequities, facilitating the acquisition of usablevocational and life skills, enhancing women’s access to and control overeconomic resources, and enabling women to establish and realize their rights(see, for example, United Nations 1995; Batliwala 1994; Mahmud andJohnston 1994; World Health Organization and UNICEF 1994). These strat-egies are particularly important for the northern cultures of the subconti-nent—whether Pakistani or north Indian, whether Hindu or Muslim.
Notes

710 W O M E N ’ S A U T O N O M Y I N I N D I A A N D P A K I S T A N
in central Punjab have greater access to urbanwhite-collar employment than do those in thesouth.
2 A profile of the eight communities inIndia also highlights considerable heterogene-ity. In Uttar Pradesh, Pratapgarh district, in theeast, is a poor, largely wheat-producing area,with few amenities; while theoretically avail-able, health and educational facilities functiononly sporadically. Brahmins represent thedominant Hindu caste. In contrast, Meerut dis-trict is very well off: its main crop is sugarcane,although wheat, millet, and maize are also pro-duced. Our sample sites lie in relatively closeproximity to the main town, and less than 100km from New Delhi. Amenities and servicesare largely available, as are a host of privatehealth and educational facilities. Jats are themain Hindu caste.
In Tamil Nadu, Ramnathpuram district lieson the southeastern coast. Palmyra is the maincrop, and occupations revolve around tendingplantations, cutting down and marketing co-conuts, and processing fiber. Villages tend tobe poorly connected by roads, have severewater supply problems, and are often reducedto depending on rain and river water. Schooland health facilities exist in, or within walk-ing distance of, most villages and, by and large,function regularly. In contrast, Coimbatore isone of the richest districts of Tamil Nadu: itsmain crops are cotton and groundnut. Trans-portation, communication, and other ameni-ties are of good quality; piped water is avail-able in many villages. The main Hindu castesof Ramnathpuram and Coimbatore are, respec-tively, Nadars and Gounders, both from theupper castes.
In each selected taluka, village lists weredrawn up; these included information on thetotal number of households in each village byreligion and caste. In order to adequately rep-resent Muslims and scheduled caste house-holds, contiguous villages were merged intosampling units of roughly 1,000–2,000 house-holds, in a way that would allow for adequaterepresentation of the different groups in ourdesign. As a result, in Tamil Nadu, where thereare generally few Muslims, clusters of villageswere much larger than in Uttar Pradesh, whereMuslims represent a substantial proportion ofthe population. The primary sampling unit(PSU) included in the sample was then selectedrandomly.
In Tamil Nadu, the selected PSU contained12 villages from Pollachi (Coimbatore district)and 15 from Mudukulathur (Ramnathpuramdistrict). The selected PSUs in Uttar Pradeshcontained fewer villages: 7 from Kunda(Pratapgarh district) and two large villages(with many “petis,” or identifiable clusters) inBaghpat (Meerut district). Each household inthe selected cluster of villages was listed andthis list constituted the sampling frame. Thedifference in the number of villages selectedin each state is attributed to the following: (1)village sizes tend to be larger in Uttar Pradeshthan in Tamil Nadu, and (2) since Muslimsconstitute less than 10 percent of the popula-tion of Tamil Nadu, a larger number of villageswas required in order to reach our target com-position of respondents.
3 A limitation of the index of decision-making authority is that the way it weightswomen’s participation raises equivalence prob-lems with certain scores where it could be sug-gested that having the major say in fewer de-cisions yields more autonomy than merelyparticipating (but not having the major say)in many.
4 The decision to assign a value of 2 (lowerautonomy) to women who fear but are notbeaten by their husbands, and 1 to those whoare beaten but do not fear their husbands(more autonomy) was made on the basis offocus group discussions: women spoke of fear-ing husbands as a way of showing respect tothem and of endeavoring not to displease ordisobey them. Beating was described, however,as a humiliating experience, in which hus-bands demonstrate their displeasure with thefailings of their wives; and members of thecommunity tend to see women who werebeaten as having been disobedient.
5 The quotations from women that followwere translated from the original Urdu andHindi by the research teams.
6 The remaining two indicators of autonomy(freedom from threat and control over resources)are defined by a somewhat different group ofsocio-cultural factors. A look at the determinantsof freedom from threat suggests quite diverse in-ter-site patterns. In Uttar Pradesh, for example,larger family size appears to enhance freedomfrom threat; in Tamil Nadu and Punjab, by con-trast, women with many children have moreunequal relations with their husbands than low-

S H I R E E N J . J E J E E B H O Y / Z E B A A . S A T H A R 711
References
Altekar, Anant S. 1962. The Position of Women in Hindu Civilization, from Prehistoric Times to thePresent Day. Delhi: Motilal Banarasidass.
Batliwala, Srilatha. 1994. “The meaning of women’s empowerment: New concepts fromaction,” in Gita Sen, Adrienne Germain, and Lincoln C. Chen (eds.), Population PoliciesReconsidered: Health, Empowerment, and Rights. Cambridge, MA: Harvard Center for Popu-lation and Development Studies.
Basu, Alaka Malwade. 1992. Culture, the Status of Women, and Demographic Behaviour: Illus-trated with the Case of India. Oxford: Clarendon Press.
Cain, Mead, Syeda Rokeya Khanam, and Shamsun Nahar. 1979. “Class, patriarchy, andwomen’s work in Bangladesh,” Population and Development Review 5(3): 405–438.
Caldwell, John C. 1979. “Education as a factor in mortality decline: An examination ofNigerian data,” Population Studies 33(3): 395–413.
———. 1986. “Routes to low mortality in poor countries,” Population and Development Re-view 12(2): 171–220.
Caldwell, John C., P. H. Reddy, and Pat Caldwell. 1982. “The causes of demographic change inrural South India: A micro approach,” Population and Development Review 8(4): 689–727.
Das Gupta, Monica. 1987. “Selective discrimination against female children in rural Punjab,India,” Population and Development Review 13(1): 77–100.
Dixon, Ruth B. 1978. Rural Women at Work: Strategies for Development in South Asia. Balti-more: Johns Hopkins University Press.
Dube, Leela. 1988. “On the construction of gender: Hindu girls in patrilineal India,” Eco-nomic and Political Weekly 23(18): WS11–WS19.
Dyson, Tim and Mick Moore. 1983. “On kinship structure, female autonomy, and demo-graphic behavior in India,” Population and Development Review 9(1): 35–60.
Hakim, Abdul, John Cleland, and Mansoor ul Hassan Bhatti. 1999. Pakistan Fertility andFamily Planning Survey 1996–97 (Main report). Islamabad: National Institute of Popula-tion Studies.
Jejeebhoy, Shireen J. 1995. Women’s Education, Autonomy, and Reproductive Behaviour: Experi-ence from Developing Countries. Oxford: Clarendon Press.
———. 1998. “Wife-beating in rural India: A husband’s right? Evidence from survey data,”Economic and Political Weekly 33(15): 855–862.
———. 2000. “Women’s autonomy in rural India: Its dimensions, determinants, and theinfluence of context,” in Harriet B. Presser and Gita Sen (eds.), Women’s Empowermentand Demographic Processes: Moving Beyond Cairo. New York: Oxford University Press.
———. 2001. “Women’s autonomy and reproductive behaviour in India,” in Zeba AyeshaSathar and James F. Phillips (eds.), Fertility Transition in South Asia. Oxford: OxfordUniversity Press.
Jejeebhoy, Shireen J. and Rebecca J. Cook. 1997. “State accountability for wife-beating:The Indian challenge,” Lancet 349 Suppl. 1: S110–S112.
Karve, Irawati. 1965. Kinship Organization in India. Bombay: Asia Publishing House.Kazi, Shahnaz and Zeba A. Sathar 2001. “The relative roles of gender and development in
explaining fertility in rural Punjab,” in Zeba Ayesha Sathar and James F. Phillips (eds.),Fertility Transition in South Asia. Oxford: Oxford University Press.
Kishor, Sunita. 2000. “Empowerment of women in Egypt and links to the survival and
parity women. While education clearly enhancesfreedom from threat, its influence is most pow-erful, as expected, in Tamil Nadu. In Punjab, whilewage-earning work is associated with greater vio-lence, size of dowry appears to free women from
the threat of violence. Finally, and particularly inthe two Indian sites, women from better-offhouseholds tend to report greater freedom fromthreat than other women.

712 W O M E N ’ S A U T O N O M Y I N I N D I A A N D P A K I S T A N
health of their infants,” in Harriet B. Presser and Gita Sen (eds.), Women’s Empower-ment and Demographic Processes: Moving Beyond Cairo. New York: Oxford University Press.
Mahmud, Simeem and Anne M. Johnston. 1994. “Women’s status, empowerment, andreproductive outcomes,” in Gita Sen, Adrienne Germain, and Lincoln C. Chen (eds.),Population Policies Reconsidered: Health, Empowerment, and Rights. Cambridge, MA: Har-vard Center for Population and Development Studies.
Mandelbaum, David, G. 1986. “Sex roles and gender relations in North India,” Economicand Political Weekly 21(46) (15 November).
Mason, Karen Oppenheim. 1984. The Status of Women: A Review of Its Relationships to Fertilityand Mortality. New York: The Rockefeller Foundation.
———. 1993. “The impact of women’s position on demographic change during the courseof development,” in Nora Federici, Karen Oppenheim Mason, and Sølvi Sogner (eds.),Women’s Position and Demographic Change. Oxford: Clarendon Press.
Mason, Karen Oppenheim et al. 1995. “Determinants of women’s power and autonomy infive Asian countries,” paper presented at the Annual Meeting of the Population Asso-ciation of America, San Francisco.
Morgan, S. Philip and Bhanu B. Niraula. 1995. “Gender inequality and fertility in two Nepalivillages,” Population and Development Review 21(3): 541–561.
Obermeyer, Carla Makhlouf. 1992. “Islam, women, and politics: The demography of Arabcountries,” Population and Development Review 18(1): 33–60.
Population Research Centre, Gandhigram Institute of Rural Health and Family Welfare Trust,and International Institute for Population Sciences, Bombay. 1994. National Family HealthSurvey: Tamil Nadu 1992. Bombay: International Institute for Population Sciences.
Population Research Centre, Lucknow University, and International Institute for Popula-tion Sciences, Bombay. 1994. National Family Health Survey: Uttar Pradesh 1992–93.Bombay: International Institute for Population Sciences.
Radcliffe-Brown, A. R. 1952. Structure and Function in Primitive Society: Essays and Addresses.London: Cohen & West.
Rao, Vijayendra and Francis Bloch. 1993. “Wife-beating, its causes and its implications fornutrition allocations to children: An economic and anthropological case study of arural south Indian community,” World Bank, Policy Research Department, Povertyand Human Resources Division, Washington, DC.
Sathar, Zeba Ayesha and Shahnaz Kazi. 2000. “Women’s autonomy in the context of ruralPakistan,” Pakistan Development Review 39(2): 89–110.
United Nations. 1995. Programme of Action of the International Conference on Population andDevelopment, 1994. New York.
Visaria, Leela. 1996. “Regional variations in female autonomy and fertility and contracep-tion in India,” in Roger Jeffery and Alaka M. Basu (eds.), Girls’ Schooling, Women’sAutonomy and Fertility Change in South Asia. New Delhi: Sage Publications.
Vlassoff, Carol. 1992. “Progress and stagnation: Changes in fertility and women’s positionin an Indian village,” Population Studies 46(2): 195–212.
World Health Organization (Health Promotion Unit, Division of Mental Health) and UNICEF(Health Promotion Unit). 1994. The Development and Dissemination of Life Skills Educa-tion: An Overview. Geneva and New York: WHO/UNICEF.