women & men in india€¦ · shri rakesh kumar maurya deputy director general shri kanishk kant...
TRANSCRIPT


Women & Men in India (A statistical compilation of Gender related Indicators in India)
2019
21st Issue
Social Statistics Division
National Statistical Office Ministry of Statistics and Programme Implementation
Government of India

FOREWORD
Promoting gender equality has been a key priority of the Government and is also plays a focal role in the
Sustainable Development Goals (SDG) Agenda 2030. Gender statistics cuts across all areas of official statistics and
provides a lens for policy makers to evolve targeted strategies to address gaps and bridging the gender-based disparities.
The National Statistical Office has been bringing out "Women and Men in India" as an annual publication since 1995
and the current issue is the twenty first in the series. In each release, efforts are made to improve its coverage and
presentation by incorporating latest available information in different domains of the Government and also based on the
inputs and feedback of the varied users. In the current issue, information on a minimum set of gender indicators has
been incorporated in the publication so as to accelerate existing efforts to generate internationally comparable gender
indicators on health, education, employment, entrepreneurship and asset ownership.
I am confident that this publication would be useful to planners, policy makers, researchers and academicians to
recognize the impact of policy interventions and suggest measures to reduce gender disparities as India moves towards
achieving the Sustainable Development Goals.
We look forward to comments and suggestions for improving the quality and coverage of information presented
in this publication.
(Pravin Srivastava)
Dated: 31.03.2020
Place : NewDelhi

PREFACE
Gender equality has been widely recognized as a prerequisite for achieving national and international
development goals. Gender statistics provide the present status of the socioeconomic situation of women and men, and
girls and boys. It’s also providing an essential tool for raising awareness about gender issues and highlighting concerns
about gender disparities.
The National Statistical Office (NSO) has endeavored to focus in this publication on such crucial statistical
indicators of socio-economic relevance as are deemed best in portraying gender inequality, gender bias and gender
discrimination. The statistical tables of these indicators provide footprints of progress of the country for tracking by
national and international agencies. NSO has been bringing out a publication entitled "Women and Men in India" on
annual basis. The current issue is the twenty first in the series and efforts have been made to improve its coverage and
presentation by incorporating latest available information published by the different Ministries/Departments/
Organizations.
The publication has been prepared in the Social Statistics Division of the National Statistical Ofce under the
overall supervision and guidance of Dr. Shailja Sharma, Additional Director General. I wish to place on record my
sincere appreciation for the team of officers for their contribution in bringing out this publication.
I hope that the publication would be useful to the users and feedback on improving future publications are
solicited.
(Tapas Kumar Sanyal)
Dated : 31.03.2020
Place: New Delhi

डॉ. शैलजाशर्ाा DR. SHAILJA SHARMA Additional Director General Ph: 91-11-26108529 E-mail: [email protected]
MESSAGE The publication ‘Women and Men in India’ presents a holistic view of the situation of women in India and
includes data on major indicators pertaining to women and men. In the Beijing Declaration adopted in the Fourth World
Conference on Women (1995), participating Governments "determined to advance the goals of equality, development
and peace for all women everywhere in the interest of all humanity". Government of India too, recognizes that
development cannot be sustainable or equitable unless it accounts for gender, and women in particular would be the
worst casualties of such unfair progress. It is well known that women’s issues are complex, not easily recognized
and often reflect conditions of grievous social evils. In developing countries like India women contribute to local and
national development in a very big way despite being under-nourished, underpaid and over-worked. Furthermore, when
one takes into account the multiple roles of women, one tends to ignore women’s non-domestic roles working double-
shifts with their unpaid domestic work.
Goal 5 of the Sustainable Development Goals (SDGs) is dedicated to “Achieve gender equality and empower all
women and girls”. The Inter-Agency and Expert Group on Gender Statistics (IAEG-GS), constituted by United Nations
Statistics Division (UNSD), has also developed global minimum set of gender indicators for the national production and
international compilation of gender statistics. The country is making efforts to compile appropriate gender statistics to
report the data on globally and nationally identified indicators which helps in pursuing the SDG’s underlying objective
of “Leaving No One Behind”.
The Social Statistics Division (SSD) has endeavored to focus in this publication on such crucial statistical
indicators of socio-economic relevance as are deemed best in portraying gender inequality, gender bias and gender
discrimination. The engendered statistical tables of these indicators provide footprints of progress of the country for
tracking by national and international agencies.
I hope the publication would be extremely useful to planners, policy makers, research workers and
academicians. Suggestions for improvement in the publication will be highly appreciated.
(Shailja Sharma)
Dated : 31.03.2020
Place : New Delhi
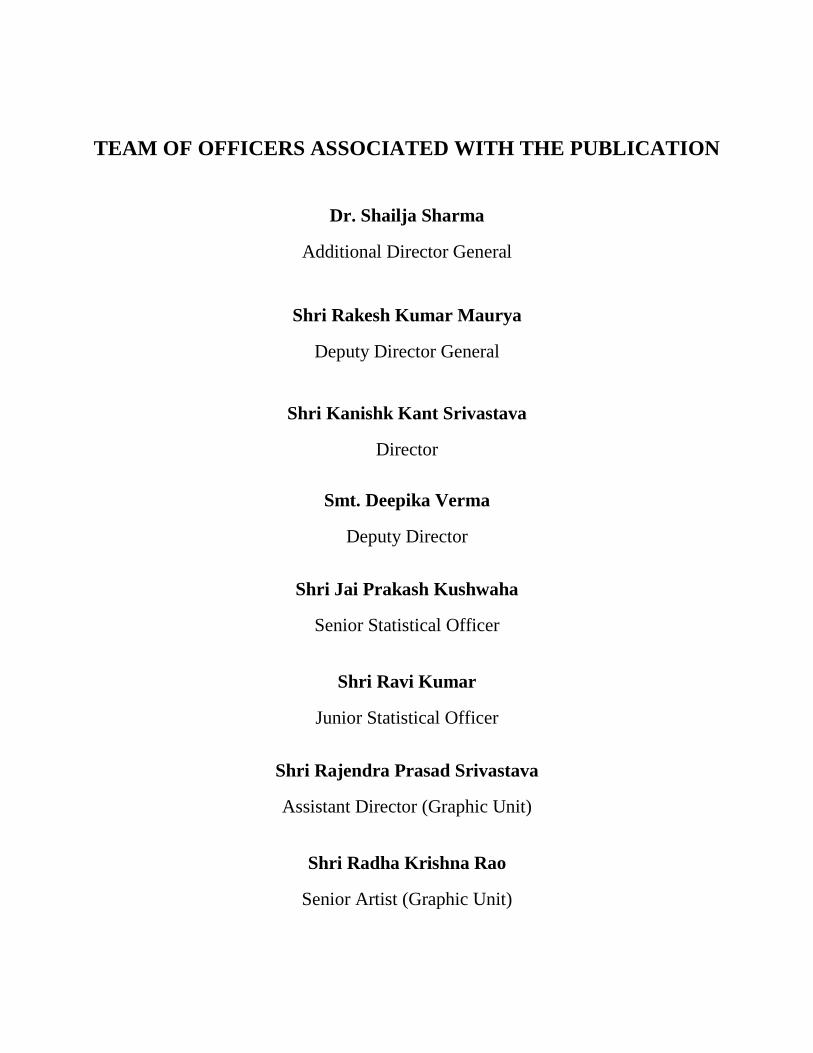
TEAM OF OFFICERS ASSOCIATED WITH THE PUBLICATION
Dr. Shailja Sharma
Additional Director General
Shri Rakesh Kumar Maurya
Deputy Director General
Shri Kanishk Kant Srivastava
Director
Smt. Deepika Verma
Deputy Director
Shri Jai Prakash Kushwaha
Senior Statistical Officer
Shri Ravi Kumar
Junior Statistical Officer
Shri Rajendra Prasad Srivastava
Assistant Director (Graphic Unit)
Shri Radha Krishna Rao
Senior Artist (Graphic Unit)

CONTENTS
HIGHLIGHTS.........................................................................................................................................................................i-viii
Chapter 1. Population and related Statistics .................................................................................................................................. 1
Table 1.1 : Trend in Population, Sex Ratio and Average Annual Growth Rate of Population of Post Independence India ............ 1
Table1.2 : State-wise Percent Share of Female Population in Total Population and Sex Ratio- 2011 ........................................... 2
Table1.3 : Year-wise State-wise Sex Ratio in post Independent India ......................................................................................... 3
Table1.4 : Sex ratio in the Age-Group 0-6 Years by Residence : 2011........................................................................................ 4
Table1.5 : State-wise sex ratio in various age-groups in the context of developmental planning .................................................. 5
Table1.6 : Sex Ratio of Adolescent, Youth & Reproductive Age group in India ........................................................................ 6
Table1.7 : Religion wise Sex Ratio among major States/UTs - Census 2011 .............................................................................. 7
Table1.8 : Sex Ratio at Birth based on registered events ............................................................................................................ 8
Table1.9 : Sex ratio at birth for bigger States based on Sample Registration System ................................................................... 9
Table1.10 : Percentage Distribution of Population by Age-group and Sex ................................................................................ 10
Table1.11 : Percent Distribution of Population in reproductive age group by Sex, Marital Status and Age-Group, 2017 ............ 11
Table1.12 : Women's Mean Age at Marriage in Major States ................................................................................................... 12
Chapter 2. Health ........................................................................................................................................................................ 13
Table2.1: Important Women related Vital Rates in India for last 4 years .................................................................................. 13
Table2.2 : Important Vital Rates in Empowered Action Group (EAG) States: 2017 .................................................................. 14
Table2.3 : State-wise Birth Death Indicators for last 5 years .................................................................................................... 15
Table2.4 : Life Expectancy at birth by sex ............................................................................................................................... 16
Table2.5 : Infant Mortality Rate for last 10 Year...................................................................................................................... 17
Table2.6 : Maternal Mortality Ratio (MMR)............................................................................................................................ 18
Table2.7 : Fertility indicators by level of education of women, 2017 ........................................................................................ 19
Table2.8 : State-wise Maternity Care indicators: 2015-16 ....................................................................................................... 20
Table2.9 : Percentage of Births Attended by Skilled Health Personnel (2015-16) ..................................................................... 21
Table2.10 : Anaemia among Women and Children during 2015-16.......................................................................................... 22
Table2.11 : Age-Specific Mortality Rate by Sex ...................................................................................................................... 23
Table2.12 :Per cent of live births where the mothers received medical attention at delivery ...................................................... 24
Table2.13 :Percentage of currently married women aged 15-49 years who use any modern method of family planning
(2015-16) ............................................................................................................................................................................... 25
Table2.14 : Unmet Need for Family Planning (currently married women age 15-49 years) ....................................................... 26
Table2.15 : Proportion of Women of Reproductive Age who have their Need for Family Planning Satisfied with Modern
Methods ................................................................................................................................................................................. 27
Table2.16 : Percentage Of Current Tobacco Use Among Men And Women Aged 15-49 Years, 2015-16 .................................. 28

Table2.17 : Proportion of Adults who are Obese, 2015-16 ....................................................................................................... 29
Table2.18 : Number of new HIV infections per 1,000 uninfected population ............................................................................ 30
Table2.19 : Sex-wise age-group wise ailment during last 15 days (in percentage) ..................................................................... 31
Table2.20 : Number per 1000 of persons treated as in patient during last 365 days in each State/UT ......................................... 32
Table2.21 : Average Medical Expenditure incurred for Treatment during stay at hospital per case of hospitalization, by State/UT,
separately for Public and Private Hospital in each Sector .............................................................................................................................. 33
Table2.22: Average Total Medical Expenditure per spell of ailment for Non-Hospitalised Treatment during a 15-day
period by Health care service provider .................................................................................................................................... 34
Chapter 3.Literacy and Education ............................................................................................................................................... 35
Table3.1 : Trend in Literacy Rates in Post Independent India ................................................................................................... 35
Table3.2 : Literacy rates for persons of age 7 years an above for rural & urban population ....................................................... 36
Table3.3 : Literacy Rate (in percent) among persons of age 7 years and above for different States ............................................ 36
Table3.4 : State-wise Gap in the Literacy rates of Males and Females in last two decades ....................................................... 37
Table3.5 Adult Literacy Rate (Age 15 Years and Above)........................................................................................................ 38
Table3.6 : Adult Literacy Rate by sex and place of residence- 2011 ........................................................................................ 38
Table3.7 : Literacy Rate of Youth in the Age Group of 15-24 Years ........................................................................................ 39
Table3.8 Gross Enrolment Ratio in Different Stages of Education........................................................................................... 40
Table3.9 : Adjusted Net Enrolment Ratio by stage of School Education, all India ................................................................... 41
Table3.10 : Number of Females per 100 Males Enrolled by stages of education ...................................................................... 42
Table3.11 : Percentage distribution of persons of age 15 years and above by highest level of education successfully
completed ............................................................................................................................................................................... 43
Table3.12 : Average number of years completed in formal education by persons with level of education below primary
and above ............................................................................................................................................................................... 44
Table3.13 : Percentage distribution of students pursuing general course by type of course ........................................................ 44
Table3.14 : Percentage distribution of students pursuing general course by gender of the student for each type of course .......... 45
Table3.15 : Number of Female Teachers per 100 Male Teachers at Different Levels of Education............................................ 46
Table3.16 : Percentage distribution of persons of age 3 to 35 years by enrolment status ........................................................... 47
Table3.17 : Trend in Average Annual Drop-Out Rate at different stages of School Education .................................................. 48
Table3.18 : Percentage of never enrolled persons of age 3 to 35 years and their distribution by major reasons for never
enrolled : 2018 ........................................................................................................................................................................ 49
Table3.19 : Percentage of ever enrolled persons of age 3 to 35 years currently not attending education and their
distribution by major reason for not attending : 2018 ............................................................................................................... 50
Table3.20 : Enrolment in Higher Education ............................................................................................................................. 51
Table3.21 : Percentage distribution of students by type of course pursuing (general course and technical/professional
course) ................................................................................................................................................................................... 52
Table3.22 : Percentage distribution of students pursuing technical/professional course by type of course.................................. 53

Table3.23 : Percentage distribution of students pursuing technical/professional course by gender of the student for each
type of course ......................................................................................................................................................................... 54
Table3.24: Number of Females per 100 Males in University Education in Major Disciplines................................................... 55
Table3.25 : Enrolment of Foreign Students in Higher Education .............................................................................................. 56
Table3.26 : Gender Parity Index(GPI) by education level ........................................................................................................ 57
Table3.27 : Year-wise Gender Parity Index (GPI) for all Categories of Students ...................................................................... 58
Table3.28 : Average expenditure (Rs.) relating to basic course per student pursuing general course during the current
academic year for each level of current attendance .................................................................................................................. 59
Table3.29 : Examination Result Level-wise Out-turn/Pass out in Higher Education ................................................................ 60
Table3.30 : Percentage of persons dropped out among ever enrolled persons of age 3 to 35 years for different levels of
last enrolment ......................................................................................................................................................................... 61
Table3.31: Gross Enrolment Ratio in Higher Education (18-23 Years) ..................................................................................... 62
Table 3.32: Gender Parity Indices ........................................................................................................................................... 63
Table 3.33: Enrolment at Under Graduate Level in Major Disciplines/ Subjects ....................................................................... 64
Table 3.34: Enrolment at Ph.D.,M.Phil. & Post Graduate Level in Major Disciplines/ Subjects ................................................ 66
Chapter 4. Participation in Economy ........................................................................................................................................... 73
Table 4.1 : Worker Population Ratio for year 2017-18 ............................................................................................................. 73
Table 4.2 : State-wise Worker Population Ratio for persons aged 15 years & above ................................................................. 74
Table 4.3 : Age Group wise Worker Population Ratio (WPR) (in %) according to usual status (ps+ss) ..................................... 75
Table 4.4 : State wise Percentage Distribution of Workers According to Broad Employment Status (Jul.17-Jun.18) ................. 76
Table 4.5 : Percentage distribution of workers in usual status (ps+ss) by broad status in employment for each State/UT .......... 77
Table 4.6 Percentage distribution of workers in usual status (ps+ss) by broad industry division during 1983 (NSS 38th
round) to 2017-18 (PLFS) ....................................................................................................................................................... 78
Table 4.7 Proportion (in per cent) of worker in usual status (ps+ss) in informal sector among workers engaged in non-
agriculture sector for each State/ UT during 2017-18 ............................................................................................................... 79
Table 4.8 Age Group Wise Labour Force Participation Rate (LFPR) (in percent) in usual status (ps+ss) during 61st
(2004-05), 66th (2009-10), 68th Round (2011-12) and PLFS (2017-18) ..................................................................................... 80
Table 4.9:State wise Labour Force Participation Rate: 2017-18................................................................................................ 81
Table4.10 : State-wise Labour Force Participation Rate for persons aged 15 years & above..................................................... 82
Table4.11 : Unemployment rates (in the labour force) according to usual status ....................................................................... 83
Table4.12 : Age wise Unemployment rates (in the labour force) according to usual status ........................................................ 83
Table4.13:State wise Unemployment Rates: 2017-18 .............................................................................................................. 84
Table 4.14 : State-wise Unemployment Rate for Persons aged 15 years & above : 2017-18 ..................................................... 85
Table 4.15.1 : Average Wage Earning (in Rs.) received per day by Casual Labourers in Specified Works (Jul.-Sep.,
2017) ...................................................................................................................................................................................... 86
Table 4.15.2 : Average Wage Earning (in Rs.) received per day by Casual Labourers in Specified Works (Oct.-Dec.,
2017) ...................................................................................................................................................................................... 87
Table 4.15.3 : Average Wage Earning (in Rs.) received per day by Casual Labourers in Specified Works (Jan.-Mar.,
2018) ...................................................................................................................................................................................... 88
Table 4.15.4 : Average Wage Earning (in Rs.) received per day by Casual Labourers in Specified Works (Apr.-Jun.,
2018) ...................................................................................................................................................................................... 89
Table 4.16: Population Group-Wise Deposits of Scheduled Commercial Banks ....................................................................... 90
Table 4.17 : State-wise Deposits of Scheduled Commercial Banks By Broad Ownership Category ........................................... 91
Table 4.18:Percent women employed in various Bank-Groups at various levels in Scheduled Commercial Banks .................... 92
Table 4.19 : State-wise Distribution of Employees of Scheduled Commercial Banks by Category ............................................ 93
Table 4.20: Proprietary Establishments and employment therein by sex of the owner: 2014 ..................................................... 94
Table 4.21: non-agricultural proprietary Establishments and employment therein by sex of the owner: 2014 ............................ 94
Table 4.22: Non-agricultural establishments and employment therein by sex of the owner : 2014 ............................................. 95
Table 4.23: Distribution of proprietary establishments by sex of owner: 2014 .......................................................................... 96
Table4.24 : Total number of establishments under women entrepreneurship by nature of operation, Hired or no Hired
Workers: 2014 ........................................................................................................................................................................ 97
Table4.25 : Number of Establishments under women entrepreneur by Major Source of Finance: 2014 ..................................... 98
Table4.26 : Broad Activity wise distribution of proprietary establishments by sex of the owner: 2014 ...................................... 99
Chapter 5.Participation in Decision Making .............................................................................................................................. 100
Table5.1: Representation of Women in the Central Council of Minister ................................................................................. 100
Table5.2 : Number of Electors and Percentage Voting in Various General Elections .............................................................. 101
Table5.3: Persons Contesting and Elected in Various LokSabha Elections ............................................................................. 102
Table5.4 : State-wise Women Voters Turnout for General Election - 2019 ............................................................................. 103
Table5.5 : State-wise Women participation in 17thLokSabha .................................................................................................. 104
Table5.6 : State-wise participation of women in State Assemblies ......................................................................................... 105
Table5.7 : Women Judges in Supreme Court and High Courts .............................................................................................. 106
Table5.8: Status of representation of women in Panchayati Raj Institutions (PRIs) ................................................................. 107
Tab le5.9: State/UT wise Proportion of Women in Managerial Position per 1000 Person Engaged In Managerial Position
In Listed Companies ............................................................................................................................................................. 108
Table5.10: Strength of Female Police Officers in India .......................................................................................................... 109
Chapter 6. Social Obstacle in Women Empowerment ................................................................................................................ 110
Table6.1 : Year-wise Status of Major Crimes Committed Against Women ............................................................................. 110
Table6.2 : Disposal of Crime Committed Against Women Cases by Police During 2018 ....................................................... 111
Table 6.3 : Disposal of Crimes Committed Against Women Cases by Courts During 2018 ..................................................... 112
Table 6.4 : State-wise Rate (per Lakh Women) of Incidence of Various Crimes Committed against Women during 2018 ....... 113
Table 6.5 : State-wise and Age-wise Distribution of Rape Victims (by age-group) during 2018 .............................................. 114

Table 6.6 : Percentage of Ever Married Women Age 15-49 Years Who Have Ever Experienced Physical or Sexual
Violence committed by their Husband ................................................................................................................................... 115
Table 6.7 : Year-wise Sex-wise Incidence of Suicides per One Lakh Population .................................................................... 116
Table 6.8 : Percentage distribution of Sex-wise Profile of Suicide Victims by various Parameters during 2018 ...................... 117
Table 6.9 : Percentage of women aged 20-24 years who were married by exact age 18 years .................................................. 118
Table 6.10: Percentage of Disabled (Differently abled persons) by Sex and area Jul-Dec, 2018 .............................................. 119
Table 6.11: Percentage of persons with broad type of disabilities–Jul.- Dec. 2018 .................................................................. 120
Table 6.12 State-wise Sex-wise percentage of Disabled persons to Total population............................................................... 121
Table 6.13 Percentage of females by type of disability - Jul-Dec, 2018 .................................................................................. 122
Chapter-7Minimum Set of Gender Indicators ............................................................................................................................ 123
Appendix-I ............................................................................................................................................................................... 124
Definitions and Explanations .................................................................................................................................................... 127

i
HIGHLIGHTS
Chapter-1: Population and Related Statistics
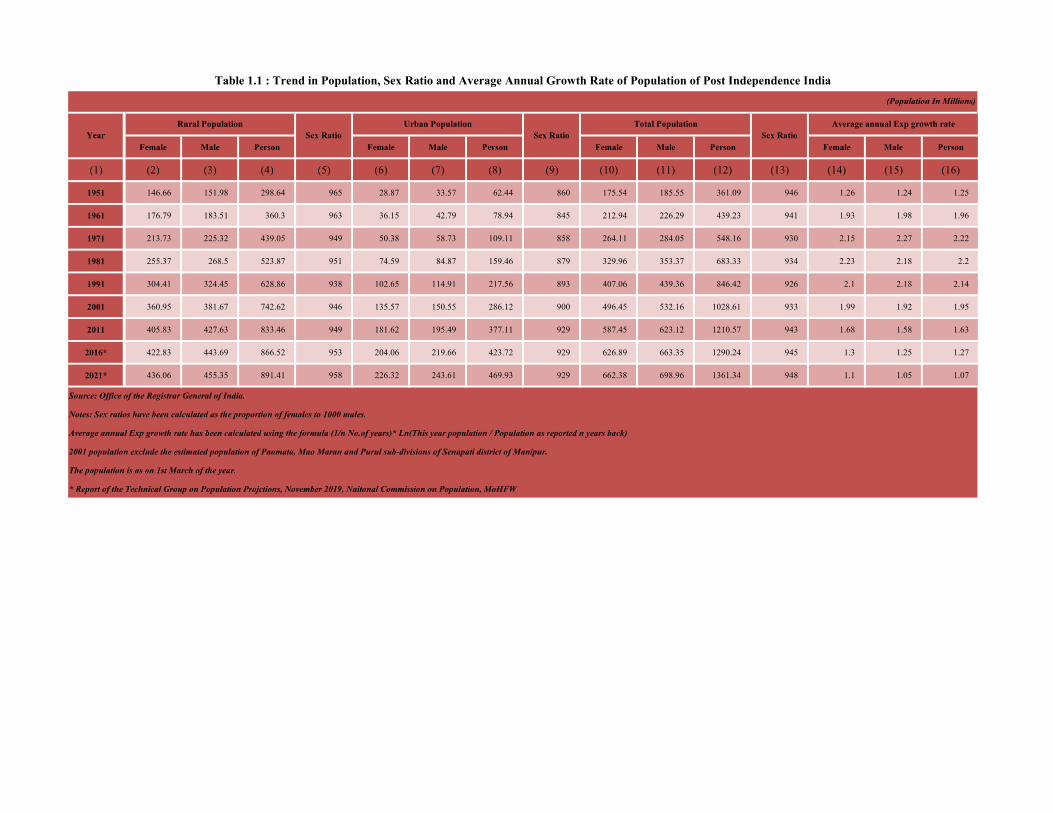
As per the report of Technical Group on Population Projections, India’s projected population
is 129.02 Crore with 48.59% female population in 2016. The projected average annual
exponential growth rate of population has declined from 1.63 in 2011 to 1.27 in 2016 and
likely to further decline to 1.07 in 2021. During this period, similar trend is also projected for
female and for male population. In India, Sex ratio is defined as the number of females per
1000 males in the population, whereas in almost all the UN publications/International
publications, it is expressed as males to per 100 females. The projected sex ratio is likely to
reach from 943 in 2011 to 945 in 2016 and it may further increase to 948 in 2021. The sex
ratio is projected to remain constant at 929 in Urban India while in rural India it is estimated
to reach at 958 in 2021 from 949 in 2011. (Table 1.1)
At all India level, the sex ratio has increased from 933 in 2001 to 943 in 2011. During this
period 19 States/UTs have recorded significant increase in sex ratio. Notable increase in the
sex ration has been recorded in Delhi (5.7%), Chandigarh (5.3%) and Arunachal Pradesh
(5.0%). Contrary to this, Daman &Diu has recorded decline of 12.9% in sex ratio. (Table
1.3)
In 2011, the Sex Ratio is lowest at 908 in the age group 0-19 years, but the same is 1033 for
the age group of 60+ years. The economically active age group (15-59) has the sex ratio of
944. (Table 1.5)
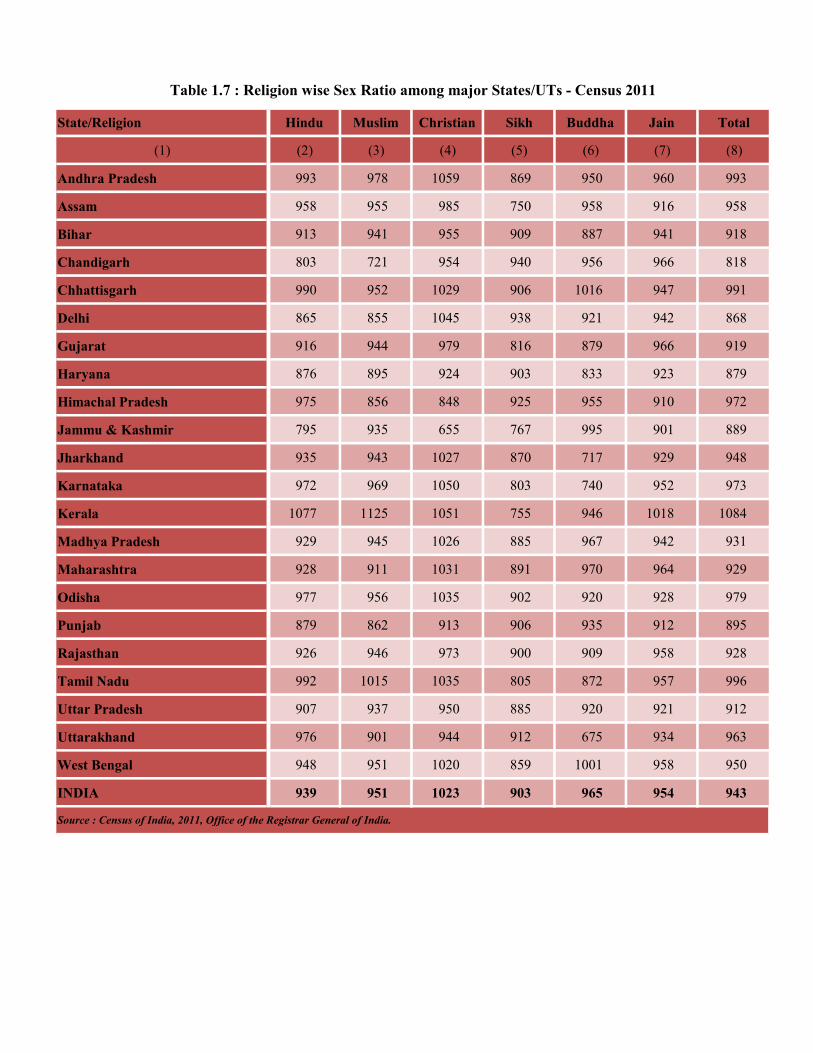
In 2011, religion wise sex ratio for Hindus, Muslims, Christians, Sikhs, Buddhists and Jains
was 939, 951, 1023, 903, 965 and 954 respectively. (Table 1.7)
Based on SRS, sex ratio at birth was 896 in 2015-17 as against 898 in 2014-16. In rural areas,
the ratio was 898 in 2015-17 as compared to 902 in 2015-17 and in urban areas it was 890 in
2015-17 as compared to 888 in 2014-16. (Table 1.9)
Women’s mean age at marriage at all India level in 2017 is 22.1 years and the same in rural
and urban areas are 21.7 years and 23.1 years respectively. The women’s mean age at
marriage has shown a static trend in all the major States and at all India level from 2015 to
2017. (Table 1.12)

ii
Chapter-2: Health Statistics
In 2017, highest age fertility rate is recorded for the females belonging to the age group 25-
29 years at 157.1, while the age specific fertility rate stands at 137.1 for the age group of 20-
24 years. It also showed the age specific fertility rate for the age group of 20-24 years had
decreased from 174.9 to 137.1 during 2014 to 2017. Total Fertility Rate (TFR) for the
country has come down to 2.2 in 2017 after being stable at 2.3 for the last three years from
2014 to 2016. (Table 2.1)
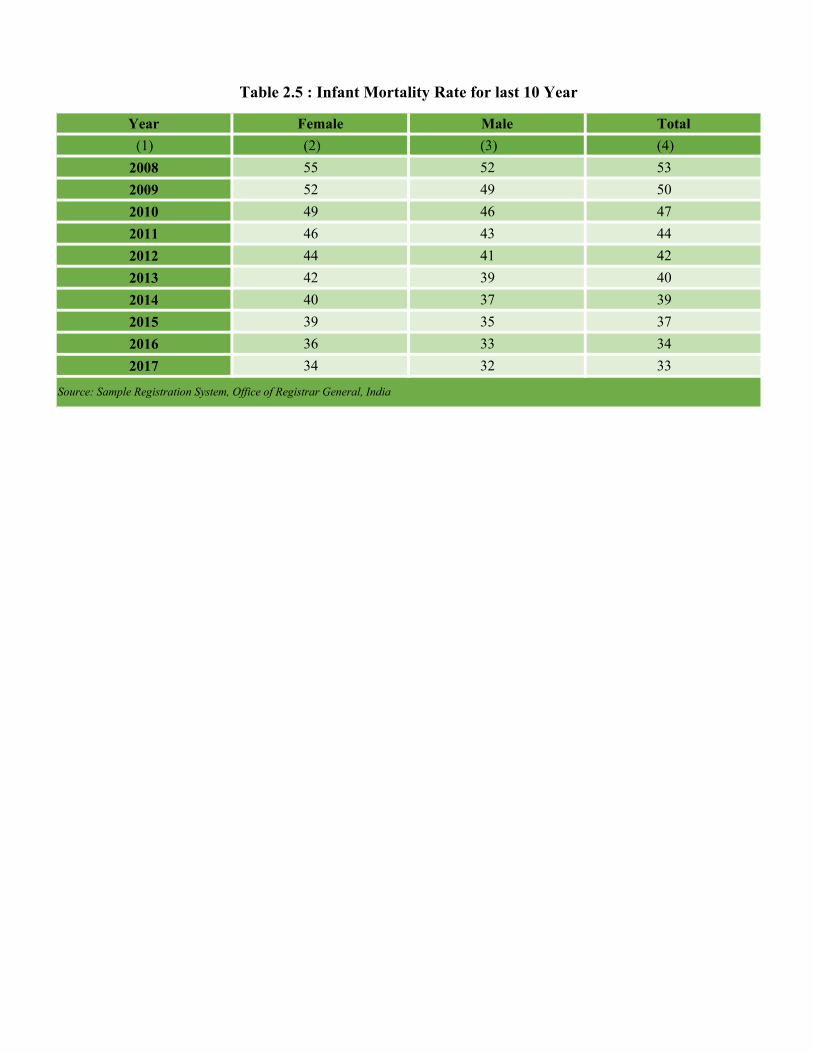
As per SRS 2017, the infant mortality rate has decreased from 40 in 2013 to 33 in 2017.
From 2013 to 2017, the infant mortality rate has decreased by 20 point in the state of
Mizoram followed by 18 point in Dadar & Nagar Haveli, 14 point in Jammu & Kashmir and
13 point in Himachal Pradesh. Similarly, the infant mortality rate has increased by 10 point
in the state of Arunachal Pradesh followed by 3 point in Tripura and 2 point in Manipur
during the same period. (Table 2.3)
Maternal Mortality Ratio (MMR) has declined from 301 in 2001-2003 to 122 in 2015-17.
During the span of 15 years from 2001-03 to 2015-17, the states of Uttar Pradesh, Assam,
Rajasthan, Bihar and Madhya Pradesh has significantly reduced maternal mortality rate by
301 points, 261 points, 259 points, 206 points and 191 points respectively. Despite this fact
these states are far above the national value of MMR at122. (Table 2.6)
As per SRS 2017, Total Fertility Rate (TFR) for rural India is observed at 2.3 as compared to
1.7 in urban areas. There is a significant difference in the age specific fertility rate of the age
group 20-24 years in rural (153.2) and in Urban (101.9) and in the age group of 25-29 years
in rural (171.4) and in urban (130.4). (Table 2.7)
As per the NFHS 2015-16 (NFHS-4), the percentage of women who had at least four Ante-
Natal Care (ANC) visits during their pregnancy is lowest in Bihar (14.4%) and highest in
Andaman & Nicobar Islands (92%) followed by Kerala (90%). (Table 2.8)
As per the NFHS 2015-16 (NFHS-4), 78.9% of live birth in the five years before the survey
was delivered in health facility. Nearly 100% Institutional delivery were observed in the
States/UT of Kerala, Lakshadweep and Puducherry and lowest in Nagaland (32.8%). (Table
2.9)
As per NFHS-4, female sterilization remains the most popular modern contraceptive method.
Among currently married women age 15-49, 36 percent use female sterilization, followed by
male condoms (5.6%) and pills (4.1%). (Table 2.13)
iii
As per National Family Health Survey (NFHS) 2015-16, 12.9% of currently married women
in the age group 15-49 years could not meet the need for family planning. (Table 2.14)
However, against the total demand for family planning (66.4%) by the currently married
women in reproductive age group, 80.6 % of demand satisfied was achieved. Of which, the
share of percentage of demand satisfied by modern methods was 71.9%. (Table 2.15)
As per the NFHS 2015-16 (NFHS-4), 3% of males and 5.1% of females in the age group 15-
49 years were found to be obese. In males, highest obesity was found in the Andaman &
Nicobar Island (8.1%) followed by Goa (7.7%) and Andhra Pradesh (7.7%) and lowest in
Jharkhand (1.2%). Similarly, in females, highest obesity was found in the Chandigarh
(14.9%) followed by Lakshadweep (14.6%) and Andhra Pradesh (10.3%) and lowest in
Meghalaya (1.7 %). (Table 2.17)
As per NSS 75th round (July 2017- June 2018) on Household social consumption on Health,
the percentage of persons that reported as ailing (PPRA) in last 15-days period is 13.5%
(Female) and 10.1% (Male) in urban areas, while the same percentage is 9.9% (Female) &
8.0% (Male) in rural areas. (Table 2.19)
Chapter-3: Education
In India, the literacy rate has increased to 77.7 in 2017 from 72.98 in 2011. It is observed that
the male and female literacy in 2017 is at 84.7 and 70.3, respectively. (Table 3.1)
As per NSS 75th Round (July, 2017- June, 18) the literacy rate for persons of age 7 years and
above is observed as 73.5 and 87.7 in rural and urban areas respectively. The gender gap in
rural is 16.5 while this gender gap is 9.4 in urban areas. (Table 3.2)
As per NSS 75th Round (July, 2017- June, 18), the gender gap is highest for Rajasthan
(23.2), followed by Bihar (19.2) and Uttar Pradesh (18.4). In urban areas, the highest gender
gap is in Bihar (20.2) followed by Rajasthan (16.5). In rural areas, the highest gender gaps
are observed in Rajasthan (25), Uttar Pradesh (20.1) and Bihar (14.9). (Table - 3.4)
As per NSS 75th Round (July, 2017- June, 18), only 8.3% of the females of age 15 years &
above by highest level of education have successfully completed graduation and above level
of courses. While 12.8 % of males of age 15 years and above by highest level of education,
have successfully completed graduation and above level of courses. (Table 3.11)

iv
As per NSS 75th Round (July, 2017- June, 18), the average no. of years completed on formal
education by male with level of education below primary and above is 9.7 years, while for
females this average is at 8.9 years. (Table – 3.12)
As per NSS 75th Round (July, 2017- June, 18), 81.8 % of females’ student that are pursuing
education upto 10th standard and this percentage of males is 81.1 %. The Humanities is the
most preferred course for both females (53.9 %) and males (46.4 %). (Table – 3.13)
As per NSS 75th Round (July, 2017- June, 18), the Humanities (53.9%) has the highest
percentage of female students among various general courses as compared to Science
(28.2%) and Commerce (17.8%). (Table – 3.13)
As per NSS 75th Round (July, 2017- June, 18), 41.2 % of females in the age group 3 to 35
years are currently attending education and this percentage for males is 46.2 %. In the age
group 3 to 35 years, 16.6 % females are never enrolled while 11.0 % males are not enrolled.
(Table – 3.16)
In the age group 3 to 35 years, among the never enrolled persons, 13.6 % females and 14.9 %
males were never enrolled in education due to financial constraints. 11.7 % females and 1.5
% males were never enrolled as they were engaged in economic activities. (Table - 3.18)
As per NSS 75th Round (July, 2017- June, 18), persons in the age group 3 - 35 years ever
enrolled, 30.2 % of females are currently not attending education due to engagement in
domestic activities. For males, 36.9 % of ever enrolled males in the 3 - 35 years’ age group
are not attending education due to engagement in economic activities. (Table 3.19)
As per NSS 75th Round (July, 2017- June, 18), only 4.5 % males and 3.1 % females are
pursuing technical/professional courses. In urban, 8.3 % of male and 6.3 % females are
pursuing technical/professional courses. (Table – 3.21)
As per NSS 75th Round (July, 2017- June, 18), the highest percentage of male (41.6 %) and
females (28.2 %) are pursuing engineering among the students pursuing
technical/professional courses. (Table – 3.22)
As per NSS 75th Round (July, 2017- June, 18), among the students pursuing
technical/professional courses, medicine has the highest 59.8 % of students are females. In
education, the percentage of females among the students pursuing education is 59.6 %.
(Table – 3.23)

v
In 2018-19, among the foreign students enrolled in higher education, 31.69 % are females.
The percentage of female foreign students enrolled is highest for Malaysia (64.12 %)
followed by Sri Lanka (55.19 %). (Table - 3.25)
The Gender Parity Index (GPI) in higher education has increased from 0.94 in 2016-17 to
0.97 in 2017-18. There has been an increase in GPI from 2016-17 to 2017-18 in SC and ST
categories as well. (Table 3.27)
The percentage of persons dropped out among ever enrolled persons of age 3 to 35 years for
different levels of last enrolment is highest for females and males in Secondary level is 19.2
and 20.4 respectively. (Table 3.30)
Chapter-4: Participation in Economy
Periodic Labour Force Survey results indicate that the worker population ratio for females in
rural sector was 17.5 and 51.7 for males in 2017-18. In Urban sector, the ratio is 14.2 for
females and 53.0 for males. In both rural and urban areas, WPRs for females were
considerably lower than WPRs for males. (Table 4.1)
As per the Periodic Labour Force Survey (2017-18), Worker Population Ratio (WPR) for
persons in the age group of 15 years and above, is 22.0 and 71.2 for females and males
respectively. Meghalaya (55.5) followed by Chhattisgarh (52.8) and Himachal Pradesh
(50.0) have maximum WPR for females and Meghalaya, Madhya Pradesh and Chhattisgarh
have for males in rural areas whereas Sikkim followed by Meghalaya and Andhra Pradesh
for females and Andhra Pradesh followed by Gujarat and Chhattisgarh for male have
maximum WPR in urban area. (Table 4.2)
As per Periodic Labour Force Survey 2017-18, majority of the females (57.7%) and males
(57.8%) workers in usual status (ps+ss) were self-employed in so far as rural area is
concerned, whereas majority of females (52.7%) and males (54.7%) were regular
wage/salaried employee in urban area. Casual labour among the female workers and male
workers were still high in rural area as compared to urban area. (Table 4.4)
In rural and urban areas, both females and males workers had shown the declined trend in
agriculture sector from 38th round of NSS to (1983) to PLFS (2017-18). Similarly, both
females and males workers showed the increasing trend in usual status of in Trade, Hotel &
Restaurant sector in the same periods. (Table 4.6)

vi
Labour Force Participation Rate (LFPR) for male workers in age 15+ years above had
declined from 79.8% to 75.8% from 2011-12 to 2017-18. LFPR for female workers in the
same age group also decreased from 31.2% to 23.3% during the same period. LFPR for
male and female workers in age 15+ years for both rural and urban areas has also declined
form 2011-12 to 2017-18. (Table 4.8)
As per PLFS (2017-18), the unemployment rate for women in rural area was 3.8 as against
5.7 for men whereas it was 10.8 and 6.9 for women and men in urban areas in the age group
of 15 years and above. (Table 4.14)
At All India level, average wage/salary earnings received by the casual labours in current
weekly status shows the increasing trend in all the quarters of the PLFS (2017-18).
However, average wage/salary earnings received by female workers of regular wage/salary
employees is still lagging behind the average earnings received by male workers in both
rural and urban areas. Similar trend was also observed in average earnings received per day
by casual labourers engaged in works other than public works. (Table 4.15.1 to 4.15.4)
As per the data of Basic Statistical Returns of Scheduled Commercial Banks in India, in
rural area 37.03 percent of the bank accounts are held by female population while in Semi-
Urban, Urban and Metropolitan areas, the percentage is around 34%. However, the
proportion of amount held therein is greater in case of metropolitan females at 32.77% than
that of female population of other areas. (Table 4.16)
Chapter -5: Participation in Decision Making
The percentage of women representation in Central Council of Ministers has decreased from
17.8 % in 2015 to 10.5 % in 2019. (Table 5.1)
There were 437.8 million women electors in Seventeenth Lok Sabha Election (2019) which
had increased from 397.0 million in sixteenth Lok Sabha Elections (2014). The difference
between the percentage of men and women electors participated in election was decreased
from 1.46 to 0.17 from Sixteenth to Seventeenth Lok Sabha General Election. (Table 5.2)
There was an upward trend in the number of females contested as well as females elected
from 14th to 17th Lok Sabha General Election. The data also shows an upward trend in
number of males contested while a downward trend in number of males elected during the
same period. (Table 5.3)

vii
Percentage turnout for female voters in 2019 general elections was more than 60% in all
the States/UTs except in the States/UTs of Bihar, Uttar Pradesh, Maharashtra and Jammu
and Kashmir. (Table 5.4)
The highest number of women member of parliaments in 17th Lok Sabha is 11 each from
Uttar Pradesh and West Bengal followed by Maharashtra with 8 members. The total
number of women participation in the 17th Lok Sabha is 78 which constitute 14% of the
total seats. (Table 5.5)
At all India level, the women participation in the State Assemblies was 11% against the
total elected representatives in the State Assemblies. The States of Bihar (14%) and
Chhattisgarh (14%) shows maximum participation of women in the State assemblies
followed by West Bengal (13%), Rajasthan (12%), Jharkhand (12%), and Gujarat (12%).
(Table 5.6)
The highest number of female judges is 9 each in Madras, Bombay and Punjab &
Haryana High Court. It is also evident from the table that there are no female judges in
Manipur, Meghalaya, Tripura and Uttarakhand. (Table 5.7)
The women participation in Panchayati Raj Institutions is highest in Rajasthan (56.49%)
followed by Uttarakhand (55.6%) and Chhattisgarh (54.785). In terms of elected women,
the highest female representation is found in Uttar Pradesh (272733) followed by Madhya
Pradesh (196490) and Maharashtra (121490). (Table 5.8)
Chapter-6: Impediments in Empowerment
Share of Cruelty by Husband or his Relatives has reduced from 35% in 2015 to 27% in
2018. Out of total rime committed against women in 2018, 60% cases reported for
Cruelty by Husband and Relatives (27%), Assault on women with intent to outrage her
modesty (24%) and Kidnapping & Abduction (19%). (Table 6.1)
During 2018, police had disposed off 66% cases out of the total cases of crime against
women investigated by the police. The maximum cases disposed off by the police under
the crime head of Cruelty by husband and relatives followed by Assault on women with
intent to outrage her modesty, kidnapping & abduction of women and rape. (Table 6.2)
During 2018, crime rate was the highest for cruelty by husband and relatives followed by
assault with intend to outrage modesty and Kidnapping & Abduction. Among the
States/UTs, the highest share of crime against women was in Uttar Pradesh (15.71% of

viii
all India crime). 7% of the total crimes were recorded against women. Assam recorded
the highest i.e., 23% of the total crime against women whereas Tamil Nadu (1%)
recorded the lowest. (Table 6.4)
As per the data of NFHS, 30.9 percent of ever married women aged 15-49 years
experienced physical or sexual violence committed by their husband. In Manipur 52.6 %
of the women experienced such violence followed by Andhra Pradesh, Telangana and
Bihar with 43, 42.9 and 42.7 percent respectively. In Sikkim only 2.2% of women
experienced physical or sexual violence by their husband. (Table 6.6)
In 2015-16, 26.8 % of women aged 20-24 years got married by exact age of 18 years.
Bihar had the maximum proportion of such women. Kerala, Punjab and Lakshadweep
were among the States/UTs having better off situation. (Table 6.9)
As per the survey on Disability conducted by M/o Statistics & Programme
Implementation, percentage of differently-abled person is higher for male than females at
2% in rural as well as urban areas. (Table 6.10)
In females, the highest disability was found in Odisha (3.0%) followed by Kerala (2.9%),
Andhra Pradesh (2.8%) and Punjab (2.8%) whereas it as lowest in the Stats/UTs of
Daman& Diu (0.7%) and Manipur (0.7%). In males, the highest disability was found in
Odisha (3.5%) followed by Kerala (3.4%), Andhra Pradesh (3.1%) and Puducherry
(2.8%) whereas the lowest in Manipur (0.9%) followed by Meghalaya (1.0%) and
Nagaland (1.0%). (Table 6.12)
The highest percentage of type of disability found in females was locomotors disability
(1.2%) followed by locomotors (1.2%). (Table 6.13)

Female Male Person Female Male Person Female Male Person Female Male Person
(1) (2) (3) (4) (5) (6) (7) (8) (9) (10) (11) (12) (13) (14) (15) (16)
1951 146.66 151.98 298.64 965 28.87 33.57 62.44 860 175.54 185.55 361.09 946 1.26 1.24 1.25
1961 176.79 183.51 360.3 963 36.15 42.79 78.94 845 212.94 226.29 439.23 941 1.93 1.98 1.96
1971 213.73 225.32 439.05 949 50.38 58.73 109.11 858 264.11 284.05 548.16 930 2.15 2.27 2.22
1981 255.37 268.5 523.87 951 74.59 84.87 159.46 879 329.96 353.37 683.33 934 2.23 2.18 2.2
1991 304.41 324.45 628.86 938 102.65 114.91 217.56 893 407.06 439.36 846.42 926 2.1 2.18 2.14
2001 360.95 381.67 742.62 946 135.57 150.55 286.12 900 496.45 532.16 1028.61 933 1.99 1.92 1.95
2011 405.83 427.63 833.46 949 181.62 195.49 377.11 929 587.45 623.12 1210.57 943 1.68 1.58 1.63
2016* 422.83 443.69 866.52 953 204.06 219.66 423.72 929 626.89 663.35 1290.24 945 1.3 1.25 1.27
2021* 436.06 455.35 891.41 958 226.32 243.61 469.93 929 662.38 698.96 1361.34 948 1.1 1.05 1.07
* Report of the Technical Group on Population Projctions, November 2019, Naitonal Commission on Population, MoHFW
Table 1.1 : Trend in Population, Sex Ratio and Average Annual Growth Rate of Population of Post Independence India(Population In Millions)
YearRural Population
Sex RatioUrban Population
Sex RatioTotal Population
Sex RatioAverage annual Exp growth rate
Source: Office of the Registrar General of India.
Notes: Sex ratios have been calculated as the proportion of females to 1000 males.
Average annual Exp growth rate has been calculated using the formula (1/n No.of years)* Ln(This year population / Population as reported n years back)
2001 population exclude the estimated population of Paomata, Mao Maran and Purul sub-divisions of Senapati district of Manipur.
The population is as on 1st March of the year.
1

Rural Urban Total Rural Urban Total(1) (2) (3) (4) (5) (6) (7)
Andaman & Nicobar Islands 46.74 46.63 46.69 877 874 876Andhra Pradesh 49.89 49.68 49.82 996 987 993Arunachal Pradesh 48.80 47.10 48.41 953 890 938Assam 48.97 48.61 48.92 960 946 958Bihar 47.94 47.23 47.86 921 895 918Chandigarh 40.84 45.10 44.98 690 822 818Chhattisgarh 50.03 48.87 49.76 1001 956 991Dadra and Nagar Haveli 46.31 40.56 43.63 863 682 774Daman and Diu 46.36 35.52 38.21 864 551 618Delhi 45.99 46.48 46.47 852 868 868Goa 50.08 48.86 49.32 1003 956 973Gujarat 48.70 46.82 47.90 949 880 919Haryana 46.85 46.61 46.77 882 873 879Himachal Pradesh 49.64 46.04 49.28 986 853 972Jammu & Kashmir 47.58 45.64 47.05 908 840 889Jharkhand 49.01 47.64 48.68 961 910 948Karnataka 49.48 49.05 49.31 979 963 973Kerala 51.87 52.18 52.02 1078 1091 1084Lakshadweep 48.78 48.58 48.63 952 945 946Madhya Pradesh 48.34 47.87 48.21 936 918 931Maharashtra 48.76 47.45 48.17 952 903 929Manipur 49.21 50.64 49.63 969 1026 985Meghalaya 49.64 50.03 49.72 986 1001 989Mizoram 48.78 49.94 49.39 952 998 976Nagaland 48.46 47.60 48.21 940 908 931Orissa 49.71 48.23 49.46 989 932 979Puducherry 50.68 51.03 50.92 1028 1042 1037Punjab 47.57 46.67 47.23 907 875 895Rajasthan 48.27 47.74 48.14 933 914 928Sikkim 46.87 47.73 47.09 882 913 890Tamil Nadu 49.83 50.00 49.91 993 1000 996Tripura 48.86 49.33 48.98 955 973 960Uttar Pradesh 47.85 47.21 47.71 918 894 912Uttarakhand 49.99 46.92 49.06 1000 884 963West Bengal 48.79 48.56 48.72 953 944 950India 48.69 48.16 48.53 949 929 943
Table 1.2 : State-wise Percent Share of Female Population in Total Population and Sex Ratio- 2011
State/Union Territory% Share of Women Sex Ratio
Source: Census of India, 2011, Office of the Registrar General of India.
2

State/ Union Territory 1951 1961 1971 1981 1991 2001 2011% Improvement
over last 10 years
(1) (2) (3) (4) (5) (6) (7) (8) (9)Andaman & Nicobar Islands 625 617 644 760 818 846 876 3.5Andhra Pradesh 986 981 977 975 972 978 993 1.5Arunachal Pradesh NA 894 861 862 859 893 938 5Assam 868 869 896 910 923 935 958 2.5Bihar 1000 1005 957 948 907 919 918 -0.1Chandigarh 781 652 749 769 790 777 818 5.3Chhattisgarh 1024 1008 998 996 985 989 991 0.2Dadra & Nagar Haveli 946 963 1007 974 952 812 774 -4.7Daman & Diu 1125 1169 1099 1062 969 710 618 -13Delhi 768 785 801 808 827 821 868 5.7Goa 1128 1066 981 975 967 961 973 1.2Gujarat 952 940 934 942 934 920 919 -0.1Haryana 871 868 867 870 865 861 879 2.1Himachal Pradesh 912 938 958 973 976 968 972 0.4Jammu & Kashmir 873 878 878 892 896 892 889 -0.3Jharkhand 961 960 945 940 922 941 948 0.7Karnataka 966 959 957 963 960 965 973 0.8Kerala 1028 1022 1016 1032 1036 1058 1084 2.5Lakshadweep 1043 1020 978 975 943 948 946 -0.2Madhya Pradesh 945 932 920 921 912 919 931 1.3Maharashtra 941 936 930 937 934 922 929 0.8Manipur 1036 1015 980 971 958 974 992 1.8Meghalaya 949 937 942 954 955 972 989 1.7Mizoram 1041 1009 946 919 921 935 976 4.4Nagaland 999 933 871 863 886 900 931 3.4Odisha 1022 1001 988 981 971 972 979 0.7Puducherry 1030 1013 989 985 979 1001 1037 3.6Punjab 844 854 865 879 882 876 895 2.2Rajasthan 921 908 911 919 910 921 928 0.8Sikkim 907 904 863 835 878 875 890 1.7Tamil Nadu 1007 992 978 977 974 987 996 0.9Tripura 904 932 943 946 945 948 960 1.3Uttar Pradesh 908 907 876 882 876 898 912 1.6Uttarakhand 940 947 940 936 936 962 963 0.1West Bengal 865 878 891 911 917 934 950 1.7India 946 941 930 934 927 933 943 1.1
Table 1.3 : Year-wise State-wise Sex Ratio in post Independent India
Source: Census of India, 2011, Office of the Registrar General of India.
3

Rural Urban Total(1) (2) (3) (4)
Andaman & Nicobar Islands 976 954 968Andhra Pradesh 941 935 939Arunachal Pradesh 975 957 972Assam 964 944 962Bihar 938 912 935Chandigarh 871 880 880Chhattisgarh 977 937 969Dadra and Nagar Haveli 970 872 926Daman and Diu 932 894 904Delhi 814 873 871Goa 945 940 942Gujarat 914 852 890Haryana 835 832 834Himachal Pradesh 912 881 909Jammu & Kashmir 865 850 862Jharkhand 957 908 948Karnataka 950 946 948Kerala 965 963 964Lakshadweep 911 911 911Madhya Pradesh 923 901 918Maharashtra 890 899 894Manipur 931 949 936Meghalaya 972 954 970Mizoram 966 974 970Nagaland 933 973 943Orissa 946 913 941Puducherry 953 975 967Punjab 844 852 846Rajasthan 892 874 888Sikkim 964 934 957Tamil Nadu 936 952 943Tripura 960 947 957Uttar Pradesh 906 885 902Uttarakhand 899 868 890West Bengal 959 947 956India 923 905 918
Table 1.4 : Sex ratio in the Age-Group 0-6 Years by Residence : 2011
State/Union Territory2011
Source : Census of India, 2011, Office of the Registrar General of India.
4

Early Childhood Childhood Economically Active Old Age
(0-6) (0-19) (15-59) (60+)(1) (2) (3) (4) (5)
Andaman & Nicobar Islands 968 948 856 792Andhra Pradesh 939 940 995 1119Arunachal Pradesh 972 978 918 917Assam 962 951 956 971Bihar 935 897 921 877Chandigarh 880 807 800 926Chhattisgarh 969 971 981 1159Dadra and Nagar Haveli 926 846 694 1185Daman and Diu 904 716 522 1331Delhi 871 842 861 989Goa 942 927 951 1200Gujarat 890 876 914 1132Haryana 834 817 888 1015Himachal Pradesh 909 900 988 1062Jammu & Kashmir 862 892 891 912Jharkhand 948 931 943 994Karnataka 948 938 966 1108Kerala 964 963 1106 1226Lakshadweep 911 995 928 971Madhya Pradesh 918 912 918 1063Maharashtra 894 887 918 1114Manipur 930 952 1006 1004Meghalaya 970 975 994 1075Mizoram 970 969 978 998Nagaland 943 937 935 875Odisha 941 966 986 998Puducherry 967 962 1037 1255Punjab 846 811 914 985Rajasthan 888 888 930 1102Sikkim 957 968 868 813Tamil Nadu 943 941 1008 1051Tripura 957 962 952 1040Uttar Pradesh 902 891 922 921Uttarakhand 890 898 991 1039West Bengal 956 949 940 1010India 918 908 944 1033
Table 1.5 : State-wise sex ratio in various age-groups in the context of developmental planning
State/Union Territory
Source : Census of India, 2011, Office of the Registrar General of India.
5

Total Rural Urban Total Rural Urban Total Rural Urban
(1) (2) (3) (4) (5) (6) (7) (8) (9) (10)
Andaman & Nicobar 934 946 914 906 924 879 877 874 882
Andhra Pradesh 939 926 965 966 933 1032 991 983 1006
Arunachal Pradesh 983 971 1023 988 981 1007 950 966 906
Assam 938 937 949 985 984 994 977 975 987
Bihar 854 852 874 846 845 850 916 919 894
Chandigarh 756 653 759 749 573 755 798 615 804
Chhattisgarh 972 981 941 986 991 969 987 995 964
Dadra & Nagar Haveli 775 852 669 627 717 536 672 760 598
Daman & Diu 584 838 497 406 735 338 491 774 429
Delhi 821 791 822 829 822 829 864 865 864
Goa 914 941 898 872 924 843 937 963 922
Gujarat 869 908 813 881 925 827 907 936 873
Haryana 805 815 785 834 836 830 881 878 886
Himachal Pradesh 896 908 791 945 962 805 987 1004 862
Jammu & Kashmir 914 922 888 928 947 877 891 926 814
Jharkhand 910 910 910 918 919 915 943 952 920
Karnataka 928 915 952 931 905 973 964 965 963
Kerala 963 964 963 1008 999 1019 1118 1105 1131
Lakshdweep 1053 1230 1008 948 1014 931 933 946 929
Madhya Pradesh 902 910 880 881 878 888 918 916 921
Maharashtra 878 883 872 879 886 872 914 934 892
Manipur 966 954 998 1002 988 1042 1012 995 1054
Meghalaya 979 971 1011 1011 1012 1011 1003 1003 1005
Mizoram 969 941 996 993 973 1010 983 959 1004
Nagaland 935 927 954 957 954 964 957 972 923
Odisha 981 990 935 1006 1018 949 998 1007 959
Puducherry 960 961 959 1040 1035 1042 1054 1036 1062
Punjab 791 800 775 843 861 813 909 930 876
Rajasthan 886 891 872 891 889 896 927 928 925
Sikkim 970 960 1003 941 926 990 883 866 929
Tamil Nadu 937 919 958 984 953 1019 1014 1004 1025
Tripura 965 962 974 1003 1000 1013 966 956 993
Uttar Pradesh 882 885 873 871 874 861 918 924 901
Uttarakhand 904 935 831 952 1003 847 988 1035 898
West Bengal 942 941 945 952 944 972 960 956 969
INDIA 898 901 892 908 907 910 945 949 935
Source: Census of India, 2011, Office of the Registrar General of India.
Table 1.6 : Sex Ratio of Adolescent, Youth & Reproductive Age group in India
States/UTsAdolescent (10-19 years) Youth (15-24 years) Reproductive Age (15-44)
6
State/Religion Hindu Muslim Christian Sikh Buddha Jain Total
(1) (2) (3) (4) (5) (6) (7) (8)
Andhra Pradesh 993 978 1059 869 950 960 993
Assam 958 955 985 750 958 916 958
Bihar 913 941 955 909 887 941 918
Chandigarh 803 721 954 940 956 966 818
Chhattisgarh 990 952 1029 906 1016 947 991
Delhi 865 855 1045 938 921 942 868
Gujarat 916 944 979 816 879 966 919
Haryana 876 895 924 903 833 923 879
Himachal Pradesh 975 856 848 925 955 910 972
Jammu & Kashmir 795 935 655 767 995 901 889
Jharkhand 935 943 1027 870 717 929 948
Karnataka 972 969 1050 803 740 952 973
Kerala 1077 1125 1051 755 946 1018 1084
Madhya Pradesh 929 945 1026 885 967 942 931
Maharashtra 928 911 1031 891 970 964 929
Odisha 977 956 1035 902 920 928 979
Punjab 879 862 913 906 935 912 895
Rajasthan 926 946 973 900 909 958 928
Tamil Nadu 992 1015 1035 805 872 957 996
Uttar Pradesh 907 937 950 885 920 921 912
Uttarakhand 976 901 944 912 675 934 963
West Bengal 948 951 1020 859 1001 958 950
INDIA 939 951 1023 903 965 954 943
Table 1.7 : Religion wise Sex Ratio among major States/UTs - Census 2011
Source : Census of India, 2011, Office of the Registrar General of India.
7

State/Union Territory 2012 2013 2014 2015 2016
(1) (2) (3) (4) (5) (6)Andaman & Nicobar Islands 934 947 1031 925 987Andhra Pradesh 985 954 955 971 806Arunachal Pradesh 819 978 993 895 964Assam 872 909 902 885 888Bihar NA 924 868 870 837Chandigarh 887 904 870 898 901Chhattisgarh 895 925 934 938 980Dadra & Nagar Havelli 954 876 890 1001 945Daman & Diu 886 961 916 924 974Delhi 886 895 896 898 902Goa 929 946 947 928 900Gujarat 902 901 886 NA NAHaryana 832 840 843 851 865Himachal Pradesh 916 906 896 903 910Jammu & Kashmir NA 923 914 912 914Jharkhand 847 885 886 879 863Karnataka 971 943 926 893 896Kerala 955 942 948 948 954Lakshadweep NA 969 1043 891 945Madhya Pradesh 912 904 908 904 909Maharashtra 894 901 911 883 904Manipur 797 700 684 686 NAMeghalaya 947 978 968 975 NAMizoram 968 954 963 973 964Nagaland 873 873 860 897 967Odisha 896 886 880 866 858Puducherry 909 910 911 939 931Punjab 844 876 880 891 857Rajasthan 861 859 799 794 806Sikkim 974 956 968 973 999Tamil Nadu 904 853 834 818 840Telangana NA 954 961 834 881Tripura 980 1055 882 1000 917Uttar Pradesh 930 883 881 877 885Uttarakhand 847 843 865 862 825West Bengal 926 913 897 919 911India 908 898 887 881 877
Table 1.8 : Sex Ratio at Birth based on registered events
Source : Civil Registration System, O/o Registrar General of India
NA:- Not Available.
8

2012-14 2013-15 2014-16 2015-17 2012-14 2013-15 2014-16 2015-17 2012-14 2013-15 2014-16 2015-17(1) (2) (3) (4) (5) (6) (7) (8) (9) (10) (11) (12) (13)
Andhra Pradesh 919 918 913 916 917 933 923 928 925 885 888 885Assam 918 900 896 915 919 902 898 918 908 876 880 891Bihar 907 916 908 900 909 921 912 904 889 870 871 865Chhattisgarh 973 961 963 961 982 987 995 985 921 839 833 862Delhi 876 869 857 850 899 909 917 926 873 866 856 848Gujarat 907 854 848 855 917 871 867 865 890 826 820 838Haryana 866 831 832 833 869 836 835 828 859 821 824 844Himachal Pradesh 938 924 917 918 940 929 921 920 901 844 852 878Jammu& Kashmir 899 899 906 917 899 895 903 919 897 915 919 910Jharkhand 910 902 918 916 918 914 927 927 867 852 882 876Karnataka 950 939 935 929 957 967 965 958 936 887 883 879Kerala 974 967 959 948 970 978 972 965 985 950 946 931Madhya Pradesh 927 919 922 916 925 911 913 908 934 954 957 950Maharashtra 896 878 876 881 888 871 872 886 908 890 882 875Odisha 953 950 948 938 957 961 959 946 922 869 871 881Punjab 870 889 893 886 863 869 876 874 881 924 921 905Rajasthan 893 861 857 856 896 867 862 858 880 840 838 851Tamil Nadu 921 911 915 907 923 920 926 919 918 901 903 896Telangana 901 897 940 922 841 859Uttar Pradesh 869 879 882 878 866 869 871 862 882 923 923 938Uttarakhand 871 844 850 841 879 850 857 849 848 828 832 816West Bengal 952 951 937 939 949 953 938 943 964 944 932 925India 906 900 898 896 907 903 902 898 905 890 888 890Source : Sample Registration System, O/o Registrar General of India
Table 1.9 : Sex ratio at birth for bigger States based on Sample Registration System
StatesTotal Rural Urban
Included in Andhra Pradesh Included in Andhra Pradesh Included in Andhra Pradesh
9

Age-Group
(years) Female Male Female Male Female Male Female Male Female Male
(1) (2) (3) (4) (5) (6) (7) (8) (9) (10) (11)
0-4 9.2 9.7 8.7 9.1 8.4 8.8 8.2 8.7 8.1 8.5
5-9 9.0 9.3 8.9 9.2 8.8 9.2 8.8 9.1 8.6 8.9
10-14 9.5 10.0 9.5 9.9 9.5 9.9 9.4 9.8 9.2 9.6
15-19 9.7 10.5 9.8 10.4 9.9 10.5 9.9 10.4 10.0 10.5
20-24 10.4 9.7 10.6 10.0 10.7 10.1 10.7 10.2 10.8 10.4
25-29 9.3 9.2 9.6 9.3 9.8 9.5 9.8 9.5 10.0 9.7
30-34 7.7 7.8 7.8 7.9 7.9 8.0 8.0 8.1 8.2 8.3
35-39 7.2 7.0 7.2 6.9 7.1 6.9 7.2 7.0 7.2 7.1
40-44 6.0 6.0 6.0 6.2 6.0 6.1 6.1 6.1 6.2 6.2
45-49 5.5 5.4 5.3 5.3 5.3 5.3 5.4 5.3 5.3 5.3
50-54 3.9 4.3 4.2 4.4 4.2 4.3 4.3 4.4 4.3 4.3
55-59 3.8 3.2 3.8 3.4 3.8 3.4 3.7 3.5 3.6 3.4
60-64 3.1 2.9 3.1 3.0 3.1 3.0 3.1 3.0 3.1 3.0
65-69 2.3 2.1 2.2 2.1 2.2 2.1 2.2 2.1 2.2 2.1
70+ 3.4 2.8 3.3 2.9 3.2 2.8 3.2 2.8 3.2 2.7
Source: Sample Registration System, Office of the Registrar General, India.
Note: Total may not add up to 100 due to rounding off.
Table 1.10 : Percentage Distribution of Population by Age-group and Sex
2013 2014 2015 2016 2017
10

Never Married Married W/D/S Never
Married Married W/D/S Never Married Married W/D/S
(1) (2) (3) (4) (5) (6) (7) (8) (9) (10) (11)
15-19 10.8 0.1 0.0 9.9 0.5 0.0 10.4 0.3 0.0
20-24 8.9 1.7 0.0 5.7 5.2 0.0 7.3 3.4 0.0
25-29 4.2 5.3 0.0 1.5 8.0 0.1 2.9 6.6 0.1
30-34 1.2 6.5 0.1 0.4 7.2 0.2 0.8 6.9 0.1
35-39 0.4 6.2 0.1 0.2 6.5 0.3 0.3 6.3 0.2
40-44 0.2 5.5 0.1 0.1 5.4 0.3 0.2 5.4 0.2
45-49 0.1 4.8 0.1 0.1 4.6 0.5 0.1 4.7 0.3
15-19 9.3 0.1 0.0 8.7 0.3 0.0 9.0 0.2 0.0
20-24 9.0 0.9 0.0 6.8 3.7 0.0 7.9 2.2 0.0
25-29 5.9 4.1 0.0 2.9 7.8 0.1 4.5 5.9 0.1
30-34 2.3 6.9 0.1 0.8 8.2 0.2 1.6 7.5 0.1
35-39 0.9 7.0 0.1 0.3 7.3 0.3 0.6 7.2 0.2
40-44 0.4 6.4 0.1 0.2 6.3 0.4 0.3 6.4 0.2
45-49 0.2 5.5 0.1 0.1 5.2 0.5 0.2 5.3 0.3
15-19 10.3 0.1 0.0 9.5 0.5 0.0 9.9 0.3 0.0
20-24 8.9 1.4 0.0 6.0 4.7 0.0 7.5 3.0 0.0
25-29 4.7 4.9 0.0 2.0 7.9 0.1 3.4 6.4 0.1
30-34 1.6 6.7 0.1 0.5 7.5 0.2 1.1 7.1 0.1
35-39 0.6 6.4 0.1 0.2 6.8 0.3 0.4 6.6 0.2
40-44 0.3 5.8 0.1 0.1 5.7 0.3 0.2 5.7 0.2
45-49 0.2 5.0 0.1 0.1 4.8 0.5 0.1 4.9 0.3
Urban
Total
Source: Sample Registration System, Office of the Registrar General, India.
W/D/S: Widowed/Divorced/Separated.
Table 1.11 : Percent Distribution of Population in reproductive age group by Sex, Marital Status and Age-Group, 2017
Age-groupMales Females Total
Rural
11

2015 2016 2017 2015 2016 2017 2015 2016 2017
(1) (2) (3) (4) (5) (6) (7) (8) (9) (10)
Andhra Pradesh 21.6 21.7 21.7 22.3 22.4 22.9 21.8 21.9 22.0
Assam 22.0 21.9 22.1 24.4 23.9 23.5 22.4 22.2 22.3
Bihar 21.9 21.3 21.6 22.5 22.6 22.6 22.0 21.5 21.8
Chhattisgarh 21.5 21.3 21.7 22.9 22.4 22.5 22.0 21.6 21.8
Delhi 25.6 23.3 23.7 23.4 23.4 23.7 23.4 23.4 23.7
Gujarat 21.1 21.7 21.7 22.8 22.7 23.4 22.3 22.0 22.5
Haryana 21.7 22.0 22.1 23.0 22.7 22.9 21.9 22.3 22.5
Himachal Pradesh 22.9 23.2 23.3 24.9 25.9 25.4 23.0 23.3 23.4
Jammu & Kashmir 24.5 24.1 24.5 25.5 25.2 26.3 24.8 24.7 25.1
Jharkhand 20.9 21.1 21.4 22.4 22.7 22.9 21.8 21.5 21.9
Karnataka 21.5 21.8 21.7 22.8 23.4 23.2 22.0 22.5 22.3
Kerala 23.0 23.1 23.0 23.5 23.2 23.5 23.2 23.1 23.2
Madhya Pradesh 21.3 21.0 21.0 22.7 23.0 22.7 21.7 21.6 21.4
Maharashtra 21.0 21.3 21.9 23.4 23.6 23.5 22.6 22.4 22.5
Odisha 22.0 22.0 21.7 23.0 23.2 23.3 22.2 22.1 21.9
Punjab 22.9 23.2 22.6 24.2 23.4 24.3 23.4 23.3 23.5
Rajasthan 21.3 21.2 21.2 22.0 22.1 22.6 21.5 21.5 21.5
Tamil Nadu 22.6 22.6 22.7 23.4 23.4 23.3 23.1 23.0 23.0
Telangana 21.3 21.4 21.6 23.0 22.8 22.8 22.1 22.1 22.0
Uttar Pradesh 21.8 21.8 21.7 22.7 23.2 23.4 21.9 22.3 22.2
Uttarakhand 22.1 22.0 21.9 23.0 23.1 23.2 22.3 22.3 22.3
West Bengal 20.5 20.8 20.7 22.2 22.2 22.0 21.0 21.2 21.2
India 21.6 21.7 21.7 23.0 23.1 23.1 22.1 22.2 22.1
Source: Sample Registration System, Office of the Registrar General of India.
Table 1.12 : Women's Mean Age at Marriage in Major States
(Age in years)
Major StatesRural Urban Combined
12


Total Rural Urban Total Rural Urban Total Rural Urban Total Rural Urban
(1) (2) (3) (4) (5) (6) (7) (8) (9) (10) (11) (12) (13)
Crude birth rate 21.0 22.7 17.4 20.8 22.4 17.3 20.4 22.1 17.0 20.2 21.8 16.8
General fertility rate 77.6 85.4 61.7 76.2 83.8 60.8 74.4 81.8 59.5 72.4 79.6 58.0
15 - 19 27.3 29.9 20.6 11.1 12.3 8.3 10.7 12.3 6.7 13.0 14.9 8.5
20 - 24 174.9 195.6 128.9 173.8 192.7 132.0 135.4 152.3 98.2 137.1 153.2 101.9
25 - 29 143.7 154.2 123.9 150.3 163.5 125.8 166.0 180.2 139.1 157.1 171.4 130.4
30 - 34 76.6 83.7 63.8 77.6 85.3 63.6 91.7 100.3 76.5 84.3 90.1 74.1
35 - 39 26.4 29.0 21.3 26.2 28.9 21.1 32.7 35.6 27.2 30.1 33.6 23.8
40 - 44 10.5 11.7 8.3 10.9 12.3 8.4 11.3 12.8 8.4 10.9 12.9 7.3
45 - 49 3.6 4.0 2.8 3.6 4.1 2.8 4.1 5.0 2.5 3.3 3.9 2.3
Total fertility rate 2.3 2.5 1.8 2.3 2.5 1.8 2.3 2.5 1.8 2.2 2.4 1.7
Gross reproduction rate 1.1 1.2 0.8 1.1 1.2 0.8 1.1 1.2 0.8 1.0 1.1 0.8
General marital fertility rate 107.7 117.5 87.3 113.4 123.8 92.0 113.4 123.8 92.1 110.3 120.4 89.9
Total marital Fertility rate 3.9 4.0 3.5 4.6 4.7 4.2 5.0 5.3 4.3 4.7 4.9 4.1
Mean age at effective marriage for females 22.3 21.8 23.2 22.1 21.6 23.0 22.2 21.7 23.1 22.1 21.7 23.1
Illiterate 3.1 3.2 2.4 3.7 3.9 2.7 2.9 3.0 2.1 2.9 3.0 2.2
Literate 2.2 2.4 1.8 2.1 2.3 1.8 2.2 2.4 1.8 2.1 2.3 1.7
Without any formal education 2.5 2.6 2.1 2.6 2.7 2.3 2.3 2.4 1.8 2.4 2.5 2.0
Below primary 2.6 2.8 2.3 2.8 3.0 2.4 2.9 3.0 2.4 3.1 3.2 2.8
Primary 2.6 2.7 2.3 2.6 2.7 2.3 2.7 2.8 2.3 2.7 2.8 2.4
Middle 2.4 2.5 2.1 2.3 2.4 2.0 2.4 2.6 2.1 2.3 2.4 2.1
Class X 2.1 2.3 1.9 2.0 2.1 1.8 2.2 2.3 1.9 2.0 2.2 1.7
Class XII 1.9 2.0 1.7 1.7 1.9 1.6 1.9 2.1 1.6 1.8 1.9 1.6
Graduate and above 1.7 1.9 1.5 1.6 1.8 1.5 1.7 1.9 1.5 1.4 1.7 1.3
1 43.0 41.3 47.9 48.6 46.5 54.4 49.7 47.5 55.8 48.3 46.0 54.5
2 31.0 30.1 33.5 28.5 27.9 30.3 28.4 28.1 29.2 30.0 29.7 30.6
3 15.1 16.1 12.3 13.4 14.5 10.3 12.9 13.9 10.0 12.9 14.1 10.0
4+ 10.8 12.5 6.2 9.5 11.1 5.0 9.0 10.6 4.9 8.8 10.2 4.9
10 to 12 1.3 1.3 1.4 2.1 2.2 1.9 2.0 2.0 1.8 2.0 2.2 1.6
12 to 18 6.8 6.8 6.9 7.4 7.7 6.4 8.6 8.9 7.8 8.0 8.6 6.4
18 to 24 9.9 9.6 11.0 9.7 9.4 10.4 13.2 13.8 10.9 13.2 13.7 11.7
24 to 30 12.4 12.7 11.3 10.4 10.5 10.1 12.9 13.6 10.5 14.2 15.0 11.7
30 to 36 12.6 12.9 11.9 11.0 11.0 11.3 11.4 11.6 10.4 12.2 12.7 10.7
36+ 56.9 56.8 57.3 59.4 59.2 60.0 51.9 50.1 58.5 50.3 47.8 58.0
GovernmentHospital 52.0 50.8 55.3 52.6 51.5 55.5 53.4 52.5 56.1 54.0 53.2 56.3
PrivateHospital 26.5 22.4 37.8 26.7 22.7 38.0 27.4 23.6 38.1 27.8 24.1 38.2
Qualified Professional 11.3 13.4 5.4 10.9 13.0 5.3 10.3 12.2 4.8 9.9 11.8 4.7
Untrained Functionary and others 10.2 13.4 1.4 9.8 12.9 1.2 8.9 11.7 1.0 8.2 10.8 0.9Source: Sample Registration System, Office of the Registrar General, India.
Percentage distribution of births by type of medical attention at delivery
Percentage distribution of current live births by birth interval (in months)
Percentage distribution of live births by birth order
Total fertility rate by level of education of the mother
Age-specific Fertility rate
Fertility Indicators
Table 2.1: Important Women Related Vital Rates in India for last 4 Years
Indicators2014 2016 20172015
13

(1) (2)
State
Assam
Bihar
Chhattisgarh
Jharkhand
Madhya Pradesh
Odisha
Rajasthan
Uttarakhand
Uttar Pradesh
Female Male Person Female Male Person Female Male Person
Assam 6.1 7.3 6.7 4.6 5.9 5.3 5.9 7.1 6.5
Bihar 6.0 5.8 5.9 5.5 5.2 5.4 5.9 5.7 5.8
Chhattisgarh 7.5 8.7 8.1 4.9 6.3 5.6 6.9 8.2 7.5
Jharkhand 6.6 5.2 5.8 4.7 4.5 4.6 6.1 5.0 5.5
Madhya Pradesh 6.5 8.0 7.3 5.1 5.9 5.5 6.1 7.5 6.8
Odisha 7.0 8.4 7.7 5.7 6.3 6.0 6.8 8.1 7.4
Rajasthan 5.4 7.1 6.3 5.1 5.2 5.1 5.3 6.6 6.0
Uttarakhand 5.7 8.4 7.1 5.0 6.2 5.6 5.5 7.8 6.7
Uttar Pradesh 7.0 7.4 7.2 5.3 5.5 5.4 6.5 6.9 6.7
Female Male Person Female Male Person Female Male Person
Assam 49 44 46 22 21 21 46 41 44
Bihar 38 34 36 33 29 31 37 34 35
Chhattisgarh 38 41 40 33 31 32 37 39 38
Jharkhand 34 27 30 31 19 24 33 25 29
Madhya Pradesh 49 52 51 29 34 32 45 48 47
Odisha 42 42 42 33 32 32 41 40 41
Rajasthan 43 40 42 30 26 28 40 37 38
Uttarakhand 28 38 33 32 29 30 29 35 32
Uttar Pradesh 45 42 44 38 28 33 43 39 41
Female Male Person Female Male Person Female Male Person
Assam 54 47 51 22 23 22 51 45 48
Bihar 44 39 42 35 34 34 43 39 41
Chhattisgarh 47 53 50 33 32 33 44 49 47
Jharkhand 39 31 35 33 24 28 38 30 34
Madhya Pradesh 60 62 61 31 36 34 54 56 55
Odisha 49 48 49 41 34 37 48 46 47
Rajasthan 50 44 47 30 28 29 45 41 43
Uttarakhand 32 40 36 33 33 33 32 38 35
Uttar Pradesh 51 47 49 39 30 35 48 43 46
Total
Infa
nt M
orta
lity
Rat
e
Rural Total
Cru
de D
eath
Rat
es
Rural Total
Und
er fi
ve M
orta
lity
Rat
e (U
5MR
) 201
6
Rural
Urban
Urban
Urban
18.3
25.0 24.1
16.4
22.6
Empowered Action Group States : 8 States (Bihar, Chhattisgarh, Jharkhand, Madhya Pradesh, Odisha, Rajasthan, Uttar Pradesh and Uttarakhand) alongwith Assam
Urban
(4)
14.7
20.9
18.0
18.2
19.4
13.5
21.5
(3) (5)
Cru
de B
irth
Rat
es
Rural Total
22.4
Table 2.2 : Important Vital Rates in Empowered Action Group (EAG) States: 2017
Source: Sample Registration System, Office of the Registrar General, India.
24.2 22.7
26.8 24.8
21.2
27.2 26.4
24.1 22.7
17.6 17.3
27.0 25.9
19.3
14

2013 2014 2015 2016 2017 2013 2014 2015 2016 2017 2013 2014 2015 2016 2017(1) (2) (3) (4) (5) (6) (7) (8) (9) (10) (11) (12) (13) (14) (15) (16)
Andaman & Nicobar Islands 14.6 14.7 12.0 11.7 11.4 4.6 4.6 5.0 5.2 5.1 24.0 22.0 20.0 16.0 14.0Andhra Pradesh 17.4 17.0 16.8 16.4 16.2 7.3 7.3 7.1 6.8 7.2 39.0 39.0 37.0 34.0 32.0Arunachal Pradesh 19.3 19.2 18.8 18.9 18.3 5.8 6.6 6.0 6.2 6.1 32.0 30.0 30.0 36.0 42.0Assam 22.4 22.4 22.0 21.7 21.2 7.8 7.2 7.1 6.7 6.5 54.0 49.0 47.0 44.0 44.0Bihar 27.6 25.9 26.3 26.8 26.4 6.6 6.2 6.2 6.0 5.8 42.0 42.0 42.0 38.0 35.0Chandigarh 14.7 14.3 13.7 13.9 13.5 4.0 4.0 4.4 4.5 4.5 21.0 23.0 21.0 14.0 14.0Chhattisgarh 24.4 23.4 23.2 22.8 22.7 7.9 7.7 7.5 7.4 7.5 46.0 43.0 41.0 39.0 38.0D & N Haveli 25.5 25.6 25.5 24.5 23.6 4.4 4.2 3.9 4.0 4.4 31.0 26.0 21.0 17.0 13.0Daman & Diu 17.9 17.3 17.1 24.0 20.2 4.9 4.6 4.7 4.6 4.7 20.0 18.0 18.0 19.0 17.0Delhi 17.2 16.8 16.4 15.5 15.2 4.1 3.8 3.6 4.0 3.7 24.0 20.0 18.0 18.0 16.0Goa 13.0 12.9 12.7 12.9 12.5 6.6 6.6 6.4 6.7 6.2 9.0 10.0 9.0 8.0 9.0Gujarat 20.8 20.6 20.4 20.1 19.9 6.5 6.2 6.1 6.1 6.2 36.0 35.0 33.0 30.0 30.0Haryana 21.3 21.2 20.9 20.7 20.5 6.3 6.1 6.1 5.9 5.8 41.0 36.0 36.0 33.0 30.0Himachal Pradesh 16.0 16.4 16.3 16.0 15.8 6.7 6.7 6.6 6.8 6.6 35.0 32.0 28.0 25.0 22.0Jammu and Kashmir 17.5 16.8 16.2 15.7 15.4 5.3 5.1 4.9 5.0 4.8 37.0 34.0 26.0 24.0 23.0Jharkhand 24.6 23.8 23.5 22.9 22.7 6.8 5.9 5.8 5.5 5.5 37.0 34.0 32.0 29.0 29.0Karnataka 18.3 18.1 17.9 17.6 17.4 7.0 6.8 6.6 6.7 6.5 31.0 29.0 28.0 24.0 25.0Kerala 14.7 14.8 14.8 14.3 14.2 6.9 6.6 6.6 7.6 6.8 12.0 12.0 12.0 10.0 10.0Lakshadweep 14.8 14.0 14.7 18.9 15.0 6.3 6.1 6.2 6.0 6.5 24.0 20.0 20.0 19.0 20.0Madhya Pradesh 26.3 25.7 25.5 25.1 24.8 8.0 7.8 7.5 7.1 6.8 54.0 52.0 50.0 47.0 47.0Maharashtra 16.5 16.5 16.3 15.9 15.7 6.2 6.0 5.8 5.9 5.7 24.0 22.0 21.0 19.0 19.0Manipur 14.7 14.6 14.4 12.9 14.6 4.0 4.3 4.0 4.5 5.3 10.0 11.0 9.0 11.0 12.0Meghalaya 23.9 24.1 23.7 23.7 22.8 7.6 7.5 7.4 6.6 6.1 47.0 46.0 42.0 39.0 39.0Mizoram 16.1 16.4 16.2 15.5 15.0 4.3 4.3 4.2 4.2 4.0 35.0 32.0 32.0 27.0 15.0Nagaland 15.4 15.3 14.8 14.0 13.5 3.1 3.1 3.0 4.5 3.6 18.0 14.0 12.0 12.0 7.0Odisha 19.6 19.4 19.2 18.6 18.3 8.4 7.9 7.6 7.8 7.4 51.0 49.0 46.0 44.0 41.0Pudducherry 15.7 14.6 13.8 13.9 13.2 7.0 6.6 6.8 7.2 7.3 17.0 14.0 11.0 10.0 11.0Punjab 15.7 15.5 15.2 14.9 14.9 6.7 6.4 6.2 6.0 7.0 26.0 24.0 23.0 21.0 21.0Rajasthan 25.6 25.0 24.8 24.3 24.1 6.5 6.4 6.3 6.1 6.0 47.0 46.0 43.0 41.0 38.0Sikkim 17.1 17.1 17.0 16.6 16.4 5.2 5.1 5.0 4.7 4.5 22.0 19.0 18.0 16.0 12.0Tamil Nadu 15.6 15.4 15.2 15.0 14.9 7.3 7.0 6.7 6.4 6.7 21.0 20.0 19.0 17.0 16.0
Telangana Incl. in A.P 18.0 17.8 17.5 17.2 Incl. in
A.P 6.7 6.5 6.1 6.6 Incl. in A.P. 35.0 34.0 31.0 29.0
Tripura 13.7 14.9 14.7 13.7 13.0 4.7 4.7 5.2 5.5 5.2 26.0 21.0 20.0 24.0 29.0Uttar Pradesh 27.2 27.0 26.7 26.2 25.9 7.7 7.4 7.2 6.9 6.7 50.0 48.0 46.0 43.0 41.0Uttarakhand 18.2 18.2 17.8 16.6 17.3 6.1 6.0 6.4 6.7 6.7 32.0 33.0 34.0 38.0 32.0West Bengal 16.0 15.6 15.5 15.4 15.2 6.4 6.1 5.9 5.8 5.8 31.0 28.0 26.0 25.0 24.0All India 21.4 21.0 20.8 20.4 20.2 7.0 6.7 6.5 6.4 6.3 40.0 39.0 37.0 34.0 33.0Source: Sample Registration System, Office of Registrar General, India
Table 2.3 : State-wise Birth Death Indicators for last 5 years
States/UTsCrude Birth Rate(CBR) Crude Death Rate (CDR) Infant Mortality Rate(IMR)
15

Period Female Male (1) (2) (3)
1990-94 60.4 59.41991-95 60.9 59.71992-96 61.4 60.11993-97 61.8 60.41994-98 62.2 60.61995-99 62.3 60.81996-00 62.7 61.21997-01 63.3 61.41998-02 64 61.91999-03 64.6 62.32000-04 65.2 62.82001-05 65.6 63.12002-06 66.1 63.52003-07 66.5 63.72004-08 66.9 64.02005-09 67.2 64.32006-10 67.7 64.62007-11 68.2 64.92008-12 68.8 65.42009-13 69.3 65.82010-14 69.6 66.42011-15 70 66.92012-16 70.2 67.4
2011-15* 69.96 66.872016-20* 71.46 68.372021-25* 72.66 69.372026-30* 73.66 70.372031-36* 74.66 71.17
Table 2.4 : Life Expectancy at birth by sex
Source: Sample Registration System, Office of the Registrar General, India.
* Report Of The Technical Group On Population Projections, November, 2019, MoHFW
16
Year Female Male Total (1) (2) (3) (4)
2008 55 52 532009 52 49 502010 49 46 472011 46 43 442012 44 41 422013 42 39 402014 40 37 392015 39 35 372016 36 33 342017 34 32 33
Table 2.5 : Infant Mortality Rate for last 10 Year
Source: Sample Registration System, Office of Registrar General, India
17

State/Union Territory 2001-03 2004-06 2007-09 2010-12 2011-13 2015-17
(1) (2) (3) (4) (5) (6) (7)
Andhra Pradesh 195 154 134 110 74 74
Assam 490 480 390 328 237 229
Bihar 371 312 261 219 165 165
Jharkhand * * * * * 76
Gujarat 172 160 148 122 91 87
Haryana 162 186 153 146 101 98
Karnataka 228 213 178 144 108 97
Kerala 110 95 81 66 46 42
Madhya Pradesh 379 335 269 230 173 188
Chhattisgarh ** ** ** ** ** 141
Maharashtra 149 130 104 87 61 55
Odisha 358 303 258 235 180 168
Punjab 178 192 172 155 122 122
Rajasthan 445 388 318 255 199 186
Tamil Nadu 134 111 97 90 66 63
Uttar Pradesh 517 440 359 292 201 216
Uttarakhand *** *** *** *** *** 89
West Bengal 194 141 145 117 101 94
India 301 254 212 178 130 122
Table 2.6 : Maternal Mortality Ratio (MMR)
Source: Sample Registration System, Office of the Registrar General, India
* included in Bihar ** included in Madhya Pradesh *** included in Uttar Pradesh
18

Total literate
Without any formal education
Below primary Primary Middle Class X Class XII Graduate
and above Total
(1) (2) (3) (4) (5) (6) (7) (8) (9) (10) (11) (12)
Total 2.9 2.1 2.4 3.1 2.7 2.3 2.0 1.8 1.4 2.1
Rural 3.0 2.3 2.5 3.2 2.8 2.4 2.2 1.9 1.7 2.3
Urban 2.2 1.7 2.0 2.8 2.4 2.1 1.7 1.6 1.3 1.7
Total 73.1 72.6 68.4 92.2 82.5 71.5 67.0 68.6 63.6 72.6
Rural 77.0 80.7 72.1 96.5 87.9 76.8 75.7 78.0 80.8 80.7
Urban 54.7 58.6 54.7 78.1 68.3 59.3 52.9 57.3 54.7 58.6
15-19 30.3 12.6 26.4 31.9 19.5 10.2 8.0 8.2 0.0 13.0
20-24 194.1 133.7 157.2 254.9 215.8 174.2 130.1 74.2 61.7 137.1
25-29 182.7 154.3 154.3 200.5 180.4 168.9 156.7 152.6 99.2 157.1
30-34 102.3 81.1 87.8 91.9 78.4 78.6 73.6 86.1 82.3 84.3
35-39 40.9 27.2 31.8 33.9 27.1 24.8 23.0 24.2 30.1 30.1
40-44 17.3 8.6 12.5 10.5 9.2 7.5 6.3 8.2 7.4 10.9
45-49 4.4 2.9 4.1 4.8 3.0 3.4 1.8 0.9 0.9 3.3
15-19 33.3 14.3 27.5 34.1 21.3 11.6 9.2 8.8 0.0 14.9
20-24 199.6 149.9 164.7 262.5 222.0 177.8 139.0 84.6 73.5 153.2
25-29 189.2 169.1 158.7 204.3 184.8 175.0 168.5 162.5 119.3 171.4
30-34 106.8 85.9 94.5 96.6 80.7 81.4 79.8 90.4 92.9 90.1
35-39 44.6 29.4 31.9 34.9 31.0 26.4 24.5 26.8 31.9 33.6
40-44 18.7 10.0 13.5 10.6 9.5 8.9 7.7 8.1 14.0 12.9
45-49 4.9 3.4 4.2 4.2 2.4 4.1 2.5 1.7 2.1 3.9
15-19 14.7 8.4 22.1 23.3 13.6 6.5 5.7 7.3 0.0 8.5
20-24 166.2 100.0 126.6 225.7 194.9 162.7 108.7 58.5 51.8 101.9
25-29 151.0 129.7 136.8 187.4 167.8 154.5 136.8 139.3 86.7 130.4
30-34 79.8 74.0 62.3 76.8 72.7 72.9 65.4 81.8 78.2 74.1
35-39 23.1 24.0 31.7 30.3 18.2 22.1 21.4 22.0 29.5 23.8
40-44 11.4 6.8 8.9 10.3 8.6 5.2 4.9 8.2 5.7 7.3
45-49 2.2 2.3 3.6 6.4 4.1 2.4 1.1 0.4 0.6 2.3
Urb
an
Source: Sample Registration System, Office of Registrar General, India
Total fertility rate
General fertility rate
Tota
l
Age Specific Fertility Rates
Rur
al
Table 2.7 : Fertility indicators by level of education of women, 2017
Resi
denc
e
Illite
rate
Educational levelLiterate
Indicator
19
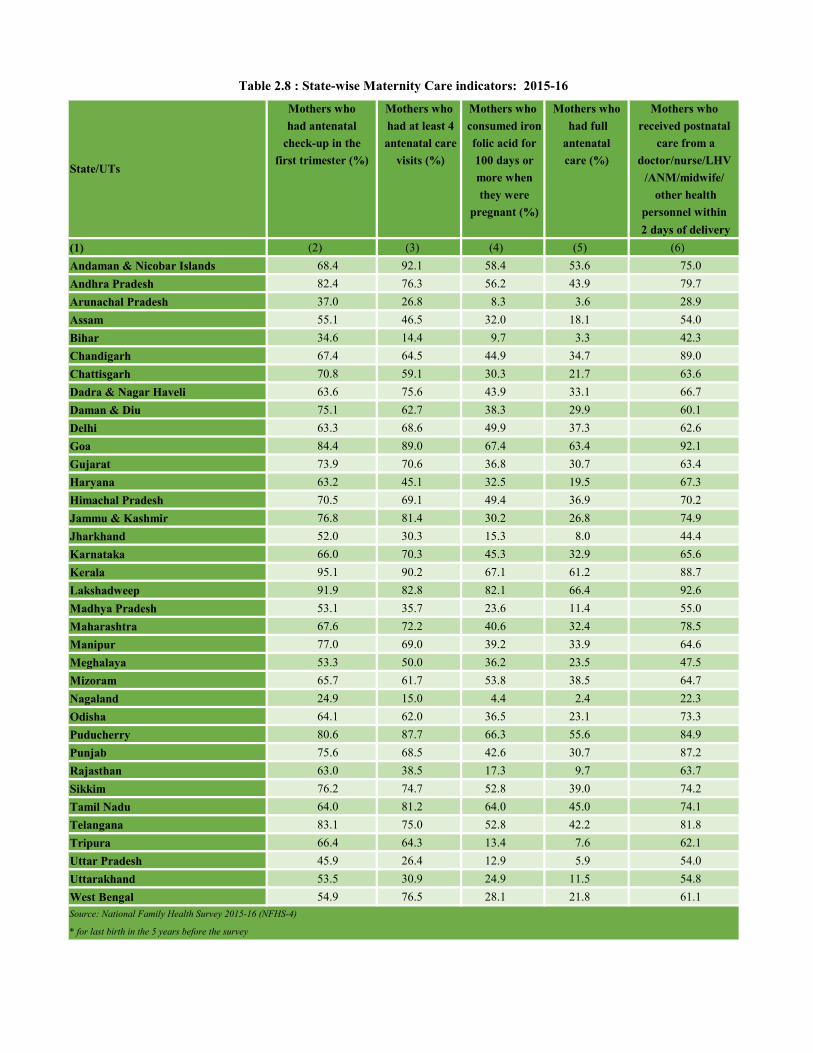
Mothers who Mothers who Mothers who Mothers who Mothers whohad antenatal had at least 4 consumed iron had full received postnatal
check-up in the antenatal care folic acid for antenatal care from afirst trimester (%) visits (%) 100 days or care (%) doctor/nurse/LHV
more when /ANM/midwife/ they were other health
pregnant (%) personnel within 2 days of delivery
(1) (2) (3) (4) (5) (6) Andaman & Nicobar Islands 68.4 92.1 58.4 53.6 75.0Andhra Pradesh 82.4 76.3 56.2 43.9 79.7Arunachal Pradesh 37.0 26.8 8.3 3.6 28.9Assam 55.1 46.5 32.0 18.1 54.0Bihar 34.6 14.4 9.7 3.3 42.3Chandigarh 67.4 64.5 44.9 34.7 89.0Chattisgarh 70.8 59.1 30.3 21.7 63.6Dadra & Nagar Haveli 63.6 75.6 43.9 33.1 66.7Daman & Diu 75.1 62.7 38.3 29.9 60.1Delhi 63.3 68.6 49.9 37.3 62.6Goa 84.4 89.0 67.4 63.4 92.1Gujarat 73.9 70.6 36.8 30.7 63.4Haryana 63.2 45.1 32.5 19.5 67.3Himachal Pradesh 70.5 69.1 49.4 36.9 70.2Jammu & Kashmir 76.8 81.4 30.2 26.8 74.9Jharkhand 52.0 30.3 15.3 8.0 44.4Karnataka 66.0 70.3 45.3 32.9 65.6Kerala 95.1 90.2 67.1 61.2 88.7Lakshadweep 91.9 82.8 82.1 66.4 92.6Madhya Pradesh 53.1 35.7 23.6 11.4 55.0Maharashtra 67.6 72.2 40.6 32.4 78.5Manipur 77.0 69.0 39.2 33.9 64.6Meghalaya 53.3 50.0 36.2 23.5 47.5Mizoram 65.7 61.7 53.8 38.5 64.7Nagaland 24.9 15.0 4.4 2.4 22.3Odisha 64.1 62.0 36.5 23.1 73.3Puducherry 80.6 87.7 66.3 55.6 84.9Punjab 75.6 68.5 42.6 30.7 87.2Rajasthan 63.0 38.5 17.3 9.7 63.7Sikkim 76.2 74.7 52.8 39.0 74.2Tamil Nadu 64.0 81.2 64.0 45.0 74.1Telangana 83.1 75.0 52.8 42.2 81.8Tripura 66.4 64.3 13.4 7.6 62.1Uttar Pradesh 45.9 26.4 12.9 5.9 54.0Uttarakhand 53.5 30.9 24.9 11.5 54.8West Bengal 54.9 76.5 28.1 21.8 61.1
Table 2.8 : State-wise Maternity Care indicators: 2015-16
State/UTs
Source: National Family Health Survey 2015-16 (NFHS-4)
* for last birth in the 5 years before the survey
20
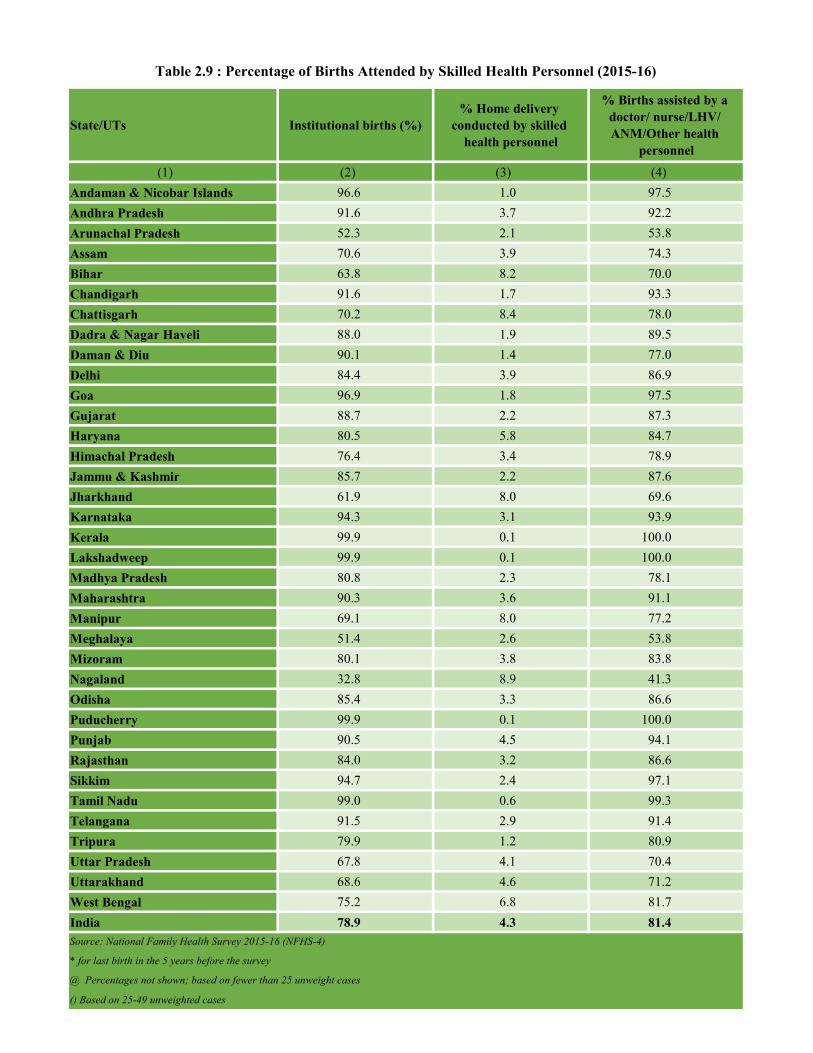
State/UTs Institutional births (%) % Home delivery
conducted by skilled health personnel
% Births assisted by a doctor/ nurse/LHV/ ANM/Other health
personnel(1) (2) (3) (4)
Andaman & Nicobar Islands 96.6 1.0 97.5Andhra Pradesh 91.6 3.7 92.2Arunachal Pradesh 52.3 2.1 53.8Assam 70.6 3.9 74.3Bihar 63.8 8.2 70.0Chandigarh 91.6 1.7 93.3Chattisgarh 70.2 8.4 78.0Dadra & Nagar Haveli 88.0 1.9 89.5Daman & Diu 90.1 1.4 77.0Delhi 84.4 3.9 86.9Goa 96.9 1.8 97.5Gujarat 88.7 2.2 87.3Haryana 80.5 5.8 84.7Himachal Pradesh 76.4 3.4 78.9Jammu & Kashmir 85.7 2.2 87.6Jharkhand 61.9 8.0 69.6Karnataka 94.3 3.1 93.9Kerala 99.9 0.1 100.0Lakshadweep 99.9 0.1 100.0Madhya Pradesh 80.8 2.3 78.1Maharashtra 90.3 3.6 91.1Manipur 69.1 8.0 77.2Meghalaya 51.4 2.6 53.8Mizoram 80.1 3.8 83.8Nagaland 32.8 8.9 41.3Odisha 85.4 3.3 86.6Puducherry 99.9 0.1 100.0Punjab 90.5 4.5 94.1Rajasthan 84.0 3.2 86.6Sikkim 94.7 2.4 97.1Tamil Nadu 99.0 0.6 99.3Telangana 91.5 2.9 91.4Tripura 79.9 1.2 80.9Uttar Pradesh 67.8 4.1 70.4Uttarakhand 68.6 4.6 71.2West Bengal 75.2 6.8 81.7India 78.9 4.3 81.4
Table 2.9 : Percentage of Births Attended by Skilled Health Personnel (2015-16)
Source: National Family Health Survey 2015-16 (NFHS-4)
* for last birth in the 5 years before the survey
@ Percentages not shown; based on fewer than 25 unweight cases
() Based on 25-49 unweighted cases
21

Non-pregnant women age 15-49 years who are
anaemic
Pregnant women age 15-49 years who are anaemic
(<12.0 g/dl) (%) (<11.0 g/dI) (%)(1) (2) (3) (4) Andaman & Nicobar Islands 65.8 61.4 65.7Andhra Pradesh 60.2 52.9 60.0Arunachal Pradesh 40.6 33.8 40.3Assam 46.1 44.8 46.0Bihar 60.4 58.3 60.3Chandigarh 75.9 * 75.9Chattisgarh 47.3 41.5 47.0Dadra & Nagar Haveli 80.0 67.9 79.5Daman & Diu 59.3 * 58.9Delhi 52.8 45.1 52.5Goa 31.4 26.7 31.3Gujarat 55.1 51.3 54.9Haryana 63.1 55.0 62.7Himachal Pradesh 53.6 50.2 53.4Jammu & Kashmir 40.4 38.1 40.3Jharkhand 65.3 62.6 65.2Karnataka 44.8 45.4 44.8Kerala 34.6 22.6 34.2Lakshadweep 46.1 36.5 45.7Madhya Pradesh 52.4 54.6 52.5Maharashtra 47.9 49.3 48.0Manipur 26.4 26.0 26.4Meghalaya 56.5 53.1 56.2Mizoram 22.4 24.5 22.5Nagaland 23.7 28.9 23.9Odisha 51.2 47.6 51.0Puducherry 53.4 26.0 52.4Punjab 54.0 42.0 53.5Rajasthan 46.8 46.6 46.8Sikkim 35.2 23.6 34.9Tamil Nadu 55.4 44.4 55.1Telangana 56.9 49.8 56.7Tripura 54.5 54.4 54.5Uttar Pradesh 52.5 51.0 52.4Uttarakhand 45.1 46.5 45.2West Bengal 62.8 53.6 62.5India 53.1 50.3 53.0
Table 2.10 : Anaemia among Women and Children during 2015-16
State/UTsAll women age 15-49
years who are anaemic (%)
Source: National Family Health Survey 2015-16 (NFHS-4)
Notes:*Haemoglobin in grams per decilitre (g/dl). Among children, prevalence is adjusted for altitude. In 2015-16, the percentage of Non pregnant women inthe age group of 15-49 years, who were anemic is 53.1% . The pregnant women with the age group 15-49 years who were anemic was 50.3%
22

Female Male Female Male Female Male Female Male Female Male
(1) (2) (3) (4) (5) (6) (7) (8) (9) (10) (11)
0-4 11.5 10.6 11.2 10.0 10.6 9.8 9.9 9.0 9.2 8.7
5-9 0.8 0.8 0.7 0.6 0.6 0.7 0.8 0.6 0.6 0.6
10-14 0.6 0.6 0.6 0.7 0.7 0.7 0.5 0.5 0.6 0.6
15-19 1.1 1.0 1.0 1.1 0.9 0.9 0.8 0.7 0.9 0.9
20-24 1.5 1.7 1.2 1.4 1.1 1.3 1.1 1.3 1.1 1.3
25-29 1.6 2.1 1.3 1.7 1.2 1.6 1.2 1.5 1.4 1.7
30-34 1.6 2.5 1.5 2.3 1.4 2.2 1.4 2.3 1.5 2.1
35-39 2.3 3.7 1.9 3.3 1.9 3.2 1.8 3.2 2.0 3.4
40-44 2.8 4.9 2.9 4.5 2.7 3.7 2.9 4.4 2.8 4.7
45-49 3.9 7.5 3.8 6.1 3.7 6.3 3.8 6.5 3.9 6.4
50-54 6.4 10.3 7.7 9.7 8.9 9.9 8.0 9.2 7.0 8.7
55-59 9.1 15.5 10.2 14.0 11.3 16.0 10.5 16.2 10.4 16.2
60-64 16.1 20.7 15.6 19.9 18.4 22.0 16.1 21.4 15.8 20.9
65-69 26.8 32.7 22.7 29.5 26.1 31.0 24.5 31.8 26.4 32.2
70-74 43.2 54.9 37.3 46.6 37.6 44.7 42.1 48.7 41.2 51.3
75-79 61.2 81.7 64.2 78.5 60.8 69.8 57.6 72.3 62.8 70.8
80-84 102.0 129.9 124.3 149.2 109.4 123.5 110.9 120.0 106.5 116.1
85+ 202.4 226.1 213.6 277.5 186.9 238.1 181.1 219.4 186.2 203.7
All ages 6.4 7.5 6.2 7.1 6.1 6.9 5.9 6.8 5.9 6.7
Source: Sample Registration System, Office of the Registrar General, India.
Table 2.11 : Age-Specific Mortality Rate by Sex
Age Group2013 2014 2015 2016 2017
23

2013 2014 2015 2016 2017 2013 2014 2015 2016 2017
(1) (2) (3) (4) (5) (6) (7) (8) (9) (10) (11)
Andhra Pradesh 91.3 92.6 93.6 96.6 96.5 99.7 99.8 99.8 99.8 99.6
Assam 71.6 75.8 77.6 81.1 80.7 93.2 94.3 94.7 95.4 96.0
Bihar 58.1 61.1 63.4 68.0 66.5 86.6 88.1 89.3 90.0 91.0
Chhattisgarh 64.0 68.2 70.2 75.5 72.8 83.3 85.2 86.1 88.6 89.1
Delhi 89.6 91.8 92.4 94.8 94.9 91.3 92.3 93.6 94.9 95.4
Gujarat 83.3 85.7 87.0 93.4 90.5 98.7 99.7 99.4 99.5 99.5
Haryana 74.8 77.8 79.4 83.6 82.9 84.1 86.0 86.5 87.3 88.2
Himachal Pradesh 69.2 72.9 74.3 76.8 77.5 94.1 94.9 95.2 95.8 96.2
Jammu & Kashmir 79.0 81.1 82.0 86.9 84.7 96.4 96.3 96.6 97.0 97.0
Jharkhand 45.3 52.1 54.2 59.3 56.6 86.6 87.2 88.0 90.3 91.3
Karnataka 90.7 93.7 94.7 97.1 95.9 97.3 98.9 99.4 99.6 99.6
Kerala 99.6 99.6 99.7 99.7 99.8 99.3 99.7 99.8 99.7 99.7
Madhya Pradesh 71.9 75.0 76.1 81.7 77.9 94.2 95.9 96.3 96.9 97.2
Maharashtra 91.6 92.3 93.6 96.2 94.8 99.0 99.3 99.5 99.4 99.6
Odisha 70.3 74.8 75.9 79.8 78.6 91.0 92.5 93.1 93.3 93.6
Punjab 80.1 81.9 82.9 88.3 85.6 92.1 92.8 93.7 94.2 94.7
Rajasthan 81.1 83.8 84.9 87.6 86.6 90.6 92.2 93.0 93.4 93.7
Tamil Nadu 89.3 90.4 90.7 95.5 91.9 99.0 99.5 99.6 99.6 99.7
Telangana * 88.3 89.5 93.4 92.0 * 94.4 95.6 96.6 97.0
Uttar Pradesh 54.7 58.2 59.0 66.0 63.1 76.0 79.2 80.0 80.9 82.0
Uttarakhand NA 65.9 67.1 71.8 70.0 NA 74.4 76.2 78.5 79.4
West Bengal 73.9 78.0 80.0 84.7 82.4 90.9 92.6 93.3 94.1 94.5
India 69.7 73.2 74.2 80.8 77.4 92.1 93.2 93.5 94.2 94.4
*included in Andhra Pradesh
Table 2.12 : Per cent of live births where the mothers received medical attention at delivery
StatesRural Urban
Source: Sample Registration System, Office of the Registrar General, India.
24

State/UTs Any method * (%)
Any modern method * (%)
Female sterilization (%)
Male sterilization (%)
IUD/ PPIUD (%) Pill (%) Condom (%)
(1) (2) (3) (4) (5) (6) (7) (8)
Andaman & Nicobar Islands 50.8 48.3 39.9 0.0 2.1 2.2 4.2
Andhra Pradesh 69.5 69.4 68.3 0.6 0.2 0.2 0.2
Arunachal Pradesh 31.7 26.6 11.2 0.0 3.4 10.2 1.4
Assam 52.4 37.0 9.5 0.1 2.2 22.0 2.7
Bihar 24.1 23.3 20.7 0.0 0.5 0.8 1.0
Chandigarh 74.0 58.2 20.6 1.3 5.4 3.6 27.3
Chhattisgarh 57.7 54.5 46.2 0.7 1.6 1.7 3.9
Dadra & Nagar Haveli 38.1 37.9 31.7 0.0 1.4 1.2 3.7
Daman & Diu 32.3 31.6 25.7 0.0 2.4 1.3 2.2
Delhi 53.0 47.3 19.4 0.2 5.4 3.2 19.0
Goa 26.3 24.8 16.3 0.0 0.9 0.3 7.1
Gujarat 46.9 43.1 33.6 0.1 3.0 1.4 4.9
Haryana 63.7 59.4 38.1 0.6 5.7 2.7 12.0
Himachal Pradesh 57.0 52.1 34.5 2.4 0.9 1.5 12.7
Jammu & Kashmir 57.3 46.1 24.4 0.4 2.8 6.2 11.3
Jharkhand 40.4 37.5 31.1 0.2 1.0 2.6 2.2
Karnataka 51.8 51.3 48.6 0.1 0.8 0.4 1.3
Kerala 53.1 50.3 45.8 0.1 1.6 0.2 2.6
Lakshadweep 29.3 14.9 10.3 0.0 0.6 0.0 3.8
Madhya Pradesh 51.4 49.6 42.2 0.5 0.5 1.3 4.9
Maharashtra 64.8 62.6 50.7 0.4 1.6 2.4 7.1
Manipur 23.6 12.7 3.1 0.1 3.7 4.2 1.3
Meghalaya 24.3 21.9 6.2 0.0 2.1 11.7 1.3
Mizoram 35.3 35.3 17.5 0.0 3.3 13.2 1.3
Nagaland 26.7 21.4 9.1 0.0 6.7 4.0 1.3
Odisha 57.3 45.4 28.3 0.2 1.1 12.0 3.4
Puducherry 61.9 61.2 57.4 0.0 2.6 0.4 0.8
Punjab 75.8 66.3 37.5 0.6 6.8 2.5 18.9
Rajasthan 59.7 53.5 40.7 0.2 1.2 2.4 8.7
Sikkim 46.7 45.9 17.6 3.4 6.3 11.6 5.2
Tamil Nadu 53.2 52.6 49.4 0.0 1.9 0.2 0.8
Telangana 57.2 56.9 54.2 1.6 0.3 0.3 0.5
Tripura 64.1 42.8 13.9 0.0 0.6 26.3 1.9
Uttar Pradesh 45.5 31.7 17.3 0.1 1.2 1.9 10.8
Uttarakhand 53.4 49.3 27.4 0.7 1.6 3.2 16.1
West Bengal 70.9 57.0 29.3 0.1 1.2 20.0 5.9
India 53.5 47.8 36.0 0.3 1.5 4.1 5.6
Table 2.13 : Percentage of currently married women aged 15-49 years who use any modern method of family planning (2015-16)
National Health Profile 2017, MoH&W, * includes other methods that are not shown separately
IUD: Intra Urine device, PPIUD: Postpartum IUD
25

State/UTs Total unmet need (%) Unmet need for spacing (%)
(1) (2) (3) Andaman & Nicobar Islands 15.5 8.1Andhra Pradesh 4.7 3.1Arunachal Pradesh 21.6 12.7Assam 14.2 5.8Bihar 21.2 9.4Chandigarh 6.3 1.8Chattisgarh 11.1 5.3Dadra & Nagar Haveli 19.6 10.6Daman & Diu 19.7 11.0Delhi 15.8 4.9Goa 17.5 8.3Gujarat 17.0 6.7Haryana 9.3 3.8Himachal Pradesh 15.7 4.8Jammu & Kashmir 12.3 5.8Jharkhand 18.4 9.0Karnataka 10.4 6.0Kerala 13.7 8.3Lakshadweep 17.9 13.2Madhya Pradesh 12.1 5.7Maharashtra 9.7 4.3Manipur 30.1 12.7Meghalaya 21.2 15.3Mizoram 19.9 12.4Nagaland 22.2 11.2Odisha 13.6 4.7Puducherry 8.3 4.8Punjab 6.2 2.4Rajasthan 12.3 5.7Sikkim 21.7 8.9Tamil Nadu 10.1 4.8Telangana 7.3 3.8Tripura 10.7 4.1Uttar Pradesh 18.1 6.8Uttarakhand 15.5 5.2West Bengal 7.5 3.0India 12.9 5.7
Table 2.14 : Unmet Need for Family Planning (currently married women age 15-49 years)
Source: National Family Health Survey 2015-16 (NFHS-4) unmet need for family planning refers to fecund women who are not using contraception but who wish to postpone the next birth (spacing) or stopchildbearing altogether limiting). Specifically, women are considered to have unmet need for spacing if they are:
-At risk of becoming pregnant, not using contraception, and either do not want to become pregnant within the next two years, or are unsure if or when theywant to become pregnant. -Pregnant with a mistimed pregnancy. -Postpartum amenorrheic for up to two years following an unwanted birth and not usingcontraception. Women who are classified as in fecund have no unmet need because they are not at risk of becoming pregnant. Unmet need for family planningis the sum of unmet need for spacing plus unmet need for limiting.
26

States/UTs Total Demand for Family Planning
Percentage of demand satisfied by modern methods
(1) (2) (3) Andaman & Nicobar Islands 66.2 73.0Andhra Pradesh 74.2 93.6Arunachal Pradesh 53.2 50.0Assam 66.5 55.6Bihar 45.2 51.4Chandigarh 80.3 72.5Chhattisgarh 68.8 79.3Dadra & Nagar Haveli 57.4 66.0Daman & Diu 52.0 60.8Delhi 69.9 69.5Goa 43.8 56.5Gujarat 63.9 67.4Haryana 73.1 81.3Himachal Pradesh 72.7 71.7Jammu & Kashmir 69.6 66.3Jharkhand 58.7 63.8Karnataka 62.2 82.5Kerala 66.8 75.3Lakshadweep 46.6 33.6Madhya Pradesh 63.5 78.0Maharashtra 74.4 84.0Manipur 53.6 23.6Meghalaya 45.5 48.1Mizoram 55.2 63.8Nagaland 48.8 43.5Odisha 70.9 64.0Puducherry 70.3 87.1Punjab 82.0 80.9Rajasthan 72.0 74.3Sikkim 68.4 67.1Tamil Nadu 63.3 83.0Telangana 64.6 88.2Tripura 74.8 57.2Uttar Pradesh 63.5 49.9Uttarakhand 69.0 71.6West Bengal 78.4 72.7India 66.4 71.9
Table 2.15 : Proportion of Women of Reproductive Age who have their Need for Family Planning Satisfied with Modern Methods
Source: National Family Health Survey 2015-16 (NFHS-4)
27

Gender Percentage Of Current Tobacco Use
(1) (2)
Male 44.5
Female 6.8
Table 2.16 : Percentage Of Current Tobacco Use Among Men And Women Aged 15-49 Years, 2015-16
Source: National Family Health Survey 2015-16 (NFHS-4)
28

State/UTs Women Men(1) (2) (3)
Andaman & Nicobar Islands 7.8 8.1Andhra Pradesh 10.3 7.7Arunachal Pradesh 2.9 2.3Assam 2.1 1.7Bihar 2.2 1.3Chandigarh 14.9 4.5Chattisgarh 2.4 1.4Dadra & Nagar Haveli 5.0 4.8Daman & Diu 8.1 4.8Delhi 10.1 3.6Goa 9.9 7.7Gujarat 7.1 3.8Haryana 4.9 2.7Himachal Pradesh 7.0 3.4Jammu & Kashmir 7.5 3.3Jharkhand 2.1 1.2Karnataka 6.5 4.6Kerala 6.4 3.8Lakshadweep 14.6 4.6Madhya Pradesh 3.1 1.6Maharashtra 6.1 4.3Manipur 5.2 2.8Meghalaya 1.7 1.4Mizoram 3.7 4.8Nagaland 2.7 1.3Odisha 3.5 2.3Puducherry 10.2 4.8Punjab 9.2 5.1Rajasthan 3.3 2.1Sikkim 5.4 5.9Tamil Nadu 8.3 3.9Telangana 8.6 4.8Tripura 2.4 1.7Uttar Pradesh 3.9 1.6Uttarakhand 4.9 2.5West Bengal 3.8 1.8India 5.1 3.0
Table 2.17 : Proportion of Adults who are Obese, 2015-16
Source: National Family Health Survey 2015-16 (NFHS-4)
29

Male Female Total Male Female Total(1) (2) (3) (4) (5) (6) (7)
Andaman & Nicobar 0.16 0.11 0.14 0.17 0.12 0.15Andhra Pradesh 0.17 0.13 0.15 0.14 0.11 0.13Arunachal Pradesh 0.05 0.04 0.05 0.06 0.04 0.05Assam 0.05 0.03 0.04 0.05 0.03 0.04Bihar 0.11 0.08 0.09 0.09 0.07 0.08Chandigarh 0.19 0.1 0.16 0.21 0.12 0.18Chhattisgarh 0.07 0.05 0.06 0.06 0.05 0.06Dadra & Nagar 0.17 0.11 0.15 0.16 0.11 0.14Daman & Diu 0.16 0.11 0.15 0.13 0.1 0.13Delhi 0.22 0.12 0.18 0.19 0.11 0.16Goa 0.15 0.11 0.13 0.14 0.1 0.13Gujarat 0.11 0.09 0.1 0.08 0.06 0.07Haryana 0.13 0.07 0.1 0.11 0.06 0.09Himachal Pradesh 0.02 0.01 0.01 0.02 0.01 0.01Jammu & Kashmir 0.02 0.01 0.02 0.02 0.01 0.02Jharkhand 0.09 0.07 0.08 0.08 0.06 0.07Karnataka 0.09 0.09 0.1 0.08 0.08 0.08Kerala 0.03 0.02 0.03 0.03 0.02 0.03Madhya Pradesh 0.05 0.03 0.04 0.04 0.02 0.03Maharashtra 0.07 0.05 0.06 0.06 0.04 0.05Manipur 0.68 0.53 0.62 0.65 0.5 0.58Meghalaya 0.08 0.06 0.07 0.07 0.05 0.06Mizoram 1.47 1.12 1.31 1.48 1.13 1.32Nagaland 0.68 0.52 0.61 0.67 0.5 0.59Odisha 0.07 0.06 0.06 0.06 0.05 0.06Puducherry 0.09 0.08 0.09 0.12 0.1 0.11Punjab 0.1 0.06 0.08 0.08 0.05 0.07Rajasthan 0.06 0.03 0.05 0.05 0.03 0.04Sikkim 0.03 0.02 0.03 0.03 0.02 0.03Tamil Nadu 0.06 0.05 0.06 0.05 0.04 0.05Telangana 0.31 0.24 0.28 0.28 0.22 0.26Tripura 0.07 0.05 0.06 0.06 0.04 0.05Uttar Pradesh 0.05 0.03 0.04 0.04 0.02 0.03Uttarakhand 0.1 0.06 0.08 0.09 0.05 0.07West Bengal 0.11 0.08 0.1 0.1 0.08 0.09India 0.09 0.07 0.08 0.08 0.06 0.07Source: Ministry of Health & FW (HIV Estimations 2017)
Table 2.18 : Number of new HIV infections per 1,000 uninfected population(in '000)
States/UTs2015 2017
30

Male Female Persons Male Female Persons
(1) (2) (3) (4) (5) (6) (7)
0-4 11.9 8.6 10.3 11.1 11.7 11.4
5-9 6.5 5.0 5.8 8.7 7.1 8.0
10-14 4.3 4.7 4.5 5.7 5.3 5.6
15-29 3.5 5.7 4.6 3.8 5.9 4.8
30-44 6.0 9.4 7.7 7.1 12.6 9.8
45-59 10.9 16.3 13.5 17.3 23.9 20.6
60-69 24.7 27.0 25.9 33.1 37.9 35.5
70+ 32.7 28.6 30.6 37.6 37.1 37.3
All 8.0 9.9 8.9 10.1 13.5 11.8
Male Female Persons Male Female Persons
(1) (2) (3) (4) (5) (6) (7)
0-4 8.5 7.2 7.8 10.8 10.0 10.4
5-9 5.8 4.8 5.3 6.5 6.2 6.4
10-14 4.2 3.9 4.1 4.3 4.2 4.3
15-29 2.6 2.6 3.2 3.4 3.9 3.7
30-44 3.5 3.5 5.0 5.1 7.4 6.2
45-59 8.4 8.4 10.3 11.5 16.7 14.0
60-64 21.7 21.4 21.6 28.6 30.5 29.6
65-69 20.9 25.3 23.3 34.1 30.3 32.2
70+ 29.8 28.4 29.1 41.3 39.6 40.4
All 6.1 7.6 6.8 8.2 10.0 9.1Source: National Sample Survey Office, 75th Round, Jul 2017 - June 2018
(Jul.2017-Jun. 2018)
Source: National Sample Survey Office, 71st Round, Jan 2014 - June 2014
Age-GroupRural Urban
Table 2.19 : Sex-wise age-group wise ailment during last 15 days (in percentage)
(Jan.2014-Jun. 2014)
Age-GroupRural Urban
31
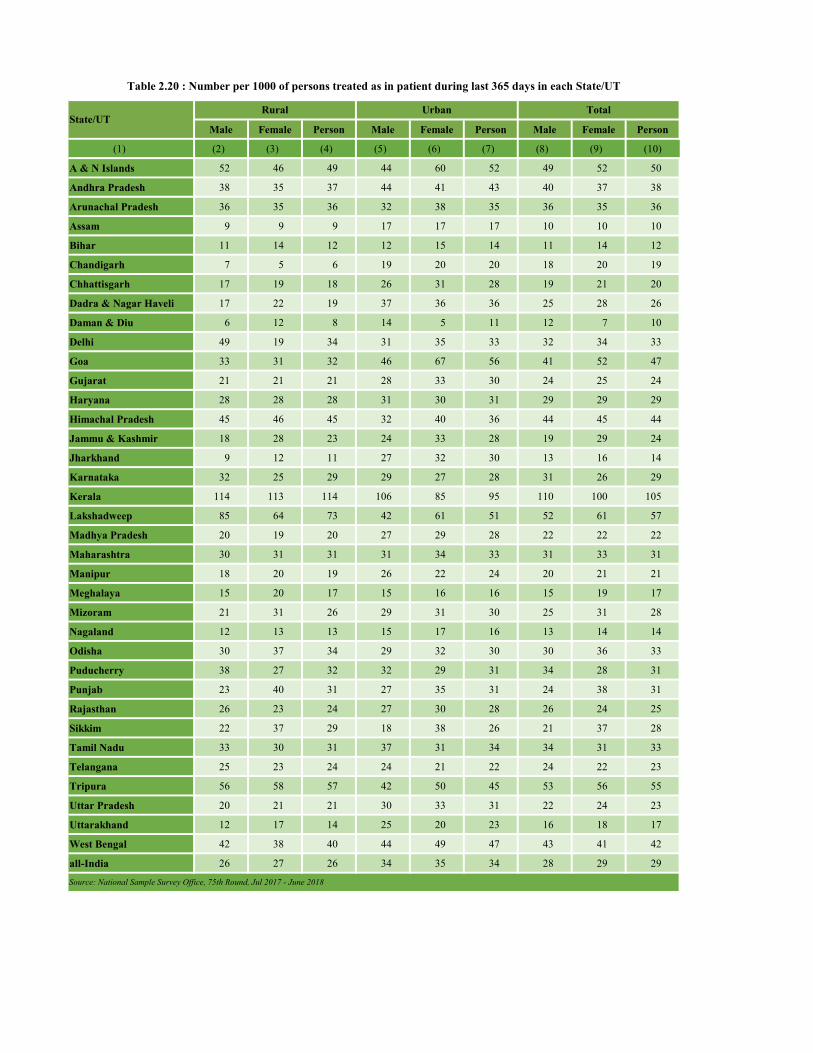
Male Female Person Male Female Person Male Female Person
(1) (2) (3) (4) (5) (6) (7) (8) (9) (10)
A & N Islands 52 46 49 44 60 52 49 52 50
Andhra Pradesh 38 35 37 44 41 43 40 37 38
Arunachal Pradesh 36 35 36 32 38 35 36 35 36
Assam 9 9 9 17 17 17 10 10 10
Bihar 11 14 12 12 15 14 11 14 12
Chandigarh 7 5 6 19 20 20 18 20 19
Chhattisgarh 17 19 18 26 31 28 19 21 20
Dadra & Nagar Haveli 17 22 19 37 36 36 25 28 26
Daman & Diu 6 12 8 14 5 11 12 7 10
Delhi 49 19 34 31 35 33 32 34 33
Goa 33 31 32 46 67 56 41 52 47
Gujarat 21 21 21 28 33 30 24 25 24
Haryana 28 28 28 31 30 31 29 29 29
Himachal Pradesh 45 46 45 32 40 36 44 45 44
Jammu & Kashmir 18 28 23 24 33 28 19 29 24
Jharkhand 9 12 11 27 32 30 13 16 14
Karnataka 32 25 29 29 27 28 31 26 29
Kerala 114 113 114 106 85 95 110 100 105
Lakshadweep 85 64 73 42 61 51 52 61 57
Madhya Pradesh 20 19 20 27 29 28 22 22 22
Maharashtra 30 31 31 31 34 33 31 33 31
Manipur 18 20 19 26 22 24 20 21 21
Meghalaya 15 20 17 15 16 16 15 19 17
Mizoram 21 31 26 29 31 30 25 31 28
Nagaland 12 13 13 15 17 16 13 14 14
Odisha 30 37 34 29 32 30 30 36 33
Puducherry 38 27 32 32 29 31 34 28 31
Punjab 23 40 31 27 35 31 24 38 31
Rajasthan 26 23 24 27 30 28 26 24 25
Sikkim 22 37 29 18 38 26 21 37 28
Tamil Nadu 33 30 31 37 31 34 34 31 33
Telangana 25 23 24 24 21 22 24 22 23
Tripura 56 58 57 42 50 45 53 56 55
Uttar Pradesh 20 21 21 30 33 31 22 24 23
Uttarakhand 12 17 14 25 20 23 16 18 17
West Bengal 42 38 40 44 49 47 43 41 42
all-India 26 27 26 34 35 34 28 29 29
Table 2.20 : Number per 1000 of persons treated as in patient during last 365 days in each State/UT
Rural Urban Total
Source: National Sample Survey Office, 75th Round, Jul 2017 - June 2018
State/UT
32

State/UT Rural Urban Total Rural Urban Total Rural Urban Total
(1) (2) (3) (4) (5) (6) (7) (8) (9) (10)
All-India 4290 4837 4452 27347 38822 31845 16676 26475 20135
A & N Islands 39 228 98 106015 107038 106800 7316 36642 18686
Andhra Pradesh 1453 1208 1358 22415 32847 25692 16717 22479 18665
Arunachal Pradesh 3793 4810 3952 13966 23497 15469 4504 6092 4754
Assam 4545 7842 4991 28785 71657 44204 9826 38935 15661
Bihar 4064 4027 40461 16479 25052 17518 11595 17861 12298
Chandigarh 9061 23819 23585 126090 120145 120165 19777 55286 54870
Chhattisgarh 3303 4618 3537 65288 28151 51622 26123 19873 24521
Dadra & Nagar Haveli 103 424 230 7224 17081 16449 474 9599 5769
Daman & Diu 270 34 137 43206 24012 27143 26479 20702 21949
Delhi 3378 2217 2285 27868 64075 63500 6797 25896 25094
Goa 1818 3466 2894 41351 35512 36199 7765 16742 14333
Gujarat 1151 3529 1936 25027 29281 27361 14924 22418 18530
Haryana 7242 7215 7236 26346 34109 29458 19177 30337 23107
Himachal Pradesh 12797 12738 12792 37797 36003 37639 20308 17791 20098
Jammu & Kashmir 4720 9203 5714 50043 39718 43098 6371 15678 8789
Jharkhand 3971 15699 8147 28229 33058 30353 17288 26055 20741
Karnataka 3445 4195 3624 17085 31462 23149 12768 26575 17900
Kerala 4395 4589 4469 25949 32746 28775 17054 22123 19109
Lakshadweep 512 175 287 10943 41432 41347 7940 12984 11380
Madhya Pradesh 2093 2030 2073 25086 31094 27037 14325 17365 15278
Maharashtra 5606 7189 6177 23821 42540 32566 19383 36612 27096
Manipur 5932 9051 6944 60361 39541 49784 14170 17505 15366
Meghalaya 1894 7668 2385 14870 35687 27375 2790 22711 6041
Mizoram 5622 7528 6415 19558 47740 39578 7260 17371 12109
Nagaland 4648 5089 4748 13098 19699 16953 6020 12109 7978
Odisha 5098 6698 5283 29974 33935 30947 1159 18748 12295
Puducherry 216 2668 1516 27246 71865 60818 5354 29453 19804
Punjab 15093 10293 13277 40303 37502 39208 31805 29338 30869
Rajasthan 7332 6707 7174 25788 35228 28226 16268 20824 17435
Sikkim 3339 2915 3266 24805 19168 23201 7180 7703 7282
Tamil Nadu 520 433 485 28412 41566 35581 12362 23260 17570
Telangana 1278 6922 3367 26019 35191 30336 19887 30082 24471
Tripura 3314 6077 3752 64017 67139 65326 5161 13400 6574
Uttar Pradesh 6914 10239 7765 29768 40706 33071 23144 33339 26089
Uttarakhand 2774 22376 7372 25502 41647 32372 15945 37038 23421
West Bengal 2726 3954 3061 45023 57549 50380 13310 25235 17141
Table 2.21 : Average Medical Expenditure incurred for Treatment during stay at hospital per case of hospitalization, by State/UT, separately for Public and Private Hospital in each Sector
Public Hospital Private Hospitals All (incl. NGO, trust-run)
Source: National Sample Survey Office, 75th Round, Jul 2017 - June 2018
Expenditure in Rs.
33
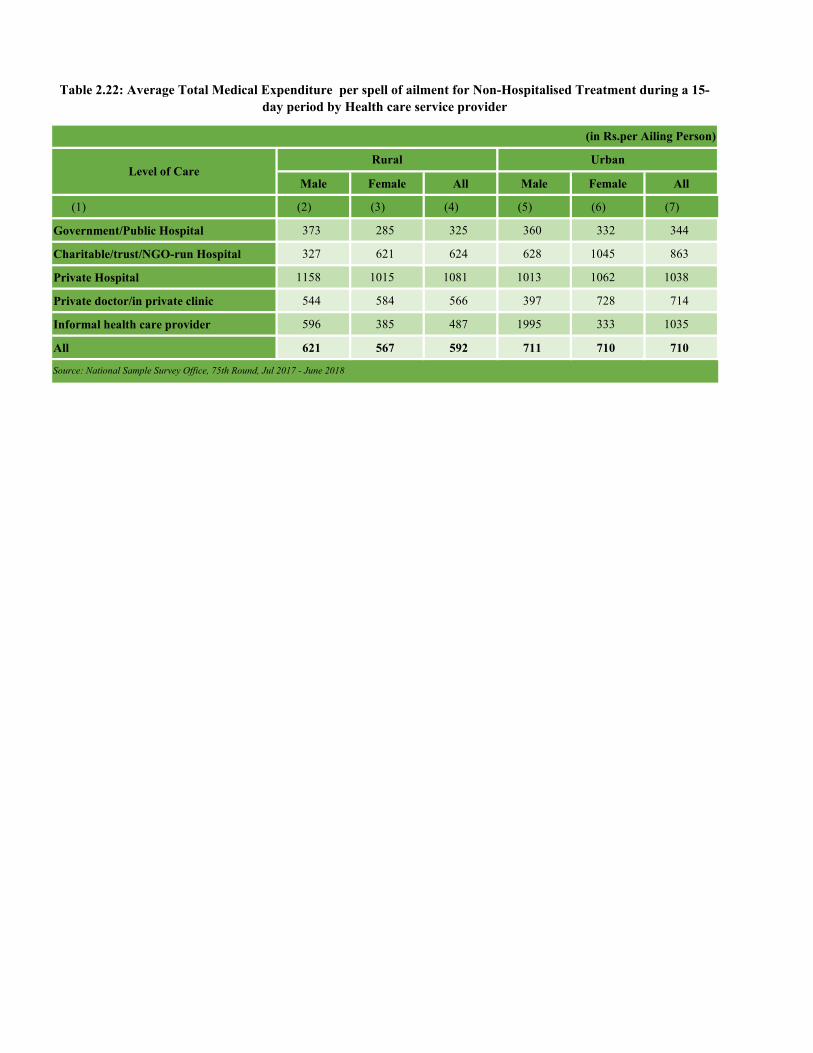
Male Female All Male Female All
(1) (2) (3) (4) (5) (6) (7)
Government/Public Hospital 373 285 325 360 332 344
Charitable/trust/NGO-run Hospital 327 621 624 628 1045 863
Private Hospital 1158 1015 1081 1013 1062 1038
Private doctor/in private clinic 544 584 566 397 728 714
Informal health care provider 596 385 487 1995 333 1035
All 621 567 592 711 710 710
Source: National Sample Survey Office, 75th Round, Jul 2017 - June 2018
Table 2.22: Average Total Medical Expenditure per spell of ailment for Non-Hospitalised Treatment during a 15-day period by Health care service provider
(in Rs.per Ailing Person)
Level of CareRural Urban
34


Female Male Person Female Male Person Female Male Person
(1) (2) (3) (4) (5) (6) (7) (8) (9) (10)
1951 4.9 19.0 12.1 22.3 45.6 34.6 8.9 27.2 18.3
1961 10.1 34.3 22.5 40.5 66.0 54.4 15.4 40.4 28.3
1971 15.5 48.6 27.9 48.8 69.8 60.2 22.0 46.0 34.5
1981 21.7 49.6 36.0 56.3 76.7 67.2 29.8 56.4 43.6
1991 30.2 57.0 36.0 64.1 81.1 67.2 39.3 64.1 52.2
2001 46.7 71.4 59.4 73.2 86.7 80.3 53.7 75.3 64.8
2011 57.9 77.2 66.8 79.1 88.8 84.1 64.6 80.9 73.0
2017 65.0 81.5 73.5 82.8 92.2 87.7 70.3 84.7 77.7
% Increase in 2017 over 2011 12.2% 5.6% 10.1% 4.7% 3.9% 4.3% 8.8% 4.7% 6.5%
Total
Male Female PersonGender
Gap (Rural)
Male Female PersonGender
Gap (Urban)
Gender Gap
(Rural + Urban)
(1) (2) (3) (4) (5) (6) (7) (8) (9) (10)2007-08 (NSS 64th
round) 77 .0 56.7 67.0 20.3 89.9 78.1 84.3 11.8 18.2
2014 (NSS 71st
round)79.8 61.3 70.8 18.5 91.1 80.8 85.9 10.3 16.1
2017 (NSS 75th
round)81.5 65.0 73.5 16.5 92.2 82.8 87.7 9.4 14.4
Source: Census of India, Office of Registrar General, India.
Table 3.1 : Trend in Literacy Rates in Post Independent India
YearRural Urban Combined
Notes: 1. For 1951, the population male , female and persons refers to effective literacy rates and the break up of Rural, Urban and male- female components are crude literacy rates.
2. Literacy rates for 1951, 1961 and 1971 relate to population aged 5 years and above whereas literacy rates for 1981, 1991, 2001 and 2011 relate to the population aged 7 years and above.
The 1981 literacy rates exclude Assam where the 1981 Census could not be conducted.
The 1991 literacy rates exclude Jammu & Kashmir where the 1991 Census could not be conducted due to disturbed conditions.
The 2001 literacy rates exclude Mao Maram, Paomata and Purul Sub-divisions of Senapati district of Manipur.
* Gender Gap=Literacy rate for males-Literacy rate for females
Table 3.2 : Literacy rates for persons of age 7 years and above for rural & urban populationRural Urban
Source: NSS 64 th Round (2007-08) , 71st Round (2014) & 75 th Round (2017)
Note: A person who can read and write a simple message in any language with understanding is considered literate in NSS surveys..
35
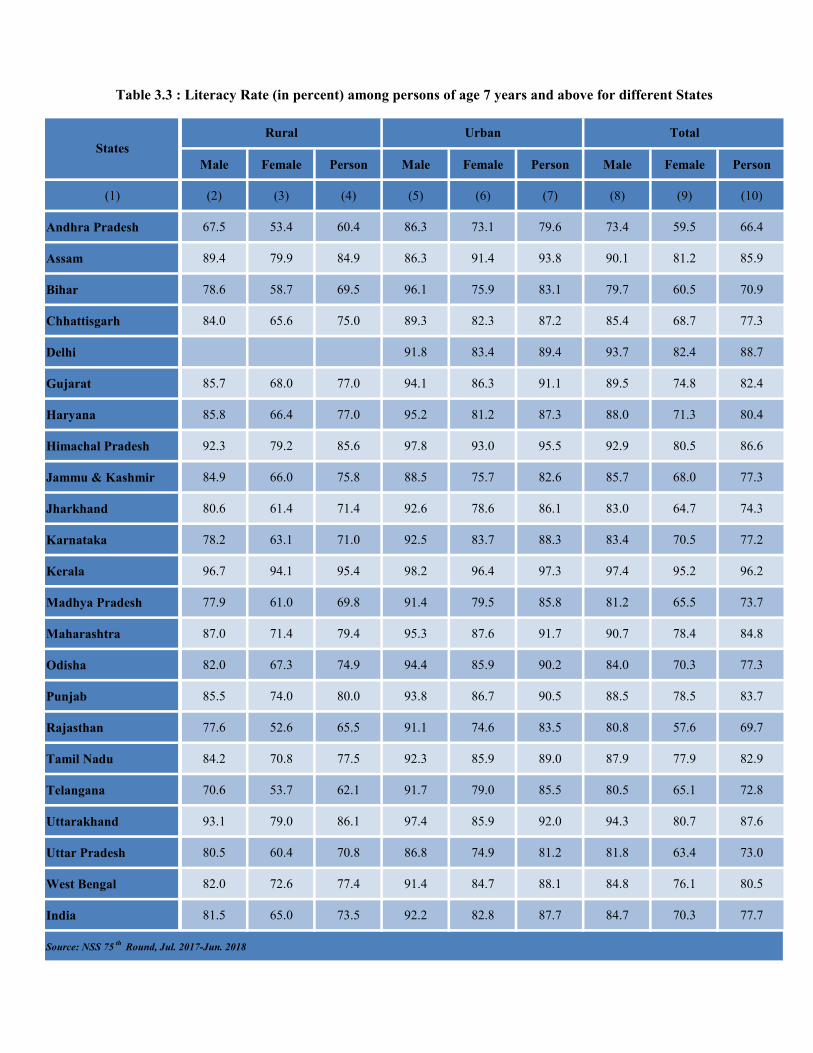
Male Female Person Male Female Person Male Female Person
(1) (2) (3) (4) (5) (6) (7) (8) (9) (10)
Andhra Pradesh 67.5 53.4 60.4 86.3 73.1 79.6 73.4 59.5 66.4
Assam 89.4 79.9 84.9 86.3 91.4 93.8 90.1 81.2 85.9
Bihar 78.6 58.7 69.5 96.1 75.9 83.1 79.7 60.5 70.9
Chhattisgarh 84.0 65.6 75.0 89.3 82.3 87.2 85.4 68.7 77.3
Delhi 91.8 83.4 89.4 93.7 82.4 88.7
Gujarat 85.7 68.0 77.0 94.1 86.3 91.1 89.5 74.8 82.4
Haryana 85.8 66.4 77.0 95.2 81.2 87.3 88.0 71.3 80.4
Himachal Pradesh 92.3 79.2 85.6 97.8 93.0 95.5 92.9 80.5 86.6
Jammu & Kashmir 84.9 66.0 75.8 88.5 75.7 82.6 85.7 68.0 77.3
Jharkhand 80.6 61.4 71.4 92.6 78.6 86.1 83.0 64.7 74.3
Karnataka 78.2 63.1 71.0 92.5 83.7 88.3 83.4 70.5 77.2
Kerala 96.7 94.1 95.4 98.2 96.4 97.3 97.4 95.2 96.2
Madhya Pradesh 77.9 61.0 69.8 91.4 79.5 85.8 81.2 65.5 73.7
Maharashtra 87.0 71.4 79.4 95.3 87.6 91.7 90.7 78.4 84.8
Odisha 82.0 67.3 74.9 94.4 85.9 90.2 84.0 70.3 77.3
Punjab 85.5 74.0 80.0 93.8 86.7 90.5 88.5 78.5 83.7
Rajasthan 77.6 52.6 65.5 91.1 74.6 83.5 80.8 57.6 69.7
Tamil Nadu 84.2 70.8 77.5 92.3 85.9 89.0 87.9 77.9 82.9
Telangana 70.6 53.7 62.1 91.7 79.0 85.5 80.5 65.1 72.8
Uttarakhand 93.1 79.0 86.1 97.4 85.9 92.0 94.3 80.7 87.6
Uttar Pradesh 80.5 60.4 70.8 86.8 74.9 81.2 81.8 63.4 73.0
West Bengal 82.0 72.6 77.4 91.4 84.7 88.1 84.8 76.1 80.5
India 81.5 65.0 73.5 92.2 82.8 87.7 84.7 70.3 77.7
Source: NSS 75 th Round, Jul. 2017-Jun. 2018
Table 3.3 : Literacy Rate (in percent) among persons of age 7 years and above for different States
StatesRural Urban Total
36

Rural Urban Total
(1) (2) (3) (4)
Andhra Pradesh 14.1 13.2 13.9
Assam 9.5 -5.1 8.9
Bihar 19.9 20.2 19.2
Chhattisgarh 18.4 7.0 16.7
Delhi 0.0 8.4 11.3
Gujarat 17.7 7.8 14.7
Haryana 19.4 14.0 16.7
Himachal Pradesh 13.1 4.8 12.4
Jammu & Kashmir 18.9 12.8 17.7
Jharkhand 19.2 14.0 18.3
Karnataka 15.1 8.8 12.9
Kerala 2.6 1.8 2.2
Madhya Pradesh 16.9 11.9 15.7
Maharashtra 15.6 7.7 12.3
Odisha 14.7 8.5 13.7
Punjab 11.5 7.1 10.0
Rajasthan 25.0 16.5 23.2
Tamil Nadu 13.4 6.4 10.0
Telangana 16.9 12.7 15.4
Uttarakhand 14.1 11.5 13.6
Uttar Pradesh 20.1 11.9 18.4
West Bengal 9.4 6.7 8.7
India 16.5 9.4 14.4
Table 3.4 : State-wise Gap in the Literacy rates of Males and Females in last two decades
State/Union TerritoryGender Gap
Source: NSS 75 th Round, Jul. 2017-Jun. 2018
* Gender Gap=Literacy rate for males-Literacy rate for females.
37

Year Male Female Total Gender Parity Index (%)
(1) (2) (3) (4) (5)
1961 41.5 13.2 27.8 32%
1971 47.7 19.4 34.1 41%
1981 54.9 25.7 40.8 47%
1991 61.9 34.1 48.5 55%
2001 73.4 47.8 61 65%
2011 78.8 59.3 69.3 75%
Residence Male Female Person Gender Parity Index
(1) (2) (3) (4) (5)Rural 74.1 50.6 62.6 68%Urban 88.3 76.9 82.8 87%Total 78.8 59.3 69.3 75%Residence Parity Index 84% 66% 76%
Table 3.5 Adult Literacy Rate (Age 15 Years and Above)
Source: Census of India, Office of the Registrar General, India.
Table 3.6 : Adult Literacy Rate by sex and place of residence- 2011
Source: Census of India, Office of the Registrar General, India.
38

Male Female Total(1) (2) (3) (4)
Andaman & Nicobar Islands 97.1 96.2 96.7Andhra Pradesh 90.8 83.2 87.0Arunachal Pradesh 84.9 76.4 80.7Assam 85.2 79.6 82.4Bihar 79.6 63.7 72.3Chandigarh 93.2 91.1 92.3Chhattisgarh 92.0 82.8 87.5Dadra & Nagar Haveli 93.3 76.4 86.8Daman & Diu 93.1 91.0 92.5Delhi 94.2 91.9 93.2Goa 96.7 95.6 96.2Gujarat 92.8 85.0 89.2Haryana 92.8 86.5 90.0Himachal Pradesh 97.0 95.8 96.4Jammu & Kashmir 89.6 76.3 83.2Jharkhand 87.2 71.4 79.6Karnataka 93.1 88.3 90.8Kerala 99.0 99.0 99.0Lakshadweep 98.3 98.3 98.3Madhya Pradesh 89.1 77.6 83.7Maharashtra 95.0 92.1 93.7Manipur 90.3 85.5 87.9Meghalaya 84.0 85.5 84.8Mizoram 95.1 91.7 93.4Nagaland 89.1 87.3 88.2Odisha 90.9 81.2 86.0Puducherry 97.9 97.1 97.5Punjab 90.4 88.9 89.8Rajasthan 91.0 71.3 81.7Sikkim 95.0 93.4 94.2Tamil Nadu 97.2 95.0 96.1Tripura 96.2 92.5 94.3Uttar Pradesh 86.6 75.8 81.6Uttarakhand 94.0 90.0 92.0West Bengal 89.2 85.2 87.3All India (Total) 90.0 81.9 86.1
Table 3.7 : Literacy Rate of Youth in the Age Group of 15-24 Years
(in percentage)
State/UTsPercentage literacy rate of youth during 2011
Source: Office of Registrar General of India, Ministry of Home Affairs.
39

Female Male Total Female Male Total Female Male Total
(1) (2) (3) (4) (5) (6) (7) (8) (9) (10)
2005-06 105.8 112.8 109.4 66.4 75.2 71 35.8 44.6 40.4
2006-07 108 114.6 111.4 69.6 77.6 73.8 36.8 45 41.1
2007-08 112.6 115.3 114 74.4 81.5 78.1 41.9 49.4 45.8
2008-09 114 114.7 114.3 76.6 82.7 79.8 43.5 51 47.4
2009-10 113.8 113.8 113.8 79 84.3 81.7 46.1 52.5 49.4
2010-11 116.3 114.9 115.5 82.9 87.5 85.2 48.5 55.7 52.2
2011-12 107.1 105.8 106.5 81.4 82.5 82 54.5 58.8 56.8
2012-13* 107.2 104.8 106 84.6 80.6 82.5 56.5 55.5 56.8
2013-14* 102.6 100.2 101.4 92.8 86.3 89.3 62.6 60.9 62.5
2014-15* 101.4 98.9 100.1 95.3 87.7 91.2 65.8 64.9 65.3
2015-16* 100.7 97.9 99.2 97.6 88.7 92.8 68.7 67.6 68.1
2016-17 96.4 94 95.1 95.2 86.9 90.7 NA NA NA
2017-18 95.4 93.1 94.2 95.9 86.6 90.9 NA NA NA
Source: Educational Statistics at a Glance 2018, MHRD
School Education in India 2015-16 : Flash Statistics, U-DISE
Table 3.8 : Gross Enrolment Ratio in Different Stages of Education
Year
Primary
( I-V) 6-10 Years
Upper primary
(VI-VIII) 11-13 Years
Higher Secondary Classes
IX-XII (14-17 Years)
40

Level Gender 2014-15 2015-16 2016-17
(1) (2) (3) (4) (5)
Boys 90.9 90.2 86.8
Girls 93.2 92.9 89.5
Total 92.0 91.5 88.1
Boys 79.0 80.3 78.6
Girls 84.4 87.1 86.0Total 82.5 83.5 82.0Boys 89.8 90.0 87.2Girls 93.5 94.2 91.6Total 91.6 91.9 89.2Boys 55.1 62.1 61.6Girls 55.7 63.6 63.4Total 55.4 62.8 62.4
Primay (I-V)
Upper Primary(VI-VIII)
Elementary (I-VIII)
Secondary (IX-X)
Table 3.9 : Adjusted Net Enrolment Ratio by stage of School Education, all India
41

Primary Upper Primary Secondary Senior Secondary
(I-V) (VI-VIII) ( IX-X) (XI-XII)
(1) (2) (3) (4) (5) (6)
2005-06 87 81 73 72 62
2006-07 88 82 73 74 62
2007-08 91 84 77 76 63
2008-09 92 86 79 77 65
2009-10 92 88 82 80 67
2010-11 92 89 82 79 78
2011-12 93 90 84 81 80
2012-13* 94 95 89 87 81
2013-14* 93 95 89 89 85
2014-15* 93 95 91 90 85
2015-16* 93 95 91 90 86
* Figures are provisional.
Table 3.10 : Number of Females per 100 Males Enrolled by stages of education
Year Higher Education
Source: Educational Statistics at a Glance 2018, MHRD
School Education in India 2015-16 : Flash Statistics, U-DISE
42

Male Female Person Male Female Person Male Female Person
(1) (2) (3) (4) (5) (6) (7) (8) (9) (10)
not literate 22.2 41.2 31.5 8.8 19.3 13.9 18.0 34.5 26.1
literate upto primary 21.2 20.4 20.9 13.5 15.9 14.7 18.9 18.9 18.9
middle 19.8 14.4 17.2 14.6 13.4 14.0 18.2 14.1 16.2
secondary 17.3 12.5 15.0 20.4 17.9 19.2 18.2 14.2 16.2
higher secondary 12.0 7.6 9.9 18.1 15.1 16.6 13.9 9.8 11.9
graduate and above 7.4 3.9 5.7 24.6 18.6 21.7 12.8 8.3 10.6
All 100.0 100.0 100.0 100.0 100.0 100.0 100.0 100.0 100.0
Source: NSS 75th Round July, 2017- June, 18
Table 3.11 : Percentage distribution of persons of age 15 years and above by highest level of education successfully completed
Highest level of education completed
Rural Urban Total
43

Male Female Person Male Female Person Male Female Person
(1) (2) (3) (4) (5) (6) (7) (8) (9) (10)
Persons of age 15 years and above 9.2 8.6 9.0 11.2 10.6 10.9 9.9 9.4 9.7
Persons of age 25 years and above 8.8 7.9 8.4 11.1 10.3 10.8 9.7 8.9 9.3
Male Female Person Male Female Person Male Female Person
(1) (2) (3) (4) (5) (6) (7) (8) (9) (10)
Up to class X 82.5 84 83.1 77.5 76.2 76.9 81.1 81.8 81.4
other (other than upto class X) 17.5 16 16.9 22.5 23.8 23.1 18.9 18.2 18.6
All 100 100 100 100 100 100 100 100 100
Humanities 54.2 61.8 57.4 30.7 40.2 35 46.4 53.9 49.6
Science 30.9 24.8 28.3 41.3 34.3 38.1 34.4 28.2 31.7
Commerce 14.9 13.4 14.3 28 25.5 26.9 19.2 17.8 18.6
All 100 100 100 100 100 100 100 100 100
Source: NSS 75th Round July, 2017- June, 18
Table 3.12 : Average number of years completed in formal education by persons with level of education below primary and above
Rural Urban Total
Source: NSS 75th Round July, 2017- June, 18
Table 3.13 : Percentage distribution of students pursuing general course by type of course
Type of course pursuingRural Urban Total
44

up to class X Humanities Science Commerce All
(1) (2) (3) (4) (5) (6) (7)
Male 55.5 54.8 63.3 60.6 55.9
Female 44.5 45.2 36.7 39.4 44.1
Person 100.0 100.0 100.0 100.0 100.0
Male 56.2 47.6 58.9 56.6 55.7
Female 43.8 52.4 41.1 43.4 44.3
Person 100.0 100.0 100.0 100.0 100.0
Male 55.6 53.0 61.5 58.6 55.8Female 44.4 47.0 38.5 41.4 44.2Person 100.0 100.0 100.0 100.0 100.0
Table 3.14 : Percentage distribution of students pursuing general course by gender of the student for each type of course
Source: NSS 75th Round July, 2017- June, 18
Type of course
Rural
Urban
Total
45

Year Primary Upper Primary Secondary Senior Secondary
Higher Secondary
(1) (2) (3) (4) (5) (6)
2005-06 65 67 61 62 NA
2006-07 66 65 63 61 NA
2007-08 80 67 61 58 NA
2008-09 73 71 60 60 NA
2009-10 84 75 63 63 NA
2010-11 76 80 61 65 59
2011-12 79 76 66 66 64
2012-13* NA NA NA NA 64
2013-14* NA NA NA NA 64
2014-15* 104 81 70 71 63
2015-16* 105 83 72 73 64
School Education in India 2016-17 : Flash Statistics, U-DISE
Table 3.15 : Number of Female Teachers per 100 Male Teachers at Different Levels of Education
NA: Not Available
* Figures related to School Education are provisional.
Source: Educational Statistics at a Glance 2016, MHRD
Source: Educational Statistics at a Glance 2016 ,
46

Never Enrolled Enrolled in Past Academic Year
Enrolled in Current Academic Year
(1) (2) (3) (4) (5) (6)
Male 12.6 40.9 0.4 46.1
Female 19.3 39.7 0.4 40.7
Person 15.7 40.3 0.4 43.5
Male 7.1 45.8 0.4 46.7
Female 9.6 47.7 0.4 42.6
Person 8.3 46.5 0.4 44.8
Male 11 42.3 0.4 46.2
Female 16.6 41.8 0.4 41.2
Person 13.6 42.1 0.4 43.9
Urban
Total
Source: NSS 75th Round July, 2017- June, 18
Table 3.16 : Percentage distribution of persons of age 3 to 35 years by enrolment status
Enrolment Status
Currently Not AttendingCurrently Attending
Rural
47

Female Male Female Male Female Male
(1) (2) (3) (4) (5) (6) (7)
2011-12* 5.3 5.9 3.2 2.1 NA NA
2012-13* 4.7 4.7 4 2.3 14.5 14.5
2013-14* 4.1 4.5 4.5 3.1 17.8 17.9
2014-15 4.1 4.5 4.5 3.1 17.8 17.9
2015-16 3.9 4.4 4.6 3.5 16.9 17.2
2016-17 6.3 6.4 6.4 5 19.8 20
Source: NSS 75th Round July, 2017- June, 18
Table 3.17 : Trend in Average Annual Drop-Out Rate at different stages of School Education
YearPrimary Upper Primary Secondary
48

Male Female Male Female Male Female
(1) (2) (3) (4) (5) (6) (7)
Percentage of never enrolled persons 12.6 19.3 7.1 9.6 11 16.6
Not interested in education 20.4 20.7 14.5 15.7 19.3 19.9
Financial constraints 13.9 13 19.4 16.5 14.9 13.6
Engaged in domestic activities 1.6 12.5 0.8 7.9 1.5 11.7
Engaged in economic activities 4.8 1.2 3.2 1.2 4.5 1.2
School is far off 0.6 1.5 0.4 0.7 0.5 1.4
Timings of educational institution not suitable 0.6 0.5 0.3 0.4 0.5 0.5
Language/Medium of instruction used unfamiliar 0.1 0.1 0.2 0.1 0.1 0.1
Inadequate number of teachers 0 0.1 0 0 0 0.1
Quality of teachers not satisfactory 0 0.1 0.2 0.1 0 0.1
Route to educational institution not safe 0.1 0.1 0.1 0.1 0.1 0.1
No tradition in community 2 4.5 1.7 6.4 2 4.8
Non-availability of female teacher - 0 - 0 - 0
Non-availability of girls' toilet - 0.1 - 0.1 - 0.1
Marriage - 0.4 - 0.5 - 0.5
Others 55.9 45.2 59.1 50.4 56.5 46
100 100 100 100 100 100
Source: NSS 75th Round July, 2017- June, 18
Table 3.18 : Percentage of never enrolled persons of age 3 to 35 years and their distribution by major reasons for never enrolled : 2018
Major ReasonsRural Urban Total
49
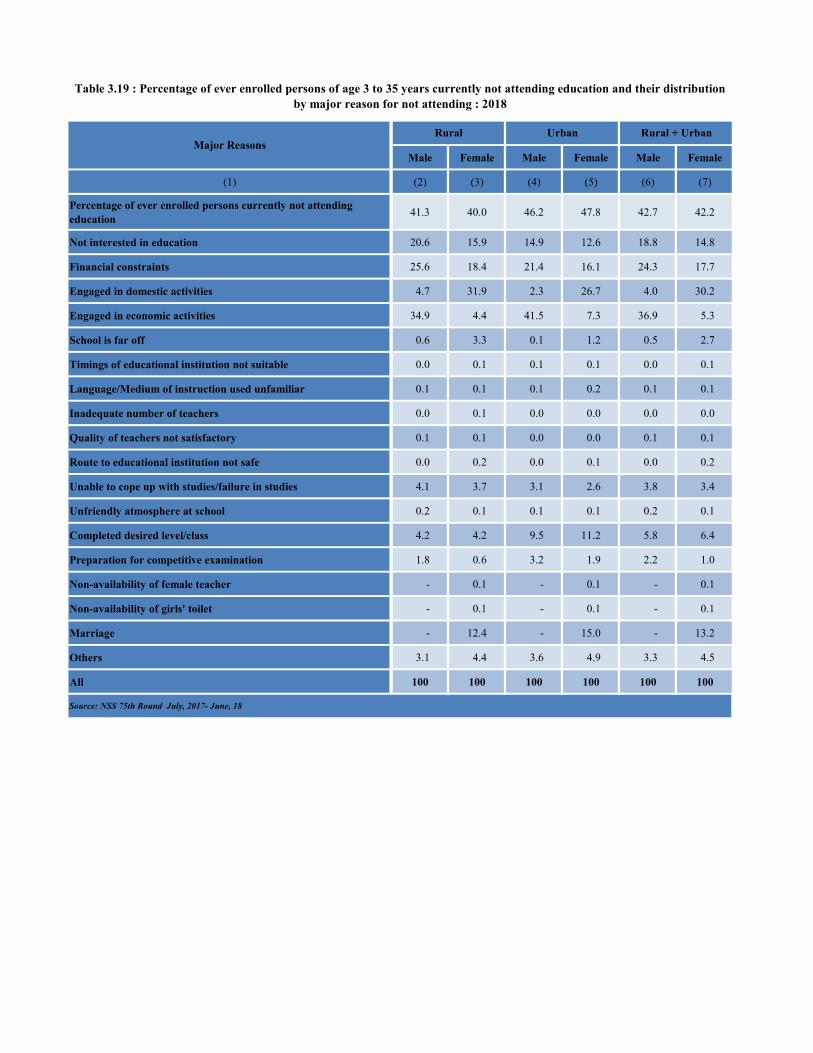
Male Female Male Female Male Female
(1) (2) (3) (4) (5) (6) (7)
Percentage of ever enrolled persons currently not attending education 41.3 40.0 46.2 47.8 42.7 42.2
Not interested in education 20.6 15.9 14.9 12.6 18.8 14.8
Financial constraints 25.6 18.4 21.4 16.1 24.3 17.7
Engaged in domestic activities 4.7 31.9 2.3 26.7 4.0 30.2
Engaged in economic activities 34.9 4.4 41.5 7.3 36.9 5.3
School is far off 0.6 3.3 0.1 1.2 0.5 2.7
Timings of educational institution not suitable 0.0 0.1 0.1 0.1 0.0 0.1
Language/Medium of instruction used unfamiliar 0.1 0.1 0.1 0.2 0.1 0.1
Inadequate number of teachers 0.0 0.1 0.0 0.0 0.0 0.0
Quality of teachers not satisfactory 0.1 0.1 0.0 0.0 0.1 0.1
Route to educational institution not safe 0.0 0.2 0.0 0.1 0.0 0.2
Unable to cope up with studies/failure in studies 4.1 3.7 3.1 2.6 3.8 3.4
Unfriendly atmosphere at school 0.2 0.1 0.1 0.1 0.2 0.1
Completed desired level/class 4.2 4.2 9.5 11.2 5.8 6.4
Preparation for competitive examination 1.8 0.6 3.2 1.9 2.2 1.0
Non-availability of female teacher - 0.1 - 0.1 - 0.1
Non-availability of girls' toilet - 0.1 - 0.1 - 0.1
Marriage - 12.4 - 15.0 - 13.2
Others 3.1 4.4 3.6 4.9 3.3 4.5
All 100 100 100 100 100 100
Source: NSS 75th Round July, 2017- June, 18
Table 3.19 : Percentage of ever enrolled persons of age 3 to 35 years currently not attending education and their distribution by major reason for not attending : 2018
Major ReasonsRural Urban Rural + Urban
50

Year
Gender Male Female Total % Female Male Female Total % Female Male Female Total % Female
(1) (2) (3) (4) (5) (6) (7) (8) (9) (10) (11) (12) (13)
Enrolment 186.50 157.23 342.12 45.96% 189.90 170.22 360.12 47.27% 186.50 174.50 361.00 48.34%
Table 3.20 : Enrolment in Higher Education
Source: NSS 75th Round July, 2017- June, 18
Enrolment number in lakhs
2016-17 2017-18 2018-19
51

Male Female Person Male Female Person Male Female Person
(1) (2) (3) (4) (5) (6) (7) (8) (9) (10)
General course 97.1 98.3 97.6 91.7 93.7 92.6 95.5 96.9 96.1
Technical/professional course 2.9 1.7 2.4 8.3 6.3 7.4 4.5 3.1 3.9
All 100.0 100.0 100.0 100.0 100.0 100.0 100.0 100.0 100.0
Source: NSS 75th Round July, 2017- June, 18
Table 3.21 : Percentage distribution of students by type of course pursuing (general course and technical/professional course)
Type of course pursuingRural Urban Total
52

Male Female Person Male Female Person Male Female Person
(1) (2) (3) (4) (5) (6) (7) (8) (9) (10)
Medicine 3.8 9.2 5.5 5.9 16.9 10.0 4.9 13.8 8.0
Engineering 30.1 20.2 27.0 51.6 33.6 44.9 41.6 28.2 37.0
Agriculture 4.1 3.0 3.8 1.6 1.6 1.6 2.7 2.1 2.5
Law 1.2 0.7 1.1 2.1 2.6 2.3 1.7 1.8 1.8
Management 2.7 6.9 4.0 6.4 7.8 6.9 4.7 7.4 5.6
Education 7.2 21.2 11.6 3.6 10.1 6.0 5.3 14.6 8.5
CA and similar course 0.6 1.7 0.9 3.1 2.6 2.9 1.9 2.2 2.0
IT/Computer courses 9.5 10.4 9.8 8.9 9.7 9.2 9.2 10.0 9.5
Course from ITI/recognised vocational institutes 30.4 10.3 24.0 11.1 3.7 8.3 20.0 6.4 15.3
others 10.3 16.4 12.2 5.8 11.3 7.9 7.9 13.4 9.8
All 100.0 100.0 100.0 100.0 100.0 100.0 100.0 100.0 100.0
Source: NSS 75th Round July, 2017- June, 18
Table 3.22 : Percentage distribution of students pursuing technical/professional course by type of course
Type of courseRural Urban Total
53

Type of course Male Female Person Male Female Person Male Female Person
(1) (2) (3) (4) (5) (6) (7) (8) (9) (10)
Medicine 47.4 52.6 100.0 37.0 63.0 100.0 40.2 59.8 100.0
Engineering 76.3 23.7 100.0 72.1 27.9 100.0 73.5 26.5 100.0
Agriculture 75.0 25.0 100.0 62.4 37.5 100.0 70.7 29.3 100.0
Law 78.1 21.7 100.0 58.6 41.4 100.0 63.9 36.1 100.0
Management 46.3 53.7 100.0 58.2 41.8 100.0 54.4 45.6 100.0
Education 42.3 57.7 100.0 37.3 62.7 100.0 40.4 59.6 100.0
CA and similar course 42.0 58.0 100.0 66.7 33.3 100.0 61.7 38.3 100.0
IT/Computer courses 66.3 33.7 100.0 60.7 39.3 100.0 63.3 36.7 100.0
Course from ITI/recognised vocational institutes 86.4 13.6 100.0 83.3 16.7 100.0 85.5 14.5 100.0
others 57.5 42.5 100.0 46.5 53.5 100.0 52.5 47.5 100.0
All 68.3 31.7 100.0 62.8 37.2 100.0 65.2 34.8 100.0
Table 3.23 : Percentage distribution of students pursuing technical/professional course by gender of the student for each type of course
Rural Urban Total
Source: NSS 75th Round July, 2017- June, 18
54

Year 2010-11 2011-12 2012-13 2013-14 2014-15 2015-16
(1) (2) (3) (4) (5) (6) (7)
Arts/ Humanities, Social Science
98.6 104.5 109.6 111.7 113.3 111.6
Engineering & Technology
40.9 39.9 40.4 39.6 39.0 38.7
Commerce 71.4 78.9 80.6 80.9 83.6 85.9
Science 86.9 95.2 93.4 90.2 87.7 89.1
IT & Computer 57.8 67.3 71.7 80.1 78.5 77.2
Medical Science 115.0 155.4 154.0 157.5 153.8 157.1
Management 48.1 55.2 57.2 58.1 57.8 59.6
Law 46.2 47.0 46.9 47.8 45.4 45.9
Others 97.5 121.0 118.5 118.0 120.6 122.3
Table 3.24: Number of Females per 100 Males in University Education in Major Disciplines
(Others includes Agriculture, Education, Indian language, Foreign language, Oriental learning, Home Science, Fine Arts, Physical Education, Library Education, Fisheries etc.
Source: D/o Higher Education, MHRD
55

Male Female Total % Female Male Female Total % Female Male Female Total % Female
(1) (2) (3) (4) (5) (6) (7) (8) (9) (10) (11) (12) (13)
All Countries 31779 15796 47575 33.20% 31394 14750 46144 31.97% 32398 15029 47427 31.69%
Nepal 7796 3454 11250 30.70% 8288 3233 11521 28.06% 9397 3350 12747 26.28%
Afghanistan 3912 511 4423 11.55% 3890 488 4378 11.15% 4083 574 4657 12.33%
Bangladesh 1135 396 1531 25.87% 1203 363 1566 23.18% 1538 537 2075 25.88%
Bhutan 1333 951 2284 41.64% 1144 855 1999 42.77% 1021 790 1811 43.62%
Sudan 1905 168 2073 8.10% 2054 166 2220 7.48% 1661 244 1905 12.81%
Nigeria 1414 677 2091 32.38% 1259 607 1866 32.53% 1091 523 1614 32.40%
Malaysia 608 1037 1645 63.04% 459 776 1235 62.83% 390 697 1087 64.12%
Sri Lanka 521 754 1275 59.14% 549 699 1248 56.01% 561 691 1252 55.19%
Iran 676 783 1459 53.67% 812 746 1558 47.88% 569 558 1127 49.51%
Iraq 697 117 814 14.37% 444 98 542 18.08% 394 104 498 20.88%
United Arab Emirates 570 647 1217 53.16% 586 535 1121 47.73% 606 444 1050 42.29%
United States 513 611 1124 54.36% 650 768 1418 54.16% 709 809 1518 53.29%
Yemen 1233 110 1343 8.19% 1346 125 1471 8.50% 1361 137 1498 9.15%
Source: D/o Higher Education, MHRD
Table 3.25 : Enrolment of Foreign Students in Higher Education
Country2016-17 2017-18 2018-19
Top Countries
56

All SC ST All SC ST
(1) (2) (3) (4) (5) (6) (7)
Primary (I-V) 1.02 1.02 0.98 1.02 1.03 0.98
Upper Primary (VI-VIII) 1.10 1.09 1.03 1.11 1.11 1.04
Elementary (I-VIII) 1.05 1.05 1.00 1.05 1.06 1.00
Secondary (IX-X) 1.02 1.03 1.02 1.03 1.05 1.02
Senior Secondary (XI-XII) 1.02 1.06 1.00 1.02 1.06 1.03
Higher Education 0.94 0.93 0.85 0.97 0.96 0.87
Table 3.26 : Gender Parity Index(GPI) by education level
Level2016-17 2017-18
Source: D/o Higher Education, MHRD
57

Level/ Primary Upper Primary Elementary Secondary Senior
Secondary
Year (I-V) (VI-VIII) (I-VIII) ( IX-X) (XI-XII)
(1) (2) (3) (4) (5) (6) (7) (8)
1950-51 0.41 0.22 0.38 NA NA NA NA
1960-61 0.50 0.34 0.47 NA NA NA NA
1970-71 0.63 0.45 0.59 NA NA NA NA
1980-81 0.67 0.53 0.63 NA NA NA NA
1990-91 0.75 0.61 0.71 NA NA NA NA
2000-01 0.82 0.75 0.80 NA NA NA NA
2005-06 0.94 0.88 0.92 0.80 0.80 0.80 0.69
2006-07 0.94 0.90 0.93 0.81 0.83 0.82 0.69
2007-08 0.98 0.91 0.96 0.85 0.84 0.85 0.70
2008-09 0.99 0.93 0.97 0.86 0.85 0.85 0.72
2009-10 1.00 0.94 0.98 0.88 0.87 0.88 0.74
2010-11 1.01 0.95 0.99 0.88 0.86 0.87 0.86
2011-12 1.01 0.99 1.00 0.93 0.92 0.93 0.88
2012-13* 1.02 1.05 1.03 0.96 0.94 0.99 0.89
2013-14* 1.03 1.08 1.04 1.00 0.98 1.00 0.92
2014-15* 1.03 1.09 1.05 1.01 0.99 1.01 0.92
2015-16* 1.03 1.10 1.05 1.02 1.01 1.02 0.92
2016-17 1.02 1.10 1.05 1.02 1.02 NA 0.94
2017-18 1.02 1.11 1.05 1.03 1.02 NA 0.97
Table 3.27 : Year-wise Gender Parity Index (GPI) for all Categories of Students
(IX-XII) Higher Education
NA: Not Available
Source: Educational Statistics at a Glance 2016 and D/o Higher Education, MHRD
58

Male Female Person Male Female Person Male Female Person
(1) (2) (3) (4) (5) (6) (7) (8) (9) (10)
Pre-primary 5,879 5,378 5,655 15,370 13,433 14,509 9,475 8,405 8,997
Primary 3,780 3,250 3,545 14,000 12,878 13,516 6,365 5,591 6,024
Upper Primary/middle 4,267 3,570 3,953 15,986 14,537 15,337 7,273 6,367 6,866
Secondary 6,154 5,479 5,856 18,548 16,210 17,518 9,516 8,376 9,013
Higher Secondary 9,943 8,106 9,148 25,887 21,081 23,832 15,077 12,221 13,845
Diploma/Certificate below graduate 8,017 9,228 8,545 35,785 10,189 22,281 14,197 9,510 12,045
Diploma/Certificate graduate and above 13,386 11,579 12,415 27,198 10,543 19,979 18,411 11,296 14,823
Graduate 11,748 11,993 11,845 19,241 17,669 18,485 14,228 14,313 14,264
Post Graduate and above 16,174 15,368 15,827 20,369 20,515 20,443 18,103 18,119 18,110
All 5,579 4,812 5,240 17,123 15,282 16,308 8,797 7,742 8,331
Source: NSS 75th Round July, 2017- June, 18
Table 3.28 : Average expenditure (Rs.) relating to basic course per student pursuing general course during the current academic year for each level of current attendance
Rural Urban Total
59

Male Female% Female
among total pass out
Male Female% Female
among total pass out
Male Female% Female
among total pass out
(1) (2) (3) (4) (5) (6) (7) (8) (9) (10)
Certificate 29787 38146 56% 32406 42977 57% 35576 39782 53%
Diploma 461606 278955 38% 451831 285246 39% 465467 318447 41%
Integrated 14445 11706 45% 14598 11811 45% 17593 13957 44%
M.Phil. 8805 17520 67% 8655 19404 69% 7829 17958 70%
PG Diploma 63854 65178 51% 71625 71551 50% 79047 80650 51%
Ph.D. 16274 12505 43% 20179 14221 41% 23765 17048 42%
Post Graduate 660749 817170 55% 656776 847627 56% 637265 862799 58%
Under Graduate 3142649 3313737 51% 3067201 3352438 52% 3042301 3432414 53%
Total 4398169 4554917 51% 4323271 4645275 52% 4308843 4783055 53%
Source: D/o of Higher Education
Table 3.29 : Examination Result Level-wise Out-turn/Pass out in Higher Education
Level
2016-17 2017-18 2018-19
60

Male Female Person Male Female Person Male Female Person
(1) (2) (3) (4) (5) (6) (7) (8) (9) (10)
Pre-primary 5.1 9.6 7.2 3.3 4.4 3.8 4.5 7.9 6.0
Primary 9.1 12.3 10.6 6.9 9.0 7.8 8.5 11.6 10.0
Upper Primary/Middle 17.5 19.1 18.2 14.9 15.5 15.2 16.9 18.3 17.5
Secondary 21.4 20.2 20.8 17.6 16.6 17.1 20.4 19.2 19.8
Higher Secondary 10.7 9.7 10.3 8.8 7.7 8.3 10.1 9.0 9.6
Diploma/Certificate (below graduate) 10.7 20.2 13.3 9.7 16.4 11.7 10.3 18.6 12.7
Graduation 5.6 6.7 6.0 4.4 3.8 4.2 5.0 5.2 5.1
Post Graduation and above 3.9 2.8 3.4 1.6 1.5 1.5 2.5 1.9 2.2
Diploma/Certificate (graduate and above) 10.1 4.0 7.8 4.2 1.9 3.4 6.7 2.8 5.3
All 13.2 14.7 13.8 9.5 9.7 9.6 12.1 13.2 12.6
Table 3.30 : Percentage of persons dropped out among ever enrolled persons of age 3 to 35 years for different levels of last enrolment
Level of last enrolmentRural Urban Rural + Urban
61

State/UTs Male Female Total Male Female Total Male Female Total
(1) (2) (3) (4) (5) (6) (7) (8) (9) (10)A and N Islands 20.3 26.1 23.2 - - - 11.1 17.7 14.4
Andhra Pradesh 35.8 29.0 32.4 31.5 26.4 28.9 30.4 22.9 26.4
Arunachal Pradesh 29.9 29.5 29.7 - - - 32.2 32.5 32.3
Assam 19.1 18.3 18.7 21.2 20.0 20.6 25.6 23.1 24.3
Bihar 15.1 12.0 13.6 12.7 7.4 10.0 21.9 14.7 18.3
Chandigarh 41.6 63.9 50.6 30.6 35.6 32.7 - - -
Chhattisgarh 18.1 19.2 18.6 18.1 18.6 18.3 10.4 12.2 11.3
D and N Haveli 7.4 12.6 9.3 15.2 22.8 18.4 4.9 5.0 5.0
Daman and Diu 4.2 9.8 5.5 16.1 25.5 20.1 10.3 15.6 12.8
Delhi 43.2 50.0 46.3 31.8 36.3 33.9 - - -
Goa 26.4 35.0 30.1 29.3 31.1 30.1 21.6 31.8 26.4
Gujarat 22.0 18.7 20.4 28.8 24.9 26.9 15.0 14.8 14.9
Haryana 26.5 32.4 29.2 18.3 22.0 20.0 - - -
Himachal Pradesh 34.7 44.9 39.6 25.6 33.3 29.4 35.7 43.7 39.7
Jammu and Kashmir 29.6 32.2 30.9 18.5 23.8 21.0 18.0 17.2 17.6
Jharkhand 19.5 18.7 19.1 17.0 14.8 15.9 13.4 14.0 13.7
Karnataka 28.2 29.4 28.8 21.2 20.9 21.0 19.0 19.0 19.0
Kerala 30.8 43.2 37.0 18.2 33.7 25.9 18.9 27.1 23.1
Lakshadweep 3.4 11.6 7.4 - - - 1.9 6.9 4.5
Madhya Pradesh 21.8 21.2 21.5 20.0 19.4 19.7 11.7 11.0 11.4
Maharashtra 33.5 30.3 32.0 31.9 30.4 31.2 17.4 13.0 15.2
Manipur 33.6 33.8 33.7 68.6 61.3 64.9 24.1 23.0 23.5
Meghalaya 23.8 27.7 25.8 81.3 211.4 142.7 21.1 25.7 23.5
Mizoram 26.5 24.8 25.7 134.9 128.3 132.5 26.8 25.0 25.9
Nagaland 17.8 19.7 18.7 - - - 17.7 20.2 19.0
Odisha 24.2 20.0 22.1 22.8 17.3 20.0 14.4 11.3 12.8
Puducherry 41.7 51.6 46.4 32.5 38.0 35.1 - - -
Punjab 25.5 34.3 29.5 17.8 25.2 21.1 - - -
Rajasthan 23.1 23.0 23.0 20.6 19.2 20.0 22.1 20.4 21.3
Sikkim 54.0 53.9 53.9 40.7 32.6 36.5 27.3 41.3 34.4
Tamil Nadu 49.8 48.3 49.0 41.4 41.7 41.6 43.3 32.5 37.8
Telangana 35.8 36.5 36.2 30.9 36.4 33.7 32.7 28.8 30.7
Tripura 21.1 17.4 19.2 19.2 15.5 17.4 15.9 12.3 14.0
Uttar Pradesh 24.2 27.5 25.8 21.9 26.4 24.0 43.3 41.9 42.6
Uttarakhand 39.2 39.1 39.1 29.3 30.7 30.0 47.4 48.3 47.8
West Bengal 20.0 18.7 19.3 14.7 13.6 14.1 11.0 9.6 10.2
26.3 26.4 26.3 22.7 23.3 23.0 17.9 16.5 17.2Source: All India Survey on Higher Education Report 2018-19
ST
Table 3.31: Gross Enrolment Ratio in Higher Education (18-23 Years)
ALL CATEGORIES SC
62

Primary Secondary Higher Secondary Primary Secondary Higher
Secondary Primary Secondary Higher Secondary
(1) (2) (3) (4) (5) (6) (7) (8) (9) (10)A & N Islands 0.95 0.95 1.05 0.95 0.94 1.08 0.94 0.93 1.04
Andhra Pradesh 0.99 1.02 1.07 0.95 1.02 1.07 0.94 0.99 1.15
Arunachal Pradesh 0.99 0.96 0.99 0.97 0.97 1.02 1.00 1.09 1.02
Assam 1.03 1.15 1.04 1.02 1.15 1.07 1.03 1.13 1.08
Bihar 1.06 1.18 1.07 1.07 1.21 1.03 1.06 1.25 1.00
Chandigarh 1.10 1.04 1.05 1.11 1.07 1.09 1.13 1.14 1.12
Chhattisgarh 1.00 1.06 1.01 1.00 1.06 1.06 1.00 1.02 1.05
D & N Haveli 0.93 0.91 1.14 0.94 0.94 1.17 0.93 0.92 1.16
Daman & Diu 1.06 1.21 1.97 1.10 1.25 2.02 1.12 1.14 2.21
Delhi 1.05 1.07 1.14 1.06 1.11 1.16 1.06 1.21 1.15
Goa 1.02 1.01 1.13 1.03 1.01 1.19 1.05 1.05 1.20
Gujarat 1.03 0.83 0.92 1.04 0.85 0.93 1.04 1.06 0.92
Haryana 1.03 0.99 1.00 1.02 1.01 0.99 1.02 1.14 0.99
Himachal Pradesh 1.02 0.97 1.02 1.02 0.99 1.01 1.02 1.01 1.03
J & K 1.03 0.97 0.92 1.01 0.96 0.91 1.03 1.06 0.96
Jharkhand 1.01 1.09 1.03 0.99 1.10 1.04 0.99 1.11 1.04
Karnataka 1.00 1.02 1.16 0.99 1.01 1.14 0.99 1.02 1.13
Kerala 1.00 1.00 1.13 1.00 1.00 1.14 1.00 1.02 1.14
Lakshadweep 0.92 0.99 1.12 0.89 0.94 1.11 0.90 0.87 0.89
Madhya Pradesh 0.98 0.97 0.92 0.99 0.98 0.95 1.00 1.06 0.96
Maharashtra 1.00 0.95 0.97 0.99 0.95 0.97 0.99 1.06 0.96
Manipur 1.03 0.99 0.91 1.00 1.00 0.94 0.99 1.03 0.91
Meghalaya 1.03 1.16 1.18 1.01 1.17 1.15 1.01 1.15 1.16
Mizoram 0.97 1.03 1.08 0.96 1.04 1.09 0.98 1.01 1.11
Nagaland 1.03 1.08 1.00 1.02 1.10 1.02 1.03 1.07 1.06
Odisha 0.98 1.00 0.97 0.98 0.99 0.97 0.98 0.99 0.98
Puducherry 1.09 1.11 1.31 1.11 1.12 1.36 1.10 1.16 1.38
Punjab 1.04 0.99 1.03 1.05 1.00 1.04 1.06 1.12 1.05
Rajasthan 0.98 0.86 0.78 0.99 0.89 0.81 0.99 1.03 0.82
Sikkim 0.92 1.11 1.25 0.91 1.10 1.24 0.92 1.08 1.20
Tamil Nadu 1.01 1.04 1.22 1.00 1.06 1.22 1.00 1.04 1.23
Telangana 1.00 1.05 1.12 0.99 1.03 1.16 0.99 1.01 1.17
Tripura 1.01 1.04 0.92 1.01 1.05 0.94 1.01 1.05 0.98
Uttar Pradesh 1.08 1.00 0.96 1.08 0.97 0.95 1.08 1.22 0.92
Uttarakhand 1.01 1.00 1.07 1.00 1.01 1.05 1.00 1.01 1.05
West Bengal 1.01 1.24 1.12 1.00 1.27 1.16 1.01 1.15 1.22
All India 1.03 1.02 1.02 1.02 1.02 1.02 1.02 1.10 1.02Source: U-DISE (2015-16) (2016-17)(2017-18)
Table3.32 : Gender Parity Indices (GPI)
State/ Sub Indicators 2015-16 2016-17 2017-18
63

Male Female Total
(1) (2) (3) (4) (5)4390688 4958599 93492872309286 2404015 47133012064394 1966492 4030886
Computer Engineering 527252 353097 880349Mechanical Engineering 742572 40207 782779Electronics Engineering 358552 272813 631365Civil Engineering 420027 116513 536540Electrical Engineering 285691 108463 394154Other Engineering & Technology 160741 68701 229442Information Technology 110751 77211 187962Architecture 38623 42482 81105Chemical Engineering 39099 12327 51426Agriculture Engineering 13955 7307 21262Aeronautical Engineering 13264 3722 16986Food Technology 7965 5469 13434Metallurgical Engineering 7323 2266 9589Mining Engineering 7412 224 7636Marine Engineering 3944 254 4198Dairy Technology 2050 973 3023Planning 491 447 938
2739712 1112476 3852188511255 938534 1449789
Nursing 60949 220402 281351General Medicine 129809 137388 267197Pharmacy 146639 115683 262322Dentistry 26464 68336 94800Ayurveda 30112 44474 74586Physiotherapy 21816 45187 67003Medical Science 22516 42274 64790Homeopathy 20207 33075 53282Unani 3655 3794 7449Ophthalmology 2495 3919 6414Other Medical Science 1548 2165 3713Occupational Therapy 1141 2313 3454Hospital Administration 1290 1932 3222Pathology 748 2202 2950Medical Management 1002 1193 2195General Surgery 500 1530 2030
470891 725867 1196758440435 464880 905315Social Science
Medical Science Total
Table 3.33: Enrolment at Under Graduate Level in Major Disciplines/ Subjects (based on actual response)
Discipline
Arts Science Commerce
Engineering & Technology
Engineering & Technology Total Education
Medical Science
64

Male Female Total
(1) (2) (3) (4) (5)
Table 3.33: Enrolment at Under Graduate Level in Major Disciplines/ Subjects (based on actual response)
Discipline
441062 306265 747327405498 245000 650498264725 133859 398584113199 192748 305947176592 73431 250023
63888 81956 14584442528 35239 7776710800 63922 7472234101 32985 6708632448 33428 6587636153 15949 5210225735 26027 5176226230 23660 4989013778 12990 26768
7549 16952 245016663 16936 235994922 15489 20411
11610 7289 188998495 2123 106184533 5355 98883257 4044 73013269 2689 59582592 2205 47972051 1688 3739
653 712 13651194 124 1318
611 703 1314343 615 95891 274 365
14671231 13925520 28596751Grand Total Source: D/o Higher Education, MHRD
Women Studies Footwear Design Marine Science / OceanographyDefence Studies Criminology & Forensic Science Gandhian Studies
Fisheries Science
Fine Arts Library & Information ScienceJournalism & Mass CommunicationDesign Linguistics Fashion Technology Veterinary & Animal SciencesHospitality and Tourism Cultural Studies Paramedical Science Religious Studies
Physical Education
IT & Computer Management Law Indian LanguageAgriculture Foreign Language Oriental Learning Home Science Social Work Area Studies
65

Male Female Total Male Female Total Male Female Total
(1) (2) (3) (4) (5) (6) (7) (8) (9) (10) (11)
Agriculture 3123 2111 5234 23 19 42 14868 8386 23254
Horticulture 334 273 607 5 5 10 2075 1406 3481
Forestry 118 83 201 7 7 14 551 420 971
Sericulture 11 3 14 0 0 0 52 47 99
Commerce 2445 2906 5351 612 1463 2075 170011 280248 450259
Foreign Trade 0 3 3 58 16 74
18 26 44 0 2 2 332 321 653
Design 74 52 126 0 1 1 1267 1301 2568
Interior Design 1 1 2 190 629 819
Civil Engineering 2725 1101 3826 0 0 0 25681 10988 36669
Mechanical Engineering 5043 522 5565 26877 3166 30043
Computer Engineering 3431 2415 5846 12660 17054 29714
Electronics Engineering 3027 1747 4774 12111 14908 27019
Other Engineering & Technology 9090 5091 14181 2 27 29 15768 7823 23591
Electrical Engineering 2731 999 3730 12993 7104 20097
Information Technology 213 165 378 1 5 6 1354 1677 3031
Architecture 168 201 369 1231 1647 2878
Chemical Engineering 735 405 1140 1677 945 2622
1239 78642 130694 209336
18 95 158 253
Education 3117 3083 6200 421 818
Engineering & Technology
1 1457 1930 3387
Disability Studies 1 18 19 2 16
Design Total 75 53 128 0 1
3 157 2087 946 3033
Design
141 238 4488 8989 13477
Defence Studies 61 4 65 154
2078 170069 280264 450333
Criminology & Forensic Science
Cultural Studies 185 271 456 97
Commerce Total 2445 2906 5351 612 1466
1110 1916 41901 72753 114654
Commerce
31 66 17546 10259 27805
Area Studies 1728 1373 3101 806
Agriculture
Agriculture Total 3586 2470 6056 35
Table 3.34: Enrolment at Ph.D.,M.Phil. & Post Graduate Level in Major Disciplines/ Subjects
(based on actual response)
DisciplinePh.D. M.Phil. Post Graduate
66

Male Female Total Male Female Total Male Female Total
(1) (2) (3) (4) (5) (6) (7) (8) (9) (10) (11)
Table 3.34: Enrolment at Ph.D.,M.Phil. & Post Graduate Level in Major Disciplines/ Subjects
(based on actual response)
DisciplinePh.D. M.Phil. Post Graduate
Agriculture Engineering 216 79 295 977 491 1468
Metallurgical Engineering 534 139 673 1081 193 1274
Food Technology 133 135 268 522 566 1088
Planning 7 1 8 489 539 1028
Aeronautical Engineering 415 59 474 500 153 653
Marine Engineering 145 35 180 263 36 299
Mining Engineering 133 15 148 278 17 295
Urban Planning 93 119 212
Dairy Technology 8 6 14 78 84 162
Transportation Planning 44 0 44
28754 13115 41869 3 32 35 114677 67510 182187
Fine Arts 258 257 515 79 102 181 1267 1345 2612
Performing Arts 82 62 144 17 13 30 723 1098 1821
Visual Arts 33 33 66 10 19 29 771 685 1456
Music 121 112 233 6 6 12 505 701 1206
Retail & Fashion Merchandize 42 49 91
Creative Designing CAD/CAM 35 14 49
Footwear Design & Production 25 17 42
CAD 5 7 12
English 1217 2072 3289 530 1742 2272 60151 128099 188250
Other Foreign Languages 289 80 369 272 89 361 3440 2298 5738
French 10 15 25 16 26 42 168 242 410
German 2 5 7 13 12 25 88 140 228
Spanish 3 1 4 23 15 38 35 41 76
1884 2738 63882 130820 194702
107 87 194
Foreign Language
Foreign Language Total 1521 2173 3694 854
Footwear Design Total
1 4 661 566 1227
Footwear Design
140 252 3266 3829 7095
Fisheries Science 165 120 285 3
8 235 1827 2062
Fine Arts
Fine Arts Total 494 464 958 112
Fashion Technology 13 51 64 0 8
Engineering & Technology Total
Engineering & Technology
67

Male Female Total Male Female Total Male Female Total
(1) (2) (3) (4) (5) (6) (7) (8) (9) (10) (11)
Table 3.34: Enrolment at Ph.D.,M.Phil. & Post Graduate Level in Major Disciplines/ Subjects
(based on actual response)
DisciplinePh.D. M.Phil. Post Graduate
Home Science 77 758 835 4 45 49 423 8543 8966
Nutrition 7 33 40 3 12 15 135 1611 1746
Food Technology 9 20 29 6 6 12 244 871 1115
Hindi 1135 1261 2396 280 452 732 38850 83238 122088
Other Indian Languages 512 532 1044 212 287 499 24894 37304 62198
Bengali 293 186 479 147 94 241 7337 20421 27758
Urdu 323 139 462 129 77 206 8742 13515 22257
Sanskrit 561 487 1048 211 190 401 7033 14193 21226
Tamil 282 570 852 349 849 1198 3611 9359 12970
Telugu 209 92 301 23 15 38 4339 6977 11316
Punjabi 310 314 624 101 112 213 1888 4540 6428
Kannada 293 174 467 7 10 17 2190 3320 5510
Odiya 36 46 82 40 68 108 1608 2063 3671
Malayalam 69 192 261 12 45 57 749 2118 2867
Computer Application 423 340 763 81 95 176 81044 71193 152237
Computer Science 864 1028 1892 195 778 973 11585 21837 33422
Information Technology 123 87 210 17 8 25 5357 5896 11253
Animation 53 34 87
Multi Media 32 18 50
444 352 796 82 68 150 8871 8433 17304
1174 98071 98978 197049
Journalism & Mass Communication
IT & Computer Total 1410 1455 2865 293 881
2199 3710 101241 197048 298289
IT & Computer
198 161 359
Indian Language
Indian Language Total 4023 3993 8016 1511
76 802 11025 11827
Hospitality and Tourism
Home Science Total 93 811 904 13 63
21 45 384 488 872
Home Science
Gandhian Studies 35 26 61 24
68

Male Female Total Male Female Total Male Female Total
(1) (2) (3) (4) (5) (6) (7) (8) (9) (10) (11)
Table 3.34: Enrolment at Ph.D.,M.Phil. & Post Graduate Level in Major Disciplines/ Subjects
(based on actual response)
DisciplinePh.D. M.Phil. Post Graduate
Law 1314 1232 2546 59 68 127 13507 10605 24112
Constitutional Law 216 66 282 238 159 397
Cyber Crime 0 1 1 110 75 185
International Law 111 55 166
Civil Law 15 22 37
506 361 867 83 81 164 5344 5831 11175
Business Administration 1971 1984 3955 78 167 245 345965 246793 592758
Business Management 1632 1328 2960 76 165 241 12224 7283 19507
Other Management 1014 727 1741 23 20 43 3892 2381 6273
Technology 2999 1415 4414
Financial Management 116 79 195 3 19 22 1704 1123 2827
Hospital Administration 2 2 4 0 2 2 1072 1491 2563
Human Resource Management 37 35 72 8 22 30 1165 1359 2524
Marketing Management 466 284 750 12 22 34 1438 638 2076
International Business 48 48 96 1 0 1 504 490 994
Pharmaceutical Technology 11 10 21 343 383 726
Hotel Management 46 24 70 2 2 4 331 121 452
Agri-Business Management 12 4 16 203 43 246
Tourism Management 70 21 91 5 4 9 27 12 39
190 255 445 2 20 22 379 520 899
Pharmacy 1633 1255 2888 0 0 0 23947 35511 59458
Dentistry 313 247 560 4797 9439 14236
Nursing 206 463 669 2 25 27 2535 10843 13378
General Medicine 72 49 121 54 50 104 6785 5263 12048
Ayurveda 191 214 405 0 1 1 3232 5422 8654
Other Medical Science 462 556 1018 53 102 155 4194 3367 7561
Physiotherapy 143 106 249 1926 3625 5551
General Surgery 11 1 12 4043 1445 5488
Anesthesiology 20 22 42 1764 1800 3564
Gynaecology 1 11 12 424 2496 2920
Medical Science
423 631 371867 263532 635399
Marine Science / Oceanography
Management
Management Total 5425 4546 9971 208
232 358 22 248 270
Management
410 13981 10916 24897
Library & Information Science
Linguistics 448 465 913 126
Law Total 1314 1232 2546 275 135
Law
69

Male Female Total Male Female Total Male Female Total
(1) (2) (3) (4) (5) (6) (7) (8) (9) (10) (11)
Table 3.34: Enrolment at Ph.D.,M.Phil. & Post Graduate Level in Major Disciplines/ Subjects
(based on actual response)
DisciplinePh.D. M.Phil. Post Graduate
Pediatrics 40 19 59 1404 1375 2779
Homeopathy 29 24 53 864 1640 2504
Pathology 10 16 26 714 1669 2383
Orthopaedics 26 1 27 2186 115 2301
Ophthalmology 15 8 23 635 1261 1896
Public Health 18 23 41 711 1072 1783
Radiology 31 11 42 1062 664 1726
Medical Science 463 1148 1611
Microbiology 64 56 120 362 928 1290
ENT 6 3 9 591 639 1230
Dermatology 1 0 1 342 704 1046
Psychiatry 10 5 15 2 34 36 459 427 886
Bio-Chemistry 76 67 143 239 517 756
Physiology 54 45 99 0 22 22 216 355 571
Bio-Technology 10 12 22 112 308 420
Anatomy 72 59 131 146 254 400
Radiothrapy 1 0 1 187 178 365
Indian Medicine 7 9 16 116 237 353
Occupational Therapy 23 20 43 119 206 325Forensic Medicine/ Toxicology 1 2 3 162 56 218
Unani 72 129 201
Lab Medicine 9 7 16 50 101 151
Cardiology 96 10 106 126 21 147
Neurology 90 20 110 89 43 132
Oncology 69 18 87 70 62 132
Bio-Physics 0 5 5 60 52 112
Medical Physics 12 10 22 2 22 24 66 44 110
Medical Management 69 33 102
Nuclear Medicine 3 0 3 47 43 90
Gastroenterology 63 4 67 62 8 70
Haematology 4 0 4 30 38 68
Urology 61 7 68 51 16 67
Nephrology 25 4 29 43 15 58
Endocrinology 25 15 40 24 8 32
Hospital Administration 0 0 0 23 9 32
Plastic Surgery 35 13 48 22 4 26
Bio-Statistics 10 5 15
Hepatology 15 3 18 4 0 4
256 369 65655 93595 159250Medical Science Total 4053 3420 7473 113
Medical Science
70

Male Female Total Male Female Total Male Female Total
(1) (2) (3) (4) (5) (6) (7) (8) (9) (10) (11)
Table 3.34: Enrolment at Ph.D.,M.Phil. & Post Graduate Level in Major Disciplines/ Subjects
(based on actual response)
DisciplinePh.D. M.Phil. Post Graduate
Oriental Learning 662 344 1006 131 95 226 14896 10355 25251
Veda 23 0 23 14 14 28 579 327 906
Jyotisha 13 2 15 24 4 28 236 67 303
Physical Education 748 212 960 220 89 309 6166 2623 8789
Yoga 21 8 29 52 13 65 38 44 82
Mathematics 2446 2058 4504 559 1484 2043 47024 89212 136236
Chemistry 4553 3483 8036 364 628 992 52509 72017 124526
Physics 3614 2340 5954 423 776 1199 30176 42621 72797
Other Science 5388 4857 10245 298 504 802 26708 40417 67125
Zoology 1026 1353 2379 143 319 462 14675 36229 50904
Botany 1015 1472 2487 147 297 444 11616 31420 43036
Bio-Technology 849 1213 2062 128 296 424 5640 13838 19478
Microbiology 302 465 767 17 122 139 4985 14169 19154
Statistics 302 301 603 36 84 120 4245 6450 10695
Life Science 997 1078 2075 52 91 143 2976 6200 9176
Bio-Chemistry 474 592 1066 23 94 117 2336 6044 8380
Environmental Science 546 572 1118 105 173 278 3097 4184 7281
Geology 557 319 876 49 16 65 4340 2794 7134
Bio-Science 794 1158 1952 7 32 39 1352 3531 4883
Electronics 171 136 307 16 29 45 2342 1898 4240
Geo-Physics 46 19 65 0 0 0 772 569 1341
Genetics 58 68 126 1 8 9 344 862 1206
Science 40 40 80
7321 215137 372455 587592Science Total 23178 21524 44702 2368 4953
1918 4809
Science
102 374 6204 2667 8871
Religious Studies 345 231 576 54
Physical Education
Physical Education Total 769 220 989 272
33 87 2891
282 15711 10749 26460
Paramedical Science
Oriental Learning Total 698 346 1044 169 113
69 84 153
Oriental Learning
71

Male Female Total Male Female Total Male Female Total
(1) (2) (3) (4) (5) (6) (7) (8) (9) (10) (11)
Table 3.34: Enrolment at Ph.D.,M.Phil. & Post Graduate Level in Major Disciplines/ Subjects
(based on actual response)
DisciplinePh.D. M.Phil. Post Graduate
Political Science 1059 661 1720 406 480 886 66940 80466 147406
Sociology 714 879 1593 204 397 601 49207 90974 140181
History 1320 1020 2340 605 657 1262 60570 69439 130009
Economics 1378 1355 2733 382 557 939 37331 53820 91151
Other Social Science 2226 2173 4399 554 674 1228 32340 50399 82739
Geography 771 386 1157 223 220 443 22571 26361 48932
Psychology 362 734 1096 78 297 375 12215 26951 39166
Public Administration 211 112 323 69 48 117 13029 7684 20713
Philosophy 560 495 1055 176 224 400 5283 5448 10731
Anthropology 95 124 219 26 40 66 1453 1758 3211
Mathematics 8 14 22 622 536 1158
Statistics 0 0 0 73 153 226
Population Studies 22 19 41 37 22 59 64 56 120
Veterinary & Animal Sciences 839 479 1318 2070 1387 3457
Dairy Science 6 2 8 38 32 70
845 481 1326 2108 1419 3527
19069 30692 1733702 2241584 3975286
37 48 630 10802 11432
All India 95043 74127 169170 11623
Veterinary & Animal Sciences Total
Women Studies 33 72 105 11
183 343 22994 25717 48711
Veterinary & Animal Sciences
3616 6376 301698 414045 715743
Social Work 345 238 583 160
Social Science
Social Science Total 8726 7972 16698 2760
72


Female Male Female Male(1) (2) (3) (4) (5)
A & N Islands 13.5 60.4 16.2 57.9Andhra Pradesh 38.1 59.1 22.8 54.3Arunachal Pradesh 10.0 48.8 6.7 44.8Assam 8.1 54.7 11.0 57.8Bihar 2.5 42.0 4.2 42.3Chandigarh 8.0 53.8 15.5 56.3Chhattisgarh 38.8 55.6 20.8 54.5D & N Haveli 36.2 55.1 15.7 67.4Daman & Diu 22.4 54.6 18.5 71.5Delhi 2.2 45.2 10.1 52.2Goa 20.4 56.8 16.8 49.9Gujarat 16.5 55.3 12.2 56.7Haryana 9.6 47.8 9.3 52.3Himachal Pradesh 40.0 55.1 16.9 54.3Jammu & Kashmir 22.9 55.4 13.9 53.2Jharkhand 10.5 46.9 9.6 43.4Karnataka 21.1 58.5 16.8 54.1Kerala 16.6 50.9 16.0 50.0Lakshadweep 7.8 53.4 7.0 43.5Madhya Pradesh 25.6 56.3 14.7 53.7Maharashtra 28.9 55.7 14.9 53.7Manipur 13.9 49.3 17.4 45.6Meghalaya 37.3 49.4 21.0 47.4Mizoram 20.4 56.5 20.2 46.1Nagaland 8.3 43.0 9.1 40.2Odisha 14.4 53.8 11.7 53.4Puducherry 5.2 46.1 14.0 51.6Punjab 9.9 54.3 12.3 56.3Rajasthan 21.5 48.2 9.8 49.5Sikkim 34.9 60.3 25.2 62.1Tamil Nadu 29.4 55.9 20.4 56.7Telangana 29.9 53.6 15.9 53.8Tripura 8.2 56.8 11.8 55.0Uttar Pradesh 9.6 47.1 7.3 48.5Uttarakhand 14.2 47.7 7.3 51.4West Bengal 15.2 59.0 17.4 56.3India 17.5 51.7 14.2 53.0
2. The figures represent size of workforce as percentage of population.
Table 4.1 : Worker Population Ratio for year 2017-18
State/Union TerritoryRural Urban
Source: Periodic Labour Force Survey (PLFS), NSO, July 2017- June 2018.
Notes:1. Figures are based on usual status approach and includes principal status and subsidiary status workers of all age
73
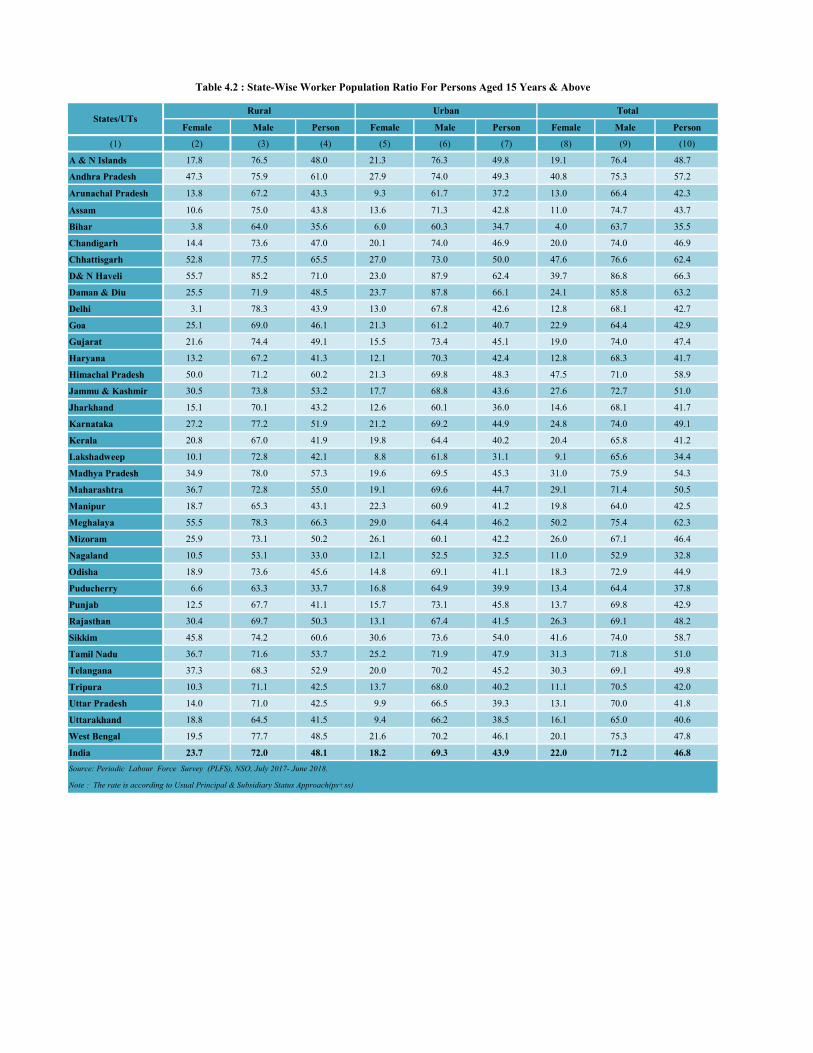
Female Male Person Female Male Person Female Male Person
(1) (2) (3) (4) (5) (6) (7) (8) (9) (10)
A & N Islands 17.8 76.5 48.0 21.3 76.3 49.8 19.1 76.4 48.7
Andhra Pradesh 47.3 75.9 61.0 27.9 74.0 49.3 40.8 75.3 57.2
Arunachal Pradesh 13.8 67.2 43.3 9.3 61.7 37.2 13.0 66.4 42.3
Assam 10.6 75.0 43.8 13.6 71.3 42.8 11.0 74.7 43.7
Bihar 3.8 64.0 35.6 6.0 60.3 34.7 4.0 63.7 35.5
Chandigarh 14.4 73.6 47.0 20.1 74.0 46.9 20.0 74.0 46.9
Chhattisgarh 52.8 77.5 65.5 27.0 73.0 50.0 47.6 76.6 62.4
D& N Haveli 55.7 85.2 71.0 23.0 87.9 62.4 39.7 86.8 66.3
Daman & Diu 25.5 71.9 48.5 23.7 87.8 66.1 24.1 85.8 63.2
Delhi 3.1 78.3 43.9 13.0 67.8 42.6 12.8 68.1 42.7
Goa 25.1 69.0 46.1 21.3 61.2 40.7 22.9 64.4 42.9
Gujarat 21.6 74.4 49.1 15.5 73.4 45.1 19.0 74.0 47.4
Haryana 13.2 67.2 41.3 12.1 70.3 42.4 12.8 68.3 41.7
Himachal Pradesh 50.0 71.2 60.2 21.3 69.8 48.3 47.5 71.0 58.9
Jammu & Kashmir 30.5 73.8 53.2 17.7 68.8 43.6 27.6 72.7 51.0
Jharkhand 15.1 70.1 43.2 12.6 60.1 36.0 14.6 68.1 41.7
Karnataka 27.2 77.2 51.9 21.2 69.2 44.9 24.8 74.0 49.1
Kerala 20.8 67.0 41.9 19.8 64.4 40.2 20.4 65.8 41.2
Lakshadweep 10.1 72.8 42.1 8.8 61.8 31.1 9.1 65.6 34.4
Madhya Pradesh 34.9 78.0 57.3 19.6 69.5 45.3 31.0 75.9 54.3
Maharashtra 36.7 72.8 55.0 19.1 69.6 44.7 29.1 71.4 50.5
Manipur 18.7 65.3 43.1 22.3 60.9 41.2 19.8 64.0 42.5
Meghalaya 55.5 78.3 66.3 29.0 64.4 46.2 50.2 75.4 62.3
Mizoram 25.9 73.1 50.2 26.1 60.1 42.2 26.0 67.1 46.4
Nagaland 10.5 53.1 33.0 12.1 52.5 32.5 11.0 52.9 32.8
Odisha 18.9 73.6 45.6 14.8 69.1 41.1 18.3 72.9 44.9
Puducherry 6.6 63.3 33.7 16.8 64.9 39.9 13.4 64.4 37.8
Punjab 12.5 67.7 41.1 15.7 73.1 45.8 13.7 69.8 42.9
Rajasthan 30.4 69.7 50.3 13.1 67.4 41.5 26.3 69.1 48.2
Sikkim 45.8 74.2 60.6 30.6 73.6 54.0 41.6 74.0 58.7
Tamil Nadu 36.7 71.6 53.7 25.2 71.9 47.9 31.3 71.8 51.0
Telangana 37.3 68.3 52.9 20.0 70.2 45.2 30.3 69.1 49.8
Tripura 10.3 71.1 42.5 13.7 68.0 40.2 11.1 70.5 42.0
Uttar Pradesh 14.0 71.0 42.5 9.9 66.5 39.3 13.1 70.0 41.8
Uttarakhand 18.8 64.5 41.5 9.4 66.2 38.5 16.1 65.0 40.6
West Bengal 19.5 77.7 48.5 21.6 70.2 46.1 20.1 75.3 47.8
India 23.7 72.0 48.1 18.2 69.3 43.9 22.0 71.2 46.8
Note : The rate is according to Usual Principal & Subsidiary Status Approach(ps+ss)
Table 4.2 : State-Wise Worker Population Ratio For Persons Aged 15 Years & Above
States/UTsRural Urban Total
Source: Periodic Labour Force Survey (PLFS), NSO, July 2017- June 2018.
74

Area Gender 15-29 15-59 15 yrs and above All
(1) (2) (3) (4) (5) (6)
Male 48.6 75.2 72.0 51.7
Female 13.8 25.5 23.7 17.5
Person 31.8 50.5 48.1 35.0
Male 47.6 74.2 69.3 53.0
Female 12.8 19.8 18.2 14.2
Person 30.6 47.0 43.9 33.9
Male 48.3 74.9 71.2 52.1
Female 13.5 23.8 22.0 16.5
Person 31.4 49.5 46.8 34.7
Total
Table 4.3 : Age Group wise Worker Population Ratio (WPR) (in %) according to usual status (ps+ss)
Source: Periodic Labour Force Survey (PLFS), NSO, July 2017- June 2018.
Note : The ratio is according to Usual Principal & Subsidiary Status Approach(ps+ss)
Rural
Urban
75

Female Male Female Male Female Male Female Male Female Male Female Male(1) (2) (3) (4) (5) (6) (7) (8) (9) (10) (11) (12) (13)
A & N Islands 32.7 34.0 60.6 44.7 6.7 21.3 12.6 19.9 85.2 67.4 2.1 12.7Andhra Pradesh 41.7 48.8 6.0 12.6 52.2 38.7 44.3 40.2 41.4 39.2 14.2 20.7Arunachal Pr. 73.1 71.4 26.9 24.6 0.0 4.0 24.5 35.7 75.5 55.5 0.0 8.9Assam 18.5 62.7 58.8 18.1 22.7 19.2 32.3 50.7 62.8 39.8 4.9 9.5Bihar 35.2 56.5 27.8 10.4 36.9 33.1 25.7 50.2 63.1 27.5 11.2 22.3Chandigarh 36.0 20.2 64.0 69.2 0.0 10.6 27.3 33.6 72.7 62.9 0.0 3.4Chhattisgarh 75.3 70.9 4.1 10.4 20.6 18.7 32.2 32.1 38.1 50.6 29.8 17.2D & N Haveli 66.8 18.8 21.2 79.3 11.9 5.9 65.8 13.0 30.1 85.6 4.0 1.4Daman & Diu 26.0 33.7 74.0 63.0 0.0 3.3 5.1 10.0 94.9 89.3 0.0 0.7Delhi 2.4 37.8 96.4 48.0 1.2 14.3 21.9 34.4 76.5 59.5 1.7 6.0Goa 33.1 20.5 48.9 66.8 18.0 12.7 23.1 36.1 74.2 56.0 2.7 7.8Gujarat 64.7 62.6 9.4 16.3 26.0 21.1 35.8 43.1 49.7 49.6 14.6 7.2Haryana 50.1 47.9 16.8 28.0 33.1 24.2 26.4 37.5 49.8 52.6 23.7 9.9Himachal Pr. 89.8 55.5 6.8 23.9 3.4 20.6 48.2 30.7 48.2 53.4 3.6 15.8J & K 89.5 53.2 9.8 23.9 0.6 22.9 45.8 42.7 51.3 45.9 2.9 11.4Jharkhand 78.1 63.7 6.9 10.5 15.0 25.8 25.4 41.3 46.9 37.9 27.7 20.8Karnataka 45.2 58.7 10.8 14.5 44.0 26.8 31.0 36.0 55.2 43.7 13.8 20.3Kerala 30.5 40.7 41.3 24.7 28.2 34.6 28.5 40.9 55.7 31.3 15.8 27.8Lakshadweep 0.0 18.8 91.4 35.5 8.6 45.7 4.7 15.7 95.3 41.9 0.0 42.4Madhya Pradesh 60.8 61.4 4.4 9.0 34.8 29.7 40.9 44.5 42.7 38.2 16.4 17.3Maharashtra 52.2 57.6 6.2 14.6 41.5 27.8 27.0 34.3 61.1 55.1 11.8 10.6Manipur 70.8 69.0 23.6 19.6 5.6 11.4 56.8 50.8 39.9 35.2 3.3 13.9Meghalaya 80.4 70.8 11.3 13.0 8.3 16.2 27.7 33.5 69.2 41.3 3.1 25.2Mizoram 85.1 79.8 12.6 12.8 2.3 7.4 44.1 38.3 54.3 46.6 1.6 15.1Nagaland 63.5 62.2 36.2 36.0 0.3 1.8 32.1 35.8 67.9 61.5 0.0 2.6Odisha 52.6 61.6 9.5 11.3 38.0 27.1 34.8 45.9 46.5 40.5 18.7 13.6Puducherry 0.8 25.3 52.3 24.2 46.9 50.5 16.0 32.9 77.5 39.7 6.5 27.4Punjab 47.8 50.1 31.0 22.1 21.3 27.8 30.3 42.2 64.2 45.9 5.5 11.9Rajasthan 84.8 64.6 4.0 15.6 11.3 19.8 44.1 45.4 43.0 43.7 12.8 10.9Sikkim 71.2 71.3 28.0 25.1 0.7 3.5 41.5 44.2 58.5 46.8 0.0 8.9Tamil Nadu 34.5 35.1 15.9 24.5 49.6 40.4 31.7 29.5 53.7 48.0 14.6 22.6Telangana 54.7 59.9 5.8 14.2 39.5 25.9 31.4 30.0 50.8 57.7 17.8 12.3Tripura 31.7 57.8 27.8 18.0 40.5 24.2 21.5 40.3 60.3 40.4 18.3 19.3Uttar Pradesh 78.5 65.2 7.6 9.3 13.9 25.5 46.2 49.8 46.2 37.2 7.6 12.9Uttarakhand 74.4 63.3 14.9 23.6 10.7 13.2 20.0 40.0 74.8 47.6 5.3 12.4West Bengal 46.0 49.0 18.5 12.2 35.5 38.8 45.6 39.3 44.7 41.4 9.7 19.3India 57.7 57.8 10.5 14.0 31.8 28.2 34.7 39.2 52.1 45.7 13.1 15.1Source: Periodic Labour Force Survey (PLFS), NSO, July 2017- June 2018.
Notes:1. Figures are based on usual status approach and includes principal status and subsidiary status workers of all age
2. The figures represent size of workforce as percentage of population.
Table 4.4 : State wise Percentage Distribution of Workers According to Broad Employment Status
Rural Urban
Self-employedRegular wage/
Salaried Employee
Casual Labour Self-employedRegular wage/
Salaried Employee
Casual Labour
(Jul.17-Jun.18)
76

Own account worker, employer
Helper in household enterprise
All self employed
(1) (2) (3) (4) (5) (6) (7) (8)
Male 48.0 9.8 57.8 14.0 28.2 100.0
Female 19.0 38.7 57.7 10.5 31.8 100.0
Person 41.0 16.9 57.8 13.1 29.1 100.0
Male 34.9 4.3 39.2 45.7 15.1 100.0
Female 23.7 11.0 34.7 52.1 13.1 100.0
Person 32.6 5.7 38.3 47.0 14.7 100.0
Male 44.1 8.2 52.3 23.4 24.3 100.0
Female 20.2 31.7 51.9 21.0 27.0 100.0
Person 38.6 13.6 52.2 22.8 24.9 100.0
Rural
Urban
Total
Source: Periodic Labour Force Survey (PLFS), NSO, July 2017- June 2018.
Table 4.5 : Percentage distribution of workers in usual status (ps+ss) by broad status in employment for each State/UT
Sector Worker
Self-employedRegular
wage/salaryCasual Labour All
77

Broad industry division
38th (1983)
43rd (1987-88)
50th (1993-94)
55th (1999-00)
61st (2004-05)
66th (2009-10)
68th (2011-12)
PLFS (2017-18)
(1) (2) (3) (4) (5) (6) (7) (8) (9) (10) (11)
Male 77.5 74.5 74.1 71.4 66.5 62.8 59.4 55.0Female 87.5 84.7 86.2 85.4 83.3 79.4 74.9 73.2Male 10.3 9.1 9.0 6.6 6.1 6.0 5.6 5.4Female 31.0 29.4 24.7 17.7 18.1 13.9 10.9 9.1Male 0.6 0.7 0.7 0.6 0.6 0.8 0.5 0.5Female 0.3 0.4 0.4 0.3 0.3 0.3 0.3 0.2Male 1.2 1.3 1.3 0.9 0.9 0.7 0.9 0.6Female 0.6 0.8 0.6 0.4 0.2 0.3 0.3 0.2Male 7.0 7.4 7.0 7.3 7.9 7.0 8.1 7.7Female 6.4 6.9 7.0 7.6 8.4 7.5 9.8 8.1Male 26.8 25.7 23.5 22.4 23.5 21.8 22.4 22.4Female 26.7 27.0 24.1 24.0 28.2 27.9 28.7 25.2Male 0.2 0.3 0.3 0.2 0.2 0.2 0.3 0.5Female - - - - 0.0 0.0 0.1 0.0Male 1.1 1.2 1.2 0.8 0.8 0.7 1.4 1.3Female 0.2 0.2 0.3 0.2 0.2 0.4 1.0 0.6Male 2.2 3.7 3.2 4.5 6.8 11.3 13.0 14.5Female 0.7 2.7 0.9 1.1 1.5 5.2 6.6 5.3Male 5.1 5.8 6.9 8.7 9.2 11.4 10.7 11.7Female 3.1 3.7 4.1 4.8 3.8 4.7 4.0 4.1Male 4.4 5.1 5.5 6.8 8.3 8.2 8.0 9.2Female 1.9 2.1 2.1 2.0 2.5 2.8 3.0 4.0Male 20.3 21.5 21.9 29.4 28.0 27.0 26.0 24.5Female 9.5 9.8 10.0 16.9 12.2 12.1 12.8 13.0Male 1.7 2.0 2.2 3.2 3.8 4.1 4.2 5.2Female 0.1 0.1 0.1 0.1 0.2 0.2 0.2 0.3Male 9.9 9.7 9.7 10.4 10.7 10.4 11.7 12.7Female 1.5 0.9 1.3 1.8 1.4 1.4 2.7 3.3Male 6.1 6.2 7.0 6.1 5.9 5.5 6.4 7.6Female 2.8 3.0 3.4 3.7 3.9 4.6 5.2 8.9Male 24.8 25.2 26.4 21.0 20.8 21.9 21.4 21.5Female 26.6 27.8 35.0 34.2 35.9 39.3 39.6 44.4
All 100.0 100.0 100.0 100.0 100.0 100.0 100.0 100.0
Table 4.6 Percentage distribution of workers in usual status (ps+ss) by broad industry division during 1983 (NSS 38th round) to 2017-18 (PLFS)
category of worker
Mining & Quarrying
Rural
Urban
AgricultureRural
Urban
Electricity, Water, etc.
Rural
Urban
ManufacturingRural
Urban
Trade, Hotel & Restaurant
Rural
Urban
ConstructionRural
Urban
Other ServicesRural
Urban
Source: Periodic Labour Force Survey (PLFS), NSO, July 2017- June 2018.
Transport, Storage &
Communications
Rural
Urban
78

Male Female Person Male Female Person Male Female Person(1) (2) (3) (4) (5) (6) (7) (8) (9) (10)
A & N Islands 61.9 31.7 56.1 52.8 31.5 48.5 57.6 31.6 52.5Andhra Pradesh 82.8 78.4 81.7 76.9 69.5 74.8 79.7 73.4 78.0Arunachal Pradesh 51.8 35.8 50.5 46.9 24.5 44.1 50.6 31.9 48.9Assam 66.3 24.7 61.5 64.4 48.0 62.0 66.0 30.0 61.6Bihar 64.8 54.6 64.4 59.5 36.7 57.6 64.0 49.5 63.4Chandigarh 55.5 33.8 53.0 60.8 42.7 56.9 60.6 42.6 56.8Chhattisgarh 78.7 76.1 78.0 72.2 63.0 70.0 75.8 70.7 74.6Dadar & Nagar Haveli 31.1 11.0 28.2 28.9 54.8 31.5 29.7 33.8 30.2Daman & Diu 35.8 8.1 29.1 26.9 10.2 24.8 27.7 9.8 25.3Delhi 64.5 24.9 62.8 64.8 31.8 60.2 64.8 31.8 60.2Goa 36.9 26.8 34.6 56.7 25.1 48.6 48.3 25.7 42.8Gujarat 67.5 49.0 65.4 70.8 51.7 67.9 69.6 50.9 67.0Haryana 75.4 66.0 74.6 60.0 49.5 58.6 68.3 56.6 67.0Himachal Pradesh 52.3 36.9 50.1 40.1 38.0 39.8 50.2 37.1 48.3Jammu & Kashmir 71.3 32.5 68.7 66.4 46.0 63.1 70.0 39.1 67.1Jharkhand 69.6 74.7 70.1 59.9 51.0 58.3 66.8 63.4 66.4Karnataka 74.0 61.3 71.6 65.6 47.0 61.3 68.9 51.9 65.3Kerala 77.0 39.2 67.6 75.1 38.4 65.9 76.1 38.8 66.8Lakshadweep 41.0 0.0 34.6 23.8 5.5 20.4 30.4 3.7 25.7Madhya Pradesh 67.6 57.0 65.7 67.2 51.3 64.0 67.4 51.1 64.9Maharashtra 66.0 52.0 64.0 56.5 42.2 53.6 59.5 44.5 56.7Manipur 53.3 55.1 53.8 41.1 44.8 42.2 48.7 50.9 49.3Meghalaya 57.8 39.0 52.3 41.7 23.4 36.0 52.5 33.6 46.8Mizoram 50.3 58.7 52.5 40.6 39.0 40.1 44.0 44.6 44.2Nagaland 19.8 17.4 19.4 21.0 23.2 21.4 20.3 20.1 20.3Odisha 71.9 52.1 68.7 63.8 47.4 61.1 69.8 50.9 66.7Puducherry 43.0 1.5 40.2 50.7 36.5 47.4 48.3 33.1 45.4Punjab 76.6 50.4 73.0 79.8 49.2 75.0 78.2 49.7 74.0Rajasthan 73.6 64.4 72.6 78.1 57.5 75.7 75.3 61.6 73.8Sikkim 46.7 35.5 43.1 69.3 57.5 66.2 57.2 44.0 53.3Tamil Nadu 69.4 49.6 64.2 57.3 52.2 56.0 62.6 51.1 59.6Telangana 66.7 73.9 68.8 55.3 50.7 54.3 59.3 61.6 59.9Tripura 75.0 26.6 69.7 63.2 38.5 58.9 72.0 31.1 66.7Uttarakhand 58.5 21.4 54.9 56.8 35.5 54.3 57.8 28.3 54.6Uttar Pradesh 89.8 75.8 88.6 81.8 66.6 80.2 86.8 71.8 85.4West Bengal 83.6 68.5 80.9 75.1 57.2 71.4 79.8 63.0 76.6India 74.4 59.2 72.1 67.2 51.0 64.1 71.0 54.7 68.2Source: Periodic Labour Force Survey (PLFS), NSO, July 2017- June 2018.
Table 4.7: Proportion (in per cent) of worker in usual status (ps+ss) in informal sector among workers engaged in non-agriculture sector for each State/ UT during 2017-18
States/UtsRural Urban Total
79

Age- Group (in years)
Male Female Person Male Female Person Male Female Person(1) (2) (3) (4) (5) (6) (7) (8) (9) (10)
15-29 58.9 15.9 38.1 58.5 17.5 38.5 58.8 16.4 38.215+ 76.4 24.6 50.7 74.5 20.4 47.6 75.8 23.3 49.8
All ages 54.9 18.2 37.0 57.0 15.9 36.8 55.5 17.5 36.9
15-29 64.9 27.1 46.4 60.7 18.1 40.5 63.6 24.4 44.615+ 81.3 35.8 58.7 76.4 20.5 49.3 79.8 31.2 55.9
All ages 55.3 25.3 40.6 56.3 15.5 36.7 55.6 22.5 39.5
15-29 68.0 30.2 49.6 61.0 16.8 40.1 65.9 26.3 46.815+ 82.5 37.8 60.4 76.2 19.4 48.8 80.6 32.6 57.1
All ages 55.6 26.5 41.4 55.9 14.6 36.2 55.7 23.3 40.0
15-29 77.2 42.8 60.2 68.3 21.7 46.6 74.6 37.1 56.415+ 85.9 49.4 67.7 79.2 24.4 53.0 84.0 42.7 63.7
All ages 55.5 33.3 44.6 57.0 17.8 38.2 55.9 29.4 43.0Note: The figures are to be read along with the explanatory note for comparability
2009-10
2004-05
Table 4.8: Age Group Wise Labour Force Participation Rate (LFPR) (in percent) in usual status (ps+ss) during 61st (2004-05), 66th (2009-10), 68th Round (2011-12) and PLFS (2017-18)
Urban Total
2017-18 (PLFS)
2011-12
Rural
80

Female Male Person Female Male Person(1) (2) (3) (4) (5) (6) (7)
A & N Islands 22.1 64.6 43.6 30.6 60.0 45.8Andhra Pradesh 39.0 61.9 50.2 25.1 57.4 41.0Arunachal Pradesh 11.2 51.0 33.2 8.4 48.8 29.8Assam 9.5 59.1 35.7 12.4 61.0 36.9Bihar 2.6 45.3 25.4 4.5 46.6 26.6Chandigarh 8.1 56.0 31.3 19.6 59.4 39.5Chhattisgarh 39.6 57.1 48.7 23.5 57.9 41.0D & N Haveli 36.2 55.7 46.4 15.7 67.5 45.6Daman & Diu 22.4 59.5 42.1 19.3 73.2 54.5Delhi 2.2 46.9 28.7 11.4 57.7 36.6Goa 25.8 63.7 43.9 24.0 53.1 37.9Gujarat 17.2 58.5 39.0 12.7 59.2 36.7Haryana 10.8 52.6 32.8 10.5 55.9 34.5Himachal Pradesh 41.6 58.7 50.0 19.5 58.7 41.5Jammu & Kashmir 24.2 57.5 41.6 18.0 56.6 37.8Jharkhand 10.9 50.8 31.5 10.8 48.4 29.8Karnataka 21.9 60.9 41.4 18.1 57.8 37.9Kerala 20.7 54.1 36.4 22.1 53.6 36.8Lakshadweep 10.6 60.1 36.4 16.1 50.1 31.5Madhya Pradesh 25.9 59.0 43.3 15.7 58.3 37.4Maharashtra 29.8 57.8 44.1 16.8 57.3 37.4Manipur 16.8 54.7 36.5 19.8 51.3 35.6Meghalaya 37.6 49.6 43.5 23.1 50.2 36.1Mizoram 22.2 60.0 41.9 24.6 52.9 38.0Nagaland 12.5 53.1 33.7 14.4 48.2 31.3Odisha 15.2 58.0 36.6 13.4 57.7 35.1Puducherry 8.3 49.0 28.5 17.0 56.1 36.2Punjab 11.1 58.6 35.6 14.2 60.2 38.4Rajasthan 21.7 51.1 36.8 10.8 53.1 33.0Sikkim 36.3 61.5 49.0 28.0 64.8 47.8Tamil Nadu 31.3 61.3 46.1 22.5 60.6 41.3Telangana 31.5 57.8 44.9 18.2 58.7 38.9Tripura 8.9 60.5 36.2 14.7 58.5 36.7Uttar Pradesh 9.7 50.3 30.3 8.2 53.7 32.0Uttarakhand 15.4 51.1 33.3 9.5 55.3 32.9West Bengal 15.4 61.7 38.9 18.5 60.3 39.6India 18.2 54.9 37.0 15.9 57.0 36.8
2. The figures represent size of labour force as percentage of population
Table 4.9:State wise Labour Force Participation Rate: 2017-18
States/ UTs Rural Urban
Source: Periodic Labour Force Survey (PLFS), NSO, July 2017- June 2018.
Notes: 1. Figures are based on usual status approach and includes principal status and subsidiary status persons of all ages.
81

Female Male Person Female Male Person Female Male Person(1) (2) (3) (4) (5) (6) (7) (8) (9) (10)
A & N Islands 29.1 81.8 56.3 40.2 79.0 60.3 33.5 80.7 57.9Andhra Pradesh 48.4 79.5 63.3 30.7 78.3 52.8 42.5 79.1 59.9Arunachal Pradesh 15.3 70.2 45.7 11.7 67.1 41.1 14.7 69.8 45.0Assam 12.3 80.9 47.7 15.4 75.3 45.7 12.7 80.3 47.5Bihar 3.9 68.8 38.2 6.4 66.5 38.2 4.1 68.6 38.2Chandigarh 14.6 76.5 48.8 25.6 78.1 51.6 25.2 78.0 51.5Chhattisgarh 54.0 79.6 67.1 30.5 77.6 54.0 49.3 79.2 64.5D & N Haveli 55.7 86.3 71.5 23.0 88.0 62.4 39.7 87.3 66.6Daman & Diu 25.5 78.4 51.8 24.8 89.9 67.9 24.9 88.4 65.2Delhi 3.1 81.2 45.5 14.6 74.8 47.1 14.3 75.0 47.1Goa 31.7 77.3 53.6 30.4 65.0 47.2 30.9 70.0 49.8Gujarat 22.5 78.7 51.7 16.2 76.6 47.1 19.9 77.8 49.8Haryana 14.7 73.9 45.5 13.7 74.8 45.5 14.3 74.3 45.5Himachal Pradesh 52.0 75.9 63.5 24.7 75.3 52.9 49.6 75.8 62.4Jammu & Kashmir 32.3 76.7 55.5 22.9 73.2 48.4 30.2 75.9 53.9Jharkhand 15.7 75.7 46.3 14.3 66.9 40.2 15.4 73.9 45.1Karnataka 28.2 80.5 54.0 22.8 73.8 48.0 26.0 77.8 51.6Kerala 25.9 71.1 46.6 27.3 68.9 46.4 26.5 70.1 46.5Lakshadweep 13.8 82.0 48.5 20.1 71.3 41.7 18.4 74.9 43.7Madhya Pradesh 35.3 81.5 59.3 21.0 75.4 49.0 31.7 80.0 56.7Maharashtra 37.7 75.4 56.8 21.6 74.2 48.2 30.8 74.9 53.1Manipur 22.6 72.4 48.7 25.4 68.5 46.6 23.5 71.3 48.1Meghalaya 56.0 78.5 66.7 31.8 68.2 49.5 51.2 76.4 63.2Mizoram 28.2 77.7 53.7 31.7 68.9 49.3 30.0 73.6 51.6Nagaland 15.7 65.6 42.0 19.0 62.9 41.1 16.7 64.8 41.8Odisha 20.0 79.4 49.0 16.9 74.6 44.8 19.5 78.6 48.3Puducherry 10.6 67.2 37.6 20.4 70.6 44.5 17.1 69.4 42.2Punjab 14.0 72.9 44.5 18.2 78.2 49.6 15.5 74.9 46.5Rajasthan 30.8 73.9 52.6 14.5 72.2 44.8 27.0 73.5 50.7Sikkim 47.6 75.7 62.3 34.0 76.8 57.3 43.9 76.0 60.9Tamil Nadu 39.0 78.5 58.3 27.6 76.7 51.4 33.7 77.7 55.1Telangana 39.2 73.7 56.6 22.9 76.7 49.9 32.6 74.9 53.9Tripura 11.2 75.7 45.3 17.1 72.3 44.1 12.5 75.0 45.1Uttar Pradesh 14.2 75.6 44.9 11.1 73.4 43.4 13.5 75.1 44.6Uttarakhand 20.3 69.1 44.5 12.3 71.3 42.5 18.1 69.8 43.9West Bengal 19.8 81.3 50.4 23.0 75.1 49.2 20.8 79.3 50.1India 24.6 76.4 50.7 20.4 74.5 47.6 23.3 75.8 49.8
Notes: 1. Figures are based on usual status approach and includes principal status and subsidiary status persons of all ages.
2. The figures represent size of labour force as percentage of population
Table 4.10 : State-wise Labour Force Participation Rate for persons aged 15 years & above
Name of States/UTs Rural Urban Total
Source: Periodic Labour Force Survey (PLFS), NSO, July 2017- June 2018.
82
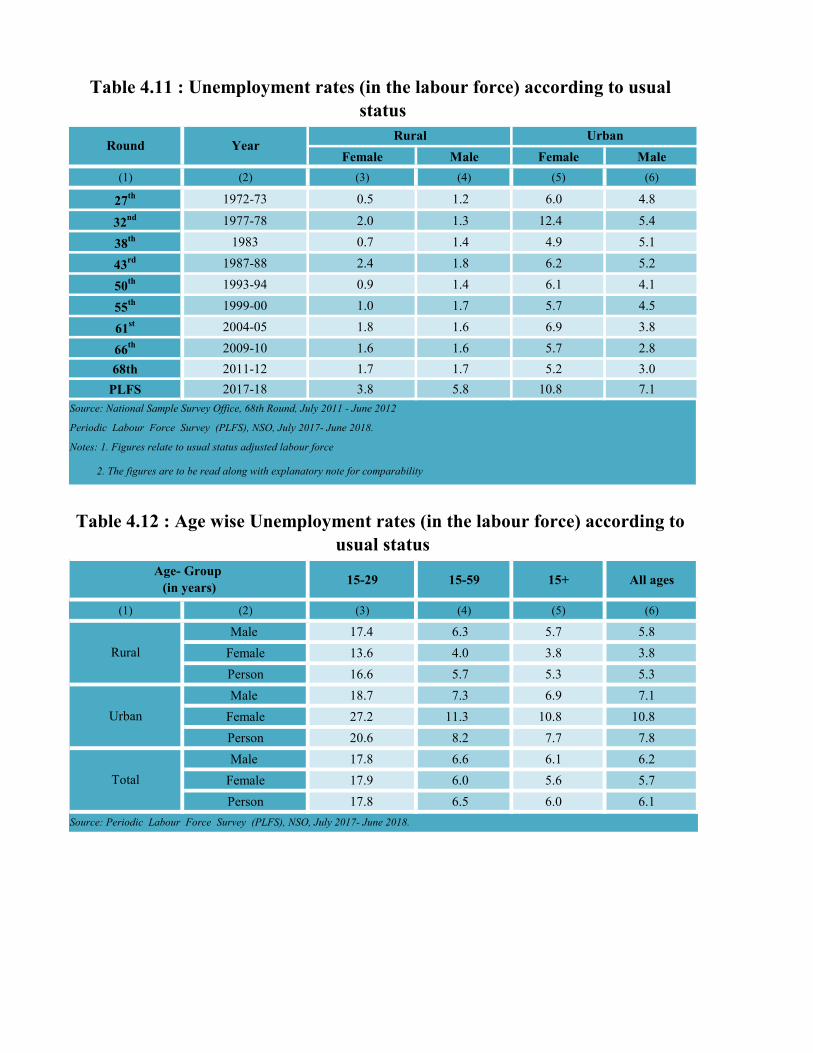
Female Male Female Male(1) (2) (3) (4) (5) (6)
27th 1972-73 0.5 1.2 6.0 4.8
32nd 1977-78 2.0 1.3 12.4 5.4
38th 1983 0.7 1.4 4.9 5.1
43rd 1987-88 2.4 1.8 6.2 5.2
50th 1993-94 0.9 1.4 6.1 4.1
55th 1999-00 1.0 1.7 5.7 4.5
61st 2004-05 1.8 1.6 6.9 3.8
66th 2009-10 1.6 1.6 5.7 2.868th 2011-12 1.7 1.7 5.2 3.0
PLFS 2017-18 3.8 5.8 10.8 7.1
15-29 15-59 15+ All ages
(1) (2) (3) (4) (5) (6)
Male 17.4 6.3 5.7 5.8Female 13.6 4.0 3.8 3.8Person 16.6 5.7 5.3 5.3Male 18.7 7.3 6.9 7.1
Female 27.2 11.3 10.8 10.8Person 20.6 8.2 7.7 7.8Male 17.8 6.6 6.1 6.2
Female 17.9 6.0 5.6 5.7Person 17.8 6.5 6.0 6.1
Source: Periodic Labour Force Survey (PLFS), NSO, July 2017- June 2018.
Table 4.12 : Age wise Unemployment rates (in the labour force) according to usual status
Age- Group (in years)
Rural
Urban
Total
Periodic Labour Force Survey (PLFS), NSO, July 2017- June 2018.
Notes: 1. Figures relate to usual status adjusted labour force
2. The figures are to be read along with explanatory note for comparability
Table 4.11 : Unemployment rates (in the labour force) according to usual status
Round YearRural Urban
Source: National Sample Survey Office, 68th Round, July 2011 - June 2012
83
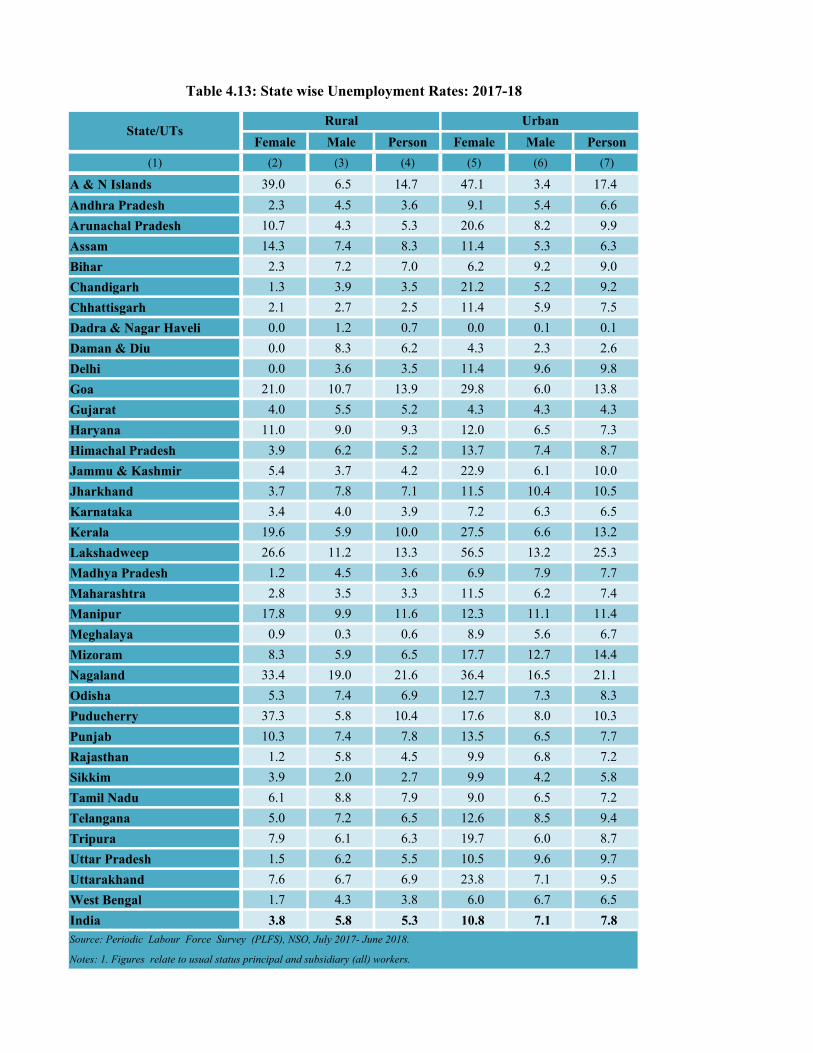
Female Male Person Female Male Person(1) (2) (3) (4) (5) (6) (7)
A & N Islands 39.0 6.5 14.7 47.1 3.4 17.4Andhra Pradesh 2.3 4.5 3.6 9.1 5.4 6.6Arunachal Pradesh 10.7 4.3 5.3 20.6 8.2 9.9Assam 14.3 7.4 8.3 11.4 5.3 6.3Bihar 2.3 7.2 7.0 6.2 9.2 9.0Chandigarh 1.3 3.9 3.5 21.2 5.2 9.2Chhattisgarh 2.1 2.7 2.5 11.4 5.9 7.5Dadra & Nagar Haveli 0.0 1.2 0.7 0.0 0.1 0.1Daman & Diu 0.0 8.3 6.2 4.3 2.3 2.6Delhi 0.0 3.6 3.5 11.4 9.6 9.8Goa 21.0 10.7 13.9 29.8 6.0 13.8Gujarat 4.0 5.5 5.2 4.3 4.3 4.3Haryana 11.0 9.0 9.3 12.0 6.5 7.3Himachal Pradesh 3.9 6.2 5.2 13.7 7.4 8.7Jammu & Kashmir 5.4 3.7 4.2 22.9 6.1 10.0Jharkhand 3.7 7.8 7.1 11.5 10.4 10.5Karnataka 3.4 4.0 3.9 7.2 6.3 6.5Kerala 19.6 5.9 10.0 27.5 6.6 13.2Lakshadweep 26.6 11.2 13.3 56.5 13.2 25.3Madhya Pradesh 1.2 4.5 3.6 6.9 7.9 7.7Maharashtra 2.8 3.5 3.3 11.5 6.2 7.4Manipur 17.8 9.9 11.6 12.3 11.1 11.4Meghalaya 0.9 0.3 0.6 8.9 5.6 6.7Mizoram 8.3 5.9 6.5 17.7 12.7 14.4Nagaland 33.4 19.0 21.6 36.4 16.5 21.1Odisha 5.3 7.4 6.9 12.7 7.3 8.3Puducherry 37.3 5.8 10.4 17.6 8.0 10.3Punjab 10.3 7.4 7.8 13.5 6.5 7.7Rajasthan 1.2 5.8 4.5 9.9 6.8 7.2Sikkim 3.9 2.0 2.7 9.9 4.2 5.8Tamil Nadu 6.1 8.8 7.9 9.0 6.5 7.2Telangana 5.0 7.2 6.5 12.6 8.5 9.4Tripura 7.9 6.1 6.3 19.7 6.0 8.7Uttar Pradesh 1.5 6.2 5.5 10.5 9.6 9.7Uttarakhand 7.6 6.7 6.9 23.8 7.1 9.5West Bengal 1.7 4.3 3.8 6.0 6.7 6.5India 3.8 5.8 5.3 10.8 7.1 7.8
Notes: 1. Figures relate to usual status principal and subsidiary (all) workers.
Table 4.13: State wise Unemployment Rates: 2017-18
State/UTsRural Urban
Source: Periodic Labour Force Survey (PLFS), NSO, July 2017- June 2018.
84

Female Male Person Female Male Person Female Male Person(1) (2) (3) (4) (5) (6) (7) (8) (9) (10)
A & N Islands 39.0 6.5 14.7 47.1 3.4 17.4 42.8 5.3 15.8Andhra Pradesh 2.3 4.5 3.6 9.0 5.5 6.6 3.9 4.8 4.5Arunachal Pradesh 10.2 4.3 5.2 20.6 8.0 9.6 11.5 4.9 5.8Assam 14.0 7.3 8.1 11.4 5.3 6.3 13.6 7.1 7.9Bihar 2.3 7.0 6.8 6.2 9.3 9.0 2.8 7.2 7.0Chandigarh 1.3 3.9 3.5 21.2 5.2 9.2 20.8 5.2 9.0Chhattisgarh 2.1 2.7 2.5 11.4 5.9 7.5 3.3 3.3 3.3D & N Haveli 0.0 1.2 0.7 0.0 0.1 0.1 0.0 0.6 0.4Daman & Diu 0.0 8.3 6.2 4.3 2.3 2.6 3.3 3.0 3.1Delhi 0.0 3.6 3.5 10.7 9.4 9.5 10.7 9.2 9.4Goa 21.0 10.7 13.9 29.8 6.0 13.8 26.0 8.1 13.9Gujarat 4.1 5.4 5.2 4.3 4.2 4.2 4.1 5.0 4.8Haryana 9.9 9.0 9.2 12.0 6.0 6.9 10.6 8.0 8.4Himachal Pradesh 3.9 6.2 5.2 13.7 7.4 8.7 4.3 6.3 5.5Jammu & Kashmir 5.6 3.8 4.3 22.8 6.0 9.9 8.5 4.2 5.4Jharkhand 3.7 7.4 6.8 11.5 10.2 10.4 5.2 7.9 7.5Karnataka 3.4 4.0 3.9 7.2 6.3 6.5 4.7 4.9 4.8Kerala 19.6 5.9 10.0 27.4 6.6 13.2 23.2 6.2 11.4Lakshadweep 26.6 11.2 13.3 56.5 13.2 25.3 50.5 12.5 21.3Madhya Pradesh 1.2 4.3 3.4 6.9 7.8 7.6 2.1 5.1 4.3Maharashtra 2.8 3.4 3.2 11.4 6.2 7.4 5.4 4.6 4.8Manipur 17.5 9.8 11.5 12.3 11.1 11.4 15.7 10.2 11.5Meghalaya 0.9 0.3 0.6 8.9 5.6 6.7 1.9 1.3 1.6Mizoram 8.4 5.9 6.5 17.7 12.7 14.3 13.3 8.8 10.1Nagaland 33.3 19.0 21.6 36.4 16.5 21.1 34.3 18.3 21.4Odisha 5.3 7.3 6.9 12.7 7.3 8.4 6.3 7.3 7.1Puducherry 37.3 5.8 10.4 17.6 8.0 10.3 21.7 7.2 10.3Punjab 10.3 7.2 7.6 13.5 6.5 7.7 11.7 6.9 7.7Rajasthan 1.2 5.6 4.4 9.9 6.7 7.2 2.3 5.9 5.0Sikkim 3.9 2.0 2.7 9.9 4.2 5.8 5.2 2.6 3.5Tamil Nadu 6.0 8.8 7.9 9.0 6.2 6.9 7.1 7.6 7.5Telangana 5.0 7.2 6.5 12.6 8.5 9.4 7.2 7.7 7.6Tripura 7.9 6.1 6.3 19.8 6.0 8.7 11.6 6.1 6.8Uttar Pradesh 1.5 6.1 5.4 10.6 9.4 9.5 3.1 6.8 6.2Uttarakhand 7.6 6.7 6.9 23.8 7.1 9.5 10.7 6.8 7.6West Bengal 1.7 4.4 3.8 5.9 6.6 6.4 3.1 5.0 4.6
India 3.8 5.7 5.3 10.8 6.9 7.7 5.6 6.1 6.0Source: Periodic Labour Force Survey (PLFS), NSO, July 2017- June 2018.Notes: 1. Figures relate to usual status principal and subsidiary (all) workers.
Table 4.14 : State-wise Unemployment Rate for Persons aged 15 years & above : 2017-18
States/UTsRural Urban Total
85

Female Male Female Male Female Male Female Male(1) (2) (3) (4) (5) (6) (7) (8) (9)
A & N Islands 0 379 0 0 0 0 0 381Andhra Pradesh 201 298 133 135 138 140 180 346Arunachal Pradesh 0 345 0 0 0 0 0 313Assam 150 251 0 149 0 0 271 293Bihar 98 281 0 160 0 160 357 296Chandigarh 0 0 0 0 0 0 0 0Chhattisgarh 154 182 160 156 0 0 173 253Dadra & Nagar Haveli 0 237 0 0 0 0 0 0Daman & Diu 0 0 0 0 0 0 0 0Delhi 0 300 0 0 0 0 300 404Goa 305 377 0 0 0 0 0 172Gujarat 164 184 150 150 0 0 155 258Haryana 266 300 0 0 160 160 171 340Himachal Pradesh 327 322 0 160 176 160 150 293Jammu & Kashmir 200 366 0 150 0 125 350 370Jharkhand 165 241 0 0 0 150 237 271Karnataka 148 283 150 150 160 0 217 346Kerala 386 425 160 0 160 0 361 438Lakshadweep 0 547 0 0 0 0 0 400Madhya Pradesh 149 187 150 158 0 0 137 239Maharashtra 136 207 111 151 0 0 174 269Manipur 330 323 0 0 0 160 274 341Meghalaya 236 282 0 0 154 159 91 382Mizoram 300 339 0 346 0 0 0 326Nagaland 0 271 0 0 0 0 0 245Odisha 144 208 0 160 0 160 99 231Puducherry 150 316 0 0 0 0 252 368Punjab 242 307 160 160 160 160 201 338Rajasthan 227 297 114 129 135 134 211 330Sikkim 0 400 0 0 0 202 0 325Tamil Nadu 184 333 142 150 128 118 190 360Telangana 208 262 150 160 0 0 242 322Tripura 219 283 166 180 161 163 264 282Uttar Pradesh 159 229 0 159 0 160 225 262Uttarakhand 0 310 0 160 0 0 250 308West Bengal 153 203 150 152 171 177 128 288India 179 282 119 138 131 142 201 335Source: Periodic Labour Force Survey (PLFS), NSO, July 2017- June 2018.
Table 4.15.1 : Average Wage Earning (in Rs.) received per day by Casual Labourers in Specified Works (Jul.-Sep., 2017)
State/Union Territory
Rural Urban
Works other than Public Works
Public Works other than MGNREGA
Public Works
MGNREGA Public Works
Works other than Public Works
86

Female Male Female Male Female Male Female Male(1) (2) (3) (4) (5) (6) (7) (8) (9)
A & N Islands 350 394 0 0 0 0 200 382Andhra Pradesh 179 314 160 151 130 0 200 359Arunachal Pradesh 0 296 0 0 0 0 0 303Assam 169 283 0 0 0 0 295 304Bihar 183 281 160 160 0 160 234 291Chandigarh 0 0 0 0 0 0 0 400Chhattisgarh 125 183 0 0 172 172 141 236Dadra & Nagar Haveli 0 0 0 0 0 0 300 0Daman & Diu 0 0 0 0 0 0 0 0Delhi 250 400 0 0 0 0 0 462Goa 400 373 0 0 0 0 0 366Gujarat 196 232 0 159 0 0 118 259Haryana 264 313 0 0 0 0 186 367Himachal Pradesh 276 355 160 160 160 160 337 341Jammu & Kashmir 0 379 0 0 0 152 184 383Jharkhand 131 240 0 0 0 0 189 277Karnataka 165 273 0 100 0 0 178 334Kerala 316 484 160 160 160 0 302 466Lakshadweep 0 486 0 0 0 0 0 572Madhya Pradesh 144 204 130 130 0 160 166 244Maharashtra 137 239 0 0 0 150 161 287Manipur 238 328 0 0 0 0 326 338Meghalaya 150 317 133 0 0 0 131 382Mizoram 300 321 0 0 0 0 295 345Nagaland 0 400 0 0 0 0 0 316Odisha 138 213 0 150 0 152 155 243Puducherry 100 394 0 0 0 0 266 357Punjab 258 309 160 153 160 155 231 325Rajasthan 222 291 0 0 0 0 233 339Sikkim 0 458 0 0 0 0 0 345Tamil Nadu 184 360 135 0 120 120 216 376Telangana 255 292 150 150 0 0 236 337Tripura 229 308 160 0 0 0 293 310Uttar Pradesh 173 245 150 160 0 0 199 272Uttarakhand 228 288 0 0 0 0 264 301West Bengal 141 226 160 151 0 0 148 270India 179 282 119 138 131 142 201 335Source: Periodic Labour Force Survey (PLFS), NSO, July 2017- June 2018.
Table 4.15.2 : Average Wage Earning (in Rs.) received per day by Casual Labourers in Specified Works
(Oct.-Dec., 2017)
State/Union Territory
Rural Urban
Works other than Public Works
Public Works other than MGNREGA
Public Works
MGNREGA Public Works
Works other than Public Works
87

Female Male Female Male Female Male Female Male(1) (2) (3) (4) (5) (6) (7) (8) (9)
A & N Islands 500 488 0 0 0 0 0 441Andhra Pradesh 187 293 114 122 130 100 200 377Arunachal Pradesh 0 268 0 150 0 0 207 318Assam 168 284 0 150 0 0 190 315Bihar 244 287 150 153 0 0 210 302Chandigarh 0 400 0 0 0 0 0 391Chhattisgarh 183 188 0 150 170 169 158 230Dadra & Nagar Haveli 0 200 0 0 0 0 300 0Daman & Diu 0 0 0 150 0 0 0 400Delhi 0 300 0 0 0 0 500 449Goa 190 399 0 150 0 0 200 354Gujarat 167 233 0 160 0 0 171 282Haryana 268 348 0 0 0 0 242 347Himachal Pradesh 312 352 189 160 160 0 204 350Jammu & Kashmir 200 376 0 159 0 160 322 365Jharkhand 198 241 0 0 100 0 187 262Karnataka 159 299 0 0 0 0 172 342Kerala 282 558 0 0 246 247 327 539Lakshadweep 170 518 0 0 0 0 0 516Madhya Pradesh 162 206 156 122 159 159 163 247Maharashtra 140 241 0 0 131 150 156 291Manipur 200 327 0 0 0 0 286 342Meghalaya 284 358 0 153 0 0 131 364Mizoram 0 358 0 0 0 0 292 351Nagaland 0 400 0 0 0 0 0 332Odisha 154 238 150 150 0 0 178 272Puducherry 102 397 0 0 0 0 174 355Punjab 243 319 0 160 150 0 211 318Rajasthan 271 280 100 0 145 151 268 314Sikkim 0 367 178 182 160 0 0 337Tamil Nadu 202 377 131 0 137 120 219 400Telangana 234 329 0 0 0 0 225 341Tripura 318 318 0 0 0 0 323 316Uttar Pradesh 173 246 160 151 0 0 173 274Uttarakhand 210 295 0 0 0 0 300 289West Bengal 145 221 150 150 0 235 154 264India 179 282 119 138 131 142 201 335Source: Periodic Labour Force Survey (PLFS), NSO, July 2017- June 2018 .
Table 4.15.3 : Average Wage Earning (in Rs.) received per day by Casual Labourers in Specified Works
(Jan.-Mar., 2018)
State/Union Territory
Rural Urban
Works other than Public Works
Public Works other than MGNREGA
Public Works
MGNREGA Public Works
Works other than Public Works
88

Female Male Female Male Female Male Female Male(1) (2) (3) (4) (5) (6) (7) (8) (9)
A & N Islands 0 500 0 0 0 0 1300 468Andhra Pradesh 199 344 100 100 114 118 205 360Arunachal Pradesh 0 287 0 0 0 0 0 332Assam 200 266 0 0 0 0 300 312Bihar 153 296 0 160 0 0 206 313Chandigarh 0 279 0 0 0 0 300 385Chhattisgarh 154 195 0 160 170 169 157 222Dadra & Nagar Haveli 150 200 0 0 0 0 300 300Daman & Diu 0 400 0 0 0 0 0 400Delhi 0 359 0 0 0 0 400 382Goa 385 357 0 0 0 0 400 381Gujarat 148 227 0 0 0 0 158 283Haryana 168 336 0 0 0 0 209 343Himachal Pradesh 305 371 160 160 170 165 226 362Jammu & Kashmir 0 373 0 0 0 150 339 380Jharkhand 223 265 0 0 0 167 228 265Karnataka 165 285 0 0 0 100 180 343Kerala 306 663 187 140 241 0 358 621Lakshadweep 0 0 0 0 0 0 0 0Madhya Pradesh 190 242 150 150 0 160 164 251Maharashtra 131 231 0 0 121 158 165 283Manipur 185 292 0 150 156 150 263 347Meghalaya 209 361 153 0 0 0 148 363Mizoram 0 299 0 0 0 0 311 351Nagaland 350 377 0 0 0 0 0 347Odisha 161 245 0 150 0 0 178 266Puducherry 125 261 0 0 0 0 261 365Punjab 203 305 0 160 0 0 239 324Rajasthan 228 314 0 0 112 140 260 298Sikkim 0 400 0 0 0 0 0 396Tamil Nadu 181 368 122 0 152 0 242 411Telangana 216 350 119 126 0 0 238 353Tripura 298 321 161 0 160 0 271 338Uttar Pradesh 183 255 0 150 0 151 210 279Uttarakhand 268 284 0 0 0 0 250 287West Bengal 175 225 105 155 0 181 153 284India 179 282 119 138 131 142 201 335Source: Periodic Labour Force Survey (PLFS), NSO, July 2017- June 2018.
Table 4.15.4 : Average Wage Earning (in Rs.) received per day by Casual Labourers in Specified Works
(Apr.-Jun., 2018)
State/Union Territory
Rural Urban
Works other than Public Works
Public Works other than MGNREGA
Public Works
MGNREGA Public Works
Works other than Public Works
89

No of Accounts Amount No of
Accounts Amount No of Accounts Amount No of
Accounts Amount
(1) (2) (3) (4) (5) (6) (7) (8) (9)
Rural 370374 69212.6 217845 323835.7 642225 1209786.5 37.0 31.8
Semi-Urban 357000 1012892.9 179375 447256.0 568454 1851368.6 33.4 30.6
Urban 202940 1081204.4 104104 546024.8 327038 2437497.6 33.9 33.6
Metropolitan 225163 1932681.1 120429 985360.2 373787 5935798.2 34.9 33.8
All India 1155477 4722991.0 621753 2302476.7 1911504 11434450.9 35.0 32.8
Source : Basic Statistical Returns of Scheduled Commercial Banks in India
Table 4.16: Population Group-Wise Deposits of Scheduled Commercial Banks
As on March 2017
No. of Accounts in thousand, Amount in Rs. Crore
Group
Individuals Total
(Including Others)
% Female to Total IndividualsMale Female
90
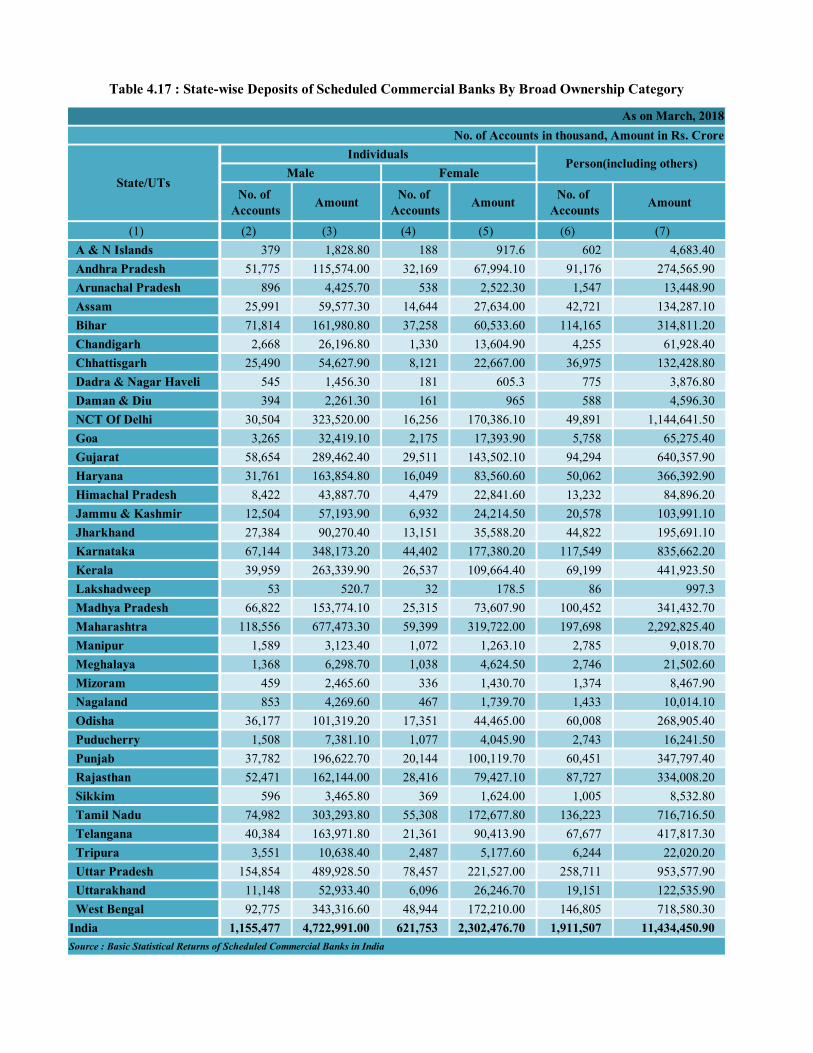
No. of Accounts Amount No. of
Accounts Amount No. of Accounts Amount
(1) (2) (3) (4) (5) (6) (7) A & N Islands 379 1,828.80 188 917.6 602 4,683.40 Andhra Pradesh 51,775 115,574.00 32,169 67,994.10 91,176 274,565.90 Arunachal Pradesh 896 4,425.70 538 2,522.30 1,547 13,448.90 Assam 25,991 59,577.30 14,644 27,634.00 42,721 134,287.10 Bihar 71,814 161,980.80 37,258 60,533.60 114,165 314,811.20 Chandigarh 2,668 26,196.80 1,330 13,604.90 4,255 61,928.40 Chhattisgarh 25,490 54,627.90 8,121 22,667.00 36,975 132,428.80 Dadra & Nagar Haveli 545 1,456.30 181 605.3 775 3,876.80 Daman & Diu 394 2,261.30 161 965 588 4,596.30 NCT Of Delhi 30,504 323,520.00 16,256 170,386.10 49,891 1,144,641.50 Goa 3,265 32,419.10 2,175 17,393.90 5,758 65,275.40 Gujarat 58,654 289,462.40 29,511 143,502.10 94,294 640,357.90 Haryana 31,761 163,854.80 16,049 83,560.60 50,062 366,392.90 Himachal Pradesh 8,422 43,887.70 4,479 22,841.60 13,232 84,896.20 Jammu & Kashmir 12,504 57,193.90 6,932 24,214.50 20,578 103,991.10 Jharkhand 27,384 90,270.40 13,151 35,588.20 44,822 195,691.10 Karnataka 67,144 348,173.20 44,402 177,380.20 117,549 835,662.20 Kerala 39,959 263,339.90 26,537 109,664.40 69,199 441,923.50 Lakshadweep 53 520.7 32 178.5 86 997.3 Madhya Pradesh 66,822 153,774.10 25,315 73,607.90 100,452 341,432.70 Maharashtra 118,556 677,473.30 59,399 319,722.00 197,698 2,292,825.40 Manipur 1,589 3,123.40 1,072 1,263.10 2,785 9,018.70 Meghalaya 1,368 6,298.70 1,038 4,624.50 2,746 21,502.60 Mizoram 459 2,465.60 336 1,430.70 1,374 8,467.90 Nagaland 853 4,269.60 467 1,739.70 1,433 10,014.10 Odisha 36,177 101,319.20 17,351 44,465.00 60,008 268,905.40 Puducherry 1,508 7,381.10 1,077 4,045.90 2,743 16,241.50 Punjab 37,782 196,622.70 20,144 100,119.70 60,451 347,797.40 Rajasthan 52,471 162,144.00 28,416 79,427.10 87,727 334,008.20 Sikkim 596 3,465.80 369 1,624.00 1,005 8,532.80 Tamil Nadu 74,982 303,293.80 55,308 172,677.80 136,223 716,716.50 Telangana 40,384 163,971.80 21,361 90,413.90 67,677 417,817.30 Tripura 3,551 10,638.40 2,487 5,177.60 6,244 22,020.20 Uttar Pradesh 154,854 489,928.50 78,457 221,527.00 258,711 953,577.90 Uttarakhand 11,148 52,933.40 6,096 26,246.70 19,151 122,535.90 West Bengal 92,775 343,316.60 48,944 172,210.00 146,805 718,580.30India 1,155,477 4,722,991.00 621,753 2,302,476.70 1,911,507 11,434,450.90Source : Basic Statistical Returns of Scheduled Commercial Banks in India
Table 4.17 : State-wise Deposits of Scheduled Commercial Banks By Broad Ownership Category
As on March, 2018No. of Accounts in thousand, Amount in Rs. Crore
State/UTs
IndividualsPerson(including others)
Male Female
91

Officers Clerks Subordinates Total
(1) (2) (3) (4) (5) (6)
State Bank of India& its associates 16% 16% 17% 16%
Nationalised Banks 17% 0% - 16%
Foreign Banks 9% 12% 7% 10%
Regional Rural Banks 10% 20% 15% 11%
Private Sector Banks 14% 7% 2% 13%
All Scheduled Commercial Banks 13% 15% 15% 14%
State Bank of India& its associates 26% 24% 16% 23%
Nationalised Banks 12% - 0% 12%
Foreign Banks 18% 28% 12% 21%
Regional Rural Banks 15% 38% 26% 18%
Private Sector Banks 12% 1% 3% 7%
All Scheduled Commercial Banks 21% 26% 16% 21%
State Bank of India& its associates 36% 33% 21% 33%
Nationalised Banks 32% 34% 11% 32%
Foreign Banks 24% 46% 20% 30%
Regional Rural Banks 24% 44% 17% 25%
Private Sector Banks 13% 5% 8% 12%
All Scheduled Commercial Banks 29% 34% 19% 29%
State Bank of India& its associates
30% 28% 19% 27%
Nationalised Banks 32% 34% 11% 32%
Foreign Banks 14% 20% 10% 16%
Regional Rural Banks 21% 39% 20% 22%
Private Sector Banks 13% 4% 6% 11%
All Scheduled Commercial Banks
25% 28% 17% 25%
Source: Basic Statistical Returns of Scheduled Commercial Banks in India
Table 4.18:Percent women employed in various Bank-Groups at various levels in Scheduled Commercial Banks
(as on March, 2018)
Bank Group
Rur
alSe
mi U
rban
All
Indi
aU
rban
/ Met
ropo
litan
92
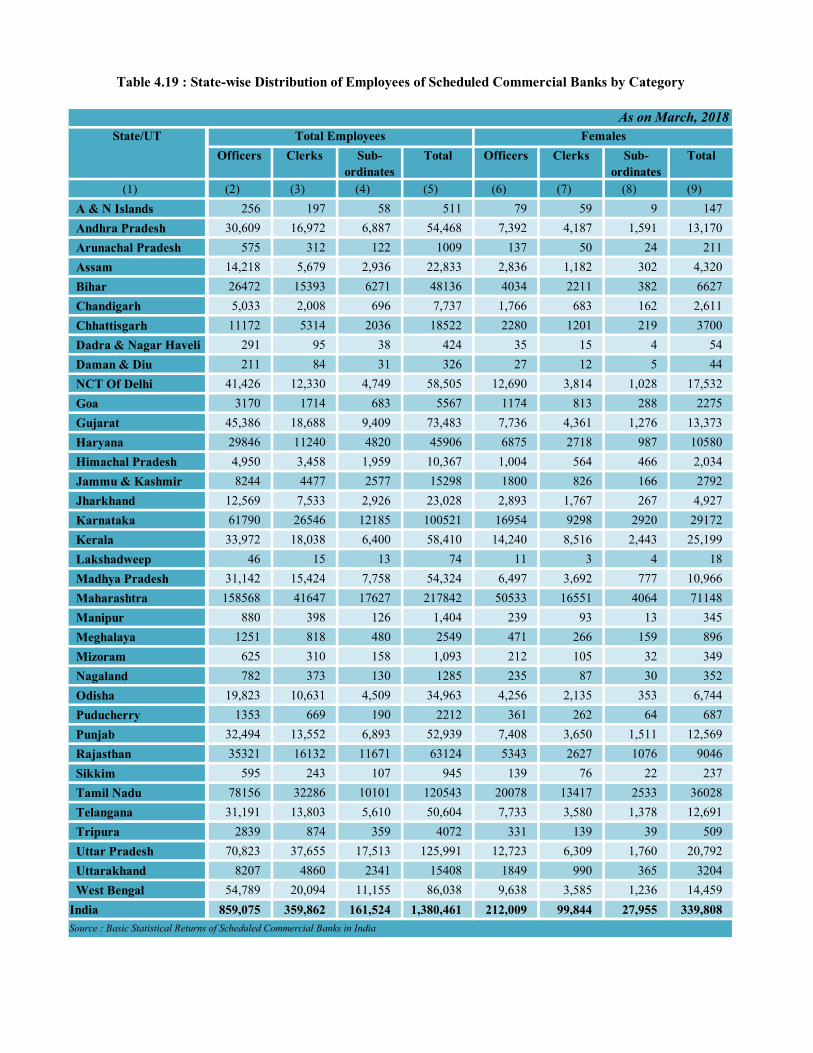
Officers Clerks Sub-ordinates
Total Officers Clerks Sub-ordinates
Total
(1) (2) (3) (4) (5) (6) (7) (8) (9) A & N Islands 256 197 58 511 79 59 9 147 Andhra Pradesh 30,609 16,972 6,887 54,468 7,392 4,187 1,591 13,170 Arunachal Pradesh 575 312 122 1009 137 50 24 211 Assam 14,218 5,679 2,936 22,833 2,836 1,182 302 4,320 Bihar 26472 15393 6271 48136 4034 2211 382 6627 Chandigarh 5,033 2,008 696 7,737 1,766 683 162 2,611 Chhattisgarh 11172 5314 2036 18522 2280 1201 219 3700 Dadra & Nagar Haveli 291 95 38 424 35 15 4 54 Daman & Diu 211 84 31 326 27 12 5 44 NCT Of Delhi 41,426 12,330 4,749 58,505 12,690 3,814 1,028 17,532 Goa 3170 1714 683 5567 1174 813 288 2275 Gujarat 45,386 18,688 9,409 73,483 7,736 4,361 1,276 13,373 Haryana 29846 11240 4820 45906 6875 2718 987 10580 Himachal Pradesh 4,950 3,458 1,959 10,367 1,004 564 466 2,034 Jammu & Kashmir 8244 4477 2577 15298 1800 826 166 2792 Jharkhand 12,569 7,533 2,926 23,028 2,893 1,767 267 4,927 Karnataka 61790 26546 12185 100521 16954 9298 2920 29172 Kerala 33,972 18,038 6,400 58,410 14,240 8,516 2,443 25,199 Lakshadweep 46 15 13 74 11 3 4 18 Madhya Pradesh 31,142 15,424 7,758 54,324 6,497 3,692 777 10,966 Maharashtra 158568 41647 17627 217842 50533 16551 4064 71148 Manipur 880 398 126 1,404 239 93 13 345 Meghalaya 1251 818 480 2549 471 266 159 896 Mizoram 625 310 158 1,093 212 105 32 349 Nagaland 782 373 130 1285 235 87 30 352 Odisha 19,823 10,631 4,509 34,963 4,256 2,135 353 6,744 Puducherry 1353 669 190 2212 361 262 64 687 Punjab 32,494 13,552 6,893 52,939 7,408 3,650 1,511 12,569 Rajasthan 35321 16132 11671 63124 5343 2627 1076 9046 Sikkim 595 243 107 945 139 76 22 237 Tamil Nadu 78156 32286 10101 120543 20078 13417 2533 36028 Telangana 31,191 13,803 5,610 50,604 7,733 3,580 1,378 12,691 Tripura 2839 874 359 4072 331 139 39 509 Uttar Pradesh 70,823 37,655 17,513 125,991 12,723 6,309 1,760 20,792 Uttarakhand 8207 4860 2341 15408 1849 990 365 3204 West Bengal 54,789 20,094 11,155 86,038 9,638 3,585 1,236 14,459India 859,075 359,862 161,524 1,380,461 212,009 99,844 27,955 339,808Source : Basic Statistical Returns of Scheduled Commercial Banks in India
Table 4.19 : State-wise Distribution of Employees of Scheduled Commercial Banks by Category
As on March, 2018State/UT Total Employees Females
93

Male Female Person % Female
(1) (2) (3) (4) (5) (6)
Establishment 9342670 2452819 11834222 20.73%
Workers 16709863 3641531 20437388 17.82%
Establishment 707430 308948 1019286 30.31%
Workers 1311080 411819 1729873 23.81%
Establishment 10050100 2761767 12853508 21.49%
Workers 18020943 4053350 22167261 18.29%
Male Female Person % Female
(1) (2) (3) (4) (5) (6)
Establishment 16149809 2790225 19000169 14.69%
Workers 28679897 4623335 33475585 13.81%
Establishment 17876783 2498827 20436846 12.23%
Workers 42435503 4771497 47417860 10.06%
Establishment 34026592 5289052 39437015 13.41%
Workers 71115400 9394832 80893445 11.61%
Figures in absolute Number
Table 4.20: Proprietary Establishments and employment therein by sex of the owner: 2014
Rural
Urban
Total
Source: Sixth Economic Census (2014), Ministry of Statistics & Programme Implementation
Figures in absolute Number
Table 4.21: Non-agricultural proprietary Establishments and employment therein by sex of the owner: 2014
Rural
Urban
Total
Source: Sixth Economic Census (2014), Ministry of Statistics & Programme Implementation
94

Type of Establishment Male Female Person % Female
(1) (2) (3) (4) (5) (6)
Own Account Establishment 16297005 5362506 21659511 24.76%
Establishments with hired worker 18322370 6856220 25178590 27.23%
All Establishments 34619375 12218726 46838101 26.09%
Own Account Establishment 13901011 3706609 17607620 21.05%
Establishments with hired worker 35741224 8224422 43965646 18.71%
All Establishments 49642235 11931031 61573266 19.38%
Own Account Establishment 30198016 9069115 39267131 23.10%
Establishments with hired worker 54063594 15080642 69144236 21.81%
All Establishments 84261610 24149757 108411367 22.28%
Figures in absolute Number
Table 4.22: Non-agricultural establishments and employment therein by sex of the owner : 2014
Rural
Urban
Total
Source: Sixth Economic Census (2014), Ministry of Statistics & Programme Implementation
95

Male Female % Female Male Female % Female Male Female % Female(1) (2) (3) (4) (5) (6) (7) (8) (9) (10)
A & N Islands 69 38 36% 36 5 12% 105 43 29%Andhra Pradesh 63493 27001 30% 37306 9779 21% 100799 36780 27%Arunachal Pradesh 30 54 64% 46 43 48% 76 97 56%Assam 44142 24414 36% 15292 5427 26% 59434 29841 33%Bihar 19153 2461 11% 7612 758 9% 26765 3219 11%Chandigarh 25 0 0% 207 18 8% 232 18 7%Chhattisgarh 13127 1340 9% 5531 749 12% 18658 2089 10%Dadra & Nagar Haveli 6 1 14% 40 3 7% 46 4 8%Daman & Diu 5 0 0% 11 11 50% 16 11 41%Delhi 80 8 9% 7384 1111 13% 7464 1119 13%Goa 237 193 45% 334 131 28% 571 324 36%Gujarat 13694 5298 28% 31520 11192 26% 45214 16490 27%Haryana 7425 1681 18% 6183 763 11% 13608 2444 15%Himachal Pradesh 6372 4786 43% 547 232 30% 6919 5018 42%Jammu & Kashmir 30399 9659 24% 8912 3086 25% 39311 12745 24%Jharkhand 9922 1151 10% 2484 428 15% 12406 1579 11%Karnataka 24360 6909 22% 23219 5566 19% 47579 12475 21%Kerala 6129 8799 59% 8024 6144 43% 14153 14943 51%Lakshadweep 3 0 0% 7 5 42% 10 5 33%Madhya Pradesh 26020 3109 11% 16455 3202 16% 42475 6311 13%Maharashtra 28241 5971 17% 40017 7286 15% 68258 13257 16%Manipur 7011 31074 82% 4264 14512 77% 11275 45586 80%Meghalaya 1414 1646 54% 275 368 57% 1689 2014 54%Mizoram 463 161 26% 939 756 45% 1402 917 39%Nagaland 2374 1766 43% 272 353 56% 2646 2119 44%Odisha 109417 17946 14% 13495 2183 14% 122912 20129 14%Puducherry 74 12 14% 166 73 30% 240 85 26%Punjab 4199 1581 27% 7311 1347 16% 11510 2928 20%Rajasthan 60660 7118 10% 42795 7649 15% 103455 14767 12%Sikkim 308 238 44% 106 54 34% 414 292 41%Tamil Nadu 43215 8151 16% 61192 10035 14% 104407 18186 15%Telangana 20070 4998 20% 7298 7185 49% 27368 12183 31%Tripura 5512 881 14% 3933 262 6% 9445 1143 11%Uttar Pradesh 120474 29573 20% ## 17853 12% 253160 47426 16%Uttarakhand 4249 1839 30% 2200 871 28% 6449 2710 29%West Bengal 151237 48776 24% 95165 18045 16% 246402 66821 21%India 823609 ## 24% ## 137485 19% ### 396118 22%
Source: Sixth Economic Census (2014), Ministry of Statistics &Programme Implementation
Table 4.23: Distribution of proprietary establishments by sex of owner: 2014
States/UTsRural Urban Total
96

Perennial Seasonal CasualWithout
Hired Workers
With Hired Worker
(1) (2) (3) (4) (5) (6) (7) (8) (9) A&N Islands 2092 347 74 2513 83% 2011 502 20%Andhra Pradesh 766306 82316 1290 849912 90% 736146 113766 13%Arunachal Pradesh 6032 241 140 6413 94% 4438 1975 31%Assam 132924 14285 6949 154158 86% 130338 23820 15%Bihar 141579 10465 1566 153610 92% 90115 63495 41%Chandigarh 5460 256 67 5783 94% 4921 862 15%Chhattisgarh 44829 32501 646 77976 57% 62328 15648 20%Dadra & Nagar Haveli 1287 14 3 1304 99% 352 952 73%Daman & Diu 694 95 16 805 86% 566 239 30%Delhi 66544 2864 1026 70434 94% 50403 20031 28%Goa 14573 1614 469 16656 87% 13539 3117 19%Gujarat 433199 88087 7337 528623 82% 403569 125054 24%Haryana 101907 17538 5079 124524 82% 113224 11300 9%Himachal Pradesh 36956 8800 3417 49173 75% 45229 3944 8%Jammu & Kashmir 23264 7030 998 31292 74% 23012 8280 26%Jharkhand 51075 3319 338 54732 93% 19827 34905 64%Karnataka 498295 40993 6518 545806 91% 492506 53300 10%Kerala 825386 54589 33942 913917 90% 863797 50120 5%Lakshadweep 346 90 24 460 75% 329 131 28%Madhya Pradesh 201458 19654 2293 223405 90% 155898 67507 30%Maharashtra 613038 44616 6646 664300 92% 580337 83963 13%Manipur 81106 5657 1523 88286 92% 84550 3736 4%Meghalaya 27525 1233 772 29530 93% 21540 7990 27%Mizoram 15264 259 305 15828 96% 12808 3020 19%Nagaland 9636 3054 967 13657 71% 11840 1817 13%Odisha 166525 65829 17246 249600 67% 223875 25725 10%Puducherry 9736 302 131 10169 96% 8192 1977 19%Punjab 101598 6944 2379 110921 92% 83916 27005 24%Rajasthan 214987 29224 3781 247992 87% 193234 54758 22%Sikkim 5071 211 22 5304 96% 4383 921 17%Tamil Nadu 1026273 45422 15914 1087609 94% 793646 293963 27%Telangana 328637 27643 206 356486 92% 292512 63974 18%Tripura 13586 714 206 14506 94% 13168 1338 9%Uttar Pradesh 432631 42374 7374 482379 90% 371730 110649 23%Uttarakhand 27597 2865 957 31419 88% 26828 4591 15%West Bengal 738603 64990 27744 831337 89% 762247 69090 8%India 7166019 726435 158365 8050819 89% 6697354 1353465 17%Source: Sixth Economic Census (2014), Ministry of Statistics & Programme Implementation
Table 4.24 : Total number of establishments under women entrepreneurship by nature of operation, Hired or no Hired Workers: 2014
States/UTs
Nature of operation
Total % perennial
Hired/No Hired Workers% with Hired worker
97

States/UTs Self-financeFinancial Assistance from Govt
Borrowing from
financial institutions
Borrowing from Non-
institutions/ Money Lenders
Loan from Self Help
Group
Donations/ Transfers from other
agencies
Total
(1) (2) (3) (4) (5) (6) (7) (8) A & N Islands 2110 60 199 5 4 135 2513Andhra Pradesh 663439 20470 8562 8573 36434 112434 849912Arunachal Pradesh 5229 262 45 28 24 825 6413Assam 139193 3438 1887 1250 1146 7244 154158Bihar 77584 7307 1946 1736 520 64517 153610Chandigarh 5621 117 26 3 1 15 5783Chhattisgarh 58761 4365 680 267 135 13768 77976D & N Haveli 490 10 38 2 2 762 1304Daman & Diu 673 14 15 0 1 102 805Delhi 59542 1148 322 239 111 9072 70434Goa 14939 503 670 25 118 401 16656Gujarat 339799 62511 6464 782 676 118391 528623Haryana 116069 1495 577 433 117 5833 124524Himachal Pradesh 44084 1242 1351 38 131 2327 49173Jammu & Kashmir 23527 1676 638 933 45 4473 31292Jharkhand 24408 4577 549 165 264 24769 54732Karnataka 464768 17513 7363 2956 8994 44212 545806Kerala 864223 9939 13471 2780 6897 16607 913917Lakshadweep 360 15 4 1 4 76 460Madhya Pradesh 145051 14855 2311 1003 848 59337 223405Maharashtra 551300 19440 10940 2997 3752 75871 664300Manipur 83621 345 802 673 90 2755 88286Meghalaya 27279 661 223 114 47 1206 29530Mizoram 14075 562 132 12 15 1032 15828Nagaland 12837 107 53 65 25 570 13657Odisha 188460 12810 3560 2058 2890 39822 249600Puducherry 8200 192 182 598 100 897 10169Punjab 94246 1808 577 299 94 13897 110921Rajasthan 182371 7912 2599 1325 387 53398 247992Sikkim 4720 236 123 7 3 215 5304Tamil Nadu 881274 26046 4868 4766 4558 166097 1087609Telangana 286081 7879 4239 2418 6544 49325 356486Tripura 12853 458 226 122 46 801 14506Uttar Pradesh 365439 14561 2565 2327 983 96504 482379Uttarakhand 27193 1046 582 71 122 2405 31419West Bengal 575628 25398 8000 28454 4532 189325 831337India 6365447 270978 86789 67525 80660 1179420 8050819
Table 4.25 : Number of Establishments under women entrepreneur by Major Source of Finance: 2014
Source: Sixth Economic Census (2014) , Ministry of Statistics & Programme Implementation
98

Male Female Total % Female Owners Male Owners Female Owners Total Owners
(2) (3) (4) (5) (6) (7) (8) (9) (10)
Activities relating to agriculture other than crop production & plantation
557244 52310 611375 9% 1131472 102828 1239717 8%
Livestock 8607401 2546345 11191189 23% 15201517 3679536 18962765 19%
Forestry and Logging 442221 124475 568018 22% 920902 209192 1133376 18%
Fishing and aqua culture 443234 38637 482926 8% 767052 61794 831403 7%
Sub Total: Agricultural Activities 10050100 2761767 12853508 21% 18020943 4053350 22167261 18%
Mining and quarrying 10050100 2761767 12853508 21% 287645 29792 319425 9%
Manufacturing 7345863 2399463 9774315 25% 20377605 3948294 24427323 16%Electricity, gas, steam and air conditioning supply
27715 3323 31230 11% 111064 19317 131797 15%
Water supply, sewerage, waste management and remediation activities
118788 10144 129385 8% 238476 19889 259662 8%
Construction 884478 47025 933616 5% 1914320 97694 2017819 5%
Whole sale trade, retail trade & repair of motor vehicles & motor cycles
900100 30237 932474 3% 2157375 75444 2239864 3%
Whole sale trade( not covered in item-10 above )
807033 48648 858225 6% 1975778 106444 2090942 5%
Retail trade ( not covered in item-10 above )
13619370 1432202 15091913 9% 22781161 2197914 25072276 9%
Transportation and storage 2696511 124707 2828104 4% 3968963 214037 4198057 5%
Accommodation and Food service activities 1974088 223095 2204816 10% 4697298 466884 5188971 9%
Information & communication 252666 19853 273734 7% 765787 58630 829983 7%
Financial and insurance activities 304102 76271 382474 20% 674988 184822 869232 21%
Real estate activities 304102 76271 382474 20% 553935 59697 616058 10%
Professional, scientific & technical activities 439953 30681 472287 6% 1007593 75058 1088270 7%
Administrative and support service activities
587370 45264 634614 7% 1361802 115946 1484513 8%
Education 510166 217474 735402 30% 2490014 738854 3283095 23%Human health & social work activities 594382 75395 673131 11% 1551946 222085 1789320 12%
Arts entertainment, sports & amusement and recreation
139039 18552 158433 12% 332134 41891 376614 11%
Other service activities not else where classified
2390786 432835 2833424 15% 3867516 722140 4610224 16%
Subtotal : Non -Agricultural Activities 34026592 5289052 39437015 13% 71115400 9394832 80893445 12%
Total 44076692 8050819 52290523 15% 89136343 13448182 103060706 13%Source: Sixth Economic Census (2014), Ministry of Statistics & Programme Implementation
Total includes others also.
Table 4.26 : Broad Activity wise distribution of proprietary establishments by sex of the owner: 2014
Broad activity code
Sex of Owner No. of employees under ownership of % employees
under Female owner
99

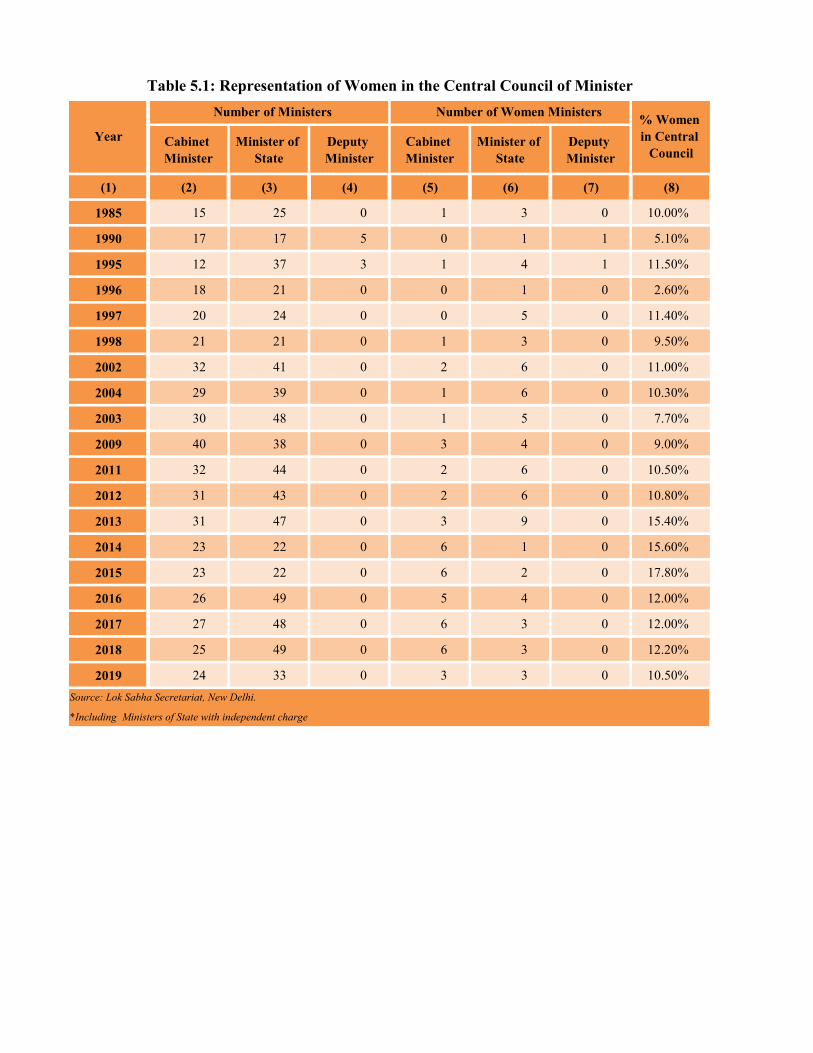
Cabinet Minister
Minister of State
Deputy Minister
Cabinet Minister
Minister of State
Deputy Minister
(1) (2) (3) (4) (5) (6) (7) (8)
1985 15 25 0 1 3 0 10.00%
1990 17 17 5 0 1 1 5.10%
1995 12 37 3 1 4 1 11.50%
1996 18 21 0 0 1 0 2.60%
1997 20 24 0 0 5 0 11.40%
1998 21 21 0 1 3 0 9.50%
2002 32 41 0 2 6 0 11.00%
2004 29 39 0 1 6 0 10.30%
2003 30 48 0 1 5 0 7.70%
2009 40 38 0 3 4 0 9.00%
2011 32 44 0 2 6 0 10.50%
2012 31 43 0 2 6 0 10.80%
2013 31 47 0 3 9 0 15.40%
2014 23 22 0 6 1 0 15.60%
2015 23 22 0 6 2 0 17.80%
2016 26 49 0 5 4 0 12.00%
2017 27 48 0 6 3 0 12.00%
2018 25 49 0 6 3 0 12.20%
2019 24 33 0 3 3 0 10.50%
*Including Ministers of State with independent charge
Table 5.1: Representation of Women in the Central Council of Minister
Year
Number of Ministers Number of Women Ministers % Women in Central
Council
Source: Lok Sabha Secretariat, New Delhi.
100
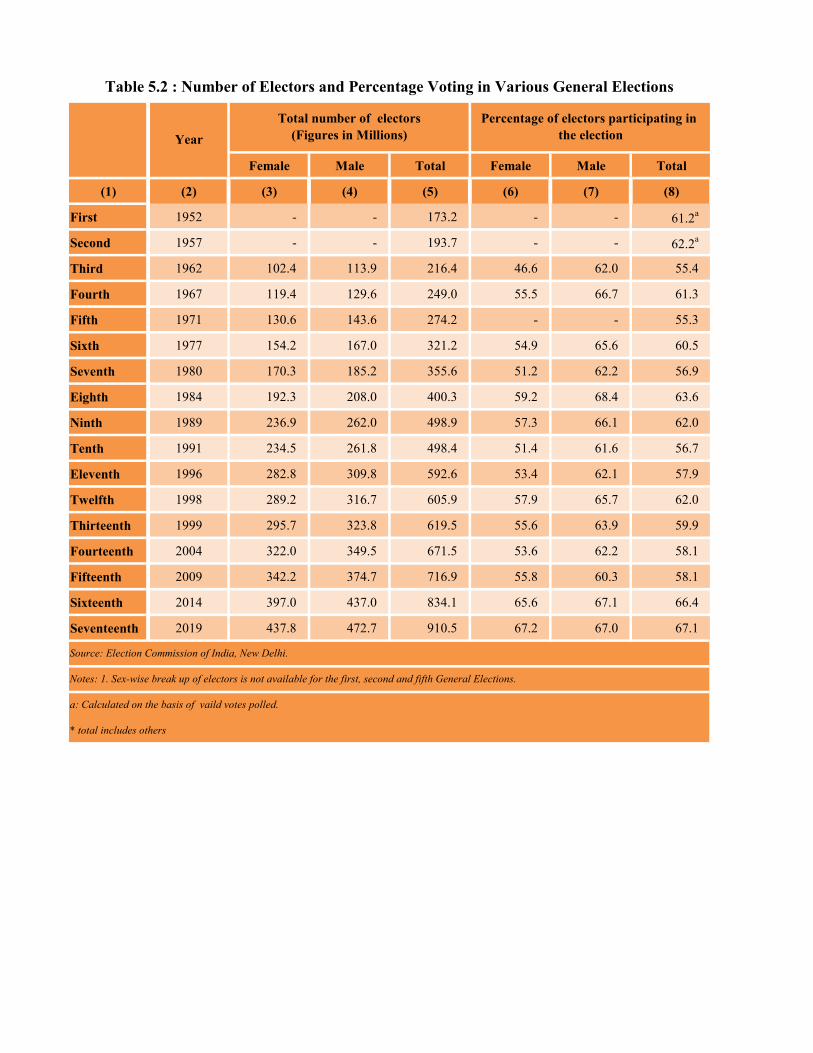
Female Male Total Female Male Total
(1) (2) (3) (4) (5) (6) (7) (8)
First 1952 - - 173.2 - - 61.2a
Second 1957 - - 193.7 - - 62.2a
Third 1962 102.4 113.9 216.4 46.6 62.0 55.4
Fourth 1967 119.4 129.6 249.0 55.5 66.7 61.3
Fifth 1971 130.6 143.6 274.2 - - 55.3
Sixth 1977 154.2 167.0 321.2 54.9 65.6 60.5
Seventh 1980 170.3 185.2 355.6 51.2 62.2 56.9
Eighth 1984 192.3 208.0 400.3 59.2 68.4 63.6
Ninth 1989 236.9 262.0 498.9 57.3 66.1 62.0
Tenth 1991 234.5 261.8 498.4 51.4 61.6 56.7
Eleventh 1996 282.8 309.8 592.6 53.4 62.1 57.9
Twelfth 1998 289.2 316.7 605.9 57.9 65.7 62.0
Thirteenth 1999 295.7 323.8 619.5 55.6 63.9 59.9
Fourteenth 2004 322.0 349.5 671.5 53.6 62.2 58.1
Fifteenth 2009 342.2 374.7 716.9 55.8 60.3 58.1
Sixteenth 2014 397.0 437.0 834.1 65.6 67.1 66.4
Seventeenth 2019 437.8 472.7 910.5 67.2 67.0 67.1
Source: Election Commission of India, New Delhi.
Notes: 1. Sex-wise break up of electors is not available for the first, second and fifth General Elections.
a: Calculated on the basis of vaild votes polled.
* total includes others
Table 5.2 : Number of Electors and Percentage Voting in Various General Elections
YearPercentage of electors participating in
the electionTotal number of electors
(Figures in Millions)
101

(1) (2) (3) (4) (5) (6) (7) (8) (9) (10) (11) (12)
First 1952 April 1952-April 1957 489 1874 3.8
Second 1957 April 1957-March1962 494 1518 3.1 45 27 60.0 1473 467 31.7
Third 1962 Apr 1962- Mar 1967 494 1985 4 70 35 50.0 1915 459 24.0
Fourth 1967 04/03/1967-27/12/1970 520 2369 4.6 67 30 44.8 2302 490 21.3
Fifth 1971 15/03/1971-18/01/1977 520 2784 5.4 86 21 24.4 2698 499 18.5
Sixth 1977 Mar 1977- Aug 1979 542 2439 4.5 70 19 27.1 2369 523 22.1
Seventh 1980 18/01/1980-31/12/1984 542 4620 8.5 142 28 19.7 4478 514 11.5
Eighth 1984 31/12/1984-27/11/1989 542 5574 10.3 164 42 25.6 5406 500 9.2
Ninth 1989 19/12/1989 -9/7/1991 529 6160 11.6 198 27 13.6 5962 502 8.4
Tenth 1991 20/06/1991-10/05/1996 521 8699 16.7 325 37 11.4 8374 484 5.8
Eleventh 1996 15/05/1996-04/12/1997 543 13952 25.7 599 40 6.7 13353 503 3.8
Twelfth 1998 10/03/1998-26/04/1999 543 4750 8.7 274 43 15.7 4476 500 11.2
Thirteenth 1999 10/10/1999-06/02/2004 543 5155 9.5 296 52 17.6 4859 494 10.2
Fourteenth 2004 17/05/2004-18/05/2009 543 5435 10 355 45 12.7 5080 498 9.8
Fifteenth 2009 18/05/2009-18/05/2014 543 8070 14.9 556 59 10.6 7514 484 6.4
Sixteenth 2014 May, 2014 onwards 543 8251 15.2 668 62 9.3 7583 481 6.3
Seventeenth 2019 May, 2019 onwards 542 8026 14.8 724 78 10.8 7296 464 6.4
Elected
Female
Sex-wise break up of candidates are not available
Source: Election Commission of India, New Delhi & Lok Sabha Secretariat
Notes: Total number of contestants include the number of candidates elected unopposed, if any.
Table 5.3: Persons Contesting and Elected in Various Lok Sabha Elections
Lok Sabha
ElectionYear Tenure
Number of seats
available for election
Total number
contesting
Average number of contestant
per seat
Total number
contesting
% winning
Total number
contesting Elected %
winning
Male
102

State/UT's Women Electors
Women Voters
% Women Turnout
Total Electors
Total Voters
% Total Turnout
(1) (2) (3) (4) (5) (6) (7)Andaman & Nicobar Islands 149 98 65.47% 318 207 65.12%Andhra Pradesh 19,881 15,818 79.56% 39406 31675 80.38%Arunachal Pradesh 404 326 80.78% 804 660 82.11%Assam 10,757 8,748 81.33% 22050 17993 81.60%Bihar 33,533 19,980 59.58% 71216 40830 57.33%Chandigarh 305 216 70.79% 647 457 70.61%Chhattisgarh 9,482 6,689 70.55% 19016 13623 71.64%Dadra & Nagar Haveli 118 95 81.17% 250 199 79.58%Daman & Diu 61 46 75.47% 122 87 71.85%Delhi 6,444 3,876 60.14% 14328 8682 60.60%Goa 580 442 76.16% 1136 854 75.14%Gujarat 21,697 13,214 60.90% 45152 29128 64.51%Haryana 8,340 5,800 69.55% 18057 12701 70.34%Himachal Pradesh 2,606 1,936 74.31% 5330 3860 72.42%Jammu & Kashmir 3,777 1,650 43.67% 7923 3563 44.97%Jharkhand 10,667 7,281 68.26% 22405 14967 66.80%Karnataka 25,249 17,080 67.65% 51095 35159 68.81%Kerala 13,469 10,611 78.78% 26205 20397 77.84%Lakshadweep 27 24 86.78% 55 47 85.21%Madhya Pradesh 24,837 17,055 68.67% 51867 36928 71.20%Maharashtra 42,249 24,853 58.82% 88677 54111 61.02%Manipur 996 838 84.13% 1960 1620 82.69%Meghalaya 965 714 73.93% 1915 1368 71.43%Mizoram 404 252 62.40% 792 500 63.14%Nagaland 599 495 82.69% 1214 1007 83.00%Odisha 15,835 11,750 74.20% 32498 23817 73.29%Puducherry 514 419 81.52% 973 791 81.25%Punjab 9,832 6,452 65.62% 20893 13777 65.94%Rajasthan 23,395 15,335 65.55% 48956 32476 66.34%Sikkim 212 167 78.60% 434 353 81.41%Tamil Nadu 29,542 21,362 72.31% 58503 42392 72.46%Telangana 14,776 9,245 62.57% 29709 18647 62.77%Tripura 1,286 1,054 81.97% 2615 2155 82.40%Uttar Pradesh 67,056 39,941 59.56% 146135 86532 59.21%Uttarakhand 3,713 2,391 64.39% 7856 4861 61.88%West Bengal 34,049 27,850 81.79% 70001 57230 81.76%All India 437,807 294,103 67.18% 910512 613656 67.40%
Table 5.4 : State-wise Women Voters Turnout for General Election - 2019
(Figures for electors & voters in thousands)
Source: Election Commission of India - General Elections, 2019 (17 th Lok Sabha).
103

Women Total % Women(1) (2) (3) (4) (5) (6) (7)
Andaman & Nicobar Islands 0 1 0% 0 0Andhra Pradesh 4 25 16% 4 18 22%Arunachal Pradesh 0 1 0% 0 0Assam 1 14 7% 1 9 11%Bihar 3 40 8% 2 17 12%Chandigarh 1 1 100% 0 0Chhattisgarh 3 11 27% 3 10 30%Dadar & Nagar Haveli 0 1 0% 0 0Daman & Diu 0 1 0% 0 0Delhi 1 7 14% 0 2 0%Goa 0 2 0% 0 0Gujarat 6 26 23% 2 10 20%Haryana 1 10 10% 1 4 25%Himachal Pradesh 0 4 0% 0 2 0%Jammu & Kashmir 0 6 0% 0 3 0%Jharkhand 2 14 14% 2 5 40%Karnataka 2 28 7% 1 11 9%Kerala 1 20 5% 1 10 10%Lakshadweep 0 1 0% 0 0Madhya Pradesh 4 29 14% 2 16 13%Maharashtra 8 48 17% 2 19 11%Manipur 0 2 0% 0 2 0%Meghalaya 1 2 50% 0 0Mizoram 0 1 0% 0 1 0%Nagaland 0 1 0% 0 0Odisha 7 21 33% 6 16 38%Pudducherry 0 1 0% 0 1 0%Punjab 2 13 15% 0 5 0%Rajasthan 3 25 12% 2 8 25%Sikkim 0 1 0% 0 1 0%Tamil Nadu 3 39 8% 3 27 11%Telangana 1 17 6% 1 12 8%Tripura 1 2 50% 1 2 50%Uttar Pradesh 11 80 14% 5 31 16%Uttarakhand 1 5 20% 0 2 0%West Bengal 11 42 26% 6 22 27%All India 78 542 14% 45 266 17%Source: Lok Sabha Secretariat
As on 3rd January, 2020
Table 5.5 : State-wise Women participation in 17th Lok Sabha
Name of the State/UTs Women MPs Total Seats % Women
First Time Elected
104

(1) (2) (3) (4) (5) (6) (7) (8)Andhra Pradesh 1955 14 2019 161 14 8% 175Arunachal Pradesh 1978 8 2019 57 3 5% 60Assam 1937/1951 14 2016 118 8 6% 126Bihar 1937/1951 15 2015 209 34 14% 243Chhattisgarh 2000/2003 4 2018 77 13 14% 90Delhi 1992/1993 5 2015 64 6 9% 70Goa 1987/1967 6 2017 38 2 5% 40Gujarat 1960/1962 12 2017 160 22 12% 182Haryana 1966/1967 12 2019 81 9 10% 90Himachal Pradesh 1971/1951 12 2017 65 3 4% 68Jammu and Kashmir 1934/1962 9 2014 85 2 2% 87Jharkhand 2000/2005 3 2019 71 10 12% 81Karnataka 1956/1957 13 2018 216 7 3% 223Kerala 1957 15 2016 132 8 6% 140Madhya Pradesh 1957 14 2018 209 21 9% 230Maharashtra 1960/1962 11 2019 264 24 8% 288Manipur 1972/1967 11 2017 58 2 3% 60Meghalaya 1972 10 2018 56 3 5% 59Mizoram 1987/1972 11 2018 40 14 0% 40Nagaland 1963/1964 13 2018 59 0 0% 59Odisha 1937 15 2019 133 13 9% 146Punjab 1937 14 2017 111 6 5% 117Puducherry 1963 13 2016 30 14 0% 30Rajasthan 1956 14 2018 176 24 12% 200Sikkim 1975 8 2019 29 3 9% 32Tamil Nadu 1937 12 2016 218 16 7% 234Telangana 2014 1 2018 113 6 5% 119Tripura 1972 11 2018 57 3 5% 60Uttar Pradesh 1937 16 2017 361 42 10% 403Uttarakhand 2000 3 2017 66 4 6% 70West Bengal 1937 16 2016 255 39 13% 294Total 3759 476 11% 4235Source: Election Commission of India
Table 5.6 : State-wise participation of women in State Assemblies
State
Assembly
Year of Constitution of
the State/Assembly
Year of Assembly
electionMale Female % Women Total Term
105
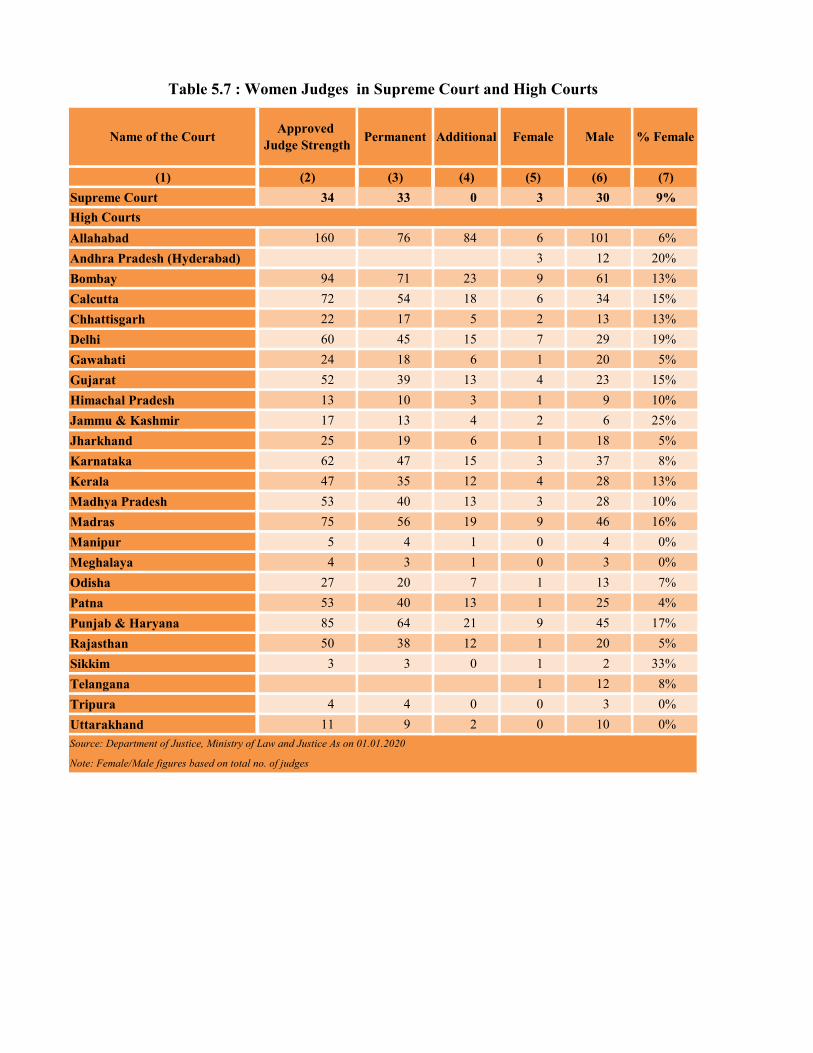
Name of the Court Approved Judge Strength Permanent Additional Female Male % Female
(1) (2) (3) (4) (5) (6) (7)Supreme Court 34 33 0 3 30 9%
Allahabad 160 76 84 6 101 6%Andhra Pradesh (Hyderabad) 3 12 20%Bombay 94 71 23 9 61 13%Calcutta 72 54 18 6 34 15%Chhattisgarh 22 17 5 2 13 13%Delhi 60 45 15 7 29 19%Gawahati 24 18 6 1 20 5%Gujarat 52 39 13 4 23 15%Himachal Pradesh 13 10 3 1 9 10%Jammu & Kashmir 17 13 4 2 6 25%Jharkhand 25 19 6 1 18 5%Karnataka 62 47 15 3 37 8%Kerala 47 35 12 4 28 13%Madhya Pradesh 53 40 13 3 28 10%Madras 75 56 19 9 46 16%Manipur 5 4 1 0 4 0%Meghalaya 4 3 1 0 3 0%Odisha 27 20 7 1 13 7%Patna 53 40 13 1 25 4%Punjab & Haryana 85 64 21 9 45 17%Rajasthan 50 38 12 1 20 5%Sikkim 3 3 0 1 2 33%Telangana 1 12 8%Tripura 4 4 0 0 3 0%Uttarakhand 11 9 2 0 10 0%
Table 5.7 : Women Judges in Supreme Court and High Courts
High Courts
Source: Department of Justice, Ministry of Law and Justice As on 01.01.2020
Note: Female/Male figures based on total no. of judges
106

District Level
Intermediate Level
Village Level Total Total
Women Women (%)
(1) (2) (3) (4) (5) (6) (7)
Andaman and Nicobar Islands 3 9 70 858 302 35.20
Andhra Pradesh 13 660 12918 156050 78025 50.00Arunachal Pradesh 22 177 1785 9383 3658 38.99Assam 26 191 2201 26820 13410 50.00Bihar 38 534 8386 127391 57887 45.44Chandigarh 1 1 1 169 58 34.32Chhattisgarh 27 146 10978 170285 93287 54.78Dadar Nagar Haveli 1 N.A 20 136 47 34.56Daman & Diu 2 N.A 15 172 92 53.49Goa 2 N.A 191 1564 516 32.99Gujarat 33 248 14292 144016 71988 49.99Haryana 21 126 6197 70035 29499 42.12Himachal Pradesh 12 78 3226 28723 14398 50.13Jammu and Kashmir 22 306 4482 33847 11169 33.00Jharkhand 24 263 4370 60782 30757 50.60Karnataka 30 176 6021 104967 50892 48.48Kerala 14 152 941 18372 9630 52.42Lakshadweep 1 N.A 10 110 41 37.27Madhya Pradesh 51 313 22817 392981 196490 50.00Maharashtra 34 351 27870 240122 121490 50.60Manipur 6 N.A 161 1723 868 50.38Odisha 30 314 6798 3502 828 23.64Puducherry N.A 10 98 NA NA -Punjab 22 147 13279 97180 32393 33.33Rajasthan 33 295 9892 124854 70527 56.49Sikkim 4 N.A 185 1096 548 50.00Tamil Nadu 31 385 12523 117599 39975 33.99Telangana 9 438 13057 103468 51735 50.00Tripura 8 35 591 6646 3006 45.23Uttar Pradesh 75 822 58791 826458 272733 33.00Uttarakhand 13 95 7762 64606 35957 55.66West Bengal 22 342 3340 59402 30157 50.77Total 630 6614 253268 3100804 1375914 44.37
Table 5.8: Status of representation of women in Panchayati Raj Institutions (PRIs)
States/UTsNo of Panchayats* Elected Representatives#
Source: Ministry of Panchayati Raj * as on 27.03.2018
107

State/UT 2015-16 2016-17 2017-18(1) (2) (3) (4)
Andhra Pradesh 158 154 122Assam 183 208 214Bihar 172 234 0Chhattisgarh 159 169 0Goa 138 141 86Gujarat 169 174 86Haryana 166 166 73Himachal Pradesh 152 170 0Jammu and Kashmir 143 91 0Jharkhand 147 143 0Karnataka 155 164 71Kerala 141 175 0Madhya Pradesh 172 165 82Maharashtra 174 174 90Meghalaya 154 167 0Nagaland - 273 0Odisha 125 135 158Punjab 166 176 101Rajasthan 166 174 61Tamil Nadu 154 157 105Telangana 169 171 113Uttar Pradesh 157 171 84Uttarakhand 156 165 0West Bengal 194 196 70Chandigarh 172 191 667Dadra & Nagar Haveli 154 177 222Daman and Diu 145 172 0Delhi 181 185 125Puducherry 278 318 600All India (Total) 173 177 90
Table 5.9: State/UT wise Proportion of Women in Managerial Position per 1000 Person Engaged In Managerial Position In Listed Companies
Source: SEBI
Note: A total of 6063 Listed Companies have filed MGT-7 for the F.Y. 2015-16 which had a total of 44841 KMPs, of these in case of 7261 KMPs Gender field was not filed and hence a the proportion is based on the remaining 37580 KMPs.
108

Police Deptt./Organization Total Police Strength (Actual)
Female Police Strength (Actual)
Percentage of Female Police Officers
(1) (2) (3) (4) Civil Police 1303724 149624 11.48District Armed Reserve Police 265656 19583 7.37State Armed Police 497890 16489 3.31
Assam Rifles 61976 859 1.39Border Security Force 242440 5231 2.16Central Industrial Security Force 143216 8592 6.00Central Reserve Police Force 301830 8268 2.74Indo-Tibetan Police Force 82861 1951 2.35National Disaster Response Force # 11173 86 0.77National Security Guard * 10358 33 0.32Railway Protection Force 64945 2344 3.61Sashastra Seema Bal 81119 2168 2.67Total 3067188 215228 7.02
# NDRF is a 100% Deputation Force
Table 5.10: Strength of Female Police Officers in India
(as on 01.01.2019)
Central Armed Police Force
Source: Data on Police Oganizations, Bureau of Police Research and Development (BPRD)
* NSG is a 100% Deputation Force
109


Crime Head 2015 2016 2017 2018 % Share in 2015
% Share in 2016
% Share in 2017
% Share in 2018
(1) (2) (3) (4) (5) (6) (7) (8) (9)
Rape (Sec. 376 IPC) 34651 38947 32559 33356 11% 11% 9% 9%
Kidnapping & Abduction (Sec.363 to 373 IPC) 59277 64519 66333 72751 18% 19% 18% 19%
Cruelty by Husband and Relatives (Sec.498-A IPC) 113403 110378 104551 103272 35% 33% 29% 27%
Assault on women with intent to outrage her modesty (Sec.354 IPC) 82422 84746 86001 89097 25% 25% 24% 24%
Insult to the modesty of women (Sec.509 IPC) 8685 7305 7451 6992 3% 2% 2% 2%
Dowry Prohibition Act, 1961 9894 9683 10189 12826 3% 3% 3% 3%
Others 2931 23376 52765 59983 6% 7% 15% 16%
Total Crime Against Women 327394 338954 359849 378277 100% 100% 100% 100%
*Total Cognizable Crimes Under IPC + SLL 4710676 4831515 5007044 5074634
% Crime Against Women to Total Crime 7% 7% 7% 7%
Table 6.1 : Year-wise Status of Major Crimes Committed Against Women
Source: Crime in India 2018, National Crime Records Bureau, Ministry of Home Affairs.
IPC : Indian Penal Code & SLL : Special and Local Laws
* Total includes crime head other than list also, therefore total varies.
110

Crime Head Cases Reported during the year
Total Cases for investigation @
Cases in which charge-sheets
were submitted
Total cases Disposed off
by police
% Disposed of total cases for Investigation
(1) (2) (3) (4) (5) (6)
Rape 33356 47139 21415 33382 71%
Attempt to commit Rape 4097 5821 2345 4050 70%
Kidnapping & Abduction of Women
72751 119127 20172 69884 59%
Dowry Deaths 7166 10637 4603 7362 69%
Assault on Women with intent to outrage her Modesty
89097 121258 57617 87809 72%
Insult to the Modesty of Women
6992 11781 4185 7082 60%
Cruelty by Husband or his Relatives 103272 150571 58954 100841 67%
Abetment of Suicides of Women
5037 7771 3040 4887 63%
Dowry Prohibition Act, 1961
12826 19456 6531 12030 62%
Indecent Representation of Women (Prohibition) Act, 1986
22 46 7 18 39%
Protection of Women from Domestic Violence Act, 2005
579 756 429 488 65%
Immoral Traffic (Prevention) Act (Women Cases only)
1459 2683 878 1328 49%
Total Crimes against Women # 378277 554936 208239 368118 66%
6.2 : Disposal of Crime Committed Against Women Cases by Police During 2018
Source: Crime in India 2018, National Crime Records Bureau, Ministry of Home Affairs.
@ Pending Cases of last years are included
111

(1) (2) (3) (4) (5) (6) Rape 28469 156327 4708 11133 3.00%Attempt to Commit Rape 3116 14193 266 726 1.90% Kidnapping & Abduction of Women
28529 168701 3077 8255 1.80%
Dowry Deaths 6652 48026 1459 1985 3.00% Assault on Women with Intent to Outrage her Modesty
75101 384434 9352 24253 2.40%
Insult to the Modesty of Women 6108 37966 515 2336 1.40% Cruelty by Husband or his Relatives
82837 589389 4982 31691 0.80%
Abetment of Suicides of Women 4491 19219 407 2067 2.10% Dowry Prohibition Act, 1961 9598 46547 788 2374 1.70% Indecent Representation of Women (Prohibition) Act, 1986
10 595 10 28 1.70%
Protection of Women from Domestic Violence Act, 2005
471 1784 73 49 4.10%
Immoral Traffic (Prevention) Act (Women Cases only)
1279 9136 299 549 3.30%
Total Crimes against Women # 282978 1598471 31975 92608 2.00%Source: Crime in India 2018, National Crime Records Bureau, Ministry of Home Affairs.
6.3 : Disposal of Crimes Committed Against Women Cases by Courts During 2018
Crime Head Cases Sent for
Trial during the Year
Total no. Of Cases for Trial
Cases Convicted
Cases Acquitted
% cases convicted of total no. of
cases for trial
112

RapeKidnapping
& Abduction
Dowry deaths
Cruelty by husband & Relatives
Assault with intent to outrage
her modesty
Insult to modesty
Dowry Prohibition
Act
Total crimes against women
Total crimes against women
Total cognizable
crimes
(1) (2) (3) (4) (5) (6) (7) (8) (9) (10) (11) (12) (13)
A&N Islands 16.1 1.1 0.0 2.2 18.8 2.2 0.0 41.1 147 3699 0.04% 3.97%
Andhra Pradesh 3.7 2.7 0.5 26.3 17.1 6.9 1.2 59.9 16438 144703 4.35% 11.36%
Arunachal Pradesh 9.3 12.0 0.0 8.3 14.2 1.7 0.0 47.6 368 2817 0.10% 13.06%
Assam 9.9 38.3 1.0 66.7 25.0 1.0 6.8 146.9 27728 120572 7.33% 23.00%
Bihar 1.1 14.0 2.0 4.5 0.5 0.1 3.7 22.4 16920 262815 4.47% 6.44%
Chandigarh 16.1 26.0 1.1 17.4 18.7 0.6 0.2 83.0 442 5967 0.12% 7.41%
Chhattisgarh 14.7 13.0 0.6 3.5 13.1 1.3 0.1 47.4 8587 98233 2.27% 8.74%
Dadra & Nagar Haveli 3.2 0.0 0.0 0.5 2.8 0.9 0.0 7.7 38 315 0.01% 12.06%
Daman & Diu 2.4 0.0 0.0 3.2 4.0 0.8 0.0 10.0 16 334 0.00% 4.79%
Delhi 13.3 40.7 1.7 37.4 29.7 6.1 0.2 130.1 13640 262612 3.61% 5.19%
Goa 8.0 10.3 0.0 1.2 16.5 3.4 0.0 46.2 362 3884 0.10% 9.32%
Gujarat 1.7 3.2 0.0 9.1 3.8 0.0 0.0 19.2 8329 393194 2.20% 2.12%
Haryana 9.7 25.6 1.6 31.2 20.0 1.4 0.1 92.9 14326 191229 3.79% 7.49%
Himachal Pradesh 9.6 9.5 0.1 5.1 14.3 2.2 0.0 43.5 1633 19594 0.43% 8.33%
Jammu & Kashmir 5.0 16.7 0.1 5.1 25.1 0.4 0.0 53.4 3437 27276 0.91% 12.60%
Jharkhand 6.0 5.6 1.4 5.7 7.6 0.2 6.8 28.5 7083 55664 1.87% 12.72%
Karnataka 1.5 3.8 0.6 6.4 16.1 0.4 4.9 30.2 13514 163416 3.57% 8.27%
Kerala 10.7 1.0 0.1 11.2 25.0 2.5 0.0 51.3 10461 512167 2.77% 2.04%
Lakshadweep 6.1 0.0 0.0 3.0 0.0 3.0 0.0 13.3 11 77 0.00% 14.29%
Madhya Pradesh 13.8 15.6 1.4 10.6 22.3 0.7 0.2 66.3 28942 405129 7.65% 7.14%
Maharashtra 3.7 11.7 0.3 11.8 18.6 1.8 0.1 49.8 35497 515674 9.38% 6.88%
Manipur 3.4 5.5 0.0 0.9 3.7 0.5 0.0 14.8 271 3781 0.07% 7.17%
Meghalaya 5.5 3.6 0.1 1.1 6.0 1.0 0.0 18.9 571 3482 0.15% 16.40%
Mizoram 8.5 0.2 0.0 1.0 11.4 0.2 0.0 21.4 249 2351 0.07% 10.59%
Nagaland 1.0 3.4 0.0 0.3 1.0 0.5 0.0 6.2 75 1775 0.02% 4.23%
Odisha 4.1 11.8 1.7 8.9 44.9 2.3 7.2 74.6 20274 107408 5.36% 18.88%
Puducherry 0.0 1.8 0.0 1.0 7.8 1.2 0.7 13.1 166 4674 0.04% 3.55%
Punjab 5.9 9.0 0.5 10.4 6.8 0.1 0.0 34.7 5302 70318 1.40% 7.54%
Rajasthan 11.7 11.4 1.1 33.0 14.1 0.1 0.0 73.6 27866 250546 7.37% 11.12%
Sikkim 5.1 2.3 0.3 0.3 7.4 1.6 0.0 17.7 172 869 0.05% 19.79%
Tamil Nadu 0.9 2.4 0.1 2.1 2.2 0.0 0.5 8.4 5822 499188 1.54% 1.17%
Telangana 3.3 6.1 1.0 34.2 24.8 4.8 0.1 77.3 16027 126858 4.24% 12.63%
Tripura 5.0 7.1 0.9 15.6 8.5 0.3 0.0 39.7 907 6078 0.24% 14.92%
Uttar Pradesh 3.7 14.4 2.3 13.3 11.8 0.0 4.1 46.5 59445 585157 15.71% 10.16%
Uttarakhand 10.4 9.3 1.2 11.5 10.2 0.1 1.9 43.5 2817 34715 0.74% 8.11%
West Bengal 2.3 9.0 0.9 35.9 7.2 0.8 0.0 59.4 30394 188063 8.03% 16.16%
ALL INDIA 5.2 11.3 1.1 16.1 13.8 1.1 2.0 50.3 378277 5070935 100.00% 3.97%
Source: Crime in India 2018, National Crime Records Bureau, Ministry of Home Affairs.
6.4 : State-wise Rate (per Lakh Women) of Incidence of Various Crimes Committed against Women during 2018
State/ Union Terriorty
Rates of Crimes Incidence of Crimes% of Crime
against women to
Total Crime within State
% of All India Crime
against Women
113

State/Union TerritoryBelow 6
years 6-12 years 12-16 years
16-18 years
18-30 years
30-45 years
45-60 years
Above 60 years Total
% to All India
Victims(1) (2) (3) (4) (5) (6) (7) (8) (9) (10) (11)
Andaman & Nicobar Islands 0 1 3 10 12 3 1 0 30 0.00%Andhra Pradesh 16 57 181 251 373 76 14 5 973 3.00%Arunachal Pradesh 4 4 13 11 29 9 0 0 70 0.00%Assam 7 24 6 52 1043 523 107 5 1767 5.00%Bihar 0 0 1 3 520 111 16 0 651 2.00%Chandigarh 7 13 16 17 14 12 7 0 86 0.00%Chhattisgarh 41 80 557 541 644 190 42 6 2101 6.00%Dadra & Nagar Haveli 0 0 0 0 6 1 0 0 7 0.00%Daman & Diu 0 0 1 0 2 0 0 0 3 0.00%Delhi 0 0 0 0 851 345 19 2 1217 4.00%Goa 0 1 21 12 13 11 2 1 61 0.00%Gujarat 0 0 3 4 389 144 12 1 553 2.00%Haryana 2 0 0 0 969 300 22 3 1296 4.00%Himachal Pradesh 2 25 85 84 101 45 6 1 349 1.00%Jammu & Kashmir 0 6 18 18 172 109 5 0 328 1.00%Jharkhand 0 0 6 63 798 217 14 0 1098 3.00%Karnataka 0 0 2 2 369 120 3 1 497 1.00%Kerala 48 129 334 645 465 294 43 14 1972 6.00%Lakshadweep 0 0 0 0 0 2 0 0 2 0.00%Madhya Pradesh 54 142 1143 1502 1798 725 75 11 5450 16.00%Maharashtra 0 0 0 0 1524 552 62 11 2149 6.00%Manipur 0 1 7 9 27 7 1 0 52 0.00%Meghalaya* 0 4 6 15 49 14 1 0 89 0.00%Mizoram 2 12 8 1 20 5 1 1 50 0.00%Nagaland 0 0 1 2 5 1 1 1 11 0.00%Odisha 0 0 10 27 835 47 4 0 923 3.00%Puducherry 0 0 0 0 0 0 0 0 0 0.00%Punjab 10 30 151 139 381 108 15 3 837 2.00%Rajasthan 17 48 392 575 2263 912 129 1 4337 13.00%Sikkim 0 0 0 4 5 4 3 0 16 0.00%Tamil Nadu 1 1 1 3 256 63 6 1 332 1.00%Telangana 0 0 0 0 465 123 17 1 606 2.00%Tripura 0 0 0 0 73 21 3 0 97 0.00%Uttar Pradesh 67 174 570 600 2235 603 70 3 4322 13.00%Uttarakhand 3 5 79 186 194 101 8 0 576 2.00%West Bengal 0 0 1 3 736 310 18 1 1069 3.00%All India 281 757 3616 4779 17636 6108 727 73 33977 100%% to All Age 1% 2% 11% 14% 52% 18% 2% 0% 100%
6.5 : State-wise and Age-wise Distribution of Rape Victims (by age-group) during 2018
Source: Crime in India 2018, National Crime Records Bureau, Ministry of Home Affairs
114

State/UT 2015-16(1) (2)
Andhra Pradesh 43.0Assam 24.4Bihar 42.7Chhattisgarh 36.5Gujarat 20.0Haryana 31.9Jharkhand 34.0Karnataka 21.6Kerala 14.0Madhya Pradesh 32.8Maharashtra 21.2Odisha 34.9Punjab 20.1Rajasthan 24.8Tamil Nadu 40.7Telangana 42.9Uttar Pradesh 36.4West Bengal 32.6Arunachal Pradesh 30.8Delhi 26.8Goa 12.3Himachal Pradesh 5.5Jammu & Kashmir 9.3Manipur 52.6Meghalaya 27.9Mizoram 15.2Nagaland 12.8Sikkim 2.2Tripura 27.7Uttarakhand 12.6Andaman & Nicobar Islands 17.9Chandigarh 22.5Dadra & Nagar Haveli 31.3Daman & Diu 26.6Lakshadweep 8.9Puducherry 34.6All India (Total) 30.9
6.6 : Percentage of Ever Married Women Age 15-49 Years Who Have Ever Experienced Physical or Sexual Violence committed by their Husband
(in percentage)
Source: NFHS, MoHFW
115

Year Female Male Total(1) (2) (3) (4) 2004 8.1 12.8 10.52005 7.9 12.7 10.32006 7.9 12.7 10.52007 8.0 13.1 10.82008 7.6 13.5 10.82009 8.2 13.6 10.92010 8.3 14.3 11.42011 8.1 14.1 11.22012 8.0 14.1 11.22013 7.5 14.2 11.02014 7.1 13.8 10.62015 6.9 14.0 10.62016 10.32017 9.92018 10.2
6.7 : Year-wise Sex-wise Incidence of Suicides per One Lakh Population
Source: Accidental Deaths and Suicides in India, National Crime Records Bureau, Ministry of Home Affairs.
116

Female Male Total Female Male Total(1) (2) (3) (4) (5) (6) (7)
House wife 22937 - 22937 54% 0% 17%Professionals/Salaried Persons: 1412 10562 11975 3% 11% 9% (i) Government 276 1431 1707 1% 2% 1% (ii) Private 895 7350 8246 2% 8% 6% (iii) Public Sector Undertaking 241 1781 2022 1% 2% 2%Student 4790 5369 10159 11% 6% 8%Unemployed 2248 10687 12936 5% 12% 10%Self-employed: 1795 21703 23498 4% 24% 17% (i) Business activity 502 7488 7990 1% 8% 6% (ii) Others 472 4687 5159 2% 10% 8% (iii) Farming/Agriculture Activity 821 9528 10349 1% 5% 4%Retired Person 139 975 1114 0% 1% 1%Daily Wage Earner 3535 26589 30127 8% 29% 22%Others 5535 16229 21770 13% 18% 16%Total 42391 92114 134516 100% 100% 100%
Female Male Total Female Male TotalUn-Married 10512 19987 30503 24.80% 21.70% 22.70%Married 27742 64791 92533 65.40% 70.30% 68.80%Widowed/Widower 1072 1257 2329 2.50% 1.40% 1.70%Divorcee 423 520 943 1.00% 0.60% 0.70%Separated 288 559 849 0.70% 0.60% 0.60%Others 884 1792 2680 2.10% 1.90% 2.00%Status not Known 1470 3208 4679 3.50% 3.50% 3.50%Total 42391 92114 134516 100% 100% 100%
Female Male Total Female Male TotalNo Education 5963 11060 17026 14.10% 12.00% 12.70%Primary 7380 15666 23048 17.40% 17.00% 17.10%Middle 7680 18568 26252 18.10% 20.20% 19.50%Matriculate/ Secondary 9366 22390 31757 22.10% 24.30% 23.60%Higher Secondary/ Intermediate/ Pre-University
7641 14434 22076 18.00% 15.70% 16.40%
Diploma/Certificate/ITI 326 1151 1477 0.80% 1.20% 1.10%Graduate and above 1307 3130 4437 3.10% 3.40% 3.30%Professionals (MBA etc.) 150 280 430 0.40% 0.30% 0.30%Status Not Known 2578 5435 8013 6.10% 5.90% 6.00%Total 42391 92114 134516 100% 100% 100%
Educational Level No. of Suicides % of Suicides
Total includes transgender also.
Source: Accidental Deaths & Suicides in India, National Crime Records Bureau, Ministry of Home Affairs.
6.8 : Percentage distribution of Sex-wise Profile of Suicide Victims by various Parameters during 2018
Profession No. of Suicides % of Suicides
Marital Status No. of Suicides % of Suicides
117

State/UT 2015-16(1) (2)
Andhra Pradesh 32.9Arunachal Pradesh 23.5Assam 30.8Bihar 42.4Chhattisgarh 21.3Goa 9.8Gujarat 24.9Haryana 19.4Himachal Pradesh 8.6Jammu & Kashmir 8.7Jharkhand 38.0Karnataka 21.4Kerala 7.6Madhya Pradesh 32.4Maharashtra 26.3Manipur 13.7Meghalaya 16.9Mizoram 10.8Nagaland 13.3Odisha 21.3Punjab 7.6Rajasthan 35.4Sikkim 14.9Tamil Nadu 16.2Telangana 26.4Tripura 33.1Uttar Pradesh 21.1Uttarakhand 13.8West Bengal 41.6A&N Islands 16.4Chandigarh 12.7D&N Haveli 27.5Daman & Diu 25.4Delhi 14.3Lakshadweep 1.9Puducherry 9.7All India (Total) 26.8
6.9 : Percentage of women aged 20-24 years who were married by exact age 18 years
(in percent)
Source: NFHS, MoHFW
118
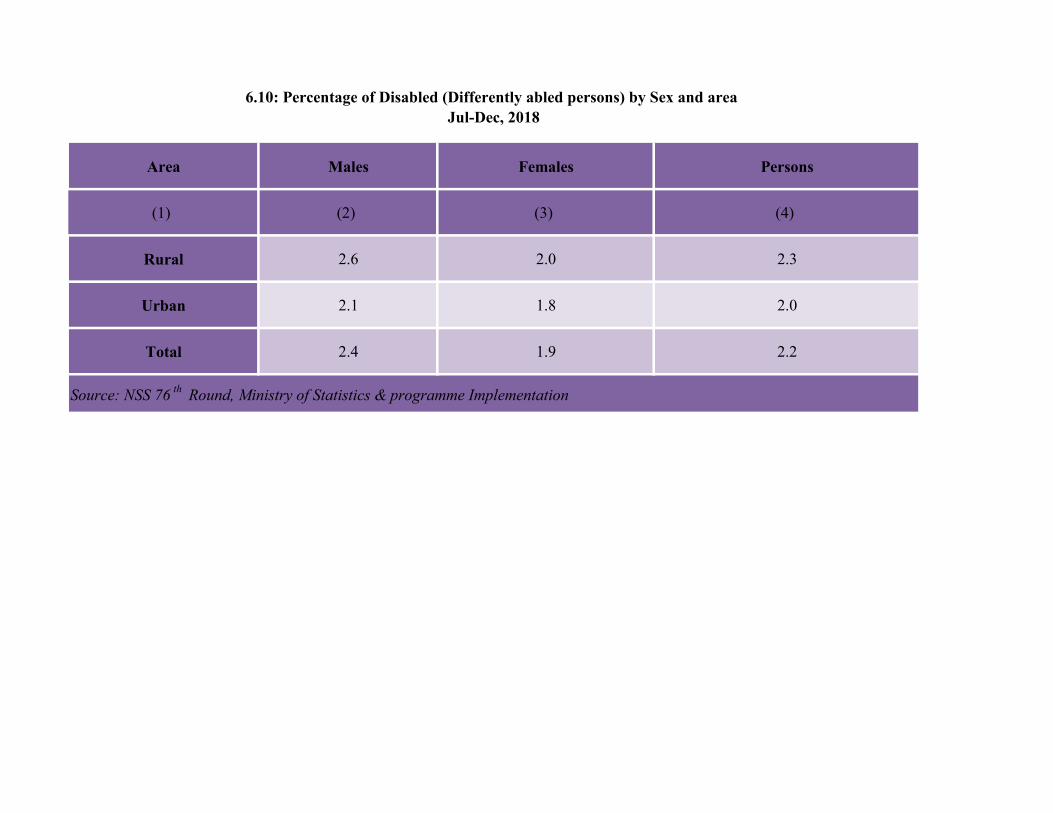
Area Males Females Persons
(1) (2) (3) (4)
Rural 2.6 2.0 2.3
Urban 2.1 1.8 2.0
Total 2.4 1.9 2.2
6.10: Percentage of Disabled (Differently abled persons) by Sex and area Jul-Dec, 2018
Source: NSS 76 th Round, Ministry of Statistics & programme Implementation
119

Area Sex
(1) (2) (3) (4) (5) (6) (7) (8) (9) (10)
Male 0.3 0.3 0.3 1.6 0.2 0.2 0.1 2.6
Female 0.3 0.3 0.2 1.2 0.1 0.1 0.0 2.0
Persons 0.3 0.3 0.2 1.4 0.2 0.1 0.0 2.3
Male 0.2 0.2 0.2 1.3 0.2 0.1 0.1 2.1
Female 0.2 0.2 0.2 1.2 0.1 0.1 0.1 1.8
Persons 0.2 0.2 0.2 1.3 0.2 0.1 0.1 2.0
Male 0.2 0.3 0.3 1.5 0.2 0.1 0.1 2.4
Female 0.2 0.3 0.2 1.2 0.1 0.1 0.0 1.9
Persons 0.2 0.3 0.2 1.4 0.2 0.1 0.1 2.2
Rural
Urban
Total
Source: NSS 76 th Round, Ministry of Statistics &Programme Implementation
6.11: Percentage of persons with broad type of disabilities–Jul.- Dec. 2018
Type of DisabilityVisual
Disability HearingSpeech and
language disability
Locomotor Disability
Mental Retardation/ Intellectual Disability
Mental Illness
Other Type of Disability
Any disability
120

State/ Union Territory Male Female Persons(1) (2) (3) (4)
Andaman & Nicobar Islands 1.8 1.2 1.5Andhra Pradesh 3.1 2.8 3.0Arunachal Pradesh 1.9 1.8 1.8Assam 1.9 1.7 1.8Bihar 1.9 1.3 1.7Chandigarh 1.1 1.0 1.1Chhattisgarh 2.6 1.8 2.2Dadra & Nagar Haveli 1.1 1.0 1.1Daman & Diu 1.2 0.7 1.0Delhi 1.4 1.1 1.3Goa 1.4 1.3 1.3Gujarat 1.7 1.3 1.5Haryana 2.7 2.7 2.7Himachal Pradesh 2.5 1.9 2.2Jammu & Kashmir 1.6 1.4 1.5Jharkhand 2.6 1.8 2.2Karnataka 2.6 2.2 2.4Kerala 3.4 2.9 3.2Lakshadweep 2.3 1.7 2.0Madhya Pradesh 2.4 1.8 2.1Maharashtra 2.5 2.0 2.2Manipur 0.9 0.7 0.8Meghalaya 1.0 0.9 1.0Mizoram 1.2 1.0 1.1Nagaland 1.0 1.1 1.0Odisha 3.5 3.0 3.2Puducherry 2.8 2.5 2.6Punjab 2.6 2.8 2.7Rajasthan 2.6 1.9 2.2Sikkim 2.4 2.1 2.2Tamil Nadu 2.0 1.9 1.9Telangana 2.3 1.8 2.0Tripura 1.3 1.1 1.2Uttar Pradesh 2.7 2.0 2.4Uttarakhand 1.7 1.5 1.6West Bengal 2.5 1.8 2.1India 2.4 1.9 2.2
6.12 State-wise Sex-wise percentage of Disabled persons to Total population
Source: NSS 76 th Round, Ministry of Statistics &Programme Implementation
121

State/ Union Territory Visual Disability Hearing
Speech and
language disability
Locomotor Disability
Mental Retardation/ Intellectual Disability
Mental Illness
Other Type of
Disability
Any disability
(1) (2) (3) (4) (5) (6) (7) (8) (9)
A & N Islands 0.1 0.1 0.2 0.8 0.0 0.1 0.0 1.2Andhra Pradesh 0.3 0.5 0.3 1.7 0.2 0.1 0.1 2.8Arunachal Pradesh 0.5 0.5 0.4 0.4 0.0 0.1 0.2 1.8Assam 0.3 0.3 0.2 0.8 0.1 0.1 0.0 1.7Bihar 0.1 0.2 0.2 0.7 0.1 0.1 0.0 1.3Chandigarh 0.1 0.1 0.1 0.8 0.1 0.0 0.0 1.0Chhattisgarh 0.1 0.2 0.2 1.0 0.1 0.1 0.1 1.8
Dadra & Nagar Haveli 0.1 0.2 0.2 0.5 0.1 0.1 0.1 1.0
Daman & Diu 0.0 0.0 0.0 0.6 0.0 0.0 0.0 0.7Delhi UT 0.1 0.1 0.1 0.7 0.1 0.1 0.0 1.1Goa 0.1 0.3 0.1 0.6 0.0 0.1 0.1 1.3Gujarat 0.1 0.2 0.1 0.8 0.1 0.1 0.1 1.3Haryana 0.3 0.3 0.2 1.9 0.2 0.1 0.0 2.7Himachal Pradesh 0.1 0.3 0.2 1.2 0.2 0.1 0.0 1.9Jammu & Kashmir 0.2 0.2 0.2 0.7 0.1 0.1 0.0 1.4Jharkhand 0.2 0.2 0.3 1.0 0.1 0.2 0.0 1.8Karnataka 0.4 0.4 0.2 1.2 0.1 0.1 0.0 2.2Kerala 0.3 0.5 0.3 1.7 0.3 0.4 0.0 2.9Lakshadweep 0.2 0.2 0.1 1.2 0.1 0.0 0.0 1.7Madhya Pradesh 0.2 0.2 0.1 1.1 0.1 0.1 0.0 1.8Maharashtra 0.2 0.2 0.2 1.3 0.2 0.1 0.1 2.0Manipur 0.1 0.1 0.1 0.2 0.1 0.1 0.0 0.7Meghalaya 0.1 0.2 0.2 0.3 0.1 0.1 0.0 0.9Mizoram 0.1 0.2 0.3 0.2 0.2 0.0 0.0 1.0Nagaland 0.2 0.2 0.2 0.3 0.1 0.1 0.1 1.1Odisha 0.4 0.5 0.2 1.6 0.2 0.2 0.1 3.0Puducherry 0.3 0.5 0.1 1.3 0.1 0.2 0.0 2.5Punjab 0.2 0.3 0.1 2.1 0.1 0.1 0.0 2.8Rajasthan 0.3 0.3 0.1 1.1 0.1 0.1 0.0 1.9Sikkim 0.5 0.7 0.5 0.5 0.0 0.1 0.0 2.1Tamil Nadu 0.2 0.4 0.2 1.0 0.1 0.1 0.1 1.9Telangana 0.2 0.3 0.2 1.1 0.1 0.1 0.0 1.8Tripura 0.1 0.2 0.2 0.5 0.1 0.1 0.1 1.1Uttar Pradesh 0.3 0.3 0.2 1.3 0.1 0.1 0.0 2.0Uttarakhand 0.4 0.3 0.1 0.8 0.1 0.1 0.0 1.5West Bengal 0.2 0.3 0.3 0.9 0.1 0.2 0.1 1.8India 0.2 0.3 0.2 1.2 0.1 0.1 0.0 1.9Source: NSS 76 th Round, Ministry of Statistics &Programme Implementation
6.13 Percentage of females by type of disability - Jul-Dec, 2018
122


CHAPTER-7: MINIMUM SET OF GENDER INDICATORS
The Minimum Set of Gender Indicators has been developed by Inter-Agency and Expert Group
on Gender Statistics (IAEG-GS) constituted by United Nations Statistics Division (UNSD). The
Minimum Set of Gender Indicators was agreed by the United Nations Statistical Commission in
its 44th Session in 2013 (E/CN.3/2013/33). The Minimum Set of Gender Indicators is to be used
across countries and regions, for the national production and international compilation of gender
statistics.
The indicators are organized into five domains namely (i) Economic structures and access to
resources (ii) Education (iii) Health and related services (iv) Public life and decision-making and
(v) Human rights of women and child. Each domain addresses one or more of the Beijing Platform
for Action critical areas of concern.
The minimum set of gender indicators comprising of 52 quantitative indicators and 11 qualitative
indicators addressing relevant issues to gender equality and /or women’s empowerment. As of the
April 2019, the minimum set of gender indicators have been classified in three tiers namely;
34 indicators fall under the Tier 1 indicator (Tier 1: indicator addresses relevant issues related
to gender equality and/or women's empowerment; is conceptually clear and has an
international established methodology and standards; and data are regularly produced by
countries, with sufficient coverage to allow tracking progress over time
13 indicators fall under the Tier 2 indicator (Tier 2: indicator addresses relevant issues related
to gender equality and/or women's empowerment; is conceptually clear and has an
international established methodology and standards; but data are not regularly produced by
countries
4 indicators fall under the Tier 3 indicator (Tier 3: indicator addresses relevant issues related
to gender equality and/or women's empowerment; but with no international established
methodology or standards; data are not regularly produced by countries
1 indicator falls under bother Tier 1 and Tier 2.
Out of 52 quantitative indicators of the minimum set of gender indicators, 22 quantitative
indicators are aligned with global SDG indicators. Information related to many of these
quantitative indicators of the minimum set of gender indicators have been given in the Women and
Men in India, the mapping of which has been given in Appendix-I.
123

Appendix-I
Mapping of Minimum Set of Gender Indicators recommended by Inter-Agency Expert Group on Gender
Statistics (IAEG-GS) with the Tables of Women and Men in India
S.
No.
Indicator
number
Indicator Tier Corresponding
Global SDG
Indicators
Corresponding
National SDG
Indicators
Related Tables
1 3 Labour force participation rate for persons
aged 15-24 and 15+, by sex
1 Table-4.8 Age (15-29 years)
Table 4.10- Age ( 15years and
above)
2 4 Proportion of employed who are own-
account workers, by sex
1 Table- 4.5
3 6 Proportion of employed who are employer,
by sex
1 Table- 4.5
4 8 Percentage distribution of employed
population by sector, each sex (sectors here
refer to Agriculture; Industry; Services)
1 Table- 4.6
5 9 Proportion of informal employment in
non-agriculture employment, by sex
2 8.3.1 Table- 4.7
6 10 Unemployment rate, by sex, age and persons
with disabilities
1 8.5.2 8.5.2 Table-4.11 ( by sex)
Table-4.12 (by age)
7 20 Youth literacy rate of persons (15-24 years),
by sex
1 4.6.1 Table-3.7-Adult literacy rate
( 15+ years)
8 21 Adjusted net enrolment rate in primary
education, by sex
1 4.1.2 Table- 3.9
9 22 Gross enrolment ratio in secondary
education, by sex
1 4.1.3 Table-3.8
10 23 Gross enrolment ratio in tertiary education,
by sex
1 4.3.3 Table 3.31
11 24 Gender parity index of the gross enrolment
ratios in primary, secondary and tertiary
education
1 4.5.2 Table- 3.32
124

S.
No.
Indicator
number
Indicator Tier Corresponding
Global SDG
Indicators
Corresponding
National SDG
Indicators
Related Tables
12 25 Share of female science, technology,
engineering and mathematics graduates at
tertiary level
1 Table- 3.33
13 31 Educational attainment of the population
aged 25 and older, by sex
1 Table-3.11
14 32 Proportion of women of reproductive age
(aged 15-49 years) who have their need for
family planning satisfied with modern
methods
1 3.7.1 Table 2.15
15 33 Under-five mortality rate, by sex 1 3.2.1 3.2.1 Table-2.2
16 34 Maternal mortality ratio 1 3.1.1 3.1.1 Table- 2.6
17 35 Antenatal care coverage 1 3.1.4 Table-2.8
18 36 Proportion of births attended by skilled
health personnel
1 3.1.2 3.1.2, 3.1.3 Table-2.9
19 37 Age-standardized prevalence of current
tobacco use among persons aged 15 years
and older, by sex
1 3.a.1 3.a.1 Table-2.16
20 38 Proportion of adults who are obese, by sex 1 Table- 2.17
21 39 Number of new HIV infections per 1,000
uninfected population, by sex, age and key
populations
1 3.3.1 3.3.1 Table-2.18
22 43 Women’s share of government ministerial
positions
1 Table- 5.1
23 44 Proportion of seats held by women in (a)
national parliaments and (b) local
governments
1 (a)/
2 (b)
5.5.1 5.5.1 Table-5.5,
Table-5.8
24 45 Proportion of women in managerial positions 1 5.5.2 5.5.2 Table- 5.9
125

S.
No.
Indicator
number
Indicator Tier Corresponding
Global SDG
Indicators
Corresponding
National SDG
Indicators
Related Tables
25 46 Percentage of female police officers 2 Table-5.1
26 47 Percentage of female judges 2 Table-5.7
27 51 Proportion of women aged 20-24 years who
were married or in a union before age 15 and
before age 18
2 5.3.1 5.3.2 Table- 6.9
126
DEFINITIONS AND EXPLANATIONS
Annual Exponential Population Growth Rate
r = (Ln P (t+10) - Ln P (t)) /10, where Ln stands for natural logarithm
P (t) = Initial population; P (t+10) = Population after 10 years
Age- Specific Fertility Rate (ASFR)
Age-specific fertility rate is defined as the number of live births in a specific age group of
women per thousand female populations of that age group (ORGI).
Age- Specific Mortality Rate (ASMR)
Age-specific mortality rate is defined as the number of deaths in specific age group per
thousand populations in the same age-group in a given year (ORGI).
Crude Birth Rate (CBR)
The Crude Birth Rate (CBR) is defined as the number of live births per thousand population.
Crude Death Rate (CDR)
The Crude Death Rate (CDR) is defined as Number of deaths per thousand population.
Dropout Rate
A dropout is a pupil who leaves school before the completion of a school stage or leaving at
some intermediate or non-terminal point of a given level of education (MHRD).
Definition of Literate
A person aged 7 years and above who can both read and write with understanding in any
language was taken as literate. A person, who can only read but cannot write, is not literate.
It is not necessary that to be treated as literate, a person should have received any formal
education or passed any minimum educational standard. Literacy could also have been
achieved through adult literacy classes or through any non-formal educational system. People
who are blind and can read in Braille were also treated as literates. All children of age 6 years
or less were treated as illiterate by definition, irrespective of their status of school attendance
and the capability to read and write (ORGI).
127

Literate
A person is considered literate if he/she can read and write a simple message in at least on
language with understanding (NSS 75th round).
Definition of Youth
Youth are defined as those aged 15 to 29 in the National Youth Policy (2014) (NYP-2014).
Disability
“Person with disability” means a person with long term physical, mental, intellectual or
sensory impairment which, in interaction with barriers, hinders his full and effective
participation in society equally with others. “Barrier’’ means any factor including
communicational, cultural, economic, environmental, institutional, political, social,
attitudinal or structural factors which hampers the full and effective participation of persons
with disabilities in society (NSS 76th Round).
Effective Literacy Rate (ELR)
The total percentage of the population of an area at a particular time aged seven year or
above who can read and write with understanding. Here the denominator is the population
aged seven years or more (ORGI).
Expectation of Life at Birth
The expectation of life at birth is the average number of years a person is expected to live
under prevailing mortality conditions (ORGI).
General Fertility Rate (GFR)
General fertility rate is defined as number of live births per thousand women in the age group
(15-49 years) in a given year (ORGI).
Gross Enrolment Ratio (GER)
The Gross Enrolment Ratio (GER) for a class-group is the ratio of the number of persons in
the class-group to the number of persons in the corresponding official age-group (MHRD).
128

Gender Parity Index (GPI)
The Gender Parity Index (GPI) is the ratio of the number of female students enrolled at
primary, secondary and tertiary levels of education to the corresponding number of male
student in each level. Thus GPI (based on GER) which is free from the effects of the
population structure of the appropriate age group, provides picture of gender equality in
education (MHRD).
Infant Mortality Rate (IMR)
Infant mortality rate refers to the measurement of mortality in the first year of life and is
computed by (relating) the number of deaths under one year of age divided by 1000 live
births in a given year (ORGI).
Labour Force Participation Rate (LFPR)
LFPR is defined as the percentage of persons in the labour force in the population (PLFS).
LFPR = No. of Employed Persons + No. of Unemployed Persons * 100
Total Population
Maternal Mortality Ratio (MMR)
Maternal Mortality Ratio refers to the number of women who die as a result of complications
of pregnancy or childbearing in a given year per 100,000 live births in that year (ORGI).
Proportion Unemployed (PU)
It is defined as the percentage of persons unemployed in the population (PLFS).
PU = No. of Unemployed Persons * 100
Total Population
Sex Ratio
Sex ratio has been defined as the number of females per 1000 males in the population. It is
expressed as ‘number of females per 1000 males’ (ORGI).
129

Scheduled Commercial Banks
All banks which are included in the second schedule to the Reserve Bank of India Act, 1934
are Scheduled Banks. These banks comprise Scheduled Commercial Banks and Scheduled
Co-operative Banks (RBI).
Total Fertility Rate (TFR)
Total fertility rate is defined as the average number of children expected to be born per
woman during her entire span of reproductive period assuming that the age specific fertility
rates, to which she is exposed to, continue to be the same and that there is no mortality
(ORGI).
Usual Status Approach (ps+ss)
The labour force according to the usual status (ps+ss) is obtained by considering the usual
principal status and the subsidiary status together. The estimate of the labour force in the
usual status (ps+ss) includes (a) the persons who either worked or were available for work
for a relatively long part of the 365 days preceding the date of survey and also (b) those
persons from among the remaining population who had worked at least for 30 days during
the reference period of 365 days preceding the date of survey (PLFS).
Unemployment Rate (UR)
UR is defined as the percentage of persons unemployed among the persons in the labour
force (PLFS).
UR = No. of Unemployed Persons * 100
No. of Employed Persons + No. of Unemployed Persons
Worker Population Ratio (WPR)
Worker Population Ratio (WPR) is defined as the percentage of employed persons in the
population (PLFS).
WPR = No. of employed Persons * 100
Total population
130

Explanatory Note for PLFS
The Periodic Labour Force Survey (PLFS) was designed with two major objectives for
measurement of employment and unemployment. The first was to measure the dynamics in
labour force participation and employment status in the short time interval of three months
for only the urban areas in the Current Weekly Status (CWS). Secondly, for both rural and
urban areas, to measure the labour force estimates on key parameters in both usual status
(ps+ss) and CWS. To achieve these twin objectives as well as providing estimates on
additional aspects of data (such as hours worked) which were not available from the
quinquennial rounds of NSSO, certain changes were introduced in the sampling design and
structure of the Schedule of inquiry.
The users of this report are being apprised of the various aspects of the survey methodology,
data collection mechanism and sampling design of PLFS vis-à-vis the earlier Employment
and Unemployment quinquennial rounds of NSSO so that these can be considered while
comparing results from earlier employment and unemployment surveys which were
undertaken along with the NSS Consumer Expenditure Surveys. The results of the PLFS thus
need to be understood and used in the context with which the survey methodology and
sample selection has been designed.
*****
131
