women leading growth: an empirical analysis on the effects of women in leadership positions on gdp
TRANSCRIPT
UBC
ECONOMICS 490:
SEMINAR IN APPLIED ECONOMICS RESEARCH ESSAY
WOMEN LEADING GROWTH
An Empirical Analysis on the Effects of Women in Leadership Positions on GDP
Avril Espinosa-Malpica December 9, 2016
SUMMARY The likes of Angela Merkel, Hillary Clinton, Christine Lagarde, and Sheryl Sandberg demonstrate that women are more than capable to lead. Yet when it comes to positions of power, women still remain largely underrepresented. Beyond the morality of gender inequality, excluding women from top leadership positions diminishes the potential for economic growth. This paper hypothesizes that increasing the share of women in top management positions in the private sector and in elected government positions in the public sector leads to an increase in GDP per capita. The study uses panel data to estimate a generalized least squares regression. It finds that increasing women leadership by 1% in the private sector increases countries’ GDP per capita by 0.037%. The results are robust and have a 0.1% significance level. The results of women leaders in the public sector are inconclusive.
Vancouver School of Economics University of British Columbia
Vancouver, BC

UBC ECONOMICS 490 : SEMINAR IN APPLIED ECONOMICS │ RESEARCH ESSAY
[2]
Women
Leading Growth
AN EMPIRICAL ANALYSIS ON THE EFFECTS OF
W OMEN IN LEADERSHIP POSIT IONS ON GDP
Avril Espinosa-Malpica
INTRODUCTION
The likes of Angela Merkel, Hillary Clinton, Christine Lagarde, and
Sheryl Sandberg demonstrate that women are more than capable to lead. Yet, when it
comes to positions of power, women still remain largely underrepresented. In June
2016, only 22.8 per cent of all national parliamentarians were women (UN Women
2016). Similarly, in the private sector, women made up only 24 per cent of senior
management roles in 2016 (Grant Thornton (2016); pg. 2). Beyond the morality of
gender inequality, excluding women from top leadership positions diminishes the
potential for economic growth. This paper hypothesizes that increasing the share of
women in top management positions in the private sector and in elected government
positions in the public sector leads to an increase in GDP per capita.
Over the last century, the changes in social and gender norms have led to an increase
participation of women in the labour force (Goldin 2006). This has been one of the
most significant changes in the labour market. In the developed world, female labour
has contributed more to global GDP than new technology or the new corporate giants
(The Economist 2006). While this change has allowed women to substantially
contribute to the economy, a glass ceiling remains that must be removed in order to
continue seeing substantial economic returns from female labour. Capitalizing on

AVRIL ESPINOSA-MALPICA │ DECEMBER 9, 2016
[3]
women’s labour by reducing the gender gap could lead to a 12 per cent increase of
GDP by 2030 among OECD countries (OECD (2012); pg. 30).
Currently women are an under-utilised resource in top leadership positions. To achieve
the best results, the best people must lead – skills sets rather than gender should
determine hiring decisions. By excluding women from top level leadership positions,
governments and firms may be missing out on hiring the most qualified candidates if
they are not male. Unrestricting leadership to both genders fully expands the pool of
talent and labour force. Women’s talent is reflected by their education. In G20 nations,
25 to 34-year-old women are more likely to have completed a post-secondary degree
than men of the same age (OECD (2012); pg. 100). Opening top tier positions to
women would result in an increase in workers, which can increase productivity if they
bring specialized skills to job that were previously missing. Possible short-term
negative effects may arise when women replace current male workers in leadership
positions who are less skilled. This would negatively affect the individuals being
replaced, as they would become unemployed. According to the neo-classical labour
supply and demand model, this would lead to disequilibrium and a decrease wages as
supply of labour is increased for high-ranking positions, as would be the case when
opening top tier jobs to female workers. However, in the long run due to the flexibility of
the economy, the labour market would adjust. Those unemployed would move into
other sectors of the economy where there is a demand for labour and their skill level is
better utilized. For society as a whole, this would be beneficial as the aggregate labour
supply would be fully exploited and distributed according to skillsets, thereby
maximizing efficiency. This would generate further economic gains and contribute to
economic development.
The choices of female leaders could also impact GDP. Studies show that female
politicians are more likely to spend money on improving health, education,
infrastructure and poverty instead of on military (The Economist 2006). In the private
sector, women demonstrate skills such as organizational effectiveness, which can be
positive for the bottom line (UN Women 2016). By contributing different viewpoints and
characteristics to the organization, women help organizations innovate and develop in
different ways. Studies also show that a diverse team creates more creative, more
diligent and harder-working groups (Phillips 2014) (Dezsö and Ross 2014). Diversifying
gender is hence important as including women in leadership position could lead to
different and possibly better outcomes that would not necessarily be considered by a
homogenous team of men.
UBC ECONOMICS 490 : SEMINAR IN APPLIED ECONOMICS │ RESEARCH ESSAY
[4]
These theories show plausible explanations for the positive economic contributions of
women in leadership hypothesized in this paper. This study is relevant because
understanding factors of economic development, such as female leadership, is
important to achieve global economic growth and global prosperity. This paper will use
data from fifty-four countries over a period from 1998-2014 to determine the effects of
women leaders in the public and private sector on the economy and contribute to the
economic development and gender parity literature.
LITERATURE REVIEW
Gender equality has long been a focus of research for economists. Many have
researched the effects of women in the labour force at a broad level, more recently
focused on women in top tier positions. The literature tends to differentiate between
the effects of women in the public and private sector, given the different implications of
the work, and thus this paper also analyses women in each sector as a separate
variable. The literature is generally in accordance and indicates that women leaders
have positive effects on their organization and society, which is in line with the
hypothesis. There is also literature that outlines differences in leadership styles
between men and women, which would account for the outcomes of mixed gender
teams.
At a broad level, Goldin (2006) analyses how a current revolution and past evolutions
of women’s increased involvement in the economy has affected the labour market. The
transition from evolution to revolution is linked to the change from jobs to careers, a
distinction marked between a need to earn wages and employment becoming part of
one’s identity. This in turn affects both horizon (if a woman perceives her job to be long
or short term) and human capital investment. To measure this change in labour
participation, the paper uses US Population Census from 1890 to 2004. By looking at
income elasticity, labour supply, and utilizing an economics history approach, Goldin
(2006) analyses the four stages of development in women’s involvement in the labour
market. The paper shows that over the past century female rate of participation in the
labour market has increased and that since 1990 the participation rate of married
college graduate in their thirties has stabilized at 76% (Goldin (2006); pg. 14). Given
that in the past women’s entrance into the labour market has been the main driver of
labour supply growth, the plateau would imply that the labour market supply in general
is stabilizing. This indicates that participation in the labour force has possibly peaked
AVRIL ESPINOSA-MALPICA │ DECEMBER 9, 2016
[5]
and that future advancements in the female labour force would need to occur from
within, meaning women’s career choices will need to change and improve. To continue
seeing returns due to women in the workforce, women need to pursue higher skill level
and wage positions.
In the private sector, Flabbi et al. (2014) hypothesizes that women’s under-
representation among executives has negative effects on productivity and welfare. To
test its hypothesis, the paper uses data from Italian automobile manufactories firms
with at least 50 employees between 1982 and 1997 from three sources. This comes
from the Bank of Italy’s annual survey of manufacturing firms (INVIND), the National
Social Security Institute (INPS) which provides the work histories of all workers ever
employed at an INVIND firm, and the Company Accounts Data Service (CADS) which
contains balance-sheet information on industry, location, sales, revenues, value added
at the firm-year level, and a firm identifier. Flabbi et al. (2014) uses joint two-way fixed
effects regressions and finds that placing females in top corporate jobs causes firms to
increase their sale per worker by 14.2%, which in turn increases profits, if the firm has
at least 20% of female workers employed (Flabbi et al. (2014); pg. 30). The paper
attributes this positive relation between female leadership and economic gains to
female CEO’s insight into female workers’ productivity, which creates a more efficient
workforce. Further analysis remains to be done to determine if female CEOs give
preferential treatment to female employees, which would be another explanation for
why female leaders affect the wages and productivity of female employees. Dezsö and
Ross (2012) also analyse economic gains in private firms, it hypothesizes that female
representation in top management positions brings informational and social diversity to
the top management team, enriches behaviour of managers throughout the firm, and
motivates women in middle management. The paper uses 15 years of panel data on
the top management teams of the S&P 1,500 firms, from the S&P’s ExecuComp
database, to run a fixed effects time series regression. The results are that a
company’s value is 1.19% higher with female representation in top management than
without it (Dezsö and Ross (2012); pg. 1080). This is particularly true in firms with a
strategy focused on innovation, as the paper finds also finds a correlation of 0.32
between female representation and innovation intensity (Dezsö and Ross (2012); pg
1079). The study indicates that further work needs to be done in examining the type of
women that make it to the top management team. Since it is significantly more difficult
for women than for men to reach the top of the corporate ladder, questions remain
about whether the results obtained are due to the possibility that the women that do
make it are exceptionally hard and thus must be even better than their male counter

UBC ECONOMICS 490 : SEMINAR IN APPLIED ECONOMICS │ RESEARCH ESSAY
[6]
parts. Introducing gender quotas, despite evidence that women are beneficial, could
deter companies from hiring women as they may wary of losses. Niederle, Carmit and
Vesterlund (2013) analyses whether or not introducing gender quotas affects team
performance and how costly these quotas are. To test if affirmative action has an
effect, this study ran an experiment and collected data using 42 male and 42 female
subjects from the Harvard Business School’s Computer Lab for Experimental
Research pool. To test the hypothesis, the research conducted a tournament entry
model with team variations on gender, gender winning quotas, and knowledge of the
quotas. Niederle, Carmit and Vesterlund (2013) finds that by introducing a gender
quota there are no significant losses, as reflected by the winning earnings of female
participants. The standard tournament yields an average score by winners of 19.2,
while the gender quota tournament yields 18.7 (Niederle, Carmit and Vesterlund
(2013); pg. 7). This is not a significant difference suggesting that including a gender
quota does not reduce the earnings of winners. This implies that introducing gender
quotas does not lower the skill level of applicants and thus the costs to firms. The
paper recommends further research into the long-term effects of increased gender
parity. In particular, research needs to be conducted to test if gender parity increases
mentorship opportunities for women and changes the perception of women’s ability to
hold high-ranking positions.
In the public sector, Clots-Figueras (2012) analyses Indian state governments and the
impact that female politicians have on the education levels of the people from their
constituency. To test its hypothesis, Clots-Figueras (2012) uses data from the Election
Commission of India state legislatures from 1967-2001, which provides observations
for 29,686 politicians in 16 states. The observations indicate candidates’
characteristics and election results. Data from the National Sample Survey data (NSS)
is also collected to determine the level of education of individuals in each constituency
from 1999-2000. Clots-Figueras (2012) estimates an OLS regression and finds that
increasing female representation in politicians by 10% increases the probability that an
individual will get an elementary school education in urban areas by 7.3% (Clots-
Figueras (2012); pg. 229). This shows an improvement of human capital through
education, as a result of increasing female leadership in the public sector, which leads
to economic gains. Clots-Figueras (2012) cites that in urban areas, an educated
woman earns 3.5 times as much as an uneducated one, while men earn 1.9 times as
much if they are educated. The paper indicates that further studies remain to be done
to analyse the reasons behind this effect. Possible causes could be that female
politicians’ care more about education spending than male politicians or that female
AVRIL ESPINOSA-MALPICA │ DECEMBER 9, 2016
[7]
politicians act as role models which incentivise young women to further their education.
Holman (2014) also analyzes the role of women leaders in the public sector. It
hypothesizes that increasing the percentage of women on the city council has a
positive effect on the city’s participation and funding of social welfare programs. Data
from 300 US cities with a population of 5,000 or more is drawn from the US Census
Bureau. As well, the Center for American Women in politics provides data about the
sex of city leaders to determine the level of female representation in 2007.
Furthermore, by obtaining and coding each of the 2008 budgets of cities studied, the
paper measures the city’s level of welfare funding. By using a logistical regression, the
study finds that when city councils U.S. municipalities are made up of at least 30%
female councillors, significant effects on social welfare programs funding takes place –
at this level, $10 per capita is budgeted towards social welfare programs (Holman
(2014); pg. 710). The findings of Holman (2014) could further explain the effects
female politicians have on development as a result of the policies they enact. Since the
effect of female city councillors on social welfare, funding is truly noticeable only when
the council is made up of at least 30% female councillors, studies remain to be done
on how critical mass works. Questions remain as to why a substantial amount of
female representatives is necessary for substantial effects on social welfare funding,
and why a linear growth proportionate to the growth of female leaders elected is not
seen.
Post (2015) and Beaman et al. (2009) analyze the capabilities of women leaders. Post
(2015) studies whether teams with female leaders are more cohesive and cooperative
than those with male leaders. Data is collected through surveys by the Industrial
Research Institute, which compiled information about teams and their performance.
Through a hierarchical linear modeling OLS regression, Post (2015) finds that female
leadership is linked with cohesion on larger and more functionally diverse teams and
with cooperative learning and participative communication on larger and
geographically dispersed teams. This demonstrates that there are certain female
leadership characteristics that have a greater effect than men in team relations and
thus productivity. Beaman et al. (2009) analyses how exposure to female leaders
improves the perception of their abilities, which weakens the stereotype of females
being unable to be proper leaders due to gender. For the paper, data is collected from
the Indian state of West Bengal, where village councils consist of elected councillors of
which one third of the seats are for females due to a gender quota. To evaluate
changing attitudes towards women in leadership, the authors conduct a survey. A
regression framework is used to analyse the data. Their findings indicate that exposure
UBC ECONOMICS 490 : SEMINAR IN APPLIED ECONOMICS │ RESEARCH ESSAY
[8]
to at least one female Pradhan (high level official) as result of gender quotas strongly
reduce male villagers’ bias in the perception of female leadership abilities after two
election cycles (Beaman et al. (2009); pg. 1499). This demonstrates that the glass
ceiling women face is not a result of their abilities but of the perception of their abilities.
The implications are that introducing gender quotas has an impact on mitigating voter
discrimination.
This paper contributes to the existing literature by analysing the effects of women
leaders at a global level, which is a sample not previously analysed in recent years as
far as it is known. While this might pose limitations, as the results will not clearly show
how women work in and react to the different environments each country and industry
might present, it should demonstrate general trends of women leaders in the world.
The hypothesis in this paper is in line with previous studies and expects that women
leaders will have a positive correlation with output.
DATA
To test this paper’s hypothesis, the following panel data is used to estimate the
long run growth accounting regression. The data is transformed using the natural log
due to the non-linear relationship between the variables used. Annual data covering
182 countries between 1950 and 2014 is gathered from the Penn World Tables 9.0
database (Feenstra, Inklaar and Timmer 2015). This data provides the dependent
variable gdppc, which is a measure of countries’ real GDP at constant national prices
per capita, transformed using the natural log. This is measured in millions of dollars at
the 2011 United States’ dollar price. The following explanatory variables are acquired
using the Penn World 9.0 database (Feenstra, Inklaar and Timmer 2015). The growth
rate of population year-on-year is measured using the variable growthpop. This
measures the growth rate of the labour force. The index of human capital, ihc, reflects
the increased efficiency of labor based on the years of schooling and returns to
education. The share of merchandise exports current purchasing power parity, sme,
measures the country’s openness to the international market. The variable gcf is gross
capital formation. This measures the net additions to the capital stock of a country, at
current purchasing power parity.
To measure the effects on GDP by women in leadership positions, two explanatory
variables from other sources are retrieved. The data on the share of women leaders in
the public sector, gfs, is gathered from the Inter-Parliamentary Union (IPU) (1990-
AVRIL ESPINOSA-MALPICA │ DECEMBER 9, 2016
[9]
2016). This data covers a period of 27 years from the years 1990 to 2016, inclusive, for
189 countries. It reflects the percentage of parliamentary seats in a single or lower
chamber held by women, which indicates women who are in the highest leadership
positions in the public sector. Members usually win the seats measured in these data
in general parliamentary elections. Seats may also be filled by nomination,
appointment, indirect election, rotation of members and by-election. The data on the
share of women leaders in the private sector, pfs, is gathered from the International
Labour Organization Statistics (ILOSTAT) (1998-2014). This data covers a period of 17
years from the years 1998 to 2014, inclusive, for 68 countries. It shows the percentage
of women in total employment in senior and middle management roles in large
enterprises and institutions. This measurement reflects women who have decision-
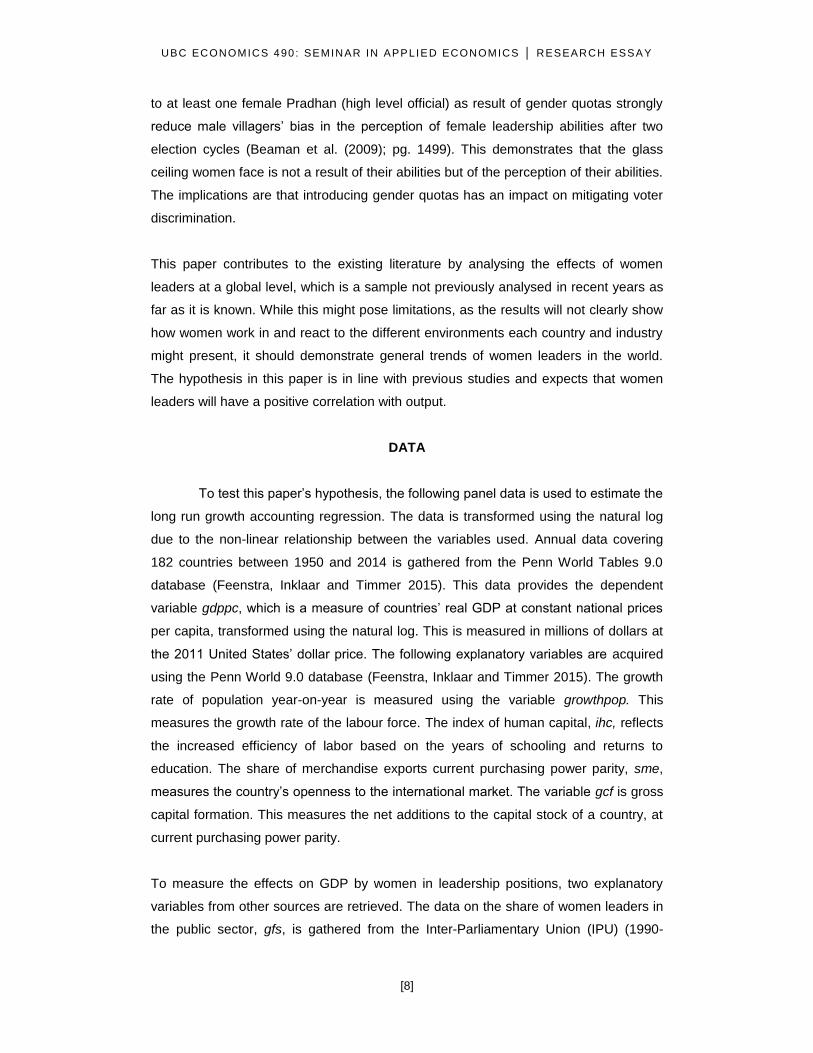
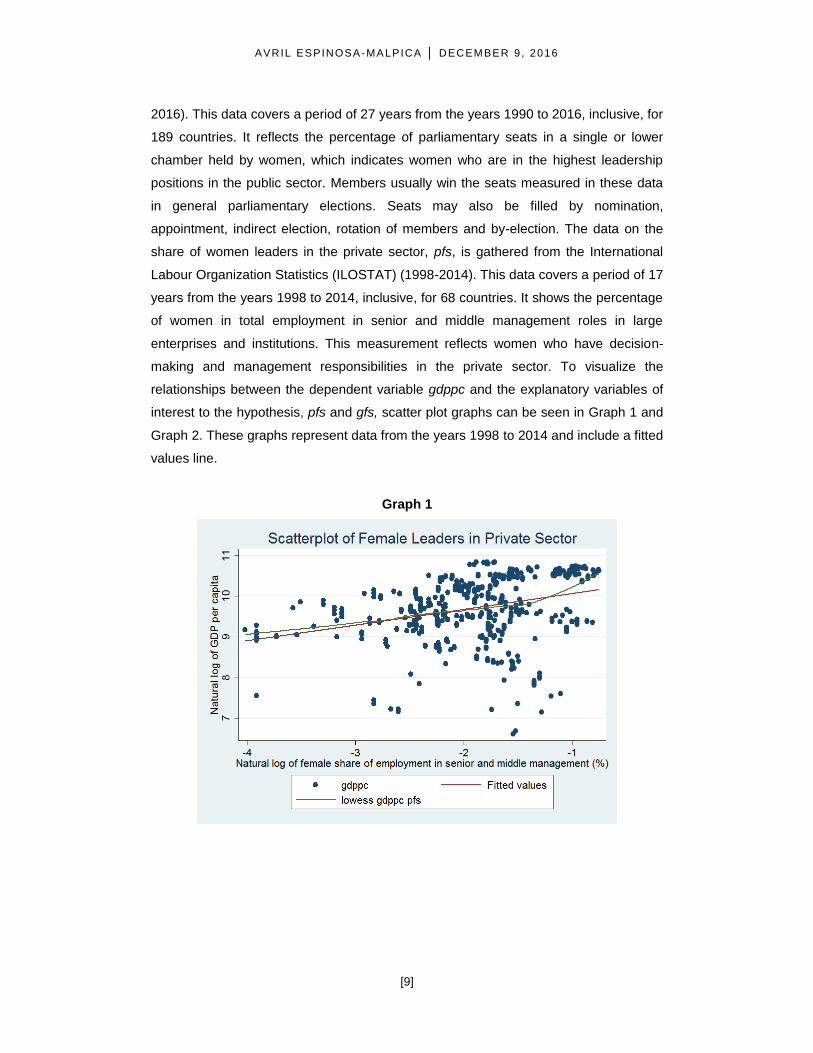
making and management responsibilities in the private sector. To visualize the
relationships between the dependent variable gdppc and the explanatory variables of
interest to the hypothesis, pfs and gfs, scatter plot graphs can be seen in Graph 1 and
Graph 2. These graphs represent data from the years 1998 to 2014 and include a fitted
values line.
Graph 1
UBC ECONOMICS 490 : SEMINAR IN APPLIED ECONOMICS │ RESEARCH ESSAY
[10]
Graph 2
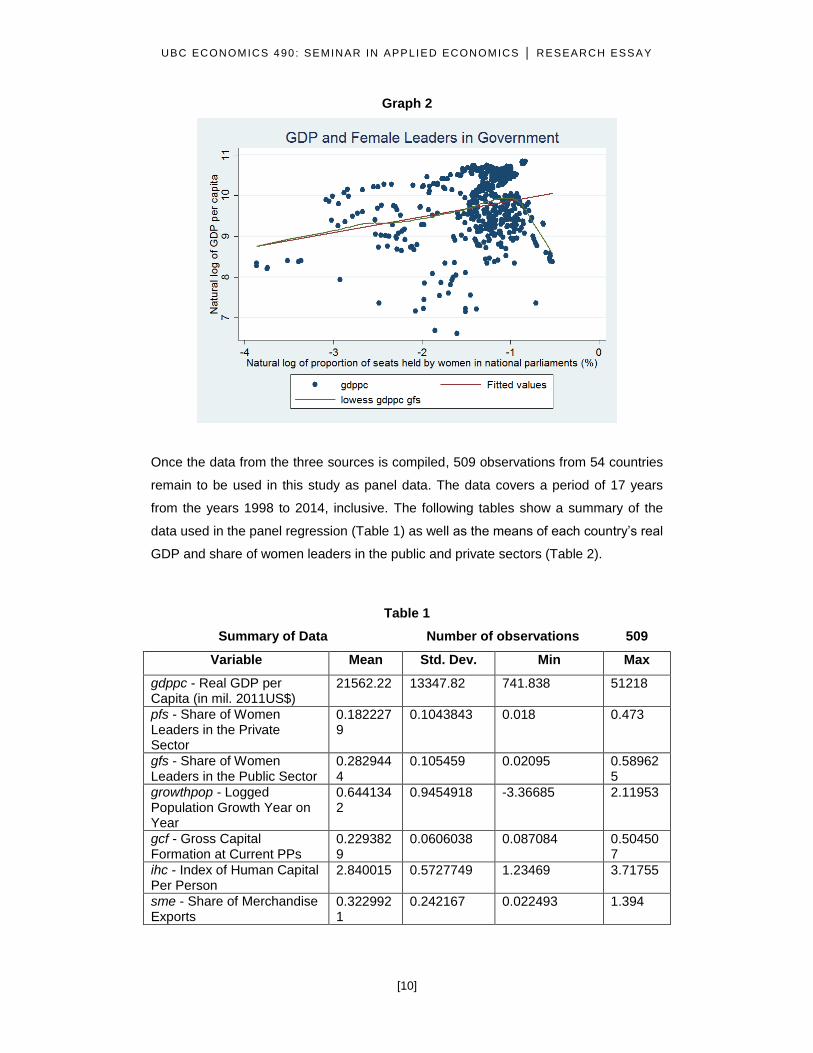
Once the data from the three sources is compiled, 509 observations from 54 countries
remain to be used in this study as panel data. The data covers a period of 17 years
from the years 1998 to 2014, inclusive. The following tables show a summary of the
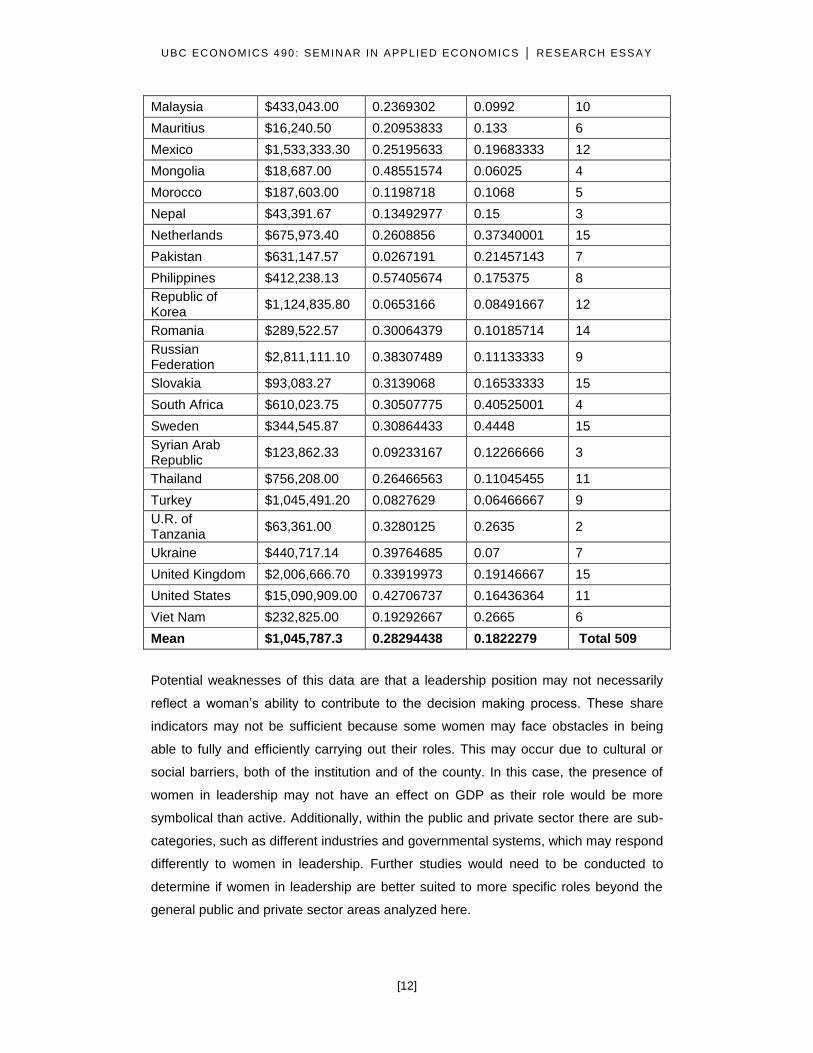
data used in the panel regression (Table 1) as well as the means of each country’s real
GDP and share of women leaders in the public and private sectors (Table 2).
Table 1
Summary of Data Number of observations 509
Variable Mean Std. Dev. Min Max
gdppc - Real GDP per Capita (in mil. 2011US$)
21562.22 13347.82 741.838 51218
pfs - Share of Women Leaders in the Private Sector
0.1822279
0.1043843 0.018 0.473
gfs - Share of Women Leaders in the Public Sector
0.2829444
0.105459 0.02095 0.589625
growthpop - Logged Population Growth Year on Year
0.6441342
0.9454918 -3.36685 2.11953
gcf - Gross Capital Formation at Current PPs
0.2293829
0.0606038 0.087084 0.504507
ihc - Index of Human Capital Per Person
2.840015 0.5727749 1.23469 3.71755
sme - Share of Merchandise Exports
0.3229921
0.242167 0.022493 1.394
AVRIL ESPINOSA-MALPICA │ DECEMBER 9, 2016
[11]
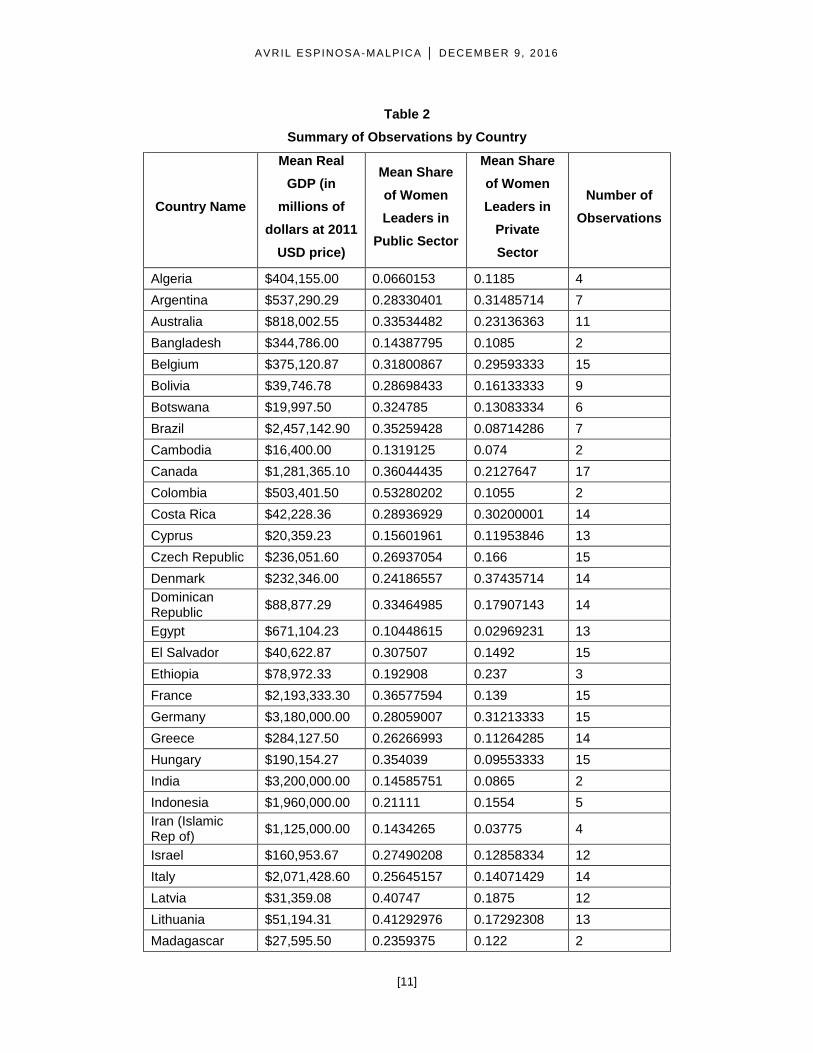
Table 2
Summary of Observations by Country
Country Name
Mean Real
GDP (in
millions of
dollars at 2011
USD price)
Mean Share
of Women
Leaders in
Public Sector
Mean Share
of Women
Leaders in
Private
Sector
Number of
Observations
Algeria $404,155.00 0.0660153 0.1185 4
Argentina $537,290.29 0.28330401 0.31485714 7
Australia $818,002.55 0.33534482 0.23136363 11
Bangladesh $344,786.00 0.14387795 0.1085 2
Belgium $375,120.87 0.31800867 0.29593333 15
Bolivia $39,746.78 0.28698433 0.16133333 9
Botswana $19,997.50 0.324785 0.13083334 6
Brazil $2,457,142.90 0.35259428 0.08714286 7
Cambodia $16,400.00 0.1319125 0.074 2
Canada $1,281,365.10 0.36044435 0.2127647 17
Colombia $503,401.50 0.53280202 0.1055 2
Costa Rica $42,228.36 0.28936929 0.30200001 14
Cyprus $20,359.23 0.15601961 0.11953846 13
Czech Republic $236,051.60 0.26937054 0.166 15
Denmark $232,346.00 0.24186557 0.37435714 14
Dominican Republic
$88,877.29 0.33464985 0.17907143 14
Egypt $671,104.23 0.10448615 0.02969231 13
El Salvador $40,622.87 0.307507 0.1492 15
Ethiopia $78,972.33 0.192908 0.237 3
France $2,193,333.30 0.36577594 0.139 15
Germany $3,180,000.00 0.28059007 0.31213333 15
Greece $284,127.50 0.26266993 0.11264285 14
Hungary $190,154.27 0.354039 0.09553333 15
India $3,200,000.00 0.14585751 0.0865 2
Indonesia $1,960,000.00 0.21111 0.1554 5
Iran (Islamic Rep of)
$1,125,000.00 0.1434265 0.03775 4
Israel $160,953.67 0.27490208 0.12858334 12
Italy $2,071,428.60 0.25645157 0.14071429 14
Latvia $31,359.08 0.40747 0.1875 12
Lithuania $51,194.31 0.41292976 0.17292308 13
Madagascar $27,595.50 0.2359375 0.122 2
UBC ECONOMICS 490 : SEMINAR IN APPLIED ECONOMICS │ RESEARCH ESSAY
[12]
Malaysia $433,043.00 0.2369302 0.0992 10
Mauritius $16,240.50 0.20953833 0.133 6
Mexico $1,533,333.30 0.25195633 0.19683333 12
Mongolia $18,687.00 0.48551574 0.06025 4
Morocco $187,603.00 0.1198718 0.1068 5
Nepal $43,391.67 0.13492977 0.15 3
Netherlands $675,973.40 0.2608856 0.37340001 15
Pakistan $631,147.57 0.0267191 0.21457143 7
Philippines $412,238.13 0.57405674 0.175375 8
Republic of Korea
$1,124,835.80 0.0653166 0.08491667 12
Romania $289,522.57 0.30064379 0.10185714 14
Russian Federation
$2,811,111.10 0.38307489 0.11133333 9
Slovakia $93,083.27 0.3139068 0.16533333 15
South Africa $610,023.75 0.30507775 0.40525001 4
Sweden $344,545.87 0.30864433 0.4448 15
Syrian Arab Republic
$123,862.33 0.09233167 0.12266666 3
Thailand $756,208.00 0.26466563 0.11045455 11
Turkey $1,045,491.20 0.0827629 0.06466667 9
U.R. of Tanzania
$63,361.00 0.3280125 0.2635 2
Ukraine $440,717.14 0.39764685 0.07 7
United Kingdom $2,006,666.70 0.33919973 0.19146667 15
United States $15,090,909.00 0.42706737 0.16436364 11
Viet Nam $232,825.00 0.19292667 0.2665 6
Mean $1,045,787.3 0.28294438 0.1822279 Total 509
Potential weaknesses of this data are that a leadership position may not necessarily
reflect a woman’s ability to contribute to the decision making process. These share
indicators may not be sufficient because some women may face obstacles in being
able to fully and efficiently carrying out their roles. This may occur due to cultural or
social barriers, both of the institution and of the county. In this case, the presence of
women in leadership may not have an effect on GDP as their role would be more
symbolical than active. Additionally, within the public and private sector there are sub-
categories, such as different industries and governmental systems, which may respond
differently to women in leadership. Further studies would need to be conducted to
determine if women in leadership are better suited to more specific roles beyond the
general public and private sector areas analyzed here.
AVRIL ESPINOSA-MALPICA │ DECEMBER 9, 2016
[13]
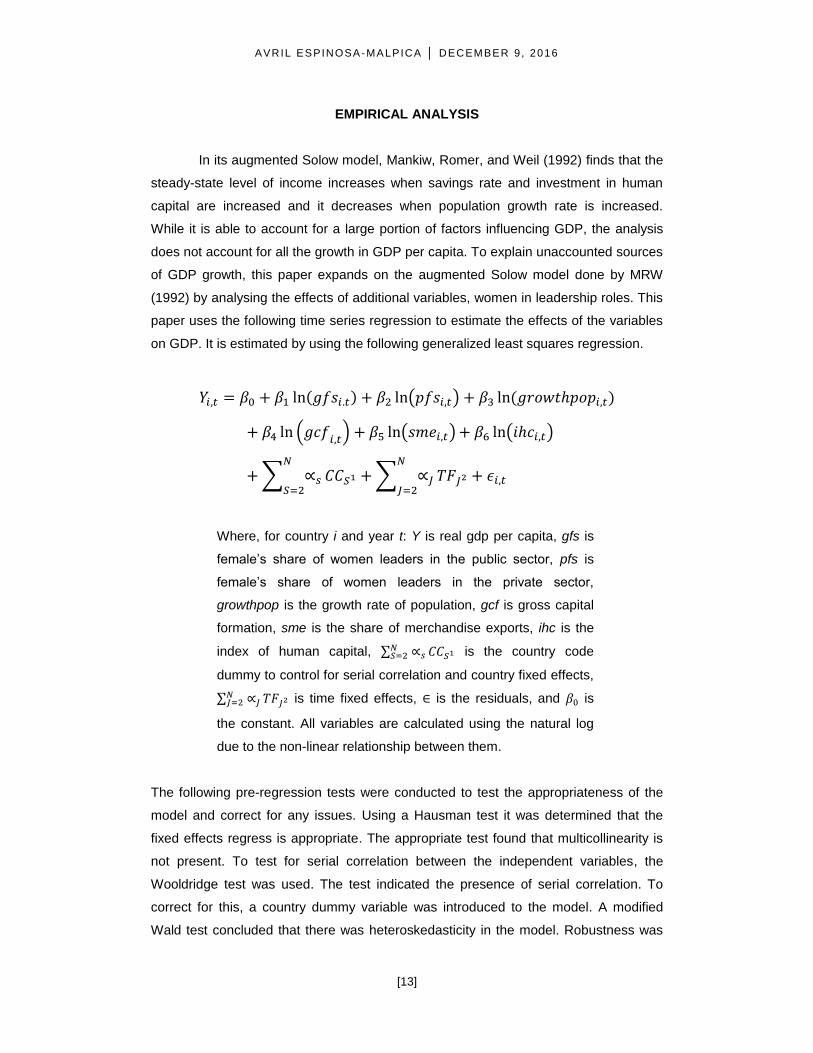
EMPIRICAL ANALYSIS
In its augmented Solow model, Mankiw, Romer, and Weil (1992) finds that the
steady-state level of income increases when savings rate and investment in human
capital are increased and it decreases when population growth rate is increased.
While it is able to account for a large portion of factors influencing GDP, the analysis
does not account for all the growth in GDP per capita. To explain unaccounted sources
of GDP growth, this paper expands on the augmented Solow model done by MRW
(1992) by analysing the effects of additional variables, women in leadership roles. This
paper uses the following time series regression to estimate the effects of the variables
on GDP. It is estimated by using the following generalized least squares regression.
𝑌𝑖,𝑡 = 𝛽0 + 𝛽1 ln(𝑔𝑓𝑠𝑖.𝑡) + 𝛽2 ln(𝑝𝑓𝑠𝑖,𝑡) + 𝛽3 ln(𝑔𝑟𝑜𝑤𝑡ℎ𝑝𝑜𝑝𝑖,𝑡)
+ 𝛽4 ln (𝑔𝑐𝑓𝑖,𝑡
) + 𝛽5 ln(𝑠𝑚𝑒𝑖,𝑡) + 𝛽6 ln(𝑖ℎ𝑐𝑖,𝑡)
+ ∑ ∝𝑠
𝑁
𝑆=2𝐶𝐶𝑆1 + ∑ ∝𝐽
𝑁
𝐽=2𝑇𝐹𝐽2 + 𝜖𝑖,𝑡
Where, for country i and year t: Y is real gdp per capita, gfs is
female’s share of women leaders in the public sector, pfs is
female’s share of women leaders in the private sector,
growthpop is the growth rate of population, gcf is gross capital
formation, sme is the share of merchandise exports, ihc is the
index of human capital, ∑ ∝𝑠𝑁𝑆=2 𝐶𝐶𝑆1 is the country code
dummy to control for serial correlation and country fixed effects,
∑ ∝𝐽𝑁𝐽=2 𝑇𝐹𝐽2 is time fixed effects, ∈ is the residuals, and 𝛽0 is
the constant. All variables are calculated using the natural log
due to the non-linear relationship between them.
The following pre-regression tests were conducted to test the appropriateness of the
model and correct for any issues. Using a Hausman test it was determined that the
fixed effects regress is appropriate. The appropriate test found that multicollinearity is
not present. To test for serial correlation between the independent variables, the
Wooldridge test was used. The test indicated the presence of serial correlation. To
correct for this, a country dummy variable was introduced to the model. A modified
Wald test concluded that there was heteroskedasticity in the model. Robustness was
UBC ECONOMICS 490 : SEMINAR IN APPLIED ECONOMICS │ RESEARCH ESSAY
[14]
included in the model to correct for heteroscedasticity. Data was also checked for
residuals. This found that 34 observations had residuals larger than the absolute value
of two. These outliers were dropped. Finally, a kernel density estimation determined
that the probability density function of residuals was normal. After choosing the
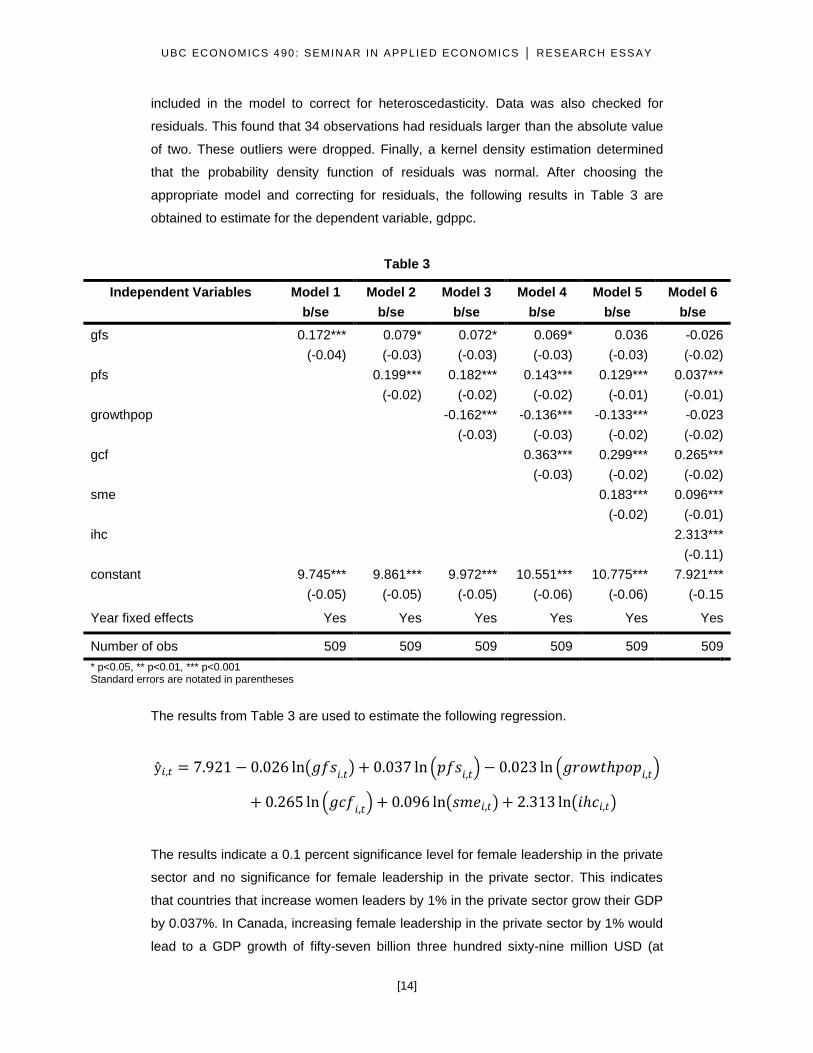
appropriate model and correcting for residuals, the following results in Table 3 are
obtained to estimate for the dependent variable, gdppc.
Table 3
Independent Variables Model 1 Model 2 Model 3 Model 4 Model 5 Model 6
b/se b/se b/se b/se b/se b/se
gfs 0.172*** 0.079* 0.072* 0.069* 0.036 -0.026
(-0.04) (-0.03) (-0.03) (-0.03) (-0.03) (-0.02)
pfs
0.199*** 0.182*** 0.143*** 0.129*** 0.037***
(-0.02) (-0.02) (-0.02) (-0.01) (-0.01)
growthpop
-0.162*** -0.136*** -0.133*** -0.023
(-0.03) (-0.03) (-0.02) (-0.02)
gcf
0.363*** 0.299*** 0.265***
(-0.03) (-0.02) (-0.02)
sme
0.183*** 0.096***
(-0.02) (-0.01)
ihc
2.313***
(-0.11)
constant 9.745*** 9.861*** 9.972*** 10.551*** 10.775*** 7.921***
(-0.05) (-0.05) (-0.05) (-0.06) (-0.06) (-0.15
Year fixed effects Yes Yes Yes Yes Yes Yes
Number of obs 509 509 509 509 509 509
* p<0.05, ** p<0.01, *** p<0.001 Standard errors are notated in parentheses
The results from Table 3 are used to estimate the following regression.
ŷ𝑖,𝑡 = 7.921 − 0.026 ln(𝑔𝑓𝑠𝑖.𝑡) + 0.037 ln (𝑝𝑓𝑠
𝑖,𝑡) − 0.023 ln (𝑔𝑟𝑜𝑤𝑡ℎ𝑝𝑜𝑝𝑖,𝑡)
+ 0.265 ln (𝑔𝑐𝑓𝑖,𝑡) + 0.096 ln(𝑠𝑚𝑒𝑖,𝑡) + 2.313 ln(𝑖ℎ𝑐𝑖,𝑡)
The results indicate a 0.1 percent significance level for female leadership in the private
sector and no significance for female leadership in the private sector. This indicates
that countries that increase women leaders by 1% in the private sector grow their GDP
by 0.037%. In Canada, increasing female leadership in the private sector by 1% would
lead to a GDP growth of fifty-seven billion three hundred sixty-nine million USD (at
AVRIL ESPINOSA-MALPICA │ DECEMBER 9, 2016
[15]
current US$).1 This is close to the total GDP earned in Canada by the Educational
Services industry, the eleventh largest industry out of the twenty main sectors in the
Canadian economy.2 This reflects potentially significant gains for the country if it
enacts policies that encourage an increase in the share of women in leadership
positions in the private sector. These results show evidence that maximizing the labour
pool of talent by allowing women to serve in top leadership positions in the private
sector has positive benefits, which the companies stand to profit from. This is in line
with the results of Flabbi et al. (2014), Dezsö and Ross (2012), and Niederle, Carmit
and Vesterlund (2013). As well, these results might indicate that women do have
different beneficial attributes that contribute to productivity, as found in UN Women
(2016), Phillips (2014) and Dezsö and Ross (2014).
The effects of female leadership in government are not significant in this regression
and therefore no conclusions can be drawn on how it affects GDP. However further
studies could be done to explain the potential negative effects women leaders in
government may have on GDP, indicated by the negative coefficient. In particular
research should be conducted to determine how democracies affect the role of women
in government, given that the countries with the highest female representation in
parliament are Rwanda with 64% of women, followed by Bolivia at 50% and Cuba at
49% (Inter- Parliamentary Union 2016). All of these three countries score low on the
2015 Democracy Index (The Economist Intelligence Unit 2015), so there appears to be
a correlation between high share of female leaders in government and low levels of
democracy. This correlation should be further analysed as it could be distorting the
results of this study, in regards to the effects of women in government on GDP, which
may be positive in democratic countries.
CONCLUSION
The recent 2016 presidential election in the United States has reignited the
debate over women’s leadership abilities. Historically women have faced greater
barriers than men when it comes to fully participating in the economy, particularly in top
1 Based on Canada’s 2015 GDP of 1.55 trillion USD (measured in current US$) (World Bank
1966-2015). 2 Based on a 1.33USD conversion rate, 0.037% of the Canadian GDP obtained from the World
Bank 1996-2015 equals to approximately $76 billion CAD. Statistics Canada (2010-2014) indicates that the GDP of the Educational Services Industry in 2014 was $ 84.639 billion CAD. Given that from 2013-2014 the GDP of the Educational Services Industry was decreasing it is estimated that two years later it has continued to decrease and thus is approximately the closest industry in GDP to the estimated change in GDP if the share of women in the private sector increased by 1%.
UBC ECONOMICS 490 : SEMINAR IN APPLIED ECONOMICS │ RESEARCH ESSAY
[16]
leadership positions. While numbers of female leaders in the public and private sector
are slightly growing, the full benefits of the female labour force have yet to be obtained.
To analyse the potential impact that women could have, it was theorized in this paper
that increasing the share of women in top public and private sector positions leads to
an increase in GDP per capita. The results are partially consistent with the hypothesis.
This paper finds that increasing women leadership by 1% in the private sector
increases countries’ GDP per capita by 0.037%. The panel data regression results are
robust and have a 0.1% significance level. The results of women leaders in the public
sector were inconclusive.
This evidence is consistent with research done on women leaders in the private sector.
However, there remains varying degrees of expected growth in the private sector
within the literature which may be a result of the different types of industries analysed
and the role of women leaders within these subcategories. Flabbi et al. (2014) finds
that in Italian automobile manufactories, having women in top corporate jobs causes
firms to increase their sale per worker by 14.2% for firms that have at least a 20%
female workforce (Flabbi et al. (2014); pg. 30). This is attributed to women CEO’s
increased awareness of female workers’ productivity which in turn creates a more
efficient workforce. Dezsö and Ross (2012) also finds a positive correlation between
economic gains and female representation in top management positions. The paper
argues that female leadership brings informational and social diversity to the top
management team, enriches behaviour of managers throughout the firm, and
motivates women in middle management. This leads to a 1.19% increase in the
company’s value, particularly in firms with a strategy focused on innovation (Dezsö and
Ross (2012); pg. 1080). The implications of the results from the literature and this
study are that firms should promote female leadership to increase their own growth.
The effects of female leadership in the public sector are not statistically significant in
this study and therefore no conclusions can be drawn. The difference in the public and
private sector may be explained by institutional constraints women face in the non-
democratic governments, where the share of women leaders in the public sector is the
highest. This may misrepresent the data as there are other factors at play in institutions
that contribute to economic decline and share of women in power. The three countries
with highest female representation are Rwanda with 64% of women, followed by
Bolivia at 50% and Cuba at 49% which also have low levels of democracy (Inter-
Parliamentary Union 2016) (The Economist Intelligence Unit 2015). The negative and
insignificant results differ from the literature. The studies conducted in Clots-Figueras
AVRIL ESPINOSA-MALPICA │ DECEMBER 9, 2016
[17]
(2012) and Holman (2014) took place in India and the United States respectively,
which rank well in terms of democracy according to The Economist Intelligence Unit
(2015). These studies would thus be reflective of the positive attributions female
leaders in the public sector have in GDP in democratic countries. Additional work
remains to be done in this subject to explain how different governmental institutions
affect the role of female leadership in the public sector.
The case for gender equality has long been argued, the suffragette movement
asserted women’s roles to be beyond those of child-rearing and taking care of the
home. ‘Because it is 2016’3, many would argue we are now beyond such debates and
gender parity should be mainstreamed and universally accepted. Yet the fact remains
that the gap persists in top leadership positions. This paper analyses empirically that
the case for morality is supplemented by the economic gains. In a time where
resources are scarce and economic development an international topic, reflected by
the UN’s Sustainable Development Goals for example, exploiting this readily available
human capital resource is an empirically sound choice. Half the population is set to
contribute; women can lead growth.
3 On November 4, 2015, Canadian Prime Justin Trudeau stated “Because it’s 2015” as an
explanation for his newly formed gender equal cabinet. This highlighted the importance of gender parity in the modern era.
UBC ECONOMICS 490 : SEMINAR IN APPLIED ECONOMICS │ RESEARCH ESSAY
[18]
REFERENCES
Beaman, Lori, Raghabendra Chattopadhyay, Esther Duflo, Rohini Pande, and Petia
Topalova. 2009. “Powerful women: Does exposure reduce bias?” The
Quarterly Journal of Economics, 124 (4): 1497-540.
Clots-Figueras, Irma. 2012. “Are female leaders good for education? Evidence from
India.” American Economic Journal: Applied Economics, 4 (1): 212-44.
Dezsö, Cristian L. and David Gaddis Ross. 2012. “Does female representation in top
management improve firm performance? A panel data investigation.” Strategic
Management Journal, 33 (9): 1072-89.
The Economist. 2006. “The importance of sex; Women in the workforce.” The
Economist, 379(8473):16.
The Economist Intelligence Unit. 2015. Democracy Index 2015: Democracy in an age
of anxiety. London: The Economist.
Flabbi, Luca, Mario Macis, Andrea Moro, and Fabiano Schivardi. 2014. "Do Female
Executives Make a Difference? The Impact of Female Leadership on Gender
Gaps and Firm Performance." Institute for the Study of Labor, 8602:1-30.
Feenstra, Robert C., Robert Inklaar and Marcel P. Timmer. 2015. "The Next
Generation of the Penn World Table" American Economic Review.
105(10):3150-3182. http://www.rug.nl/ggdc/productivity/pwt/ (accessed
September 27, 2016).
Goldin, Claudia. 2006. “The quiet revolution that transformed women's employment,
education, and family.” The American Economic Review, 96 (2): 1-21.
Grant Thornton. 2016. Women in business: Turning promise into practice. London:
International Business Report.
Holman, Mirya R. 2014. “Sex and the city: Female leaders and spending on social
welfare programs in U.S. municipalities.” Journal of Urban Affairs, 36 (4): 701-
15.
Inter-Parliamentary Union (IPU). 1990-2016. “Women in parliaments are the
percentage of parliamentary seats in a single or lower chamber held by
women.” World Bank.
http://databank.worldbank.org/data/reports.aspx?source=2&series=SG.GEN.P
ARL.ZS&country=# (accessed October 13, 2016).
International Labour Organization (ILO). 1998-2014. “Female share of employment in
senior and middle management (%).” ILOSTAT.
http://www.ilo.org/ilostat/faces/help_home/data_by_subject/subject-
AVRIL ESPINOSA-MALPICA │ DECEMBER 9, 2016
[19]
details/indicator-details-by-
subject?subject=EMP&indicator=EMP_XFMG_NOC_RT&datasetCode
=YI&collectionCode=YI&_afrLoop=140470035586380#!%40%40%3Findicator%3DEM
P_XFMG_NOC_RT%26subject%3DEMP%26_afrLoop%3D140470035586380
%26datasetCode%3DYI%26collectionCode%3DYI%26_adf.ctrl-
state%3Dpqz1fbyxd_292 (accessed October, 7, 2016).
Niederle, Muriel, Carmit Segal, and Lise Vesterlund. 2013. “How costly is diversity?
Affirmative action in light of gender differences in competitiveness.”
Management Science, 59 (1): 1-16.
OECD. 2012. Closing the Gender Gap. Paris: OECD Publishing.
Post, Corinne. 2015. “When is female leadership an advantage? Coordination
requirements, team cohesion, and team interaction norms.” Journal of
Organizational Behavior, 36 (8): 1153-1175.
Statistics Canada. 2010-2014. “Gross Domestic Product.” Government of Canada.
https://www.ic.gc.ca/app/scr/sbms/sbb/cis/gdp.html?code=11-91&lang=eng
(accessed November 23, 2016).
UN Women. 2016. Facts and Figures: Leadership and Political Participation. New
York: United Nations.
World Bank. 1966-2015. “GDP (current US$).” World DataBank.
http://databank.worldbank.org/data/reports.aspx?source=2&series=NY.GDP.M
KTP.CD&country= (accessed November 3, 2016).