women and academic publishing: preliminary results from … · · 2010-02-101 women and academic...
TRANSCRIPT
1
Women and Academic Publishing:
Preliminary Results from a Survey of the ISA Membership1
Kathleen J. Hancock Colorado School of Mines
Matthew Baum Harvard University
1 Prepared for the International Studies Association annual convention, New Orleans, LA, February 17-20, 2010.

2
Numerous studies covering a variety of social and physical sciences have regularly concluded two major things about women and academia: (1) women publish less than men, and (2) women make up declining percentages of the professorate as we move up the ladder from assistant to associate to full professor. There are two broad sets of answers to why more women aren’t getting tenure and being promoted: First, it may be the case that women are choosing to leave what has been documented in several studies as an inhospitable–chilly–environment for women, opting instead for careers with warmer climes. Second, perhaps they are being forced out of academia via tenure denial because they are unable to produce enough research or of a type and quality that their colleagues decide merits tenure. While both answers most likely play a role in understanding what has been termed the leaky pipeline, our paper focuses on those women who wish to remain in academia, regardless of how friendly or unfriendly the institutional climate, but do not make it past the assistant professor rank.
Among those women who do not get tenure despite their desire to achieve it, some may be denied because of extremely poor teaching or service records. However, it is more likely, given the imperative of a strong research record for tenure, that productivity is at issue, whether because a woman clearly does not produce at the required rate, or because her productivity is marginally acceptable, perhaps opening the door for discrimination based on gender, personality type, views about mothers, etc. Our 2009 survey of the members of the International Studies Association (ISA) and subsequent analysis addresses this issue in two ways. First, we wanted to see if women are in fact producing at lower rates than men in international studies, as the literature finds happens in many disciplines. Second, we wanted to understand what factors affect publication rates during the assistant professor years. We focused on the assistant professor years because if women do not publish enough early in their careers, they are presumably far less likely to have long-term academic careers. Our findings suggest a variety of ways in which universities might change their policies to better aid assistant professors in achieving research records that will earn them tenure, and in which individual scholars might think strategically about their research and publications. Women Publish Less and Are Less Apt to Earn Tenure The leaky pipeline has become a common term to explain the loss of women in the physical sciences, technology, engineering and mathematics as they make their way through the professional pipeline from undergraduate to the highest reaches of academia.2 In 1999, MIT published the study that pushed many political leaders, university administrators, and scholars to pay attention to this deficit. That report showed that women comprised 7.5% of the School of Science faculty in 1985, a percentage that barely changed during the following decade.3
Less noticed in the U.S. press is a similar pattern in many of the social sciences, including political science, its subfield of international relations, and the multidisciplinary international studies programs. In these areas, we see a similar pattern of the percentages of women declining as one moves up the academic ladder, from student to full professor. This is particularly true at the most prestigious, research-oriented universities. For example, a 2007 report by the Committee on
2 Marc Goulden, Karie Frasch, and Mary Ann Mason, "Staying Competitive: Patching America's Leaky Pipeline in the Sciences," Center for American Progress, http://www.americanprogress.org/issues/2009/11/women_and_sciences.html. 3 "A Study on the Status of Women Faculty in Science at MIT," (Massachusetts Institute of Technology, 1999).

3
Science, Engineering, and Public Policy stated that “for over 30 years, women have made up over 30% of the doctorates in social sciences and behavioral sciences….yet, at the top research institutions, only 15.4% of the full professors in the social and behavioral sciences are women.”4 In many but not all of the social sciences, women receive a similar or higher percentage of PhD’s than men. In 2002, women attained 42% of the PhDs in Political Science, 67% in psychology, 61% in sociology, 58% in American Studies and in Anthropology, 28% in economics, and 24% in history.5 Most ISA members received their doctorates in Political Science. The American Political Science Association (APSA) found that political science has made relatively little progress in increasing the percentage of female tenure-tracked faculty. “In 2001, women were 24 percent of all full-time faculty, an increase of just 6 percent over 1991. The percentage of women assistant professors has stalled at about 35 percent over the past five years.”6
Publishing may well be the Achilles heal of women scholars. In nearly every discipline and type of institution, research is the decisive factor in tenure, promotion, and salary decisions, a finding supported by numerous studies using statistical analysis and interviews.7 If a tenure candidate’s colleagues determine his or her research to be inadequate, no amount of teaching or service will overcome this deficiency. On the other hand, “excellent research will counterbalance almost all other deficiencies.”8
This focus on research suggests that one of the chief causes behind women’s underrepresentation at higher levels of academia may be research productivity. If women are not publishing as effectively as their male counterparts, they are vulnerable to being denied tenure
4 "Beyond Bias and Barriers: Fulfilling the Potential of Women in Academic Science and Engineering," (Committee on Science, Engineering, and Public Policy (COSEPUP), 2007). 5 Division of Science Resources Statistics National Science Foundation, Science and Engineering Doctorate Awards: 2002, Publication 04- 303 (Arlington, VA: National Science Foundation, 2003), Mary Frank Fox, "Gender, Faculty, and Doctoral Education in Science and Engineering," in Equal Rites, Unequal Outcomes: Women in American Research Universities, ed. L. Hornig (New York: Kluwer Academic/Plenum Publishers, 2003), ———, "Women, Science and Academia: Graduate Education and Careers," Gender and Society 15, no. 5 (2001). 6 American Political Science Association, "Women's Advancement in Political Science: A Report on the APSA Workshop on the Advancement of Women in Academic Political Science in the United States," (2005), iii. 7 Two-year colleges are the one exception to this rule. E. L. Boyer, The Undergraduate Experience (New York: Oxford University Press, 1986), ———, Scholarship Re-Considered: Priorities of the Professoriate (Princeton, NJ: Carnegie Foundation for the Advancement of Teaching, 1990), Carnegie Foundation, The Condition of the Professoriate: Attitudes and Trends 1989 (Princeton, N.J.: Carnegie Foundation for the Advancement of Teaching, 1989), F. Daly and B. K. Townsend, "The Chair's Role in Tenure Acquisition," Thought and Action 9 (1994), W. T. Daly, "Teaching and Scholarship: Adapting American Higher Education to Hard Times," Journal of Higher Education 65, no. January-February (1994), A. L. Gabbin, S. N. Cairns, and R. L. Benke, eds., Facutly Performance Indicators (Harrisonberg, Va.: Center for Research in Accounting Information, James Madison University,1990), K. L. Kasten, "Tenure and Merit Pay as Rewards for Researching, Teaching, and Service at a Research University," Journal of Higher Education 55, no. July-August (1984), L.S. Lewis, "Academic Tenure: Its Recipients and Effects," Annals of the American Academy of Political and Social Sciences 448 (1980), D. A. Verrier, "Perceptions of Life on the Tenure Track," Thought and Action 9 (1994), Shelley M. Park, "Research, Teaching, and Service: Why Shouldn't Women's Work Count?," Journal of Higher Education 67, no. 1 (1996): 48. 8 Park, "Research, Teaching, and Service: Why Shouldn't Women's Work Count?," 48.

4
and promotion to higher levels. Indeed, numerous studies have found that women underperform their male colleagues in numbers of publications. In a 1990 article, Svein Kyvik reports that “virtually all studies that have examined scientific publishing among men and women [social and physical] scientists have found that men are more productive than women.” More than fifty studies from the 1980’s, in both the United States and Europe, found that male scientists on average published 40-60% more articles than their female counterparts.9 While recent research suggests that women are catching up and in some subfields may publish at rates comparable to their male colleagues, most reports show that women continue to be less productive (at least in publishing) in most areas of academia.10
Our Survey of International Studies Association Members
To understand whether women underperform men in terms of articles and books published, and the possible causes behind any such lower publication rates, we conducted a survey of the ISA membership in September of 2009, using Survey Monkey (www.surveymonkey.com). The survey was titled “How Do They Do It?: Traits of Prolific Publishers.” While this paper focuses on women, we were interested in collecting data that would help all assistant professors succeed. We emailed a link to the survey (presented in the Appendix) to the full membership of ISA (roughly 5,000 individuals).11 The ISA represents scholars in 80 countries and is, according to its website, “the most respected and widely known scholarly association in this field.”12 Our survey included nearly 60 questions, all focused on the assistant professor years, about articles and books published, work environment, work habits, personal circumstances (marriage, children, etc.), and research focus.
To evaluate research productivity, we asked respondents how many of the following publications they had authored during their years as an assistant professor: (1) books, (2) book chapters, (3) peer-reviewed articles, (4) non-peer-reviewed articles, (5) review articles, and (6) book reviews. In the case of books and articles, we asked respondents how many of these publications were single-authored and how many co- or multi-authored. We then created several publication indexes based on an informal survey of how senior faculty weight various types of publications when rendering tenure decisions. We discuss below the details of the indexes as well as our conjectures on what factors affect publication rates and our findings.
We received 1475 responses, of which 359 were current students and hence automatically excluded from our analyses of assistant professors. An additional 223 respondents indicated that they had never been an assistant professor. This left 893 potentially valid respondents. Additional dropped data, due primarily to institutional differences that rendered many questions
9 Jonathan. R. Cole and Harriet Zuckerman, "The Productivity Puzzle: Persistence and Change in Patterns of Publications of Men and Women Scientists," in Advances in Motivation and Achievement, ed. Martin L. Maehr and Marjorie W. Steinkamp (Greenwich, CN: JAI Press, 1984), Svein Kyvik, "Motherhood and Scientific Productivity," Social Studies of Science 20, no. 1 (1990), M. N. Franklin, The Community of Science in Europe: Preconditions for Research Effectiveness in European Community Countries (Aldershot, UK: Gower, 1988). 10 Giovanni Abramo, Ciriaco Andrea D'Angelo, and Alessandro Caprasecca, "Gender Differences in Research Productivity: A Bibliometric Analysis of the Italian Academic System," Scientometrics 79, no. 3 (2009). 11 While the ISA Governing Council approved our use of their membership e-list, they did not review the specifics of the survey. 12 http://www.isanet.org/

5
inapplicable to a subset of respondents (we believe most of these are at universities outside the U.S.) resulted in a maximum of 766 observations for any of our post-filtered variables. About 60% of our overall respondents were male (65% of the qualifying cases).
DESCRIPTIVE RESULTS Before turning to our analysis that evaluates how various factors affect a scholar’s productivity, we summarize here some of the descriptive results from the survey. Prior to 2009, the ISA did not regularly collect data on its members. While it now asks members for some basic information, ISA’s data gathering does not cover many of the questions we included in our survey. Where ISA has summarized its early data gathering, we compare our results with its findings. Women in International Studies Women make up 40% of our respondents. The percentages vary significantly, however, when we break down membership by career position. (See Figure 1.) At the student level and among post-doctoral fellows, women accounted for nearly half the population (49%). However, as we move up to full professor, the percentage of women declines with each level. Of our respondents, women account for 43% of assistant professors, 34% of associate professors, and 23% of full professors. Among non-tenure stream appointments, such as visiting professors, women accounted for only 35% of the population. These differences between men and women are statistically significant for all but non-tenure stream and independent researchers.13
As shown in Figure 2, our survey indicates different distributions for the various positions for men and women. For women, 30% of the ISA members are students, 24% assistant professors, 13% associates, and 11% full professors. These numbers reflect the declining percentages as
13 Students are significant at p<.001; assistant professor, p<.05; associate professors, p<.05; full professor, p<.001; post-doc, p<.05.
0% 20% 40% 60% 80% 100%
Figure 1: What Is Your Current Position?
Male
Female

6
women move up the career ladder. Men are more evenly divided among the various ranks: 20% are students, 21% assistant professors, 17% associates, and 23% full professors.
Our numbers on percentage of full professors differ from those recently collected and reported on by ISA. Of ISA’s 5,268 members, 59% (3,091) had submitted data as of November 2009.14 Of the 1,835 male members who supplied information, 14% are full professors; of the 1,250 female members who responded, 7% are full professors.15 This early analysis did not include percentages for the other ranks. The difference between our findings and those of ISA suggests that our survey may have received a relatively high percentage of responses from full professors. This high response rate among full professors, in turn, may have resulted from the way we framed the survey, with its focus on what traits make for prolific publishers. Full professors might justifiably have felt that they have something to contribute on this issue and therefore been more responsive to our survey relative to ISA’s request for demographic information. On the other hand, the ISA figures could be under-representing full professors in the ISA membership. While their n is substantially larger than ours, it is possible that full professors have been slow to submit data to ISA. New members, who are more likely to be students or new professors, may be accounting for a larger percentage of respondents than the true count for ISA members. As ISA continues to collect data on its membership, the actual percentages should become clearer.
Career and Education According to the survey, 90% of ISA members have PhDs in Political Science, Government, or International Relations. Sociology, Economics, History, and Communications claim 1-2% each of the membership. In terms of the ranking and location of the university from which respondents earned their degrees, there is a nearly even divide among those who earned their PhDs at top-10 universities in the US, top-50 universities in the US, and outside the US, with each group accounting for 29-32% of members who have already earned their degrees; the
14 Meredith Reid Sarkees, "Report of the Committee on the Status of Women in the Profession," (November 27, 2009). Unpublished report. 15 ISA Committee on the Status of Women in the Profession, "Committee on the Status of Women Report/Recommendations, Report to the ISA Governing Council," (December 2009).
0% 10% 20% 30% 40%
Figure 2: Percent of ISA Membership
Female
Male

7
remaining group have degrees from American universities ranked below the top-50 (see Figure 3). In future surveys, we would want to know more about the type and location of non-US universities from which nearly a third of respondents graduated. The differences between genders are statistically significant for Top-10 PhD (p<.01) and Below-50 PhD (p<.06)
As shown in Figure 4, both male and female respondents were primarily employed at PhD-granting institutions. Slightly higher percentages of women than men started their careers at liberal arts and MA-granting schools, whereas a slightly higher percentage of men were at BA-granting institutions. The strong representation of PhD-granting institutions is consistent with the focus of ISA, which is primarily about presenting research, an endeavor generally considered more important at PhD-granting universities than others institutions.16 The gender gaps in Figure 3 are statistically significant for all but BA/BS; for Liberal Arts, p<.01; for Masters, p<.10; and for PhD, p<.05.
16 The survey did not include the option of a 2-year Associates of Art (AA) degree-granting college. Since only a handful of respondents did not answer this question, either very few respondents were Assistant Professors at these institutions, or if they were, they opted to choose one of the other selections. Future surveys will include this option.
0% 5% 10% 15% 20% 25% 30% 35%
US Top-‐10 US Top-‐50 US Below-‐50 Outside US
Figure 3: Where Did You Earn Your PhD?
Female
Male
0% 10% 20% 30% 40% 50% 60% 70% 80%
Liberal Arts
BA/BS Masters PhD
Figure 4: As an Assistant Professor, at what type of university did you work?
Female
Male

8
Geographic Location Most respondents (61%) indicated they have worked primarily in the United States since completing their Ph.D.s (Figure 5). Western Europe was the second most frequently selected location, accounting for 18% of respondents. The other locations ranged from 1-4%: Asia, 4%; Middle East, Eastern Europe & Russia, and Latin America, each with 2%; and Africa, 1%. There were no statistically significant differences between men and women.
Age Although some studies have shown that the average age for scholars is virtually the same for men and women (45-46),17 we found different age profiles for our male and female respondents (Figure 6). Women tended to be younger, with 67% of women 40 or under, compared to 53% for men. The mid-range age of 41-50 accounts for 20-22% of both women and men. Men have a higher percentage at the older ages, with 25% of men over 50 compared to 14% of women. Gender differences were significant for all but the 40-50 group; overall (not shown), under 40, and over 50, p<.001.
17 Kyvik, "Motherhood and Scientific Productivity," 154.
2%
2%
3%
4%
9%
18%
61%
E. Europe and Russia
Latin America
Africa/Middle East
Asia
Other
W. Europe
United States
Figure 5: Where did you work the majority of your post-graduate years?
0% 10% 20% 30% 40% 50% 60% 70% 80%
Under 40 41-‐50 over 50
Figure 6: Age at time of survey
Female
Male

9
Children Consistent with other literature on the subject, we found that ISA members tend not to have young children while they are assistant professors (Figure 7). The percentages are higher for women than men, with 62% of women reporting they had no children under age 5, and 51% of men reporting the same. Men were thus more likely to have one or more children who were not yet in school. Men and women were about equally likely to have one child (20% and 18%, respectively). More men reported larger families, with 29% having two or more children under age 5, compared to 20% for women. These gender differences are statistically significant for no children (p<.01), two children (p<.06), and three children (p<.01).
Our survey asked respondents to indicate how many hours a week their children were in the care of someone other than themselves. Women indicated much more than men that their children spent significant hours in daycare, with nannies, with other family members, or otherwise not with them. We found that 60% of women, compared to 32% of men, said their children were in someone else’s care for 30 or more hours a week. 38% of men reported 10 hours or less compared to 10% for women. The overall differences between men and women were significant at p<.001, as were the differences at 10 or less hours and at 31-40 hours.
0% 10% 20% 30% 40% 50% 60% 70%
0 1 2 3 4+
Figure 7: How many children under 5 years old did you have as an Assistant Professor?
Female
Male
0% 10% 20% 30% 40% 50% 60%
10 or less
11-‐20 21-‐30 31-‐40 41-‐50 over 51
Figure 8: How many hours were your children in the care of someone other than you or your spouse/
partner?
Female
Male

10
Research Focus The vast majority of respondents -- 76% of women and 60% of men -- indicated their primary methodology was qualitative. Only 17% of women indicated they primarily use quantitative, compared to 27% for men. We gave scholars several options, including formal modeling, experimental, counterfactual analysis, pure theory, legal analysis, and ethical analysis. Of these, formal modeling was selected by 4% of men and less than one percent of women; 3% of men indicated pure theory, as did 2% of women; all others received 0-2%. In Figure 9, “Other” represents all of these other methodologies plus those who selected the option “Other.” The differences in men and women for both qualitative and quantitative methods are significant to p<.001.
CONJECTURES In analyzing what factors may account for higher publication rates, we tested 17 conjectures, organized into 4 models based on similar clusters of variables: work environment, work habits, personal circumstances, and research focus. Our data allow us to consider several factors within each of these categories. A. Work Environment A professor’s work environment would presumably affect how much publishing he or she accomplishes, by setting particular research and teaching expectations for tenure, by providing leave time for research-focused activity, and enacting policies that support research. We looked at 6 ways in which the work environment might affect publication records. 1. Department’s research expectations: We speculated that the more research a department expects from its scholars, the more likely the faculty will focus large percentages of their time on research, which will then translate into a higher publication rate. To measure this in the survey, we asked respondents to identify how much time, as a percentage of their work week, their university expected them to devote to research. We also asked about official policies and found that faculty often believed that a higher percentage of their time was actually supposed to be
0%
20%
40%
60%
80%
Qualitative Quantitative Other
Figure 9: What methodology did you primarily employ in your publications?
Female
Male

11
spent on research as opposed to teaching and service than the policy stated. This is consistent with the widespread assumption -- stated at the beginning of this paper -- that research is necessary, and can be sufficient, for tenure. 2. University type: In addition to asking respondents about expectations set by their department, we asked them what type of university they taught at: small liberal arts, Baccalaureate, Master’s, or PhD-granting institution. Some research suggests that having a higher percentage of women at either the institution as a whole or in the scholar’s particular department may help women publish at higher rates. Gander found that the one type of institution where women out-publish men is at liberal arts colleges, where women are employed at proportionately higher rates than men.18 However, since we are comparing publications overall, rather than within an institution, we expected to find that professors at the first three types of institutions (liberal arts, BA/BS-, and MA-granting) would publish less than those at PhD-granting universities, where the research requirements are more demanding. 3. Teaching load: Universities require a range of teaching loads for their faculty. The higher the teaching load, the less we expected scholars to publish. We gave respondents a range of options from 4 courses for one semester and 3 the next (a 4/3 load) and higher, down to 1 course each semester or less. We asked respondents who teach on a quarter system to make a rough estimate of their equivalent teaching load. In a follow up email message to prospective respondents, we asked faculty who teach at institutions where they do not set teaching requirements in the same way (for example, in many European universities) to estimate rough equivalents to these teaching loads. While the lowest teaching loads are presumably at top-10 research universities, lower ranked PhD-granting universities, as well as the liberal arts, BA/BS-granting, and Masters-granting institutions offer a wide-variety of course loads, running from 4/4 to 2/2. Thus, while there might be significant overlap between university type and teaching load, there is also some variation that we wanted to capture with this question. 4. Leave time: We speculated that the more research leave time a faculty member was granted, either by the university through faculty development programs or earned through grants that buy out courses, the more the faculty member would publish. With this additional time to focus on research and writing, faculty should be able to produce more articles/books and/or improve the quality of their work leading to more accepted publications. 5. Same-sex mentor: Research has shown that women tend to publish more in professions dominated by women or in institutions (mostly liberal arts colleges) where women comprise a majority of the faculty. Studies have also shown that female faculty are more apt to mentor women than are their male colleagues, and that they spend more time mentoring than their male colleagues. Long found that collaboration with a mentor is the most important factor affecting productivity.19 Finally, “female graduate students often have a harder time than males finding
18 James P. Gander, "Faculty Gender Effects on Academic Research and Teaching," Research in Higher Education 40, no. 2 (1999): 180. 19 J. Scott Long, "The Origins of Sex Differences in Science," Social Forces 84, no. 4 (1990), Cheryl D. Young, "An Assessment of Articles Published by Women in 15 Top Political Science Journals," PS: Political Science and Politics 28 (1995).

12
and developing meaningful mentoring relationships….”20 Consistent with Long’s analysis, a 2005 APSA report concluded that one of the three critical factors that add to the leaky pipeline after women take faculty positions is an inhospitable institutional climate that offers too few mentoring opportunities and other interventions to keep faculty on track for tenure.21 In particular, the report cited the lack of mentoring opportunities.
Female faculty have been shown to play a critical role in improving the experience of female graduate and undergraduate students and increasing the likelihood they will graduate in that particular major. Based on a survey of 1,215 faculty in five science and engineering fields, Fox finds that “women faculty reported acting as primary research advisors for a larger number of women graduate students than did men, and also had larger number of women students on their research teams. Further, women faculty put significantly more emphasis upon giving help to advisees across areas, not only in designing, executing, and publishing research but also in gaining social capacities, including participating in laboratory meetings, making presentations, and interacting with faculty.”22
Based on these findings, we conjectured that women who reported having female mentors in graduate school and/or as assistant professors would have higher publication rates than those who either had no mentor or a male mentor. 6. Tenure clock: Many universities now allow tenure-track faculty to stop the tenure clock when they have a child. For most universities, parents can stop the clock for one year; a few allow new parents to stop it for one year per child, up to two or even three children. While one might expect that those stopped the clock had higher publication rates, we expected the reverse: those who stopped the clock would have lower publication rates. Research shows that many see it as a stigma to have to stop the clock and thus avoid requesting this unless absolutely necessary. Therefore, we speculated that those who stopped the clock had published less than their counterparts who did not think they needed the clock stopped in order to earn tenure. B. Work Habits 7. Hours spent on research: We conjectured that simply working more hours per week on conducting and writing up research would lead to higher publication rates. If women published less, perhaps it was simply because they did not work as many hours on research as men. This conjecture suggests that it does not matter why faculty cannot give as much time to research–it could be childcare, housework, different expectations–only that they are dedicating fewer hours
20 A. Lanethea Mathews and Kristi Andersen, "A Gender Gap in Publishing? Women's Representation in Edited Politial Science Books," PS: Political Science and Politics 43, no. 1 (2001). Their conclusion is based on research reported in Elizabeth G. Creamer, Assessing Faculty Publication Productivity: Issues of Equity, Ashe-Eric Higher Education Report 26(2) (Washington, DC: Graduate School of Education and Human Development, George Washington University, 1998), APSA Committee on the Status of Women, "Improving the Status of Women in Political Science: A Report with Recommendations " PS: Political Science and Politics 23 (1992). 21 American Political Science Association, "Women's Advancement in Political Science," iii. 22 Mary Frank Fox, "Institutional Transformation and the Advancement of Women Faculty: The Case of Academic Science and Engineering," in Higher Education: Handbook of Theory and Research, ed. J.C. Smart (Springer Netherlands, 2008), 73. Her findings were originally reported in Fox, "Gender, Faculty, and Doctoral Education in Science and Engineering."
13
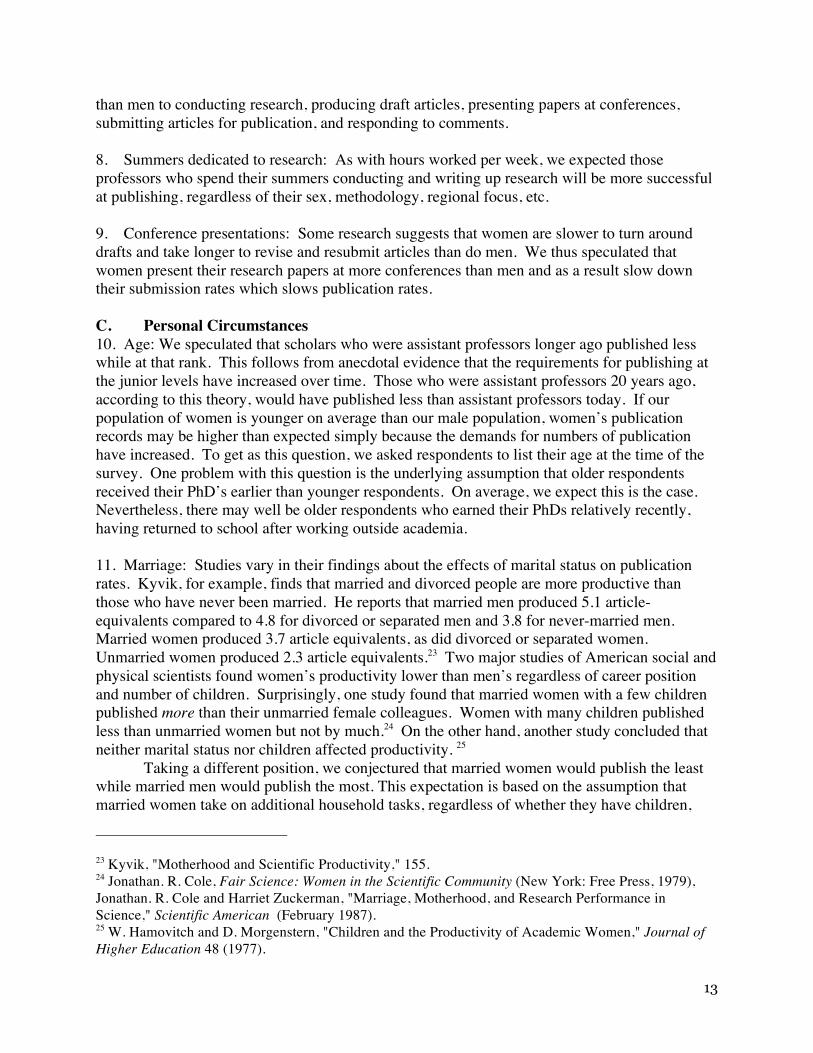
than men to conducting research, producing draft articles, presenting papers at conferences, submitting articles for publication, and responding to comments. 8. Summers dedicated to research: As with hours worked per week, we expected those professors who spend their summers conducting and writing up research will be more successful at publishing, regardless of their sex, methodology, regional focus, etc. 9. Conference presentations: Some research suggests that women are slower to turn around drafts and take longer to revise and resubmit articles than do men. We thus speculated that women present their research papers at more conferences than men and as a result slow down their submission rates which slows publication rates. C. Personal Circumstances 10. Age: We speculated that scholars who were assistant professors longer ago published less while at that rank. This follows from anecdotal evidence that the requirements for publishing at the junior levels have increased over time. Those who were assistant professors 20 years ago, according to this theory, would have published less than assistant professors today. If our population of women is younger on average than our male population, women’s publication records may be higher than expected simply because the demands for numbers of publication have increased. To get as this question, we asked respondents to list their age at the time of the survey. One problem with this question is the underlying assumption that older respondents received their PhD’s earlier than younger respondents. On average, we expect this is the case. Nevertheless, there may well be older respondents who earned their PhDs relatively recently, having returned to school after working outside academia. 11. Marriage: Studies vary in their findings about the effects of marital status on publication rates. Kyvik, for example, finds that married and divorced people are more productive than those who have never been married. He reports that married men produced 5.1 article-equivalents compared to 4.8 for divorced or separated men and 3.8 for never-married men. Married women produced 3.7 article equivalents, as did divorced or separated women. Unmarried women produced 2.3 article equivalents.23 Two major studies of American social and physical scientists found women’s productivity lower than men’s regardless of career position and number of children. Surprisingly, one study found that married women with a few children published more than their unmarried female colleagues. Women with many children published less than unmarried women but not by much.24 On the other hand, another study concluded that neither marital status nor children affected productivity. 25
Taking a different position, we conjectured that married women would publish the least while married men would publish the most. This expectation is based on the assumption that married women take on additional household tasks, regardless of whether they have children,
23 Kyvik, "Motherhood and Scientific Productivity," 155. 24 Jonathan. R. Cole, Fair Science: Women in the Scientific Community (New York: Free Press, 1979), Jonathan. R. Cole and Harriet Zuckerman, "Marriage, Motherhood, and Research Performance in Science," Scientific American (February 1987). 25 W. Hamovitch and D. Morgenstern, "Children and the Productivity of Academic Women," Journal of Higher Education 48 (1977).

14
whereas married men are more likely to benefit from spouses that perform the majority domestic household tasks, thus freeing up men to focus on their research.
Of course this is a stereotype and many men do an equal share of the work. Nevertheless, many studies support our assumption. For example, in a January 2010 article, Schielbinger and Gilmartin find that at the assistant professor level in dual-career families, female scientists do 57-59% of the housework compared to 33-35% for male scientists in dual-career families.26 Men with stay-at-home spouses have the best deal, with their wives covering 75% of the cooking, 71% of the cleaning, and 84% of the laundry. This equated to male scientists working 4.5 hours a week on household tasks and enjoying about 14 hours a week of household work from their spouses. Women with stay-at-home spouses reported nearly the same benefits, but fewer academic women than men have that relationship.27 Nerad found that 89% of female political science faculty reported having a spouse who works full-time compared to 50% of male faculty. Women faculty who were married were more likely to have spouses with degrees associated with demanding jobs: Ph.D., M.D., and J.D.: 41% of women had spouses with these degrees, compared to 16% for men.28 12. Children: We conjectured that having children distracts from the time one can give to research and thus expected to find that those with more children published less. Some research has shown that men with children produce more than men without children, whereas women with children produce less than their childless counterparts. The 2005 APSA report concluded that there is a “chronological crunch in which the most intense demands for research, publications, and service in tenure-track positions overlap with the years of heaviest family responsibilities.”29 Women were less likely to have children in graduate school than were men, making it more likely that if they planned to have families, they would be doing so during their assistant professor years.30
Some previous studies on the effects of children did not take into account the age of the children or the stage of one’s career at which the faculty member has the children, two factors we consider important for assessing publication rates. Newborns and toddlers require considerably more time to parent than older children. Until children are old enough to be enrolled full-time in public schools (around age 5-6), parents with careers must either take time from their paid jobs to parent their own children or find reliable childcare, whether family members, daycare centers, or paid in-home care (nannies, au pairs, babysitters). While teenage children pose their own challenges for parents, they are not nearly as time-consuming as newborns, infants, and toddlers. Furthermore, we think it is important to focus on the assistant professor years, when one is
26 Londa Schiebinger and Shannon K. Gilmartin, "Housework Is an Academic Issue: How to Keep Talented Women Scientists in the Lab, Where They Belong," Academe Online January-February (2010): Figure 3. 27 Ibid.: Figure 2. 28 Maresi Nerad, "The Advancement of Women Ph.D.s in Political Science: Defining the Problem" (paper presented at the APSA Workshop on Women’s Advancement in Political Science, Washington, DC, March 2004). 29 American Political Science Association, "Women's Advancement in Political Science," iii. 30 Ibid., 5-6.

15
establishing her reputation and vying for tenure. At this stage, more than others, young children would presumably have a more significant negative effect on publishing.31
13. Children under 5 and primary caregiver: Consistent with societal expectations, Scheibinger and Gilmartin find that women assume a disproportionate share of child care. They found that “women scientists do 54 percent of parenting labor in their households, and men scientists do 36 percent (“parenting labor” refers to physical, psychosocial, and intellectual responsibilities).”32 These heavier parenting responsibilities negatively affect tenure. Mason and Goulden show that women who have children within five years of receiving their doctorate are less likely to achieve tenure than are men with “early babies.”33 Similarly, Williams reports that “women who have children soon after receiving their PhDs are much less likely to achieve tenure than men who have children at the same point in their careers.”34 We thus speculated that those who identified themselves as the primary caregivers–the one who “ primarily took care of your children when they were sick, woke up in the night, and otherwise needed parenting”–would have lower publication rates, regardless of whether they are male or female.
14. Paid vs. unpaid childcare: Finally, we wanted to gauge whether using paid childcare (nanny, daycare, preschool) would help or hurt publication rates compared to unpaid care (self-care, family help). While little has been written about this issue in academia, we speculated that those with paid care have more time to dedicate to their scholarly careers, including to research. Those without paid care are either spending their own time on childcare -- which can both reduce time and energy for publications -- or are using family care which we assumed might be less reliable given family members own busy lives. Of course, this last aspect may not be true; there are certainly some grandparents (or aunts and uncles) who are caring for their young relatives nearly fulltime. Research Focus We selected three types of research focus to evaluate: substantive area, methodology, and area of the world. Young speculates that the methodologies that most women employ and the subjects they study may not be considered the best and most important by editors, reviewers, and other gate keepers.35 Sarkees and McGlen find some evidence for this, noting that few articles about women and politics can be found outside the journal Women & Politics.36 However, women write about much more than women and politics. Our survey found that 8% of respondents
31 In their study of social work faculty members, Fox and Faver reported that having younger children is positively related to publication rates. The authors speculate that this counterintuitive finding may be the result of women delaying childbirth until after they have a significant publication record Mary Frank Fox and Catherine A. Faver, "Men, Women, and Publication Productivity: Patterns among Social Work Academics," Sociological Quarterly 26 (1985). 32 Schiebinger and Gilmartin, "Housework Is an Academic Issue: How to Keep Talented Women Scientists in the Lab, Where They Belong." 33 Mary Ann Mason and Marc Goulden, "Do Babies Matter? The Effect of Family Formation on the Lifelong Careers of Academic Men and Women," Academe Online November-December (2002). 34 Joan C. Williams, "Hitting the Maternal Wall," Academe 90, no. 6 (2004). 35 Young, "An Assessment of Articles Published by Women in 15 Top Political Science Journals." 36 Meredith Reid Sarkees and Nancy E. McGlen, "Confronting Barriers: The Status of Women in Political Science," Women & Politics 12, no. 4 (1992).

16
selected “feminist theory and gender studies” as the substantive area in which they mostly publish; an additional 5% identified it as the area in which they published equally with another area. (Not a single man selected this as his main area of publications.) Of course, this could well reflect the challenge of publishing in feminist theory and gender studies, but it seems equally likely that most women choose to research other substantive fields. 15. Substantive area: We offered our respondents 23 areas of research, plus “other,” based on the 23 official sections associated with ISA. Men and women have differing interests in these areas. The most popular substantive areas for women were International Security (18%), International Political Economy (IPE) (10%), Feminist Theory and Gender Studies (8%), Comparative Politics (CP) (7%) and Environmental Studies, International Organizations (IO), and Foreign Policy Analysis (FPA) (each with 6%). For men, the top choices were International Security (22%), IPE (14%), FPA (14%), Scientific Study of International Processes (SSIP) (10%), and CP (7%). We speculated that the most popular substantive areas might be the easiest in which to publish, due to a critical mass of interest and more journals from which to choose. Given this rationale, it is important to consider the top choices overall, rather than by sex. Since men account for twice as many ISA members as women, their preferences tilt the numbers: overall, the top selections are the same as those for men. Thus we speculated that those publishing on international security, IPE, FPA, SSIP, and CP were likely to publish more than those choosing less popular areas of research. 16. Methodology: The two primary methodologies by which international studies scholars identify their work is quantitative and qualitative. In general, we expected qualitative research to take significantly more time to conduct than quantitative research. Qualitative research for international studies scholars often involves reading countless journal articles and books, mastering cases in detail, and conducting time-consuming field research. In contrast, quantitative analysis can be more quickly generated once a scholar obtains access to a database. Clearly there are many exceptions to this assumption: quantitative scholars who create their own databases must spend considerable time collecting data, and all scholars regardless of methodology have to know the literature to which they are speaking. Nevertheless, we speculated that on average, qualitative scholars may spend more time conducting research and analysis, relative to their quantitatively focused colleagues, which in turn may slow their publication rates. On the other hand, we expected qualitative researchers to have the advantage when it comes to publishing books. Books are more likely to center around extensive case study analysis and to include detailed research that is too lengthy to be condensed into articles without losing the meaning of the argument and the extensive detail required for evidence of the author’s theoretical claim. In sum, then, we expected scholars who primarily use qualitative methodologies to publish more books than their quantitative colleagues, and for quantitatively-focused scholars to have the advantage in articles and book chapters. 17. Area of the world: Finally, we considered how one’s focus on a particular state or region of the world would affect a scholar’s productivity. In the survey, we asked respondents to identify the main area of the world they used for data in their publications. We also included two broad categories: global analysis and comparative analysis using several regions. As with the subfield of study, we speculated that scholars who focus on the most popular regions or states would have
17
a publishing advantage. Of the specific states or areas, the Western Europe/Canada ranked first overall, having been selected by 14.4% of respondents; the U.S. was a close second with 14.2%.
Global studies and comparative regional studies were among the top four chosen areas, with global studies selected by 19% of respondents and comparative regional studies by 11%. While these areas were highly popular, we speculated they would not have the same positive effect as the others. Instead they would presumably take more time to master and would thus result in fewer publications.
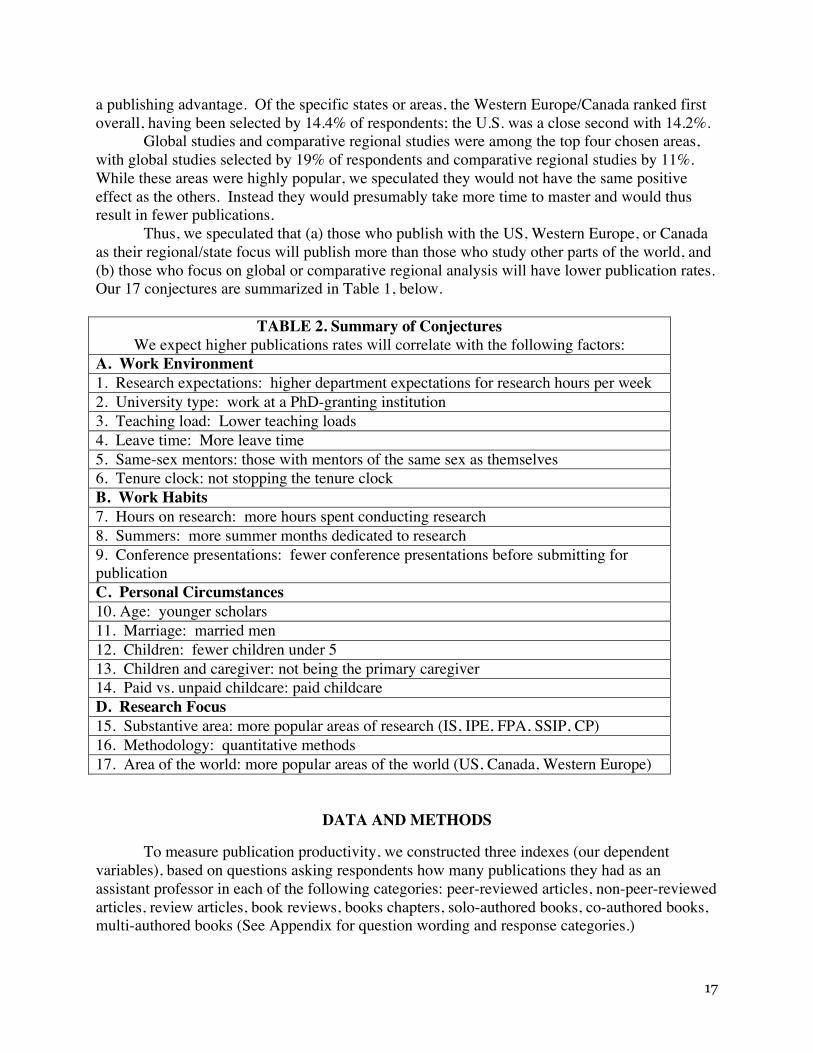
Thus, we speculated that (a) those who publish with the US, Western Europe, or Canada as their regional/state focus will publish more than those who study other parts of the world, and (b) those who focus on global or comparative regional analysis will have lower publication rates. Our 17 conjectures are summarized in Table 1, below.
TABLE 2. Summary of Conjectures
We expect higher publications rates will correlate with the following factors: A. Work Environment 1. Research expectations: higher department expectations for research hours per week 2. University type: work at a PhD-granting institution 3. Teaching load: Lower teaching loads 4. Leave time: More leave time 5. Same-sex mentors: those with mentors of the same sex as themselves 6. Tenure clock: not stopping the tenure clock B. Work Habits 7. Hours on research: more hours spent conducting research 8. Summers: more summer months dedicated to research 9. Conference presentations: fewer conference presentations before submitting for publication C. Personal Circumstances 10. Age: younger scholars 11. Marriage: married men 12. Children: fewer children under 5 13. Children and caregiver: not being the primary caregiver 14. Paid vs. unpaid childcare: paid childcare D. Research Focus 15. Substantive area: more popular areas of research (IS, IPE, FPA, SSIP, CP) 16. Methodology: quantitative methods 17. Area of the world: more popular areas of the world (US, Canada, Western Europe)
DATA AND METHODS
To measure publication productivity, we constructed three indexes (our dependent variables), based on questions asking respondents how many publications they had as an assistant professor in each of the following categories: peer-reviewed articles, non-peer-reviewed articles, review articles, book reviews, books chapters, solo-authored books, co-authored books, multi-authored books (See Appendix for question wording and response categories.)

18
The first dependent variable (which we term the combined publication index), measures all types of publications based on the following weighting scheme: book (solo, co- or multi-authored, up to a maximum of 6 books37)=5 points, peer reviewed article=1 point, non-peer reviewed article=.4 points, book chapter=.6 points, review article=.6 points, and book review=.2 points. We based these weightings on informal conversations with colleagues aimed at getting a general sense of how the various types of publications are weighted, relative to one another, in making tenure decisions. Though the precise values are certainly subject to debate, we are confident that our relative weighting represent reasonable approximations for most top-20 research programs in the United States.38 (Moreover, a variety of tests indicated that minor variations in the weighting scheme had little effect on the results of our analyses.) Nevertheless, it is important to bear in mind that this is an unscientifically constructed weighting scheme (indeed, to our knowledge, so such scheme exists), and hence should be interpreted with due caution.
Our second dependent variable (combined non-book publications) replicates the first, excluding books. Finally, our third dependent variable focuses only on books and is thus labeled the “books only” index. In each case, for our final dependent variables we divide the total index score by the number of years a given respondent reports being an assistant professor, yielding a measure of average publication productivity per year as an assistant professor. For respondents who were formerly assistant professors, we divide by six (the average number of years to tenure for an assistant professor).39 The means, standard deviations, and ranges for the three weighted dependent variables are shown in Table 2a:
TABLE 2a. Summary Statistics for Dependent Variables, Overall
Index (Dependent Variable) Mean Std. Dev. Min. Max.
Combined publications 3.13 2.90 0 23.1
Combined non-book publications 1.74 1.24 0 9.85
Books only 0.30 0.41 0 3.00
37 Ten individuals reported publishing over six books while assistant professors, with one reporting having published 10 books. Since these are extreme outliers and totally obviate the remaining elements of the scale, we recoded these values to 6 books. 38 Kyvik created a similar index. In his formulation, a journal article or a book chapter gets 1 point; a book receives 2-6 points depending on page numbers and type of book (research book=2-6 points, textbook=2-4 points, and edited book=2-3 points). A report receives 1-6 points, using the page and type criteria. We did not follow Kyvik’s approach of counting page numbers. Kyvik, "Motherhood and Scientific Productivity," 151. 39 Unfortunately, we did not have a question asking former assistant professors how long they were at that rank.

19
In Table 2b we break out the above figures by gender. Note that the only statistically significant difference between genders emerges for the non-book publications index (p<.05), with men scoring modestly higher than women. This suggests that men and women are similarly prolific in book publications, at least based on this crude summary.
TABLE 2b. Summary Statistics for Dependent Variables, by Gender
--------Men-------- -----Women-----
Index (Dependent Variable) Mean Std. Dev. Mean Std. Dev. Diff.
Combined publications 3.19 2.75 3.03 3.18 .16
Combined non-book publications 1.80 1.18 1.62 1.35 .18*
Books only 0.29 0.29 0.31 .44 -.02
*p<.05
Results
In this section we review the results from a series of regression analyses testing each of our conjectures. In each instance, we first run OLS models against the causal variables within each of the four conjecture subcategories (Work Environment, Work Habits, Research Focus, and Personal Circumstances). We then re-run the OLS models for each dependent variable against the full set of causal variables (the “kitchen sink”). The former results are shown in Table 3, while the latter are shown in Table 4.
[Tables 3-5 here]
A. Work Environment
Our first group of conjectures (1-6) address respondents’ work environment. These conjectures hold that publishing productivity will be positively associated with departmental publishing expectations (#1), employment with a Ph.D. granting institution (#2) reduced teaching loads (#3), leave time40 (#4), having a same-sex mentor41 (#5), and not stopping the tenure
40 This variable is based on the combined amount of sabbatical and other research leave time (with both types of leaves coded on a 0-4 scale running from none to more than 24 months). The combined variable thus runs from 0 to 8. 41 This variable is coded 0-2, where 0=not at all, 1=either in graduate school or as an assistant professor, and 2=both in graduate school and as an assistant professor.

20
clock42 (#6). The results of our statistical analyses generally, though imperfectly, support these conjectures.
Beginning with Conjecture #1, the results from our work environment model (Table 3, Models 4-6 for the publication index, non-book publication index, and books only index, respectively) confirm our expectations for women, but not for men. As shown in Table 5 (which presents the simulated expected effects of variations in our causal variables on the three dependent variables), among women a maximum increase in actual departmental expectations (from “less than 20%” to “more than 80%” of one’s work time) is associated with increases in publications of about.75, .82, and .54 standard deviations on our combined publications, combined non-book publications, and books only indexes, respectively (p<.10 in each case). The results for men are substantively small and statistically insignificant. These results do not, however, persist in the fully specified models that include all controls from all subcategories (Table 4, Models 1-3, with substantive interpretations presented in Table 7). Hence, we see some limited evidence in support of Conjecture #1, albeit only among women.
Consistent with Conjecture #2, which is closely related to the first conjecture, both the work environment (again, Table 3, Model 4-6, and substantively interpreted in Table 5) and the fully specified (again, Table 4, Models 1-3, with substantive interpretations in Table 7) models indicate statistically significant positive relationships for men, but not for women. However, in both cases the results are insignificant when we measure productivity only via published books. Among male respondents, working at a PhD granting institution as an assistant professor is associated with increases of .26 and .28 standard deviations on the combined publications and combined non-book publications indexes, respectively (p<.05 in each case). The corresponding increases for the fully specified models are .30 and .31 standard deviations, respectively (p<.01 in each case). These highly robust results offer strong and consistent support for Conjecture #2 and indicate that, at least among men, working at a PhD granting institution is clearly associated with increased publications, albeit not with respect to books.
Interestingly, variations in teaching load (Conjecture #3) produced no statistically significant effects for men or women in any of our models. However, increased leave time (Conjecture #4), combining sabbatical and parental leave, is associated with substantial and highly significant increases – rather than the anticipated decreases – in productivity among men. This pattern emerges for all three dependent variables in the fully specified, though not in the work environment, models.43 For the former models and among male respondents, as the teaching load increases from 1/1 to 4/3 or more, male publication productivity increases by .64, .59, and .62 standard deviations on the combined publications, combined non-book publications, and books only indexes, respectively (p<.01 in each case). This suggests comparable leave time effects for books and other types of publications. It further suggests that leave time does not appear to follow from difficulty in publishing. Rather, the causal arrow appears to run in the opposite direction, with the extra time afforded by leaves of absence associated with greater productivity.
42 This variable, which runs from 0 to 2, combines two questions to measure tenure clock stoppage for parental leave and for other reasons. For both constituent questions, the responses are dichotomized where 0=no and 1=yes. However, for the parental leave question, responses of “I intend to ask for it but have not yet done so” are coded as .5. 43 Note that both the valence and magnitude of the effects of leave time remain unaffected if we break these two categories of leave time into separate causal variables.

21
Conjecture #5 (same-sex mentoring) receives fairly robust support for women, but not for men, in both our work habits and fully specified models. In the work habits models, moving from lacking any same-sex mentoring to having same-sex mentors in graduate school and as an assistant professor is associated with increases of .44 and .56 standard deviations on the combined publications and books only indexes, though the former relationship is not quite statistically significant (p<.15), while the latter is significant at p<.05. This suggests same-sex mentoring may be more important for book publications than for other types of publications. The results are similar in the fully specified models, with corresponding increases of.40 and .52 standard deviations on the combined and books only indexes, respectively (p<.10 and p<.05, respectively). In each instance, the difference between the significant effects for women and insignificant effects for men is itself statistically significant (p<.10 or better). This is one of a relatively small number of instances in our data set where we find statistically significant “differences in the differences.” In all likelihood, this results from the relatively small number of observations in each subcategory. The fact that same-sex mentoring emerges so robustly despite this limitation as a clear difference between the genders attests to its likely importance in influencing publication success – especially with respect to books -- for women, but seemingly less so for men.
The final conjecture in our work environment models concerns the effects of stopping the tenure clock (#6). We anticipated an inverse relationship in this instance, with such stoppages associated with reduced publishing success (albeit with an assumption that the causal arrow runs in the reverse direction, with those having difficulty publishing being more likely to request stoppage of their tenure clock). Once again, the results partially support our conjecture, in this instance only among men. In the work environment models (as noted, Models 4-6 of Table 3, substantively interpreted in Table 5), as tenure clock stoppages increase from none to 36 or more months for both parenthood and other reasons, the number of publications among men declines by .75, .69, and .72 standard deviations on the combined publications, combined non-book publications, and books only indexes (p<.01 in each instance). For the fully specified models (again, shown in Table 4, Models 1-3, and substantively interpreted in Table 7), the corresponding declines are 1.03, .81, and .97 standard deviations. As with Conjecture #5, here again the differences between the differences for men and women are themselves highly significant (p<.01) in every instance. This clearly suggests that stopping the tenure clock is counter-productive for men, but not for women (albeit quite possibly with the causal arrow running in the opposing direction, with only those men experiencing difficulty in publishing requesting stoppage of their tenure clocks). This may be attributable, at least in part, to social norms, whereby it is simply more socially acceptable for a woman than for a man to stop the tenure clock for reasons of parenting. Whatever the reason, however, this is another area where men and women differ substantially and statistically significantly.
B. Work Habits
Our second set of conjectures (7-9) addresses respondents’ work habits. These conjectures hold that publishing productivity will be positively associated with time spent on research in general (#7) and during the summer (#8), as well as with fewer numbers of conference presentations-per-article (#9). The results of our statistical analyses are, in this instance, decidedly mixed.
The strongest and most consistent result in this subsection concerns Conjecture #7. In six of our seven models (three dependent variables x work habits and fully specified models),

22
women appear to benefit substantially and statistically significantly from increasing their time devoted to research. However, this pattern does not in these data extend to summertime research (#8), the results for which are statistically insignificant in every case. In the work habits models (shown in Models 7-9 of Table 3 and substantively interpreted in Table 5), as female respondents’ overall research time increased from “less than 10” to “over 40” hours-per-week, their publication productivity increased by 1.09, 1.34, and .63 standard deviations on the combined publications, combined non-book publications, and books only indexes, respectively (p<.01 in the first two cases and p<.05 in the third case). The fact that we observe the largest effect in the combined non-book index model suggests that devoting greater time to research exerts a disproportionate return to publishing articles and book chapters, rather than books. Interestingly, in these models the amount of time men devote to research has no statistically significant effect on their productivity. Moreover, the difference in the effects for women and absence of effects for men is itself statistically significant in all three work habit models (as before, p<.01 for the first two dependent variables, and p<.05 for the third).
The corresponding results for the fully specified models (Models 1-3 of Table 4, substantively interpreted in Table 7) are, among women, increases of .62 and .78 standard deviation increases in productivity on the combined publications and combined non-book publications indexes (p<.10 and p<.05, respectively), while the results for the books only index are, in this case, substantively small and statistically insignificant. Among men, as before none of the relationships are statistically significant, though for the combined non-book publication index the results are nearly significant (a .32 standard deviation increase in productivity that narrowly misses the p<.10 significance threshold). These results for both women and men further support our above conjecture that devoting more time to research matters more for publishing articles and book chapters than for producing books. In the fully specified models, however, the differences between the effects for women and men are not statistically significant, though they are nearly so (p<.15) in the combined publications model.
Turning to Conjecture #9, here the results, again, shown in Models 7-9 of Table 3, are somewhat inconsistent. In the work habits models, as the number of conference presentations-per-article increases among men from none to three or more, productivity increases – contrary to our conjecture -- by .29 and .44 standard deviations on the combined publications and combined non-book publications indexes, respectively. The former relationship, however, is not quite statistically significant (p<.15), while the latter is significant at the p<.05 level. The relationship for the books only index is statistically insignificant, as are all three relationships for women. The difference between the effects for men and women are themselves statistically significant for only the non-book publications index model (p<.10).
In this instance the fully specified models (Models 1-3 of Table 4) differ substantially from the work habits models. The results from the combined publications index model are statistically insignificant for both men and women. However, in the other two models we find significant effects of conference presentations-per-article on publication productivity, albeit only among women. Among this group of respondents (again, see Table 7), the aforementioned increase in conference presentations-per-article is associated with declines -- as per our conjecture – of .22 and .10 standard deviations (p<.05 in both cases) on the combined non-books and books only indexes. In both models, the differences between the effects for men and women are statistically significant at the p<.05 level. The results for our tests of Conjecture #9 are thus quite ambiguous, supporting the conjecture for women in the fully specified models, but moving in the opposite direction for men in the work habits models.

23
C. Personal Circumstances
Our third set of conjectures (10-14) addresses respondents’ personal circumstances. These conjectures hold that publishing productivity will be negatively associated with age (#10) and positively associated with having paid, relative to unpaid, childcare44 (#14). They also predict positive (negative) relationships for men (women) who were married (#11) and had children under five years of age (#12) while working as assistant professors. Finally, Conjecture #13 predicts that being the primary nighttime caregiver for a child under five years of age will be negatively associated with publication productivity.45 As with our work habits models, the results of our statistical tests are again mixed.
Beginning with the effects of age (Conjecture #10), the results here (shown in Models 1-3 of Table 3 and substantively interpreted in Table 6) are among our strongest and most consistent, as well as demonstrating one of the largest gender gaps in our data. In our Personal Circumstances models, as women increase in age from “under 30” to the mean age in the data set (the midpoint between “30-40” and “41-50”, which for simplicity we will describe as 40), their research productivity during their assistant professorship declines dramatically, by 2.08, 2.23, and 1.64 standard deviations on the combined publication, combined non-book publication, and books only indexes, respectively (p<.01 in the first two cases and p<.05 in the third case). At this point, women’s productivity appears to remain roughly constant, as there is no statistically significant change across any of our three dependent variables from age 40 to “over 50” (the maximum value in our survey). In other words, up to a point, and consistent with our conjecture, the longer in the past our female respondents were most likely assistant professors, the less they published while assistant professors. However, this pattern eventually flattens out, suggesting that expectations for assistant professors, while arguably lower in the past, do not continue inexorably downward as one moves backward in time.
Men also become less prolific over time, further supporting our conjecture. However, their decline is substantially more modest than that for women. As men increase in age from “under 30” to 40, their research productivity declines by a still significant but far less dramatic .65, and .73 standard deviations on the combined publication and combined non-book publication indexes, respectively (p<.10 in the former case and p<.01 in the latter). However, there is no significant effect among men in the books only index model. However, unlike their female counterparts, the over time decline in productivity among men continues past age 40, by an additional .22 and .24 standard deviations on the combined publication and combined non-book publication indexes, respectively, as age increases from 40 to “over 50” (p<.01 in both cases). This may substantiate our earlier speculation that the relatively younger cohort of women in our sample mitigates the continued trend among scholars over 50, at least relative to men. Nevertheless, the combined total decline in productivity for women from “under 30” to “over 50” is well over twice as large in magnitude as for men. The differences, in turn, in the rates of decline among men and women between “under 30” and 40 are themselves statistically significant for the combined non-book publication index (p<.01), and nearly so for the combined publication index (p<.15). The differences between men and women as they increase in age from
44 Both types of childcare are operationalized as dummy variables, where responses of “I did not use any paid care. I mostly had family members…take care of my child(ren)” are coded as unpaid childcare. 45 This dummy variable is coded one if the respondent indicated that they had primary responsibility, whether or not they reported having a spouse or partner.

24
40 to “over 50,” in turn, are significant (p<.05) for both the combined publication and combined non-book publication indexes.
These patterns remain largely unchanged in the fully specified models, and so we do not delineate them here. (We invite the interested reader to consult Models 1-3 in Table 4, also substantively interpreted in Table 6.) However, there is one noteworthy difference. In the latter models, the patterns described above for the combined productivity and combined non-book productivity dependent variables also emerge for the books only dependent variable. In this instance we observe statistically significant declines in book publications among women, as well as smaller and marginally significant declines among men, as age increases from “under 30” to 40, but not – for men or women -- as age increases from 40 to “over 50.”
Turning to Conjecture #11, the results, shown in Table 3, Models 1-3 and substantively interpreted in Table 5, indicate that married men, but not married women, outperform their unmarried counterparts for two of the three dependent variables (excluding the books only index), and for both the personal circumstances and fully specified models. In the personal circumstances models, married men are more productive by .26 and .30 standard deviations for the combined publication and combined non-book publications indexes, respectively (p<.10 and p<.05, respectively). The corresponding effects in the fully specified models (see Table 4, Models 1-3, with substantive interpretations in Table 7) are nearly identical differences of .24 and 30 standard deviations, respectively (p<.05 and p<.01, respectively). The differences among women move in the opposing direction, indicating that being married reduces women’s productivity. However, none of the differences among women are statistically significant. Hence, these latter results are at most suggestive. Moreover, the gap between the significant effects among men and the insignificant effects among women does not achieve standard levels of statistical significance. Nonetheless, overall these patterns do appear to suggest that marriage affords a greater productivity boost to men than to women, albeit more so for articles and book chapters than with respect to publishing books.
In these data, we find no significant relationships for men or women in our tests of Conjectures 12 and 13 (having children under age 5 while an assistant professor and serving as primary night time caregiver for such children, respectively). The sole “near” exception concerns women’s book publishing in the personal circumstances model. In that instance, having a child under age five while an assistant professor is associated with a nearly significant (just missing the p<.10 level) .92 standard deviation increase on the books only index.
The final personal circumstances conjectures concern the effects of paid (#14a) and unpaid (#14b) childcare. The results here (see again Models 1-3 in Tables 3 and 4, with substantive interpretations in Tables 5 and 7, for the personal circumstances and fully specified models, respectively) are inconsistent, but generally suggest, contrary to our expectations, that both types of childcare are associated with relatively modest, and sometimes significant, declines in productivity. However, these patterns are almost certainly an artifact of the construction of the variables, which include all respondents without children as lacking paid or unpaid childcare. Since having childcare depends upon having young children, this variable is, in effect, serving as a proxy for having young children. This, in turn, could potentially negate any otherwise-significant results on the prior analysis of the effects of having children under age five. However, when we re-ran the various models, limiting the childcare variables to respondents with children and excluding the latter variables from the “children under five” analysis, none of the relationships proved statistically significant. Consequently, while we anticipated that children
25
would be an important factor in research productivity, we are unable to substantiate these conjectures in the present data. D. Research Focus
Our final set of conjectures (15-17) addresses respondents’ research focus. These conjectures hold that publishing productivity will be positively associated with working in popular substantive issue areas (#15), employing quantitative methods, except for books (#16), and focusing on the U.S. or Western Europe (#17a), but not on multiple areas (#17b).46
Beginning with Conjecture #15, the results from the Research Focus models (Models 10-12 in Table 3) are largely insignificant, with the exception of the combined non-book publication model. In that instance, males, but not females, who work on popular topics were .13 standard deviations less productive on the combined non-book publication index (p<.10). We defined a popular topic any topical area selected by over 50 respondents in our survey (below which a significant drop-off in frequency was apparent). This included comparative politics, foreign policy analysis, international political economy and international security.
Interestingly the results were somewhat stronger for men in the fully specified models (Models 10-12 in Table 3, with simulated expected values presented in Table 5), achieving statistical significance for two of the three dependent variables. In these latter models, working in a popular topical area was associated with reduced productivity of .32 and .45 standard deviations on the combined and non-book combined publication indexes, respectively (p<.10 and p<.05, respectively). Once again, the results were small and insignificant for women across all three fully specified models.
In contrast to variations in topical research focus, employing quantitative methods (#16) appears in these data to matter for women but not for men. Among women in the Research Focus models, employing quantitative methods in one’s research was associated with an increase in productivity of .36 and .65 standard deviations on the combined publications and combined non-book publications indexes, respectively (p<.10 and p<.01, respectively). The results are nearly identical in the fully specified models (Models 10-12 in Table 4, with simulated expected values presented in Table 7), where employing quantitative methods is associated with increases in productivity of .31 and .59 standard deviations on the combined publications and combined non-book publications indexes, respectively (p<.15 and p<.01, respectively). In both sets of models, the results for the books only index, and for all indexes among men, were substantively small and statistically insignificant. In fact, the differences between men and women are themselves statistically significant in all four cases (p<.10 or better). This pattern appears to supports our conjecture that quantitative methods are less helpful in publishing books than in other types of publications, albeit only among women.
We turn finally to Conjectures 17a and 17b. Beginning with the latter, we find no statistically significant relationships between a focus on multiple regional areas and publication productivity for men or women in any of our models. However, we do see some evidence among males, but not among females, that a regional focus on Western Europe or Canada is positively associated with research productivity. Among male respondents in the Research Focus models (tested in Models 10-12 of Table 3 and interpreted in Table 5), a regional focus on Western Europe or Canada is associated with increases of .34 and .40 standard deviations on the
46 Each of these variables are dummies, coded 1 if the respondents indicated the pertinent method or focus was one of their two primary methods or emphases (in two separate questions in each case).

26
combined publication and books only indexes (p<.01 in both cases). For females in the books only index model, the corresponding increase of .28 standard deviations approaches, but does not quite achieve, standard levels of statistical significance (p<.15).
Turning to the fully specified models (tested in Models 1-3 of Table 4 and interpreted in Table 7), a regional focus on Western Europe or Canada is again positively associated with research productivity, albeit more strongly so among men than among women. Among male respondents, a regional focus on Western Europe or Canada is associated with increases of .31,.17, and .40 standard deviations on the combined publications, combined non-book publications and books only indexes (p<.05, p<.15, and p<.01, respectively). The corresponding increases for females are .32, .34, and .34 standard deviations, respectively (p<.10 in the first two cases and just below the .10 threshold in the third case) Taken together, these results suggest that this particular regional focus may facilitate book publication somewhat more than other types of publications, particularly (or at least more consistently), but not exclusively, among men. We summarize our conjectures and findings in Table 8.
TABLE 8. Summary of Conjecture Tests
We expect higher publications rates will correlate with the following factors: Categories Summary Results
A. Work Environment 1. Research expectations: higher department expectations for research hours per week
Limited support for women, but not men
2. University type: work at a PhD-granting institution Support for men, but not women 3. Teaching load: Lower teaching loads Statistically insignificant 4. Leave time: More leave time Highly significant support for men
and women 5. Same-sex mentors: those with mentors of the same sex as themselves
Robust support for women but not men
6. Tenure clock: not stopping the tenure clock Support for men but not women B. Work Habits 7. Hours on research: more hours spent conducting research
Strong support for women but not men
8. Summers: more summer months dedicated to research Statistically insignificant 9. Conference presentations: fewer conference presentations before submitting for publication
Reverse results for men; statistically insignificant for women
C. Personal Circumstances 10. Age: younger scholars Mostly supported: older scholars
published less as assistant professors than their younger counterparts, with stronger differences for women than for men
11. Marriage: married men Support for married men. Married women produce less than single women.

27
12. Children: fewer children under 5 Statistically insignificant 13. Children and caregiver: not being the primary caregiver
Statistically insignificant
14. Paid vs. unpaid childcare: paid childcare Unsupported. Both paid and unpaid childcare are associated with declines in productivity
D. Research Focus 15. Substantive area: more popular areas of research (IS, IPE, FPA, SSIP, CP)
Statistically significant support for men. Small and insignificant effects for women.
16. Methodology: quantitative methods Significant support for women, but not men
17. Area of the world: 17a: not using multiple regions or global analysis 17b: more popular areas of the world (US, Canada, Western Europe)
a. no significant results b. support, especially for men
Conclusions
A number of our descriptive data support what other scholars have previously reported. For example, we find that the percentage of women significantly declines as scholars move up the career ladder from assistant to full professor. On the other hand, we did not find that women were dramatically less successful than men at publishing. Instead, we found that the only statistically significant advantage enjoyed by men concerned publication rates for non-books – that is, articles and book chapters -- where men scored modestly higher than women. This can be explained by the fact that our survey queries people about their years as assistant professors. As a result, many of our female respondents had already achieved tenure and thus had succeeded in meeting, more or less, the publication rates of their male colleagues. Yet, the one area where we found a difference–article publications–is important, as many top research universities may more highly value articles over books. We find at least partial support for the majority of our conjectures, which, viewed in tandem, do appear to suggest some significant differences in the effects of the various factors we investigated on the publishing productivity of male and female scholars. That these differences mostly – albeit by no means universally – conformed with our ex ante conjectures regarding which factors were likely to more heavily influence one or the other gender suggests that there remain important and systematic differences in the academic career paths of men and women. These differences, in turn, are not limited to one or several types of factors. Such differences emerged in every cluster of variables: work environment, work habits, research focus, and personal circumstances. That said, they are arguably most robust for the work environment cluster, suggesting that this factor may wield a disproportionate influence on publication productivity. Additional research will be necessary to “drill down” into these differentiating factors, to determine how and why they influence professional productivity.

28
References
"A Study on the Status of Women Faculty in Science at MIT." Massachusetts Institute of Technology, 1999.
Abramo, Giovanni, Ciriaco Andrea D'Angelo, and Alessandro Caprasecca. "Gender Differences in Research Productivity: A Bibliometric Analysis of the Italian Academic System." Scientometrics 79, no. 3 (2009): 517-39.
American Political Science Association. "Women's Advancement in Political Science: A Report on the APSA Workshop on the Advancement of Women in Academic Political Science in the United States." 2005.
APSA Committee on the Status of Women. "Improving the Status of Women in Political Science: A Report with Recommendations " PS: Political Science and Politics 23, (1992): 547-54.
"Beyond Bias and Barriers: Fulfilling the Potential of Women in Academic Science and Engineering." Committee on Science, Engineering, and Public Policy (COSEPUP), 2007.
Boyer, E. L. Scholarship Re-Considered: Priorities of the Professoriate. Princeton, NJ: Carnegie Foundation for the Advancement of Teaching, 1990.
———. The Undergraduate Experience. New York: Oxford University Press, 1986. Carnegie Foundation. The Condition of the Professoriate: Attitudes and Trends 1989. Princeton,
N.J.: Carnegie Foundation for the Advancement of Teaching, 1989. Cole, Jonathan. R. Fair Science: Women in the Scientific Community. New York: Free Press,
1979. Cole, Jonathan. R., and Harriet Zuckerman. "Marriage, Motherhood, and Research Performance
in Science." Scientific American (February 1987): 83-89. ———. "The Productivity Puzzle: Persistence and Change in Patterns of Publications of Men
and Women Scientists." In Advances in Motivation and Achievement, edited by Martin L. Maehr and Marjorie W. Steinkamp, 217-58. Greenwich, CN: JAI Press, 1984.
Creamer, Elizabeth G. Assessing Faculty Publication Productivity: Issues of Equity, Ashe-Eric Higher Education Report 26(2). Washington, DC: Graduate School of Education and Human Development, George Washington University, 1998.
Daly, F., and B. K. Townsend. "The Chair's Role in Tenure Acquisition." Thought and Action 9, (1994): 125-46.
Daly, W. T. "Teaching and Scholarship: Adapting American Higher Education to Hard Times." Journal of Higher Education 65, no. January-February (1994): 45-57.
Fox, Mary Frank. "Gender, Faculty, and Doctoral Education in Science and Engineering." In Equal Rites, Unequal Outcomes: Women in American Research Universities, edited by L. Hornig. New York: Kluwer Academic/Plenum Publishers, 2003.
———. "Institutional Transformation and the Advancement of Women Faculty: The Case of Academic Science and Engineering." In Higher Education: Handbook of Theory and Research, edited by J.C. Smart, 73-103: Springer Netherlands, 2008.
———. "Women, Science and Academia: Graduate Education and Careers." Gender and Society 15, no. 5 (2001): 654-66.
Fox, Mary Frank, and Catherine A. Faver. "Men, Women, and Publication Productivity: Patterns among Social Work Academics." Sociological Quarterly 26, (1985): 537-49.
Franklin, M. N. The Community of Science in Europe: Preconditions for Research Effectiveness in European Community Countries. Aldershot, UK: Gower, 1988.

29
Gabbin, A. L., S. N. Cairns, and R. L. Benke, eds. Facutly Performance Indicators. Harrisonberg, Va.: Center for Research in Accounting Information, James Madison University, 1990.
Gander, James P. "Faculty Gender Effects on Academic Research and Teaching." Research in Higher Education 40, no. 2 (1999): 171-84.
Goulden, Marc, Karie Frasch, and Mary Ann Mason. "Staying Competitive: Patching America's Leaky Pipeline in the Sciences." Center for American Progress, http://www.americanprogress.org/issues/2009/11/women_and_sciences.html.
Hamovitch, W., and D. Morgenstern. "Children and the Productivity of Academic Women." Journal of Higher Education 48, (1977): 633-45.
ISA Committee on the Status of Women in the Profession. "Committee on the Status of Women Report/Recommendations, Report to the ISA Governing Council." December 2009.
Kasten, K. L. "Tenure and Merit Pay as Rewards for Researching, Teaching, and Service at a Research University." Journal of Higher Education 55, no. July-August (1984): 500-14.
Kyvik, Svein. "Motherhood and Scientific Productivity." Social Studies of Science 20, no. 1 (1990): 149-60.
Lewis, L.S. "Academic Tenure: Its Recipients and Effects." Annals of the American Academy of Political and Social Sciences 448, (1980): 86-101.
Long, J. Scott. "The Origins of Sex Differences in Science." Social Forces 84, no. 4 (1990): 1297-315.
Mason, Mary Ann, and Marc Goulden. "Do Babies Matter? The Effect of Family Formation on the Lifelong Careers of Academic Men and Women." Academe Online November-December, (2002).
Mathews, A. Lanethea, and Kristi Andersen. "A Gender Gap in Publishing? Women's Representation in Edited Politial Science Books." PS: Political Science and Politics 43, no. 1 (2001): 143-47.
National Science Foundation, Division of Science Resources Statistics. Science and Engineering Doctorate Awards: 2002, Publication 04- 303. Arlington, VA: National Science Foundation, 2003.
Nerad, Maresi. "The Advancement of Women Ph.D.s in Political Science: Defining the Problem." Paper presented at the APSA Workshop on Women’s Advancement in Political Science, Washington, DC, March 2004.
Park, Shelley M. "Research, Teaching, and Service: Why Shouldn't Women's Work Count?" Journal of Higher Education 67, no. 1 (1996): 46-84.
Sarkees, Meredith Reid. "Report of the Committee on the Status of Women in the Profession." November 27, 2009.
Sarkees, Meredith Reid, and Nancy E. McGlen. "Confronting Barriers: The Status of Women in Political Science." Women & Politics 12, no. 4 (1992): 43-86.
Schiebinger, Londa, and Shannon K. Gilmartin. "Housework Is an Academic Issue: How to Keep Talented Women Scientists in the Lab, Where They Belong." Academe Online January-February, (2010).
Verrier, D. A. "Perceptions of Life on the Tenure Track." Thought and Action 9, (1994): 95-124. Williams, Joan C. "Hitting the Maternal Wall." Academe 90, no. 6 (2004): 16-20. Young, Cheryl D. "An Assessment of Articles Published by Women in 15 Top Political Science
Journals." PS: Political Science and Politics 28, (1995): 525-33.
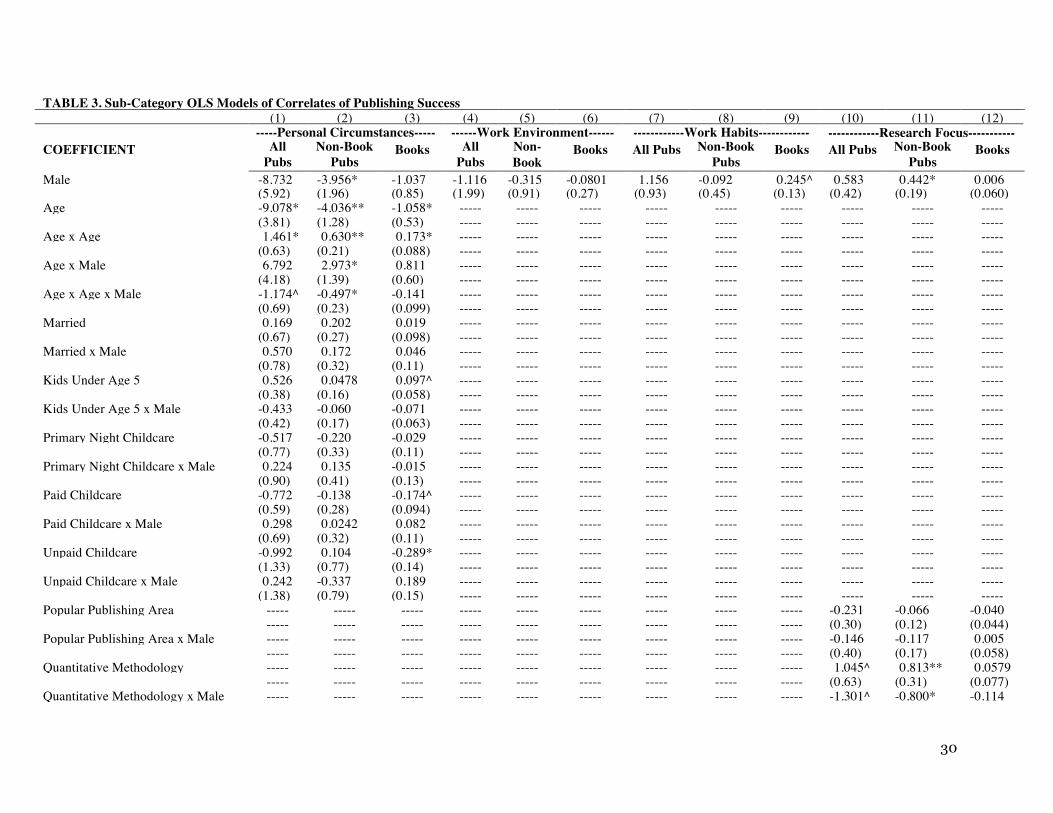
30
TABLE 3. Sub-Category OLS Models of Correlates of Publishing Success (1) (2) (3) (4) (5) (6) (7) (8) (9) (10) (11) (12) -----Personal Circumstances----- ------Work Environment------ ------------Work Habits------------ ------------Research Focus-----------
- COEFFICIENT All Pubs
Non-Book Pubs
Books All Pubs
Non-Book Pubs
Books All Pubs Non-Book Pubs
Books All Pubs Non-Book Pubs
Books
Male -8.732 -3.956* -1.037 -1.116 -0.315 -0.0801 1.156 -0.092 0.245^ 0.583 0.442* 0.006 (5.92) (1.96) (0.85) (1.99) (0.91) (0.27) (0.93) (0.45) (0.13) (0.42) (0.19) (0.060) Age -9.078* -4.036** -1.058* ----- ----- ----- ----- ----- ----- ----- ----- ----- (3.81) (1.28) (0.53) ----- ----- ----- ----- ----- ----- ----- ----- ----- Age x Age 1.461* 0.630** 0.173* ----- ----- ----- ----- ----- ----- ----- ----- ----- (0.63) (0.21) (0.088) ----- ----- ----- ----- ----- ----- ----- ----- ----- Age x Male 6.792 2.973* 0.811 ----- ----- ----- ----- ----- ----- ----- ----- ----- (4.18) (1.39) (0.60) ----- ----- ----- ----- ----- ----- ----- ----- ----- Age x Age x Male -1.174^ -0.497* -0.141 ----- ----- ----- ----- ----- ----- ----- ----- ----- (0.69) (0.23) (0.099) ----- ----- ----- ----- ----- ----- ----- ----- ----- Married 0.169 0.202 0.019 ----- ----- ----- ----- ----- ----- ----- ----- ----- (0.67) (0.27) (0.098) ----- ----- ----- ----- ----- ----- ----- ----- ----- Married x Male 0.570 0.172 0.046 ----- ----- ----- ----- ----- ----- ----- ----- ----- (0.78) (0.32) (0.11) ----- ----- ----- ----- ----- ----- ----- ----- ----- Kids Under Age 5 0.526 0.0478 0.097^ ----- ----- ----- ----- ----- ----- ----- ----- ----- (0.38) (0.16) (0.058) ----- ----- ----- ----- ----- ----- ----- ----- ----- Kids Under Age 5 x Male -0.433 -0.060 -0.071 ----- ----- ----- ----- ----- ----- ----- ----- ----- (0.42) (0.17) (0.063) ----- ----- ----- ----- ----- ----- ----- ----- ----- Primary Night Childcare -0.517 -0.220 -0.029 ----- ----- ----- ----- ----- ----- ----- ----- ----- (0.77) (0.33) (0.11) ----- ----- ----- ----- ----- ----- ----- ----- ----- Primary Night Childcare x Male 0.224 0.135 -0.015 ----- ----- ----- ----- ----- ----- ----- ----- ----- (0.90) (0.41) (0.13) ----- ----- ----- ----- ----- ----- ----- ----- ----- Paid Childcare -0.772 -0.138 -0.174^ ----- ----- ----- ----- ----- ----- ----- ----- ----- (0.59) (0.28) (0.094) ----- ----- ----- ----- ----- ----- ----- ----- ----- Paid Childcare x Male 0.298 0.0242 0.082 ----- ----- ----- ----- ----- ----- ----- ----- ----- (0.69) (0.32) (0.11) ----- ----- ----- ----- ----- ----- ----- ----- ----- Unpaid Childcare -0.992 0.104 -0.289* ----- ----- ----- ----- ----- ----- ----- ----- ----- (1.33) (0.77) (0.14) ----- ----- ----- ----- ----- ----- ----- ----- ----- Unpaid Childcare x Male 0.242 -0.337 0.189 ----- ----- ----- ----- ----- ----- ----- ----- ----- (1.38) (0.79) (0.15) ----- ----- ----- ----- ----- ----- ----- ----- ----- Popular Publishing Area ----- ----- ----- ----- ----- ----- ----- ----- ----- -0.231 -0.066 -0.040 ----- ----- ----- ----- ----- ----- ----- ----- ----- (0.30) (0.12) (0.044) Popular Publishing Area x Male ----- ----- ----- ----- ----- ----- ----- ----- ----- -0.146 -0.117 0.005 ----- ----- ----- ----- ----- ----- ----- ----- ----- (0.40) (0.17) (0.058) Quantitative Methodology ----- ----- ----- ----- ----- ----- ----- ----- ----- 1.045^ 0.813** 0.0579 ----- ----- ----- ----- ----- ----- ----- ----- ----- (0.63) (0.31) (0.077) Quantitative Methodology x Male ----- ----- ----- ----- ----- ----- ----- ----- ----- -1.301^ -0.800* -0.114
----- ----- ----- ----- ----- ----- ----- ----- ----- (0.69) (0.33) (0.087)

31
W. Europe/Canada Focus ----- ----- ----- ----- ----- ----- ----- ----- ----- 0.655 0.256 0.112 ----- ----- ----- ----- ----- ----- ----- ----- ----- (0.56) (0.22) (0.080) W. Europe/Canada Focus x Male ----- ----- ----- ----- ----- ----- ----- ----- ----- 0.307 -0.0280 0.0552 ----- ----- ----- ----- ----- ----- ----- ----- ----- (0.67) (0.27) (0.097) Multiple Regions/Areas ----- ----- ----- ----- ----- ----- ----- ----- ----- 0.050 -0.0079 0.009 ----- ----- ----- ----- ----- ----- ----- ----- ----- (0.31) (0.15) (0.041) Multiple Regions/Areas x Male ----- ----- ----- ----- ----- ----- ----- ----- ----- 0.117 0.139 0.0172 ----- ----- ----- ----- ----- ----- ----- ----- ----- (0.38) (0.18) (0.052) Research Hours/week ----- ----- ----- ----- ----- ----- 1.042*** 0.547*** 0.084* ----- ----- ----- ----- ----- ----- ----- ----- ----- (0.31) (0.14) (0.041) ----- ----- ----- Research Hours/week x Male ----- ----- ----- ----- ----- ----- -0.917** -0.394* -0.101* ----- ----- ----- ----- ----- ----- ----- ----- ----- (0.35) (0.16) (0.047) ----- ----- ----- Summer Research Time ----- ----- ----- ----- ----- ----- 0.145 -0.036 0.035 ----- ----- ----- ----- ----- ----- ----- ----- ----- (0.27) (0.11) (0.041) ----- ----- ----- Summer Research Time x Male ----- ----- ----- ----- ----- ----- -0.003 0.144 -0.029 ----- ----- ----- ----- ----- ----- ----- ----- ----- (0.32) (0.13) (0.048) ----- ----- ----- Conf. Presentations/Paper ----- ----- ----- ----- ----- ----- -0.04 -0.045 0.011 ----- ----- ----- ----- ----- ----- ----- ----- ----- (0.23) (0.10) (0.031) ----- ----- ----- Conf. Presentations/Paper x Male ----- ----- ----- ----- ----- ----- 0.323 0.229^ 0.014 ----- ----- ----- ----- ----- ----- ----- ----- ----- (0.29) (0.13) (0.041) ----- ----- ----- Dept. Research Expectations ----- ----- ----- 0.564^ 0.256^ 0.055 ----- ----- ----- ----- ----- ----- ----- ----- ----- (0.30) (0.15) (0.034) ----- ----- ----- ----- ----- ----- Dept. Research Expectations x Male ----- ----- ----- -0.425 -0.182 -0.051 ----- ----- ----- ----- ----- ----- ----- ----- ----- (0.32) (0.16) (0.039) ----- ----- ----- ----- ----- ----- Ph.D. Granting University ----- ----- ----- -0.005 0.082 0.014 ----- ----- ----- ----- ----- ----- ----- ----- ----- (0.60) (0.24) (0.083) ----- ----- ----- ----- ----- ----- Ph.D. Granting University x Male ----- ----- ----- 0.757 0.268 0.051 ----- ----- ----- ----- ----- ----- ----- ----- ----- (0.70) (0.28) (0.10) ----- ----- ----- ----- ----- ----- Teaching Load ----- ----- ----- -0.376 -0.166 -0.040 ----- ----- ----- ----- ----- ----- ----- ----- ----- (0.30) (0.14) (0.041) ----- ----- ----- ----- ----- ----- Teaching Load x Male ----- ----- ----- 0.400 0.131 0.048 ----- ----- ----- ----- ----- ----- ----- ----- ----- (0.33) (0.15) (0.045) ----- ----- ----- ----- ----- ----- Total Leave Time ----- ----- ----- 0.025 -0.040 0.021 ----- ----- ----- ----- ----- ----- ----- ----- ----- (0.17) (0.069) (0.024) ----- ----- ----- ----- ----- ----- Total Leave Time x Male ----- ----- ----- 0.0863 0.075 -0.004 ----- ----- ----- ----- ----- ----- ----- ----- ----- (0.19) (0.078) (0.027) ----- ----- ----- ----- ----- ----- Same-Gender Mentoring ----- ----- ----- 0.648 0.231 0.113* ----- ----- ----- ----- ----- ----- ----- ----- ----- (0.41) (0.18) (0.054) ----- ----- ----- ----- ----- ----- Same-Gender Mentoring x Male ----- ----- ----- -0.560 -0.180 -0.113^ ----- ----- ----- ----- ----- ----- ----- ----- ----- (0.44) (0.19) (0.060) ----- ----- ----- ----- ----- ----- Stop Tenure Clock ----- ----- ----- -0.537 -0.234 -0.082 ----- ----- ----- ----- ----- ----- ----- ----- ----- (0.46) (0.24) (0.064) ----- ----- ----- ----- ----- -----
Stop Tenure Clock x Male ----- ----- ----- -0.570 -0.186 -0.066 ----- ----- ----- ----- ----- -----

32
----- ----- ----- (0.54) (0.29) (0.074) ----- ----- ----- ----- ----- ----- Constant 15.39** 7.388*** 1.695* 3.002 1.660^ 0.251 0.634 0.757* 0.0078
1 2.736*** 1.398*** 0.289***
(5.37) (1.81) (0.74) (1.85) (0.85) (0.25) (0.67) (0.35) (0.093) (0.32) (0.14) (0.044) Observations 654 647 654 595 586 593 652 643 652 655 649 656 R-squared 0.09 0.12 0.06 0.06 0.08 0.04 0.05 0.08 0.02 0.03 0.04 0.03 *** p<0.001, ** p<0.01, * p<0.05, ^ p<0.10; Robust standard errors in parentheses.

33
TABLE 4. Fully Specified OLS Models of Correlates of Publishing Success (1) (2) (3) COEFFICIENT All
Publications Non-book
Publications Books
Male -7.013 -3.887^ -0.701 (7.23) (2.21) (1.07) Dept. Research Expectations 0.139 0.000115 0.0201 (0.29) (0.13) (0.040) Dept. Research Expectations x Male 0.00174 0.0105 0.00396 (0.33) (0.14) (0.048) Ph.D. Granting University -0.0767 0.146 -0.00704 (0.48) (0.19) (0.068) Ph.D. Granting University x Male 0.955 0.246 0.0862 (0.59) (0.23) (0.089) Teaching Load -0.360 -0.156 -0.0389 (0.29) (0.13) (0.041) Teaching Load x Male 0.416 0.165 0.0459 (0.32) (0.14) (0.046) Total Leave Time 0.181 0.0394 0.0378 (0.17) (0.065) (0.025) Total Leave Time x Male 0.0861 0.0627 -0.00102 (0.19) (0.074) (0.028) Same-Gender Mentoring 0.578^ 0.198 0.107* (0.33) (0.12) (0.050) Same-Gender Mentoring x Male -0.711^ -0.237^ -0.142* (0.37) (0.14) (0.056) Stop Tenure Clock -0.229 -0.0729 -0.0439 (0.43) (0.23) (0.064) Stop Tenure Clock x Male -1.286* -0.422 -0.154^ (0.58) (0.30) (0.083) Research Hours/week 0.612^ 0.317* 0.0442 (0.34) (0.13) (0.052) Research Hours/week x Male -0.627 -0.181 -0.0842 (0.40) (0.16) (0.061) Summer Research Time 0.0577 -0.0705 0.0155 (0.31) (0.11) (0.045) Summer Research Time x Male 0.0138 0.110 -0.00826 (0.35) (0.13) (0.053) Conf. Presentations/Paper -0.226 -0.208^ -0.0122 (0.28) (0.11) (0.041) Conf. Presentations/Paper x Male 0.385 0.280* 0.0313 (0.35) (0.14) (0.051) age -8.204* -3.496** -1.035^ (3.92) (1.18) (0.56) Age x Male 4.437 1.967 0.561 (4.44) (1.27) (0.66) Age x Age 1.350* 0.556** 0.171^ (0.65) (0.20) (0.093) Age x Age x Male -0.824 -0.350^ -0.103
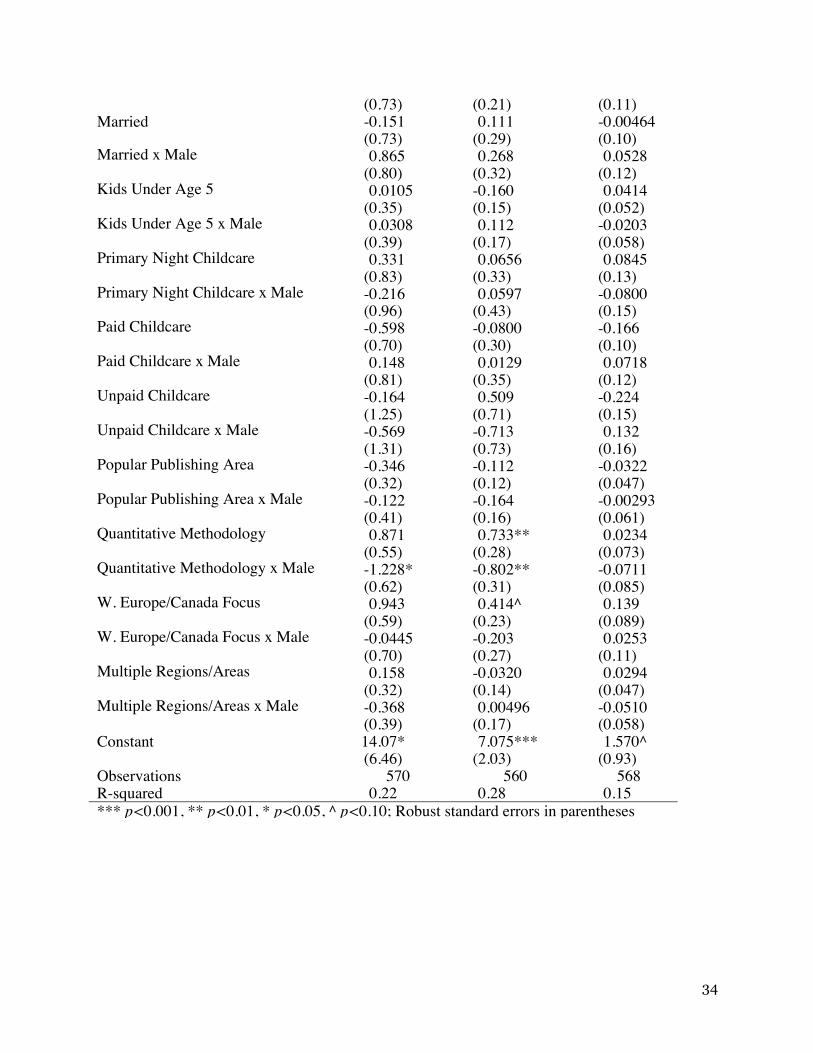
34
(0.73) (0.21) (0.11) Married -0.151 0.111 -0.00464 (0.73) (0.29) (0.10) Married x Male 0.865 0.268 0.0528 (0.80) (0.32) (0.12) Kids Under Age 5 0.0105 -0.160 0.0414 (0.35) (0.15) (0.052) Kids Under Age 5 x Male 0.0308 0.112 -0.0203 (0.39) (0.17) (0.058) Primary Night Childcare 0.331 0.0656 0.0845 (0.83) (0.33) (0.13) Primary Night Childcare x Male -0.216 0.0597 -0.0800 (0.96) (0.43) (0.15) Paid Childcare -0.598 -0.0800 -0.166 (0.70) (0.30) (0.10) Paid Childcare x Male 0.148 0.0129 0.0718 (0.81) (0.35) (0.12) Unpaid Childcare -0.164 0.509 -0.224 (1.25) (0.71) (0.15) Unpaid Childcare x Male -0.569 -0.713 0.132 (1.31) (0.73) (0.16) Popular Publishing Area -0.346 -0.112 -0.0322 (0.32) (0.12) (0.047) Popular Publishing Area x Male -0.122 -0.164 -0.00293 (0.41) (0.16) (0.061) Quantitative Methodology 0.871 0.733** 0.0234 (0.55) (0.28) (0.073) Quantitative Methodology x Male -1.228* -0.802** -0.0711 (0.62) (0.31) (0.085) W. Europe/Canada Focus 0.943 0.414^ 0.139 (0.59) (0.23) (0.089) W. Europe/Canada Focus x Male -0.0445 -0.203 0.0253 (0.70) (0.27) (0.11) Multiple Regions/Areas 0.158 -0.0320 0.0294 (0.32) (0.14) (0.047) Multiple Regions/Areas x Male -0.368 0.00496 -0.0510 (0.39) (0.17) (0.058) Constant 14.07* 7.075*** 1.570^ (6.46) (2.03) (0.93) Observations 570 560 568 R-squared 0.22 0.28 0.15 *** p<0.001, ** p<0.01, * p<0.05, ^ p<0.10; Robust standard errors in parentheses

35
TABLE 5. Effects of Variations in Causal Variables on Publication Productivity, Derived from Sub-Category Models Causal Variable
Conjec- ture #
DV = Pub Index
DV = Pub Index (No Books)
DV =Books Only
Category: Work Environment Min Max Diff Min Max Diff Min Max Diff Dept Research Expecation 1 Female 2.28 4.445 2.165 ^ 1.262 2.275 1.013 ^ 0.229 0.453 0.224 ^
Male 2.907 3.479 0.572 insig 1.634 1.926 0.292 insig 0.283 0.296 0.013 insig Diff 0.627 -0.966 -1.593 insig 0.372 -0.349 -0.721 insig 0.054 -0.157 -0.211 insig
Ph.D granting Affiliation 2 Female 2.971 2.956 -0.015 insig 1.539 1.626 0.087 insig 0.296 0.308 0.012 insig Male 2.619 3.367 0.748 * 1.507 1.859 0.352 * 0.244 0.309 0.065 insig Diff -0.352 0.411 0.763 insig -0.032 0.233 0.265 insig -0.052 0.001 0.053 insig
Teaching Load 3 Female 4.143 2.21 -1.933 insig 2.098 1.258 -0.84 insig 0.417 0.229 -0.188 insig Male 3.039 3.162 0.123 insig 1.85 1.671 -0.179 insig 0.262 0.305 0.043 insig Diff -1.104 0.952 2.056 insig -0.248 0.413 0.661 insig -0.155 0.076 0.231 insig
Total Leave Time 4 Female 2.932 3.117 0.185 insig 1.639 1.337 -0.302 insig 0.275 0.437 0.162 insig Male 2.982 3.729 0.747 insig 1.703 1.924 0.221 insig 0.267 0.383 0.116 insig Diff 0.05 0.612 0.562 insig 0.064 0.587 0.523 insig -0.008 -0.054 -0.046 insig
Same Sex Mentor 5 Female 2.71 4 1.29 ^^ 1.498 1.952 0.454 insig 0.256 0.485 0.229 * Male 3.019 3.171 0.152 insig 1.679 1.783 0.104 insig 0.289 0.287 -0.002 insig Diff 0.309 -0.829 -1.138 insig 0.181 -0.169 -0.35 insig 0.033 -0.198 -0.231 ^
Stop Tenure Clock 6 Female 3.061 1.978 -1.083 insig 1.628 1.172 -0.456 insig 0.316 0.155 -0.161 insig Male 3.172 0.989 -2.183 ** 1.768 0.918 -0.85 ** 0.296 -0.001 -0.297 ** Diff 0.111 -0.989 -1.1 insig 0.14 -0.254 -0.394 insig -0.02 -0.156 -0.136 insig
Category: Work Habits Hours/week for Research 7 Female 2 5.162 3.162 ** 1.077 2.743 1.666 ** 0.224 0.482 0.258 *
Male 2.988 3.372 0.384 insig 1.572 2.046 0.474 * 0.31 0.26 -0.05 insig Diff 0.988 -1.79 -2.778 ** 0.495 -0.697 -1.192 ** 0.086 -0.222 -0.308 *

36
Summertime Research 8 Female 2.763 3.163 0.4 insig 1.728 1.598 -0.13 insig 0.242 0.341 0.099 insig
Male 2.863 3.27 0.407 insig 1.563 1.87 0.307 insig 0.278 0.291 0.013 insig Diff 0.1 0.107 0.007 insig -0.165 0.272 0.437 insig 0.036 -0.05 -0.086 insig
# Conf. Presentations per Paper 9 Female 3.109 2.968 -0.141 insig 1.698 1.571 -0.127 insig 0.294 0.329 0.035 insig Male 2.811 3.649 0.838 ^^ 1.559 2.101 0.542 * 0.257 0.331 0.074 insig Diff -0.298 0.681 0.979 insig -0.139 0.53 0.669 ^ -0.037 0.002 0.039 insig
Category: Personal Circumstances Married 11 Female 2.888 3.029 0.141 insig 1.461 1.655 0.194 insig 0.292 0.307 0.015 insig
Male 2.548 3.292 0.744 ^ 1.475 1.841 0.366 * 0.24 0.303 0.063 insig Diff -0.34 0.263 0.603 insig 0.014 0.186 0.172 insig -0.052 -0.004 0.048 insig
Kids Under 5 While Asst Prof 12 Female 2.679 4.839 2.16 insig 1.593 1.746 0.153 insig 0.248 0.627 0.379 ^^ (^) Male 3.118 3.488 0.37 insig 1.803 1.755 -0.048 insig 0.274 0.374 0.1 insig Diff 0.439 -1.351 -1.79 insig 0.21 0.009 -0.201 insig 0.026 -0.253 -0.279 insig
Primary Nighttime Childcare 13 Female 3.135 2.634 -0.501 insig 1.679 1.454 -0.225 insig 0.313 0.279 -0.034 insig Male 3.246 2.961 -0.285 insig 1.807 1.735 -0.072 insig 0.303 0.262 -0.041 insig Diff 0.111 0.327 0.216 insig 0.128 0.281 0.153 insig -0.01 -0.017 -0.007 insig
Paid Childcare 14a Female 3.281 2.496 -0.785 insig 1.654 1.537 -0.117 insig 0.364 0.201 -0.163 ^ Male 3.391 2.923 -0.468 insig 1.85 1.729 -0.121 insig 0.33 0.24 -0.09 ^ Diff 0.11 0.427 0.317 insig 0.196 0.192 -0.004 insig -0.034 0.039 0.073 insig
Unpaid Childcare 14b Female 3.281 2.246 -1.035 insig 1.654 1.808 0.154 insig 0.364 0.087 -0.277 ^ Male 3.391 2.641 -0.75 * 1.85 1.617 -0.233 insig 0.33 0.23 -0.1 ^ Diff 0.11 0.395 0.285 insig 0.196 -0.191 -0.387 insig -0.034 0.143 0.177 insig

37
Category: Research Focus Work on Popular Topic 15 Female 3.19 2.711 -0.479 insig 1.653 1.526 -0.127 insig 0.337 0.253 -0.084 insig
Male 3.509 2.735 -0.774 insig 1.957 1.572 -0.385 ^ 0.323 0.253 -0.07 insig Diff 0.319 0.024 -0.295 insig 0.304 0.046 -0.258 insig -0.014 0 0.014 insig
Quantative Work 16 Female 2.782 3.825 1.043 ^^ (^)
1.418 2.223 0.805 ** 0.297 0.356 0.059 insig Male 3.293 3.038 -0.255 insig 1.802 1.819 0.017 insig 0.316 0.259 -0.057 insig Diff 0.511 -0.787 -1.298 ^ 0.384 -0.404 -0.788 * 0.019 -0.097 -0.116 insig
Mostly W. Europe/Canada Focus 17a Female 2.874 3.538 0.664 insig 1.551 1.809 0.258 insig 0.282 0.397 0.115 ^^ Male 2.997 3.971 0.974 ** 1.761 1.984 0.223 insig 0.26 0.424 0.164 ** Diff 0.123 0.433 0.31 insig 0.21 0.175 -0.035 insig -0.022 0.027 0.049 insig
Focus on Multiple Regions 17b Female 3.011 3.078 0.067 insig 1.615 1.613 -0.002 insig 0.307 0.316 0.009 insig Male 3.135 3.296 0.161 insig 1.752 1.881 0.129 insig 0.284 0.312 0.028 insig Diff 0.124 0.218 0.094 insig 0.137 0.268 0.131 insig -0.023 -0.004 0.019 insig
^^p<.15, ^p<.10, *p<.05, **p<.01

38
TABLE 6. Effects of Variations in Age (Conjecture #10) on Publication Productivity Sub-Category Models
DV = Publication Index Min Mean Max Diff (min-to-mean) Diff (mean-to-max) Diff (min-to-max)
Female 8.409 2.371 3.033 -6.038 ** 0.662 insig -5.376 ** Male 5.169 3.288 2.653 -1.881 ^ -0.635 * -2.516 * Diff -3.24 0.917 -0.38 4.157 ^^ -1.297 * 2.86 insig
DV = Pub Index (No Books) Female 4.13 1.362 1.45 -2.768 ** 0.088 insig -2.68 ** Male 2.742 1.835 1.533 -0.907 ** -0.302 ** -1.209 ** Diff -1.388 0.473 0.083 1.861 ** -0.39 * 1.471 ^
DV =Books Only Female 0.902 0.23 0.325 -0.672 * 0.095 insig -0.577 * Male 0.494 0.302 0.243 -0.192 insig -0.059 insig -0.251 ^^ Diff -0.408 0.072 -0.082 0.48 insig -0.154 ^ 0.326 insig
Fully Specified Models DV = Publication Index
Min Mean Max Diff (min-to-mean) Diff (mean-to-max) Diff (min-to-max) Female 7.574 2.355 3.21 -5.219 * 0.855 insig -4.364 * Male 6.023 3.093 2.573 -2.93 * -0.52 ^^ -3.45 ** Diff -1.551 0.738 -0.637 2.289 insig -1.375 ^ 0.914 insig
DV = Pub Index (No Books) Female 3.707 1.352 1.538 -2.355 ** 0.186 insig -2.169 ** Male 2.979 1.76 1.477 -1.219 ** -0.283 * -1.502 ** Diff -0.728 0.408 -0.061 1.136 insig -0.469 ^ 0.667 insig
DV =Books Only Female 0.879 0.229 0.344 -0.65 ^ 0.115 insig -0.535 ^^ (^) Male 0.619 0.278 0.229 -0.341 ^^ -0.049 insig -0.39 ^ (*) Diff -0.26 0.049 -0.115 0.309 insig -0.164 ^ 0.145 insig ^^p<.15, ^p<.10, *p<.05, **p<.01

39
TABLE 7. Effects of Variations in Causal Variables on Publication Productivity, Derived from Fully Specified Models
Causal Variable Conjec- ture # DV = Publication Index DV = Pub Index (No Books) DV =Books Only (SD=.41)
Min Max Diff Min Max Diff Min Max Diff Dept. Expectations 1 Female 2.778 3.327 0.549 insig 1.573 1.595 0.022 insig 0.28
1 0.354 0.073 insig
Male 2.903 3.454 0.551 insig 1.727 1.772 0.045 insig 0.252
0.342 0.09 insig Diff 0.125 0.127 0.002 insig 0.154 0.177 0.023 insig -
0.029
-0.012 0.017 insig Ph.D granting Affiliation 2 Female 2.999 2.916 -0.083 insig 1.5 1.642 0.142 insig 0.30
8 0.303 -0.005 insig
Male 2.516 3.399 0.883 ** 1.484 1.869 0.385 ** 0.234
0.311 0.077 insig Diff -0.483 0.483 0.966 ^^
(^) -0.016 0.227 0.243 insig -
0.074
0.008 0.082 insig Teaching Load 3 Female 4.07 2.24 -1.83 insig 2.053 1.275 -0.778 insig 0.42
5 0.228 -0.197 insig
Male 2.934 3.22 0.286 insig 1.721 1.76 0.039 insig 0.265
0.299 0.034 insig Diff -1.136 0.98 2.116 insig -0.332 0.485 0.817 insig -
0.16 0.071 0.231 insig
Total Leave Time 4 Female 2.738 4.015 1.277 insig 1.533 1.817 0.284 insig 0.25
9 0.529 0.27 ^^
Male 2.774 4.642 1.868 ** 1.611 2.339 0.728 ** 0.239
0.494 0.255 ** Diff 0.036 0.627 0.591 insig 0.078 0.522 0.444 insig -
0.02 -0.035 -0.015 insig
Same Sex Mentor 5 Female 2.715 3.87 1.155 ^ 1.5 1.891 0.391 ^^ 0.25
9 0.474 0.215 *
Male 3.277 2.999 -0.278 insig 1.794 1.714 -0.08 insig 0.327
0.26 -0.067 insig Diff 0.562 -0.871 -1.433 ^ 0.294 -0.177 -0.471 ^^ 0.06
8 -0.214 -0.282 *
Stop Tenure Clock 6 Female 2.993 2.541 -0.452 insig 1.595 1.424 -0.171 insig 0.31
3 0.223 -0.09 insig
Male 3.181 0.176 -3.005 ** 1.77 0.767 -1.003 * 0.296
-0.103 -0.399 ** Diff 0.188 -2.365 -2.553 * 0.175 -0.657 -0.832 insig -
0.017
-0.326 -0.309 ^ Hours/week for Research 7 Female 2.36 4.152 1.792 ^ 1.26 2.222 0.962 * 0.25
9 0.395 0.136 insig
Male 3.122 3.083 -0.039 insig 1.563 1.965 0.402 ^^ 0.335
0.222 -0.113 insig Diff 0.762 -1.069 -1.831 ^^ 0.303 -0.257 -0.56 insig 0.07
6 -0.173 -0.249 insig
Summertime Research 8 Female 2.808 3.017 0.209 insig 1.73 1.514 -0.216 insig 0.27 0.32 0.05 insig Male 2.95 3.165 0.215 insig 1.658 1.777 0.119 insig 0.26
9 0.291 0.022 insig
Diff 0.142 0.148 0.006 insig -0.072 0.263 0.335 insig -0.00
1
-0.029 -0.028 insig

40
# Conf. Presentations per Paper 9 Female 3.298 2.588 -0.71 insig 1.895 1.257 -0.638 * 0.324
0.285 -0.039 * Male 2.912 3.38 0.468 insig 1.653 1.872 0.219 insig 0.26
2 0.319 0.057 insig
Diff -0.386 0.792 1.178 insig -0.242 0.615 0.857 * -0.06
2
0.034 0.096 * Married 11 Female 3.07 2.919 -0.151 insig 1.504 1.601 0.097 insig 0.31 0.303 -0.007 insig Male 2.493 3.202 0.709 * 1.417 1.794 0.377 ** 0.24
3 0.291 0.048 insig
Diff -0.577 0.283 0.86 insig -0.087 0.193 0.28 insig -0.06
7
-0.012 0.055 insig Kids Under 5 While Asst Prof 12 Female 2.947 2.977 0.03 insig 1.671 1.053 -0.618 insig 0.28
3 0.438 0.155 insig
Male 3.062 3.27 0.208 insig 1.784 1.593 -0.191 insig 0.268
0.349 0.081 insig Diff 0.115 0.293 0.178 insig 0.113 0.54 0.427 insig -
0.015
-0.089 -0.074 insig Primary Nighttime Childcare 13 Female 2.864 3.199 0.335 insig 1.561 1.635 0.074 insig 0.28
1 0.372 0.091 insig
Male 3.086 3.182 0.096 insig 1.717 1.853 0.136 insig 0.284
0.288 0.004 insig Diff 0.222 -0.017 -0.239 insig 0.156 0.218 0.062 insig 0.00
3 -0.084 -0.087 insig
Paid Childcare 14a Female 3.144 2.547 -0.597 insig 1.598 1.511 -0.087 insig 0.36
2 0.196 -0.166 ^^
Male 3.301 2.847 -0.454 insig 1.787 1.714 -0.073 insig 0.319
0.229 -0.09 ^^ Diff 0.157 0.3 0.143 insig 0.189 0.203 0.014 insig -
0.043
0.033 0.076 insig Unpaid Childcare 14b Female 3.144 2.997 -0.147 insig 1.598 2.099 0.501 insig 0.36
2 0.136 -0.226 ^^
Male 3.301 2.552 -0.749 ^ 1.787 1.574 -0.213 insig 0.319
0.23 -0.089 ^^ Diff 0.157 -0.445 -0.602 insig 0.189 -0.525 -0.714 insig -
0.043
0.094 0.137 insig Work on Popular Topic 15 Female 3.163 2.452 -0.711 insig 1.651 1.415 -0.236 insig 0.32
5 0.257 -0.068 insig
Male 3.475 2.55 -0.925 ^ 1.963 1.409 -0.554 * (**)
0.313
0.243 -0.07 insig Diff 0.312 0.098 -0.214 insig 0.312 -0.006 -0.318 insig -
0.012
-0.014 -0.002 insig Quantative Work 16 Female 2.734 3.632 0.898 ^^ 1.406 2.143 0.737 ** 0.3 0.322 0.022 insig Male 3.238 2.865 -0.373 insig 1.772 1.696 -0.076 insig 0.30
2 0.255 -0.047 insig
Diff 0.504 -0.767 -1.271 * 0.366 -0.447 -0.813 ** 0.002
-0.067 -0.069 insig Mostly W. Europe/Canada Focus 17a Female 2.701 3.637 0.936 ^ 1.473 1.889 0.416 ^ 0.26
8 0.409 0.141 ^^
Male 2.911 3.801 0.89 * 1.697 1.912 0.215 ^^ 0.248
0.412 0.164 **
Diff 0.21 0.164 -0.046 insig 0.224 0.023 -0.201 insig -
0.02 0.003 0.023 insig

41
Focus on Multiple Regions 17b Female 2.868 3.045 0.177 insig 1.597 1.562 -0.035 insig 0.29
1 0.32 0.029 insig
Male 3.198 2.988 -0.21 insig 1.756 1.729 -0.027 insig 0.294
0.273 -0.021 insig Diff 0.33 -0.057 -0.387 insig 0.159 0.167 0.008 insig 0.00
3 -0.047 -0.05 insig
^^p<.15, ^p<.10, *p<.05, **p<.01
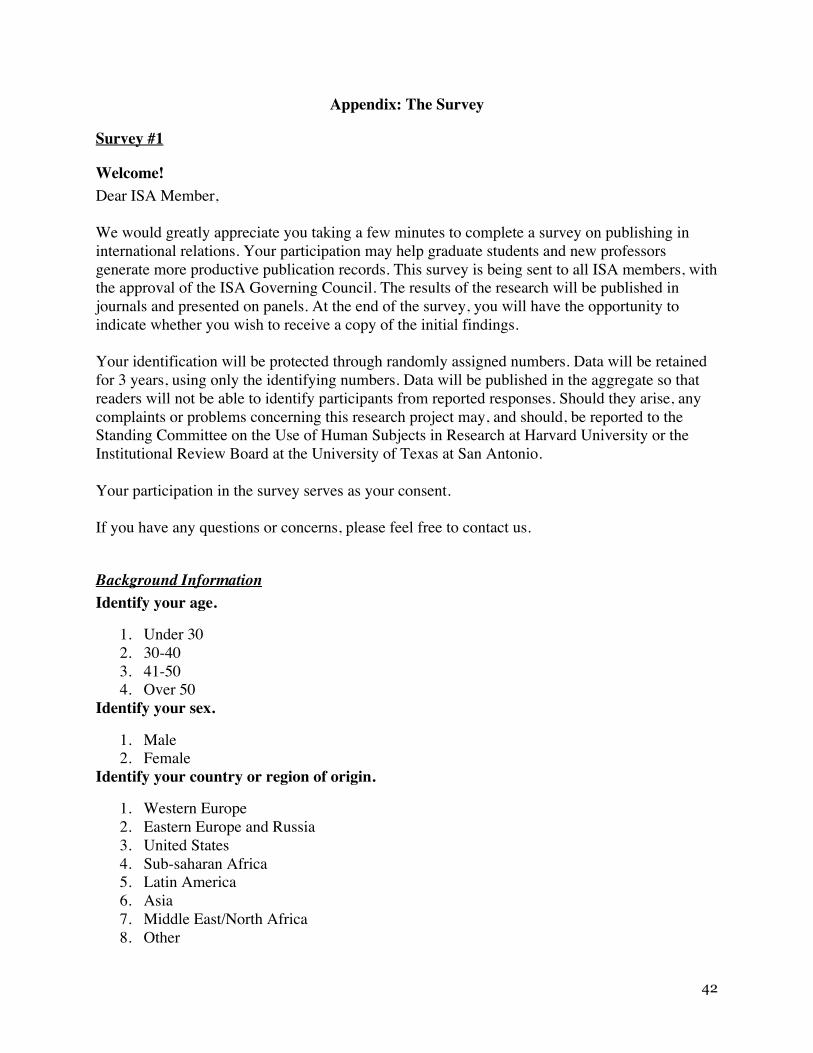
42
Appendix: The Survey
Survey #1
Welcome! Dear ISA Member, We would greatly appreciate you taking a few minutes to complete a survey on publishing in international relations. Your participation may help graduate students and new professors generate more productive publication records. This survey is being sent to all ISA members, with the approval of the ISA Governing Council. The results of the research will be published in journals and presented on panels. At the end of the survey, you will have the opportunity to indicate whether you wish to receive a copy of the initial findings. Your identification will be protected through randomly assigned numbers. Data will be retained for 3 years, using only the identifying numbers. Data will be published in the aggregate so that readers will not be able to identify participants from reported responses. Should they arise, any complaints or problems concerning this research project may, and should, be reported to the Standing Committee on the Use of Human Subjects in Research at Harvard University or the Institutional Review Board at the University of Texas at San Antonio. Your participation in the survey serves as your consent. If you have any questions or concerns, please feel free to contact us.
Background Information Identify your age.
1. Under 30 2. 30-40 3. 41-50 4. Over 50
Identify your sex.
1. Male 2. Female
Identify your country or region of origin.
1. Western Europe 2. Eastern Europe and Russia 3. United States 4. Sub-saharan Africa 5. Latin America 6. Asia 7. Middle East/North Africa 8. Other

43
Is English your first language?
1. Yes 2. No
Do you have any relatives that are or were professors?
1. No 2. Yes, both of my parents were/are professors. 3. Yes, one of my parents was/is a professor. 4. Yes, another close relative (aunt, uncle, grandparent) was/is a professor.
What is your current position?
1. Student 2. Assistant Professor 3. Associate Professor 4. Full Professor 5. Post-doctoral fellow 6. Non-tenure stream appointment (e.g. visiting professor) 7. Independent researcher 8. Other
Have you ever worked as an Assistant Professor?
1. No. 2. Yes, but I did not receive tenure, or left before the tenure review time ended. 3. Yes, I received tenure and then later took a non-tenure tracked position.
How long have you been at the rank of Assistant Professor?
1. 1 year 2. 2 years 3. 3 years 4. 4 years 5. 5-6 years 6. 7-8 years 7. 9 or more years
How long ago were you at the rank of Assistant Professor?
1. 5 years or less 2. 6-10 years 3. 11-15 years 4. More than 15 years ago
The survey questions that follow ask you about your experiences as an Assistant Professor, such as the focus of your research, the number of your publications, the number of conferences you attended, and the research and financial support your university provided you. Do you think you would be able to answer questions such as these?
1. No. It was a long time ago. 2. Probably. 3. Definitely.
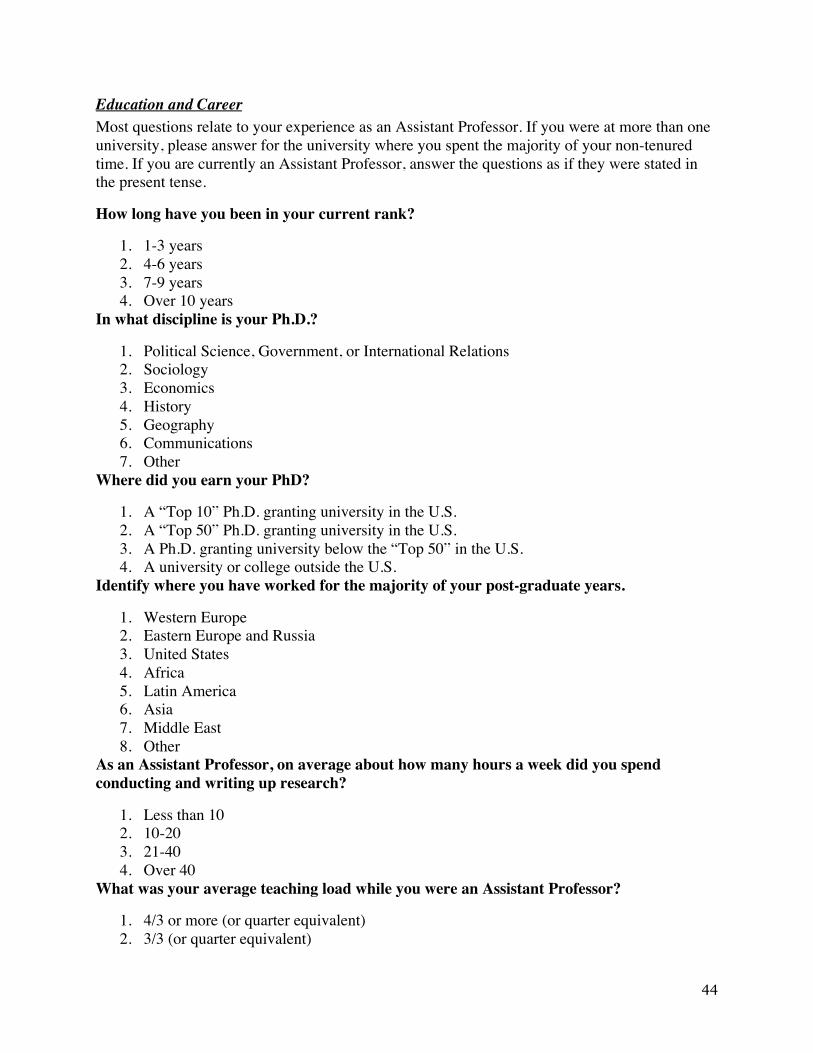
44
Education and Career Most questions relate to your experience as an Assistant Professor. If you were at more than one university, please answer for the university where you spent the majority of your non-tenured time. If you are currently an Assistant Professor, answer the questions as if they were stated in the present tense.
How long have you been in your current rank?
1. 1-3 years 2. 4-6 years 3. 7-9 years 4. Over 10 years
In what discipline is your Ph.D.?
1. Political Science, Government, or International Relations 2. Sociology 3. Economics 4. History 5. Geography 6. Communications 7. Other
Where did you earn your PhD?
1. A “Top 10” Ph.D. granting university in the U.S. 2. A “Top 50” Ph.D. granting university in the U.S. 3. A Ph.D. granting university below the “Top 50” in the U.S. 4. A university or college outside the U.S.
Identify where you have worked for the majority of your post-graduate years.
1. Western Europe 2. Eastern Europe and Russia 3. United States 4. Africa 5. Latin America 6. Asia 7. Middle East 8. Other
As an Assistant Professor, on average about how many hours a week did you spend conducting and writing up research?
1. Less than 10 2. 10-20 3. 21-40 4. Over 40
What was your average teaching load while you were an Assistant Professor?
1. 4/3 or more (or quarter equivalent) 2. 3/3 (or quarter equivalent)

45
3. 2/3 (or quarter equivalent) 4. 2/2 (or quarter equivalent) 5. 2/1 (or quarter equivalent) 6. 1/1 or less (or quarter equivalent)
As an Assistant Professor, about how much of your time did your department officially expect you to dedicate to research?
1. 20% or less of my time 2. 21-40% of my time 3. 41-60% of my time 4. 61-80% of my time 5. over 80% of my time
In your opinion, as an Assistant Professor, about how much of your time did your department actually expect you to dedicate to research?
1. 20% or less of my time 2. 21-40% of my time 3. 41-60% of my time 4. 61-80% of my time 5. over 80% of my time
As an Assistant Professor, how many hours a week did you work on all your combined professional responsibilities (research, teaching, service)?
1. Less than 40 2. 40-50 3. 51-60 4. 61-70 5. More than 70
As an Assistant Professor, at what type of university or college did you work?
1. Small liberal arts college 2. Baccalaureate’s college/university 3. Master’s college/university 4. PhD granting university
At how many professional conferences did you present while in graduate school?
1. None 2. 1-2 3. 3-5 4. 6-10 5. more than 10
How often did you present at professional conferences as an Assistant Professor?
1. Rarely 2. Once a year 3. Twice a year 4. Three or more times a year
As an Assistant Professor, about how much of your summers did you dedicate to research?

46
1. Three months 2. Two months 3. One month 4. Less than one month
As an Assistant Professor, how much research leave or sabbatical time did you receive from your university (excluding grants, fellowships, etc. that you earned from outside sources)?
1. None 2. Less than 6 months 3. 6-12 months 4. 13-24 months 5. More than 24 months
As an Assistant Professor, how much research leave time did you earn from fellowships, grants, and other sources outside the university?
1. None 2. Less than 6 months 3. 6-12 months 4. 13-24 months 5. More than 24 months
Did your university stop the tenure clock for you for reasons other than parenthood (e.g. to take care of an ill spouse or parent)?
1. No. I had no reason to request this. 2. No. I had a reason to request it, but chose not to. 3. No. I requested it but was denied. 4. Yes, for less than 12 months. 5. Yes, for 12-23 months. 6. Yes, for 24-35 months. 7. Yes, for 36 or more months.
As an Assistant Professor, on average, did you have one or more graduate students who served as research assistants (RAs)?
1. No 2. Yes, but only rarely 3. Yes, 1 assistant about half the time 4. Yes, 1 assistant most or all of the time or 2+ part-time assistants 5. Yes, 2 or 3 assistants most or all of the time 6. Yes, over 3 assistants most or all of the time
As an Assistant Professor, on average, did you have one or more undergraduate students who served as research assistants (RAs)?
1. No 2. Yes, but only rarely 3. Yes, 1 assistant about half the time 4. Yes, 1 assistant most or all of the time or 2+ part-time assistants 5. Yes, 2 or 3 assistants most or all of the time

47
6. Yes, over 3 assistants most or all of the time As an Assistant Professor, on average, did you have teaching assistants (TAs)?
1. No 2. Yes, but only rarely 3. Yes, 1 assistant about half the time 4. Yes, 1 assistant most or all of the time 5. Yes, 2 or 3 assistants most or all of the time 6. Yes, over 3 assistants most or all of the time
As an Assistant Professor, how much support did your university provide for conferences? (If the university paid using funding caps, rather than number of conferences, estimate the number of conferences for which you could have been fully reimbursed.)
1. The university did not pay for any conferences. 2. The university paid for me to attend 1-2 conferences per year. 3. The university paid for me to attend 3-4 conferences per year. 4. The university paid for me to attend 5 or more conferences per year.
For the conferences that you did attend, how did the university cover your costs?
1. The university did not pay for any conferences. 2. The university covered all costs associated with the conference. 3. The university had a cap on how much it would spend per year.
As an Assistant Professor, how big was the average annual research budget the university provided you? (If the budget did not come in annual increments, divide the total by the number of years you were an Assistant Professor to get an annual average.)
1. $0 2. less than $1,000 per year 3. $1,000-4,999 per year 4. $5,000-9,999 per year 5. $10,000-20,000 per year 6. more than $20,000 per year
Was your principal mentor during graduate school male or female?
1. Male 2. Female 3. I didn’t have a mentor
Was your principal mentor after graduate school male or female?
1. Male 2. Female 3. I didn’t have a mentor
While an Assistant Professor, in your opinion, what effect did your spouse/partner have on your productivity?
1. None, I was not married/did not have a partner. 2. A strongly positive effect 3. A weakly positive effect

48
4. No effect 5. A weakly negative effect 6. A strongly negative effect
While an Assistant Professor, was your spouse/partner also a professor?
1. No, I was not married/did not have a partner. 2. No, I was married/had a partner, but my spouse/partner was not a professor. 3. Yes, my spouse/partner was a professor in my discipline. 4. Yes, my spouse/partner was a professor but not in my discipline.
While an Assistant Professor, in what department were you employed?
1. Political Science, Government, or International Relations 2. Sociology 3. History 4. Geography 5. Interdisciplinary 6. Philosophy 7. Communications 8. Business 9. Other (please specify)
Methodology and Research Interests as an Assistant Professor (If you are currently an Assistant Professor, answer the questions as if they were stated in the present tense.)
As an Assistant Professor, in what substantive area did you mostly publish?
1. Comparative Interdisciplinary Studies 2. Comparative Politics 3. Diplomatic Studies 4. Environmental Studies 5. Ethnicity, Nationalism and Migration Studies 6. Feminist Theory and Gender Studies 7. Foreign Policy Analysis 8. Global Development Studies 9. Human Rights 10. Intelligence Studies 11. International Communication 12. International Education 13. International Ethics 14. International Health 15. International Law 16. International Organization 17. International Political Economy 18. International Political Sociology 19. International Security 20. Methods

49
21. Peace Studies 22. Scientific Study of International Processes 23. Study of the IR or Political Science Discipline, including Pedagogy 24. Other (please specify)
If you published equally in a second area, what was it?
1. None. The previous question captures the majority of my publications. 2. Comparative Interdisciplinary Studies 3. Comparative Politics 4. Diplomatic Studies 5. Environmental Studies 6. Ethnicity, Nationalism and Migration Studies 7. Feminist Theory and Gender Studies 8. Foreign Policy Analysis 9. Global Development Studies 10. Human Rights 11. Intelligence Studies 12. International Communication 13. International Education 14. International Ethics 15. International Health 16. International Law 17. International Organization 18. International Political Economy 19. International Political Sociology 20. International Security 21. Methods 22. Peace Studies 23. Scientific Study of International Processes 24. Study of the IR or Political Science Discipline, including Pedagogy 25. Other (please specify)
As an Assistant Professor, what methodology did you primarily employ in your publications?
1. Qualitative 2. Quantitative 3. Formal Modeling 4. Experimental 5. Counterfactual Analysis 6. Pure Theory 7. Legal Analysis 8. Ethical Analysis 9. Other (please specify)
If you used a second methodology equally in your publications, what was it?
1. None. The previous question captures the majority of my publications. 2. Qualitative

50
3. Quantitative 4. Formal Modeling 5. Experimental 6. Counterfactual Analysis 7. Pure Theory 8. Legal Analysis 9. Ethical Analysis 10. Other (please specify)
As an Assistant Professor, what theoretical framework or approach did you most often use in your publications?
1. Realism 2. Liberalism 3. Constructivism 4. Marxism 5. Feminism 6. Rational Choice 7. Post-modernism 8. Critical theory 9. Other (please specify)
If you used a second framework or approach equally in your publications, what was it?
1. None. The previous question captures the majority of my publications. 2. Realism 3. Liberalism 4. Constructivism 5. Marxism 6. Feminism 7. Rational Choice 8. Post-modernism 9. Critical theory 10. Other (please specify)
As an Assistant Professor, what is the main area of the world that you used for data in your publications? (Please read through the entire list before answering. In some cases, individual states are identified along with the broader region in which they are placed. Identify the term that most precisely captures your focus.)
1. United States 2. China 3. Russia 4. Japan 5. India 6. Mexico 7. North America (US, Mexico, Canada) 8. Western Europe and Canada 9. Eastern Europe 10. Former Soviet area

51
11. Central Asia and the Caucasus 12. South Asia, including Afghanistan 13. Southeast Asia 14. East Asia 15. Latin America (broadly) 16. Central America 17. South America 18. Middle East/North Africa 19. Sub-Saharan Africa 20. Oceania 21. Global analysis 22. Comparative analysis using several regions 23. Historical regions (Roman Empire, e.g.) 24. None
If you used a second state or region equally in your publications, what was it?
1. None. The previous question captures the majority of my publications. 2. United States 3. China 4. Russia 5. Japan 6. India 7. Mexico 8. North America (US, Mexico, Canada) 9. Western Europe and Canada 10. Eastern Europe 11. Former Soviet area 12. Central Asia and the Caucasus 13. South Asia, including Afghanistan 14. Southeast Asia 15. East Asia 16. Latin America (broadly) 17. Central America 18. South America 19. Middle East/North Africa 20. Sub-Saharan Africa 21. Oceania 22. Global analysis 23. Comparative analysis using several regions 24. Historical regions (Roman Empire, e.g.) 25. None
Publishing as an Assistant Professor (If you are currently an Assistant Professor, answer the questions as if they were stated in the present tense.)
How many draft articles were you typically working on at any given time?

52
1. One or two 2. Three 3. Four 4. Five or more
As an Assistant Professor, how many peer-reviewed articles did you publish?
1. None 2. 1-2 3. 3-5 4. 6-9 5. 10 or more
As an Assistant Professor, how many non-peer-reviewed articles did you publish?
1. None 2. 1-2 3. 3-5 4. More than 5
As an Assistant Professor, how many review articles did you publish?
1. None 2. 1-2 3. 3-5 4. More than 5
As an Assistant Professor, how many book reviews did you publish?
1. None 2. 1-2 3. 3-5 4. More than 5
As an Assistant Professor, how many book chapters did you publish?
1. None 2. 1-2 3. 3-5 4. More than 5
As an Assistant Professor, in general, how related to each other are the articles you published?
1. Same topic, but different venues 2. All related topics 3. Two different topics 4. Three or more different topics
As an Assistant Professor, how many times did you co-author an article?
1. Never 2. 1-2 times 3. 3-5 times 4. More than 5 times

53
As an Assistant Professor, how many books did you single-author?
1. None 2. 1 3. 2 4. 3 5. 4 or more
As an Assistant Professor, how many books did you co-author with only one additional author?
1. None 2. 1 3. 2 4. 3 5. 4 or more
As an Assistant Professor, how many books did you co-author with two or more additional authors?
1. None 2. 1 3. 2 4. 3 5. 4 or more
In your opinion, how important were large professional conferences to helping you publish as an Assistant Professor?
1. Not at all 2. A little 3. Fairly 4. Very
How much do you estimate that your Research Assistants helped you in achieving your publishing record while an Assistant Professor?
1. Significantly 2. Somewhat 3. Very little 4. Not at all 5. N/A, did not have any RA
Did you publish while still in graduate school?
1. Published two or more articles in a peer-reviewed journal 2. Published one article in a peer-reviewed journal 3. Published one article in a peer-reviewed journal plus one or more in a non-peer reviewed
journal 4. Published in a non-peer reviewed journal or a book chapter 5. Did not publish
Did you publish with your mentor or another faculty member while in graduate school?
54
1. Yes, once 2. Yes, twice 3. Yes, three or more times 4. No
As an Assistant Professor, from whom did you learn the most about how to publish?
1. Graduate school mentor 2. Colleagues from your employing university 3. Colleagues from your Ph.D.-granting alma mater 4. Co-authors 5. Spouse/partner 6. Figured it out by myself 7. Talks, workshops, etc. at conferences 8. Other (please specify)
While an Assistant Professor, with whom did you co-author most of your articles and/or books?
1. Always with men 2. Mostly with men 3. A nearly even mix of men and women 4. Mostly with women 5. Always with women 6. I did not co-author
While an Assistant Professor, before submitting an article for publication, how many times did you usually present it at a conference?
1. Never 2. 1 3. 2 4. 3 or more times
While an Assistant Professor, who provided the most important feedback on draft articles or chapters before you submitted them for publication?
1. Large conference (ISA, APSA, etc.) participants, including discussants, panelists, and audience members
2. Smaller conference (regional conferences, issue specific conferences, etc.) participants, including discussants, panelists, and audience members
3. Colleagues from your employing university 4. Colleagues from your Ph.D.-granting alma mater 5. Your mentor(s) 6. Your spouse/partner 7. Colleagues met at conferences, etc. 8. Other (please specify)
Which of the following best describes your publications during your Assistant Professor years?
1. I published only in English 2. Most of my significant publications were in English

55
3. My publications in English and other languages were about equal in terms of their significance
4. Most of my significant publications were in a language other than English 5. I published mainly in a language other than English
As an Assistant Professor, in what language other than English did you publish?
1. Spanish 2. French 3. German 4. Chinese 5. Russian 6. Arabic 7. Two or more of the above languages 8. Other (please specify)
How many of your publications were translations from one language to another, as opposed to original publications? (For example, if you published one article in English, translated it into Spanish and published it in a Spanish-language journal, you would mark “b” below.)
1. None 2. 1-2 articles were translations 3. 3-4 articles were translations 4. 5 or more articles were translations
Children and Childcare (If you are currently an Assistant Professor, answer the questions as if they were stated in the present tense.)
How many children under 5 years old did you have as an Assistant Professor? (Select the highest number that applies for the years you were at this rank.)
1. None 2. One 3. Two 4. Three 5. Four or more
What best describes your childcare situation as an Assistant Professor?
1. I did not use any paid care. My spouse/partner and I traded off taking care of our child(ren).
2. I did not use any paid care. My spouse/partner mostly took full-time care of our child(ren).
3. I did not use any paid care. I mostly had family members (parents, siblings, etc.) take care of my child(ren).
4. I mostly used a nanny, babysitter, or other paid in-home care. 5. I mostly used out-of-home care (daycare, preschool). 6. I used paid in-home and out-of-home care about equally.

56
As an Assistant Professor, how many hours a week were your children in the care of someone other than you or your spouse/partner?
1. 10 or less 2. 11-20 3. 21-30 4. 31-40 5. 41-50 6. over 51
As an Assistant Professor, who primarily took care of your children when they were sick, woke up in the night, and otherwise needed parenting?
1. I did. I am a single parent. 2. I did, although I was married or have a live-in partner. 3. My spouse/partner did. 4. A member (or members) of my extended family did. 5. My spouse/partner and I equally shared these responsibilities.
Did your university stop the tenure clock for you after you became a parent? (The times below reflect total time stopped, not per child.)
1. No. My university did not have a policy for stopping the clock for new parents. 2. No. My university had a policy to offer it, but I did not ask for it. 3. No. I asked for it, but I was denied. 4. Yes, for less than one year. 5. Yes, for one year. 6. Yes, for two years. 7. Yes, for three or more years. 8. I intend to ask for it, but have not yet done so.
Extra Comments What other factors, not captured above, do you think account for your success in publishing?
Is there anything else you would like to add, or to clarify?
Thank you!
Thank you for your time. This concludes the survey.
Clicking 'done' below will take you to a new site where you can request a copy of the initial survey results. You will also have the opportunity to volunteer to be interviewed about your publishing experiences. (The purpose of moving to a separate survey site is to preserve the anonymity of your responses to the survey you have just completed.)

57
Survey #2
Welcome Thank you for completing the ISA survey. You have been redirected here in order to keep your survey answers separate from any personal information you opt to disclose.
On the next page, you will have an opportunity to request a copy of our initial survey results, and can also volunteer to be interviewed about your experiences as an author.
Contact Information Would you like to be emailed a copy of our initial survey findings once they become available?
1. No thanks 2. Yes, please send it to this email address:
Interview Inquiry Would you be willing to be interviewed in-depth about your publishing experiences?
1. No 2. Yes. Please provide your name, institution, email address, and phone number
Conclusion Thank you!
If you have requested a copy of the survey results, they will be emailed to you once the survey has concluded.