wkcd – a brief history see 1998
TRANSCRIPT

WKCD – a brief history
• See http://en.wikipedia.org/wiki/West_Kowloon_Cultural_District
• 1998 HK Tourism Board (chairman Selina Chow 1996-2007) proposed to Legco that cultural and arts exhibitions...needed
• 1998 Tung Chee Hwa proposed the WKCD project• Stage 1 – 2001 design competition
• Stage 2 – 2004 ( when Donald Tsang was CS) IFP: Invitation for Proposal from developers - much criticized on:
1. the single packaged development approach
2. giant canopy
3. excessive commercial property development• Stage 3 – 2008 Legco funded the WKCD Authority $21.6 billion

Stage 1: 2001 Design Competition winner: Norman Foster

The Hong Kong Arts Development Council (ADC)
• ADC Chairman Mr. Darwin Chen in 2004
• Proposed to Desmond Hui, a WKCD financial study at HKU

• An Academic Financial Study
• For The West Kowloon Cultural District
• FOR DISCUSSION
• Commissioned by• The Hong Kong Arts Development Council
• Written by• Wong, Kwok-Chun; BSc(Building Studies), BBuilding, PhD (HK); MRICS; M
HKIS; Department of Real Estate and Construction
• and• Hui, Desmond C.K; B Arch(Cornell); M Phil, PhD(Cantab); OAA; MRAIC; H
KIA; RA; Department of Architecture
• of• Centre for Cultural Policy Research
• The University of Hong Kong
• 10 May 2004


To build this, we’ll need
$25.1 billion: total development cost

The $25.1 billion Total Development Cost:
(In $ billion)
Commercial Portion
Arts & Cultural Portion
Foster Scheme Features
Total
Construction Cost
8.2 5.4 3.9 17.5
Estimated Developer’s
Profit on Construction *
1.6 1.1 0.8 3.5
Interest cost 2.0 1.2 0.9 4.1
Total 11.8 7.7 5.6 25.1
*Development profit depends on property prices.
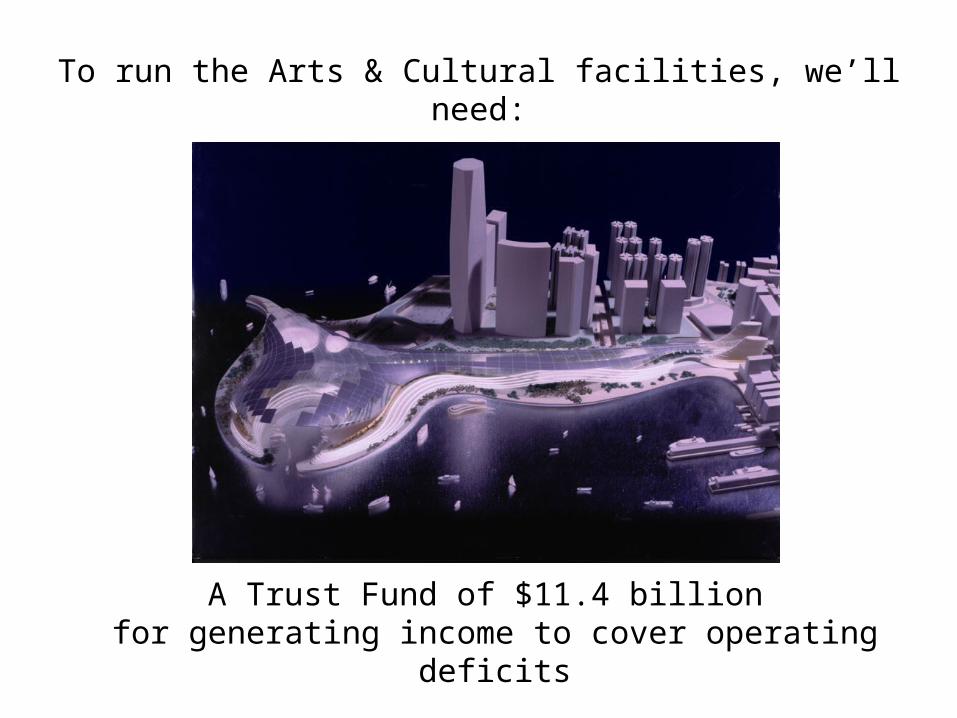
To run the Arts & Cultural facilities, we’ll need:
A Trust Fund of $11.4 billion for generating income to cover operating deficits

Where would this magic $11.4 billion
Trust Fundcome from?

The Commercial Portion’s Land Value: $24.6 billion
The Commercial Portion’sMarket Value: $36.4 billion
LESS its development Cost: $11.8 billion

Basis of this $36.4 billion Commercial Portion Market Value
(Total gross floor area:
In WKCD: 726,285 m2)
% gfa
in WKCD
Valued
@
Value
(in $ billion)
Retail 22% $70,000 psm 11.2
Residential 40% $75,000 psm 21.8
Arts & Cultural related retail 2% $35,000 psm 0.5
20,000 m2 Commercial
Open Space
$17,500 psm 0.3
1,790 Car parks Each: $450,000 0.8
Interest earned 1.8
Gross Value 36.4

This $24.6 billion Commercial Land Valuewould pay for:
Foster SchemeFeatures,
$ 5.6 billion ,23%
A $11.4 billionTrust Fund to
operate the Arts& Cultural
Portion,46%
The Arts &CulturalPortion,
$ 6.9 billion,28%
Other Arts &Cultural
Facilities, $ 0.75 billion,
3%

Would $11.4 billion be sufficient? Figures in
($ million)
Operating Principles
Government* Commercial**
Trust Fund 11,376 11,376
Museum of Modern Art (3,000) (280)
(Royalty)
Museum of Ink/Design (1,200) (1,200)
Surplus Asset 7,176 9,896
Assume 6% Yearly
investment return 431 594
Yearly operating deficits
(Arts & Cultural Portion)
(459) (144)
Depreciation allowance
(Assume 30 years)
(441) (441)
Net Yearly Surplus/Deficit (469) 9* Government principles are primarily the LCSD’s. ** Commercial denotes “Quasi-Commercial” principles – ticket pricing policies as those of LCSD’s.

Detailed Operations
Figures in $ million
Operating Principles
Government Commercial
10,000 seats Venue 24 48
2,500 seat Concert Hall (2) 7
Theatres A,B,C (9) 88
Broadway
Museum of Moving Image (18) (14)
Museum of Modern Art (205) (70)
Royalty
Museum of Ink/Design (120) (114)
Art Exhibition Area (7) 6
Water Amphitheatre & Piazza Areas (72) (65)
Programme Expenses (50) (30)
Yearly Operating Surplus/deficits (459) (144)

Alternative Market ScenariosScenarios: Price/ Rental levels :
Residential: price /m2
Per square feet (psf)
$95,000
$8,830
$85,000
$7,900
$75,000
$6,970
$65,000
$6,040
$55,000
$5,110
Retail portion: price /m2
Price psf
Monthly rental psf
$88,667
$8,240
$44
$79,333
$7,373
$40
$70,000
$6,506
$35
$60,667
$5,638
$30
$51,333
$4,771
$26
Land Value & Trust Fund (in $ billion)
Commercial Portion’s
Land Value 34.3 29.4 24.6 19.7 14.9
Arts & Cultural Facilities 13.2 13.2 13.2 13.2 13.2
Trust Fund 21.1 16.2 11.4 6.5 1.7
Yearly Surplus/Deficits: (in $ million)
Government principles 114 (178) (469) (761) (1052)
Commercial principles 592 300 9 (283) (575)

Stage 2: 2004 Invitation for Proposals 3 major proposals from developers
Dynamic Star HK World City Arts.. Parc (park of arts recreation & Culture)
Subsidiary of
Cheung Kong Henderson Sino , Chinese Estates
Wharf,

1. Dynamic Star (Cheung Kong)
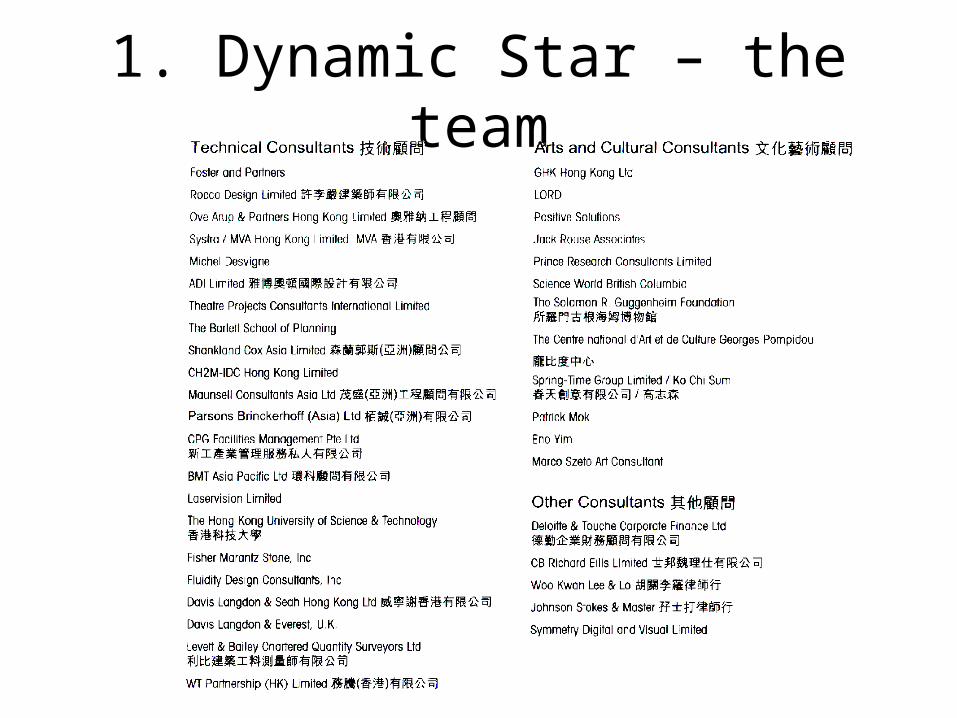
1. Dynamic Star – the team

2. World City (Henderson)

2. World City – the team

3. Parc (Sino, Chinese Estates, Wharf)

3. parc – the team

Stage 2 –Invitation for Proposal – 2005 Rafael Hui’s “solution”
much criticized on: Rafael Hui’s solutions:
the single packaged development approach
Require HKD 30 billion deposit from developers
giant canopy Scrap the giant canopy
excessive commercial property development
50% residential commercial land to be
auctioned openly

Specialist Advisor to the Subcommittee on West Kowloon Cultural District (WKCD) Development
for the study on The Financial Aspects of the WKCD Project for the Legislative Council Commission
Final Report 21 May 2008
Presentation on 24 may 2008by K C Wong, K W Chau, S K Wong, and P Yung
of Versitech Limited
( a wholly owned subsidiary of the University of Hong Kong)
Stage 3 – project completely re-viewed in 20062008 Legco funded $21.6 billion to WKCD
Authority

contents
• 1. a financial overview• 2. scenarios of private sector involvements• 3. on “design and build”• 4. capital, on-costs and operating costs• 5. risk and sensitivity analysis• 6. management organisation• 7. financial sustainability• 8. the question of M+• 9. on RDE: retail, dinning, and entertainments• 10. key parameters to be monitored• 11. funding priorities• 12. summary

GHK’s Financial Summary

GHK’s Financial Summary
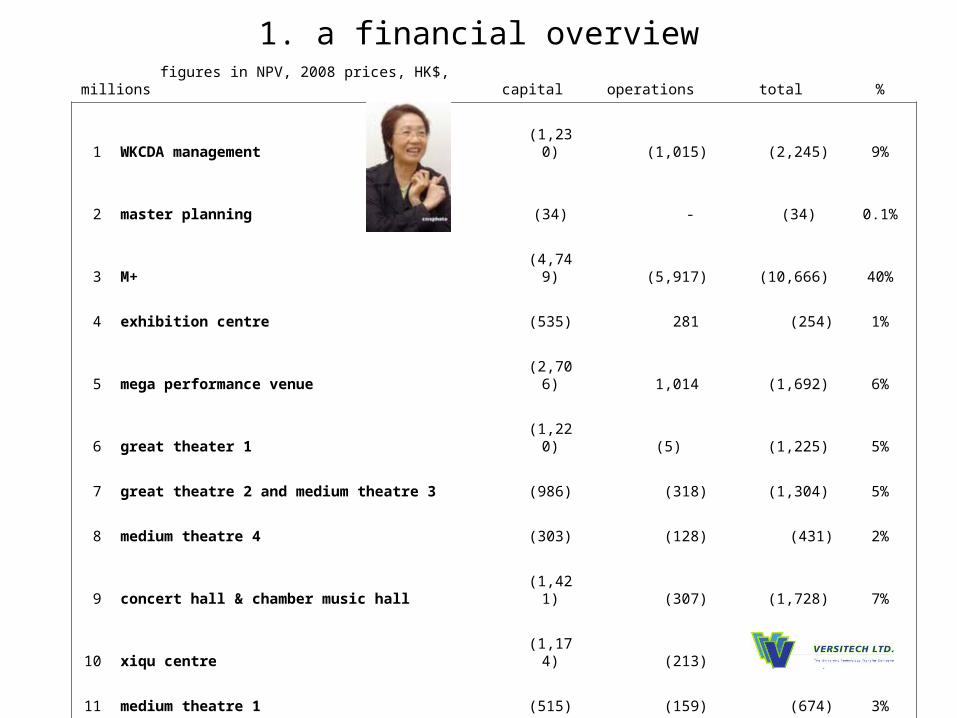
1. a financial overview figures in NPV, 2008 prices, HK$, millions capital operations total %
1 WKCDA management (1,230) (1,015) (2,245) 9%
2 master planning (34) - (34) 0.1%
3 M+ (4,749) (5,917) (10,666) 40%
4 exhibition centre (535) 281 (254) 1%
5 mega performance venue (2,706) 1,014 (1,692) 6%
6 great theater 1 (1,220) (5) (1,225) 5%
7 great theatre 2 and medium theatre 3 (986) (318) (1,304) 5%
8 medium theatre 4 (303) (128) (431) 2%
9 concert hall & chamber music hall (1,421) (307) (1,728) 7%
10 xiqu centre (1,174) (213) (1,387) 5%
11 medium theatre 1 (515) (159) (674) 3%
12 medium theatre 2 & black box theatre 1 (699) (213) (912) 3%
13 black box theatres 2 & 3 (320) (140) (460) 2%
14 black box theatre 4 (195) (104) (299) 1%
15 piazzas (310) - (310) 1%
16 other arts and cultural facilities (331) - (331) 1%
17 transport facilities (1,049) 179 (870) 3%
18 communal facilities (1,027) (537) (1,564) 6%
sub-total (18,804) (7,582) (26,386) 100%
19 RDE: retail, dinning & entertainment (2,765) 8,448 5,683 21.5%
total (21,569) 866
to be met by land values 21,288

30
2. scenarios of private sector involvements
options: 1A 1B 2
M+ ’s procurement
& operation
Same for all 3 Scenarios: design competition, design & build
Operate, Manage and Maintain by Not-for-Profit Organisation
private sector’s roles
on performing arts (PA) facilities
design & build only
do NOT finance, maintain, or
operate
design & build design & build
finance & maintain finance & maintain
do NOT operateown & operate
packaged PA facilities*
level of private sector involvement small medium large
total cost:
capital & operating $29,950 Mn5.8% more expensive
than 1A8.1% more expensive
than 1A
finance cost 6.1% p.a. 12.5% p.a. 12.5% p.a.
risk premiums allowed 23% 29.5% (p 34) 20.8%
operating costs
(over 50 years)
$8,333 Mn $8,333 Mn
same as 1A?
$8,569 Mn
almost the same as 1A?
efficiency gain due to larger private involvement
- Not allowed for
WKCD Authority’s costs Same for all 3 Scenarios : $2,117 Mn
* Package A: MPV + hotel 2,3 + RDE; B: MT1+ BBT2,3 + hotel 1 + RDE; C: residential, others A&C + transport, communal facilities

3. on “design and build”design & build conventional: separating design & build
Full performance specification needed tender after detailed design
This specification is never exhaustive
Could be reviewed and adjusted after detailed design, and before tendering
How to specify performance in terms of
comfort, space, aesthetics, quality of architectural detailing?
Without detailed design, BD contractor may cut costs to meet minimum
performance only
With detailed design, there can be much more accurate costs estimates for both
contracting parties:
lacks an architect’s independent view has architect’s independent view
May save time before tendering, but could be problematic if competition is used to
choose a design
Little longer time for detailing, but will pay off in terms of value for money
May be more costly to rectify problems, such as contractual dispute that occurs at
a later stage
Client knows exactly what it will get before committing resources
Suitable for, civil engineering projects, building services or buildings with
functional requirements only
More suitable for artistic and innovative complexes, like M+ and PA facilities
Appointment of an operator before conceptual design is most essential in both cases

4. capital, on-costs, and operating costs
Capital costs
NPV 2008
$ million
as % construction
cost
Compared to
Conventional/
Alternative
direct construction cost 11,012 100% unit costs are comparable
professional fees1,869
6% to 14.6% 6%
contract management 8% to 9% conventionally included in the developer’s normal profit: either the WACC(12.5% p.a.), or 10% profit on construction (H-11)WKCDA’s costs years 1-8 1,230 11.2%
risk allowances 2,850 25.9% 10% to 15% contingencies
major repair and renovation 2,891 26.3% Conventionally half-replaced
Not allowed for after 50 years
museum development 1,717 15.6% franchise fee $156 million for international operator
Total capital cost 21,569 195.9%Ref. FA page H-11 ; and WKCD-511
Annex 2, and 5(a)To be met by land value 21,288
Operating deficits
CACF, transport, communal 6,567
WKCDA’s costs years 9-50 1,015
Total operating deficit 7,582
To be met by RDE rental 8,448

5. risk and sensitivity analysis: any contingency plan?
Sensitivity Tests
AssumptionsFinancial
impactsin billion HK$
As % of $21.6 billion
ST2 Pessimistic Outcome in procurement and operations
- 5.7 -26%
ST4 50% Real Decrease in Land Premium -10.4 -48%
ST9 3% Real Discount Rate (instead of 4%) - 4.1 -19%
Tests still missing
Construction costs escalation(over 6% p.a. over past 30 years, much
higher than FA’s assumption of 2%)
mostSignificantespecially
first 5 years
to be assessedVolatility in investment returns
(no risk free investment tools at 6.1%)

6. management organisation
WKCDA management costsyears 1-8 development phase
WKCDA management costsyears 9-50 operation phase
1 Directors 90(5 departments: chief executive, planning
& development, property, finance, procurement. excluding consultants)
33(5 departments: chief executive,
area management, finance)Staff
2 Duties
land assembly and property master planning and project development
strategic and business planningcultural and arts policy liaison
legal, procurementcontracting and finance
estate management area marketing and programmingstrategic and business planning
cultural policy liaisonlegal, contract management
procurement and finance
3 Annual costs (HK$) 189.4 million 60.3 million
4 In 2008 NPV 1.23 billion 1.015 billion
5 Other supports out-source consultants Operations of individual facilities budget separately
Relevant questions:
1. What are the detailed duties, ranks, salaries, for these 90 (or 33) staff? 5. Would their duties overlap with the out-source consultants?
2. Would it be more cost effective to out-source some of these duties?
3. What are the detailed breakdowns of $189.4 and $60.3 million?
4. Compared with CACF (details down to the smallest theatre are provided), is the information too coarse to justify the funding of $2.245 billion?

7. financial sustainability
*3.378 billion = 20.639 billion x (1/1.04)^50 + (1/1.04)^100+… 20.639 billion = 21.568 – 0.873 billion (for museum collection) - 0.056 (for land cost of off site storage) in 2008 NPV
Under the current proposal of a 21.6 billion endowment fund
Capital costs: met by land values
Operating cost: met by RDE rental
After 50 years, there will be no funding provided for:
Major repair and renovations of
FFE , M&E
Renovation/reconstruction of building structures & fabric: assuming the buildings last only for 50 years
The additional seed fund needed for this purpose is $3.38 billion *
(i.e. 16% of the endowment, in PV terms, )

Museums M+
Solomon R.
Guggenheim Museum
(New York)
San Francisco Museum of Modern
Art
Museum of Modern
Art, New York
Metro-politan
museum of Art,
New York
Art Institute
of Chicago
Tate Modern London
Centre Pompidou
Paris
Exhibitarea sq. m
26,000 4,600 4,647 11,612 78,366 19,600 7,827 22,000
GFAsq. m
61,950 n.a. 20,911 73,420 200,000 64,400 43,000 103,305
ExhibitsDesign, popular culture, moving
image, visual art
Modern art
Modern art
Modern & con-
temporaryart
One of world’s
largest & finest art museum
Art museum
and schoolModern
art
Modern art & contemporary
creation,including design
& architecture
collection/history/
franchise fee
Cost$ 1,717 millionto be collected
in 4 years & developed
Franchise fee$156million in the 1990s
for Bilbao
Since 1935;nowover
22,000 objects
Founded in 1929;
now 150,000 pieces[7]
Opened in 1872;now
over 2 million works
Founded in 1879;
now over 25,000 pieces
Collection began in
1847;Tate Galleryfounded in1897; now 65,000 pcs
PreviouslyNational
Museum of Modern Art
opened in 1947;now
53,000 pcs *
Full time staff
336 95 F/T 232approx
590 F/T20 P/T
1,783 F/T744 P/T
725 F/T46 P/T
1,157 FTE 918 F/T63 Ct
Yearly acquisition
$20 million
$16 million
$11 million
$395 million
$774 million
$125 million
$264 million
$70 million
Adult fee $27.5 - $30 $137 $98 $156 $156 $94 various $103
Visitors per year
1.2 – 2 million 0.9 million
0.8 million
2.7 million
Over 4.0 million
1.4 million
4.0million
5.5million
cost recovery
18 - 22% 66% 59% 57% 55% 50% 54% 27%
8. the question of M+ : is it like Pompidou?
* Long collection history achieved “through the generosity of artists such as Picasso, Braque, Matisse, Chagall and Brancusi, which had hitherto been passed over by other institutions.”

8. the question of M+ (cont’d): the Guggenheim model
The FA’s conclusions on the Guggenheim model:
Question:
Guggenheim is not interested Did Guggenheim joint venture with Pompidou and HK’s Dynamic Star in 2005 for WKCD (IFP)? There was an open statement*
looking for “an open purse from the government”
Is this a serious claim, which should be supported by evidence and assessed financial figures?
want design, operational, curatorial control
Should this be welcomed? The FA also pinpointed that “The only direct local experience of large-scale museum operation lies with LCSD’s operation of public museums.”
Yet the largest local art museum that could provide local experts with suitable experience, namely the Hong Kong Museum of Art, is only 16% of the proposed size of M+.
Is this the best way for knowledge transfer? After all M+ is a $10.7 billion investment.
a pricey model Inconsistent with FA’s data: this model could save up to $4.8 billion, according to FA’s data provided so far. This is financially so significant that it should have been studied and compared very seriously than the way it is treated now.
* Statement still available on the web: http://www.guggenheim.org/press_releases/release_140.html

9. on RDE: Retail, Dining and Entertainment
119,000 sq.m gfa:( 2012 construction) a considerable size: bigger than Elements, potentially a rival if not planned very differently
Valued at monthly rental of $30 psf: Comparables are large malls: not scattered
scattered shops: how to ensure sufficient pedestrian flow in order to sustain $30
psf?
full integration of cultural venues and shops: a lengthy evolution process. London Theatre Land has more than 200 years history
Physical plan unknown: complements or conflict to arts facilities
RDE: CACF ratio = 2:5
A rather large ratio to be planned into CACF
not all developers are successful in RDE/malls. most successful ones own
substantial shares of their malls
successful malls/RDE depends on: expertise in planning, design, tenant mix, tenants’ relative locations, pedestrian flow, leasing, theme, promotion, management
Experience shows that public owners are likely to be less successful:
the level of private participation in WKCD’s RDE should be carefully considered
the current proposal might have implied 100% WKCDA ownership?
(otherwise, there is insufficient RDE rental to cover operating loss)
Comparing to operating details of CACF, those for RDE are clearly insufficient
Needs a good business plan for this life line

10. Key parameters to be monitoredThe publication of these information are essential:
The early appointment of operators
A time line for inviting proposals from
and appointment of operators
Investment return Investment portfolio and performance
Design quality Rules of design competition (open or by invitation)
IPF for professional services, design brief, selection criteria
Winning designs
Quality specifications Specifications for quality of materials and workmanship
Information on expenditures
Unit construction costs (CFA and GFA)
Professional fees
Project and contract management costs
Status of contingencies and risk allowances
Major repair and renovation costs
Management organisation Staff numbers, respective ranks, performance pledged and achieved
Utilization rates Number and types of visitors
Cost effectiveness Cost recovery rates for individual facilities

Cost item
Factors to consider
UncertaintyImprovement
PotentialFinancial
Significance
1WKCDA
Management
MediumRole & responsibility
not clear
Mediumin efficiency
Medium
2a M+ (capital cost)
HighCost, quality & outcome
highly uncertain with Design and Build
Highin procurement
(Except for costs of design competition
and consultant fees)
High
2b M+ (operating cost)High
Limited options available
Highin operation mode
HighMajor cost centre
3 Exhibition centre Medium** Low if procured traditionally
Low Low
4 Mega performance venue Medium* Low Medium
5 Great theater 1 Medium* Low Medium
6Great theatre 2 and medium theatre 3
Medium* Medium ## late in program
Medium
7 Medium theatre 4 Medium* Medium # Low
8Concert hall & chamber
music hallMedium*
* Low if procured traditionally Low Medium
11. funding priorities

Cost item
Factors to consider
UncertaintyImprovement
PotentialFinancial
Significance
9 Xiqu centre Medium* Low Medium
10 Medium theatre 1 Medium* Low Low
11Medium theatre 2 & black box theatre 1
Medium*Low Low
12Black box theatres 2 &
3Medium*
Low Low
13 Black box theatre 4 Medium* Low Low
14 Piazzas Medium* Low Low
15Other arts and cultural
facilitiesMedium*
Low Low
16 transport facilities Low Low Low
17 communal facilities Low Medium Medium
18Retail, dinning &
entertainment
HighLimited study on
demand, business concepts, and their
integration with other facilities
HighCan consider other modes of operation
such as private sector participation
High
Life line for financial sustainability
11. funding priorities (cont’d)

12. executive summary
1. This report assumes the principle that the WKCD should be financially self sufficient and financially sustainable within the 40 hectares of land.
2. The Method of comparing Scenarios of private sector involvement is questionable. Scenarios 1B and 2 are not sufficiently realistic to allow meaningful comparisons. Despite greater private sector participation in, no additional efficiency gain has been allowed for.
3. "Design and Build" is not a suitable procurement method for M+ and possibly not the best option for other core arts and cultural facilities as well.
4. Unit construction costs are within a reasonable range. On-costs are, however, higher than conventional.
5. The Financial Advisor’s (FA) sensitivity analyses have not covered the financial implications of risks in investment returns and in construction cost escalation. There are also no contingency plans for the worse cases scenario.
12. executive summary (cont’d)
6. There is no fund set aside for major renovations or re-constructions after 50 years, beyond which the WKCD may not be financially sustainable. An extra saving of $3.38 billion on capital and operating costs, equivalent to 16% of the $21.6 billion seed fund, is needed.
7. Under the FA’s operating assumptions, M+ would cost $10.7 billion to construct and operate for 50 years. By 2059, M+ would account for 89% of the WKCD’s yearly deficit. M+ might become a long term financial burden of the WKCD.
8. According to the information provided by the FA so far, should M+ be run by an international operator, the potential saving of $4.8 billion, in very crude terms, could be as high as 22% of the $21.6 billion seed fund.
9. RDE is the life line of the WKCD. Yet compared to the financial and operating details for Core Arts and Cultural Facilities (CACF), those information provided for RDE are clearly insufficient.
10. To build up the financial strength of the WKCD, one has to cut spending and earn more. It’s worthwhile to consider options for (a) reduction of on-costs; (b) a more efficient operation mode of M+; and (c) an effective business plan for RDE facilities, are essential.

Offices at WKCD?

Offices at WKCD - Cont’d

Cost data
• Davis Langdon & Seah International, Current Building Cost Information Data in Hong Kong, Quarterly; or
• http://www.dlsqs.com/ice/index.jsp?mod=newsview&showmodonly=newsview&op=view&catid=71