witty, justin aoc 2012 energy goals and actions at uhm
TRANSCRIPT

!Campus!Sustainability!Planning:!
An!Evaluation!of!the!University!of!Hawai’i!at!Mānoa’s!!Energy!Goals!and!Actions!
!!
Justin!Witty!!
!
Urban!and!Regional!Planning!AOC!
November!19,!2012!
!!
Abstract: Energy reduction at the University of Hawai’i at Mānoa has largely been dependent on mechanical upgrades and weekend/holiday conservation methods. These methods have not achieved the success envisioned in the stated 30% reduction goal by 2012 and have over-relied on Facilities and Grounds personnel to do the majority of the work. I argue that energy reduction efforts are needed from everyone on campus and increased collaboration and incentives are required to meet energy reduction goals. Drawing from common organizational barriers of public universities and of some energy reduction best practices I present a more complete understanding of the critical leverage points to successful campus energy reduction. These best practices highlight ways that others have encouraged energy conservation behavior, developed physical infrastructure upgrades, and purchased renewable energy platforms. Besides the actual projects themselves, three of these leverage points are crucial to campus energy management: strategic planning as an act of creating collaborative vision; encouraging and incentivizing energy education and behavior; and lauding the success of those making strides toward energy reduction goals.

! !
Table!of!Contents:!!
List%of%Figures% i!!Acronyms% ii%!1.!!Introduction! 1!! ! !2.!!UHM!Context! 1!! ! ! !Strengths%and%Opportunities! 4!!Weaknesses%and%Threats! 5!!Past%Energy%Reduction%Methods! 9!!3.!!Strategic!Energy!Planning:!Key!Aspects! 11!!Participatory%Process%and%Leadership! 11!!Budgeting%and%Implementation! 13!!4.!!Demand!Side!Energy! 15!!Information/Education!! 15!!Economic%Instruments!! 17!!Administrative%Policy! 18!!Physical%Improvements! 20!!5.!!Supply!Side!Energy! 22!!Renewable%Energy%Production%and%Purchase! 23!!Campus%System%Upgrades%to%Increase%Renewable%Energy%Effectiveness! 26!!6.!!Recommendations! 26!!Campus%Involvement! 27!!Energy%Management%Office! 28!!Leadership%and%Lauding%Success!! 30!

! !
!7.!!Conclusion! 31!!References! 32!!!
!!!!!!!!!!!!!!!!!!!!!!!!!!!

! i!
List%of%Figures%!Figure!1.!!UHM!Energy!SWOT!Matrix!! 3!!Figure!2.!!UHM!Campus!Building!Age!Graphs!! 7!!Figure!3.!!UHM!Building!Condition!Survey!! 8!!Figure!4.!!UHM!Campus!Electrical!Loads!by!End!Use!! 10!!Figure!5.!!Duke!Business!School!Energy!Efficiency!Process!! 11!!Figure!6.!!UHM!Organizational!Hierarchy!! 13!!Figure!7.!!Policy!Instrument!Categories!! 15!!Figure!8.!!Solar!Photovoltaic!Panels!on!a!Campus!Parking!Structure!at!Arizona!State!
University!!! 24!! ! !Figure!9.!!Distribution!of!Green!Revolving!Funds!by!Student!Enrollment!and!dollar!
amount!of!the!GRF! 25!!!!!!!!!!!!!!!!!!!!!!

! ii!
Acronyms!Used!%Federal%Agencies%or%Programs%AASHE!–!Association!for!the!Advancement!of!Sustainability!in!Higher!Education!ACUPCC!–!America’s!College!and!University!President’s!Climate!Challenge!CFDA!–!Catalog!of!Federal!Domestic!Assistance!DOE!–!Department!of!Energy!!EIA!–!Energy!Information!Administration!EPA!–Environmental!Protection!Agency%IRS!–!Internal!Revenue!Service!LBNL!–!Lawrence!Berkeley!National!Laboratory!LEED!–!Leadership!in!Energy!and!Environmental!Design!NOAA!–!National!Oceanic!and!Atmospheric!Administration!NREL!–!National!Renewable!Energy!Laboratory!ULSF!–!University!Leaders!for!a!Sustainable!Future!%State%of%Hawai’i%Agencies%or%Programs%DBEDT!–Department!of!Business,!Economic!Development!and!Tourism!HCEI!–!Hawai’i!Clean!Energy!Initiative!SOH!–!State!of!Hawai’i!%University%of%Hawai’i%at%Mānoa%%Agencies%or%Programs%HNEI!–!Hawai’i!Natural!Energy!Institute!MGD!–!Mānoa!Green!Days!MSC!–!Mānoa!Sustainability!Council!REIS!–!Renewable!Energy!and!Island!Sustainability!SOEST!–!School!of!Ocean!and!Earth!Science!and!Technology!UH!–!University!of!Hawai’i!Higher!Education!System!UHM!–!University!of!Hawai’i!at!Mānoa!%Universities%ASU!–!Arizona!State!University!ISU!–!Iowa!State!University!UCLA!–!University!of!California!at!Los!Angeles!UCSD!–!University!of!California!at!San!Diego!%Other%CFL!–!Compact!Fluorescent!Lamp!CREB!–!Clean!Renewable!Energy!Bond!EMO!–!Energy!Management!Office!EPEAT!–!Electronic!Product!Environmental!Assessment!Tool!ESCo!–!Energy!Service!Company!GHG!–!Green!House!Gas!GRF!–!Green!Revolving!Fund!GRITS!–!Green!Revolving!Investment!Tracking!System!

! iii!
HVAC!–!Heating,!Ventilation,!and!Air!Conditioning!IT!–!Information!Technology!kWh!–!Kilowatt!Hour!LPG!–!Liquefied!Petroleum!Gas!or!“Propane”!MW!–!Mega!Watt!O&M!–!Operations!and!Maintenance!P2!–!Pollution!Prevention!PPA!–!Power!Purchase!Agreement!PV!b!Photovoltaic!SAQ!–!Sustainability!Assessment!Questionnaire!SEI!–!Sustainable!Endowment!Institute!SNG!–!Synthetic!Natural!Gas!SRA!–!Source!Reduction!Assistance!SWOT!–!Strengths,!Weaknesses,!Opportunities,!and!Threats!TCO!–!Total!Cost!of!Ownership!!

! 1!
1.##Introduction# The University of Hawai’i higher education system (UH) is the second largest user of energy in the State, behind the US Military (UH Mānoa , 2006). Of the 183 million kWh of electricity used in 2011 by the UH system, the University of Hawai’i at Mānoa accounted for roughly 60% of the total (Department of Business, Economic Development, and Tourism, 2012; Newcomb, Anderson & McCormick Consultants, 2011). Over $23 million was spent on electricity alone for the Mānoa campus in 2011, not including costs for other energy sources such as natural gas or transportation fuels that are also used on campus (Newcomb, Anderson & McCormick Consultants, 2011). These numbers are particularly troubling in the current economic recession where higher education is usually high on the list for budget cuts, increased State and Federal regulations create need for more administrators, and national alumni donations are at an all-time low (Grummon, 2011). Other prospective realities such as rising oil and gas prices, an interest rate that can only get higher, and an economic recovery that could be several years to a decade away all loom on the horizon (Grummon, 2011). These issues, combined with other obstacles for UHM such as aging infrastructure and maintenance backlogs, will continue to challenge energy reduction efforts. However, tight budgets and rising energy costs also provide an opportunity to promote energy conservation, efficiency, and the use of renewable energy (Simpson, 2003). When the budget is tight there is more focus put on financial savings methods and perhaps incentives to become more energy efficient. Many colleges and universities around the country have developed and instituted their own methods for achieving energy savings goals on campus. This paper reviews College and University planning efforts with regard to energy consumption and discusses UHM’s energy plans and their to-date accomplishments. Section 2 will discuss some of the organizational strengths and weaknesses of the University of Hawai’i at Mānoa. Section 3 focuses on the key aspects of strategic planning and how it can help build awareness and consensus related to campus energy use. Sections 4 and 5 review and discuss methods used at other US colleges and universities to establish key elements to a comprehensive energy plan and examples of best practices that could potentially be introduced to the UHM campus and other locations in Hawai’i. Section 6 proposes some recommendations for systemic change and energy reduction on campus, followed by a conclusion in Section 7. 2.##UHM#Context# The University of Hawai’i at Mānoa is the flagship campus of the University of Hawai’i system and is the main research institute in Hawai’i. It is a land, sea, and space grant university which enrolls over 20,000 students, and employs almost 8,200 full or part time employees including 2,300 faculty (Mānoa Institutional Research, 2011). Of the 20,000 students, over 4,000 reside on campus in UHM managed housing. UHM has over 300 buildings and 6 million total square feet of building floor space used for various purposes such as housing, food service, instruction, research, and administration (Newcomb, Anderson & McCormick Consultants, 2011).

! 2!
Due to the remote location of Hawai’i, approximately 2,500 miles from the western United States, 91% of the consumed energy is imported to the islands, with petroleum making up 85%. Other fuel sources include small amounts of imported coal (6%), waste burning for energy, and local renewable energy such as geothermal, wind, hydro, and solar (State of Hawaii Energy Resource Coordinator, 2010). The University uses Synthetic Natural Gas (SNG) and Liquefied Petroleum Gas (LPG) also known as Propane, to provide an alternative to electricity; however, these fuel sources are made from coal and the byproducts of crude oil during the refining process (Newcomb, Anderson & McCormick Consultants, 2011). Spending over $23 million for electricity in fiscal year 2011, UHM used a total of 109 million kWh of electricity, 415,000 Therms of SNG, and an undisclosed amount of diesel and gasoline (Newcomb, Anderson & McCormick Consultants, 2011). Since the energy rate in Hawai’i is substantially higher than the continental US it is important when making comparisons to focus on the kWh or Therms used rather than the dollar cost, otherwise UHM would rank with other universities two or three times its size. The dollar cost will be used to significant effect when it comes to deciding which energy reduction projects to pursue. Many projects that wouldn’t normally produce a high enough rate of return for other campuses in the contiguous United States may prove worth the investment in Hawai’i. This could provide a more diverse selection of energy saving projects and programs from which to choose. According to a 2011 energy audit of the campus, UHM uses approximately 1% of the total energy consumed in Hawai’i (Newcomb, Anderson & McCormick Consultants, 2011). Reduced energy use and increased renewable energy production on the UHM campus will have a substantial impact on the Hawai’i Clean Energy Initiative (HCEI) goals of 40% renewable energy production and 30% energy reduction across the state. UHM also represents the cutting edge of research and access to environmental sustainability knowledge through programs such as the Hawai’i Natural Energy Institute (HNEI) and UH Sea Grant. UHM’s influence over the other University of Hawai’i (UH) System campuses and Hawaiian businesses and industry could be profound in affecting transformation across the State. UHM has committed to several energy goals, endorsed by Interim Chancellor Denise Konan in 2006. These goals are in line with other universities and could position the university as a leader in sustainability if achieved. However, no UHM Chancellor since 2006 has publicly endorsed these policy goals. The University of Hawai’i at Mānoa’s Green Building Design and Clean Energy Policy (2006) states that it will reach a:
• 30% reduction of campus-wide electricity use by 2012, based on a 2003 benchmark; • 50% reduction of campus-wide electricity use by 2015, based on a 2003 benchmark; • 25% of campus-wide energy use supplied by renewable sources by 2020; and • by 2050, the Mānoa campus will achieve self-sufficiency in energy and water, will treat
and transform its wastes into useable resources through conservation and re-use, and through its adoption of renewable energy technologies.
The FY 2011 electricity reduction was only 15% from the 2003 baseline, meaning UHM has only one year to reduce an additional 15% to make the 2012 goal of 30% reduction (Newcomb, Anderson & McCormick Consultants, 2011). In order to reach these goals there are a variety of barriers and critical leverage points that can either hinder or help the energy reduction process.

! 3!
A tool developed by the Harvard Business School to identify potential issues and opportunities is called Strength, Weakness, Opportunity, and Threat (SWOT) analysis (Paris, 2003). It is a process of delineating both internal (strength, weakness) and external (opportunity, threats) conditions that allows self-discovery, consensus building, and organizational visioning.
Strengths Weaknesses
S.1 High energy costs that make energy reduction projects have shorter payback periods in Hawai’i
W.1 Lack of driving University Leadership and commitments
S.2 A research university with systems to take advantage of energy research grants
W.2 Diminishing budget to put toward Capital Investment
S.3 In house expertise on numerous renewable energy technologies within HNEI and REIS
W.3 Low importance of energy due to its small percentage of the overall UHM operating budget
S.4 Strong tradition of Strategic Planning and Research with necessary systems already in place
W.4 Complex organizational structure with transient executive administration and student body
S.5 Design, build, and operate their own physical infrastructure
W.5 Aging Physical infrastructure and lack of facilities staff
S.6 State resources are aligned with university priorities W.6 Large deferred maintenance resource necessity
S.7 “Right timing” energy efficiency projects with necessary building renovations gives a higher investment return
W.7 Limited installed sub-metering for benchmarking and data analysis
S.8 Student participation with little to no cost through volunteers, class projects, or student jobs
W.8 Low individual awareness for UHM energy reduction efforts or Renewable Energy utilization
W.9 Narrow focus of UHM Energy Policy on electricity only
W.10 Limited rooftop area to meet renewable energy needs with Solar PV
Opportunities Threats
O.1 Increased funding through renewable energy and energy infrastructure research grants T.1 Non-compliance with State Mandates
O.2 Healthier classrooms, higher productivity, and less maintenance from better designed buildings
T.2 Low incentives for students, faculty, or staff to save energy
O.3 Reduced uncertainty and risk from fuel and energy price increases
T.3 Excessive energy use with increasing amount of personal electronics and appliances on campus
O.4 Existence of off-campus sites for renewable energy production
T.4 Risk of increased energy costs lead to increased tuition and loss of student enrollment
Figure 1. UHM Energy SWOT Matrix

! 4!
Strengths)and)Opportunities) Ranked by the National Science Foundation as one of the top 30 public universities for federal research in engineering and science, UHM garnered 34% of its FY 2009-2010 budget from federal grants and contracts (Mānoa Institutional Research, 2012). With an additional 3% of funding coming from State and local grants or contracts, UHM brings in more money from research than State and Federal appropriations or tuition and fees at 29% and 24% respectively (Mānoa Institutional Research, 2012). The strength of having the relationships established, contracting offices in place, and a background in earth sciences and engineering gives UHM a good advantage when it comes to energy related research. The Hawai’i Natural Energy Institute (HNEI) is a research arm of the School of Ocean and Earth Science and Technology (SOEST) and conducts research and testing of innovative renewable energy technology. These resident energy experts are working “right next door” and could be leveraged to become more engaged with the energy solutions for the campus or better perpetuate their knowledge to the UHM students, faculty, and staff. Other UHM leverage points are the Center for Renewable Energy and Island Sustainability (REIS), at the College of Engineering, and the Hawai’i Energy Policy Forum, part of the College of Social Sciences, which are both inter-disciplinary research groups that explore issues regarding energy and energy policy in Hawai’i. Another advantage is that there is a history of participatory planning within the university setting. The UHM Strategic Planning Coordinator, Susan Hippensteele, has used this planning format when developing the 2011-2015 UHM Strategic Plan. The collaborative process included over 1400 students, faculty, staff, and various stakeholders and includes a 15-person Strategic Plan working group to oversee the implementation (UHM, 2011). Public institutions can also lead the way for investing in better buildings because they are one of the few sectors that build, own, and operate the spaces in which they invest (UNEP, 2007). Many times in the residential or private business sector the investment and design of a building is separated from those who occupy and pay the operational costs of a building, providing little incentive for energy efficiency. By integrating “life cycle costs” into the analysis of building design and investment, it is more apparent that spending a little more upfront can save drastically over the lifespan of a building. Governments and public institutions construct, own, and operate a large proportion of the country’s infrastructure and will see larger returns on good design investment than private developers (Lovins, 2011). Many unseen additional benefits exist such as healthier classrooms, more student involvement, and more practical learning for students, however these areas are not easily quantifiable. Measuring performance is complex and challenging; although some have tried, such as Heschong, L., Wright, R., & Okura, S. (2002) who show a 20-26% rate of improvement in student test scores in well day lit classrooms throughout several elementary schools in the US. Improved learning, fewer employees’ sick days, and higher worker productivity are difficult to measure and even harder to monetize making it tough to compare projects objectively. For this reason a Cost Effectiveness analysis is used in many health related fields that require comparison in natural units like lives saved or in this case test score improvement (Robinson, 1993). This may

! 5!
make it easier to compare health or academic benefits between projects since these areas are not easily monetized. There are also the benefits such as student/faculty retention, environmental benefit, and brand value of the UH Mānoa name. This may in turn garner more research grant dollars and more opportunities for collaboration with other private partners. According to the UHM Strategic Plan, Achieving our Destiny, goals of improving retention, raising graduation rates, and reducing the maintenance backlog are all high priorities for the university. Linking the budgetary requirements of projects to certain strategic goals is also important toward project justification and priority. When a project can fulfill multiple strategic goals it should be taken into consideration for a higher priority even when facing budgetary or contracting difficulties. Other unseen benefits of retrofits and downsizing also show reduced but un-quantified maintenance costs. Less time spent changing light bulbs due to longer life spans, smart meters that send electricity data to a central computer, or installing environmental management tools that allow understanding of multiple systems can all help reduce workloads and save man hours (Lovins, 2011). Also some energy reduction projects have synergistic effects when combined with other projects. According to a report by the United Nations Environment Programme (2007) their rule of thumb is that for every three watts of lighting energy saved an additional watt of air-cooling can be saved as a result. In effect, a reduction in lighting makes it possible for a follow on reduction in HVAC either from making the AC work less to possibly downsizing the entire system. Another benefit that university leadership must keep in mind is the reduced threat from fuel price spikes allowing for better long term budgeting and planning. All these additional factors attributed to better design, a healthier campus, a more aware student body, and energy reduction all reduce risk for the future and will help achieve some of the strategic goals of the university (Lovins, 2011). Having access to State Government resources is another advantage since Hawai’i has developed its own energy goals, state mandates, and State Energy Office. According to Berke and Godshalk (2009), state mandates produce consistently higher quality plans because they encourage local government to develop a better information base. Extra emphasis due to knowing someone else is invested in the same outcomes, collaborative team building, and access to extra resources are additional reasons for better implementation results. This concept can be expanded to include internal policies and mandates. Just as the State develops resources to facilitate energy conservation and reduction at the public facility level, UHM can institute policies that require individual departments or colleges to reduce energy in some ways. This could allow for more systemic learning and behavior change and can decentralize some of the implementation to the deans, faculty, and students, rather than leaving implementation to Facilities and Grounds staff only. Weaknesses)and)Threats) Hawai’i pays the highest electricity rates of any state in the United States. On Oahu the current rate is approximately $0.35 a kWh for residents and an industrial rate of $0.21 plus appropriate

! 6!
fees, as of September 2012 (HECO, 2012). An average cost in 2011 for the University was $0.212 per kWh meaning that the difference between meeting the 30% savings goal as opposed to only making 15% reduction costs the university $4 million a year. An increase of just five cents to $0.26 and that figure increases to $5 million. In 2006 the rate was $0.16 so it is not uncommon for significant rate increases to occur in short time spans (UHM Facilities Management, 2008). Even as electricity use is being reduced, prices are rising and the total electricity bill may exceed last year. Starting energy reduction projects near-term is essential to take advantage of these avoided costs. A major problem for prioritizing projects is that some benefits are hidden from view. Pearce and Miller (2006) believe one of the four main barriers for sustainability at the university level is the “relative invisibility of operations for decision makers.” Energy reductions are a relatively low priority overall because of the aforementioned rising costs despite energy use reductions, the hidden benefits such as improved health or reduced maintenance costs, and the relative scale of the energy costs in comparison to an overall administrative budget. For example in 2008 energy costs comprised only 2% of the $902 million budget, which included personnel and operations (Office of Vice Chancellor for Administration, Finance, and Operations, 2009). Additional barriers they identify include deferred maintenance backlogs, lack of initial capital/labor, and sub-optimal behavior of building occupants, which will be addressed later in the paper. A university is a public institution with a complex organizational hierarchy. It is often said that “the faculty are the university” but a modern research university, much like a modern democracy, has many checks and balances and has several bases of power. Often these power bases are the Board of Regents, the President or Chancellor, and the Faculty (O'Brien, 1998). In many places the students also play a large part in campus decisions and as the “clients” hold much more power than many give credit (Moore, J., Pagani, F., Quayle, M., Robinson, J., Sawada, B., Spiegelman, G., & Van Wynsberghe, R., 2005). Organizing the variety of interests into a common vision is time consuming but can be very successful and productive. Other barriers to change are organizational culture, power pockets, and an individual belief that their actions have little effect on the whole (Sharp, 2002). The University is a public state institution, so funding and Board of Regents appointments come from outside the university, which may make systematic or sweeping changes difficult internally. This is in spite of the fact that the amount of public funding that comes from state tax dollars is only 26% of the total funding in 2009-2010 (Mānoa Institutional Research, 2012). Even though institutional change is difficult the energy reduction goals of the university fit in with the HCEI goals mandated by the State, so it should be supported externally. This is tempered by the fact that even though people may express a need for change they are still resistive due to uncertainty, risk, or potential power shifts (Chaskin, R., Brown, P., Venkatesh, S., & Vidal, A., 2001). The aging infrastructure of the UHM campus is also a problem. With a mean age of 33 years, the building envelopes are not sealed properly, the HVAC systems are out of date, and some buildings and spaces are not being utilized as they were originally designed (Figure 2). Some students though are working to better understand how these spaces are currently being used in a program called UHM Building Information Model (BIM). They are inventorying and modeling over 3.5 million square feet of classroom, office, and laboratory space in an effort to better

! 7!
understand the infrastructure needs of the campus and to better organize the utilized space for departmental and classroom scheduling (Simonich, 2012). By better integrating the energy use data from electricity smart meters, building sub meters, and mesh networks into the already built floor plan database, there is an opportunity to have a real time picture of the energy use by space, for the campus. This project could eventually be used for advanced energy simulation and building energy performance analysis, turning what was merely meter data into knowledge campus planners can use to make better-informed decisions for the future.
Figure 2. UHM Campus Building Age Graphs, (UHM, 2008) This presents an opportunity for deep energy retrofits, which are focused more on improved architecture and design than on system upgrades. An example of this is the comparison of a lighting retrofit program that replaces high wattage incandescent light bulbs for low wattage Compact Fluorescent Light bulbs (CFLs) versus integrating more day lighting and reducing the amount of total light bulbs, as well as using low wattage CFLs where needed. The second option will cost more and take longer to implement, however, these deep retrofits tend to be cost effective when the building energy efficiency is very poor or when the building and internal systems are approaching the end of their useful life, thus requiring a major retrofit anyway. These projects are sometimes referred to as Capital Investment projects rather than just energy efficiency upgrades. By “right timing” or synchronizing these upgrades with necessary replacement of equipment that has come to the end of its useful life, the costs can usually come out the same as basic replacement. This is especially effective if you can downsize the original equipment and use smaller (hence more efficient) models. This requires a full understanding and projection of the building maintenance schedule so a retrofit is not planned after a new system has recently been installed. With the amount of planned renovation on the campus currently there may not be enough personnel or resident knowledge to take advantage of these right timing scenarios and using an Energy Service Company (ESCo) may be advantageous. Act 96 of the 2006 State Legislature stipulates that UHM is obligated to reduce energy consumption 30% by 2030. It also states that all new construction and large scale retrofit projects meet or exceed Leadership in Energy and Environmental Design (LEED) Silver ratings and all new laboratories built on campus must meet the LABS 21 Environmental Performance Criteria (Newcomb, Anderson & McCormick Consultants, 2011). Since 2006, UHM has added three new
! 8!
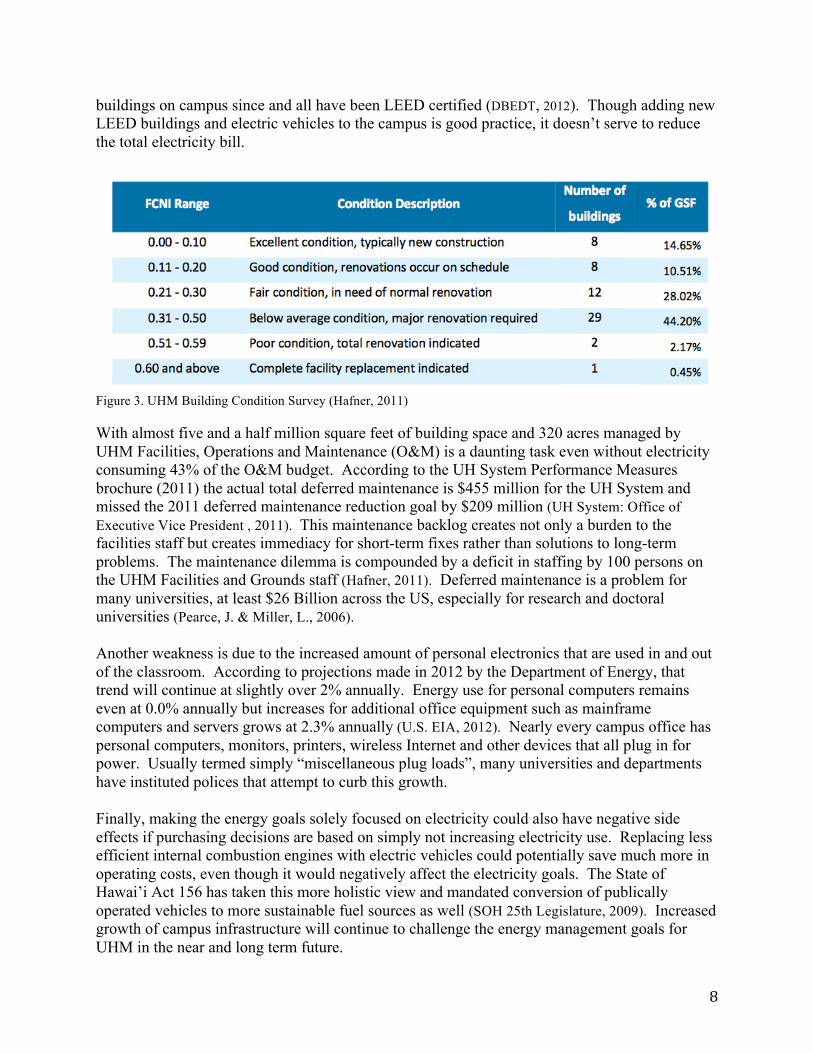
buildings on campus since and all have been LEED certified (DBEDT, 2012). Though adding new LEED buildings and electric vehicles to the campus is good practice, it doesn’t serve to reduce the total electricity bill.
Figure 3. UHM Building Condition Survey (Hafner, 2011) With almost five and a half million square feet of building space and 320 acres managed by UHM Facilities, Operations and Maintenance (O&M) is a daunting task even without electricity consuming 43% of the O&M budget. According to the UH System Performance Measures brochure (2011) the actual total deferred maintenance is $455 million for the UH System and missed the 2011 deferred maintenance reduction goal by $209 million (UH System: Office of Executive Vice President , 2011). This maintenance backlog creates not only a burden to the facilities staff but creates immediacy for short-term fixes rather than solutions to long-term problems. The maintenance dilemma is compounded by a deficit in staffing by 100 persons on the UHM Facilities and Grounds staff (Hafner, 2011). Deferred maintenance is a problem for many universities, at least $26 Billion across the US, especially for research and doctoral universities (Pearce, J. & Miller, L., 2006). Another weakness is due to the increased amount of personal electronics that are used in and out of the classroom. According to projections made in 2012 by the Department of Energy, that trend will continue at slightly over 2% annually. Energy use for personal computers remains even at 0.0% annually but increases for additional office equipment such as mainframe computers and servers grows at 2.3% annually (U.S. EIA, 2012). Nearly every campus office has personal computers, monitors, printers, wireless Internet and other devices that all plug in for power. Usually termed simply “miscellaneous plug loads”, many universities and departments have instituted polices that attempt to curb this growth. Finally, making the energy goals solely focused on electricity could also have negative side effects if purchasing decisions are based on simply not increasing electricity use. Replacing less efficient internal combustion engines with electric vehicles could potentially save much more in operating costs, even though it would negatively affect the electricity goals. The State of Hawai’i Act 156 has taken this more holistic view and mandated conversion of publically operated vehicles to more sustainable fuel sources as well (SOH 25th Legislature, 2009). Increased growth of campus infrastructure will continue to challenge the energy management goals for UHM in the near and long term future.

! 9!
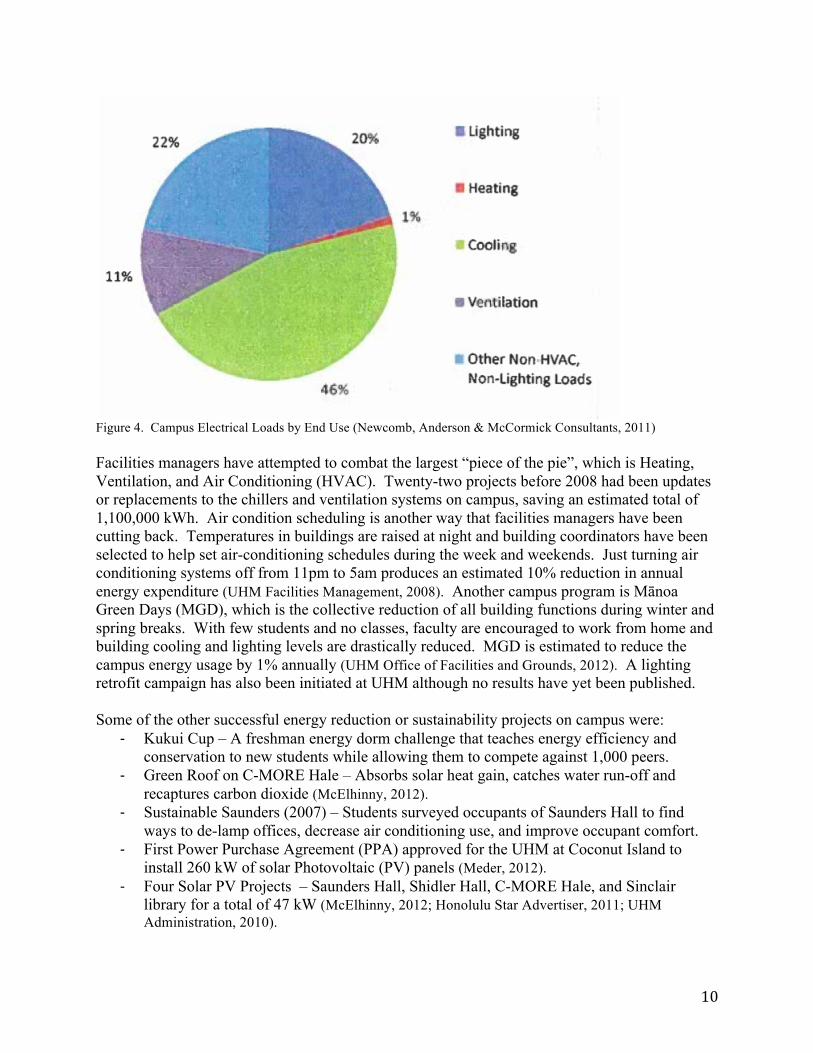
Past)Energy)Reduction)Methods) Energy reduction by 15% is still a tremendous accomplishment for such a large institution and UHM utilized a variety of methods to achieve this reduction. A building energy metering and benchmarking program was initiated on campus that will allow 25 buildings on campus to be sub-metered and consequentially have some form of energy benchmark in place (Newcomb, Anderson & McCormick Consultants, 2011). There are also some sub-meters for the SNG on campus, which allows for benchmarking on 26 campus buildings. Performance measuring and benchmarking is an essential step in reducing energy use throughout the campus but is challenged by its basic design. The UHM electrical grid was developed years ago when there was no need for the electricity to be monitored at the building level so the campus buildings don’t all have sub-meters. It is also difficult to disaggregate electricity use for a chilled water loop, used in air conditioning, which services multiple buildings but is only monitored on one building meter. These problems make benchmarking a fundamental challenge to any environmental management or energy savings program. Metering and benchmarking are essential methods of evaluating the success of campus energy conservation or efficiency projects. Without a baseline there is no way to know if a decrease in energy use is contributable to the energy reduction project, the weather, or some unknown factor. Especially when electric vehicles, constructing more buildings, or increasing student enrollment adds to the total energy bill, it can be very hard to see value in energy saving projects unless they are closely monitored for analysis. For this reason, in 2009 the State of Hawai’i enacted Act 155, which states that any state department managing buildings must benchmark each building over 5,000 square feet using the ENERGY STAR portfolio management tool (HCEI, 2010). This shows that it is not only something that UHM should do; it must be done according to State law. Building simulation and modeling conducted by Newcomb, Anderson, and McCormick (2011) show the average breakdown of energy use for buildings on campus in Figure 4. While the models could not be compared to actual data due to the energy benchmarking problems mentioned above, for general purposes they appear consistent with data collected from other sources in Hawai’i (Peppard, E., Maskery, J., & Witty J, 2011). The current major energy expenditures at UHM are cooling for buildings 46%, plug loads at 22% and lighting at 20% (Figure 4). With this kind of data it is easy to see that efficiency gains from natural ventilation, day lighting, and appliance awareness should be utilized. Understanding actual building energy disaggregation can be a tool for energy project targeting and is a necessary step toward energy reduction and net-zero energy use by 2050.
! 10!
Figure 4. Campus Electrical Loads by End Use (Newcomb, Anderson & McCormick Consultants, 2011) Facilities managers have attempted to combat the largest “piece of the pie”, which is Heating, Ventilation, and Air Conditioning (HVAC). Twenty-two projects before 2008 had been updates or replacements to the chillers and ventilation systems on campus, saving an estimated total of 1,100,000 kWh. Air condition scheduling is another way that facilities managers have been cutting back. Temperatures in buildings are raised at night and building coordinators have been selected to help set air-conditioning schedules during the week and weekends. Just turning air conditioning systems off from 11pm to 5am produces an estimated 10% reduction in annual energy expenditure (UHM Facilities Management, 2008). Another campus program is Mānoa Green Days (MGD), which is the collective reduction of all building functions during winter and spring breaks. With few students and no classes, faculty are encouraged to work from home and building cooling and lighting levels are drastically reduced. MGD is estimated to reduce the campus energy usage by 1% annually (UHM Office of Facilities and Grounds, 2012). A lighting retrofit campaign has also been initiated at UHM although no results have yet been published. Some of the other successful energy reduction or sustainability projects on campus were:
, Kukui Cup – A freshman energy dorm challenge that teaches energy efficiency and conservation to new students while allowing them to compete against 1,000 peers.
, Green Roof on C-MORE Hale – Absorbs solar heat gain, catches water run-off and recaptures carbon dioxide (McElhinny, 2012).
, Sustainable Saunders (2007) – Students surveyed occupants of Saunders Hall to find ways to de-lamp offices, decrease air conditioning use, and improve occupant comfort.
, First Power Purchase Agreement (PPA) approved for the UHM at Coconut Island to install 260 kW of solar Photovoltaic (PV) panels (Meder, 2012).
, Four Solar PV Projects – Saunders Hall, Shidler Hall, C-MORE Hale, and Sinclair library for a total of 47 kW (McElhinny, 2012; Honolulu Star Advertiser, 2011; UHM Administration, 2010).

! 11!
, Kuykendall Hall (prospective) – Hawaii’s first net-zero building on campus integrating natural ventilation, LED lighting design, and integrated solar PV.
, Energy Curriculum (prospective) – Currently undergoing development and strategic visioning.
Even with a succession of profitable and sustainable programs and projects there has still not been transformational change on the campus in relation to energy use. UHM hasn’t scaled up from these demonstration projects to influence large enough energy reductions across the entire campus. A difference must be realized between successful projects and institutional change (Sharp, 2002). 3.##Strategic#Energy#Planning:#Key#Aspects# Strategic planning is a tool used for long term planning, especially during uncertain times, in order to shape the direction and vision of an organization. It incorporates many different aspects of the specific environment, organizational missions, and budgets to provide a way ahead toward the envisioned future. Strategic planning is much more concerned with imprecise variables and probable trends as opposed to long term planning which usually assumes a linear future or status quo along the planning horizon (Paris, 2003). One of the most notable hallmarks of strategic planning is that there is a sense that something needs to change and it is a systemic change. As a public organization, any change must be nested into the mandated directives set by the State and Board of Education. There are defined limitations and implied expectations that the university must uphold with regard to the level of education provided to its students. There are also cultural, environmental, and economic expectations that must be met in order to achieve success. To navigate these competing requirements and trends it is necessary to take a more holistic view of campus energy use and go through a strategic planning process specifically focused on energy. Strategic planning will allow for more participation and input from students, faculty, staff and the local community and can begin to shape their collective vision for the future of the university, ensuring that everyone is working toward the same outcome.
Figure 5. Duke University Energy Efficiency Process (CGGC, 2011) )Participatory)Process)and)Leadership) In many ways energy planning follows the same basic tenets as any other form of urban planning. One must go through the same core problem solving steps. The first step is usually identifying and understanding specific problems (i.e., is high energy use really a problem). Though there is nothing wrong per se with energy use; for example some departments require a large sum of energy either for safety reasons (ventilation or temperature control), or because they are inherently energy intensive (Information Technology or data centers). A problem occurs when large portions of the campus energy use are wasted, causing secondary pressures on

! 12!
budgeting and maintenance. Energy use hasn’t traditionally been monitored or even understood because of relatively cheap energy costs though in recent years this has changed dramatically. Throughout planning literature there emerge several different approaches to planning (Bryson, 1988; Baer, 1997). The most conventional is a technocratic, problem solving like blueprint, focused on implementation and outcomes. Another path is a more inclusive, participatory, and visioning style of planning that focuses on process and can be successful irrespective of outcomes (Alexander, E.R. & Faludi, A., 1989). Though the first type of planning pervades most typical organizations the latter has been used with great success at other universities and when conducting Strategic Planning at UHM. Involving students, faculty, and staff in the planning process turns consumers into stakeholders. Not only does the institution widen its feedback for good ideas, it also creates external advocates for the organization if the process is inclusionary (Paris, 2003). Embarking on this inclusionary process requires support from the administrative leadership to both facilitate and give direction to the process. Leaders provide an impetus for collaboration and cooperation between differing factions and sometimes come to a final decision if opposing parties can’t come to agreement. Due to the complex organizational structure of modern universities no one person is totally in control which requires the use of strategic planning to resolve conflicts, gain consensus, and create a singular vision. The typical university has several different silos of power including students, faculty, and administration. When deciding upon changing the curriculum toward more sustainability related material that may be a primarily faculty driven decision or it may not. Whether thousands of students “request” a change, faculty see a need for change, or administrators see an opportunity for change everyone must be on board. Faculty can come up with a curriculum and it can be funded by the administration but if students don’t see a benefit from taking the classes the program will die. There must be leaders in each of these power silos that are all pushing in the same direction in order to make transformative change and believe in a collective vision. Presidents and chancellors serve at the request of the Board of Regents and often must “toe the line” on what is publicly acceptable in supporting policies. On average the Chancellor tenure is 2.75 years since 2001 with UH Presidents slightly longer at 5.66 years since 1955 (UH System, 2012). Students are much the same and many students don’t get involved on campus until their junior or senior years. Having short time frames to get involved in energy projects that are primarily long-term is a fundamental problem. Increasing continuity in order to build on small successes with such a transient population for both students and head administrators is a challenge. Strategic planning though can create stability in times of changing leadership by creating a stable vision of the future (Paris, 2003). Faculty, on the other hand, sometimes spend a majority of their careers at UHM, 20 years or longer. This longevity does not imply an aligned vision and faculty can become quite segregated between those in research, instruction, and specialist fields. Faculty may be focused on their students, research and research grants, or making tenure so much so that they barely interact with the larger social organization with which they are a part (Sharp, 2002; O’Brien, 1998). If organizational culture dictates that faculty only focus on their specific areas of interest and not on the campus environment, then participation will continually be low and opportunities for

! 13!
collaboration will be missed. Both O’Brien (1998) and Sharp (2002) believe that the most significant problem is how the faculty views their role, as employees or as managers. This is a fundamental argument in allowing faculty to unionize but more importantly it affects how the faculty see their position of power. Organization and awareness are thus two areas with the potential to help or hinder energy projects on campus. Another important group is the administrative staff, including facilities managers. Many of these workers also have longevity and are the ones implementing these projects. They may not have direct power to make decisions or enact policies but they have a great influence over how smoothly a project goes and how fast it is implemented. By including the middle management and staff at the decision making table as well, they become stakeholders in a positive outcome rather than barriers if they aren’t. Getting through bureaucracy can be a monumental task given that the governing structure at universities is often top down, very rarely a linear hierarchy, and includes many differing parties. Though the complex hierarchical organization is difficult to navigate, both a top-down and bottom-up approach is recommended (Moore, et. al, 2005).
Figure 6. UHM Hierarchy Budgeting)and)Implementation) Besides the problems caused by complex organizational structures there are also issues of turning a conceptual plan into an operational plan. Areas such as budgeting, implementation, review, and transparency determine the success of a plan as much as its formulation. Paris (2003) finds that it is not uncommon for institutions’ strategic plans to have no connection to their budget. Without linking financial resources to the strategic plan actions, the value of that

! 14!
plan is limited. For complex organizations where departments may sometimes compete for financial resources it may be beneficial to separate energy funds into a discretionary account or revolving fund allowing energy savings to accumulate and be used for future energy projects. In some places a concrete implementation plan that links policy, projects, and accountability to real outcomes is needed (Moore, et al., 2005). Implementation takes the “What” and “Why” of visioning and turns it into the “How, When, Where, and Who” of action. This is usually not a prescriptive process though certain people can be held responsible for certain actions by relative dates while still retaining a fair amount of flexibility in the plan. Alexander (1989) believes that planning outcomes can be evaluated separately from the planning process as long as outcomes are beneficial, even if they don’t match planned outcomes directly. Another belief from Wildavsky (1973) is that plans not implemented indicated failure. In the case of energy planning a good process could be viewed as a success separately from the implementation, however, I would agree with Wildavsky (1973) that if stated energy reduction goals are not met then the planning process will be seen as a failure by the larger population not involved in the planning process. In order to build momentum and energy awareness, a series of small victories centered on the semester timelines are necessary. Uncertainty and flexibility can be embedded in the plan so that even if outcomes don’t resemble the planning outcomes exactly it is not deemed a failure of implementation in the long term but on a short term basis (semester or year) there need to be visible and marketed successes (Bryson, 1988). Short term goals must be established along with the long-term visioning and people must be held accountable. This is primarily a middle management issue and is embedded in the organizational culture of the institution. According to Bryson (1988) there are three main areas with which to evaluate the strategic planning process: 1) focus the attention of key decision makers on what is important for their organizations; 2) help set priorities for action; and 3) generate those actions. Building this momentum is necessary to take small-scale demonstration projects campus wide. It is also beneficial if the plan actions are coupled with evaluation and review. A feedback loop to change and modify practices and make adjustments along the way should be established to influence what short-term goals could be met (Bryson, 1988). Benchmarking is critical to this step since actual information must be compared to models that were used when justifying the program. Establishing a baseline and trends will help delineate trends of weather, rebound effect, or general growth in energy usage to determine actual energy saved. This will ensure long-term goals stay on track while short-term goals are adjusted each semester or year. Sharing the results of short-term projects and transparency are also important. Informing the student population about sustainability projects, success stories, and energy savings on campus are a good way to not only promote change but to also garner more participation (Paris, 2003). For a 2011/2012 student class project, students in IS489, IS499, HON291, and HON491 conducted a version of the University Leaders for a Sustainable Future (ULSF) Sustainability Assessment Questionnaire (SAQ) with 497 student respondents. The results overwhelmingly showed that most students either don’t know or think very little is being done to improve sustainability on campus (UH Environmental Center, 2012). In truth, finding information on plans, policies, and project outcomes was a time intensive process because most websites were not

! 15!
updated and most inherent knowledge about energy projects is held by only a select few. This becomes a major problem when some of those key people horde that information as a form of retaining power or leave the university for other opportunities and take all knowledge of that project with them. Collecting and providing data for future research is a good way to build on past successes and perpetuate the learning curve so future students can excel. 4.##Demand#Side#Energy! Reducing the demand for energy is usually the first goal in any energy management program. Several different approaches to this are reducing demand through conservation, increasing the efficiency of certain systems that use energy, or reducing the peak demand. Through personal experience in conducting residential energy research it is clear that even when homeowners live in exactly the same home with the same appliances, and similar lifestyles that energy use varies wildly due to household behaviors, sometimes with one house using twice as much as another (Peppard, et al., 2011). For this reason reducing the demand for energy is mostly focused on changing people’s behavior with regard to how much energy they use. This can vary from making them more aware of their actions, providing incentives to reduce energy use, or physically removing the choice of wasting energy away by changing equipment or the systems they use. When designing an energy conservation or efficiency program it is important to identify who the targeted audience is and what method of influence should be used. The primary devices used include information/education, economic instruments, administrative policy instruments, and physical improvements. These different techniques can be manifested in several different ways and while each has advantages and disadvantages they are best used in combination to have the best overall effect. According to Psychology professor Linda Steg (2008) in order to change an individual’s behavior, they must first be made aware of the need for and possible ways to change. They must then have the motivation to change and lastly adopt the new relevant behavior (Steg, 2008). Below are several categories for affecting an energy use behavior change across the college campus.
Figure 7. Policy Instrument Categories (Linden, A., Carlsson-Kanyama, A., & Eriksson, B., 2006).
)Information/Education) Information campaigns are generally inexpensive but also tend to be one of the slowest mechanisms to produce results and/or only produce short-term change (Steg, 2008; Bender, S., Moezzi, M., Gossard, M., & Lutzenhiser, L., 2002). Since energy information or education is a voluntary measure it is only as effective as the information is helpful, relevant, and value

! 16!
oriented. It must trigger a strong enough reaction to change behavior. Some common examples of information campaigns are Energy Star or recycled content on packaging, media and advertising campaigns, or seminars and sustainability education in applicable classrooms. Information campaigns are put loosely into two categories: the attitude model and the social diffusion model (Costanzo, M., Archer, D., Aronson, E., & Pettigrew, T., 1986). Many of the media and advertising campaigns that are supplied to a mass audience belong in the attitude model because they are simply trying to change attitudes and behavior with education and information. It has been shown that energy education in this manner must be targeted effort and even then has modest results (Steg, 2008). Two important ways to reach people on a more personal level are through college curricula and energy use feedback mechanisms. Numerous studies all show that information campaigns such as posters, brochures, and even workshops rarely translate into actual behavior change (Marans, R. & Edelstein, J., 2010). A study by Dr. Scott Geller (1981), which included questionnaires, before and after energy workshops, showed that attendees were more concerned about energy, had increased perceptions of control over their energy use, and learned some simple things they could do to save energy in their homes. However, after multiple home visits, he concluded that “the results of this and other behavioral field studies suggest that workshops, informational pamphlets, and media promotion should not be relied on to promote energy conservation unless they are supplemented with other techniques designed to motivate action” (Geller, 1981). It should be clear that providing energy information and education will most likely result in a more informed population with better energy awareness but will probably not manifest itself into large scale behavioral change. The social diffusion model carries that most people will only adopt energy conservation methods or use new technology after someone they know and trust uses it first and proves that the new action is not overly costly or inconvenient (Costanzo, M., Archer, D., Aronson, E., & Pettigrew, T., 1986). There are almost always some early adopters that seek new technology and enjoy being the first on the block to try new things, but the vast majority must to be convinced. Malcolm Gladwell, in his book “The Tipping Point” calls these people Mavens, the ones who spread new ideas and make them acceptable to others through their knowledge and social skills. In places such as a university campus this phenomenon is usually called “peer pressure” and has a negative connotation. However, peer pressure with regards to energy conservation could be the vital component the campus needs to ensure conservation in mass. The psychology behind this has more to do with the memorable and interesting stories acquired from friends and family and less on actual pressure. One of the key ways these social networks can get the information is through college courses, seminars, school organizations, and projects directed at energy efficiency or conservation. College sustainability or energy classes could be provided for those primary early adopters who are already excited about energy conservation or technology. As they learn new ideas from class they then discuss energy conservation techniques with their friends and family and act on them in their own lives. Getting more and more people on board and really showing them the difference this can make in their own lives is essential to changing behavior. Programs of information and awareness should be coupled with education and training to make the most positive change.

! 17!
Several programs are trying to provide feedback to students, faculty, and administrators in attempts to elevate their awareness in non-conventional ways. One is through an online energy “dashboard” that provides real time energy use and production data at universities like ASU and UCSD. Due to their extensive metering projects they provide detailed performance data for their renewable energy projects and energy usage for the major buildings on campus. This application does two things; one is to database large amounts of historical energy data that can be used for future research and the other is to provide a quick display that lets users see comparative data in a functional way. The energy data can be shown in cost, green house gas (GHG) emissions, or kWh and also in selected date ranges. Providing this information publicly and in easy to read charts and graphs can also reduce the amount of reports produced by facilities workers in addition to being an engaging way to inform a larger body of students, faculty, and administration about energy related issues. A different approach occurred at the University at Buffalo where they posted annual cost and building energy use at the entrance to every building on campus. This was a comparatively low-tech approach to inform students and faculty of the impact their individual building or department was having on the campus as a whole. The general belief is that by providing feedback to the building users they can create awareness that didn’t exist before and spur conversations about the high dollar costs or the need to conserve (Simpson, 2003). At UCLA they are implementing a student research project that aims at wiring residential dormitories so that students can see their real time energy use. During several phases they monitored lights, HVAC and eventually included a peer visualization tool that compared rooms on a high, average, or low user level. UCLA researchers concluded that students cut their light use by 20-30% and HVAC by about 30% as well, though it is unclear if this tool has created new habits or if the constant feedback is necessary to influence behavior (UCLA, 2012). )Economic)Instruments) There are numerous examples of economic instruments at higher levels such as tax incentives, financial aid, or low interest bonds from either the Federal or State levels. Much less has been seen at a university level though there are financial incentives or penalties that can influence either a department, office, or an individual’s energy use. One of UHM’s 2011 peer universities, Iowa State, has implemented a Green Billing Program that gives incentives for energy use reduction by billing individual departments, buildings, and colleges instead of facilities simply paying one whole bill. This not only allows department heads to see and understand their energy needs and use but ISU created profit sharing incentives for each entity to recoup some of the energy savings for their own budget. The decentralized billing first needed all major facilities to be individually monitored by energy sub-meters and the university budget office had to go through a major restructuring process. Individual departments now have an extra incentive to initiate or request energy efficiency projects in their selected buildings or areas. This does place more of a burden on departmental staff but with decreasing budgets it may be an extra way for Deans and faculty to keep money in their respective programs.

! 18!
In recent years UHM has established a Building Coordinator program to help reduce air conditioning schedules for individual buildings. These coordinators work with facilities employees who are individually responsible for the maintenance of assigned buildings. If a form of financial bonus or savings sharing for the building’s college could be implemented it would encourage both facilities managers and volunteer building coordinators to collaborate and find additional cost saving opportunities. Such rewards or incentive programs create a mutually beneficial process for reducing energy and environmental waste. Basing employee performance evaluations partially on good environmental or energy management practices is another way to create the sense of importance across the campus staff. The university can also offer non-financial rewards such as academic credit for students, tuition waivers for employees to continue their education, or certificates and recognition before the larger campus community. )Administrative)Policy) Many examples of administrative policy instruments also exist including State mandates, building codes, and State energy goals. As an example the State of Hawai’i requires all new construction on campus to meet LEED Silver certification but many times the certification is not attained because of extra costs in time, effort, and money. A problem with this is that if there is no post-construction evaluation by an independent third party to certify LEED Silver ratings then designers and construction managers may not be held accountable for meeting certain standards. The ramifications of not meeting this certification standard are unclear which illustrates that enforcing the policies becomes just as important as creating the policies. Possibly due to the enforcement problems there are fewer effective policy instruments at the campus level though several areas such as purchasing, design standards, temperature setpoints, and personal electronics are showing improved energy reductions at other universities. Besides construction certification, another policy tool is to incorporate operating & maintenance costs into procurement decisions. This is referred to as the Fully Burdened Cost or Total Cost of Ownership (TCO) and for durable items or capital improvements it may save a lot of money in the long term. Incorporating these life cycle costs into the decision making process usually justifies more energy efficient and lower carbon purchases. At Arizona State University all new computer purchases must meet Electronic Product Environmental Assessment Tool (EPEAT) Gold standards and all electronics must meet Energy Star standards or be in the top 25% of energy efficient models (ASU University Policy Manuals Group, 2010). This means that they consider energy efficiency and recycled content in addition to the cost of the equipment. In addition to their 2004 Green Purchasing Policy, the Georgia Institute of Technology was remodeling so many buildings to the LEED Gold standard that they decided to write a “Yellow Book” stating required design standards for all new retrofits or remodeling projects (Georgia Tech Facilities Managment, 2012). Design standards are basically building codes that exceed the state standard and would require all remodeled buildings to perform similarly to newer buildings. These standards could vary from energy efficiency, energy metering, indoor air quality, or require locally produced products. LEED: Existing Buildings and LEED Operations & Maintenance standards also exist as guidelines to help improve existing building stock. UHM is currently developing the UHM Building Design, Performance, and Sustainability Standards and will provide the same type of guidance for consultants and contractors to follow (UHM, 2008). In

! 19!
2011, UH Sea Grant’s Center for Smart Building and Community Design published an Environmental Product Guide for Hawai’i that lists eco-friendly construction products and local businesses that sell these products in order to better educate and inform purchasing and construction officials (Center for Smart Building and Community Design, 2011). The Hawai’i State Procurement Office also provides price and vendor listings for environmentally preferred products as well. One last policy measure is to stipulate what the maximum temperature for cooling will be in all buildings on campus. The State of Hawai’i recommends a 76 degree setpoint and Arizona State University has instituted a cooling setpoint of 80 degrees (DBEDT, 2012; ASU, 2010). The University at Buffalo calculated that they saved approximately $100,000 per year for each degree Fahrenheit that they didn’t cool or heat a building, and they only have 100 buildings on campus (Simpson, 2003). Despite relatively conventional policies like this energy costs continue to increase across the nation. Many programs ask workers to consolidate items like refrigerators, microwaves, and printers to common areas that multiple people can share and to buy only energy star appliances. Another approach is for the campus Information Technology Department to produce a set of guidelines that inform students and faculty of the most efficient power settings on their computers. In a study of office plug loads researchers found that 64% of desktop computers were left on overnight and only 4% of those were in a low power mode (Roberson, J. A., Webber, C.A., McWinney, M.C., Brown, R.E., Pinckard, M.J., & Busch, J.F., 2004). A similar survey of Saunders Hall at UHM, revealed that only 7% of respondents had set their computer hibernation settings (Nixon, 2007). Reasons given for this low percentage were “its just easier to do”, there are no real incentives, and a lack of awareness of environmental consequences. As stated above, information and education may not be enough to induce behavioral energy conservation so a program of someone systematically changing all those computer settings may be necessary (preferably by student workers). If the above apathy of changing computer settings continues, a systematic audit of computer settings may prove to be very productive. Two programs that are going beyond asking people to think about their behavior are Iowa State University’s College of Human Sciences Computer Management Plan and a student run Server Management program at the University of California, San Diego. First, the IT specialists at ISU discovered that the 500 computers managed by the College of Human Services were on and idling 75% of the time. In an effort to curb that waste they used money from the University’s Green Revolving Fund (GRF) to purchase and install $3,039 worth of energy conservation software on these computers. This allows systems administrators to monitor the compliance with the university wide Computer Use Policy and have reduced waste to 25%. This has proven a sound investment and has saved enough to repay the loan in less than one year (Billingsly, 2010). The second program, initiated by students at UCSD, describes a more in-depth process and recommends a system called Somniloquy to lower the power setting even further than factory hibernation settings yet still allows certain functions such as file sharing, remote desktop, and remote access to local files. Through an informal survey at USCD they discovered that 75% of 107 survey respondents left their computers powered on after work hours and popular reasons given for this were programs running in the background (57%), quick availability (45%), file

! 20!
sharing/downloading (40%), and remote access (29%). By using this software to induce a “super sleep state” that still allows for these listed functions to operate they can effectively reduce the energy use of these computers by 60 to 80%. This is obviously not as good as turning off the computer totally but it does remove most excuses as to why a computer is not at least idle when not being used. By using this software, a typical desktop computer used 45 hours a week saved 620 kWh per computer per year, which in Hawai’i equates to a little over $200 annually per computer (Agarwal, Y., Hodges, S., Chandra, R., Scott, J., Bahl, P., & Gupta, R., Unknown). Physical)Improvements) Another way to change energy behavior is to limit the choices that people have to use energy. This is the idea behind making physical changes and is likely the most used energy efficiency technique. By replacing older incandescent light bulbs with newer florescent light bulbs no behavior modification is necessary, people can just turn on the lights as they would have before and they are using less energy. It is the same idea with reducing the size of mechanical ventilation systems or replacing them with natural ventilation. The user ultimately has no choice and must conform behavior to fit the new environment unless the building is so uncomfortable that a smaller less efficient air conditioner would be brought in to make the space more comfortable. So in many ways the process of reducing energy with physical improvements is not only about replacing systems but deciding what is a good or at least tolerable level of comfort. Deciding on comfort levels is never easy since they vary from person to person, however, there are scientific studies that place human comfort within acceptable ranges. This is true for light levels as well as temperature, two major users of energy in our building spaces. Too much light or glare in an office or classroom produces headaches and not enough light produces eye strain so there is a range that most people find acceptable. It is always easier to add additional task lights in certain situations than it is to take away overhead lights. To take a lighting retrofit a step further means improving the natural light or day lighting of the space. There are numerous techniques for adding light shelves, skylights, or just adding windows to a space to eliminate the need for electric lights altogether except during periods of darkness. This can make offices and classrooms more pleasant and pleasurable to work in while also making them more energy efficient. Utilizing day lighting, rather than replacing lights or de-lamping, is generally easier to do when doing a “deep retrofit” or when designing a new building from the ground up. Based upon the level of retrofit there are numerous physical improvements that have both short and long-term payback periods ranging from installing CO2 monitors to reduce ventilation requirements to enhanced window glazing. With any physical change the first step is to maximize efficiency downstream at the end user, which creates a multiplying effect for the upstream systems like chillers, generators, and PV arrays. In the book “Reinventing Fire” Amory Lovins (2011) recommends four priorities for choosing energy efficiency projects:
1. Reduce energy for fundamental processes - lighting, ventilation, data centers 2. Reduce systems that distribute energy - pipes, wiring 3. Improve efficiency of chillers and motors – reduced peak 4. Put wasted energy to good use – food waste, heat recovery
By reducing demand at the user level it is then possible to make adjustments at the classroom, building, and campus level.

! 21!
Commissioning a new building is the process of ensuring the function of all the systems and making certain that they are all working in harmony. Thus the process of recomissioning or retrocomissioning is ensuring that these systems are still working together properly after a number of years. Mechanical equipment not only breaks down and gets replaced with new parts or systems but settings get adjusted from time to time for various reasons and are not adjusted back to the correct settings. The mission of the building or the occupants can also change periodically as well so there needs to be continuous adjustment by facilities workers, or continuous commissioning. This will be difficult if backlogs are still high and significant training has not been conducted. However, in a study by the Lawrence Berkeley National Laboratory (LBNL) of 24 buildings in the 2009 University of California System, a 9% average energy decrease was seen from the recomissioning process alone (Matthew, 2009). A range of 2% to 25% savings was seen overall with the most energy reduction and shortest payback times coming from laboratory-type facilities. The average payback period was 2.5 years at $0.25/sf-year. A majority of the deficiencies came from the HVAC and air distribution systems and the “most common interventions were adjusting (thermostat) setpoints, modifying sequences of operations, calibration, and various mechanical fixes” (Matthew, 2009). On a campus with over 300 buildings this would require a tremendous effort but significant savings may result by recomissioning on a consistent basis rather than waiting for the capital investment required for retrofits. A key aspect to recomissioning is targeting and reducing the peak load of certain systems. Off setting the peak load and running the generators more efficiently can be just as effective as replacing them with newer models. In fact, Act 155 of the Hawai’i State Legislature determines that “Public buildings shall be retro-commissioned no less often than every five years” (HCEI, 2010). Physical improvements are not always just about upgrading equipment or swapping newer technologies for older ones. Recomissioning only requires a better understanding of the physical systems and how they interrelate. Many would argue that day lighting and natural ventilation are using older practices that were used in architectural design before there was air conditioning or light bulbs. Physical improvement projects should not only focus on newer and more efficient technologies but better, more holistic ways to do things. A major barrier to campus energy improvement is the high capital costs of certain physical improvement projects. One solution to this is hiring an outside ESCo to help not only with the planning, design, and maintenance but also to utilize their no upfront cost contracting. In many instances projects can be financed solely with the projected energy savings of the project with a majority of the risk being taken by the ESCo. This not only will save the university money in the long run but also will help improve deferred maintenance if energy retrofits are “right timed” with necessary building renovations. Other ways to pay for these improvements include Federal Grants such as the Pollution Prevention (P2) or Source Reduction Assistance (SRA) grant programs. Managed by the Environmental Protection Agency (EPA) since the Pollution Prevention Act of 1990, these grants are open to state universities and can match funds up to $180,000 (EPA, 2012). These grants can be used for innovative energy technology demonstrations, conducting surveys, assisting in research, or even purchasing CFLs and electric vehicles. Money used to further

! 22!
research, experiments, surveys, or training in a broad spectrum of resource management or pollution prevention techniques can be used to great advantage by a university willing to use the campus as a living laboratory. An estimated $4,922,000 will be awarded in fiscal year 2013 (CFDA, Unknown). The State of Hawai’i has also established a “Building Energy Efficiency Revolving Loan Fund” within the state treasury that could provide low or no cost loans for future projects. It was established to help provide technical assistance, additional personnel, equipment, or travel to assist in these projects and includes individual sub-accounts for public entities like UHM (HCEI, 2010). Additional sources of money could be garnered from non-profit, governmental, or even private industry resources. Assistance from research grants at the local, state or federal level is possible for a research university like UHM. The Department of Energy is a major funder of energy research in Hawai’i and the EPA could provide building management technical assistance since UHM participates in their Energy Star Battle of the Buildings Program. Other agencies such as America’s College and University Presidents’ Climate Challenge (ACUPCC) or the Association for the Advancement of Sustainability in Higher Education (AASHE) provide assistance to participating schools, or on a more local level the Building Industry Association or Hawai’i Energy can provide additional technical or monetary assistance. The 2009 AASHE Bulletin reported over $534 million in grants delivered to universities and colleges for sustainability projects (AASHE, 2010). 5.##Supply#Side#Energy# It is imperative that energy programs not only focus on efficiency and conservation but also producing cleaner more renewable energy. Consistent growth on campus using non-fossil fuel based energy may be the only way to significantly lower GHG emissions from current levels. In the short term, the price of renewable energy isn’t drastically different than current primary energy sources in Hawai’i, but as technology improves that price is expected to come down (Lovins, 2011). Prices for renewable energy can also be locked in via long-term contracts that can help reduce uncertainty in the market and lower expectations of risk surrounding rising oil and gas prices. It is beyond the scope of this paper to discuss the different sources of renewable energy and which ones are best suited for UHM but there are a multitude of demonstration projects in Hawai’i that could be implemented or use further research at UHM. Some examples currently used around the world include solar, wind, geothermal, hydrogen, biofuels, methane from landfill or waste water treatment, and ocean wave, temperature, and tide energy sources. Some of these may seem inapplicable to UHM but the University just built the LEED certified John A Burns School of Medicine near the Kaka’ako waterfront park, which used to be a landfill and is just venting excess methane right into the air. It is hoped that opportunities such as using that waste methane to provide some power for the building were analyzed and discussed as practitioners need to be aware of new non-traditional power sources. The question of when to invest in renewable energy rather than extra energy efficiency is not a completely straightforward equation. First, energy efficiency only lowers the carbon emissions produced from fossil fuel electricity generation, it doesn’t eliminate them. Even though reducing energy use through energy efficiency or energy conservation is effective in saving money it is only a means to an end, the end is an economical non-polluting renewable energy. Another

! 23!
wrinkle is that energy efficiency has also shown to rebound slightly which decreases its significance over time. A direct rebound effect would be that as demand for electricity goes down so does the price, making it cost effective to use more again. Researcher David Greene estimates that the direct rebound effect is approximately 20% on a microeconomic level (Herring, 2006). An indirect rebound effect would be that as energy use decreases, customers have more money allowing for the purchase of additional goods and services that use energy. Both of these phenomena can be envisioned on the UHM campus by looking at the typical office and its numerous appliances and the campus capital improvement budget. Directly, if people use efficient appliances they may feel that they can use them more often or plug in extra devices (Steg, 2008). Indirectly, if the university saves a significant amount of money from energy reduction methods and invests that money back into building more buildings on campus, the result is rebounded energy use. Second, no amount of renewable energy sources will be adequate if there is still rampant energy waste through lack of energy conservation or efficiency. Paying for extra renewable energy that is not really needed will waste money and could be better spent on energy conservation programs or efficiency upgrades. In a site survey done by energy consultants Newcomb, Anderson, & McCormick (2011) there is only enough roof space on campus to support 4.9 MW of Solar PV. This equates to only 7% of the current total campus energy use (Newcomb, Anderson & McCormick Consultants, 2011). Improving energy efficiency and conservation efforts will increase that 7% making renewable energy more effective and a better investment. In essence if UHM can make their goal of 50% reduction by 2015 then almost 14% of energy can come from solar PV and the goal of 25% renewable energy production by 2020 becomes more attainable. Practitioners and designers now have whole hosts of energy computer modeling software that can help maximize the benefits of certain retrofits and power sources. Programs such as BEopt, design builder, ENERGY-10, and Energy Plus software packages not only help to design low energy buildings or retrofits but also to conduct cost benefit analysis in order to determine which retrofits or materials provide the best energy savings. It is important to note that this cost benefit analysis only compares different retrofits against each other and a “no change” or status quo model and shouldn’t be the sole estimation of benefits behind a retrofit decision. Energy design programs also aid in determining when it becomes cost effective to invest in renewable energy sources rather than more energy efficiency methods. )Renewable)Energy)Production)and)Purchase) Deciding which fuel or energy sources are best has much to do with the location and climate, the priorities of the school, and the capabilities of the local electricity grid. Aspects of the local economy, political structure, and community will also determine which methods are acceptable or desired. It is probable that a diverse array of fuel and energy sources will be necessary to approach self-sufficiency levels due to the high density of buildings on the UHM campus. What is important is that no matter what renewable energy sources are chosen, switching fuels and purchasing new equipment will be expensive and require large sums of capital investment. Therefore several ways that large public institutions have paid for these upgrades in the past are presented.

! 24!
Power Purchase Agreements (PPAs) are a low risk way to make renewable energy a possibility for the campus without having the resident expertise and/or financial capital for the project. In essence the contract would allow a third party provider to lease land or rooftop space for certain renewable energy projects and sell the produced energy back to the university at a fixed rate. At the end of the fixed term, the university would have the opportunity to buy the system, or continue the contract. This places the majority of the risk and all the maintenance costs on the service provider. Since private companies are able to exploit the full extent of state and federal tax incentives and some state incentives are getting political pressure to expire, timing may be of the essence. Arizona State University is one university that has taken full advantage of PPAs. They have the largest solar renewable energy portfolio of any university in the United States. With six different Energy Service Providers fulfilling contracts that support 58 campus wide systems, solar energy provides 15.3 MWdc of capacity or approximately 23 million kWh per year to the campus. Solar power still only accounts for 30% of the total peak energy used by ASU requiring other alternatives in their portfolio as well (ASU Solar, 2012). Solar PV is a logical renewable energy source since ASU gets an average of 310 sunny days a year (85% annual sunshine). In contrast Honolulu receives 260 sunny days or 71% annual sunshine (NOAA, 2007). While it is tempting to maximize rooftop space with solar photovoltaic panels, detailed analysis is required to understand structural limitations, shading from other buildings, and sun angle in order to get a range of solar energy throughout the day. Some rooftops may be better suited as green roofs, community gardens, or solar thermal panels as opposed to solar PV. One area that was used to great effect with solar PV were the ASU parking structures which both provided an easily accessible place for solar power generation and also provided shading for cars parked on the top deck (photo below).
Figure 8. Solar PV Panels on campus parking structure at Arizona State University Clean Renewable Energy Bonds (CREBs) are an Internal Revenue Service (IRS) sponsored bond program begun in 2005 as part of the Energy Policy Act and extended with the American Recovery and Reinvestment Act of 2009. Primarily used by public institutions, CREBs allow zero or near-zero percent interest rate bonds to be issued for qualified renewable energy projects. The borrower would pay back only the principal of the bond and the bondholders are “paid” with a federal tax credit rather than an interest payment. The University of California San Diego (UCSD) used this program to acquire almost $15M in bonds to finance 15 PV projects adding 2.9 MW of photovoltaic power to their campus (Ghram, 2009). It is important to note that four engineering students in a Solar Power course at USCD helped to write and conduct analysis for the proposals that garnered the $15M. Though these bonds are set to expire in October of 2012 there is a chance they will be extended based on the political elections later this year (U.S. DOE EERE, 2010). If they are still available, CREBs are a good long-term financing option for a

! 25!
variety of renewable energy projects such as wind, solar, geothermal, closed and open loop biomass, trash combustion, landfill gas, and hydropower. Another zero or low interest financing option is through a Green Revolving Fund (GRF). GRFs are usually started with university endowment funds or donations but can also be begun from department and administrative budgets or even money saved from initial energy reduction projects. The money from the GRF can be used to finance energy efficiency, community outreach and education, or small renewable energy projects. The money is paid back into the fund through energy savings in a long-term payment plan (typically five years). Depending on how it is set up, some schools charge an interest rate varying from 1-10%, some require that the extra savings be put back into the fund but some charge nothing at all. Ryan Hubbel of the National Renewable Energy Laboratory (NREL) adds, “Incorporating some form of a “matching” program (such as a utility rebate program) is a good way to enhance the size and impact of the GRF” (Hubbel, 2012). Of the 52 colleges and universities that have GRFs, annual returns on investment range from 29% to 47% (SEI, 2011). By comparison the average annual return for the stock market since 1928 is 9.3% (Krantz, 2011). All types of universities are able to capture these savings with public institutions making up 42% of the universities with GRFs and they are fairly evenly distributed in both university size and endowment amount (Figure 6).
Figure 9. Distribution of Green Revolving Funds by student enrollment and dollar amount of the GRF (SEI, 2011) Two main methods of repayment to the fund are recommended: for those entities that may pay their own utility bill, a loan model may be appropriate and for those on a central billing system an accounting model would work best (Hubbel, 2012). The loan model works as a normal bank loan would with set payments and a negotiated interest rate that the building manager or department head would pay at regular intervals. With a university utilizing central billing the accounting model would allow for capital repayment either annually, semi-annually or after each term, and can be repaid through an accounting office with savings being reinvested back into the fund. The Sustainable Endowment Institute has also developed an online web tool called Green Revolving Investment Tracking System (GRITS). One requirement of this system is baseline utility consumption data and the ability to track savings attributed to the individual project. This can be accomplished by tracking total utility costs or by using consumption data but a direct partnership with facilities personnel is essential. The additional stress placed on facilities personnel by this process has been noted at other universities and an effort must be made to promote collaboration rather than give facilities

! 26!
personnel more duties and no extra resources. Other issues include fluctuating annual utility prices, which may adjust repayment plans, limited initial engagement from the student body, and limited project management capacity (SEI, 2011). While there are potential institutional problems the benefits can promote collaboration among university entities furthering numerous university strategic goals. Campus)System)Upgrades)to)Increase)Renewable)Energy)Effectiveness) These programs may not produce any renewable energy but will better configure systems to utilize renewable energy sources or at least switch from a more expensive, polluting, and inefficient source of energy for another more sustainable source. It is one thing to upgrade a system to a more efficient energy source such as with electric vehicles but it is another thing if those electric vehicles are powered by renewable energy. In this area there are numerous alternatives as well to include running the campus shuttle on soy biodiesel like at UCSD or on hydrogen as they do at Hickam Air Base, purchasing solar powered vehicles that can travel up to 15 miles per day as they did at the University of Central Florida, and even purchasing energy-producing elliptical machines at the gym to recharge iPods and create energy awareness like the University of Oregon and Pearl Harbor Naval Base (AASHE, 2010). Other projects could include installing solar controlled moisture sensors to help manage irrigation, solar powered pedestrian lights, or even solar thermal water heating systems. Focusing on systems that can use renewable sources directly is often very cost effective. Solar thermal systems are much more cost effective than solar PV panels. In situations where there is sufficient hot water use such as dormitories, athletic locker rooms, or food service centers it may be economical to add solar thermal panels. While adequate roof space may not be sufficient to cover the peak loads for some “tower” type dormitories, combining solar thermal with other technologies such as drainpipe heat exchangers can effectively double the first hour capacity of hot water heaters (E Source , 2010). These systems capture the latent heat from wastewater by coiling incoming cold water pipes around the warm wastewater pipe. This can be especially effective when many hot water intensive activities all occur at the same time such as before class showering in the mornings or laundry day on Sundays at the dormitories. A secondary method may be to use tankless water heaters and Synthetic Natural Gas (SNG) or LPG for all hot water needs. Tankless water heaters are more efficient than traditional tank-type water heaters regardless of whether they use SNG or electricity. 6.##Recommendations# Though many of the highlighted energy reduction best practices are technical in nature, the barriers facing the University are primarily social and policy related. Organizational culture, increased responsibility for students and employees, and a fear of the unknown all make implementing one of these best practices at UHM a challenge. The trend of increased energy cost and importance on campus will continue and because of that a more concerted effort needs to be made involving the entire campus; students, faculty, administration, and third-party stakeholders. An Energy Management Office should be set up that acts as a center for collaboration, awareness, and project development giving it the $23 million dollar attention it

! 27!
requires. More effort should also be allocated for incentives and recognition of successful projects to not only increase awareness but also encourage more participation in energy related learning and research. The UHM energy reduction goals, first established in 2006, were the first major step to gaining participation and effecting change at the university level from a non-facilities standpoint and should be a renewed commitment with every president and chancellor after they are hired, for continued support. The commitment to a set of energy goals is one of the most important steps when creating a strategic energy plan. Integrating the University goals and values into energy planning and policy is paramount when developing a strategic energy planning process. Four goals taken from the UHM Strategic Plan, 2011-2015, show how integral energy is to UHMs success (UHM, 2011). Goal 1: A Transformative Teaching and Learning Environment - # of students taking courses that include aspects of sustainability - % of students with experiential learning Goal 2: A Global, Leading Research University - % of undergraduates involved in research and scholarship - square footage and % increase of new/renovated research facilities - # of faculty with expertise in key research areas including sustainability and Native
Hawaiian scholarship Goal 3: An Engaged University - # of students involved in campus leadership and decision-making (e.g., ASUH, GSO,
college/department committees) Goal 4: Facilitating Excellence - Resource usage measures in kilowatt-hours, gallons of wastewater, and tons of solid waste. - # of searchable data sets and data systems. Each of these strategic goals has within it numerous opportunities and barriers directly related to energy use on campus. It is no longer acceptable to think of energy as just another bill that must be paid, nor just what technology can be bought to reduce that energy use. Simply viewing energy consumption as a number to be reduced is missing opportunities to achieve substantially more than saving dollars alone. Understanding the what, how, and why of energy use on campus can bring about new research opportunities, more engagement with students and extracurricular student organizations, and help save money that can be reinvested into other more meaningful programs on campus. Allowing facilities managers to turn the lights off at night or adjust temperature settings is only the beginning to a strategic energy revolution on campus. Campus)Involvement))Many of these energy reduction or efficiency methods require efforts from a broad spectrum of the campus. Facilities managers are central and key components but they alone cannot bring about the desired change. Respected and committed “champions” must push for change throughout the many different power structures. Faculty, students, Deans, IT personnel, and third party service providers all must take some responsibility for their energy use if there is hope for mass change. Individually they must rethink their own systems and make better use of their

! 28!
resources but the university must give them access to resources, information, and in some cases incentives. Strategic planning and SWOT analysis are tools that enable better understanding of the complex energy issues, inclusion of a diverse array of participants, and solutions that are supported by various stakeholders. Another tool is a thorough plan critique or review before implementation, preferably by those outside of the plan making process. More open input in the form of a review, similar to academic review of papers before they are published, could generate the interdisciplinary input needed for projects that touch many facets of the campus. An asset that the university already possesses is the Mānoa Sustainability Council. This group, made up of diverse faculty, students, and interested campus parties, could be a good review board for project and plan critique. Since their various backgrounds, interests, and specialties are focused on many aspects of sustainability they could properly review and make balanced judgments on projects being proposed for implementation. The formulated plan would then have both an internal and external review before it went to the Board of Regents for approval. Third-party service providers may also bring unique solutions to the planning process. ESCos are a proven way for universities to capture energy savings because of their no upfront cost financing, the technical experience they bring, and their performance and maintenance guarantees. There are potential challenges to be aware of such as contracting limitations, the need for collaboration across multiple departments, and any Union pushback from perceived loss of work to outside contractors (Pearce, J. & Miller, L., 2006). These relationships work best when facilities workers have input into which building retrofits fit into their maintenance schedule and also help the ESCo with technical solutions particular to the Mānoa campus. This collaboration can benefit the facilities workers as well since there will be a transfer of knowledge and some training by the ESCo employees to the university staff. It also helps to look beyond the “low hanging fruit” retrofits and select a mixture of short and long-term payback retrofits. Using short and long-term projects in the same portfolio allows longer payback retrofits like chillers or energy management systems to become more economically feasible. However, it is usually the long payback or “deep” retrofit that exceeds the technical knowledge or capability of facilities’ personnel. With continually rising energy costs some savings now may be better than delaying a project for several years until the training and resources are present in-house. The State of Hawai’i has been recognized by the Energy Services Coalition as First in the Nation in Energy Savings Performance Contracts for State Building Efficiency and all UH System community colleges have implemented performance contracts to implement “major energy conservation measures”(DBEDT, 2012). Energy)Management)Office) Besides utilizing a participatory planning process, which has been used for other purposes at UHM, another important aspect is to appoint an Energy Management Officer with an associated team. Rather than nesting those duties with someone already employed at the university or using facilities workers as the energy team and giving them more work, a separate office should be established so they can focus on energy/environmental issues full time. Though it is difficult to

! 29!
find new money in the budget for extra positions they too can be looked upon as an investment. Any money saved now rather than later can immediately be put to new salaries for an energy team and with an energy bill in the millions, those salaries could be paid for many times over. The Energy Management Officer should also have enough authority to maintain effective collaboration across the campus. This should be relative to the priority placed upon energy savings. By making the energy team an office of full time workers the University can demonstrate the high importance that they place on energy savings and the reduction of student tuition dollars. The formulation of an energy office would not only send the right message it would allow staff to properly conduct tasks such as campus energy benchmarking, project review, and education/outreach. This would allow for a more fact based planning process and create a hub for collaboration across the campus. Currently there are dozens of campus energy or sustainability initiatives being driven by student organizations, class projects, or facilities managers, most with no knowledge of the others efforts. Rather than working in divergent directions an energy management office could help coordinate these efforts to have a more synergistic effect. If groups became aware of each other’s efforts they might be encouraged to expand their projects or perhaps collaborate. This propagation of knowledge would then create a positive feedback loop and amplify the progress of energy projects on campus. The energy office should coordinate efforts, promote energy reduction projects, aid with public outreach, and possibly implement programs. Additional duties such as creating campus building design and construction standards, pursuing funding options, and creating lessons learned from past projects have also been proposed in the past (UHM, 2006). There is also potential for linkages with campus energy data storage and research with HNEI and REIS, or linkage with a new sustainability curriculum being developed for UHM. To be effective at creating an energy plan it is essential that someone provide UHM stakeholders with quantitative insight on UHM energy use, understanding of the energy dynamics in Hawai’i, and a view of the price pressures for successful energy reduction projects and programs. It may also foster better collaboration and technical assistance if implementing a Green Revolving Fund by providing time and expertise for departments or student groups who may not be able to handle the management on their own (Levy, J. I. & Dilwali, K. M. , 2000). It is important to point out that an energy manager should act as a central coordinator for energy projects not as the sole person or office responsible. The position could in fact have negative consequences if other departments and staff forgo their own responsibilities with regards to energy and pile it all onto the Energy or Sustainability office (Shriberg, 2000). The main function of the energy office should be to coordinate, collaborate, and provide analysis and evaluations of energy projects or programs on campus. Many of UHMs peer universities have offices of sustainability, energy, or the environment and serve in a variety of capacities across campuses. With a small office of full time energy management staff and the Mānoa Sustainability Council (MSC) volunteers, a system of project idea creation, data analysis, and project review could be created. Any student or faculty sustainability ideas could be brought before the MSC committee for discussion or project ideas could be initiated inside the energy management office. The

! 30!
energy management staff would then conduct the detailed analysis for feasibility, potential cost, recommended materials, and implementation timelines for review by the MSC. Public discussion and critique can then take place resulting in a vote and prioritization from the 22-person committee. This decision can then be passed up to the Planning Board for budgeting and contracting with most of the research already done. Contractor bids can then be compared against the research estimates and then sent to the Board of Regents with the full support of the Energy Management office and MSC for implementation and financing. This way good ideas can be brought in from anyone on campus, they can be reviewed in detail by full time staff, and a participatory review process can take place. While this would be a lengthy process it is better to get a thoroughly vetted and reviewed plan rather than pass a poor plan up and find the faults during budgeting or implementation. In 2006 a draft Energy Policy was formulated which outlines many similar suggestions such as hiring an Energy Manager, developing an Energy Management Office, or producing annual reports for the UHM community detailing items such as the sustainability efforts to date, university operating costs, and campus energy use. Many recurring themes for a sustainable campus have come and gone, notably in 2003 (UHM Charter of Sustainability), and 2006 (Draft Clean Energy Policy and Draft Energy Management Office Policy). Unfortunately, as in any other organization, if the leadership does not support the efforts, then everyone else is swimming against the current. For this reason leadership is a fundamental part of any planning effort. Leadership)and)Lauding)Success)) Key leader involvement is crucial for giving an energy program or strategic planning process legitimacy. If the University leadership cares about energy in a significant way then faculty and students will too. This can vary from making public commitments, funding additional programs, or empowering students to help shape their collective future. However this is done, the leadership must set a good example for everyone else to follow and provide opportunities for others to succeed. Leaders may not always have the right answer but they have the ability to find those that do and to pool resources when required. There are a multitude of students and faculty interested and currently researching or working on projects to improve the energy landscape on campus from the public policy standpoint, renewable energy research, physical equipment upgrades, and many more. Strong leaders in energy will inevitably come from these areas as well. More emphasis should also be placed on lauding the successful projects and incentivizing energy conservation on campus. Making data more accessible for research opportunities, providing campus projects information, and where student tuition money is going could get the student body more interested and more involved in the process. Supporting student campus energy projects by enabling student organizations to keep a portion of the money they end up saving after a project is complete will allow that program to expand and improve for those who follow. Students not involved on campus will surely still come to earn a degree and then leave or possibly just get an online degree. However, if they think of UHM as their home and they are involved in more than just getting a classroom education then they will not only take more away from their college experience but more alumni donations may follow.

! 31!
I hope that this document has provided insight on the state of the UHM energy reduction measures and provides some alternative ideas as to maintaining current programs or creating future ones. The aim of this paper is not to prescribe a method of effective planning or a recipe for energy reduction but to open the discussion to many different alternatives that could be used in formulating an effective strategy. This not only entails strategy formulation but also includes plan implementation, critique, and communicating results to the public. Not all the solutions can be tackled by physical changes or upgrades to the campus and there are numerous examples of programs that have excelled at UHM and in other university settings. More time, effort, and administrative support should be spent connecting various enterprises and improving the energy research and knowledge coming from the University of Hawai’i at Mānoa. 7.##Conclusion# Universities are also somewhat unique for public entities in that they represent the cutting edge in technology, have access to high levels of information, and are less susceptible to economic pressure. They also produce unbiased scientific research that can benefit local businesses, governmental offices, and the community as a whole. Universities have historically been cast in a utopian light, focusing on ideals and collective betterment, idyllic landscaping and design, and an egalitarian vision. Shriberg (2000) states that is exactly why universities are the perfect places to start sustainability-related change. A number of the perceived barriers to success such as high investment costs, lack of energy education, and lack of profitable energy solutions are surmountable. Other challenges to the organizational structure, collaboration at different decision making levels, and providing incentives for students and faculty where there were none before will be a much more difficult solution that must be addressed. Many of the tools discussed above can help get there but a strong desire, most notably from the Chancellor and senior staff, are what is needed the most to affect transformative change on the UHM campus. A real energy solution will be to take responsibility for creating a better learning environment, providing a better education, and reducing damage done to the environment by using less fossil fuel based energy. Blaming any one entity for the “energy problem” is unproductive and strays from collaboration on actually solving the problem. Energy management is good for the environment, good for the pocketbook, and increases opportunities for students to conduct research and get good jobs, which will enhance the local economy of Hawai’i. It is not only imperative that our society uses less fossil fuels for environmental or security reasons but it makes economic sense as well. Using energy efficiently and wisely doesn’t have to mean decreased comfort in our built environment. Facing one of the most prolific issues of our generation the students being taught in our universities now need the information and the examples to continue improving on the current efforts. The more people become aware of their energy use and its repercussions, the more they will desire to change their behaviors, policies, and programs involved in that use. More importantly, the local university has the ability to set the example for other businesses and the local government to follow, hopefully bringing these issues and projects to the mainstream for mass implementation.

! 32!
References! AASHE. (2010). AASHE Digest 2009. Association for the Advancement of Sustainability in Higher Education. Lexington: AASHE. Agarwal, Y., Hodges, S., Chandra, R., Scott, J., Bahl, P., & Gupta, R. (Unknown). Somniloquy: Augmenting Network Interfaces to Reduce PC Energy Usage. Alexander, E.R. & Faludi, A. (1989). Planning and Plan Implementation: notes on evaluation criteria. Environment and Planning B: Planning and Design, 16, 127-140. ASU. (2010, 2-Apr). ASU reduces energy consumption universitywide. Retrieved 2012, 12-Oct from ASU News: https://asunews.asu.edu/20100402_energypolicy ASU Solar. (2012, 17-Jul). Solar FAQs. Retrieved 2012, 22-Sep from Arizona State University Solar: https://cfo.asu.edu/solar-faq ASU University Policy Manuals Group. (2010, 1-Mar). Purchasing and Buisness Services Manual. Retrieved 2012, 22-Sep from Arizona State University: http://www.asu.edu/aad/manuals/pur/pur210.html Baer, W. (1997). General Plan Evaluation Criteria: An Approach to Making Better Plans. Journal of the American Planning Association, 63 (3), 329-344. Bender, S., Moezzi, M., Gossard, M., & Lutzenhiser, L. (2002). Using Mass Media to Influence Energy Consumption Behavior: California’s 2001 Flex Your Power Campaign as a Case Study. ACEEE Summer Study on Energy Efficiency in Buildings. Berke, P. & Godshalk, D. (2009). Searching for the Good Plan: A Meta-Analysis of Plan Quality Studies. Journal of Planning Literature, 23 (3). Billingsly, C. (2010). Iowa State University - Live Green Revolving Loan Fund. Sustainable Endowment Institute. Bryson, J. M. (1988). A Strategic Planning Process for Public and Non-profit Organizations. Long Rang Planning, 21 (1), 73-81. Center for Smart Building and Community Design. (2011, Oct). 2011 Environmental Product Guide. Retrieved 2012, 12-Oct from Sea Grant University of Hawaii: http://sbcd.seagrant.soest.hawaii.edu/sites/seagrant.soest.hawaii.edu/files/publications/2011environmentalproductguide_web_0.pdf CFDA. (Unknown). Pollution Prevention Grants Program. Retrieved 2012, 24-Sep from Catalog of Federal Domestic Assistance: https://cfda.symplicity.com/index?s=program&mode=form&tab=step1&id=15438a8058b068197cc298e0234f8695

! 33!
Chaskin, R., Brown, P., Venkatesh, S., & Vidal, A. (2001). Building Community Capacity. New York: Aldine de Gruyter. !CGGC.!(2011,!Mar).!Capturing)the)Energy)Efficiency)Opportunity:)Lessons)from)EDF)Climate)Corps.!Retrieved!2012,!14,Oct!from!Center!on!Globalization,!Governance,!&!Competitiveness:!http://cggc.duke.edu/events/energy_efficiency_conf/Duke,EDF,CC,Conf,Rpt.pdf! Costanzo, M., Archer, D., Aronson, E., & Pettigrew, T. (1986). Energy Conservaton Behavior: The difficult path from information to action. American Psychologist, 41 (5), 521-528. DBEDT. (2012). Lead By Example: State of Hawai'i Agencies' Energy Iniatives FY 2010-2011. Department of Business Development & Tourism. E Source. (2010). Energy Costs in Managing Energy Costs in Colleges and Universities. Retrieved 2012, 12-Oct from Energy Right Solutions: http://www.energyright.com/business/pdf/Colleges_Universities_ESCD.pdf EPA. (2012, 02-May). Pollution Prevention (P2) - Grants and Funding. Retrieved 2012, 24-Sep from Environmental Protection Agency: http://www.epa.gov/p2/pubs/grants/rfpqa.html#sra Geller, S. (1981). Evaluating Energy Conservation Programs: Is Verbal Report Enough? Journal of Consumer Research, 8, 331-335. Georgia Tech Facilities Managment. (2012, 11-Jul). Design and Construction. Retrieved 2012, 11-Oct from Georgia Tech Facilities Managment: http://www.facilities.gatech.edu/dc/standards/GTSPECS.pdf Ghram, R. (2009, 29-Oct). San Diego Region Secures $154 Million in Clean Renewable Energy Bonds. Retrieved 2012, 20-Jul from UC San Diego News Center: http://ucsdnews.ucsd.edu/newsrel/general/10-09CREB.asp Gladwell, M. (2002). The Tipping Point, How Little Things Can Make a Big Difference. Back Bay Books. Grummon, P.T. (2011). Trends to Watch in Higher Education. Society for College and University Planning, 7. Hafner, D. (2011). Service Levels and Staffing Shortfalls, 2011. UH Mānoa, UHM Office of Facilies and Grounds. HCEI. (2010). Hawaii Clean Energy Initiative. Retrieved 2012, 9-Oct from The 2009 Clean Energy Omnibus Bill, Act 155, HB 1464: http://www.capitol.hawaii.gov/session2009/bills/HB1464_CD1_.HTM

! 34!
HECO. (2012, 4-Oct). October 1, 2012 Effective Rate Summaries. Retrieved 2012, 27-Oct from Hawai'i Electric Company, Inc.: http://www.heco.com/vcmcontent/StaticFiles/FileScan/PDF/EnergyServices/Tarrifs/HECO/EFFRATESOCT2012.pdf Herring, H. (2006). Energy Efficiency - a critical view. Energy Journal, 31, 10-20. Heschong, L., Wright, R., & Okura, S. (2002, Summer). Daylighting impacts on Human Performance in School. Journal of the Illuminating Engineering Society, 101-114. Honolulu Star Advertiser. (2011, 11-Sep). UH Mānoa to cut electricity bill with solar panels. Retrieved 2012, 28-Oct from Honolulu Star Advertiser: http://www.staradvertiser.com/news/breaking/128966753.html?id=128966753 Hubbel, R. (2012, 27-Feb). A "How to" for Higher Education Green Revolving Fund Development. Retrieved 2012, 24-Sep from NREL Renewable Energy Project Finance: https://financere.nrel.gov/finance/content/how-higher-education-green-revolving-fund-development Krantz, M. (2011, 17-Oct). Investors question wisdom of 10% rate of return rule. Retrieved 2012, 23-Sep from USA Today: http://www.usatoday.com/money/perfi/columnist/krantz/story/2011-10-17/rate-of-return-for-stocks/50807868/1 Levy, J. I. & Dilwali, K. M. (2000). Economic Incentives for Sustainable Resource Consupmption at a Large University. International Journal of Sustainability in Higher Education, 1 (3), 252-266. Linden, A., Carlsson-Kanyama, A., & Eriksson, B. (2006). Efficient and inefficient aspects of residential energy behaviour: What are the policy instruments for change? Energy Policy, 34, 1918-1927. Lovins, A. (2011). Reinventing Fire. White River Junction, VT: Chelsea Green. Mānoa Institutional Research. (2011, 20-Jan). Employee Headcount. Retrieved 2012, 20-Jul from University of Hawaii at Mānoa: http://manoa.hawaii.edu/ovcaa/mir/pdf/fsa1.pdf Mānoa Institutional Research. (2012, 1-Mar). UHM Current Funds Revenues by Source. Retrieved 2012, 30-Jul from UH System IRO: http://manoa.hawaii.edu/ovcaa/mir/pdf/bdb1.pdf Marans, R. & Edelstein, J. (2010). The Human Dimension of Energy Conservation and Sustainability: A case study of the University of Michigan's energy conservation program. International Journal of Sustainabiltiy in Higher Education, 11 (1), 6-18. Matthew, P. & Mills, E. (2009). Monitoring-Based Commissioning: Benchmarking Analysis of 24 UC/CSU/IOU Projects. Final, Lawrence Berkeley National Laboratory.

! 35!
McElhinny, K. (2012, Winter). C-MORE Hale: A Luau Laboratory. Retrieved 2012, 28-Oct from gb&d Magazine: http://gbdmagazine.com/2012/c-more-hale/ Meder, S. (2012, 31-Jul). HIMB to house state-of-the-art solar energy project. Retrieved 2012, 28-Oct from University of Hawaiʻi at Mānoa: http://www.uhm.hawaii.edu/news/article.php?aId=5220 Moore, J., Pagani, F., Quayle, M., Robinson, J., Sawada, B., Spiegelman, G., & Van Wynsberghe, R. (2005). Recreating the University from Within: Collaborative reflections on the University of British Columbia’s engagement with sustainability. International Journal of Sustainability in Higher Education, 6 (1), 66-80. Newcomb, Anderson & McCormick Consultants. (2011). UHM Strategic Energy Plan. Nixon, D. (2007). Sustainable Saunders Survey. Retrieved 2012, 13-Oct from UHM College of Social Sciences Public Policy Center: http://publicpolicycenter.hawaii.edu/documents/SS_survey_results2.pdf NOAA. (2007, Jan). Ranking of cities based on % annual possible sunshine. Retrieved 2012, 22-Sep from Natinal Ocean & Atmospherics Administration: http://www.ncdc.noaa.gov/oa/climate/online/ccd/pctposrank.txt O'Brien, G. D. (1998). All the Essential Half-truths about Higher Education. Chicago, IL: University of Chicago Press. Office of Vice Chancellor for Administration, Finance, and Operations. (2009). Mānoa Expenditure Summary for FY2008 by Level V & VI. Retrieved 2012, 13-Oct from UHM Budget & Finance: http://manoa.hawaii.edu/ovcafo/newbudget/FY2008ExpenditureSummary.pdf Paris, K. A. (2003). Strategic Planning in the University. University of Wisconsin - Madison. UWM Board of Regents. Pearce, J. & Miller, L. (2006). Energy Service Companies as a Component of a Comprehensive University Sustainability Strategy. International Journal of Sustainability in Higher Education, 7 (1), 16-33. Peppard, E. Maskery, J. & Witty, J. (2011). Watt Watcher Phase I Report. Unpublished raw data, Center for Smart Building and Community Design, School of Architecture. Roberson, J. A., Webber, C.A., McWinney, M.C., Brown, R.E., Pinckard, M.J., & Busch, J.F. (2004). After-hours Power Status of Office Equipment and Inventory of Miscellaneous Plug- Load Equipment. Lawrence Berkeley National Laboratory, Energy Analysis Department. U.S. Department of Energy. Robinson, R. (1993). Cost-effectiveness analysis. British Medical Journal, 307, 793-794.

! 36!
SEI. (2011). Greening the Bottom Line. Retrieved 2012, 23-Sep from Sustainable Endowment Institute: http://www.endowmentinstitute.org/gbl/Greening_the_Bottom_Line.pdf Sharp, L. (2002). Green Campuses: the road from little victories to systemic change. International Journal of Sustainability in Higher Education, 3 (2), 128-145. Shriberg, M. (2000). Sustainability management in campus housing. International Journal of Sustainability in Higher Education, 1 (2), 137-153. Simonich, D. (2012, Jul). Mānoa Building Information Model Project: Spatial Survey and Integrated Planning. Ka Pili Kai, 34 (2), 4-5. Simpson, W. (2003). Energy Sustainability and the Green Campus. Planning for Higher Education, 31 (3), 150-158. SOH 25th Legislature. (2009, Jun). SB 1202, Act 156. Retrieved 2012, 12-Oct from Hawaii Clean Energy Iniative: http://www.hawaiicleanenergyinitiative.org/storage/sb_202_cs1.pdf State of Hawaii Energy Resource Coordinator. (2010). Hawaii State Energy Office Publications. Retrieved 2011, 30-Nov from Hawaii State Energy Office Energy Programs: http://energy.hawaii.gov/resources/hawaii-state-energy-office-publications Steg, L. (2008). Promoting Household Energy Conservation. Energy Policy, 36 (44), 49-53. Sustainable Endowments Institute. (2008). The College Sustainabilty Report Card. Retrieved 2012, 4-Aug from Sustainable Endowments Institute: http://www.GreenReportCard.org/report-card-2010/schools/university-of-hawaii-manoa U.S. DOE EERE. (2010). Qualified Energy Conservation Bonds (“QECBs”) & New Clean Renewable Energy Bonds (“New CREBs”). US Department of Energy, Energy Efficiency and Renewable Energy. US DOE. U.S. EIA. (2012). Annual Energy Outlook 2012. U.S. Energy Information Administration. Department of Energy . UCLA. (2012). Researchers test strategies to motivate students to save energy. Retrieved 2012, 12-Oct from UCLA Today - Faculty and Staff news: http://today.ucla.edu/portal/ut/PRN-students-compete-to-use-less-energy-201876.aspx UH Environmental Center. (2012). Campus-Wide Sustainability Assessment Questionaire (SAQ). University of Hawaii at Mānoa, Honolulu. UH Mānoa. (2006). UHM Green Building Design and Clean Energy Policy. UH System. (2012). Past Presidents of the University of Hawai'i. Retrieved 2012, 7-Oct from The University of Hawaii System: http://www.hawaii.edu/about/pastpresidents.html

! 37!
UH System: Office of Executive Vice President. (2011). UH System Performance Measures, 2011. University of Hawaii System. UHM. (2003). Charter of Sustainability. University of Hawaii at Mānoa, Honolulu. UHM Administration. (2010, 20-Jul). University of Hawaii at Mānoa. Retrieved 2012, 28-Oct from The College Sustainability Report Card: http://www.greenreportcard.org/report-card-2011/schools/university-of-hawaii-manoa/surveys/campus-survey !UHM Facilities Management. (2008). UHM Energy Strategy 2008-2015. University of Hawaii at Mānoa, Facilities and Grounds, Honolulu. UHM Office of Facilities and Grounds. (2012). Campus Energy Update. University of Hawaii at Mānoa, Honolulu. UHM. (2008). Office of Physical, Environmental, and Long-Range Planning. Retrieved 2012, 12-Oct from University of Hawaii at Mānoa: http://manoa.hawaii.edu/planning/ UHM. (2011). The 2011–2015 Strategic Plan. Retrieved 2012, 12-Oct from University of Hawaii at Mānoa: http://manoa.hawaii.edu/vision/ UHM. (2006). Draft Energy Policy Implementation Plan: UH Mānoa's Energy Managment Office. University of Hawaii at Mānoa, Honolulu. UNEP. (2007). Buildings and Climate Change: Status, Challenges, and Opportunities. United Nation Environment Programme, Sustainable Consumption and Production Branch. Paris: UNEP. Wildavsky,!A.!(1973).!If!Planning!is!Everything,!Maybe!it's!Nothing.!Policy)Sciences.)4,!2, 127-153 !Zipcar. (2012). Green Benefits. Retrieved 2012, 13-Oct from Zipcar: http://www.zipcar.com/is-it/greenbenefits