wisdot bridge manual chapter 10 – geotechnical...
TRANSCRIPT

WisDOT Bridge Manual Chapter 10 – Geotechnical Investigation
January 2015 10-1
Table of Contents
10.1 General ............................................................................................................................... 2
10.2 Subsurface Exploration ....................................................................................................... 3
10.3 Soil Classification ................................................................................................................ 8
10.4 Site Investigation Report ................................................................................................... 10

WisDOT Bridge Manual Chapter 10 – Geotechnical Investigation
January 2015 10-2
10.1 General
The purpose of the Geotechnical Investigation is to provide subsurface information for the plans and to develop recommendations for the construction of the structure at reasonable costs versus short and long term performance. The level of Geotechnical Investigation is a function of the type of the structure and the associated performance. For example, a box culvert under a low ADT roadway compared to a multi-span bridge on a major interstate would require a different level of Geotechnical Investigation. The challenge for the geotechnical engineer is to gather subsurface information that will allow for a reasonable assessment of the soil and rock properties compared to the cost of the investigation. The geotechnical engineer and the structure engineer need to work collectively when evaluating the loads on the structures and the resistance of the soil and rock. The development of the geotechnical investigation and evaluation of the subsurface information requires a degree of engineering judgment. A guide for performing the Geotechnical Investigation is provided in WisDOT Geotechnical Bulletin No. 1, LRFD [10.4] and Geotechnical Engineering Circular #5 – Evaluation of Soil and Rock Properties (Sabatini, 2002). The following structures will require a Geotechnical Investigation:
• Bridges • Box Culverts • Retaining Walls • Non-Standard Sign Structures Foundations • High Mast Lighting Foundations • Noise Wall Foundations

WisDOT Bridge Manual Chapter 10 – Geotechnical Investigation
January 2015 10-3
10.2 Subsurface Exploration
The Geotechnical Engineering Unit (or geotechnical consultant) prepares the Site Investigation Report (SIR) and the Subsurface Exploration (SE) sheet. The SIR describes the subsurface investigation, laboratory testing, analyses, computations and recommendations for the structure. All data relative to the underground conditions which may affect the design of the proposed structure’s foundation are reported. Further information describing this required investigation can be found in the Department’s “Geotechnical Bulletin #1” document. The Subsurface Exploration sheet is a CADDS drawing that illustrates the soil boring locations and is a graphical representation of the driller’s findings. This sheet is included in the structure plans. If the Department is not completing the geotechnical work on the project, the SIR and SE sheet(s) are the responsibility of the consultant.
The subsurface investigation is composed of two areas of investigation: the Surface Survey and the detailed Site Investigation.
Surface Surveys include studies of the site geology and air-photo review, and they can include geophysical methods of exploration. This work should include a review of any existing structure foundations and any existing geotechnical information. Surface Surveys provide valuable data indicating approximate soil conditions during the reconnaissance phase.
Based on the results of the Surface Survey information, the plans for a Detailed Site Investigation are made. The subsurface investigation needs to provide the following information:
• Depth, extent and thickness of each soil or rock stratum
• Soil texture, color, mottling and moisture content
• Rock type, color and condition
• In-situ field tests to determine soil and rock parameters
• Laboratory samples for determining soil or rock parameters
• Water levels, water loss during drilling, utilities and any other relevant information
The number and spacing of borings is controlled by the characteristics and sequence of subsurface strata and by the size and type of the proposed structure. Depending upon the timing of the Geotechnical Investigation the required information may not be available and the geotechnical engineer may have to develop a subsurface investigation plan based on the initial design. The Department understands that additional investigation may be required once the preliminary design is completed. The challenge for the Department and the consultant is to develop a geotechnical investigation budget without knowing the subsurface conditions that will be encountered. Existing subsurface information from previous work can help this situation, but the plans should be flexible to allow for some unforeseen subsurface conditions.

WisDOT Bridge Manual Chapter 10 – Geotechnical Investigation
January 2015 10-4
One particular subsurface condition is the presence of shallow rock. In some cases, borings should be made at a frequency of one per substructure unit to adequately define the subsurface conditions. However, with shallow rock two or more borings may be necessary to define the rock line below the foundation. Alternatively, where it is apparent the soil is uniform, fewer borings are needed. For example, a four span bridge with short (less than30 foot) spans at each end of a bridge may only require three borings versus the five borings (one per substructure).
Borings are typically advanced to a depth where the added stress due to the applied load is 10 percent of the existing stress due to overburden or extended beyond the expected pile penetration depths. Where rock is encountered, borings are advanced by diamond bit coring according to ASTM D2113 to determine rock quality according to ASTM D6032.
LRFD [Table 10.4.2-1] Minimum Number of Exploration Points and Depth of Exploration (modified after Sabatini et al., 2002) provides guidelines for an investigation of bridges (shallow foundations and deep foundations) and retaining walls. The following presents the typical subsurface investigation guidelines for the other structures:
• Box Culverts: The recommended spacing of the borings would be 1/every 200 feet of length of the box culvert with a minimum of two boring for a new box culvert. The borings should have 15 feet of continuous SPT samples below the base of the box culvert.
• Box Culvert Extensions: May require a boring depending upon the length of the extension and the available information from the existing box culvert. If a boring is recommended then it would follow the same procedures as for a new box culvert.
• Non-Standard Sign Structure Foundations: The recommended spacing would be one for each sign structure site. If the sign structure is a bridge with two foundations then one boring may still be adequate. The borings should have 20 feet of continuous SPT samples and a SPT sample at 25 feet and 30 feet below the ground surface at the sign structure site.
• High Mast Lighting Foundations: The recommended spacing would be one for each site. The borings should have 15 feet of continuous SPT samples and a SPT sample every 5 feet to a depth of 40 feet below the ground surface at the site.
• Noise Wall Foundations: The recommended spacing would be one for every 200 feet to 300 feet of wall. The borings should have 20 feet of continuous SPT samples below the ground surface.
The Department generally follows AASHTO laboratory testing procedures. Any or all of the following soil tests may be considered necessary or desirable at a given site:

WisDOT Bridge Manual Chapter 10 – Geotechnical Investigation
January 2015 10-5
In-situ (field) Tests
• Standard penetration
• Pocket penetrometer (cohesive soil)
• Vane shear (cohesive soil)
• Cone penetration (seldom used)
• Rock core recovery and Rock Quality Designation (RQD)
Laboratory Tests
• Moisture, density, consistency limits and unit weight
• Unconfined compression (cohesive soils and rock cores)
• Grain size analysis (water crossings) - This test is required for streambed sediments of multi-span structures over water to facilitate scour computations.
• One-dimensional consolidation (seldom used)
• Unconsolidated undrained triaxial compression (seldom used)
• Consolidated undrained triaxial compression with pore water pressure readings (seldom used)
• Corrosion Tests (pH, resistivity, sulfate, chloride and organic content)
One of the most widely used in-situ tests in the United States is the Standard Penetration Test (AASHTO T-206) as described in the AASHTO Standard Specifications. This test provides an indication of the relative density of cohesionless soils and, along with the pocket penetrometer readings, predicts the consistency and undrained shear strength of cohesive soils. Standard Penetration Tests (SPTs) generally consist of driving a 2-inch O.D. split barrel sampler into the ground with a 140-pound hammer falling over a height of 30 inches. The split-barrel sampler is driven in 6-inch increments for a total of 18-inches and the number of blows for each 6-inch increment is recorded. The field blow-count, SPT N-value, equals the number of blows that are required to drive the sampler the last 12-inches of penetration. Split-barrel samplers are typically driven with a conventional donut, safety or automatic-trip hammer. Hammer efficiencies, ER, are determined in accordance with ASTM D 4945. In lieu of a more detailed assessment, ER values of 45, 60 and 80 percent may be used to compute corrected blow counts, N60, for conventional, safety and automatic-trip hammers, respectively, in accordance with LRFD [10.4.6.2.4]. Correlation between standard penetration values and the resulting soil bearing value approximations are available from many sources. Standard penetration values can be used by experienced Geotechnical Engineers to estimate pile shaft resistance values by also considering soil texture, moisture

WisDOT Bridge Manual Chapter 10 – Geotechnical Investigation
January 2015 10-6
content, location of water table, depth below proposed footing and method of boring advance.
For example, DOT Geotechnical Engineers using DOT soil test information know that certain sand and clays in the northeastern part of Wisconsin have higher load-carrying capacities than tests indicate. This information is confirmed by comparing test pile data at the different sites to computed values. The increased capacities are realized by increasing the design point resistance and/or shaft resistance values in the Site Investigation Report.
Wisconsin currently uses most of the soil tests previously mentioned. The soil tests used for a given site are determined by the complexity of the site, size of the project and availability of funds for subsurface investigation. The scope and extent of the laboratory testing program should take into consideration available subsurface information obtained during the initial site reconnaissance and literature review, prior experience with similar subsurface conditions encountered in the project vicinity and potential risk to structure performance. Detailed information about how to develop a laboratory testing program and the type of tests required is presented in previous sited reference or refer to a soils textbook for a more detailed description of soil tests.
Laboratory tests of undisturbed samples provide a more accurate assessment of soil settlement and structural properties. Unconfined compression tests and other tests are employed to measure the undrained shear strength and to estimate pile shaft resistance in clay soils by assuming:
2qc u=
Where:
c = cohesion of soil
qu = unconfined compression strength
It is worthy to note that pile shaft resistance is a function of multiple parameters, including but not limited to stress state, depth, soil type and foundation type.
In addition to the tests of subsurface materials, a geological and/or geophysical study may be conducted to give such geological aspects as petrology, rock structure, rock quality, stratigraphy, vegetation and erosion. This can include in-situ and laboratory testing of selected samples, as well as utilizing non-destructive geophysical techniques, such as seismic refraction, electromagnetic or ground penetrating radar (GPR)
Boring and testing data analysis, along with consideration of the geology and terrain, allow the geotechnical engineer to present the following in the bridge SIR:
• The preferred type of substructure foundation (i.e. shallow or deep).
• The factored bearing resistance for shallow foundations.

WisDOT Bridge Manual Chapter 10 – Geotechnical Investigation
January 2015 10-7
• The settlement for the shallow foundations.
• If piles are required, recommend the most suitable type and the support values (shaft resistance and point resistance) furnished by the different soil strata.
• A discussion of any geotechnical issues that may affect construction.
• The presence and affect of water, including discussion of dewatering impact and cut-slope impact under abutments.
When piles are recommended, suitable pile types, estimated length requirements, pile drivability and design loads are discussed. Adverse conditions existing at abutments due to approach fills being founded on compressible material are pointed out, and recommended solutions are proposed. Unfactored resistance values at various elevations are given for footing foundation supports. Problems associated with scour, tremie seals, cofferdams, settlement of structure or approach fill slopes and other conditions unique to a specific site are discussed as applicable.

WisDOT Bridge Manual Chapter 10 – Geotechnical Investigation
January 2015 10-8
10.3 Soil Classification
The total weight of the structure plus all of the forces imposed upon the structure is carried by the foundation soils. There are many ways to classify these soils for foundation purposes. An overall geological classification follows:
1. Bedrock - This is igneous rock such as granite; sedimentary rock such as limestone, sandstone and shale; and metamorphic rock such as quartzite or marble.
2. Glacial soils (Intermediate Geo Material- IGM) - This wide variety of soils includes granular outwash, hard tills, bouldery areas and almost any combination of soil that glaciers can create and are typically defined to have a SPT number greater than 50.
3. Alluvial soils - These are found in flood plains and deltas along creeks and rivers. In Wisconsin, these soils normally contain large amounts of sand and silt. They are highly stratified and generally loose. Pockets of clay are found in backwater areas.
4. Residual soils - These soils are formed as a product of weathering and invariably reflect the parent bedrock material. They may be sands, silts or clay.
5. Lacustrine soils - These soils are formed as sediment and are deposited in water environments. In Wisconsin, they tend to be clayey. One example of these soils is the red clay sediments around Lakes Superior and Michigan.
6. Gravel, cobbles and boulders - These are particles that have been dislodged from bedrock, then transported and rounded by abrasion. Some boulders may result from irregular weathering.
Regardless of how the materials are formed, for engineering purposes, they are generally broken into the categories of bedrock, gravel, sand, silt, clay or a combination of these. The behavioral characteristics of any soil are generally based on the properties of the major constituent(s). Listed below are some properties associated with each of these material types.
1. Sand - The behavior of sand depends on grain size, gradation, density and water conditions. Sand scours easily, so foundations on sand must be protected in areas subject to scour.
2. Silt - This is a relatively poor foundation material. It scours and erodes easily and causes large volume changes when subject to frost.
3. Clay - This material needs to be investigated very carefully for use as a bearing material. Long-term consolidation may be an issue.
4. Bedrock - This is generally the best foundation material. Wisconsin has shallow weathered rock in many areas of the state. Weathered granite and limestone become sands. Shale and sandstone tend to weather more on exposure.

WisDOT Bridge Manual Chapter 10 – Geotechnical Investigation
January 2015 10-9
5. Mixture of soils - This is the most common case. The soil type with predominant behavior has the controlling name. For example, a soil composed of sand and clay is called sandy clay if the clayey fraction controls behavior.

WisDOT Bridge Manual Chapter 10 – Geotechnical Investigation
January 2015 10-10
10.4 Site Investigation Report
The following is a sample of a Site Investigation Report. The subsurface exploration drawing is also submitted with the report.

CORRESPONDENCE/MEMORANDUM ___________________State of Wisconsin
DATE: February 5, 2008 TO: Bill Niemi, P.E. Southwest Region, Madison Office Soils and Materials Engineer FROM: Jeffrey D Horsfall, P.E. Geotechnical Engineer SUBJECT: Site Investigation Report
Project I.D. 1390-04-01 B-28-146/147 STH 26 over Crawfish River Jefferson County
Attached is the Site Investigation Report for the above project. Please call if you have any questions. Attachments cc: Southwest Region, Madison Office (via e-mail)
Bureau of Structures, Structures Design (via e-mail) Tom Zalewski, Earth Tech (via e-mail)
Central Office Files Geotechnical File (original)

Site Investigation Report Project I.D. 1390-04-01 Structure B-28-146/147
STH 26 over the Crawfish River Jefferson County February 5, 2008
1. GENERAL The project is located on STH 26 over the Crawfish River, west of the city of Jefferson, Jefferson County. The two new structures will each have three spans and are part of the Jefferson Bypass project. The proposed base of the south abutments will require approximately 7 feet of fill, the piers will require 2 feet to 12 feet of excavation and the north abutments will require approximately 8 feet to 11 feet of excavation. Topography near the proposed structure is the lowlands and the Crawfish River. The project will be constructed using LRFD design for pile-supported substructures. The plans are in English units. The Southwest Region, Madison Office requested that the Geotechnical Unit evaluate the foundation support for the proposed bridges. The following report presents the results of the subsurface investigation, the design evaluation, the findings, the conclusions and the recommendations. 2. SUBSURFACE CONDITIONS The Geotechnical Section drill crews completed eight borings near the proposed structure. Samples were collected in the borings with a method conforming to AASHTO T-206, Standard Penetration Test, in May and June 2007, using an automatic hammer. The purpose of the borings was to define subsurface soil conditions at this location. Soil textures in the boring logs were field identified by the drillers. Attachment 1 presents tables showing the summaries of subsurface conditions logged in the borings at this site and at the time of drilling for the structures. Attachment 2 presents the results of the soils laboratory tests. Attachment 3 presents figures that illustrate the boring locations and graphical representations of the boring logs. The original borings logs are available at the Central Office Geotechnical Unit and will be made available upon request. The following describes the subsurface conditions in the eight borings:
South Side Land Borings (B-1, B-3 and B-6) 1.5 feet to 5.0 feet of topsoil or black silt, overlying 4.5 feet to 9.5 feet of gray, soft, silt, trace clay, trace organics, overlying 2.5 feet to 8.5 feet of gray to brown, loose to firm, fine to medium, sand, overlying 52.0 feet to 65.0 feet of gray, medium hard, clay, some silt, overlying Gray, firm to very dense, fine to course sand, some silt, some gravel and boulders (B-3 had a layer red silt at the base of the boring)

Site Investigation Report Structure B-28-146/147 Page 2
Water Borings (B-2, B-4 and B-5) 2.0 feet to 6.0 feet of water, overlying 0.0 feet to 6.0 feet of gray, very soft, silt, some sand, little organics, overlying 62.0 feet to 65.0 feet of gray, medium hard, clay, trace silt, overlying Gray, firm to very dense, fine to course, sand, some silt, some gravel
North Side Land Borings (B-8 and B-7) 1.0 feet to 3.0 feet of topsoil or light brown sand or silt, overlying 12.0 feet to 14.0 feet of light brown to gray, loose, sand and silt, mottled, overlying 2.0 feet to 3.0 feet of light brown, firm, fine to medium, sand, overlying 12.0 feet to 15.5 feet of gray, soft, silt, little sand, overlying 55.0 feet to 59.5 feet of gray, medium hard, clay, trace silt, overlying Gray, loose to very dense, sand, little silt, some gravel, trace boulders
The approximate water level at the time of drilling varied from elevation 773.5 feet to elevation 779.2 feet for the south side land borings, from elevation 777.0 feet to 778.0 feet in the Crawfish River and from 794.0 feet to 796.6 feet for the north side land borings. In addition, two of the borings (B-2 and B-4) experienced artesian conditions with a maximum water pressure of 7 feet above the level of the Crawfish River. 3. ANALYSIS ASSUMPTIONS The foundation analyses are separated into a shallow foundation (spread footings) or a deep foundation (piling support). The analyses used the following assumptions: Shallow Foundation (Allowable Stress Design) 1. The water level ranged from elevation 773.5 feet to elevation 796.6 feet. 2. The base of the foundations are at following elevations:
Table 1: Foundation Elevations Substructure B-28-146 B-52-147
South Abutment 790.7 792.5 Pier 1 771.0 771.2 Pier 2 769.2 768.6
North Abutment 786.9 788.9 3. The width of the footing is 6 feet. 4. The factor of safety is 3.0 for the allowable bearing capacity. Deep Foundation (Load and Reduction Factor Design) 1. Soil pressures for displacement piles are based upon a 10 3/4-inch diameter cast-in-place
pile. 2. The water level ranged from elevation 773.5 feet to elevation 796.6 feet.

Site Investigation Report Structure B-28-146/147 Page 3 3. Ultimate bearing capacity determined using the FHWA computer program DRIVEN. 4. The drivability evaluation used the computer program GRLWEAP. 5. The lateral capacities of the CIP piles are determined using the computer program LPILE. Table 3 presents the design shear strength and unit weights used in the analysis. The values are based upon, empirical formulas for angle of internal friction using the Standard Penetration Test results and the effective overburden pressure and for cohesion using the pocket penetrometer tests results. 4. RESULTS OF ANALYSIS Shallow Foundation The estimated allowable bearing capacity at the base of the substructures (see Table 1) ranged from 1,700 psf for the fill at the south abutment with a 2H:1V end slope to 1,900 psf to 5,300 psf for the silt and clay below the piers and north abutment. Table 2 presents the results of the allowable bearing capacity for the soils at the base of the substructure footings.
Table 2: Allowable Bearing Capacity (psf) Substructure B-28-146 B-28-147
South Abutment 1,700 psf 1,700 psf Pier 1 5,500 psf 1,900 psf Pier 2 4,900 psf 5,300 psf
North Abutment 2,000 psf 3,000 psf The estimated settlement from the bridge loads on the shallow foundations will be excessive at the substructures. The estimated settlement at the south abutment from the embankment load will range from 2 inches to 3 inches. The time for settlement would occur over several months in the fine-grained soils. Deep Foundation Table 3 shows the estimated skin friction and end bearing values. Drivability The drivability evaluation used a Delmag D-16-32 diesel hammer to determine if the pile would be overstressed during pile installation. The results of the evaluation indicated that a 10 3/4-inch CIP pile should have the minimum pile thickness increased from 0.219-inches to 0.365-inches for the pile not to be overstressed during installation. Lateral Pile Load Capacity The lateral capacity of the 10 3/4-inch CIP piles is 8 kips for the front row and 12 kips at the back row at the south abutment and 14 kips for both rows of piles at the north abutment. The proposed abutment type is an A4.

Site Investigation Report Structure B-28-146/147 Page 4
Table 3: Soil Parameters and Foundation Capacities Soil Description Friction Angle
(degrees) Cohesion
(psf) Unit Weight
(pcf) Nominal
Skin Friction1 (psf)
Nominal End Bearing1
(psf) B-28-146 South Abutment (B-1)
Fill, granular (replaces excavated 2’ of topsoil) (Elevation 790.7 ft – 781.4 ft)
32 0 120 160 14,100
Silt, gray, trace clay, trace organics (Elevation 781.4 ft – 771.9 ft)
0 500 110 440 4,500
Sand, gray, fine to medium (Elevation 771.9 ft – 769.4 ft)
31 0 118 470 20,700
Silt, gray, trace silt (Elevation 769.4 ft – 755.4 ft)
0 2,000 120 1,510 18,000
Clay, gray, some silt (Elevation 755.4 ft – 723.4 ft)
0 2,250 123 1,570 20,200
Clay, gray, some silt (Elevation 723.4 ft – 704.4 ft)
0 2,500 125 1,520 22,500
Limestone Boulder (Elevation 704.4 ft – 703.4 ft)
NA NA NA NA NA
Sand, fine to medium, some silt, some gravel (Elevation 703.4 ft – 695.4 ft)
35 0 135 2,270 107,700
Boulder (Elevation 695.4 ft – 694.4 ft)
NA NA NA NA NA
Sand, gray, fine to medium, some silt, some gravel (Elevation 694.4 ft and below)
0 36,000 140 NA Refusal
1. Skin friction and end bearings values are nominal values and have not been modified by a resistance factor. 2. NA - not applicable 3. Refusal, steel pile will obtain capacity in the very dense sand and silt layer.

Site Investigation Report Structure B-28-146/147 Page 5
Table 3: Soil Parameters and Foundation Capacities (Continued) Soil Description Friction Angle
(degrees) Cohesion
(psf) Unit Weight
(pcf) Nominal
Skin Friction1 (psf)
Nominal End Bearing1
(psf) B-28-147 South Abutment (B-3)
Fill, granular (replaces excavated 1.5’ of black silt) (Elevation 792.5 ft – 783.7 ft)
32 0 120 150 13,300
Silt, light brown (Elevation 783.7 ft – 779.2 ft)
0 1,000 115 820 9,000
Sand, gray to brown, fine to course (Elevation 779.2 ft – 770.7 ft)
31 0 118 460 20,700
Clay, gray to brown, trace silt (Elevation 770.7 ft – 750.2 ft)
0 1,000 115 950 9,000
Clay, gray to brown, trace silt (Elevation 750.2 ft – 730.2 ft)
0 1,500 118 1,290 13,500
Clay, gray to brown, trace silt (Elevation 730.2 ft – 705.7 ft)
0 1,750 118 1,430 15,800
Sand, gray, fine to course, some silt, little gravel (Elevation 705.7 ft – 699.7 ft)
30 0 115 1,320 13,300
Silt, gray, trace clay (Elevation 699.7 ft – 695.7 ft)
0 4,500 135 1,250 40,500
Sand, brown, fine to course, some silt, little gravel (Elevation 695.7 ft – 691.2 ft)
35 0 135 2,320 107,700
Sand, brown, fine to course, some silt, little gravel (Elevation 691.2 ft – 680.2 ft)
0 36,000 140 NA Refusal
Silt, red, some gravel, little clay (Elevation 680.2 ft and below)
0 36,000 140 NA Refusal
1. Skin friction and end bearings values are nominal values and have not been modified by a resistance factor. 2. NA - not applicable 3. Refusal, steel pile will obtain capacity in the very dense sand and silt layer.

Site Investigation Report Structure B-28-146/147 Page 6
Table 3: Soil Parameters and Foundation Capacities (Continued) Soil Description Friction Angle
(degrees) Cohesion
(psf) Unit Weight
(pcf) Nominal
Skin Friction1 (psf)
Nominal End Bearing1
(psf) B-28-146 Pier 1 (B-2)
Silt, gray, some sand, some organics (Elevation 771.0 ft – 770.0 ft)
28 0 105 10 300
Clay, gray, trace silt (Elevation 770.0 ft – 749.0 ft)
0 2,500 125 1,250 22,500
Clay, gray, trace silt (Elevation 749.0 ft – 729.0 ft)
0 2,500 125 1,520 22,500
Clay, gray, trace silt (Elevation 729.0 ft – 708.0 ft)
0 2,250 123 1,570 20,300
Sand, gray, fine to medium, some silt, little gravel (Elevation 708.0 ft – 700.5 ft)
38 0 135 2,170 268,700
Sand and Gravel, fine to course, some silt, boulders (Elevation 700.5 ft and below)
0 36,000 140 NA Refusal
B-28-147 Pier 1 (B-6) Sand, fine to medium, trace shells (Elevation 771.2 ft – 768.5 ft)
30 0 110 10 1,100
Clay, gray (Elevation 768.5 ft – 743.0 ft)
0 2,000 120 1,410 18,000
Clay, gray (Elevation 743.0 ft – 728.0 ft)
0 2,000 120 1,510 18,000
Clay, gray (Elevation 728.0 ft – 708.0 ft)
0 2,250 123 1,570 20,300
Gravel (Elevation 708.0 ft – 704.0 ft)
38 0 135 1,990 268,700
Sand, brown, some silt, little gravel (Elevation 704.0 ft and below)
0 36,000 140 NA Refusal
1. Skin friction and end bearings values are nominal values and have not been modified by a resistance factor. 2. NA - not applicable 3. Refusal, steel pile will obtain capacity in the very dense sand and silt layer.

Site Investigation Report Structure B-28-146/147 Page 7
Table 3: Soil Parameters and Foundation Capacities (Continued) Soil Description Friction Angle
(degrees) Cohesion
(psf) Unit Weight
(pcf) Nominal
Skin Friction1 (psf)
Nominal End Bearing1
(psf) B-28-146 Pier 2 (B-4)
Clay, gray, some silt (Elevation 769.2 ft – 753.0 ft)
0 2,500 125 1,140 22,500
Clay, gray, some silt (Elevation 753.0 ft – 733.0 ft)
0 2,500 125 1,520 22,500
Clay, gray, some silt (Elevation 733.0 ft – 709.0 ft)
0 2,250 123 1,570 20,300
Sand, gray, fine to medium, some silt, little gravel (Elevation 709.0 ft – 705.0 ft)
32 0 120 1,090 33,000
Gravel, fine to course, little sand (Elevation 705.0 ft – 701.0 ft)
38 0 135 2,130 268,700
Sand and Gravel, fine to course, some silt (Elevation 701.0 ft and below)
0 36,000 140 NA Refusal
B-28-147 Pier 2 (B-5) Clay, gray, some silt (Elevation 768.6 ft – 753.0 ft)
0 2,750 128 1,010 24,800
Clay, gray, some silt (Elevation 753.0 ft – 733.0 ft)
0 2,500 125 1,520 22,500
Clay, gray, some silt (Elevation 733.0 ft – 707.5 ft)
0 2,500 125 1,520 22,500
Sand, gray, fine to course, some silt, some gravel (Elevation 707.5 ft – 703.5 ft)
34 0 130 1,360 73,600
Sand and Gravel, gray, fine to course, some silt (Elevation 703.5 ft – 695.0 ft)
40 0 138 2,790 417,800
Sand and Gravel, gray, fine to course, some silt (Elevation 695.0 ft – 689.0 ft)
32 0 120 1,400 33,000
Gravel, gray, fine to course, few boulders (Elevation 689.0 ft and below)
0 36,000 140 NA Refusal
1. Skin friction and end bearings values are nominal values and have not been modified by a resistance factor. 2. NA - not applicable 3. Refusal, steel pile will obtain capacity in the very dense sand and silt layer.

Site Investigation Report Structure B-28-146/147 Page 8
Table 3: Soil Parameters and Foundation Capacities (Continued) Soil Description Friction Angle
(degrees) Cohesion
(psf) Unit Weight
(pcf) Nominal
Skin Friction1 (psf)
Nominal End Bearing1
(psf) B-28-146 North Abutment (B-8)
Silt, brown to gray, little sand, mottled (Elevation 786.9 ft – 782.6 ft)
0 1,000 110 800 9,000
Sand, light brown, fine to medium (Elevation 782.6 ft – 780.6 ft)
34 0 125 90 9,900
Silt, gray, little sand (Elevation 780.6 ft – 768.6 ft)
0 1,500 115 1,140 13,500
Clay, gray, little silt (Elevation 768.6 ft – 742.6 ft)
0 2,500 125 1,520 22,500
Clay, gray, little silt (Elevation 742.6 ft – 722.6 ft)
0 1,500 115 1,290 13,500
Clay, gray, little silt (Elevation 722.6 ft – 709.1 ft)
0 2,000 120 1,510 18,000
Sand, gray, some silt, little gravel, trace boulders (Elevation 709.1 ft and below)
0 36,000 140 NA Refusal
1. Skin friction and end bearings values are nominal values and have not been modified by a resistance factor. 2. NA - not applicable 3. Refusal, steel pile will obtain capacity in the very dense sand and silt layer.

Site Investigation Report Structure B-28-146/147 Page 9
Table 3: Soil Parameters and Foundation Capacities Soil Description Friction Angle
(degrees) Cohesion
(psf) Unit Weight
(pcf) Nominal
Skin Friction1 (psf)
Nominal End Bearing1
(psf) B-28-147 North Abutment (B-7)
Silt, brown, trace sand, mottled (Elevation 788.9 ft – 782.0 ft)
0 1,500 115 1,060 13,500
Sand, brown, fine (Elevation 782.0 ft – 779.0 ft)
34 0 125 150 16,800
Silt, gray, trace sand (Elevation 779.0 ft – 763.5 ft)
0 2,000 120 1,380 18,000
Clay, gray, trace silt (Elevation 763.5 ft – 742.0 ft)
0 2,000 120 1,510 18,000
Clay, gray, trace silt (Elevation 742.0 ft – 722.0 ft)
0 2,000 120 1,510 18,000
Clay, gray, trace silt (Elevation 722.0 ft – 712.0 ft)
0 1,500 115 1,290 13,500
Silt, gray, little clay, trace sand and gravel (Elevation 712.0 ft – 708.5 ft)
0 1,000 110 940 9,000
Sand, gray, little silt and gravel (Elevation 708.5 ft – 700.0 ft)
29 0 110 1,010 13,300
Sand, gray, some gravel, little silt (Elevation 700.0 ft – 691.0 ft)
32 0 120 1,470 33,000
Sand, gray, little silt, some gravel (Elevation 691.0 ft and below)
0 36,000 140 NA Refusal
1. Skin friction and end bearings values are nominal values and have not been modified by a resistance factor. 2. NA - not applicable 3. Refusal, steel pile will obtain capacity in the very dense sand and silt layer.

Site Investigation Report Structure B-28-146/147 Page 10 Lateral Earth Pressure The lateral earth pressure for the backfill material will exert 36 psf for sandy soils. The backfill material will be granular, free draining and locally available. Scour The bridge section will estimate the scour depth based on the soil types located in the riverbed. 5. FINDING AND CONCLUSIONS
The following findings and conclusions are based upon the subsurface conditions and the analysis: 1. The following describes the subsurface conditions in the eight borings:
South Side Land Borings (B-1, B-3 and B-6) 1.5 feet to 5.0 feet of topsoil or black silt, overlying 4.5 feet to 9.5 feet of gray, soft, silt, trace clay, trace organics, overlying 2.5 feet to 8.5 feet of gray to brown, loose to firm, fine to medium, sand, overlying 52.0 feet to 65.0 feet of gray, medium hard, clay, some silt, overlying Gray, firm to very dense, fine to course sand, some silt, some gravel and boulders (B-3 had a layer red silt at the base of the boring)
Water Borings (B-2, B-4 and B-5) 2.0 feet to 6.0 feet of water, overlying 0.0 feet to 6.0 feet of gray, very soft, silt, some sand, little organics, overlying 62.0 feet to 65.0 feet of gray, medium hard, clay, trace silt, overlying Gray, firm to very dense, fine to course, sand, some silt, some gravel
North Side Land Borings (B-8 and B-7) 1.0 feet to 3.0 feet of topsoil or light brown sand or silt, overlying 12.0 feet to 14.0 feet of light brown to gray, loose, sand and silt, mottled, overlying 2.0 feet to 3.0 feet of light brown, firm, fine to medium, sand, overlying 12.0 feet to 15.5 feet of gray, soft, silt, little sand, overlying 55.0 feet to 59.5 feet of gray, medium hard, clay, trace silt, overlying Gray, loose to very dense, sand, little silt, some gravel, trace boulders
2. The approximate water level at the time of drilling varied from elevation 773.5 feet to
elevation 779.2 feet for the south side land borings, from elevation 777.0 feet to 778.0 feet in the Crawfish River and from 794.0 feet to 796.6 feet for the north side land borings. In addition, two of the borings (B-2 and B-4) experienced artesian conditions with a maximum water pressure of 7 feet above the level of the Crawfish River.
3. The estimated allowable bearing capacity at the base of the substructures (see Table 1)
ranged from 1,700 psf for the fill at the south abutment with a 2H:1V end slope to 1,900 psf to 5,300 psf for the silt and clay below the piers and north abutment. Table 2 presents

Site Investigation Report Structure B-28-146/147 Page 11
the results of the allowable bearing capacity calculations. The calculation utilized a factor of safety of 3.
4. Support of the piles will occur in the very dense silt, weathered bedrock or bedrock. The
pile tip elevation will range from 693 feet to 709 feet. The driven pile lengths will depend upon the type of pile hammer used and the actual subsurface conditions encountered.
5. The drivability evaluation used a Delmag D-16-32 diesel hammer to determine if the pile
would be overstressed during pile installation. The results of the evaluation indicated that a 10 3/4-inch CIP pile should have the minimum pile thickness increased from 0.219-inches to 0.365-inches for the pile not to be overstressed during installation.
6. The lateral capacity of the 10 3/4-inch CIP piles is 8 kips for the front row and 12 kips at
the back row at the south abutment and 14 kips for both rows of piles at the north abutment. The proposed abutment type is an A4.
6. RECOMMENDATIONS The following recommendations are based upon the findings and conclusions:
1. The recommended support system for the abutments and piers are 10 3/4-inch diameter cast in place piles driven to a “Required Driving Resistance” of 186 tons using modified Gates dynamic formula. These values use a “Factored Axial Compression Resistance” of 74.5 tons and a Resistance Factor of 0.4 for the modified Gates dynamic formula.
Table 4 presents the estimated pile tip elevations for the substructures. The actual pile lengths compared to the design pile lengths maybe shorter, because the piles may achieve bearing in the dense sand or silt layers above the very dense sand and gravel layers.
Table 4: Estimated 10 3/4-inch diameter CIP Pile Tip Elevations Substructure B-28-146 B-28-147 South Abutment 703 feet 693 feet Pier 1 708 feet 708 feet Pier 2 705 feet 703 feet North Abutment 709 feet 694 feet
2. The drivability evaluation indicated that the driving stresses require the thickness of the
10 3/4-inch diameter CIP piles should be increased from 0.219-inches to 0.365-inches.
3. Flush mounted end plates should be used at the end of the 10 3/4-inch diameter cast in place pile to reduce the potential for loss of skin friction resistance because of the artesian conditions.

Site Investigation Report Structure B-28-146/147 Page 12
4. Pile spacing should be as great as possible to reduce the effect of densification of the soils during installation of cast in place piles within the cofferdam.
5. The settlement of the subsurface soils caused by the construction of the south abutment
approach embankments will cause excessive down drag loads on the piles. Therefore, the plans should provide details for excavating the topsoil and silt and backfilling with granular fill prior to installation of the embankments and piling at the south abutments. The limits of the excavation should be based on a 1.5H:1V slope from the east and west subgrade shoulder points and from the front of the south abutments and the back of the approach slabs. The estimated depth of the excavation should range from 11 feet (east end) to 7 feet (west end).
An alternative option would be to surcharge the south abutment areas prior to construction of the bridges. The estimated time for the consolidation of the compressible materials would be approximately 6 months.
6. Granular 1 backfill should be used behind the abutments.

Site Investigation Report Structure B-28-146/147 Attachment 1
Attachment 1 Tables of Subsurface Conditions
Site Investigation Report Structure B-28-146/147 Attachment 1
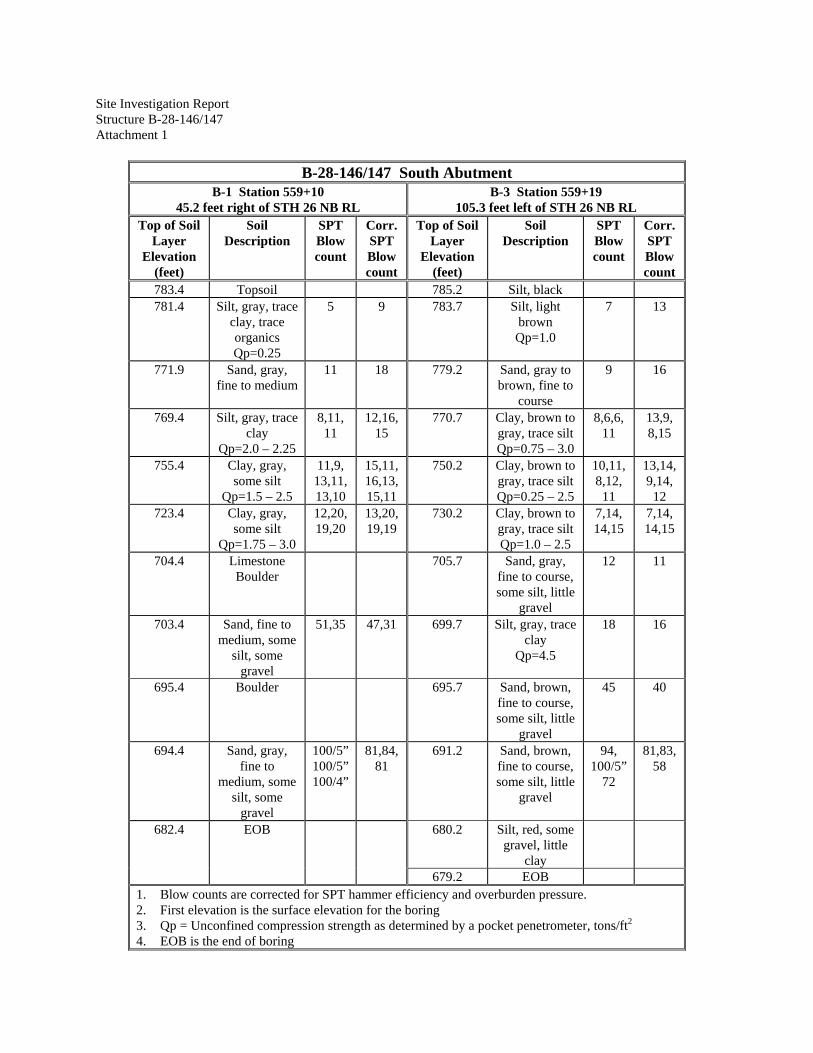
B-28-146/147 South Abutment B-1 Station 559+10
45.2 feet right of STH 26 NB RL B-3 Station 559+19
105.3 feet left of STH 26 NB RL Top of Soil
Layer Elevation
(feet)
Soil Description
SPT Blow count
Corr. SPT Blow count
Top of Soil Layer
Elevation (feet)
Soil Description
SPT Blow count
Corr. SPT Blow count
783.4 Topsoil 785.2 Silt, black 781.4 Silt, gray, trace
clay, trace organics Qp=0.25
5 9 783.7 Silt, light brown Qp=1.0
7 13
771.9 Sand, gray, fine to medium
11 18 779.2 Sand, gray to brown, fine to
course
9 16
769.4 Silt, gray, trace clay
Qp=2.0 – 2.25
8,11, 11
12,16,15
770.7 Clay, brown to gray, trace silt Qp=0.75 – 3.0
8,6,6,11
13,9, 8,15
755.4 Clay, gray, some silt
Qp=1.5 – 2.5
11,9, 13,11,13,10
15,11,16,13,15,11
750.2 Clay, brown to gray, trace silt Qp=0.25 – 2.5
10,11,8,12,
11
13,14,9,14,
12 723.4 Clay, gray,
some silt Qp=1.75 – 3.0
12,20,19,20
13,20,19,19
730.2 Clay, brown to gray, trace silt Qp=1.0 – 2.5
7,14, 14,15
7,14, 14,15
704.4 Limestone Boulder
705.7 Sand, gray, fine to course, some silt, little
gravel
12 11
703.4 Sand, fine to medium, some
silt, some gravel
51,35 47,31 699.7 Silt, gray, trace clay
Qp=4.5
18 16
695.4 Boulder 695.7 Sand, brown, fine to course, some silt, little
gravel
45 40
694.4 Sand, gray, fine to
medium, some silt, some
gravel
100/5” 100/5” 100/4”
81,84,81
691.2 Sand, brown, fine to course, some silt, little
gravel
94, 100/5”
72
81,83,58
682.4 EOB 680.2 Silt, red, some gravel, little
clay
679.2 EOB 1. Blow counts are corrected for SPT hammer efficiency and overburden pressure. 2. First elevation is the surface elevation for the boring 3. Qp = Unconfined compression strength as determined by a pocket penetrometer, tons/ft2 4. EOB is the end of boring

Site Investigation Report Structure B-28-146/147 Attachment 1
B-28-146/147 Pier 1 B-2 Station 560+77
18 feet right of STH 26 NB RL B-6 Station 560+54
79.1 feet left of STH 26 NB RL Top of Soil
Layer Elevation
(feet)
Soil Description
SPT Blow count
Corr. SPT Blow count
Top of Soil Layer
Elevation (feet)
Soil Description
SPT Blow count
Corr. SPT Blow count
779.0 Barge 783.0 Silt, black, trace clay
778.0 Water 778.0 Silt, brown, trace sand, trace fibers
Qp=0.5 – 1.0
4 8
776.0 Silt, gray, some sand,
some organics
0,6,4 0,16,9 773.5 Sand, fine to medium, trace
shells
5 8
770.0 Clay, gray, trace silt
Qp=2.0 – 2.75
8,14, 8,12,8
17,28,14,20,
12
768.5 Clay, gray Qp=0.5 – 2.75
8,9,7,9,10,8
12,13,9,12, 12,9
749.0 Clay, gray, trace silt
Qp=1.75 – 2.5
10,13,10,14
14,18,13,18
743.0 Clay, gray Qp=1.25 –
2.25
12,10,10
14,11,11
729.0 Clay, gray, trace silt
Qp=1.75 – 3.0
12,13,18,16
14,15,20,17
728.0 Clay, gray Qp=1.5 – 2.75
13,11,13
13,11,13
708.0 Sand, gray, fine to
medium, some silt, little
gravel
95,67 99,67 708.0 Gravel 100/5” 94
700.5 Sand and Gravel, fine to course, some
silt, some boulders
ARTESIAN
100/3” 100/2”
97,94 704.0 Sand, brown, some silt, little
gravel
72, 100/2” 100/1” 100/1”
65,88,85,82
694.0 EOB 688.9 EOB 1. Blow counts are corrected for SPT hammer efficiency and overburden pressure. 2. First elevation is the surface elevation for the boring 3. Qp = Unconfined compression strength as determined by a pocket penetrometer, tons/ft2 4. EOB is the end of boring

Site Investigation Report Structure B-28-146/147 Attachment 1
B-28-146/147 Pier 2 B-4 Station 562+23
19 feet right of STH 26 NB RL B-5 Station 562+20
79 feet left of STH 26 NB RL Top of Soil
Layer Elevation
(feet)
Soil Description
SPT Blow count
Corr. SPT Blow count
Top of Soil Layer
Elevation (feet)
Soil Description
SPT Blow count
Corr. SPT Blow count
778.0 Barge 778.0 Barge 777.0 Water 777.0 Water 771.0 Clay, gray,
some silt Qp=1.75 – 3.0
11,13,12,13,12,16
32,32,26,27,23,28
773.0 Clay, gray, some silt
Qp=2.75 – 3.25
8,15, 11,14
47,34,21,24
753.0 Clay, gray, some silt
Qp=2.25 – 2.5
16,14,17,15
26,21,24,20
753.0 Clay, gray, some silt
Qp=2.0 – 2.75
14,13,13,13
22,20,18,17
733.0 Clay, gray, some silt
Qp=1.75 – 2.25
17,14,16,14,
26
22,17,19,18,
29
733.0 Clay, gray, some silt
Qp=2.0 – 2. 5
16,14,17,18,
18
21,17,20,20,
20
709.0 Sand, gray, fine to
medium, some silt, little
gravel
22 23 707.5 Sand, gray, fine to
medium, some silt, some
gravel
27 31
705.0 Gravel, fine to course, little
sand
35 36 703.5 Sand and Gravel, gray, fine to course,
some silt
106, 43
109, 42
701.0 Sand and Gravel, fine to course, some
silt ARTESIAN
120, 134, 107
119, 129, 98
695.0 Sand, gray, fine to
medium, some silt, some
gravel
19 18
686.5 EOB 689.0 Gravel, gray, fine to course, few boulders
100/5” 100/5” 100/3”
93,89,87
678.0 EOB 1. Blow counts are corrected for SPT hammer efficiency and overburden pressure. 2. First elevation is the surface elevation for the boring 3. Qp = Unconfined compression strength as determined by a pocket penetrometer, tons/ft2 4. EOB is the end of boring

Site Investigation Report Structure B-28-146/147 Attachment 1
B-28-146/147 North Abutment B-8 Station 563+19
45.0 feet right of STH 26 NB RL B-7 Station 563+19
105.0 feet left of STH 26 NB RL Top of Soil
Layer Elevation
(feet)
Soil Description
SPT Blow count
Corr. SPT Blow count
Top of Soil Layer
Elevation (feet)
Soil Description
SPT Blow count
Corr. SPT Blow count
797.6 Sand, light 797.0 Topsoil brown, some
silt 796.0 Silt, light
brown
796.6 Silt, brown to gray, little
sand, mottled
7,6 13,9 794.0 Sand, light brown, some silt, mottled
9 16
Qp=1.25 789.0 Silt, brown, tr. sand, mottled
Qp=1.5
9 15
782.6 Sand, light brown, fine to
medium
27 37 782.0 Sand, brown, fine
16 25
780.6 Silt, gray, little sand
Qp=1.25 – 3.0
6,8 8,10 779.0 Silt, gray, trace sand
Qp= 0.5 – 2.5
5,8,11 7,11, 15
768.6 Clay, gray, little silt
Qp=1.5 – 2.75
11,1010,9
13,12,11,9
763.5 Clay, gray, trace silt
Qp=1.75 – 2.25
13,12,14,11
16,15,16,12
742.6 Clay, gray, little silt
Qp=1.25 – 2.2
9,10, 12,10
9,10, 11,9
742.0 Clay, gray, trace silt
Qp=1.25 – 2.5
11,13,11,11
12,14,11,11
722.6 Clay, gray, little silt
Qp=2.0 – 2.25
10,11,16
9,10, 14
722.0 Clay, gray, trace silt
Qp=1.75 – 2.0
11,11 11,10
709.1 Sand, gray, some silt, little gravel, trace
boulders
92, 100/3” 100/4”
77,82,79
712.0 Silt, gray, little clay, tr. sand and gravel
Qp=0.75 – 1.2
10 9
697.1 EOB 708.5 Sand, gray, little silt and
gravel
6,12 5,10
700.0 Sand, gray, some gravel,
little silt
32,21 27,17
691.0 Sand, gray, some gravel,
little silt
100/1” 100/0”
80,77
683.0 EOB 1. Blow counts are corrected for SPT hammer efficiency and overburden pressure. 2. First elevation is the surface elevation for the boring 3. Qp = Unconfined compression strength as determined by a pocket penetrometer, tons/ft2 4. EOB is the end of boring

Site Investigation Report Structure B-28-146/147 Attachment 2
Attachment 2 Soils Laboratory Test Results


Site Investigation Report Structure B-28-146/147 Attachment 3
Attachment 3 Bridge Figures
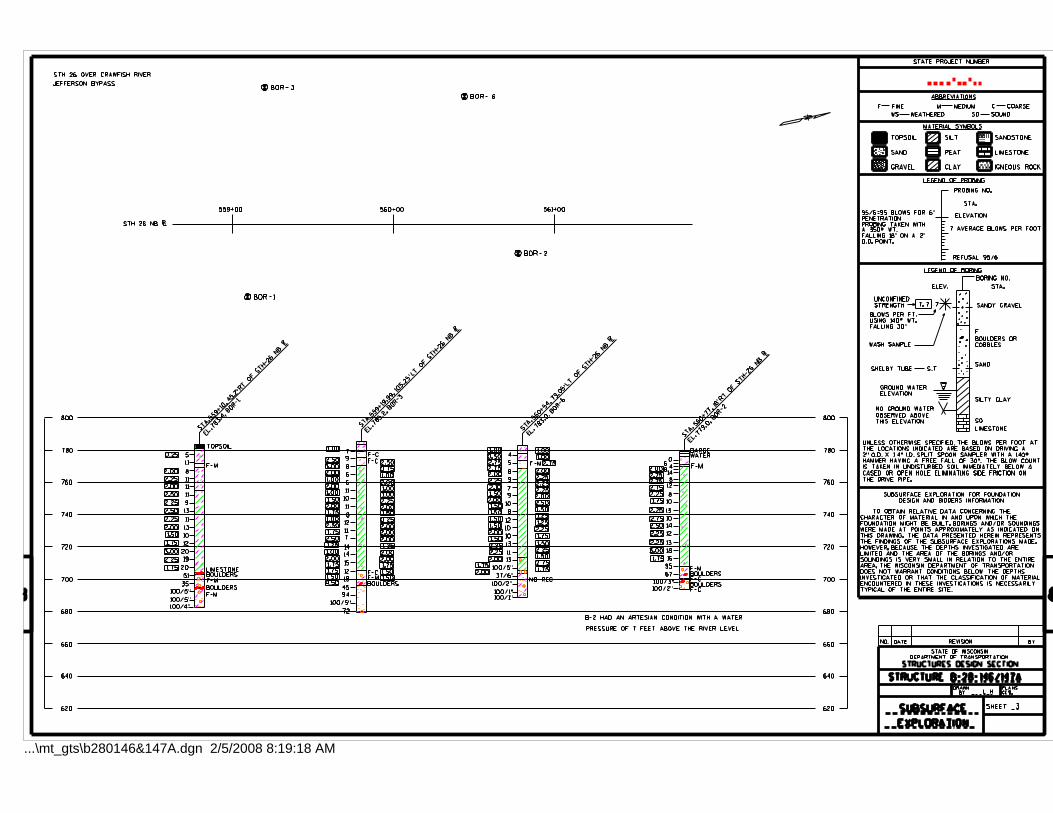
...\mt_gts\b280146&147A.dgn 2/5/2008 8:19:18 AM
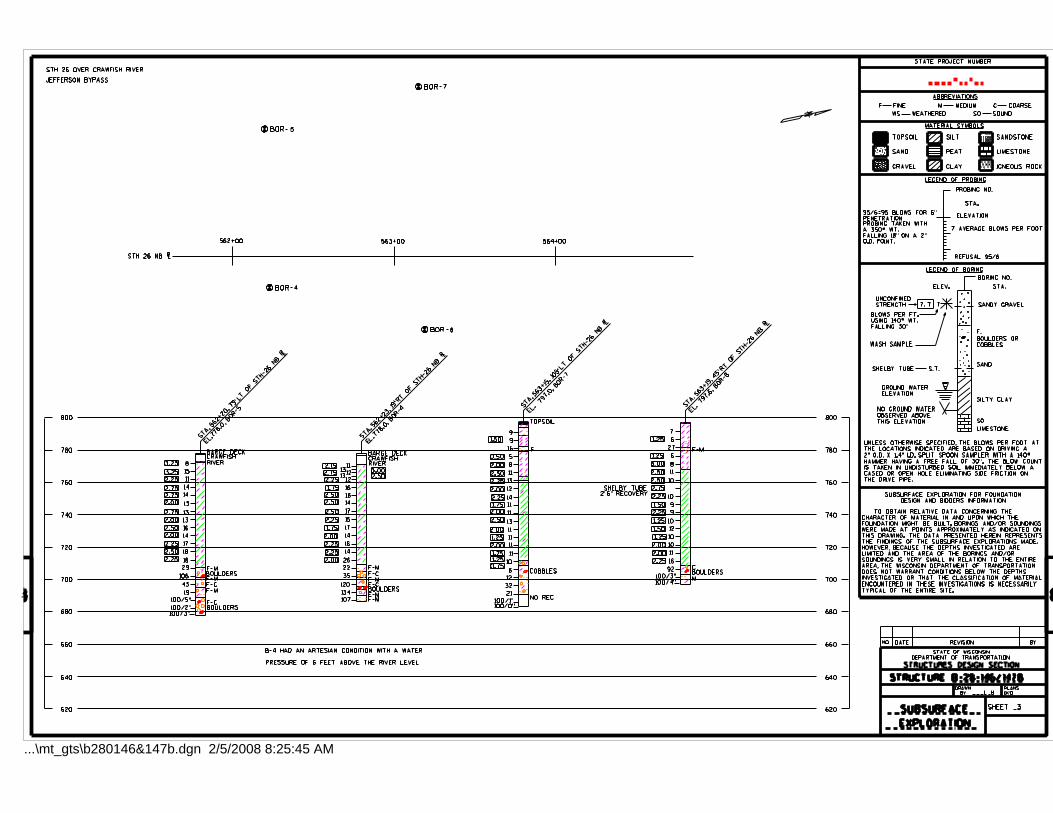
...\mt_gts\b280146&147b.dgn 2/5/2008 8:25:45 AM

WisDOT Bridge Manual
This page intentionally left blank.