wisconsin education challenges tom mccarthy, communications officer wisconsin department of public...
TRANSCRIPT
Wisconsin Education Challenges
Tom McCarthy, Communications Officer Wisconsin Department of Public Instruction
Changing Faces of Wisconsin

Poverty is Growing in WisconsinChange in Free & Reduced Lunch (2001-2012)
Source: Wisconsin Department of Public Instruction. School Finance Maps. http://dpi.wi.gov/sfs/maps.html
In many rural districts, more than half the students are eligible for free-and-reduced lunch.
Wisconsin FRL Rate Doubles
2001: 21%2012: 43%
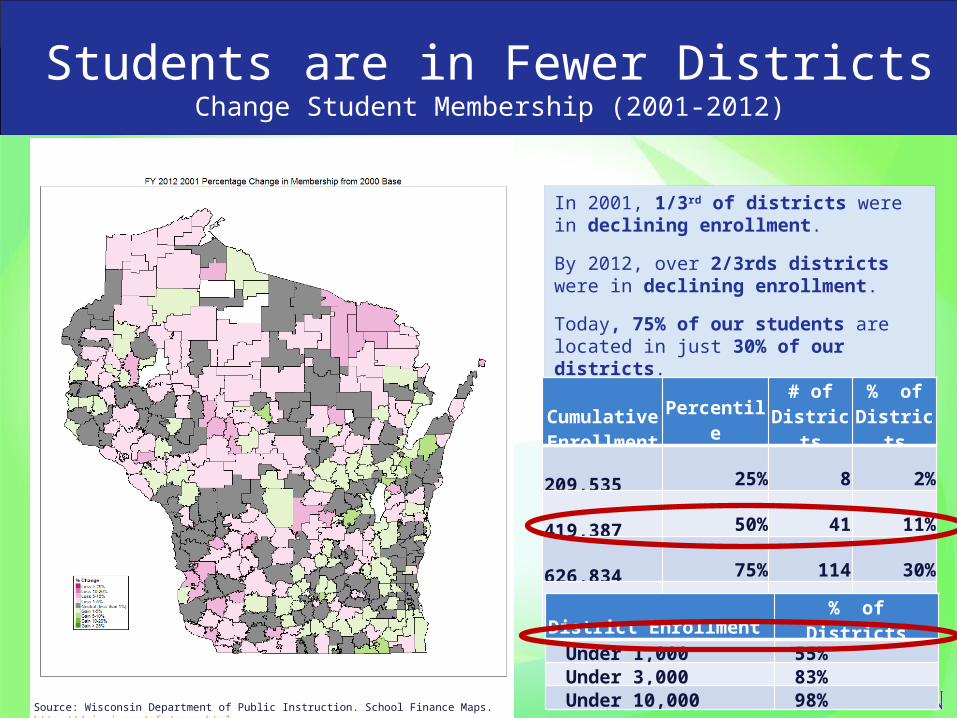
Students are in Fewer DistrictsChange Student Membership (2001-2012)
In 2001, 1/3rd of districts were in declining enrollment.
By 2012, over 2/3rds districts were in declining enrollment.
Today, 75% of our students are located in just 30% of our districts.
Wisconsin FRL Rate Doubles
2001: 21%2012: 43%
Cumulativ
e Enrollment
Percentile
# of District
s
% of District
s 209,535 25% 8 2% 419,387 50% 41 11% 626,834 75% 114 30% 871,551 100% 424 100%
Source: Wisconsin Department of Public Instruction. School Finance Maps. http://dpi.wi.gov/sfs/maps.html
District Enrollment % of DistrictsUnder 1,000 55%Under 3,000 83%Under 10,000 98%

Which Means Rural Districts Have Fewer Kids & Greater Poverty
Wisconsin FRL Rate Doubles
2001: 21%2012: 43%
Source: Wisconsin Department of Public Instruction. School Finance Maps. http://dpi.wi.gov/sfs/maps.html

Why Does it Matter?

And Poverty Impacts Achievement(2012-13 Report Card Data)
There is a very strong correlation between poverty and school performance.
Avg. FRL
HIGH-poverty, LOW-performing schools
LOW-poverty, HIGH-performing schools
Source: Wisconsin Department of Public Instruction. School and District Report Cards http://reportcards.dpi.wi.gov/

But Poverty Can’t Explain Any the Racial Achievement Gap
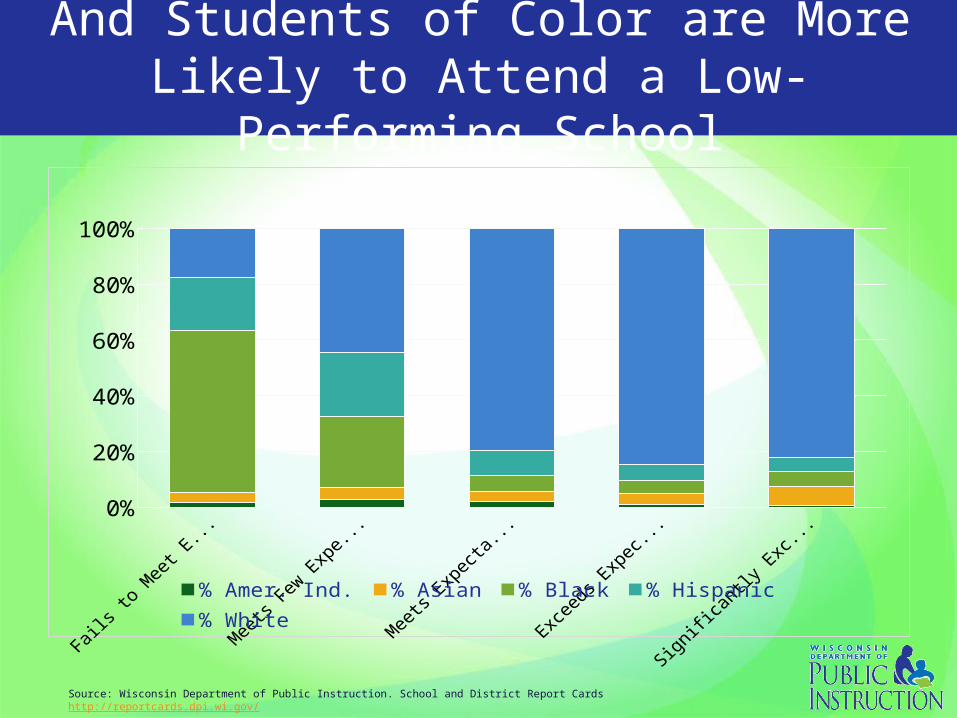
And Students of Color are More Likely to Attend a Low-Performing
School
0%10%20%30%40%50%60%70%80%90%
100%
% Amer. Ind. % Asian % Black % Hispanic % White
Source: Wisconsin Department of Public Instruction. School and District Report Cards http://reportcards.dpi.wi.gov/

Vouchers & Charters Expansion
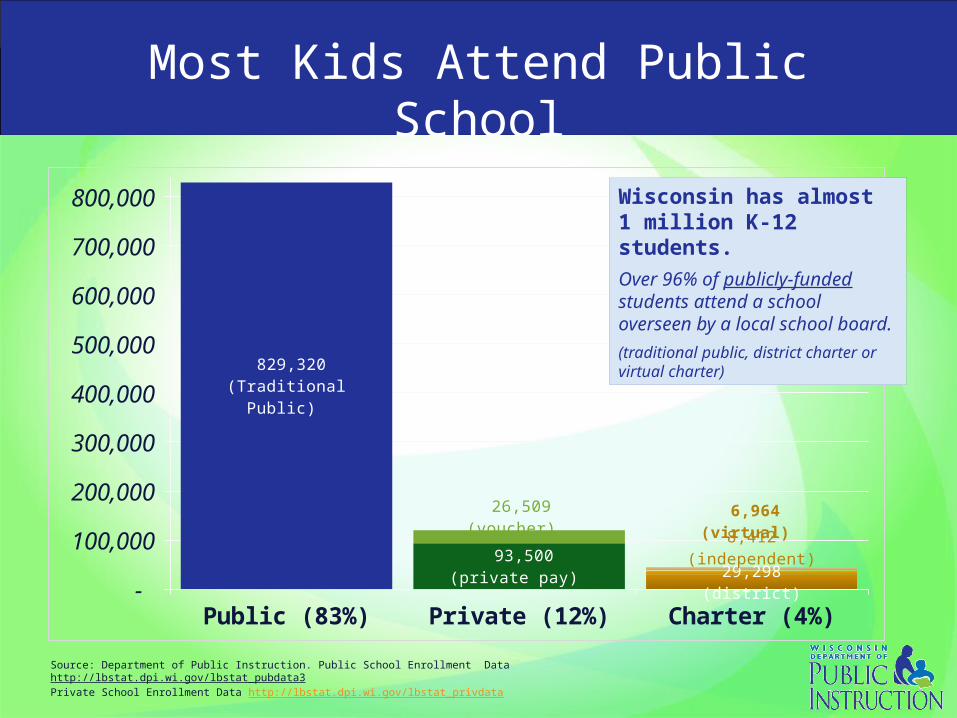
Most Kids Attend Public School
Public (83%) Private (12%) Charter (4%) -
100,000
200,000
300,000
400,000
500,000
600,000
700,000
800,000
829,320(Traditional
Public)
93,500 (private pay) 29,298 (district)
26,509 (voucher) 8,412 (inde-
pendent)
6,964 (virtual)
Source: Department of Public Instruction. Public School Enrollment Data http://lbstat.dpi.wi.gov/lbstat_pubdata3 Private School Enrollment Data http://lbstat.dpi.wi.gov/lbstat_privdata
Wisconsin has almost 1 million K-12 students.Over 96% of publicly-funded students attend a school overseen by a local school board.
(traditional public, district charter or virtual charter)
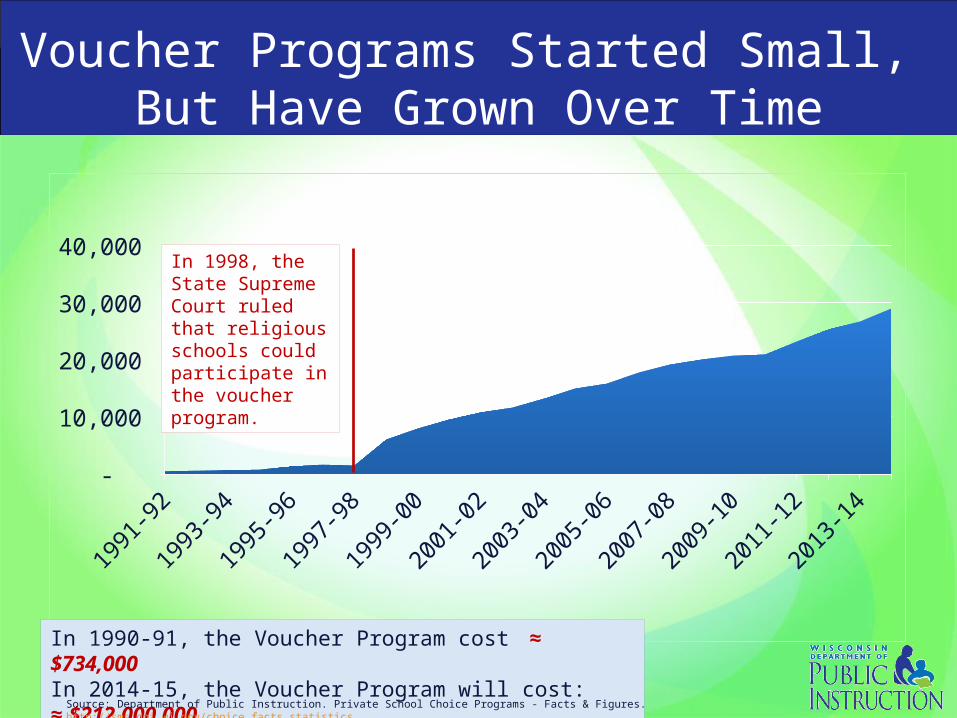
Voucher Programs Started Small, But Have Grown Over Time
1991
-92
1993
-94
1995
-96
1997
-98
1999
-00
2001
-02
2003
-04
2005
-06
2007
-08
2009
-10
2011
-12
2013
-14
- 5,000
10,000 15,000 20,000 25,000 30,000 35,000
341
In 1998, the State Supreme Court ruled that religious schools could participate in the voucher program.
In 1990-91, the Voucher Program cost ≈ $734,000In 2014-15, the Voucher Program will cost: ≈ $212,000,000
Source: Department of Public Instruction. Private School Choice Programs - Facts & Figures. http://sms.dpi.wi.gov/choice_facts_statistics

Most Students in Voucher Schools are Publicly-Funded
Milwaukee PCP average: 79%
Racine PCP average: 44%
Wisconsin PCP average: 4%
All PCP schools average:64%
The % of voucher-funded students in participating schools (particularly K-8 schools) tends to grow over time.
Source: Department of Public Instruction. Private School Choice Programs - Facts & Figures. http://sms.dpi.wi.gov/choice_facts_statistics
1 4 7 10 13 16 19 22 25 28 31 34 37 40 43 46 49 52 55 58 61 64 67 70 73 76 79 82 85 88 91 94 97 100 103 106 109 1120
10
20
30
40
50
60
70
80
90
100
2014-15 % Voucher Enrollment in Choice Schools (September Pupil Count)
Milwaukee PCP average: 80%
Racine PCP average: 49%Wisconsin PCP average: 10%All PCP school average:
63%

A Voucher in Every Backpack?
What would universal vouchers with public school funding parity cost? Let’s do the math…
New Cost for Tuition-Paying StudentsNumber of Private Pay
Students X
Public SchoolRevenue Limit
=Marginal Cost for
Universal Vouchers
93,000 X $10,000 = $930,000,000
Increased Cost for Current Voucher Students (2013-14)
GradePublic School Revenue Limit
Voucher Amount
Difference XVoucher
Enrollment= Marginal Cost
K-8 $10,000 $7,210 $2,790 X 23,616 = $65,888,700 9-12 $10,000 $7,856 $2,144 X 5,184 = $11,114,500
Total 28,800 $77,003,200
Total additional (marginal) cost for universal vouchers:$ 1,007,003,200 ($1 billion)Source: Department of Public Instruction. 2013-15 State Budget Information. http://news.dpi.wi.gov/news_2013-15-state-budget-information
Note: calculations are updated to determine marginal, rather than total program costs.
School Finance Challenges

School Funding – Simplified!
Property Tax Levy
State Equalization
Aid
Revenue Limit
Categorical AidFederal FundsOther Revenue
Outside the Revenue Limit

K-12 School Aids as % of State General Fund Source: Legislative Fiscal Bureau
1995-96
1996-97
1997-98
1998-99
1999-00
2000-01
2001-02
2002-03
2003-04
2004-05
2005-06
2006-07
2007-08
2008-09
2009-10
2010-11
2011-12
2012-13
2013-14
2014-15
33% 38% 38% 39% 37% 40% 39% 40%
43%
40% 40% 39%38% 38% 37% 37%
34% 33% 33% 32%

General Fund Revenue Collections (in billions)Source: Legislative Fiscal Bureau
2003-04
2004-05
2005-06
2006-07
2007-08
2008-09
2009-10
2010-11
2011-12
2012-13
2013-14
$10.74 $11.40 $12.03
$12.62 $13.04 $12.11
$12.13 $12.91 $13.51 $14.09 $13.95

During the Great Recession, Revenue Limits Were Cut …
1993
-94
1994
-95
1995
-96
1996
-97
1997
-98
1998
-99
1999
-00
2000
-01
2001
-02
2002
-03
2003
-04
2004
-05
2005
-06
2006
-07
2007
-08
2008
-09
2009
-10
2010
-11
2011
-12*
2012
-13
2013
-14
2014
-15
$(600)
$(500)
$(400)
$(300)
$(200)
$(100)
$-
$100
$200
$300
$400
Change in Per-Pupil Revenue Over Time
Pep-Pupil Aid Revenue Limit Change
Source: Department of Public Instruction. 2011-13 State Budget. http://pb.dpi.wi.gov/pb_11-13_budget 2013-15 State Budget. http://news.dpi.wi.gov/news_2013-15-state-budget-information
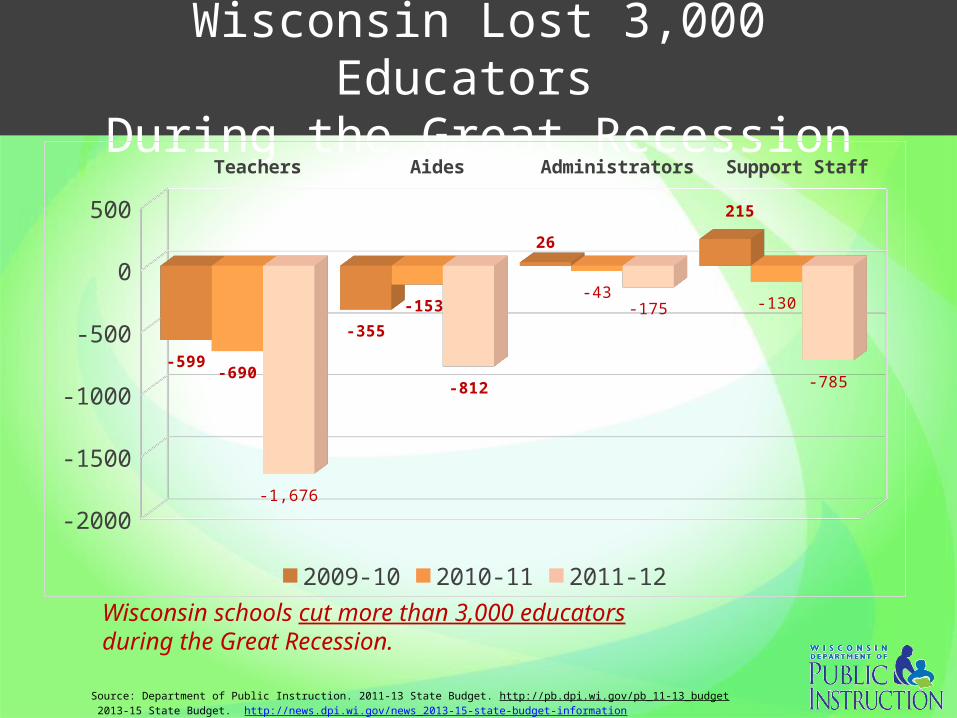
Wisconsin Lost 3,000 Educators During the Great Recession
Teachers Aides Administrators Support Staff
-2000
-1500
-1000
-500
0
500
-599
-355
26
215
-690
-153-43
-130
-1,676
-812
-175
-785
2009-10 2010-11 2011-12Wisconsin schools cut more than 3,000 educators during the Great Recession.
Source: Department of Public Instruction. 2011-13 State Budget. http://pb.dpi.wi.gov/pb_11-13_budget 2013-15 State Budget. http://news.dpi.wi.gov/news_2013-15-state-budget-information

And an Increased Reliance on Referenda
Source: Legislative Fiscal Bureau
Overall
Passed 1,423 52%
Failed 1,328 48%
Total 2,751
Debt
Passed 955 54%
Failed 800 46%
Total 1,755
Non-recurring
Passed 314 56%
Failed 242 44%
Total 556
Recurring
Passed 154 35%
Failed 286 65%
Total 440
There have been almost 2,800 referenda since the 1990s.
80% of referenda are in rural schools.
Over the last few years, the pass rate has increased.
Overall2012-14
Passed 151 64%Failed 85 36%
Total 236

Special Education & Bilingual Reimbursement Rates are Falling
2001
2003
2005
2007
2009
2011
2013
0%
5%
10%
15%
20%
25%
30%
35%
40%36%
34%32%
30%30%29%29%29%29%28%28%
27%26%
18%17%
13%13%11%11%12%11%11%
10%9%8% 8%
SWD BLBC
Special Education & Bilingual/Bicultural (BLBC)
This budget would mean 9 years of flat funding for students with special needs and ELL students
This budget will mean almost a decade of flat funding.
Reimbursement rates dropped 10 percentage points since 2000-01
Special Education (36% to 26%) Bilingual-Bicultural (18% to 8%).
Source: Department of Public Instruction. 2011-13 State Budget. http://pb.dpi.wi.gov/pb_11-13_budget 2013-15 State Budget. http://news.dpi.wi.gov/news_2013-15-state-budget-information

2015-17 Executive Budget Proposal

According to WisTax…
Funding Approaches the 2009 Levels
“With the categorical payment eliminated next year, revenue in the typical district declines 1.5% to $9,815 per student and approaches 2009 levels.”
Source: WisTax. “School revenues under state budget proposal” http://wistax.org/blog/school-revenues-under-state-budget-proposal
School Levy Tax Credit (SLTC)Increases of $105.6 million in FY16 & FY17
• The SLTC reduces property taxes – it is not additional revenue
• The SLTC is distributed based on a municipalities share of the statewide school levy – not equalizing
• SLTC is counted as state aid
Tax Credit Changes

SLTC and First Dollar Credits have grown over time
Figures in millionsSource: Wisconsin Legislative Fiscal Bureau
2005-06
2006-07
2007-08
2008-09
2009-10
2010-11
2011-12
2012-13
2014-15
2015-16*
2016-17*
0
200
400
600
800
1000
1200
First Dollar Credit
School Levy Tax Credit

Increased General School Aid All Goes to Property Tax Relief
2009
-10
2010
-11
2011
-12
2012
-13
2013
-14
2014
-15
2015
-16
2016
-17
$4.00
$4.10
$4.20
$4.30
$4.40
$4.50
$4.60
$4.70
$4.6
5
$4.6
5
$4.2
6
$4.2
9
$4.3
8
$4.4
8
$4.4
8 $
4.5
8
General School Aids (in billions $)
General Equalization Aids*$0/+$108M (all property tax reduction)
School Levy Tax Credit+$105.6M/+$105.6M (all property tax reduction)
*Without an increase in the revenue limit, additional general aid will reduce property taxes, but not enable additional spending.

Proposed 2015-17 Budget
Cuts & Policy Changes Stir ControversyVoucher & Charter Expansion
New funding mechanism from district aid
Statewide charter authorizing board (2R)
New Test; Different Report Cards
Eliminate SBAC in 2015-16
Modifies state report cards
New “alternative” licenses
Major cuts to UW & ECB
$300M to UW; Eliminates shared governance
$5.4M to Education Communication Board (ECB)

A Better Path Forward

Sharing stories of success