wireless sensor system according to the concept of iot...
TRANSCRIPT

International Journal of Advanced Computer Science and Information Technology (IJACSIT) Vol. 3, No. 3, 2014, Page: 327-343, ISSN: 2296-1739 © Helvetic Editions LTD, Switzerland www.elvedit.com
Wireless Sensor System According to the Concept of IoT -Internet of Things-
Authors
Juan Felipe Corso Arias Mechatronics/Engineering, Military Nueva Granada University
[email protected] Bogotá, Colombia
Yeison Julian Camargo Barajas Telecommunications/Engineering, Military Nueva Granada University
[email protected] Bogotá, Colombia
Juan Leonardo Ramirez Lopez Telecommunications/Engineering, Military Nueva Granada University
[email protected] Bogotá, Colombia
Abstract This article presents the design of a wireless communication system, responding to the sensor concept applied to a scaled industrial process where temperature variables were used. The sensors are connected to the internet (IoT) to be monitored remotely from anywhere in the world. The sensor data is downloaded from the cloud using a graphical programming platform to control and communicate the system with a programmable logic controller (PLC), which performs the actions according to the temperature value (set point) of the sensors. The monitoring process was performed with a SCADA system and the modeling of the communication system was performed using the formalism of Petri nets, as a system that responds in terms of discrete events. Key Words
IoT, Petri, PLC, SWI.

International Journal of Advanced Computer Science and Information Technology Volume 3, Issue 3, 2014, ISSN: 2296-1739
Copyright © 2014 Helvetic Editions LTD - All Rights Reserved
www.elvedit.com 328
I. INTRODUCTION The trend of the market is the information to be available independently of the place or the
geographic location. For this reason, currently, the internet is used to bring a real time interaction among devices that will not be possible with other mediums [1]. Simply, all the information gathered from the sensors must be available in the cloud to be managed and controlled. Thus, a central point of management exists where the information from the sensors remotely distributed is stored. Furthermore, the industrial processes make necessary to implement wireless communication systems (due to the hostile environment and the difficult access to the places) to transmit the signals generated by the sensors making up the control loop [2]–[8]. Hence, the modeling, design and implementation of a remote wireless system applied to an industrial process is done. Then, the reliability of the system can be analyzed. A SCADA system supervises the process and a PLC [9] executes the event generated in the control. The modeling of the communication was performed using Petri nets [10]–[14]. It allowed analyzing the viability and reliability of the system. The rest of the paper is organized as follows: Section II presents a description of the implemented system according to the IoT, the mathematical modeling using Petri nets, the simulation of the proposed Petri net, a networking analysis and a description of the developed control system. Section III shows the analysis of the results obtained. Finally, Section IV shows the conclusions.
II. DEVELOPMENT In this section we will describe the implemented sensor’s system [15]. The system uses three
type of sensors (Thermocouple, thermistor and Integrated Circuit LM35) for temperature sensing. The sensors send the information to the Internet, more exactly to the Xively’s servers (a platform designed for the IoT). Thus, the information gathered can be monitored from anywhere in the world. Once the data is stored in the internet a computer is used to download it and process it to be used in a temperature control system. The project goal is to develop a redundant system of temperature measurement. Hence, if a failure exists in one of the sensors the system is able to continue online with the rest of the sensors (using the average of the temperature gathered). The average of the temperature captured from the sensors is used as a threshold value or set point that enables the system to take a control decision. Then, the processed information is sent to the PLC to perform an action. The implemented action in the system is to open or close a cylinder according to the temperature value. Furthermore, the system implements a SCADA system that allows plotting and visualizing the information available from the internet corresponding to the temperature values gathered by the sensors. It also allows controlling the system manually, then the administrator is able to change the action whenever he wants. Figure I shows a flow chart and the topology of the implemented systems.

Wireless Sensor System According to the Concept of Internet of Things Juan Felipe Corso, Yeison Julian Camargo and Leonardo Ramirez Lopez
Copyright © 2014 Helvetic Editions LTD - All Rights Reserved www.elvedit.com 329
a) System’s Flow Chart b) Real Topology
FIGURE I: IMPLEMENTED SYSTEM.
A. System Modeling Using Petri Nets of Type (P/T) SWI (Sensors Wireless Industry). A petry net (푃/푇), is a tuple 푁 =< 푃,푇,푃푟푒,푃표푠푡 > where:
푃 is a set of finite sites. 푇 is a set of finite transactions disjoined of 푃 such that 푃 ∩ 푇 =
푃푟푒,푃표푠푡 ∈ 푁| |∗| | are incidence matrixes of 푁. 퐶 = 푃표푠푡 − 푃푟푒, where 퐶is defined as the incident matrix of 푁. There exists an arc with weight 푛 > 0 from a place 푝 ∈ 푃, to a transition 푡 ∊ 푇 if and only if 푃푟푒[푝, 푡] = 푛푤푖푡ℎ푛 > 0, and there exists an arc with weight 푛 > 0 from a transition 푡 ∊ 푇 to a place 푝 ∈ 푃 if and only if 푃표푠푡[푝, 푡] =
푛푤푖푡ℎ푛 > 0. Thus, the set of arcs of 푁is defined as in equation 1. 퐹 ∶= {(푝, 푡) ∈ 푃.푇 ∕ 푃푟푒[푝, 푡]} > 0} ∪ {(푡,푝) ∈ 푇.푃/푃표푠푡[푝, 푡] > 0} (1)
Control Supervisor
Access Point
PLC
Xively (Internet)
Router Router
Capture System and
Data
Wireless Communication
Shield
Sensor 2
Sensor 3
Sensor 1
Instrumentation Variables
(Temperature)
Temperature 1 (Thermocouple) Temperature 2 (Thermistor) Temperature 3 (LM35)
SCADA System
Wi-Fi (802.11g)
LAN NETWORK
WAN NETWORK
Control and Supervision
PLC
Data Capture with Wireless Shield
Router

International Journal of Advanced Computer Science and Information Technology Volume 3, Issue 3, 2014, ISSN: 2296-1739
Copyright © 2014 Helvetic Editions LTD - All Rights Reserved
www.elvedit.com 330
This allows an alternative definition of 푁 that fits better for the graphical representation of the Petri Net. The modeling of the communication system was done using the WoPeD software [16]. It is a free software under LGPL license. It is aimed to provide a tool for the modeling and analysis of the control flow of processes and the description of the resources by using control flow networks (an extension of the Petri nets). The Table I shows the nomenclature used to make the equations clear.
TABLE I: NOMENCLATURE
Name Acronym Place p Transition t1,2,3,4
Subprocesses(Wi-Fi,Ethernet) sub1,2 Source p1 Thermocouple p2 Thermistor p3 LM35 p4 Data Capture with wireless shield p5 Router p6 Xively p7 PC with Labview p8 PLC Siemens p9
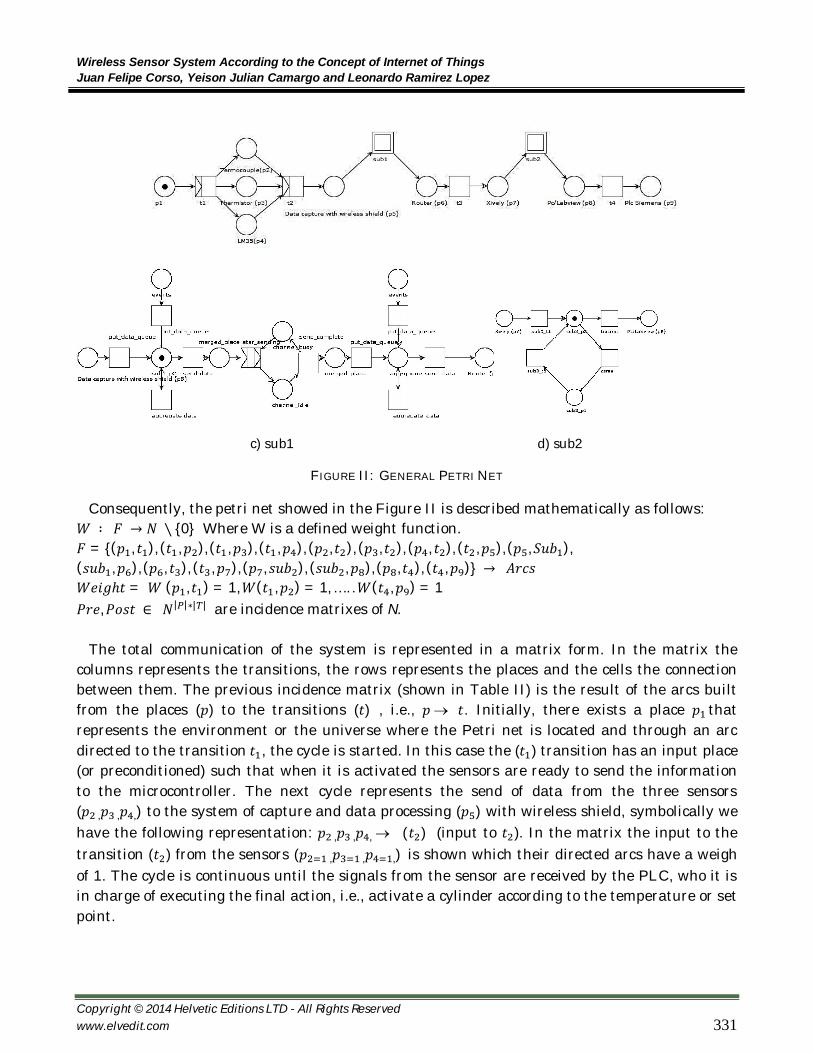
The model is graphically depicted in Figure II; the (푝 ) token represents the initial marking of
the system. The transitions (푡 , , , ) represent the events of changing from one place to another with a default weight in the arcs not labeled defined by푤(푝 , 푡 ) = 1. The subset (푠푢푏1) represents the wireless communication between the system for data capture with a wireless shield and the layer 3 device or router. The communication used the standard IEEE 802.11g. The subset (푠푢푏2) represents the medium access protocol in the Ethernet architecture (CSMA/CD) for the LAN network where the control process is performed. In this case it is necessary a LAN network due to the PLC does not work with a wireless module. Based on a Petri net with a type (푃/푇), the model shown in the Figure II is developed for the System of Wireless Industrial sensors (SWI) [17]. The places and the transitions are defined according to the equation 2 and equation 3.
푝 = {푠푒푛푠표푟푠(푡ℎ푒푟푚표푐표푢푝푙푒, 푡ℎ푒푟푚푖푠푡표푟, 퐿푀35);퐷푎푡푎푐푎푝푡푢푟푒푤푖푡ℎ푤푖푟푒푙푒푠푠푠ℎ푖푒푙푑;푅표푢푡푒푟;푋푖푣푒푙푦;
푃퐶푤푖푡ℎ퐿푎푏푣푖푒푤;푃퐿퐶푆푖푒푚푒푛푠} (2)
푡 = {푡 ,푡 ,푆푢푏 ,푡 ,푆푢푏 ,푡 } (3)
Wireless Sensor System According to the Concept of Internet of Things Juan Felipe Corso, Yeison Julian Camargo and Leonardo Ramirez Lopez
Copyright © 2014 Helvetic Editions LTD - All Rights Reserved www.elvedit.com 331
c) sub1 d) sub2
FIGURE II: GENERAL PETRI NET
Consequently, the petri net showed in the Figure II is described mathematically as follows: 푊 ∶ 퐹 → 푁 ∖ {0} Where W is a defined weight function. 퐹 = {(푝 , 푡 ), (푡 ,푝 ), (푡 ,푝 ), (푡 ,푝 ), (푝 , 푡 ), (푝 , 푡 ), (푝 , 푡 ), (푡 ,푝 ), (푝 , 푆푢푏 ), (푠푢푏 ,푝 ), (푝 , 푡 ), (푡 ,푝 ), (푝 , 푠푢푏 ), (푠푢푏 ,푝 ), (푝 , 푡 ), (푡 ,푝 )} → 퐴푟푐푠 푊푒푖푔ℎ푡 = 푊(푝 , 푡 ) = 1,푊(푡 ,푝 ) = 1, … . .푊(푡 ,푝 ) = 1 푃푟푒,푃표푠푡 ∈ 푁| |∗| | are incidence matrixes of N.
The total communication of the system is represented in a matrix form. In the matrix the columns represents the transitions, the rows represents the places and the cells the connection between them. The previous incidence matrix (shown in Table II) is the result of the arcs built from the places (푝) to the transitions (푡) , i.e., 푝푡. Initially, there exists a place 푝 that represents the environment or the universe where the Petri net is located and through an arc directed to the transition푡 , the cycle is started. In this case the (푡 ) transition has an input place (or preconditioned) such that when it is activated the sensors are ready to send the information to the microcontroller. The next cycle represents the send of data from the three sensors (푝 ,푝 ,푝 ,) to the system of capture and data processing (푝 ) with wireless shield, symbolically we have the following representation: 푝 ,푝 ,푝 ,(푡 ) (input to 푡 ). In the matrix the input to the transition (푡 ) from the sensors (푝 ,푝 ,푝 ,)is shown which their directed arcs have a weigh of 1. The cycle is continuous until the signals from the sensor are received by the PLC, who it is in charge of executing the final action, i.e., activate a cylinder according to the temperature or set point.

International Journal of Advanced Computer Science and Information Technology Volume 3, Issue 3, 2014, ISSN: 2296-1739
Copyright © 2014 Helvetic Editions LTD - All Rights Reserved
www.elvedit.com 332
TABLE II: PREVIOUS INCIDENCE MATRIX
Pre t1 t2 sub1 t3 sub2 t4 p1 1 0 0 0 0 0 p2 0 1 0 0 0 0 p3 0 1 0 0 0 0 p4 0 1 0 0 0 0 p5 0 0 1 0 0 0 p6 0 0 0 1 0 0 p7 0 0 0 0 1 0 p8 0 0 0 0 0 1 p9 0 0 0 0 0 0
Table III shows the posterior incidence matrix columns. In this matrix the columns represents
the transitions, the rows represent the places and the cells represents the connection between them. The “posterior incidence matrix” is built from the arcs formed from the (t) transitions to the places (푝), such that 푡푝. Initially, there exists a transition 푡 that represtns the event of changing from the starting place 푝 to the places 푝 ,푝 ,푝 (푡ℎ푒푟푚표푐표푢푝푙푒, 푡ℎ푒푟푚푖푠푡표푟, 퐿푀35). In this case, the transition (푡 ) has three output arcs (or post conditionals) such that when it is activated the sensors are ready to send the information to the microcontroller 푡 푝 ,푝 ,푝 . The next cycle represents the send of data from the three sensors (푝 ,푝 ,푝 ,) to the capture and data processing (푝 ) with wireless shield; symbolically we have: 푡 푝 (output from 푡 ). In the matrix, the output from the (푡 ) transition to the sensors (푝 ,푝 ,푝 ,)is shown such that their arcs have a weight of 1. The cycle is continuous until the entire process of the system is ended. This is the control part that depends on the signals from the sensors.
TABLE III: POSTERIOR INCIDENCE MATRIX
Post t1 t2 sub1 t3 sub2 t4 p1 0 0 0 0 0 0 p2 1 0 0 0 0 0 p3 1 0 0 0 0 0 p4 1 0 0 0 0 0 p5 0 1 0 0 0 0 p6 0 0 1 0 0 0 p7 0 0 0 1 0 0 p8 0 0 0 0 1 0 p9 0 0 0 0 0 1

Wireless Sensor System According to the Concept of Internet of Things Juan Felipe Corso, Yeison Julian Camargo and Leonardo Ramirez Lopez
Copyright © 2014 Helvetic Editions LTD - All Rights Reserved www.elvedit.com 333
The incidence matrix is formed by the subtraction of the post – pre matrixes. Consequently, the
pair of the matrix 푝표푠푡(푝1, 푡1 = 0) is subtracted from the pair of the matrix 푝푟푒(푝1, 푡1 = 1); ⟹0 − 1 = −1 and the same procedure is executed until completing the incidence matrix as shown in Table IV. The incidence matrix shows the entire network to be unidirectional, then, 푝1 has a direction towards푡1, but not on the opposite direction (-1).
TABLE IV: INCIDENCE MATRIX C: = POST - PRE
C t1 t2 sub1 t3 sub2 t4 p1 -1 0 0 0 0 0 p2 1 -1 0 0 0 0 p3 1 -1 0 0 0 0 p4 1 -1 0 0 0 0 p5 0 1 -1 0 0 0 p6 0 0 1 -1 0 0 p7 0 0 0 1 -1 0 p8 0 0 0 0 1 -1 p9 0 0 0 0 0 1
Furthermore, the incidence matrix allow the places and transition to know which are the arcs
that they are connected to and to obtain information from them to determine which are the places for input and output in a transition. Finally, it is convenient to define the tokens as vectors which inputs are integer numbers, assuming that the places form a totally ordered set. In this way, the initial token in (푃/T) IWN for the vector 푀 is defined by (1,0,0,0,0,0,0,0,0) and the cycle continues until completing the occurrences sequence shown in Table V. In other words, when an enabled transition is triggered, it will change the distribution of the signals (tokens). In this way, a trigger’s sequence will produce a marking sequence and consequently the Table V is formed:
TABLE V: SEQUENCE OF OCURRENCES (MO)
1
t1 ->
0
t2 ->
0
s1 ->
0
t3 ->
0
s2 ->
0
t4 ->
0 0 1 0 0 0 0 0 0 1 0 0 0 0 0 0 1 0 0 0 0 0 0 0 1 0 0 0 0 0 0 0 1 0 0 0 0 0 0 0 1 0 0 0 0 0 0 0 1 0 0 0 0 0 0 0 1
Conventionally, the techniques for the analysis of Petri models are classified in: I) numeration;
II) transformation; III) structural analysis and IV) simulation. For the Petri net (P/T) IWN, the

International Journal of Advanced Computer Science and Information Technology Volume 3, Issue 3, 2014, ISSN: 2296-1739
Copyright © 2014 Helvetic Editions LTD - All Rights Reserved
www.elvedit.com 334
enumeration method was used. It is based on a graph called “coverability graph”. It represents each marking vector in the network and the transitions among them as shown in the Figure III. One method to verify that the petri net has the desirable properties is to build a coverability graph. The graph consists of nodes made of binary sequences (0s and 1s) connected by the transitions defined in the network. The series start from the node, which elements are zeros and they represent all the possible states that can be obtained when the network is working under all the desirable conditions. The sequence of occurrences shown in Table V is one the possible combinations in the coverability graph.
FIGURE III: COVERABILITY GRAPH
B. Processing and Data Capture System with Wi-Fi
The capture and data processing system was developed with the C++ programming language, including the libraries for the communication protocols, such as: DHCP and HTTP that belong to the application layer in the OSI model. TCP was used in the transport layer. The wireless communication between the sensors and the router is established using the Wi-Fi libraries (slightly modified) of the capture and data processing system to identify the SSID and the password for the WPA or WEP security protocol that is being connected to the Wi-Fi shield. Finally, the programming necessary to send all the parameters to the cloud was done. The process of sending the data to the Internet has different phases. Initially the temperature is captured by the thermocouple and passed to the (Integrated Circuit) IC MAX 6675 which performs the cold junction compensation (it compensates the dependence with the environmental temperature inherent to the measure), amplifies and converts to digital the temperature obtained from the thermocouple. The MAX IC passes the data to the microcontroller ATMEGA 328P through the following serial port: SPI of 12 bits and 0.25 centigrade grades of resolution. Lastly, the microcontroller passes the data to the Wi-Fi wireless shield that sends the information to a wireless router.

Wireless Sensor System According to the Concept of Internet of Things Juan Felipe Corso, Yeison Julian Camargo and Leonardo Ramirez Lopez
Copyright © 2014 Helvetic Editions LTD - All Rights Reserved www.elvedit.com 335
C. Analysis of Dataflow
Pathchar [18] is a Linux utility similar to traceroute but focused in the network performance measurements. The output of the Pathchar software is shown in Table VI. This output shows the measurements of the possible paths that the data can take when traveling from a sensor to the cloud servers. The information is analyzed with all the metrics among the hops involved from the source of the packets (sensor) to the destination of the packets (IoT web portal - Xively). The tool sends 45 different packets sizes in the range from 64 to 1500 bytes (1500 is the MTU in the local host). The software uses 32 different sets of this packets per hop. Thus, 11.520 packets are sent and the same number of answered are shown by the software.
TABLE VI. TRAFFIC MEASUREMENTS Link Host IP BW Latency Drodped Queuing
0 System of processing and capture of Data
Wi-Fi
192.168.0.3 39 Mb/s 124 µs
1 Modem Wi-Fi 192.168.0.1 722 Kb/s 14.8 ms 11 % 2 10.32.0.26 3 *201.244.1.150 *10.5.4.70 *201.244.1.5 490µs
4 sta.etb.net.co 10.5.4.74 27ms 5 Edge3.Miami1 4.59.82.113 *4.69.138.77 73 µs 42%
6 Edge2.Miami2 4.69.138.109 571Mb/s 345 µs 1.23 ms 7 globalcrossing 4.68.111.122 178 Mb/s 156 µs 8 ae9.scr4.gblx.net 67.16.147.129 30.1 ms 9 po2.gblx.net 67.17.95.214 161 ms 10 INTERNAP 64.215.30.78 *216.52.255.46 49 Mb/s 4 µs 1.55ms
11 pnap.net 216.52.255.110 135 ms 12 Logmein.net (xively) 63.251.195.114 * 210.52.233.121
In this part of the paper we present an analysis carried out to find the performance of the
system. A software was used to find the RTT (Round Trip Time) and the lost packet rate in the communication from the sensors to the Internet, specifically the Xively’s servers. The Smokeping [19] program was used to perform the measure of RTT in the traffic from the sensors (source) to the Xively’s servers (destination) during 30 hours. Figure IV depicts the output of the Smokeping program and the Petri nets simulator explained in section III. It indicates the average percentage of lost packets to be 0.6% which is very low. The average RRT was 177.7 ms with a standard deviation of 6.1ms. These values are relative low taking in to account the possible distances from the sensor to the central management point. The Table VII shows the values above explained. The RRT is the time that a sent packet expends in going from its source to return after going to

International Journal of Advanced Computer Science and Information Technology Volume 3, Issue 3, 2014, ISSN: 2296-1739
Copyright © 2014 Helvetic Editions LTD - All Rights Reserved
www.elvedit.com 336
its destination [20]. This value is a key aspect in the HTTP protocol that is used to send the data from the sensors to the internet. According to [21] the RTT time is calculated as in Equation 3
푅푅푇 = 퐿푎푡푒푛푐푦 + ( ) + 퐿푎푡푒푛푐푦 (3)
Figure IV: XIVELY’S RTT OVER HTTP (DAY 1)
TABLE VII. COMMUNICATION MEASUREMENTS
Lost Packet Rate RTT (ms) Standart Deviation (ms)
0.60 % 177.7 6.1 The average RTT (177.7ms) is shown in Figure IV, i.e., the average RTT from the sensor to the
Xively sever in the Internet. The figure shows a stable communication with some peaks. The HTTP protocol was used to transfer the information. The HTTP (Hypertext transfer protocol) protocol is also the base for the communication in the World Wide Web. In order to measure the

Wireless Sensor System According to the Concept of Internet of Things Juan Felipe Corso, Yeison Julian Camargo and Leonardo Ramirez Lopez
Copyright © 2014 Helvetic Editions LTD - All Rights Reserved www.elvedit.com 337
end to end delay the Smokeping software was used. The Figure V shows a capture of the HTTP protocol in the application layer towards the Xively servers (api.xively.com) with the Wireshark software. The PUT method (in the HTTP protocol) was used to send (or upload) the temperature data gathered by the sensors (220 bytes) to the servers located in the cloud. The figure shows how the data is send within the http protocol, in this case the data is pointed out by the red circles in the image. The PUT method allows writing a file with an established connection to the server.
FIGURE V: HTTP PROTOCOL.
Figure VI, shows the sequence of the TCP protocol in the transport layer. The black line represents the source port and the red point represents the destination port in the communication, in this case the destination port in the Xively portal. The green lines represent the acknowledgement in the TCP process.
FIGURE VI: TCP SEQUENCE PROTOCOL

International Journal of Advanced Computer Science and Information Technology Volume 3, Issue 3, 2014, ISSN: 2296-1739
Copyright © 2014 Helvetic Editions LTD - All Rights Reserved
www.elvedit.com 338
D. The IoT
The main idea of the IoT is to integrate objects in a communication network [22]–[26]. In other words, it represents a new approach where all the things make part of the internet, working among them in real time. Technically, it is based on the integration of sensors, devices and household things that get connected to the internet through wired or wireless networks. Because of the world wide deployment of the internet the adoption of this technology is feasible and the cost of the implementation will be inexpensive. It will allow the sensors to be integrated in homes, workplaces, automation processes and so on. In this way, every object is able to be connected to a web environment (in this work the Xively’s webpage) to store all its information and show it in real time (if desirable). Figure VII shows the gathered data from the sensors directly to the internet. It allows filtering and plotting the data to find possible trends or critical situations. The data can be checked everywhere in the world independently the location of the sensors.
FIGURE VII: XIVELY´S WEB PAGE.
E. OPC and Real Time System in LabView
In this part of the work we aim to describe the system developed that connects the Internet data to the PLC through LabView (Figure VIIIa). The data from the cloud are downloaded with a PC with LabView to be processed and afterwards be sent to the PLC. The PLC is in charge of executing the temperature control programed with the LabView software through the OPC communication standard (communication between the PLC and LabView) [27]. The SCADA system is the GUI (Graphical User Interface) that allows the interaction with the sensors system and displays the gathered data. Hence, it controls and supervises the process. When the temperature value is above the threshold, the PLC performs the opening action of the system. Additionally, there exists new alternatives for SCADA systems that can be monitored from the cloud; one example is the webpage 3pdashboard. In this website it is possible to design the control system and plot the data gathered from the sensor that is stored in the Xively´s servers. The management and analysis of the data is executed in real time and within a webpage without the need of installing any software in a PC. The website has a graphical environment where it is

Wireless Sensor System According to the Concept of Internet of Things Juan Felipe Corso, Yeison Julian Camargo and Leonardo Ramirez Lopez
Copyright © 2014 Helvetic Editions LTD - All Rights Reserved www.elvedit.com 339
possible to create a control system for the sensor network. We also developed an application (in the 3pdashboard website) that plots the data gathered by our sensors. The application developed is shown in the Figure 8b.
a)
b)
FIGURE VIII: CONTROL OF THE SYSTEM.
III. RESULTS In this section we aim to describe the results obtained from the simulation of the Petri net. The
Workflow Petri Net Designer (WoPeD) software was used to simulate the proposed mathematical modeling of the Petri net corresponding to the implemented sensor’s system. The results of the simulation will allow to determine the robustness of the system. Based on the mathematical modeling of the Petri net (P/T) of type (P/T) SWI that corresponds to a workflow system, it was possible to carry out a dynamic analysis through the SWI simulation. In the simulation the RTT was used as continuous random variable. It showed the dynamic behavior of the petri net to follow a statistical pattern varying from a chaotic state in the first day (refer to Figure IX) to a stable state when augmenting the sampling periods (due to the higher number of events) and finally a Gaussian pattern in the 10TH day which keeps the same this point forward. It allows concluding that the data flow based on the RTT follows a robust behavior around the experimental median (λ) introduced in the simulation. The time between a pair of consecutives events has an exponential distribution with a (λ) parameter (in this case RRT) and independent

International Journal of Advanced Computer Science and Information Technology Volume 3, Issue 3, 2014, ISSN: 2296-1739
Copyright © 2014 Helvetic Editions LTD - All Rights Reserved
www.elvedit.com 340
in statistics terms. Figure VI shows the Gaussian pattern that indicates the stabilization of the communication system between the wireless sensors and the PLC.
a) Day 1 b) Day 5 c) Day 30
FIGURE IX: GAUSSIAN PATTERN.
IV. CONCLUSIONS In this work we presented a Wireless Sensor System that is able to be monitored all over the
world using the Internet. The system was also simulated with Petri nets. The results of the simulation described a pattern that goes from a chaotic state in the first day to a Gaussian state day after day (refer to Figure IX). The pattern denotes the stability and reliability of the industrial communication in environments using data networks. The results showed the system not to be suitable for industrial processes that require immediate responses times due to the delay found in the network based on the simulations performed (refer to Figure IV). But, according to the decrement of the delay the implementation of the system will allow using data networks in industrial processes with real time responses. The model could be implemented in conditions where the change in the measure (temperature, level, grades) respect to the time is not critical. Finally, the implemented system demonstrated that it was possible to build a control system (PLC) that centralizes the data gathered from sensors distributed around the world. Hence, the sensors can be monitored and controlled from anywhere in the world according to the concept of IoT.
V. ACKNOWLEDGMENT
This research was supported by Military Nueva Granada University. Specially by the Master Degree program from the Mechatronics Department
REFERENCES
[1] S. Cesar San Martin, F. Torres, R. Barrientos, and M. Sandoval, “Monitoreo y control de temperatura de un estanque de agua entre chile y España usando redes de alta velocidad,” REVISTA FACULTAD DE INGENIERÍA, UTA (CHILE), vol. 11, no. 1, pp. 41–46, 2003.

Wireless Sensor System According to the Concept of Internet of Things Juan Felipe Corso, Yeison Julian Camargo and Leonardo Ramirez Lopez
Copyright © 2014 Helvetic Editions LTD - All Rights Reserved www.elvedit.com 341
[2] L. Hou and N. Bergmann, “Novel industrial wireless sensor networks for machine condition monitoring and fault diagnosis,” Instrumentation and Measurement, IEEE Transactions on, vol. 61, no. 10, pp. 2787–2798, 2012.
[3] Z. Ke, L. Yang, X. Wang-hui, and S. Heejong, “The application of a wireless sensor network design based on zigbee in petrochemical industry field,” in Intelligent Networks and Intelligent Systems, 2008. ICINIS ’08. First International Conference on, 2008, pp. 284–287.
[4] G. Cena, A. Valenzano, and S. Vitturi, “Wireless extensions of wired industrial communications networks,” in Industrial Informatics, 2007 5th IEEE International Conference on, vol. 1, 2007, pp. 273–278.
[5] K. Koumpis, L. Hanna, M. Andersson, and M. Johansson, “Wireless industrial control and monitoring beyond cable replacement,” in Proc.2nd PROFIBUS Int. Conf., Coombe Abbey, Warwickshire, UK, 2005.
[6] S. Trikaliotis and A. Gnad, “Mapping wirelesshart into profinet and profibus fieldbusses,” in Emerging Technologies Factory Automation, 2009. ETFA 2009. IEEE Conference on, 2009, pp. 1–4.
[7] Siemens, “Profinet the industrial Ethernet standard for automation,” 8th IEEE International Workshop on Factory Communication Systems COMMUNICATION in AUTOMATION, 2007. [Online]. Available: http://wfcs2010.loria.fr/files/Siemens.pdf
[8] D. Miorandi, E. Uhlemann, S. Vitturi, and A. Willig, “Guest editorial: Special section on wireless technologies in factory and industrial automation, part i,” Industrial Informatics, IEEE Transactions on, vol. 3, no. 2, pp. 95–98, 2007.
[9] J. Antony, B. Mahato, S. Sharma, and G. Chitranshi, “A web plc using distributed web servers for data acquisition and control: Wed based plc,” in Information Science and Applications (ICISA), 2011 International Conference on, 2011, pp. 1–4.
[10] J.-S. Lee and P.-L. Hsu, “An improved evaluation of ladder logic diagrams and petri nets for the sequence controller design in manufacturing systems,” The International Journal of Advanced Manufacturing Technology, vol. 24, no. 3-4, pp. 279–287, 2004. [Online]. Available: http://dx.doi.org/10.1007/
[11] R. Zurawski and M. Zhou, “Petri nets and industrial applications: A tutorial,” Industrial Electronics, IEEE Transactions on, vol. 41, no. 6, pp.567–583, 1994.
[12] L. Gomes, A. Costa, J. Barros, R. Pais, T. Rodrigues, and R. Ferreira, “Petri net based building automation and monitoring system,” in Industrial Informatics, 2007 5th IEEE International Conference on, vol. 1, 2007, pp. 57–62.
[13] X. Fu, Z. Ma, Z. Yu, and G. Fu, “On Wireless sensor networks formal modeling based on Petri nets,” in Wireless Communications, Networking and Mobile Computing (WiCOM), 2011 7th International Conf.
[14] J. CERVANTES, “Representacion y aprendizaje de conocimiento con redes de petri difusas,” 2005.
[15] Corso, F.; Camargo, Y.; Ramirez, L., "Wireless Sensor System According to the Concept of IoT -Internet of Things-," Computational Science and Computational Intelligence (CSCI), 2014 International Conference on , vol.1, no., pp.52,58, 10-13 March 2014

International Journal of Advanced Computer Science and Information Technology Volume 3, Issue 3, 2014, ISSN: 2296-1739
Copyright © 2014 Helvetic Editions LTD - All Rights Reserved
www.elvedit.com 342
[16] Woped at http://www.woped.org/
[17] L. Palopoli, R. Passerone, and T. Rizano, “Scalable offline optimization of industrial Wireless sensor networks,” Industrial Informatics, IEEE Transactions on, vol. 7, no. 2, pp. 328–339, 2011.
[18] V. Jacobson, “Pathchar: A Tool to Infer Characteristics of Internet Paths,” ftp://ftp.ee.lbl.gov/pathchar/,
[19] Smokeping at http://oss.oetiker.ch/smokeping/
[20] N. V. Mnisi, O. Oyedapo, and A. Kurien, “Active throughput estimation using rtt of differing icmp packet sizes,” in Broadband Communications, Information Technology Biomedical Applications, 2008 Third International Conference on, 2008, pp. 480–485.
[21] Mnisi, N. V.; Oyedapo, O.J.; Kurien, A, "Active Throughput Estimation Using RTT of Differing ICMP Packet Sizes," Broadband Communications, Information Technology & Biomedical Applications, 2008 Third International Conference on , vol., no., pp.480,485, 23-26 Nov. 2008
[22] Y. Huang and G. Li, “Descriptive models for internet of things,” in Intelligent Control and Information Processing (ICICIP), 2010 International Conference on, 2010, pp. 483–486.
[23] Q. Zhu, R. Wang, Q. Chen, Y. Liu, and W. Qin, “Iot gateway: Bridgingwireless sensor networks into internet of things,” in Embedded and Ubiquitous Computing (EUC), 2010 IEEE/IFIP 8th International Conf.
[24] A. Williams. (2011, April) How the internet of things helps us understand radiation levels. [Online]. Available: http://readwrite.com/2011/04/01/ow-theinternet- of-things-help
[25] F. de la innovacion Bankinter, “El internet de las cosas.”
[26] C. Alcaraz, P. Najera, J. Lopez, and R. Roman, “Wireless sensor networks and the internet of things: Do we need a complete integration?” in 1st International workshop on the security of The internet of Things (SecIoT), 2010.
[27] A. Lakshmi, B. Sangeetha, A. Naveenkumar, B. Ganesh, and N. Bharathi, “Experimental validation of pid based cascade control system through scada-plc-opc interface,” in Computer Communication and Informatics (ICCCI), 2012 International Conference on, 2012, pp. 1–4.
AUTHORS’ BIOGRAPHY
Juan Felipe Corso Arias is M.Sc in Mechatronics from the Military Nueva Granada University and Electronic Engineer from the El Bosque University. He has been professor in the Networking field for the Military Nueva Granada University and in the Electronic field for the Catholic University of Colombia. Currently, he works as a SysAdmin for the Military Nueva Granada University. His research fields are related to networking, domotic and automation.

Wireless Sensor System According to the Concept of Internet of Things Juan Felipe Corso, Yeison Julian Camargo and Leonardo Ramirez Lopez
Copyright © 2014 Helvetic Editions LTD - All Rights Reserved www.elvedit.com 343
Yeison Julian Camargo Barajas is an Engineer in Telecommunications from the Military Nueva Granada University. He obtained his bachelor degree with a research work related to QoS multicast routing using artificial intelligence and a meritorious distinction for his research quality. He was granted with a scholarship by the National Department of science and technology to continue his research in the same university. He has worked for the industry in the networking and VoIP fields. His research fields are related to
Networking, Artificial Intelligence and Security.
Leonardo Juan Ramírez López is Chief of Division Technology Development and Innovation at the Nueva Granada Military University, Bogota - Colombia. Ph.D. Biomedical Engineering, University of Mogi das Cruzes, Sao Paulo, Brazil. Magister of Systems Engineering, National University of Colombia (2006). University Degree in Electronic Engineering (1997). Membership of International Society for Telemedicine and eHealth (ISfTeH) since 2010. IEEE member of EMBS Society since 2000. Associate Professor and leader of Telemedicine Group TIGUM-UMNG.