wipro business travel study -...
TRANSCRIPT

Wipro: Business Travel Carbon Footprint StudyAir Travel, FY 14-15 and FY 15-16

Project Methodology
1. Business Goal Definition*
2. Organizational Boundary Setting*
3. Operational Boundary Setting*
4. Data Collection
5. Data Analysis6. Emission Factor
Selection/ Development
7. GHG Inventorying
(Baseline)8. Interpretation
9. Mitigation Scenario
Modelling
10. Estimating GHG Mitigation
Potential
11. GHG Mitigation
Recommendations
12. Reporting
* defined by ‘The Greenhouse Gas Protocol’: Corporate Accounting and Reporting Standard, World Resources Institute (WRI) World Business Council for Sustainable Development (WBCSD)
1. Business Goal Definition
Estimate GHG emissions from Wipro’s Air Travel activities and
evaluate mitigation alternatives as decision support for development of its Corporate GHG Mitigation
Roadmap

2. Organizational Boundary Definition
Wipro Technologies
(within boundary)
Wipro Infotech (outside
boundary)
Wipro Business Process Services
(outside boundary)
Wipro Eco Energy Services
(outside boundary)
Wipro Ltd.
* based on 2006 IPCC Guidelines for National Greenhouse Gas Inventories, Vol. 2 - Energy, Chapter 3: Mobile Combustion

3. Operational Boundary Definition
Corporate Business Air
Travel Emissions
Scope 3 Emissions
•Electricity AT&C Emissions
•Aircraft Fuel Combustion Emissions
•Capital Goods Manufacturing Emissions
•Fuel Production (Supply-Chain) Emissions
Scope 2 Emissions
• Electricity Generation (Office Electricity) Emissions
Scope 1 Emissions
• Owned Vehicle Emissions
* based on 2006 IPCC Guidelines for National Greenhouse Gas Inventories, Vol. 2 - Energy, Chapter 3: Mobile Combustion

4. Data Collection & 5. Data Analysis
Activity Data Questionnaire Design and Collection
Activity Data Quality Assessment and Verification
Flight Distance Calculation (~ 11,000 pairs, ~ 4,000 newly
researched)
Flight Distance Categorization: Short-Long Haul for Domestic, Short-
Medium-Long for International
Determining list of Airlines
Passenger-km totalization by Sectors (International,
Domestic-India, Domestic-USA, Others)
Passenger-km totalization by Flight Distance Category
within Sectors (International – Short, Medium, Long, Domestic - Short, Long)
Passenger-km totalization by Airline

6. Emission Factor Development
* based on 2006 IPCC Guidelines for National Greenhouse Gas Inventories, Vol. 2 - Energy, Chapter 3: Mobile Combustion
LTO and Cruise Mode Emissions (Total) for all aircraft models
Convert to best-case per-passenger emission factors for finite distances for
every aircraft model
(using max PAX Capacity and Load-Factor of 1)
Repeat for additional finite distances per model, and replicate for each aircraft
model
Calculate weighting factor based on % of aircraft model count vs. total fleet count
of airline
Calculate per-passenger emissions for finite distance for each airline as sum of weighted LTO & Cruise-mode emissions
(account for weighted-avg. airline passenger capacity, airline-wide
passenger load factor, and PAX to Freight Ratio)
Repeat for adiditonal finited distances for each domestic airline

Assumptions• One passenger per booking entry
• Same airline for all legs of multi-stop flights
• GHG mitigation through substitution of Multi-Leg Roundtrip-Flights with Non-Stop Roundtrip-Flights was simple for a roundtrip flight with even-number of legs (eg. 4-leg flight: Mumbai-Dubal-London-Dubai-London) wherein the ‘destination’ was the middle city (i.e. London). The process of determining the ‘destination’ for a roundtrip-flight with odd-number of legs (eg. 3-leg flight: Mumbai-Dubai-Geneva-Mumbai) was: identify the city following the ‘mid-point’ in the even-number sequence (eg. mid-point of 4 city trip would be 2nd-city, the subsequent city would be the 3rd-city in the sequence –i.e. Geneva.
• 100% economy class seats
• Employee Count: 1,20,000
• Additional Employee Time per Flight Leg (Pre-Departure, Transit, Post-Arrival Time) : 3 hours/flight
• For Airlines wherein fleet composition and operation data were not available, the corresponding ‘average’ emission factor for the Sector was applied (eg. use of Avg. International Short Haul Emission Factor (kg CO2e/pass-km) for Ravn Alaska Airline’s International Short Haul Flights)

Materiality and Exclusions
• Scope 1 Emissions from Owned Vehicle use to support Air Travel activities not considered material to footprint and hence excluded
• Scope 2 Emissions attributable to Office Electricity Use (for Air Travel Management Operations) not considered material to footprint and hence excluded
• Scope 3 Emissions attributable to AT&C Losses resulting from Office Electricity Use (for Air Travel Management Operations) not considered material to footprint and hence excluded
• Scope 3 Emissions from Train Travel in the USA excluded
• Flights shorter than 100 kms excluded (considered to be data error)
• Flights costing less than INR 200 excluded (considered to be data error)
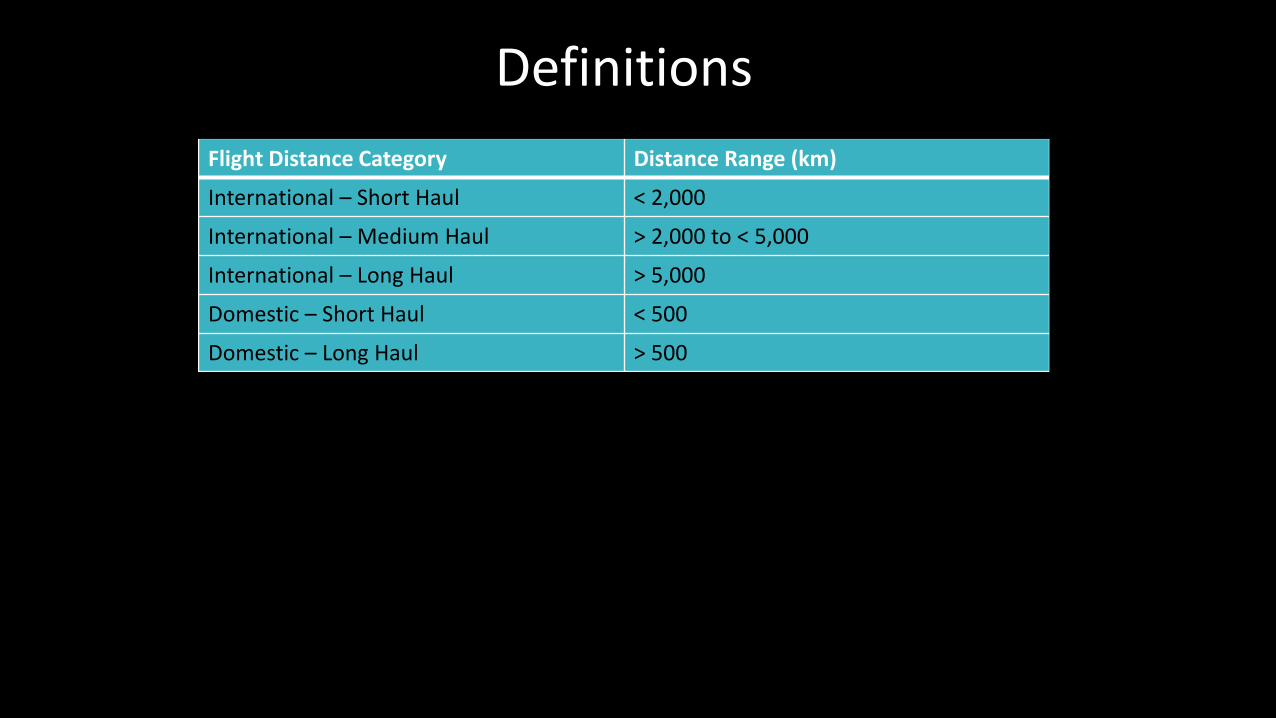
Definitions
Flight Distance Category Distance Range (km)
International – Short Haul < 2,000
International – Medium Haul > 2,000 to < 5,000
International – Long Haul > 5,000
Domestic – Short Haul < 500
Domestic – Long Haul > 500

Data Analysis:
Know your
Air Travel Metrics

Total Distance
Domestic - India
International
Domestic
Domestic - USA
324.4
174.3
136.4
809.9
1,134.4
336.9
160.3
FY 15-16FY 14-15
1,269.8
932.9
161.4
Distance Metrics(Million Passenger-kms)
Domestic - Others15.2 13.7

Total Flights
Domestic - India
International
Domestic
Domestic - USA
2,89,474
1,73,147
96,636
1,79,201
4,68,67
5
2,96,205
1,13,763
FY 15-16FY 14-15
4,98,32
72,02,122
1,59,166
Domestic - Others23,276 19,691
Flight Metrics(Nos. of Flights)

Auckland, New Zealand
Bonaire, Netherlands
Antilles
Lisbon, Portugal
Perth, Australia
London, United Kingdom
Singapore, Singapore
Sydney, Australia
Toronto, Canada
18,287.5
18177.93
18138.05
18,336.8
Tallinn, USSR
Geneva, Switzerland
Cotonou, Benin
Porto, Portugal
Guangzhou, China
Helsinki, Finland
Lyon, France
Lagos, Nigeria
Vego, Spain
Hongkong
106.6
107.2
109.9
128.5
101.4
5 Longest
International Flights
km km
5 Shortest
International Flights
Auckland, New Zealand
Heathrow, United Kingdom18,364.2

Delhi, India
Bangalore, India
Amritsar, India
Kochi, India
Dibrugarh, India
Port Blair, India
Dibrugarh, India
Kochi, India
Guwahati, India
Pune, India
2,418.7
2,408.6
2,385.4
2,368.7
2,483.5Baroda, India
Bombay, India
Calicut, India
Jammu, India
Dehradun, Uttarakhand
Pune, India
Srinagar, India
Chandigarh, India
124.1
131.7
142.6
143.2
102.3
5 Shortest Domestic-
India Flights
km km
5 Longest Domestic-
India Flights
Ahmedabad, India
Pune, India
Coimbatore, India
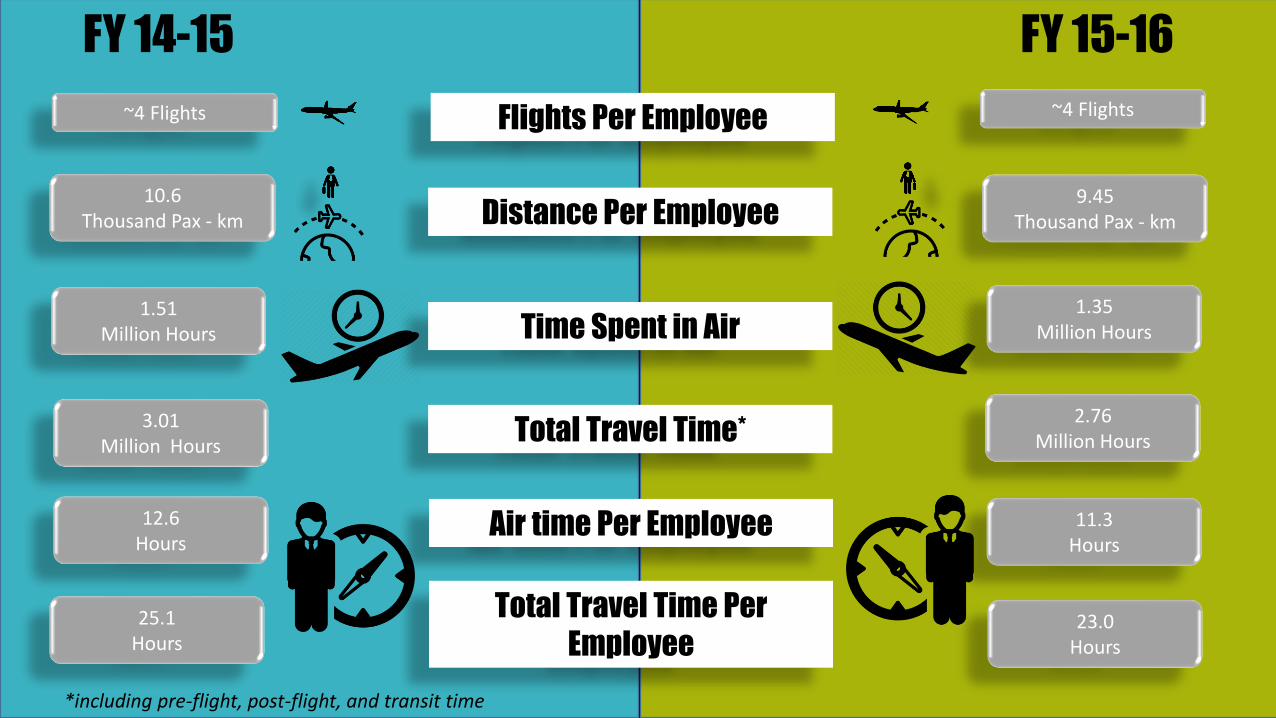
1.51Million Hours
1.35 Million Hours
3.01 Million Hours
2.76Million Hours
12.6 Hours
11.3 Hours
25.1Hours
23.0 Hours
Time Spent in Air
Total Travel Time*
Air time Per Employee
Total Travel Time Per
Employee
FY 15-16FY 14-15
Distance Per Employee10.6
Thousand Pax - km9.45
Thousand Pax - km
~4 Flights ~4 FlightsFlights Per Employee
*including pre-flight, post-flight, and transit time

Most Favoured International Airlines(flight count-based)
14%
11%
10%
8%
8%6%6%
5%
3%3%
26%
Most Favoured International AirlinesFY 2014-2015
Emirates
British Airways
Lufthansa
Singapore Airlines
Etihad Airways
Jet Airways
Qatar Airways
Air India
United Airlines
Cathay Pacific Airways
Others
19%
11%
9%
9%8%7%
5%
3%3%2%
24%
Most Favoured International AirlinesFY 2015-2016
Emirates
Etihad Airways
Lufthansa
British Airways
Singapore Airlines
Qatar Airways
Jet Airways
Air India
United Airlines
KLM Royal Dutch Airlines
Others
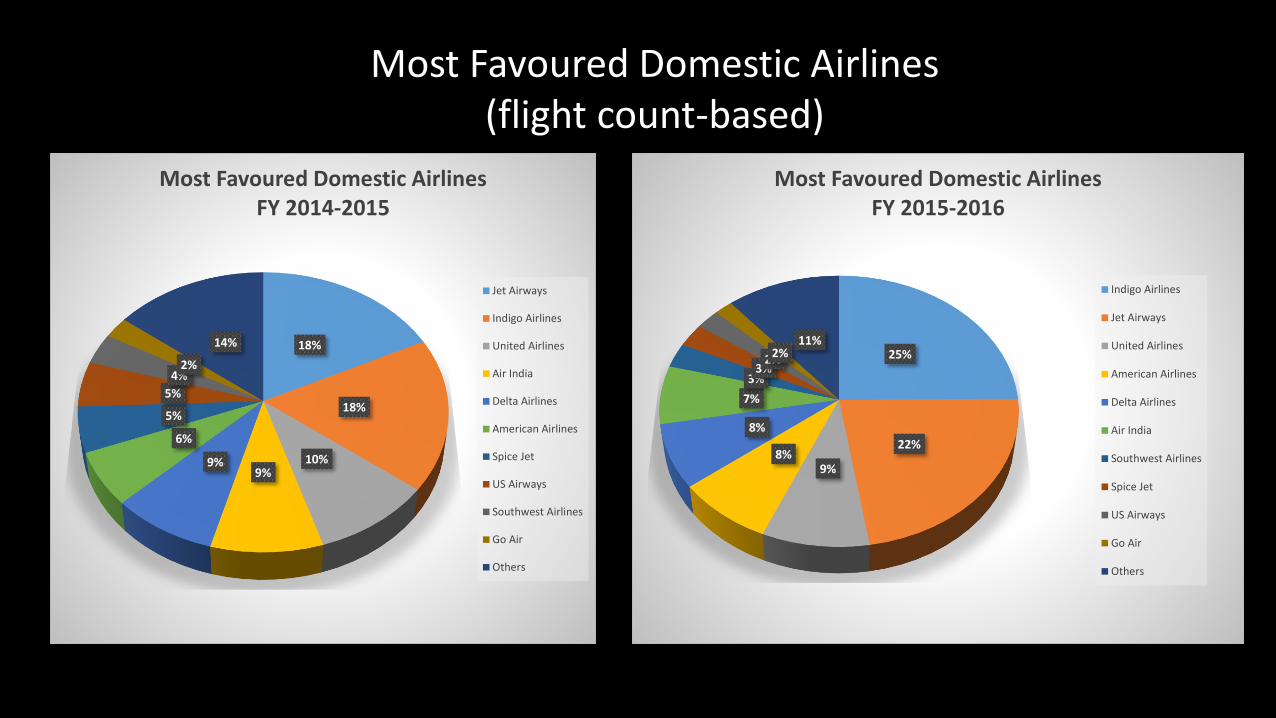
Most Favoured Domestic Airlines(flight count-based)
18%
18%
10%9%
9%
6%
5%
5%
4%2%
14%
Most Favoured Domestic AirlinesFY 2014-2015
Jet Airways
Indigo Airlines
United Airlines
Air India
Delta Airlines
American Airlines
Spice Jet
US Airways
Southwest Airlines
Go Air
Others
25%
22%
9%8%
8%
7%
3%3%
2%2%11%
Most Favoured Domestic AirlinesFY 2015-2016
Indigo Airlines
Jet Airways
United Airlines
American Airlines
Delta Airlines
Air India
Southwest Airlines
Spice Jet
US Airways
Go Air
Others

Data Analysis:
Know your
Baseline GHG Emissions
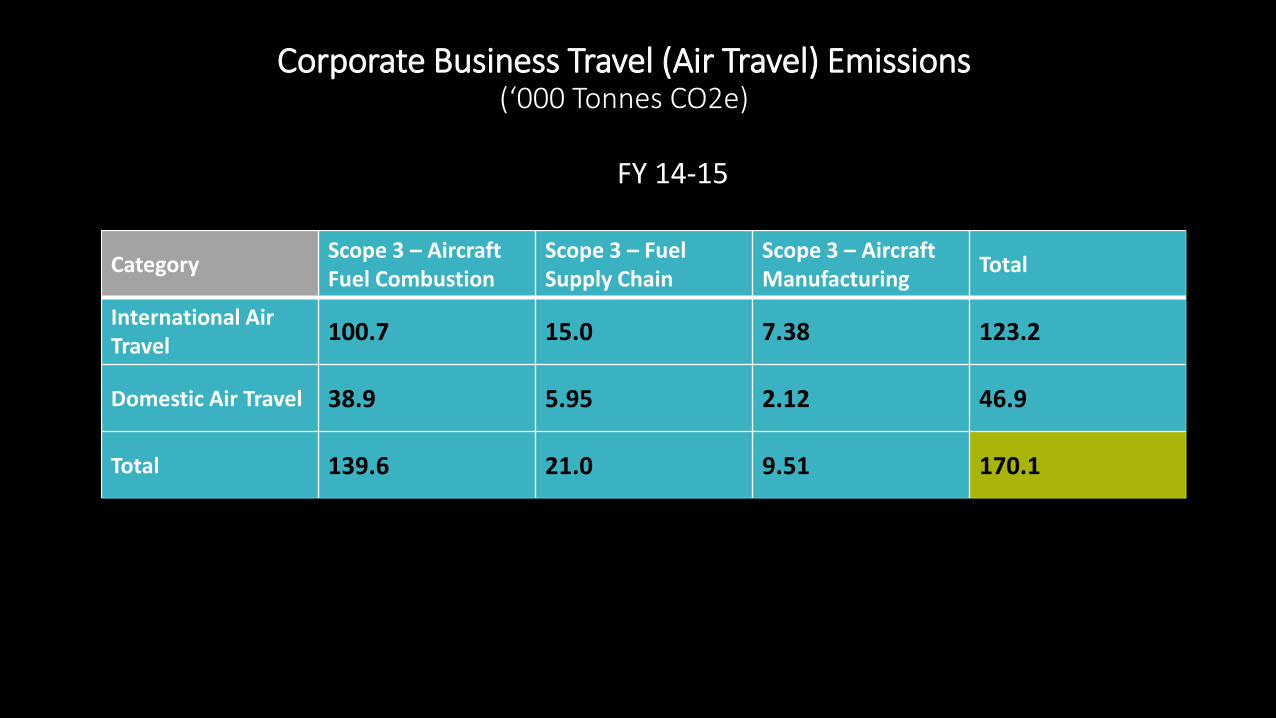
Corporate Business Travel (Air Travel) Emissions (‘000 Tonnes CO2e)
CategoryScope 3 – AircraftFuel Combustion
Scope 3 – FuelSupply Chain
Scope 3 – AircraftManufacturing
Total
International Air Travel
100.7 15.0 7.38 123.2
Domestic Air Travel 38.9 5.95 2.12 46.9
Total 139.6 21.0 9.51 170.1
FY 14-15

Corporate Business Travel (Air Travel) Emissions (‘000 Tonnes CO2e)
CategoryScope 3 – AircraftFuel Combustion
Scope 3 – FuelSupply Chain
Scope 3 – AircraftManufacturing
Total
International Air Travel
88.6 13.1 6.4 108.2
Domestic Air Travel 37.0 5.7 2.0 44.7
Total 125.6 18.8 8.4 152.9
FY 15-16

Air Travel Emission Trend – FY 14-15 vs. FY 15-16
0
20,000
40,000
60,000
80,000
100,000
120,000
140,000
160,000
180,000
FY 2014-2015 FY 2015-2016
Air Travel GHG Emissions: FY 14-15 and FY 15-16
Air Travel Emission Trend
GHG Emissions FY 2014 - 2015 -170.1 Thousand tonne CO2e
GHG Emissions FY 2015-2016 -152.9 Thousand tonne CO2e
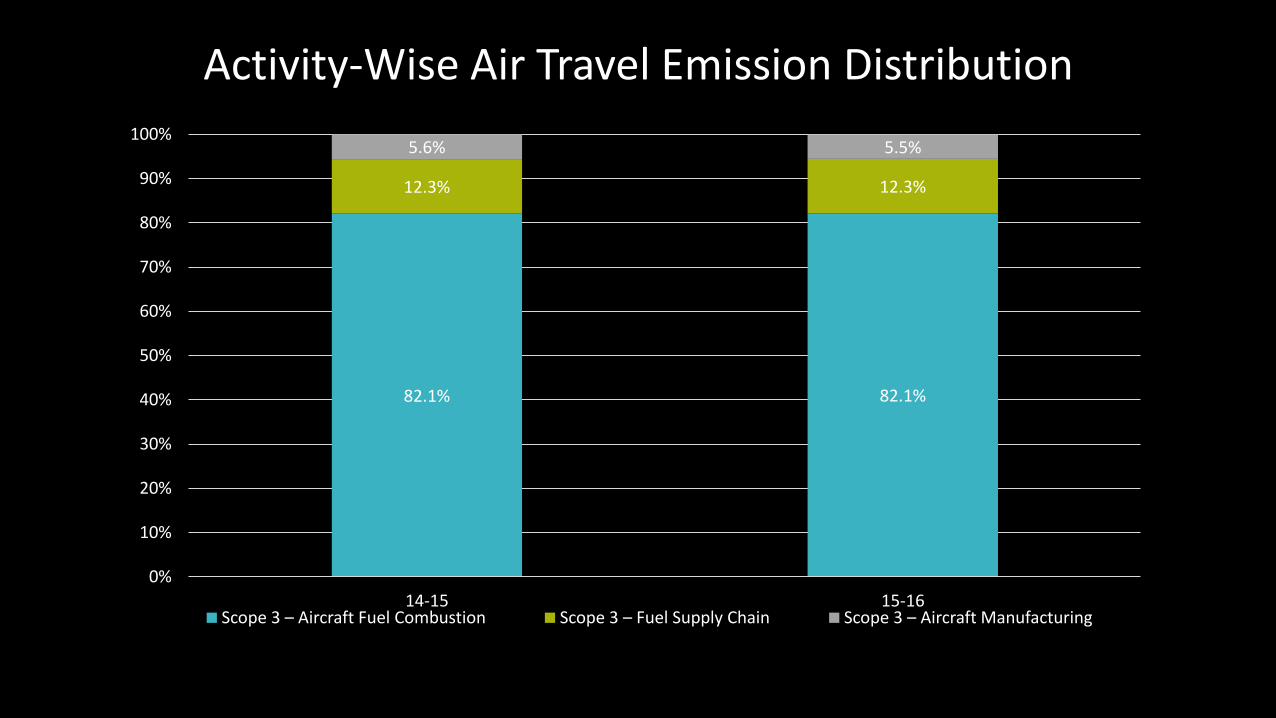
Activity-Wise Air Travel Emission Distribution
82.1% 82.1%
12.3% 12.3%
5.6% 5.5%
0%
10%
20%
30%
40%
50%
60%
70%
80%
90%
100%
14-15 15-16Scope 3 – Aircraft Fuel Combustion Scope 3 – Fuel Supply Chain Scope 3 – Aircraft Manufacturing
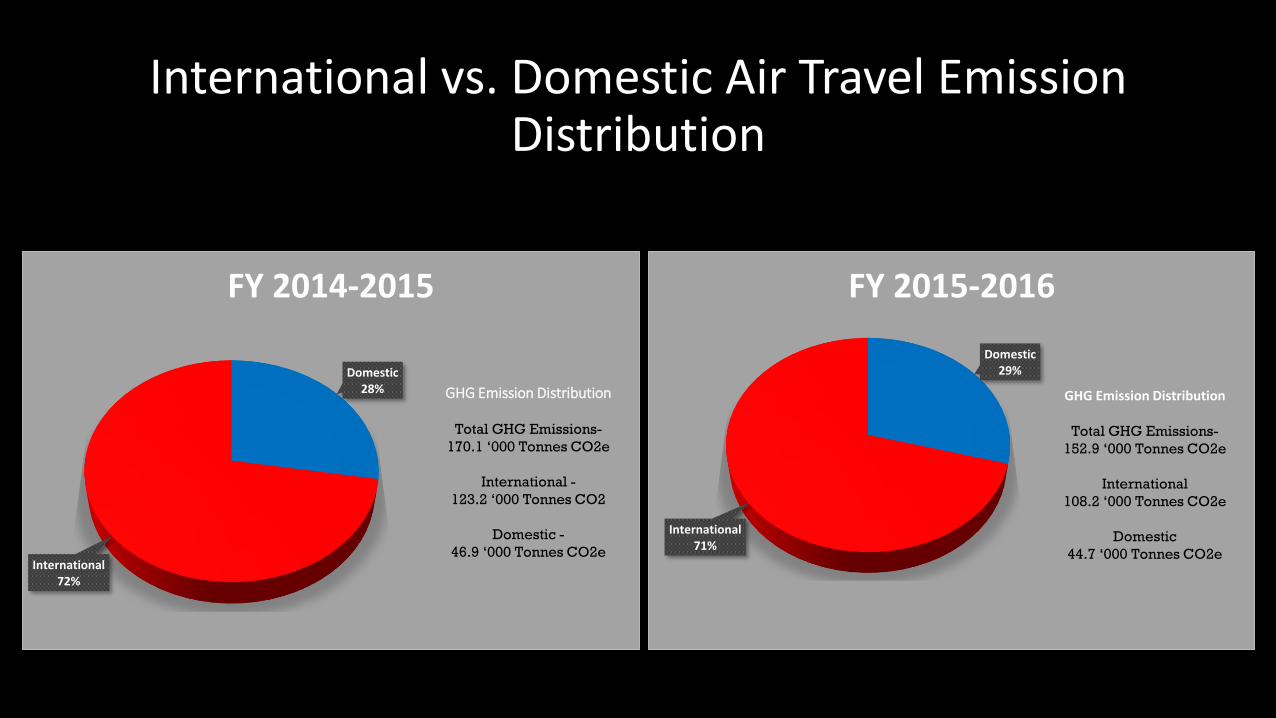
International vs. Domestic Air Travel Emission Distribution
Domestic28%
International72%
FY 2014-2015
GHG Emission Distribution
Total GHG Emissions-
170.1 ‘000 Tonnes CO2e
International -
123.2 ‘000 Tonnes CO2
Domestic -
46.9 ‘000 Tonnes CO2e
Domestic29%
International71%
FY 2015-2016
GHG Emission Distribution
Total GHG Emissions-
152.9 ‘000 Tonnes CO2e
International
108.2 ‘000 Tonnes CO2e
Domestic
44.7 ‘000 Tonnes CO2e

Domestic Air Travel Emission Distribution
Domestic - India46%
Domestic - USA49%
Domestic - Other5%
FY 2014-2015
Domestic GHG Emission Distribution
Total Domestic GHG Emissions
46.9 ‘000 Tonnes CO2e
Domestic - India
21.7 ‘000 Tonnes CO2e
Domestic - USA
23.0 ‘000 Tonnes CO2e
Domestic - Other
2.38 ‘000 Tonnes CO2e
Domestic - India52%
Domestic - USA43%
Domestic - Other5%
FY 2015-2016
Domestic GHG Emission Distribution
Total Domestic GHG Emissions
44.7 ‘000 Tonnes CO2e
Domestic - India
23.1 ‘000 Tonnes CO2e
Domestic - USA
19.5 ‘000 Tonnes CO2e
Domestic - Other
2.21 ‘000 Tonnes CO2e

1.42 Tonnes
CO2e1.28 Tonnes
CO2e
341.6 kg CO2e
326.5kg CO2e
21.3 g CO2e 20.4 g CO2e
53.8 Million Litres
48.4Million Litres
Emission Per Employee
Emission Per Flight
Emission Per Rupee
Litres of fuel burnt
FY 14-15 FY 15-16GHG Emission Benchmarks

0.39 Tonnes
CO2e
0.36 Tonnes
CO2e
? 326.5kg CO2e
76,557 Tonnes
CO2e
110,809 Tonnes CO2e
Emission Per Employee
Emission Per Flight
Total Air Travel Emissions
Infosys TCSGHG Emission Benchmarks - Peers
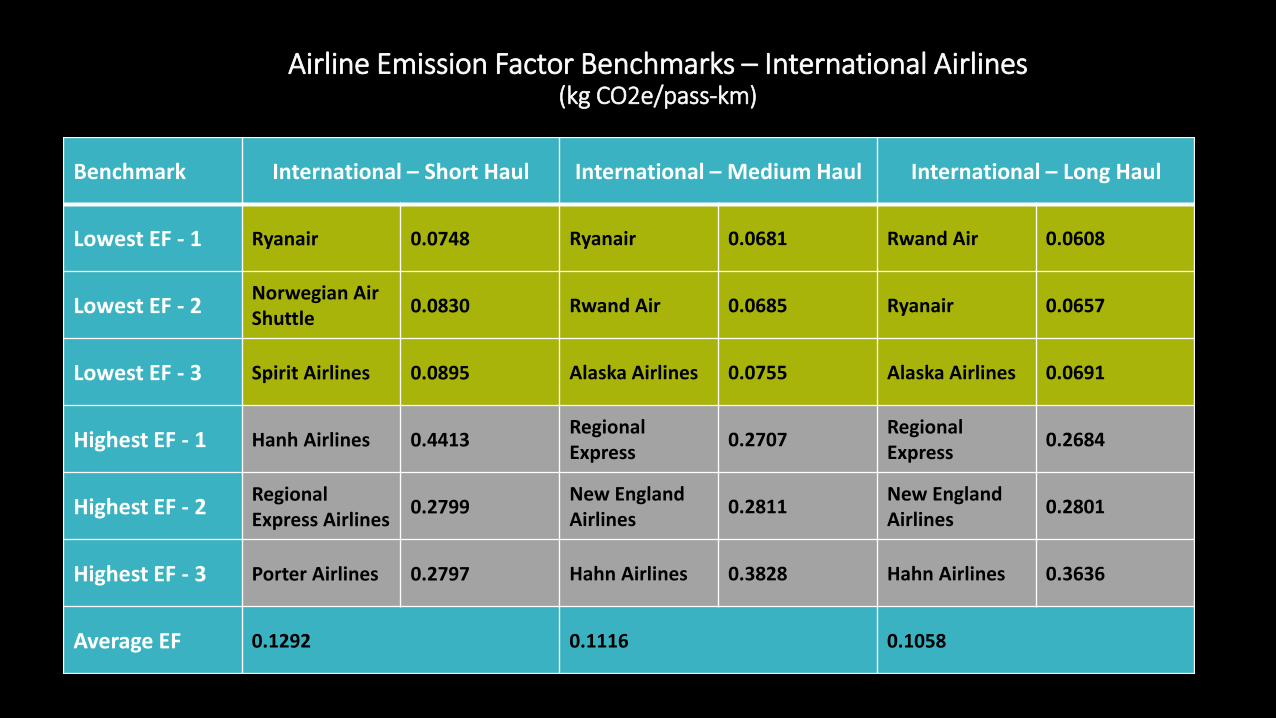
Airline Emission Factor Benchmarks – International Airlines(kg CO2e/pass-km)
Benchmark International – Short Haul International – Medium Haul International – Long Haul
Lowest EF - 1 Ryanair 0.0748 Ryanair 0.0681 Rwand Air 0.0608
Lowest EF - 2Norwegian Air Shuttle
0.0830 Rwand Air 0.0685 Ryanair 0.0657
Lowest EF - 3 Spirit Airlines 0.0895 Alaska Airlines 0.0755 Alaska Airlines 0.0691
Highest EF - 1 Hanh Airlines 0.4413Regional Express
0.2707Regional Express
0.2684
Highest EF - 2Regional Express Airlines
0.2799New England Airlines
0.2811New England Airlines
0.2801
Highest EF - 3 Porter Airlines 0.2797 Hahn Airlines 0.3828 Hahn Airlines 0.3636
Average EF 0.1292 0.1116 0.1058
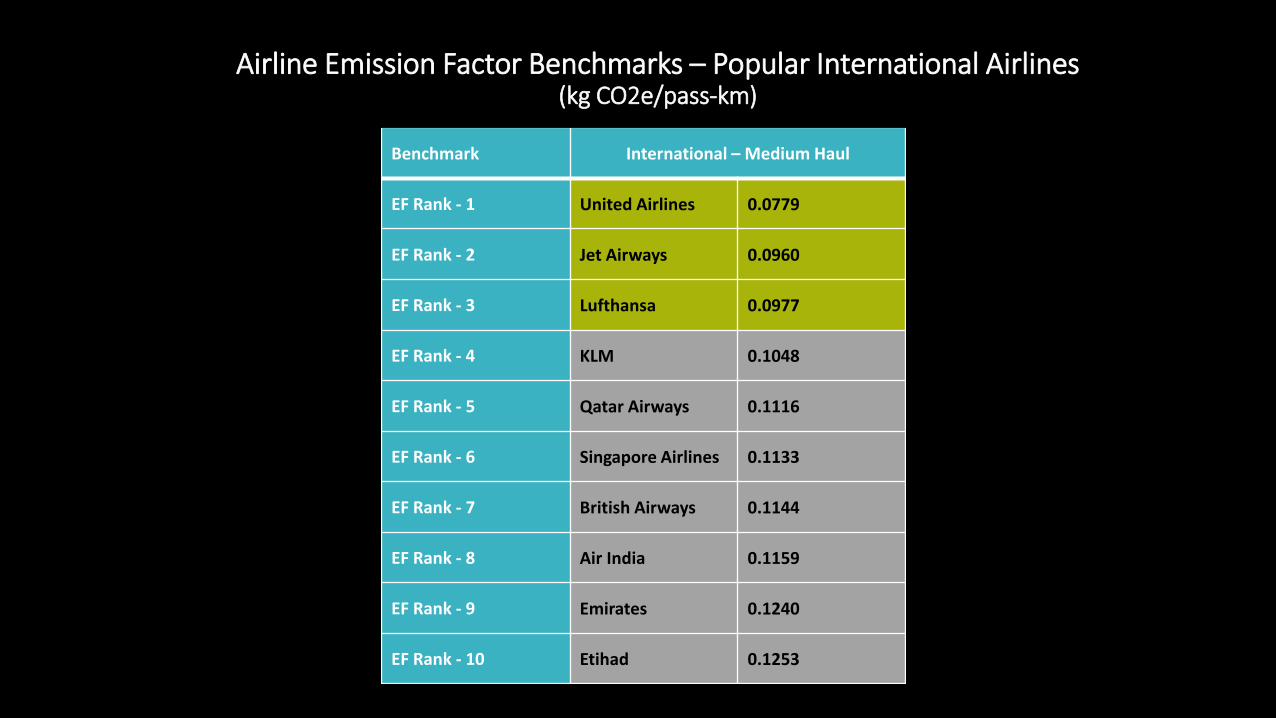
Airline Emission Factor Benchmarks – Popular International Airlines(kg CO2e/pass-km)
Benchmark International – Medium Haul
EF Rank - 1 United Airlines 0.0779
EF Rank - 2 Jet Airways 0.0960
EF Rank - 3 Lufthansa 0.0977
EF Rank - 4 KLM 0.1048
EF Rank - 5 Qatar Airways 0.1116
EF Rank - 6 Singapore Airlines 0.1133
EF Rank - 7 British Airways 0.1144
EF Rank - 8 Air India 0.1159
EF Rank - 9 Emirates 0.1240
EF Rank - 10 Etihad 0.1253

Airline Emission Factor Benchmarks – Domestic (India) Airlines(kg CO2e/pass-km)
Benchmark Domestic – India Short Haul Domestic India – Long Haul
Lowest EF - 1 Indigo Airlines 0.1289 Spice Jet 0.0861
Lowest EF - 2 GO Air 0.1304 Indigo Airlines 0.0867
Lowest EF - 3 Air Asia India 0.1378 GO Air 0.0877
Highest EF - 1 Air India 0.1996 Air India 0.1329
Highest EF - 2 Jet Airways 0.1806 Jet Airways 0.1198
Highest EF - 3 Spice Jet 0.1670 Vistara 0.1105
Average EF 0.1582 0.1031
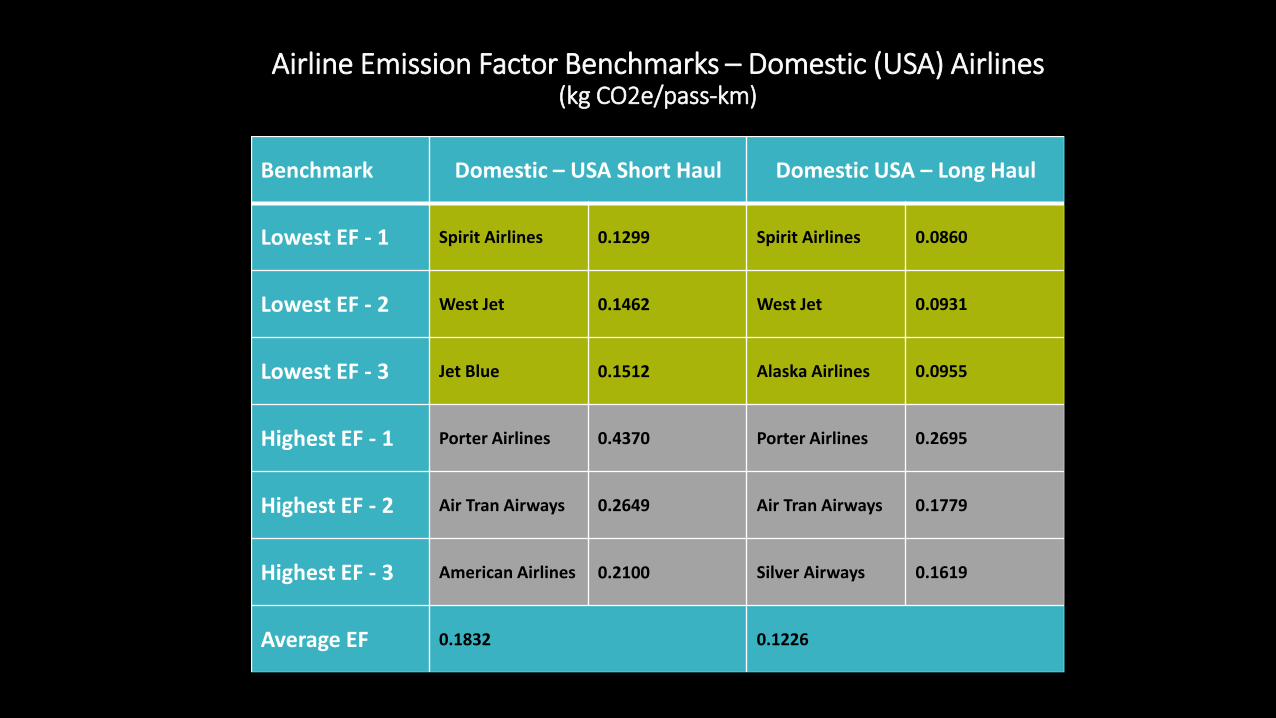
Airline Emission Factor Benchmarks – Domestic (USA) Airlines(kg CO2e/pass-km)
Benchmark Domestic – USA Short Haul Domestic USA – Long Haul
Lowest EF - 1 Spirit Airlines 0.1299 Spirit Airlines 0.0860
Lowest EF - 2 West Jet 0.1462 West Jet 0.0931
Lowest EF - 3 Jet Blue 0.1512 Alaska Airlines 0.0955
Highest EF - 1 Porter Airlines 0.4370 Porter Airlines 0.2695
Highest EF - 2 Air Tran Airways 0.2649 Air Tran Airways 0.1779
Highest EF - 3 American Airlines 0.2100 Silver Airways 0.1619
Average EF 0.1832 0.1226

Scenario Modelling:
Know your
Mitigation Options
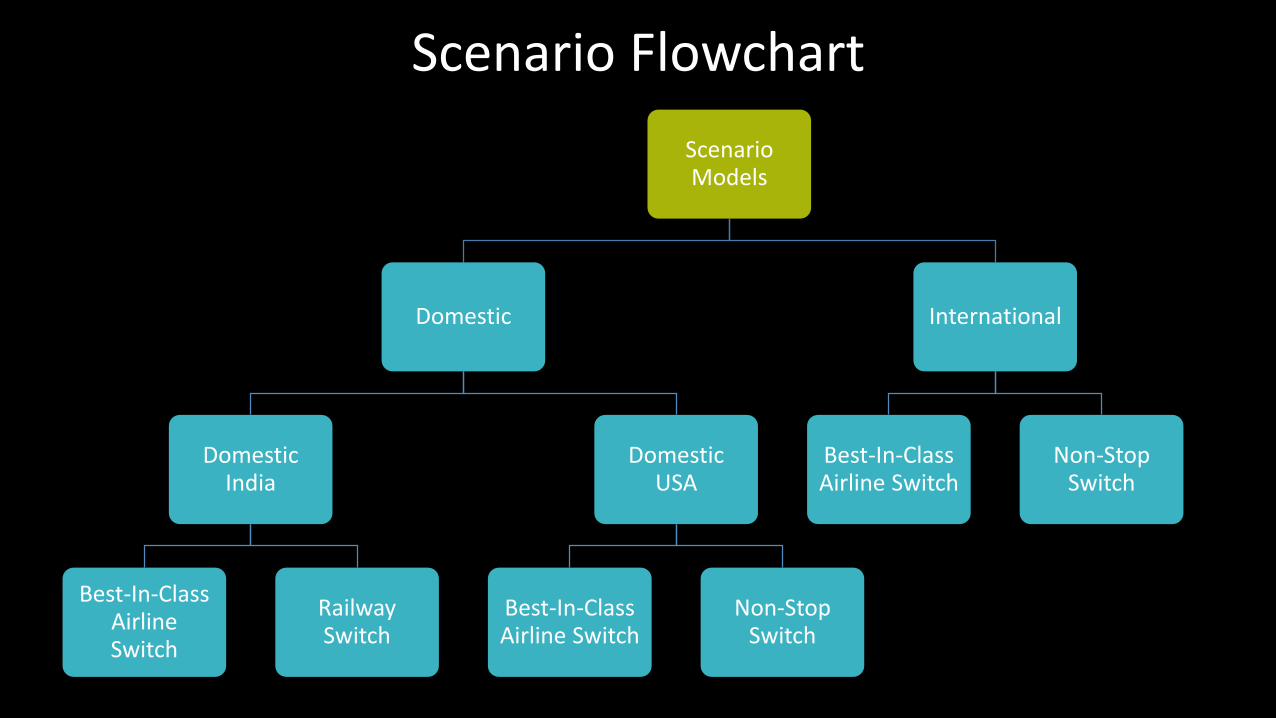
Scenario Flowchart
Scenario Models
Domestic
Domestic India
Best-In-Class Airline Switch
Railway Switch
Domestic USA
Best-In-Class Airline Switch
Non-Stop Switch
International
Best-In-Class Airline Switch
Non-Stop Switch

Scenario Flowchart
119.0
19.6 20.2
70.4
15.7 12.7
48.5
3.9 7.50.0
20.0
40.0
60.0
80.0
100.0
120.0
140.0
International Domestic India Domestic USA
GH
G E
mis
sio
ns
‘00
0 T
on
nes
CO
2e
Air Travel Category
FY 14- 15 Best In Class Switch
Baseline Recommendation Savings
Best In Class Switch
InternationalBaseline - 119.0 Thousand tonne CO2eRecommendation - 70.4 Thousand tonne CO2eSavings - 48.5 Thousand tonne CO2eSaving % -41%
Domestic IndiaBaseline - 19.6 Thousand tonne CO2eRecommendation - 15.7 Thousand tonne CO2eSavings - 3.9 Thousand tonne CO2eSaving % -37%
Domestic USABaseline - 20.2Thousand tonne CO2eRecommendation - 12.7 Thousand tonne CO2eSavings - 7.5 Thousand tonne CO2eSaving % - 20%
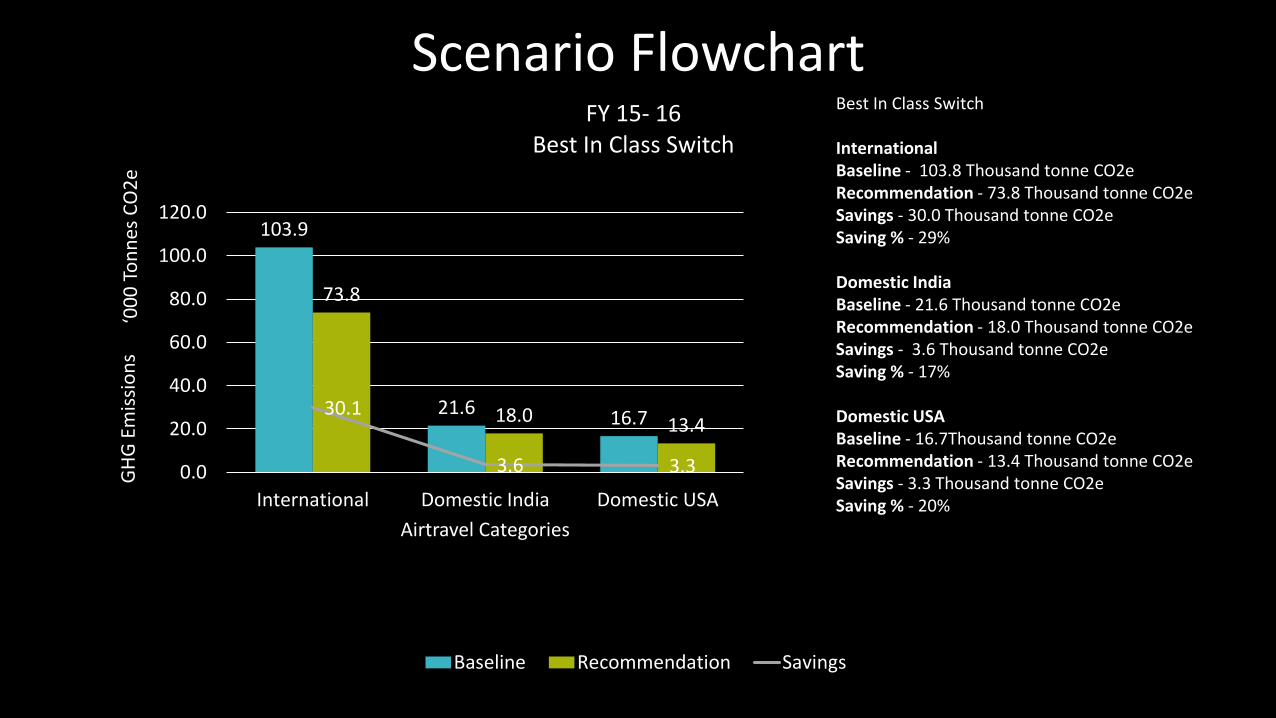
Scenario Flowchart
103.9
21.6 16.7
73.8
18.0 13.430.1
3.6 3.30.0
20.0
40.0
60.0
80.0
100.0
120.0
International Domestic India Domestic USA
GH
G E
mis
sio
ns
‘00
0 T
on
nes
CO
2e
Airtravel Categories
FY 15- 16 Best In Class Switch
Baseline Recommendation Savings
Best In Class Switch
InternationalBaseline - 103.8 Thousand tonne CO2eRecommendation - 73.8 Thousand tonne CO2eSavings - 30.0 Thousand tonne CO2eSaving % - 29%
Domestic IndiaBaseline - 21.6 Thousand tonne CO2eRecommendation - 18.0 Thousand tonne CO2eSavings - 3.6 Thousand tonne CO2eSaving % - 17%
Domestic USABaseline - 16.7Thousand tonne CO2eRecommendation - 13.4 Thousand tonne CO2eSavings - 3.3 Thousand tonne CO2eSaving % - 20%

Scenario Flowchart
Best In Class Switch for Top GHG Emission contributing sectors
FY 14 -15Baseline – 32.17 Thousand tonne CO2eRecommendation – 24.62 Thousand tonne CO2eSavings – 7.54 Thousand tonne CO2eSavings % - 23%
FY 15-16Baseline – 47.23 Thousand tonne CO2eRecommendation – 35.20 Thousand tonne CO2eSavings – 12.04 Thousand tonne CO2eSavings % - 25%
32.17
47.23
24.62
35.20
0.00
5.00
10.00
15.00
20.00
25.00
30.00
35.00
40.00
45.00
50.00
FY 14-15 FY 15-16
GH
G E
mis
sio
ns
‘00
0 t
on
ne
CO
2e
Baseline Recommendation
FY 14-15 vs FY 15-16

Scenario Flowchart
63.4
7.1
47.5
3.6
15.9
3.50.0
10.0
20.0
30.0
40.0
50.0
60.0
70.0
International Domestic USA
GH
G E
mis
sio
ns
‘00
0 T
on
nes
CO
2e
Air Travel Category
FY 14-15Non Stop Switch
Baseline Recommendation Savings
Non Stop Switch
InternationalBaseline - 63.4 Thousand tonne CO2eRecommendation - 47.4 Thousand tonne CO2eSavings - 15.9 Thousand tonne CO2eSaving % -25%
Domestic USABaseline - 7.0 Thousand tonne CO2eRecommendation - 3.6 Thousand tonne CO2eSavings - 3.50 Thousand tonne CO2eSaving % -25%

Scenario Flowchart
65.2
6.7
55.9
4.39.3
2.40.0
10.0
20.0
30.0
40.0
50.0
60.0
70.0
International Domestic USA
GH
G E
mis
sio
ns
’00
0 T
on
nes
CO
2e
Air Travel Category
Non Stop Switch FY 15-16
Baseline Recommended Savings
Non Stop Switch
InternationalBaseline - 65.2 Thousand tonne CO2eRecommendation - 55.9 Thousand tonne CO2eSavings - 9.3 Thousand tonne CO2eSaving % - 14%
Domestic USABaseline - 6.7 Thousand tonne CO2eRecommendation - 4.3 Thousand tonne CO2eSavings - 2.4 Thousand tonne CO2eSaving % - 35%

Scenario Flowchart
Non Stop Switch for Top GHG Emission contributing sectors
FY 14-15Baseline – 13.96 Thousand tonne CO2eRecommendation – 10.61 Thousand tonne CO2eSavings – 3.34 Thousand tonne CO2eSavings % - 24%
FY 15-16Baseline – 16.57 Thousand tonne CO2eRecommendation – 12.48 Thousand tonne CO2eSavings – 4.09 Thousand tonne CO2eSavings % - 25%
13.96
16.57
10.61
12.48
0.00
2.00
4.00
6.00
8.00
10.00
12.00
14.00
16.00
18.00
FY 14-15 FY 15-16
GH
G E
mis
sio
n ‘0
00
to
nn
e C
O2
e
Baseline Recommendation

Key Recommendations• Give priority to Best-In-Class Airlines:
➢ For International Travel: United Airlines, Jet Airways, Lufthansa
➢ For Domestic Travel in India: Indigo, Go Air, Spicejet
• Switch journeys of < 200 km to shared vehicular transport such as express busses, express trains and car-pooled intercity-cabs
• Switch to Rajdhani, Duronto, Shatabdi , Amtrak Train Travel for Routes between key-city pairs served by these high-speed trains➢ For India-Travel: Mumbai-Ahmedabad, Mumbai-Baroda, Kolkata-Ranchi, Kolkata-Puri, Jaipur-Delhi, Bangalore-Chennai,
Mysore-Chennai, Chennai-Coimbatore, Pune-Hyderabad, New Delhi-Chandigarh, New Delhi-Amritsar
➢ For US-Travel: New York City-Boston, New York City-Philadelphia, Houston-Dallas, New York City-Washington DC
• Consider time savings from avoided air travel (with tele-video conferencing as a substitute) to be eligible for partial consideration as vacation-time for employees.