winning trust quality
TRANSCRIPT

1st Floor, N.I.C.L. Building, Abbasi Shaheed Road, Karachi-75530URL: www.searlecompany.com
Winning
ThroughTrustQuality Quarterly Report
Spetember 2019
3530
1852

1
CONTENTS
Company Information 2
Directors’ Report to the Members 3
Directors’ Report to the Members (Urdu) 6
Unconsolidated Condensed Interim Statement of Financial Position 7
Unconsolidated Statement of Profit or Loss and Other Comprehensive Income 8
Unconsolidated Condensed Interim Statement of Changes In Equity 9
Unconsolidated Condensed Interim Statement of Cash Flows 10
Selected Notes to the Unconsolidated Condensed Interim Financial Statements 11
Consolidated Condensed Interim Financial Statements 25

2 Quarterly Report September 2019
Board of DirectorsMr. Adnan Asdar Ali (Chairman)Mr. Rashid AbdullaMr. S. Nadeem Ahmed (Chief Executive Officer)Mr. Zubair Razzak PalwalaMr. Ayaz AbdullaMr. Asad AbdullaMrs. Shaista Khaliq Rehman
Board of Audit CommitteeMrs. Shaista Khaliq Rehman (Chairperson)Mr. Adnan Asdar Ali (Member)Mr. Asad Abdulla (Member)
Board of HR & Remuneration CommitteeMrs. Shaista Khaliq Rehman (Chairperson)Mr. Adnan Asdar Ali (Member)Mr. Ayaz Abdulla (Member)Mr. Asad Abdulla (Member)
Chief Financial OfficerMr. Mobeen Alam
Company SecretaryMr. Zubair Razzak Palwala
AuditorsA. F. Ferguson & Co.
Legal AdvisorsMohsin Tayebaly & Co.
BankersAlbaraka Bank (Pakistan) LimitedBank Al Habib LimitedBank Alfalah LimitedBank of PunjabDubai Islamic Bank Pakistan LimitedFaysal Bank LimitedHabib Bank LimitedHabib Metropolitan Bank LimitedMCB Bank LimitedMeezan Bank LimitedNational Bank of PakistanSilk Bank LimitedSoneri Bank LimitedStandard Chartered Bank (Pakistan) LimitedSummit Bank Limited
Registered OfficeFirst Floor, N.I.C.L. Building, Abbasi Shaheed Road, Off: Shahrah-e-Faisal, Karachi.
Share RegistrarCDC Share Registar Services Limited Head Office, CDC House, 99-B, Block ‘B’ S.M.C.H.S., Main Shahrah-e-FaisalKarachi - 74400
3
We are pleased to present the unconsolidated interim financial information of your Company for the three months ended September 30, 2019. These financial statements have been prepared in accordance with the requirements of the International Accounting Standard (IAS) 34 – ‘Interim Financial Reporting’ and the provisions of the directives issued under the Companies Act, 2017.
MARKET OVERVIEW
Pharmaceutical sales in Pakistan grew at a (2013-19) CAGR of 12%, driven by new molecule introductions and supported by underlying demographic trends of increasing affordability, rising population, higher life expectancy and increased incidence of chronic diseases. However, the pharmaceutical industry is experiencing a constant downward trend, due to high reliance of imported APIs, low per capita expenditure and low prices in terms of global environment.
The recent economic conditions have raised challenges on the industry as a whole. It is well known fact that the chemical industry of Pakistan has capacity constraints to develop basic components required for manufacturing drugs. Therefore, the industry resorts to import of raw materials. Due to this significant dependability, fluctuation in exchange rates coupled with stiff price regulations directly affect the product margins and consequent commercial feasibility. Pakistani rupee has experienced double-digit depreciation which has put the pharma industry under immense pressure.
OPERATING RESULTS
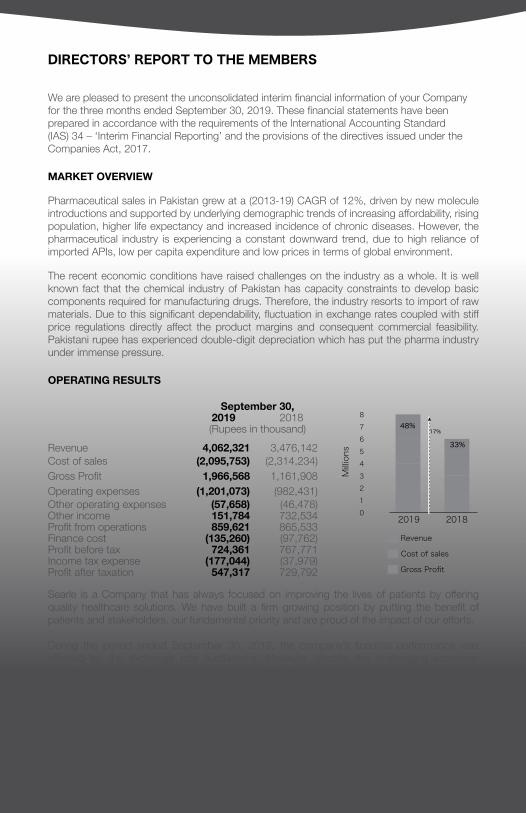
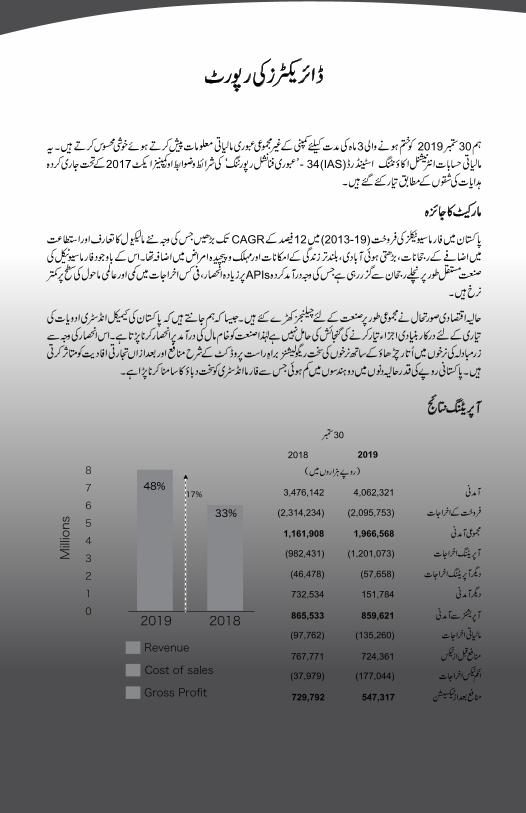
September 30,2019 2018(Rupees in thousand)
Revenue 4,062,321 3,476,142 Cost of sales (2,095,753) (2,314,234)Gross Profit 1,966,568 1,161,908 Operating expenses (1,201,073) (982,431)Other operating expenses (57,658) (46,478)Other income 151,784 732,534 Profit from operations 859,621 865,533 Finance cost (135,260) (97,762)Profit before tax 724,361 767,771 Income tax expense (177,044) (37,979)Profit after taxation 547,317 729,792
Searle is a Company that has always focused on improving the lives of patients by offering quality healthcare solutions. We have built a firm growing position by putting the benefit of patients and stakeholders, our fundamental priority and are proud of the impact of our efforts.
During the period ended September 30, 2019, the company’s financial performance was affected by the exchange rate fluctuations. However, despite the challenging economic conditions, Searle managed to continue its momentum.
Financial highlights are summarized below:
• Net sales of the Company grew by 17% to Rs 4.06 billion.• Gross profit margin increased to 48%.• Operating profit margin was 21%• Profit before and after taxation was 18% and 13% respectively.
DIRECTORS’ REPORT TO THE MEMBERS
0
2
4
6
8
10
Millions
48%48%
2019 2018
Revenue
Cost of sales
Gross Profit
Revenue
Cost of sales
Gross Profit
13%
012345678
Millions
48%
33%
2019 2018
17%
4 Quarterly Report September 2019
EARNINGS PER SHARE
Basic earnings per share after taxation for the period was Rs. 2.58 (2018: Rs. 3.44).
There is no dilution effect on the basic earnings per share of the Company, as the Company has no convertible dilutive potential ordinary shares outstanding as at September 30, 2019.
FUTURE OUTLOOK
In the local market, the therapeutic areas which Searle has over the years strengthened include cardiovascular, cold & cough, diabetes, infant formula, pro-biotic and antibiotics. Moving forward, we are focusing on enhancing the share of specialty generic branded portfolio and targeting differentiated products. It is also pertinent to mention that Searle has an organic pipeline of over 200 products in different stages of the regulatory approval process. Further, due to overly regulated drug pricing mechanism, volatility in retail prices is a concern of paramount importance for us. Delays in new product approvals also pose key threats for the industry as a whole. However, with the change in recent political scenario, we will have to wait to assess the future economic trends and modify our strategies accordingly. For the longer run, Searle is focusing on emerging portfolios including, bio-similars, medical devices, nutraceuticals and genome sciences.
ACKNOWLEDGEMENT
At Searle, we all are emotionally motivated and willing to contribute enthusiastically on continuous basis. Same is the case with our partners, suppliers and customers, for which we are thankful and expect the same zeal and zest for future contribution. We assure, Searle will continue to work hard to provide long term sustainable growth to everyone associated with us.
For and on behalf of the Board
Syed Nadeem Ahmed Zubair Razzak PalwalaChief Executive Officer Director
Karachi : October 28, 2019

5
6 Quarterly Report September 2019
0
2
4
6
8
10
Millions
48%48%
2019 2018
Revenue
Cost of sales
Gross Profit
Revenue
Cost of sales
Gross Profit
13%
012345678
Millions
48%
33%
2019 2018
17%
7
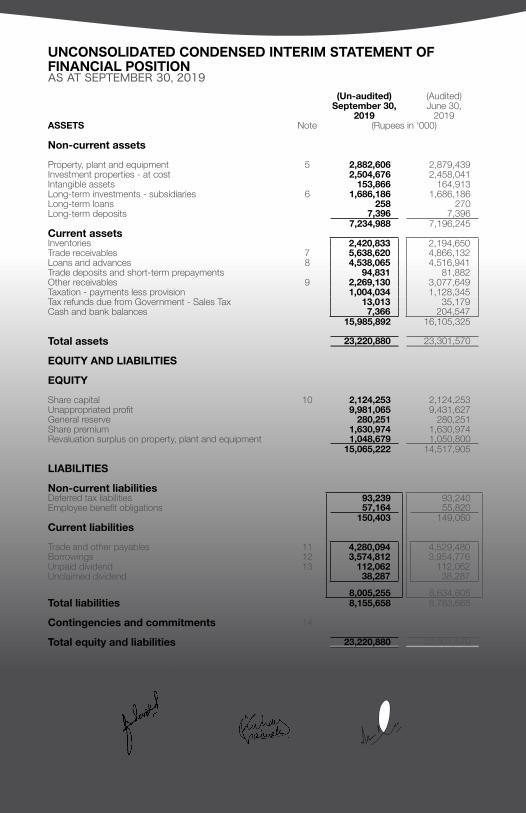
(Un-audited) (Audited)September 30, June 30,
2019 2019ASSETS Note (Rupees in ‘000)
Non-current assets
Property, plant and equipment 5 2,882,606 2,879,439 Investment properties - at cost 2,504,676 2,458,041 Intangible assets 153,866 164,913 Long-term investments - subsidiaries 6 1,686,186 1,686,186 Long-term loans 258 270 Long-term deposits 7,396 7,396
7,234,988 7,196,245 Current assetsInventories 2,420,833 2,194,650 Trade receivables 7 5,638,620 4,866,132 Loans and advances 8 4,538,065 4,516,941 Trade deposits and short-term prepayments 94,831 81,882 Other receivables 9 2,269,130 3,077,649 Taxation - payments less provision 1,004,034 1,128,345 Tax refunds due from Government - Sales Tax 13,013 35,179 Cash and bank balances 7,366 204,547
15,985,892 16,105,325
Total assets 23,220,880 23,301,570
EQUITY AND LIABILITIES
EQUITY
Share capital 10 2,124,253 2,124,253 Unappropriated profit 9,981,065 9,431,627 General reserve 280,251 280,251 Share premium 1,630,974 1,630,974 Revaluation surplus on property, plant and equipment 1,048,679 1,050,800
15,065,222 14,517,905
LIABILITIES
Non-current liabilitiesDeferred tax liabilities 93,239 93,240 Employee benefit obligations 57,164 55,820
150,403 149,060 Current liabilities
Trade and other payables 11 4,280,094 4,529,480 Borrowings 12 3,574,812 3,954,776 Unpaid dividend 13 112,062 112,062 Unclaimed dividend 38,287 38,287
8,005,255 8,634,605 Total liabilities 8,155,658 8,783,665
Contingencies and commitments 14
Total equity and liabilities 23,220,880 23,301,570
The annexed notes from 1 to 24 form an integral part of these condensed interim financial statements.
UNCONSOLIDATED CONDENSED INTERIM STATEMENT OF FINANCIAL POSITIONAS AT SEPTEMBER 30, 2019
Chief Executive Officer Director Chief Financial Officer
8 Quarterly Report September 2019 8
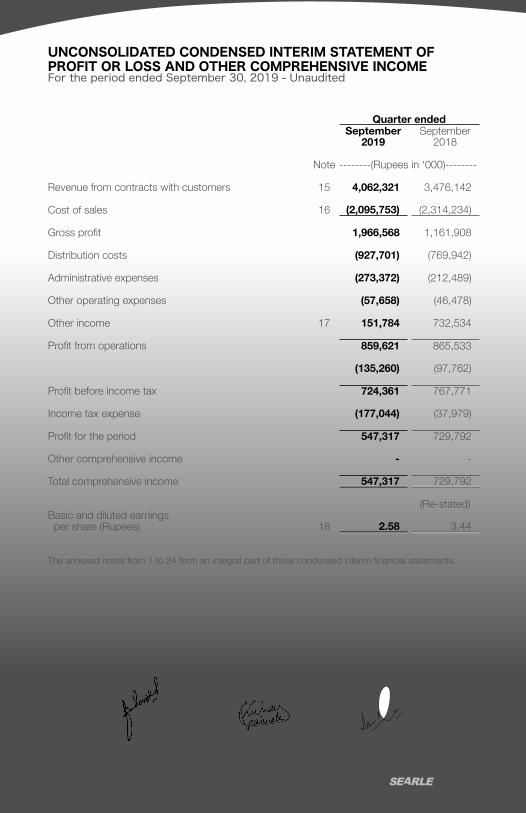
UNCONSOLIDATED CONDENSED INTERIM STATEMENT OF PROFIT OR LOSS AND OTHER COMPREHENSIVE INCOMEFor the period ended September 30, 2019 - Unaudited
Quarter endedSeptember September
2019 2018
Note --------(Rupees in ‘000)--------
Revenue from contracts with customers 15 4,062,321 3,476,142
Cost of sales 16 (2,095,753) (2,314,234)
Gross profit 1,966,568 1,161,908
Distribution costs (927,701) (769,942)
Administrative expenses (273,372) (212,489)
Other operating expenses (57,658) (46,478)
Other income 17 151,784 732,534
Profit from operations 859,621 865,533
(135,260) (97,762)
Profit before income tax 724,361 767,771
Income tax expense (177,044) (37,979)
Profit for the period 547,317 729,792
Other comprehensive income - -
Total comprehensive income 547,317 729,792
(Re-stated)Basic and diluted earnings per share (Rupees) 18 2.58 3.44
The annexed notes from 1 to 24 form an integral part of these condensed interim financial statements.
Chief Executive Officer Director Chief Financial Officer

9
UNCONSOLIDATED CONDENSED INTERIM STATEMENT OF CHANGES IN EQUITY For the period ended September 30, 2019 - Unaudited
Capital reserves Revenue reserves
Share capital Share
premium
Issue of bonus shares
Revaluation surplus on Property, plant &
equipment
General reserve
Unappro-priated profits
Total reserves Total
------------------------------------------------------ Rupees in ‘000 ------------------------------------------------------
Balance as at July 01, 2018 1,847,177 1,630,974 - 574,331 280,251 7,981,789 10,467,345 12,314,522
Transfer of incremental depreciationfor the period (net of deferred tax) - - - (279) - 279 - -
Total comprehensive income for the period - - - - - 729,792 729,792 729,792
Balance as at September 30, 2018 1,847,177 1,630,974 - 574,052 280,251 8,711,860 11,197,137 13,044,314
Balance as at July 01, 2019 2,124,253 1,630,974 - 1,050,800 280,251 9,431,627 12,393,652 14,517,905
Transfer of incremental depreciationfor the period (net of deferred tax) - - - (2,121) - 2,121 - -
Total comprehensive income for the period - - - - - 547,317 547,317 547,317
Balance as at September 30, 2019 2,124,253 1,630,974 - 1,048,679 280,251 9,981,065 12,940,969 15,065,222
The annexed notes from 1 to 24 form an integral part of these condensed interim financial statements.
Chief Executive Officer Director Chief Financial Officer

10 Quarterly Report September 2019
September 30, September 30, 2019 2018
Note (Rupees in ‘000)CASH FLOWS FROM OPERATING ACTIVITIES
Cash generated from operations 19 433,885 (22,044)Finance cost paid (91,843) (75,751)Income taxes paid (52,734) (86,382)Decrease in long-term loans 12 28
Net cash generated from operating activities 289,320 (184,149)
CASH FLOWS FROM INVESTING ACTIVITIES
Purchase of property, plant and equipment (47,721) (176,096)Proceeds from disposal of property, plant and equipment 2,450 - Purchase of investment properties (61,266) (2,520)Purchase of intangibles - (12,441)
Net cash used in investing activities (106,537) (191,057)
CASH FLOWS FROM FINANCING ACTIVITIES
Dividend paid - (3)
Net cash used in financing activities - (3)
Net increase / (decrease) in cashand cash equivalents 182,783 (375,209)
Cash and cash equivalents at the beginning of the period (3,340,229) (2,186,442)
Cash and cash equivalents at the end of the period 20 (3,157,446) (2,561,651)
(3,157,446) (2,561,651)
The annexed notes from 1 to 24 form an integral part of these condensed interim financial statements.
UNCONSOLIDATED CONDENSED INTERIM STATEMENT OF CASH FLOWSFor the period ended September 30, 2019 - Unaudited
Chief Executive Officer Director Chief Financial Officer
11
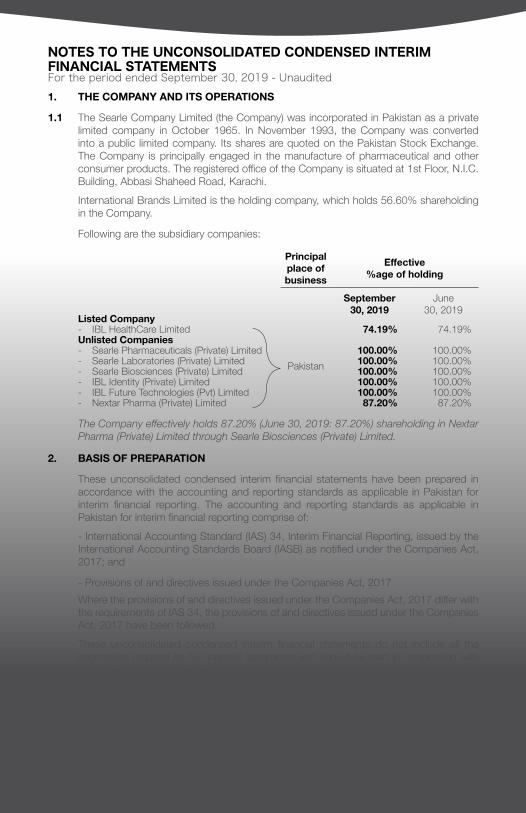
NOTES TO THE UNCONSOLIDATED CONDENSED INTERIMFINANCIAL STATEMENTSFor the period ended September 30, 2019 - Unaudited1. THE COMPANY AND ITS OPERATIONS
1.1 The Searle Company Limited (the Company) was incorporated in Pakistan as a private limited company in October 1965. In November 1993, the Company was converted into a public limited company. Its shares are quoted on the Pakistan Stock Exchange. The Company is principally engaged in the manufacture of pharmaceutical and other consumer products. The registered office of the Company is situated at 1st Floor, N.I.C. Building, Abbasi Shaheed Road, Karachi.International Brands Limited is the holding company, which holds 56.60% shareholding in the Company.
Following are the subsidiary companies:
Principal place of business
Effective %age of holding
September 30, 2019
June 30, 2019
Listed Company- IBL HealthCare Limited
Pakistan
74.19% 74.19%Unlisted Companies- Searle Pharmaceuticals (Private) Limited 100.00% 100.00%- Searle Laboratories (Private) Limited 100.00% 100.00%- Searle Biosciences (Private) Limited 100.00% 100.00%- IBL Identity (Private) Limited 100.00% 100.00%- IBL Future Technologies (Pvt) Limited 100.00% 100.00%- Nextar Pharma (Private) Limited 87.20% 87.20%
The Company effectively holds 87.20% (June 30, 2019: 87.20%) shareholding in Nextar Pharma (Private) Limited through Searle Biosciences (Private) Limited.
2. BASIS OF PREPARATION
These unconsolidated condensed interim financial statements have been prepared in accordance with the accounting and reporting standards as applicable in Pakistan for interim financial reporting. The accounting and reporting standards as applicable in Pakistan for interim financial reporting comprise of:- International Accounting Standard (IAS) 34, Interim Financial Reporting, issued by the International Accounting Standards Board (IASB) as notified under the Companies Act, 2017; and
- Provisions of and directives issued under the Companies Act, 2017Where the provisions of and directives issued under the Companies Act, 2017 differ with the requirements of IAS 34, the provisions of and directives issued under the Companies Act, 2017 have been followed.
These unconsolidated condensed interim financial statements do not include all the information required for full financial statements and should be read in conjunction with the annual financial statements for the year ended June 30, 2019.

12 Quarterly Report September 2019
2.1 Changes in accounting standards, interpretations and pronouncements
a) Standards, interpretations and amendments to published approved accounting standards that are effective and relevantIFRS 9 ‘Financial instruments’ - This standard replaces the guidance in lAS 39. It includes requirements on the classification and measurement of financial assets and liabilities; it also includes an expected credit loss model that replaces the current incurred loss impairment model.IFRS 15 ‘Revenue from contracts with customers’ - IFRS 15 replaces the previous revenue standards: lAS 18 Revenue, lAS 11 Construction Contracts, and the related interpretations on revenue recognition.IFRS 15 introduces a single five-step model for revenue recognition and establishes a comprehensive framework for recognition of revenue from contracts with customers based on a core principle that an entity should recognise revenue representing the transfer of promised goods or services to customers in an amount that reflects the consideration to which the entity expects to be entitled in exchange for those goods or services.
b) Standards, interpretations and amendments to published approvedaccounting standards that are not yet effective but relevant
The following is the new standard, amendment to existing approved accounting standards and new interpretations that will be effective for the periods beginning on or after July 1, 2019 that may have an impact on the financial statements of the Company.IFRS 16 ‘Leases’ - IFRS 16 replaces the previous lease standard: IAS 17 Leases. It will result in almost all leases being recognised on the statement of financial position, as the distinction between operating and finance leases is removed. Under the new standard, an asset (the right to use the leased item) and a financial liability to pay rentals are recognsied. The only exceptions are short term and low value leases. Further, IFRS 9 ‘Financial Instruments’ (previously applicable from annual periods beginning on or after July 1, 2018). This standard replaces the guidance in IAS 39. It includes requirements on the classification and measurement of financial assets and liabilities; it also includes an expected credit losses model that replaces the current incurred loss impairment model. The management is in the process of assessing the impact of changes laid down by these standards on its financial statements.
3. SIGNIFICANT ACCOUNTING INFORMATION AND POLICIES
The accounting policies and method of computations adopted in the preparation of these unconsolidated condensed interim financial statements are the same as those applied in the preparation of the financial statements for the year ended June 30, 2019.
4. ACCOUNTING ESTIMATES AND JUDGEMENTS AND FINANCIAL RISK MANAGEMENT
The preparation of these unconsolidated condensed interim financial statements in conformity with approved accounting standards requires management to make estimates, assumptions and use judgements that affect the application of policies and reported amounts of assets and liabilities and income and expenses. Estimates, assumptions and judgements are continually evaluated and based on historical experience and other factors, including reasonable expectations of future events. Revisions to accounting estimates are recognised prospectively commencing from the period of revision.
NOTES TO THE UNCONSOLIDATED CONDENSED INTERIMFINANCIAL STATEMENTSFor the period ended September 30, 2019 - Unaudited
13
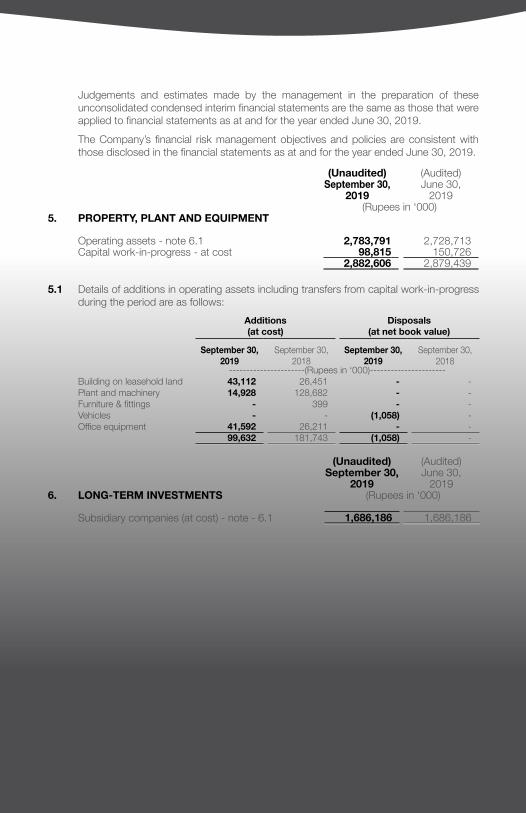
Judgements and estimates made by the management in the preparation of these unconsolidated condensed interim financial statements are the same as those that were applied to financial statements as at and for the year ended June 30, 2019.The Company’s financial risk management objectives and policies are consistent with those disclosed in the financial statements as at and for the year ended June 30, 2019.
(Unaudited) (Audited)September 30, June 30,
2019 2019 (Rupees in ‘000)
5. PROPERTY, PLANT AND EQUIPMENT
Operating assets - note 6.1 2,783,791 2,728,713 Capital work-in-progress - at cost 98,815 150,726
2,882,606 2,879,439
5.1 Details of additions in operating assets including transfers from capital work-in-progress during the period are as follows:
Additions (at cost)
Disposals (at net book value)
September 30, 2019
September 30, 2018
September 30, 2019
September 30, 2018
----------------------(Rupees in ‘000)----------------------Building on leasehold land 43,112 26,451 - - Plant and machinery 14,928 128,682 - - Furniture & fittings - 399 - - Vehicles - - (1,058) - Office equipment 41,592 26,211 - -
99,632 181,743 (1,058) -
(Unaudited) (Audited)September 30, June 30,
2019 20196. LONG-TERM INVESTMENTS (Rupees in ‘000)
Subsidiary companies (at cost) - note - 6.1 1,686,186 1,686,186
14 Quarterly Report September 2019
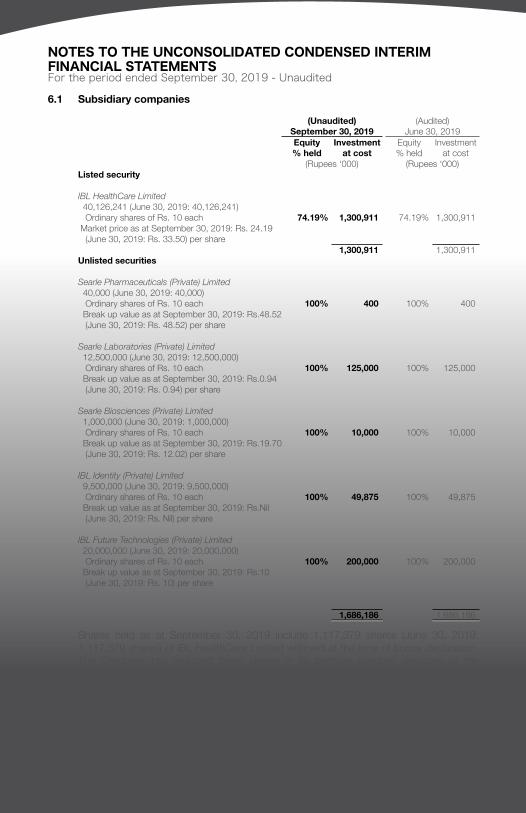
6.1 Subsidiary companies
(Unaudited) (Audited)September 30, 2019 June 30, 2019Equity Investment Equity Investment% held at cost % held at cost
(Rupees ‘000) (Rupees ‘000)Listed security
IBL HealthCare Limited 40,126,241 (June 30, 2019: 40,126,241) Ordinary shares of Rs. 10 each 74.19% 1,300,911 74.19% 1,300,911 Market price as at September 30, 2019: Rs. 24.19 (June 30, 2019: Rs. 33.50) per share
1,300,911 1,300,911 Unlisted securities
Searle Pharmaceuticals (Private) Limited 40,000 (June 30, 2019: 40,000) Ordinary shares of Rs. 10 each 100% 400 100% 400 Break up value as at September 30, 2019: Rs.48.52 (June 30, 2019: Rs. 48.52) per share
Searle Laboratories (Private) Limited 12,500,000 (June 30, 2019: 12,500,000) Ordinary shares of Rs. 10 each 100% 125,000 100% 125,000 Break up value as at September 30, 2019: Rs.0.94 (June 30, 2019: Rs. 0.94) per share
Searle Biosciences (Private) Limited 1,000,000 (June 30, 2019: 1,000,000) Ordinary shares of Rs. 10 each 100% 10,000 100% 10,000 Break up value as at September 30, 2019: Rs.19.70 (June 30, 2019: Rs. 12.02) per share
IBL Identity (Private) Limited 9,500,000 (June 30, 2019: 9,500,000) Ordinary shares of Rs. 10 each 100% 49,875 100% 49,875 Break up value as at September 30, 2019: Rs.Nil (June 30, 2019: Rs. Nil) per share
IBL Future Technologies (Private) Limited 20,000,000 (June 30, 2019: 20,000,000) Ordinary shares of Rs. 10 each 100% 200,000 100% 200,000 Break up value as at September 30, 2019: Rs.10 (June 30, 2019: Rs. 10) per share
1,686,186 1,686,186
Shares held as at September 30, 2019 include 1,117,379 shares (June 30, 2019: 1,117,379 shares) of IBL HealthCare Limited withheld at the time of bonus declaration. The Company has included these shares in its portfolio pending decisions of the Honourable High Court of Sindh on petitions filed by Company in respect of tax on bonus shares.
NOTES TO THE UNCONSOLIDATED CONDENSED INTERIMFINANCIAL STATEMENTSFor the period ended September 30, 2019 - Unaudited

15
(Unaudited) (Audited)September 30, June 30,
2019 20197. TRADE RECEIVABLES (Rupees in ‘000)
Considered good
- Export receivables - secured 439,894 307,294
- Due from related parties, unsecured - note 7.1 4,339,695 3,839,765
- others - unsecured 859,031 719,073 5,638,620 4,866,132
Considered doubtful 152,003 152,003
Less: Provision for doubtful debts (152,003) (152,003) - -
5,638,620 4,866,132
7.1 These are stated net of amount payable to IBL Operations (Private) Limited, United Brands Limited and IBL Logistics (Private) Limited - associated companies amounting to Rs. 385.53 million (2019: Rs. 284.97 million), Rs. 15.54 million (2019: Rs. 15.36 million) and Rs. 1.01 million (2019: Rs. 1.01 million) respectively.
8. LOANS AND ADVANCES
8.1 This includes interest free loan provided to IBL Identity (Private) Limited - wholly owned subsidiary amounting to Rs. 3,081.63 million as at September 30, 2019 (June 30, 2019: Rs. 3,046.13 million).
8.2 This represents advance to Searle Biosciences (Private) Limited and Searle Laboratories (Private) limited - wholly owned subsidiaries amounting to Rs. 972.2 million (June 30, 2019: Rs. 975.6 million), Rs. 11.9 million (June 30, 2019: Rs. 6.5 million) respectively. These advances are provided for the purpose of financial assistance and are settled in the ordinary course of business.
16 Quarterly Report September 2019
(Unaudited) (Audited)September 30, June 30,
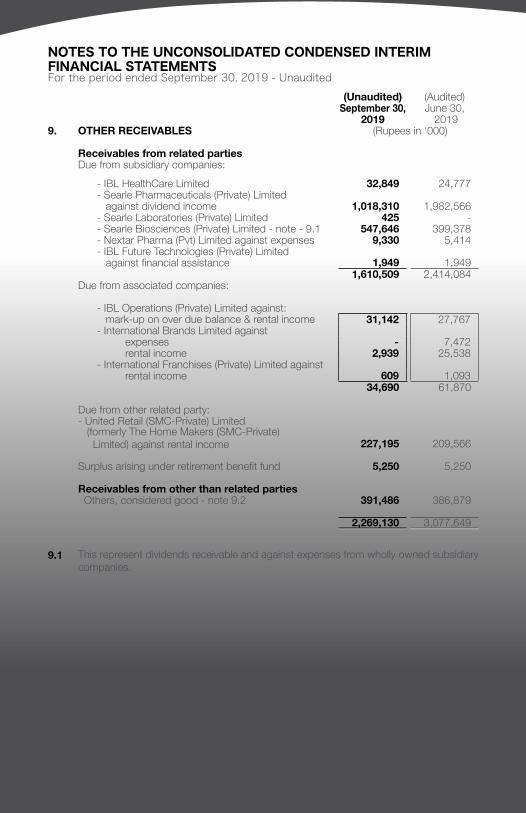
2019 20199. OTHER RECEIVABLES (Rupees in ‘000)
Receivables from related parties Due from subsidiary companies:
- IBL HealthCare Limited 32,849 24,777 - Searle Pharmaceuticals (Private) Limited against dividend income 1,018,310 1,982,566 - Searle Laboratories (Private) Limited 425 - - Searle Biosciences (Private) Limited - note - 9.1 547,646 399,378 - Nextar Pharma (Pvt) Limited against expenses 9,330 5,414 - IBL Future Technologies (Private) Limited against financial assistance 1,949 1,949
1,610,509 2,414,084 Due from associated companies:
- IBL Operations (Private) Limited against: mark-up on over due balance & rental income 31,142 27,767 - International Brands Limited against
expenses - 7,472 rental income 2,939 25,538
- International Franchises (Private) Limited against rental income 609 1,093
34,690 61,870
Due from other related party:- United Retail (SMC-Private) Limited (formerly The Home Makers (SMC-Private) Limited) against rental income 227,195 209,566
Surplus arising under retirement benefit fund 5,250 5,250
Receivables from other than related parties Others, considered good - note 9.2 391,486 386,879
2,269,130 3,077,649
9.1 This represent dividends receivable and against expenses from wholly owned subsidiary companies.
NOTES TO THE UNCONSOLIDATED CONDENSED INTERIMFINANCIAL STATEMENTSFor the period ended September 30, 2019 - Unaudited

17
10. SHARE CAPITAL
Authorised share capital
(Unaudited) (Audited) (Unaudited) (Audited)September 30, June 30, September 30, June 30,
2019 2019 2019 2019 (Rupees in ‘000)
Ordinary shares of300,000,000 300,000,000 Rs. 10 each 3,000,000 3,000,000
Issued, subscribed and paid up capital
(Unaudited) (Audited)September
30, 2019June
30, 2019 (Number of shares)
12,553,074 12,553,074 Shares allotted for 125,531 125,531 consideration paid in cash
24,000 24,000 Shares allotted for 240 240 consideration other than cash
199,848,171 199,848,171 Shares allotted as 1,998,482 1,998,482 bonus shares
212,425,245 212,425,245 2,124,253 2,124,253
11. TRADE AND OTHER PAYABLES
Creditors - note 11.1 1,457,045 2,531,434 Bills payable in foreign currency 1,035,152 708,946 Royalty payable 16,503 23,966 Accrued liabilities 1,218,510 801,222 Payable to provident fund 9,801 8,619 Advance from customers - unsecured 34,695 22,415 Accrued mark-up 152,890 109,473 Taxes deducted at source and payable to statutory authorities 75,428 96,147 Workers’ Profit Participation Fund 188,514 149,417 Workers’ Welfare Fund 28,798 16,342 Other liabilities 62,758 61,499
4,280,094 4,529,480
11.1 This includes amount payable to Searle Pharmaceutical (Private) Limited - wholly owned subsidiary amounting to Rs. 1,099.36 million (June 30, 2019: Rs. 2,192.65 million) on account of toll manufacturing services. This also includes payable to Searle Laboratories (Private) Limited - wholly owned subsidiary amounting to Rs. 9.13 million (June 30, 2019: Rs. 9.13 million).

18 Quarterly Report September 2019
(Unaudited) (Audited)September 30, June 30,
2019 201912. BORROWINGS (Rupees in ‘000)
SecuredRunning finances under mark-up arrangements - note - 12.1 3,164,812 3,544,776Export re-finance 210,000 210,000
3,374,812 3,754,776 UnsecuredBorrowing from IBL Future Technologies (Private) Limited - note 12.2 200,000 200,000
3,574,812 3,954,776
12.1 The Company has entered into running finance under mark-up arrangements from various banks amounting to Rs. 4,175 million (June 30, 2019: Rs. 4,175 million) which include financing facilities obtained under Islamic mode amounting to Rs. 3,525 million (June 30, 2019: Rs. 3,525 million). The arrangements are secured jointly by registered mortgage of Rs. 589.44 million (June 30, 2019 : Rs. 589.44 million) of immovable property together with joint pari passu charge on all current assets of the Company to the extent of Rs. 4,071 million (June 30, 2019: Rs. 4,071 million) in favour of Standard Chartered Bank (Pakistan) Limited (the lead bank).
The rates of mark-up ranged between 13.34% to 13.96% (June 30, 2019: 6.9% to 12.7%) per annum.
12.2 This represents interest free loan obtained from IBL Future Technologies (Private) Limited - wholly owned subsidiary and is repayable on demand.
13. UNPAID DIVIDEND
This includes dividend on bonus shares amounting to Rs. 96.69 million withheld pertaining to 125 shareholders, on which stay from the Honourable High Court of Sindh has been obtained. The amount further includes dividend withheld amounting to Rs. 15.37 million due to non-compliance of certain legal / regulatory requirements by the shareholders.
14. CONTINGENCIES AND COMMITMENTS
14.1 Contingencies
14.1.1 There has been no significant change in the status of contingencies as reported in the note 25 and 33.4 of annual audited financial statements of the Company for the year ended June 30, 2019.
NOTES TO THE UNCONSOLIDATED CONDENSED INTERIMFINANCIAL STATEMENTSFor the period ended September 30, 2019 - Unaudited
19
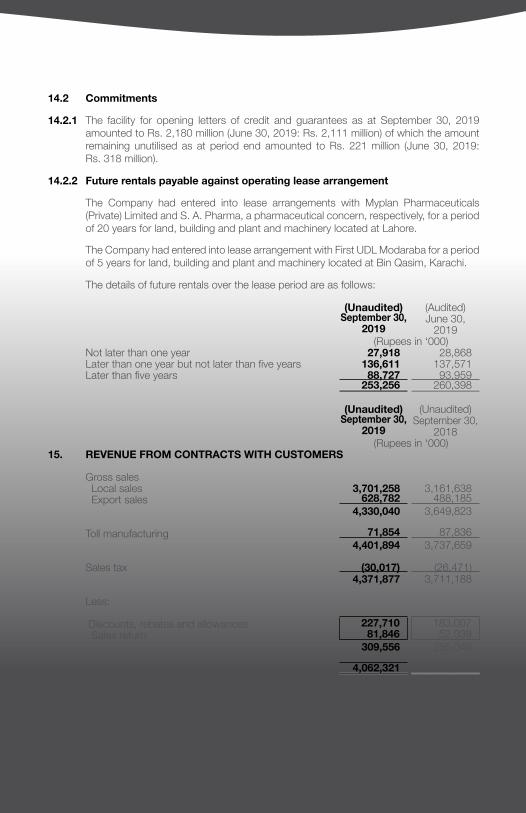
14.2 Commitments
14.2.1 The facility for opening letters of credit and guarantees as at September 30, 2019 amounted to Rs. 2,180 million (June 30, 2019: Rs. 2,111 million) of which the amount remaining unutilised as at period end amounted to Rs. 221 million (June 30, 2019: Rs. 318 million).
14.2.2 Future rentals payable against operating lease arrangement
The Company had entered into lease arrangements with Myplan Pharmaceuticals (Private) Limited and S. A. Pharma, a pharmaceutical concern, respectively, for a period of 20 years for land, building and plant and machinery located at Lahore.
The Company had entered into lease arrangement with First UDL Modaraba for a period of 5 years for land, building and plant and machinery located at Bin Qasim, Karachi.
The details of future rentals over the lease period are as follows:
(Unaudited) (Audited)September 30, June 30,
2019 2019 (Rupees in ‘000)
Not later than one year 27,918 28,868 Later than one year but not later than five years 136,611 137,571 Later than five years 88,727 93,959
253,256 260,398
(Unaudited) (Unaudited)September 30, September 30,
2019 2018 (Rupees in ‘000)
15. REVENUE FROM CONTRACTS WITH CUSTOMERS
Gross sales Local sales 3,701,258 3,161,638 Export sales 628,782 488,185
4,330,040 3,649,823
Toll manufacturing 71,854 87,836 4,401,894 3,737,659
Sales tax (30,017) (26,471) 4,371,877 3,711,188
Less:
Discounts, rebates and allowances 227,710 183,007 Sales return 81,846 52,039
309,556 235,046
4,062,321 3,476,142
20 Quarterly Report September 2019
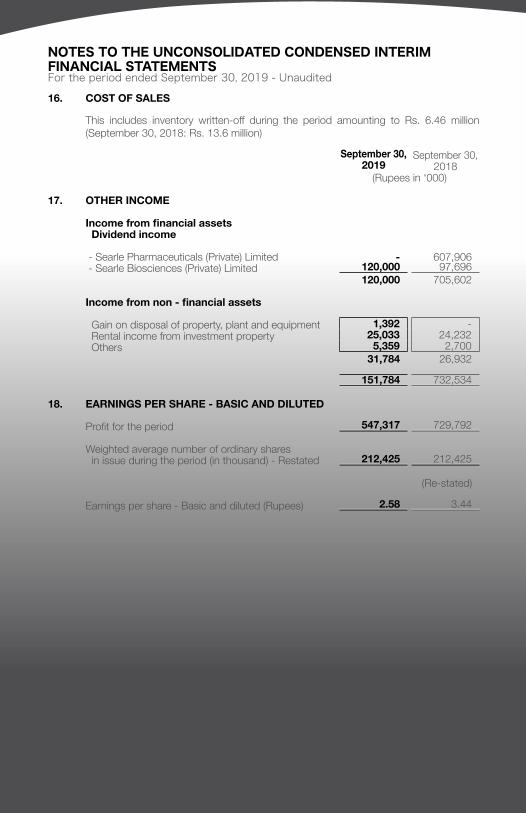
16. COST OF SALES
This includes inventory written-off during the period amounting to Rs. 6.46 million (September 30, 2018: Rs. 13.6 million)
September 30, September 30,2019 2018
(Rupees in ‘000)
17. OTHER INCOME
Income from financial assets Dividend income
- Searle Pharmaceuticals (Private) Limited - 607,906 - Searle Biosciences (Private) Limited 120,000 97,696
120,000 705,602
Income from non - financial assets
Gain on disposal of property, plant and equipment 1,392 - Rental income from investment property 25,033 24,232 Others 5,359 2,700
31,784 26,932
151,784 732,534
18. EARNINGS PER SHARE - BASIC AND DILUTED
Profit for the period 547,317 729,792
Weighted average number of ordinary shares in issue during the period (in thousand) - Restated 212,425 212,425
(Re-stated)
Earnings per share - Basic and diluted (Rupees) 2.58 3.44
NOTES TO THE UNCONSOLIDATED CONDENSED INTERIMFINANCIAL STATEMENTSFor the period ended September 30, 2019 - Unaudited

21
September 30, September 30,2019 2018
(Rupees in ‘000)19. CASH GENERATED FROM OPERATIONS
Profit before income tax 724,361 767,771
Add adjustments for non-cash charges and other items Depreciation 58,127 47,055 Gain on disposal of property, plant and equipment (1,392) - Amortisation 11,047 10,579 Provision for retirement benefits obligation 1,344 900 Financial cost 135,260 97,762
Profit before working capital changes 928,747 924,067
Effect on cash flow due to working capital changes
(Increase) / decrease in current assets
Inventories (226,183) 85,644 Trade receivables (772,488) (791,629) Loans and advances (21,124) (504,970) Trade deposits and short-term prepayments (12,949) (23,241) Other receivables 808,519 (27,979) Sales tax 22,166 (12,721)
(202,059) (1,274,896)Increase / ( decrease ) in current liabilities
Trade and other payables (292,803) 328,785
(292,803) 328,785
Cash flows generated from operations 433,885 (22,044)
20. CASH AND CASH EQUIVALENTS
Cash and bank balances 7,366 19,524 Short term borrowings (3,164,812) (2,581,175)
(3,157,446) (2,561,651)
22 Quarterly Report September 2019
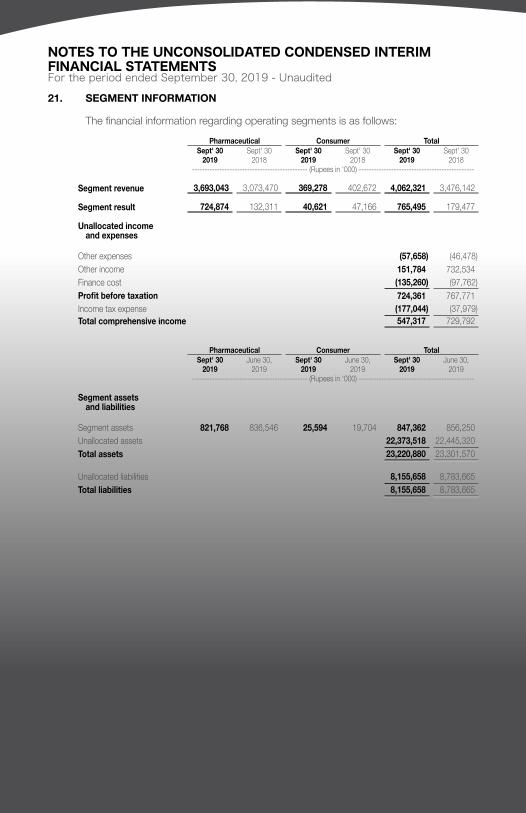
21. SEGMENT INFORMATION
The financial information regarding operating segments is as follows:
Pharmaceutical Consumer TotalSept' 30 Sept' 30 Sept' 30 Sept' 30 Sept' 30 Sept' 30
2019 2018 2019 2018 2019 2018---------------------------------------------- (Rupees in ‘000) ----------------------------------------------
Segment revenue 3,693,043 3,073,470 369,278 402,672 4,062,321 3,476,142
Segment result 724,874 132,311 40,621 47,166 765,495 179,477
Unallocated income and expenses
Other expenses (57,658) (46,478)Other income 151,784 732,534 Finance cost (135,260) (97,762)Profit before taxation 724,361 767,771 Income tax expense (177,044) (37,979)Total comprehensive income 547,317 729,792
Pharmaceutical Consumer TotalSept' 30 June 30, Sept' 30 June 30, Sept' 30 June 30,
2019 2019 2019 2019 2019 2019---------------------------------------------- (Rupees in ‘000) ----------------------------------------------
Segment assetsand liabilities
Segment assets 821,768 836,546 25,594 19,704 847,362 856,250 Unallocated assets 22,373,518 22,445,320 Total assets 23,220,880 23,301,570
Unallocated liabilities 8,155,658 8,783,665 Total liabilities 8,155,658 8,783,665
NOTES TO THE UNCONSOLIDATED CONDENSED INTERIMFINANCIAL STATEMENTSFor the period ended September 30, 2019 - Unaudited

23
22. TRANSACTIONS WITH RELATED PARTIES
The following transactions were carried out with related parties during the period :
September 30, September 30,2019 2018
Nature of relationship Nature of transactions (Rupees in ‘000)
Holding company - Corporate service charges 60,000 48,000 - Rent income 1,669 2,276 - Income from provision of amenities 1,270 1,905
Subsidiaries- Revenue 229,364 45,617 - Outside processing charges - 873,838 - Dividend income 120,000 705,602 - Short term loan given 35,500 189,950 - Advance(received back)/given (2,900) 10,800
Associated companies- Revenue 3,091,743 2,775,860 - Salaries and wages 70 130 - Purchases 245 843 - Carriage and duties 1,518 10,512 - Discounts claimed 76,265 80,818 - Rent expense 2,547 1,066 - Rent income 16,504 15,268 - Stock claims 18,778 42,030 - Internet services 281 1,109 - Architect fee 2,375 - - Income from Provision of Amenities 9,474 1,906 - Donations 4,296 5,300 - Purchases of ERP Hardware - 25,072 - Incentive on Searle Focus Prooducts 696 1,616 - Repair & maintenance 859 - - Merchandise expense 2,203 18,653 - Others 3,400 -
Staff retirement benefits- Contributions to
Provident Fund 29,213 26,174 - Benefits paid 12,375 37,429
Key managementemployees compensation - Salaries and other
employee benefits 41,978 42,090 - Contributions to
Provident Fund 3,556 4,212 - Directors’ fees - 4 - Sale of goods 24 -

24 Quarterly Report September 2019
22.1 The status of outstanding balances with related parties as at September 30, 2019 is included in the respective notes to the financial statements. These are settled in the ordinary course of business.
23. CORRESPONDING FIGURES
Corresponding figures have been rearranged for better presentation and comparison purpose, wherever considered necessary. However, there is no material reclassification.
24. DATE OF AUTHORISATION FOR ISSUE
These unconsolidated condensed interim financial statements were approved and authorised for issue by the Board of Directors of the Company on October 28, 2019.
Chief Executive Officer Director Chief Financial Officer
NOTES TO THE UNCONSOLIDATED CONDENSED INTERIMFINANCIAL STATEMENTSFor the period ended September 30, 2019 - Unaudited

FinancialConsolidated Condensed Interim
Statements
Directors’ Report to the Members 26
Directors’ Report to the Members (Urdu) 29
Consolidated Condensed Interim Statement of Financial Position 30
Consolidated Condensed Interim Statement of Profit or Loss and Other Comprehensive Income 31
Consolidated Condensed Interim Statement of Changes in Equity 32
Consolidated Condensed Interim Statement of Cash Flows 33
Selected Notes to the Consolidated Condensed Interim Financial Statement - Unaudited 34
Contents
26 Quarterly Report September 2019
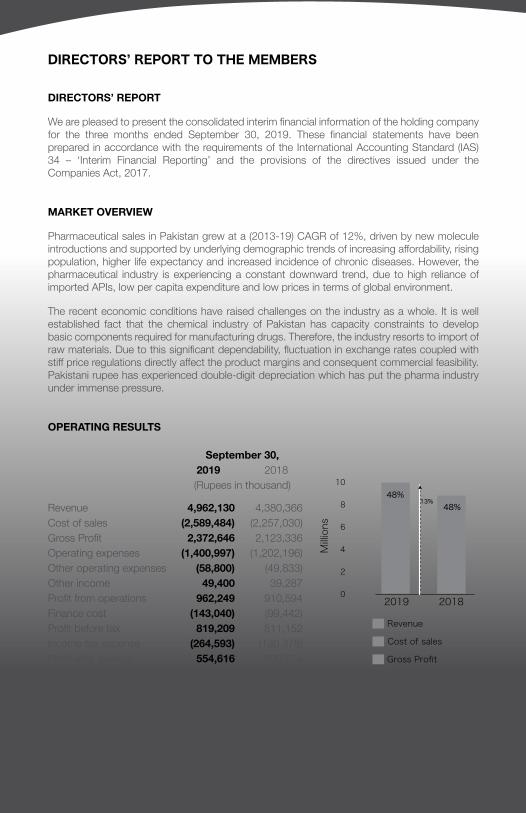
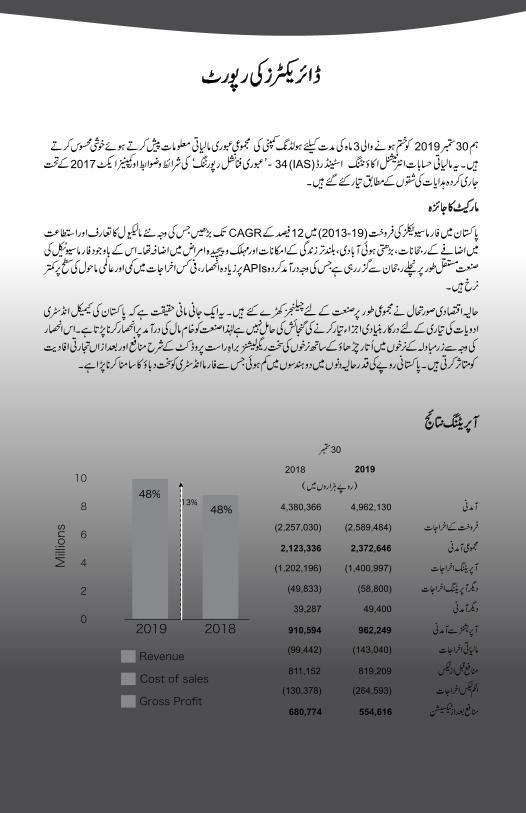
DIRECTORS’ REPORT
We are pleased to present the consolidated interim financial information of the holding company for the three months ended September 30, 2019. These financial statements have been prepared in accordance with the requirements of the International Accounting Standard (IAS) 34 – ‘Interim Financial Reporting’ and the provisions of the directives issued under the Companies Act, 2017.
MARKET OVERVIEW
Pharmaceutical sales in Pakistan grew at a (2013-19) CAGR of 12%, driven by new molecule introductions and supported by underlying demographic trends of increasing affordability, rising population, higher life expectancy and increased incidence of chronic diseases. However, the pharmaceutical industry is experiencing a constant downward trend, due to high reliance of imported APIs, low per capita expenditure and low prices in terms of global environment.
The recent economic conditions have raised challenges on the industry as a whole. It is well established fact that the chemical industry of Pakistan has capacity constraints to develop basic components required for manufacturing drugs. Therefore, the industry resorts to import of raw materials. Due to this significant dependability, fluctuation in exchange rates coupled with stiff price regulations directly affect the product margins and consequent commercial feasibility. Pakistani rupee has experienced double-digit depreciation which has put the pharma industry under immense pressure.
OPERATING RESULTS
September 30,2019 2018(Rupees in thousand)
Revenue 4,962,130 4,380,366 Cost of sales (2,589,484) (2,257,030)Gross Profit 2,372,646 2,123,336 Operating expenses (1,400,997) (1,202,196)Other operating expenses (58,800) (49,833)Other income 49,400 39,287 Profit from operations 962,249 910,594 Finance cost (143,040) (99,442)Profit before tax 819,209 811,152 Income tax expense (264,593) (130,378)Profit after taxation 554,616 680,774
Searle group of companies have always focused on improving the lives of patients by offering quality healthcare solutions. We have built a firm growing position by putting the benefit of patients and stakeholders, our fundamental priority and are proud of the impact of our efforts.
During the period ended September 30, 2019, the holding company’s financial performance was affected by the exchange rate fluctuations. However, despite the challenging economic conditions, Searle group of companies managed to continue its momentum.
DIRECTORS’ REPORT TO THE MEMBERS
0
2
4
6
8
10
Millions
48%48%
2019 2018
Revenue
Cost of sales
Gross Profit
Revenue
Cost of sales
Gross Profit
13%
012345678
Millions
48%
33%
2019 2018
17%
27
Financial highlights are summarized below:
• Net sales of the Company grew by 13% to Rs 4.96 billion.• Gross profit margin remained at 48%.• Operating profit margin was 19%• Profit before and after taxation was 17% and 11% respectively.
EARNINGS PER SHARE
Basic earnings per share after taxation for the period was Rs. 2.57 (2018: Rs. 3.18).
There is no dilution effect on the basic earnings per share of the holding company, as the holding company has no convertible dilutive potential ordinary shares outstanding as at September 30, 2019.
FUTURE OUTLOOK
Moving forward, we are focusing on enhancing the share of specialty generic branded portfolio and targeting differentiated products. It is also pertinent to mention that Searle has an organic pipeline of over 200 products in different stages of the regulatory approval process.
Further, due to overly regulated drug pricing mechanism, volatility in retail prices is a concern of paramount importance for us. Delays in new product approvals also pose key threats for the industry as a whole. However, with the change in recent political scenario, we will have to wait to assess the future economic trends and modify our strategies accordingly. For the longer run, Searle is focusing on emerging portfolios including, bio-similars, medical devices, nutraceuticals and genome sciences.
ACKNOWLEDGEMENT
At Searle group of companies, we all are emotionally motivated and willing to contribute enthusiastically on continuous basis. Same is the case with our partners, suppliers and customers, for which we are thankful and expect the same zeal and zest for future contribution. We assure, Searle will continue to work hard to provide long term sustainable growth to everyone associated with us.
For and on behalf of the Board
Syed Nadeem Ahmed Zubair Razzak PalwalaChief Executive Officer Director
Karachi : October 28, 2019

28 Quarterly Report September 2019
29
0
2
4
6
8
10
Millions
48%48%
2019 2018
Revenue
Cost of sales
Gross Profit
Revenue
Cost of sales
Gross Profit
13%
012345678
Millions
48%
33%
2019 2018
17%

30 Quarterly Report September 2019
CONSOLIDATED CONDENSED INTERIM STATEMENT OF FINANCIAL POSITIONAs at September 30, 2019
Chief Executive Officer Director Chief Financial Officer
(Un-audited) (Audited)September 30, June 30,
2019 2019ASSETS Note (Rupees in ‘000)Non-current assetsProperty, plant and equipment 5 3,830,163 3,786,177 Investment properties - at cost 2,771,202 2,724,116 Intangible assets 353,898 365,268 Long-term loans and advances 258 270 Long-term deposits 16,210 13,624
6,971,731 6,889,455 Current assetsInventories 3,272,303 2,953,902 Trade receivables 6 7,283,006 6,209,817 Loans and advances 7 2,990,526 2,944,181 Trade deposits and short-term prepayments 117,948 91,074 Interest accrued 5,604 2,970 Other receivables 8 881,930 787,859 Taxation - payments less provision 902,220 1,000,760 Tax refunds due from government - Sales tax 39,350 59,527 Cash and bank balances 9 57,714 262,054
15,550,601 14,312,144 Asset classified as ‘Held for Sale’ 75,500 75,500
Total assets 22,597,832 21,277,099
EQUITY AND LIABILITIESShare capital and reservesShare capital 10 2,124,253 2,124,253 Unappropriated profit 8,151,751 7,603,678 General reserve 280,251 280,251 Share premium 1,630,974 1,630,974 Revaluation surplus on property, plant and equipment 1,435,815 1,437,936 Attributable to owners of The Searle Company Limited - Holding Company 13,623,044 13,077,092 Non-controlling interests 450,801 442,137
14,073,845 13,519,229 LIABILITIESNon-current liabilitiesLong term borrowings 4,664 4,664 Deferred tax liabilities 96,581 96,581 Retirement benefit obligations 57,164 55,820
158,409 157,065 Current liabilities
Trade and other payables 11 4,642,116 3,520,230 Borrowings 12 3,565,202 3,922,277 Unpaid dividend 110,667 110,667 Unclaimed dividend 47,593 47,631
8,365,578 7,600,805 Total liabilities 8,523,987 7,757,870 Contingencies and commitments 13
Total equity and liabilities 22,597,832 21,277,099
The annexed notes from 1 to 22 form an integral part of this consolidated condensed interim financial information
31
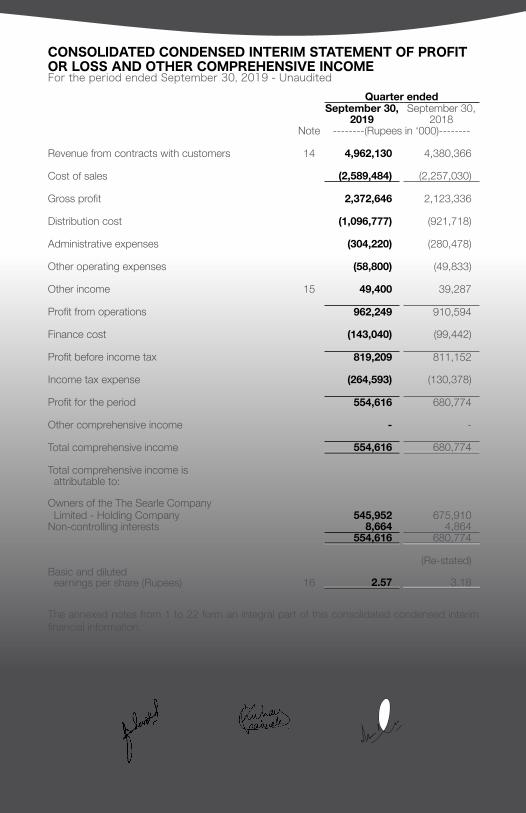
CONSOLIDATED CONDENSED INTERIM STATEMENT OF PROFIT OR LOSS AND OTHER COMPREHENSIVE INCOMEFor the period ended September 30, 2019 - Unaudited
Chief Executive Officer Director Chief Financial Officer
Quarter endedSeptember 30, September 30,
2019 2018Note --------(Rupees in ‘000)--------
Revenue from contracts with customers 14 4,962,130 4,380,366
Cost of sales (2,589,484) (2,257,030)
Gross profit 2,372,646 2,123,336
Distribution cost (1,096,777) (921,718)
Administrative expenses (304,220) (280,478)
Other operating expenses (58,800) (49,833)
Other income 15 49,400 39,287
Profit from operations 962,249 910,594
Finance cost (143,040) (99,442)
Profit before income tax 819,209 811,152
Income tax expense (264,593) (130,378)
Profit for the period 554,616 680,774
Other comprehensive income - -
Total comprehensive income 554,616 680,774
Total comprehensive income is attributable to:
Owners of the The Searle Company Limited - Holding Company 545,952 675,910 Non-controlling interests 8,664 4,864
554,616 680,774
(Re-stated)Basic and diluted earnings per share (Rupees) 16 2.57 3.18
The annexed notes from 1 to 22 form an integral part of this consolidated condensed interim financial information.

32 Quarterly Report September 2019
CONSOLIDATED CONDENSED INTERIM STATEMENT OF CHANGES IN EQUITY For the period ended September 30, 2019 - Unaudited
Attributable to the owners of the Holding CompanyCapital reserves Revenue reserves
Share capital Share
premium
Issue of bonus shares
Revaluation surplus on Property, plant &
equipment
General reserve
Unappro-priated profits
Sub-Total reserves
Non- Controlling
interestTotal
------------------------------------------------------------------ Rupees in ‘000 ------------------------------------------------------------------
Balance as at July 01, 2018 1,847,177 1,630,974 - 675,001 280,251 6,566,207 9,152,433 451,963 11,451,573
Transferred from surplus on revaluation offixed assets on account of incremental - - - (279) - 279 - - - depreciation for the period (net of tax)
- - - - - 675,910 675,910 4,864 680,774 Total comprehensive income for the period
Balance as at September 30, 2018 1,847,177 1,630,974 - 674,722 280,251 7,242,396 9,828,343 456,827 12,132,347
Balance as at July 01, 2019 2,124,253 1,630,974 - 1,437,936 280,251 7,603,678 10,952,839 442,137 13,519,229
Total comprehensive income for the period - - - - - 545,952 545,952 8,664 554,616
Transferred from surplus on revaluation offixed assets - net of deferred taxation:- incremental depreciation for the period - - - (2,121) - 2,121 - - -
Balance as at September 30, 2019 2,124,253 1,630,974 - 1,435,815 280,251 8,151,751 11,498,791 450,801 14,073,845
The annexed notes from 1 to 22 form an integral part of this consolidated condensed interim financial information.
Chief Executive Officer Director Chief Financial Officer
33
September 30, 2019
September 30, 2018
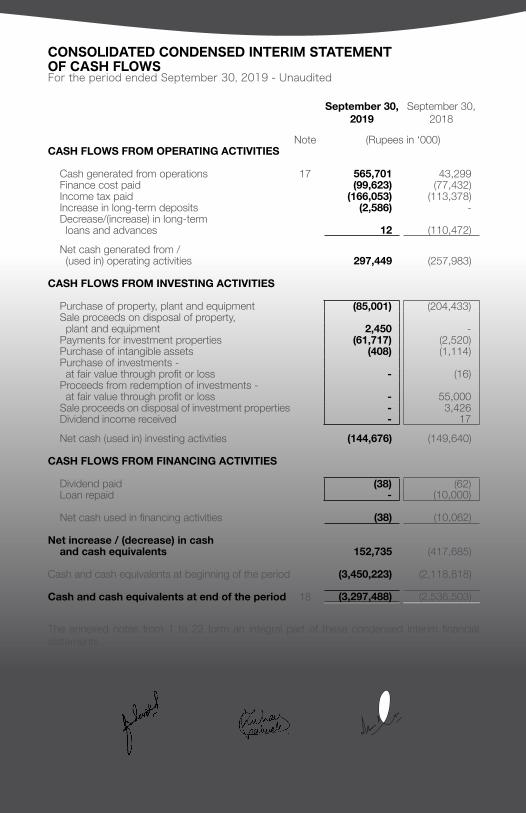
Note (Rupees in ‘000)CASH FLOWS FROM OPERATING ACTIVITIES
Cash generated from operations 17 565,701 43,299 Finance cost paid (99,623) (77,432)Income tax paid (166,053) (113,378)Increase in long-term deposits (2,586) - Decrease/(increase) in long-term loans and advances 12 (110,472)
Net cash generated from / (used in) operating activities 297,449 (257,983)
CASH FLOWS FROM INVESTING ACTIVITIES
Purchase of property, plant and equipment (85,001) (204,433)Sale proceeds on disposal of property, plant and equipment 2,450 - Payments for investment properties (61,717) (2,520)Purchase of intangible assets (408) (1,114)Purchase of investments - at fair value through profit or loss - (16)Proceeds from redemption of investments - at fair value through profit or loss - 55,000 Sale proceeds on disposal of investment properties - 3,426 Dividend income received - 17
Net cash (used in) investing activities (144,676) (149,640)
CASH FLOWS FROM FINANCING ACTIVITIES
Dividend paid (38) (62)Loan repaid - (10,000)
Net cash used in financing activities (38) (10,062)
Net increase / (decrease) in cashand cash equivalents 152,735 (417,685)
Cash and cash equivalents at beginning of the period (3,450,223) (2,118,818)
Cash and cash equivalents at end of the period 18 (3,297,488) (2,536,503)
The annexed notes from 1 to 22 form an integral part of these condensed interim financial statements.
CONSOLIDATED CONDENSED INTERIM STATEMENT OF CASH FLOWSFor the period ended September 30, 2019 - Unaudited
Chief Executive Officer Director Chief Financial Officer

34 Quarterly Report September 2019
NOTES TO THE CONSOLIDATED CONDENSED INTERIM FINANCIAL STATEMENTSFor the period ended September 30, 2019 - Unaudited1. LEGAL STATUS AND OPERATIONS
The Searle Company Limited (the Company) was incorporated in Pakistan as a private limited company in October 1965. In November 1993, the Company was converted into a public limited company. Its shares are quoted on the Pakistan Stock Exchange. The Company is principally engaged in the manufacture of pharmaceutical and other consumer products. The registered office of the Company is situated at 1st Floor, N.I.C. Building, Abbasi Shaheed Road, Karachi.International Brands Limited is the holding company, which holds 56.60% shareholding in the Company.
Following are the subsidiary companies:
Principal place of business
Effective %age of holding
September 30, 2019
June 30, 2019
Listed Company- IBL HealthCare Limited
Pakistan
74.19% 74.19%Unlisted Companies- Searle Pharmaceuticals (Private) Limited 100.00% 100.00%- Searle Laboratories (Private) Limited 100.00% 100.00%- Searle Biosciences (Private) Limited 100.00% 100.00%- IBL Identity (Private) Limited 100.00% 100.00%- IBL Future Technologies (Private) Limited 100.00% 100.00%- Nextar Pharma (Private) Limited 87.20% 87.20%
2. BASIS OF PREPARATION
These condensed consolidated interim financial statements have been prepared in accordance with the accounting and reporting standards as applicable in Pakistan for interim financial reporting. The accounting and reporting standards as applicable in Pakistan for interim financial reporting comprise of:- International Accounting Standard (IAS) 34, Interim Financial Reporting, issued
by the International Accounting Standards Board (IASB) as notified under the Companies Act, 2017; and
- Provisions of and directives issued under the Companies Act, 2017
Where the provisions of and directives issued under the Companies Act, 2017 differ with the requirements of IAS 34, the provisions of and directives issued under the Companies Act, 2017 have been followed.This consolidated condensed interim financial information does not include all information and disclosures required in the financial statements and should be read in conjunction with the financial statements of the Company for the year ended June 30, 2019.
2.1 Changes in accounting standards, interpretations and pronouncements
a) Standards, interpretations and amendments to published approvedaccounting standards that are effective and relevant
IFRS 9 ‘Financial instruments’ - This standard replaces the guidance in IAS 39. It includes requirements on the classification and measurement of financial assets and liabilities; it also includes an expected credit loss model that replaces the current incurred loss impairment model.

35
IFRS 15 ‘Revenue from contracts with customers’ - IFRS 15 replaces the previous revenue standards: lAS 18 Revenue, lAS 11 Construction Contracts, and the related interpretations on revenue recognition.IFRS 15 introduces a single five-step model for revenue recognition and establishes a comprehensive framework for recognition of revenue from contracts with customers based on a core principle that an entity should recognise revenue representing the transfer of promised goods or services to customers in an amount that reflects the consideration to which the entity expects to be entitled in exchange for those goods or services.
b) Standards, interpretations and amendments to published approvedaccounting standards that are not yet effective but relevant
The following are the new standards, amendments to existing approved accounting standards and new interpretations that will be effective for the periods beginning on or after July 1, 2019 that may have an impact on the financial statements of the Company.IFRS 16 ‘Leases’ - This standard is effective for periods beginning from or after January 1, 2019. IFRS 16 replaces the previous lease standard: IAS 17 Leases. It will result in almost all leases being recognised on the statement of financial position, as the distinction between operating and finance leases is removed. Under the new standard, an asset (the right to use the leased item) and a financial liability to pay rentals are recognised. The only exceptions are short term and low value leases.Further, IFRS 9 ‘Financial Instruments’ (previously applicable from annual periods beginning on or after July 1, 2018). This standard replaces the guidance in IAS 39. It includes requirements on the classification and measurement of financial assets and liabilities; it also includes an expected credit losses model that replaces the current incurred loss impairment model.
The management is in the process of assessing the impact of changes laid down by these standards on its financial statements.
3. SIGNIFICANT ACCOUNTING INFORMATION AND POLICIES
The accounting policies and method of computations adopted in the preparation of this consolidated condensed interim financial information are the same as those applied in the preparation of the financial statements for the year ended June 30, 2019.
4. ACCOUNTING ESTIMATES, JUDGEMENTS AND FINANCIAL RISK MANAGEMENT
The preparation of this consolidated condensed interim financial information in conformity with approved accounting standards requires management to make estimates, assumptions and use judgements that affect the application of policies and reported amounts of assets and liabilities and income and expenses. Estimates, assumptions and judgements are continually evaluated and based on historical experience and other factors, including reasonable expectations of future events. Revisions to accounting estimates are recognised prospectively commencing from the period of revision.Judgements and estimates made by the management in the preparation of this consolidated condensed interim financial information are the same as those that were applied to financial statements as at and for the year ended June 30, 2019.The Company’s financial risk management objectives and policies are consistent with those disclosed in the financial statements as at and for the year ended June 30, 2019.
36 Quarterly Report September 2019
(Unaudited) (Audited)September 30, June 30,
2019 2019 (Rupees in ‘000)
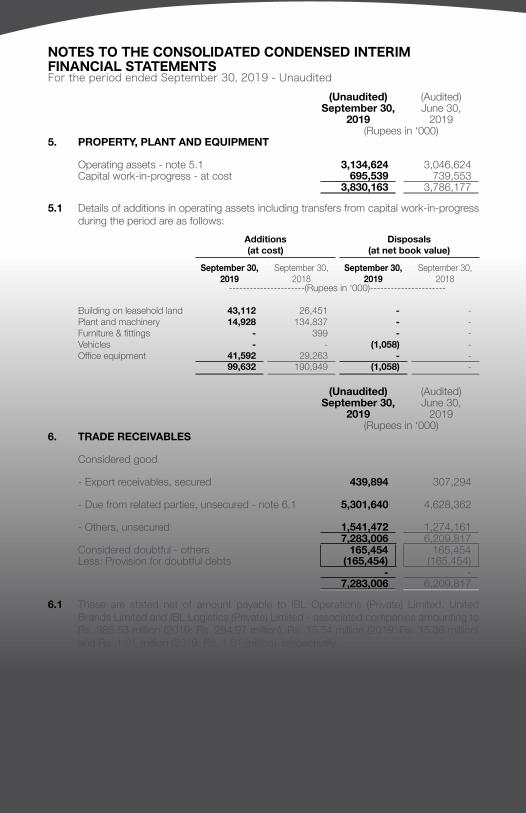
5. PROPERTY, PLANT AND EQUIPMENT
Operating assets - note 5.1 3,134,624 3,046,624 Capital work-in-progress - at cost 695,539 739,553
3,830,163 3,786,177
5.1 Details of additions in operating assets including transfers from capital work-in-progress during the period are as follows:
Additions (at cost)
Disposals (at net book value)
September 30, 2019
September 30, 2018
September 30, 2019
September 30, 2018
----------------------(Rupees in ‘000)----------------------
Building on leasehold land 43,112 26,451 - - Plant and machinery 14,928 134,837 - - Furniture & fittings - 399 - - Vehicles - - (1,058) - Office equipment 41,592 29,263 - -
99,632 190,949 (1,058) -
(Unaudited) (Audited)September 30, June 30,
2019 2019 (Rupees in ‘000)
6. TRADE RECEIVABLES
Considered good
- Export receivables, secured 439,894 307,294
- Due from related parties, unsecured - note 6.1 5,301,640 4,628,362
- Others, unsecured 1,541,472 1,274,161 7,283,006 6,209,817
Considered doubtful - others 165,454 165,454 Less: Provision for doubtful debts (165,454) (165,454)
- - 7,283,006 6,209,817
6.1 These are stated net of amount payable to IBL Operations (Private) Limited, United Brands Limited and IBL Logistics (Private) Limited - associated companies amounting to Rs. 385.53 million (2019: Rs. 284.97 million), Rs. 15.54 million (2019: Rs. 15.36 million) and Rs. 1.01 million (2019: Rs. 1.01 million) respectively.
NOTES TO THE CONSOLIDATED CONDENSED INTERIM FINANCIAL STATEMENTSFor the period ended September 30, 2019 - Unaudited
37
(Unaudited) (Audited)September 30, June 30,
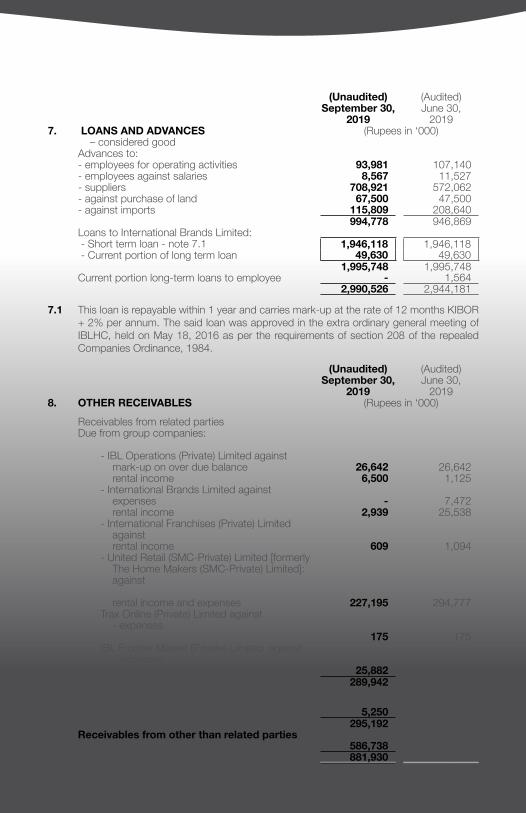
2019 20197. LOANS AND ADVANCES (Rupees in ‘000)
– considered good Advances to:- employees for operating activities 93,981 107,140 - employees against salaries 8,567 11,527 - suppliers 708,921 572,062 - against purchase of land 67,500 47,500 - against imports 115,809 208,640
994,778 946,869 Loans to International Brands Limited: - Short term loan - note 7.1 1,946,118 1,946,118 - Current portion of long term loan 49,630 49,630
1,995,748 1,995,748 Current portion long-term loans to employee - 1,564
2,990,526 2,944,181
7.1 This loan is repayable within 1 year and carries mark-up at the rate of 12 months KIBOR + 2% per annum. The said loan was approved in the extra ordinary general meeting of IBLHC, held on May 18, 2016 as per the requirements of section 208 of the repealed Companies Ordinance, 1984.
(Unaudited) (Audited)September 30, June 30,
2019 20198. OTHER RECEIVABLES (Rupees in ‘000)
Receivables from related parties Due from group companies:
- IBL Operations (Private) Limited against mark-up on over due balance 26,642 26,642 rental income 6,500 1,125 - International Brands Limited against expenses - 7,472 rental income 2,939 25,538 - International Franchises (Private) Limited against rental income 609 1,094 - United Retail (SMC-Private) Limited [formerly The Home Makers (SMC-Private) Limited]: against
rental income and expenses 227,195 294,777 Trax Online (Private) Limited against - expenses
175 175 IBL Frontier Market (Private) Limited against - expenses
25,882 25,882 289,942 382,705
Due from other related parties:Surplus arising under retirement benefit fund 5,250 5,250
295,192 387,955 Receivables from other than related partiesOthers, considered good 586,738 399,904
881,930 787,859
38 Quarterly Report September 2019
(Unaudited) (Audited)September 30, June 30,
2019 2019 (Rupees in ‘000)
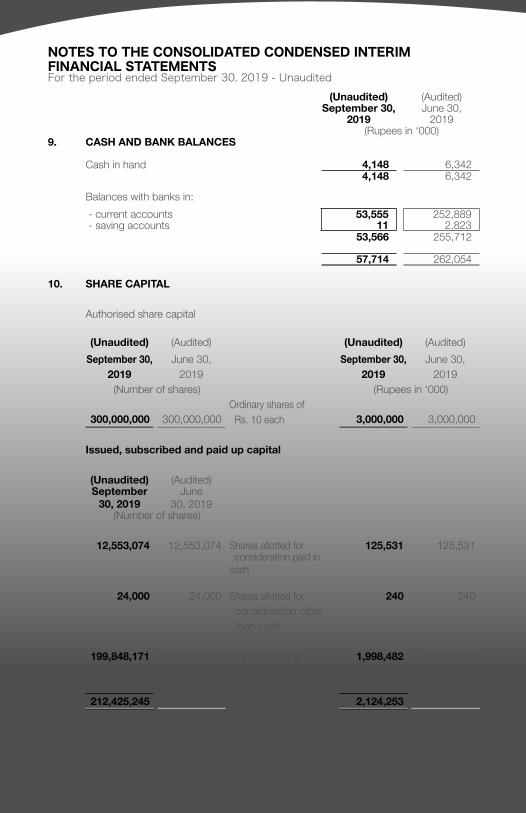
9. CASH AND BANK BALANCES
Cash in hand 4,148 6,342 4,148 6,342
Balances with banks in: - current accounts 53,555 252,889 - saving accounts 11 2,823
53,566 255,712
57,714 262,054
10. SHARE CAPITAL
Authorised share capital
(Unaudited) (Audited) (Unaudited) (Audited)September 30, June 30, September 30, June 30,
2019 2019 2019 2019 (Number of shares) (Rupees in ‘000)
Ordinary shares of 300,000,000 300,000,000 Rs. 10 each 3,000,000 3,000,000
Issued, subscribed and paid up capital
(Unaudited) (Audited)September
30, 2019June
30, 2019 (Number of shares)
12,553,074 12,553,074 Shares allotted for 125,531 125,531 consideration paid in cash
24,000 24,000 Shares allotted for 240 240 consideration other than cash
199,848,171 199,848,171 Shares allotted as 1,998,482 1,998,482 bonus shares
212,425,245 212,425,245 2,124,253 2,124,253
NOTES TO THE CONSOLIDATED CONDENSED INTERIM FINANCIAL STATEMENTSFor the period ended September 30, 2019 - Unaudited
39
(Unaudited) (Audited)September 30, June 30,
2019 2019 (Rupees in ‘000)
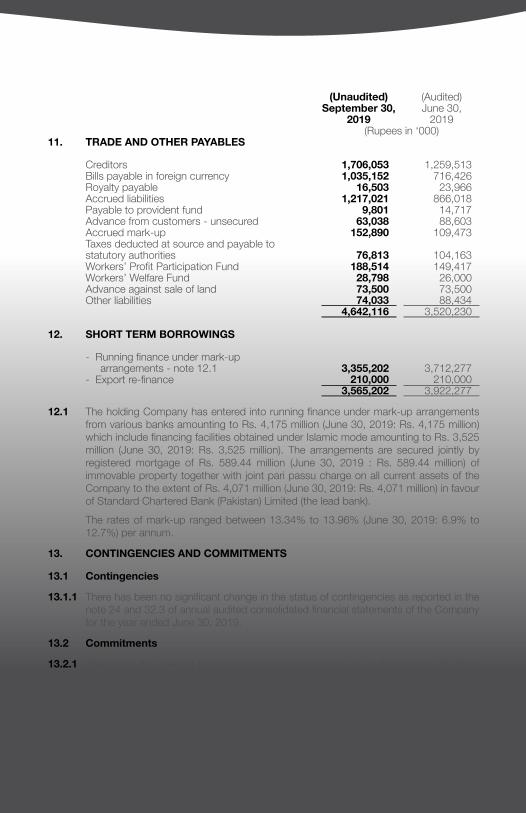
11. TRADE AND OTHER PAYABLES
Creditors 1,706,053 1,259,513 Bills payable in foreign currency 1,035,152 716,426 Royalty payable 16,503 23,966 Accrued liabilities 1,217,021 866,018 Payable to provident fund 9,801 14,717 Advance from customers - unsecured 63,038 88,603 Accrued mark-up 152,890 109,473 Taxes deducted at source and payable tostatutory authorities 76,813 104,163 Workers’ Profit Participation Fund 188,514 149,417 Workers’ Welfare Fund 28,798 26,000 Advance against sale of land 73,500 73,500 Other liabilities 74,033 88,434
4,642,116 3,520,230
12. SHORT TERM BORROWINGS
- Running finance under mark-up arrangements - note 12.1 3,355,202 3,712,277 - Export re-finance 210,000 210,000
3,565,202 3,922,277
12.1 The holding Company has entered into running finance under mark-up arrangements from various banks amounting to Rs. 4,175 million (June 30, 2019: Rs. 4,175 million) which include financing facilities obtained under Islamic mode amounting to Rs. 3,525 million (June 30, 2019: Rs. 3,525 million). The arrangements are secured jointly by registered mortgage of Rs. 589.44 million (June 30, 2019 : Rs. 589.44 million) of immovable property together with joint pari passu charge on all current assets of the Company to the extent of Rs. 4,071 million (June 30, 2019: Rs. 4,071 million) in favour of Standard Chartered Bank (Pakistan) Limited (the lead bank). The rates of mark-up ranged between 13.34% to 13.96% (June 30, 2019: 6.9% to 12.7%) per annum.
13. CONTINGENCIES AND COMMITMENTS
13.1 Contingencies
13.1.1 There has been no significant change in the status of contingencies as reported in the note 24 and 32.3 of annual audited consolidated financial statements of the Company for the year ended June 30, 2019.
13.2 Commitments
13.2.1 The facility for opening letters of credit and guarantees as at September 30, 2019 amounted to Rs. 2,180 million (June 30, 2019: Rs. 2,111 million) of which the amount remaining unutilised as at period end amounted to Rs. 221 million (June 30, 2019: Rs. 318 million).

40 Quarterly Report September 2019
13.2.2 Future rentals payable against operating lease arrangements
Further, the Company has also entered into lease arrangements with Myplan Pharmaceuticals (Private) Limited and S. A. Pharma, a pharmaceutical concern, respectively, for a period of 20 years for land, building and plant and machinery located at Lahore.
The details of future rentals payable over the lease period are as follows:
(Unaudited) (Audited)September 30, June 30,
2019 2019 (Rupees in ‘000)
Not later than one year 27,918 28,868 Later than one year but not later than five years 136,611 137,571 Later than five years 88,727 93,959
253,256 260,398
14. REVENUE FROM CONTRACTS WITH CUSTOMERS
(Unaudited) (Unaudited)September 30, September 30,
2019 2018 (Rupees in ‘000)
Gross salesLocal sales 4,743,080 4,196,504 Export sales 628,782 488,185
5,371,862 4,684,689
Toll manufacturing 71,854 87,836 5,443,716 4,772,525
Sales tax (67,299) (28,847) 5,376,417 4,743,678
Less:
Discounts, rebates and allowances 315,173 307,781 Sales returns 99,114 55,531
414,287 363,312
4,962,130 4,380,366
NOTES TO THE CONSOLIDATED CONDENSED INTERIM FINANCIAL STATEMENTSFor the period ended September 30, 2019 - Unaudited

41
(Unaudited) (Unaudited)September 30, September 30,
2019 2018 (Rupees in ‘000)
15. OTHER INCOME
Income from financial assets
Realised gain on investments - at fair value through profit or loss - 73 Unrealised gain on investments - at fair value through profit or loss - 226 Interest on loan to International Brands Limited 7,882 5,416 Dividend income - 17
7,882 5,732
Income from non - financial assets
Gain on disposal of property, plant and equipment 1,392 - Exchange (loss) / gain 1,536 97 Rental income from investment properties 31,913 30,263 Others 6,677 3,195
41,518 33,555
49,400 39,287
16. BASIC AND DILUTED EARNINGS PER SHARE
Profit for the year (Rupees in ‘000) 537,952 675,910
Weighted average number of outstanding shares at the end of the period (in thousand) - Restated 212,425 212,425
Basic and diluted earnings per share (Rupees) - Restated 2.57 3.18
42 Quarterly Report September 2019
September 30, September 30,2019 2018
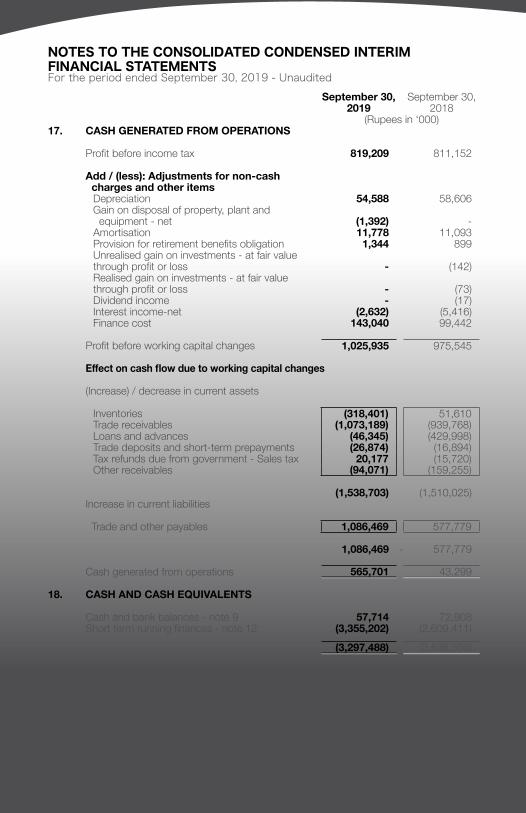
(Rupees in ‘000)17. CASH GENERATED FROM OPERATIONS
Profit before income tax 819,209 811,152
Add / (less): Adjustments for non-cash charges and other items
Depreciation 54,588 58,606 Gain on disposal of property, plant and equipment - net (1,392) - Amortisation 11,778 11,093 Provision for retirement benefits obligation 1,344 899 Unrealised gain on investments - at fair valuethrough profit or loss - (142)Realised gain on investments - at fair valuethrough profit or loss - (73)Dividend income - (17)Interest income-net (2,632) (5,416)Finance cost 143,040 99,442
Profit before working capital changes 1,025,935 975,545
Effect on cash flow due to working capital changes
(Increase) / decrease in current assets
Inventories (318,401) 51,610 Trade receivables (1,073,189) (939,768)Loans and advances (46,345) (429,998)Trade deposits and short-term prepayments (26,874) (16,894)Tax refunds due from government - Sales tax 20,177 (15,720)Other receivables (94,071) (159,255)
(1,538,703) (1,510,025)Increase in current liabilities
Trade and other payables 1,086,469 577,779
1,086,469 - 577,779
Cash generated from operations 565,701 43,299
18. CASH AND CASH EQUIVALENTS
Cash and bank balances - note 9 57,714 72,908 Short term running finances - note 12 (3,355,202) (2,609,411)
(3,297,488) (2,536,503)
NOTES TO THE CONSOLIDATED CONDENSED INTERIM FINANCIAL STATEMENTSFor the period ended September 30, 2019 - Unaudited
43
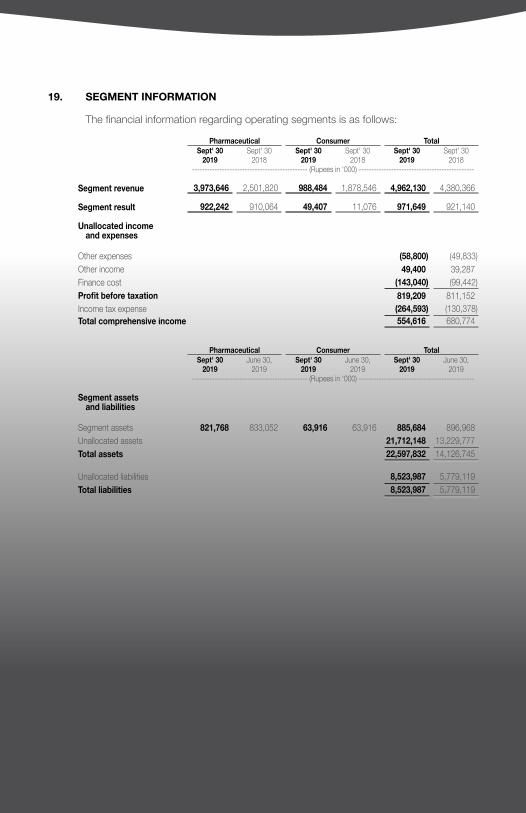
19. SEGMENT INFORMATION
The financial information regarding operating segments is as follows:
Pharmaceutical Consumer TotalSept' 30 Sept' 30 Sept' 30 Sept' 30 Sept' 30 Sept' 30
2019 2018 2019 2018 2019 2018---------------------------------------------- (Rupees in ‘000) ----------------------------------------------
Segment revenue 3,973,646 2,501,820 988,484 1,878,546 4,962,130 4,380,366
Segment result 922,242 910,064 49,407 11,076 971,649 921,140
Unallocated income and expenses
Other expenses (58,800) (49,833)Other income 49,400 39,287 Finance cost (143,040) (99,442)Profit before taxation 819,209 811,152 Income tax expense (264,593) (130,378)Total comprehensive income 554,616 680,774
Pharmaceutical Consumer TotalSept' 30 June 30, Sept' 30 June 30, Sept' 30 June 30,
2019 2019 2019 2019 2019 2019---------------------------------------------- (Rupees in ‘000) ----------------------------------------------
Segment assetsand liabilities
Segment assets 821,768 833,052 63,916 63,916 885,684 896,968 Unallocated assets 21,712,148 13,229,777 Total assets 22,597,832 14,126,745
Unallocated liabilities 8,523,987 5,779,119 Total liabilities 8,523,987 5,779,119
44 Quarterly Report September 2019
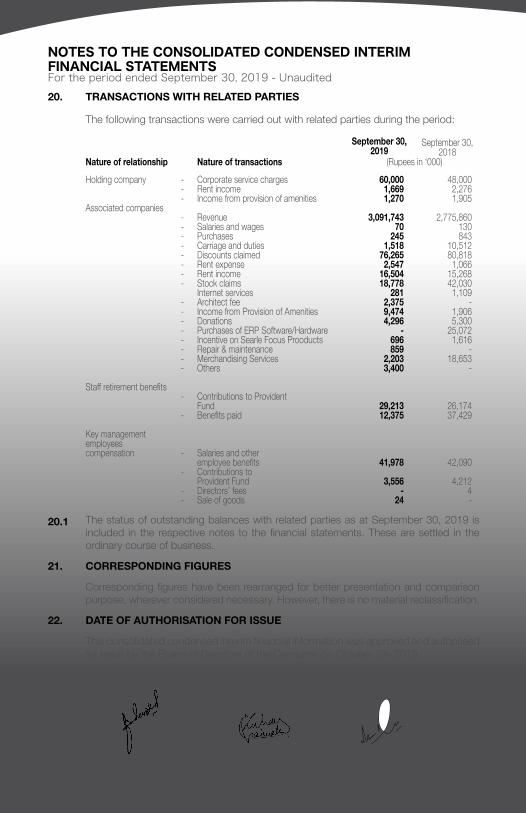
20. TRANSACTIONS WITH RELATED PARTIES
The following transactions were carried out with related parties during the period:
September 30, September 30,2019 2018
Nature of relationship Nature of transactions (Rupees in ‘000)Holding company - Corporate service charges 60,000 48,000
- Rent income 1,669 2,276 - Income from provision of amenities 1,270 1,905
Associated companies- Revenue 3,091,743 2,775,860 - Salaries and wages 70 130 - Purchases 245 843 - Carriage and duties 1,518 10,512 - Discounts claimed 76,265 80,818 - Rent expense 2,547 1,066 - Rent income 16,504 15,268 - Stock claims 18,778 42,030
Internet services 281 1,109 - Architect fee 2,375 - - Income from Provision of Amenities 9,474 1,906 - Donations 4,296 5,300 - Purchases of ERP Software/Hardware - 25,072 - Incentive on Searle Focus Prooducts 696 1,616 - Repair & maintenance 859 - - Merchandising Services 2,203 18,653 - Others 3,400 -
Staff retirement benefits- Contributions to Provident
Fund 29,213 26,174 - Benefits paid 12,375 37,429
Key managementemployees compensation - Salaries and other
employee benefits 41,978 42,090 - Contributions to
Provident Fund 3,556 4,212 - Directors’ fees - 4 - Sale of goods 24 -
20.1 The status of outstanding balances with related parties as at September 30, 2019 is included in the respective notes to the financial statements. These are settled in the ordinary course of business.
21. CORRESPONDING FIGURES
Corresponding figures have been rearranged for better presentation and comparison purpose, wherever considered necessary. However, there is no material reclassification.
22. DATE OF AUTHORISATION FOR ISSUE
This consolidated condensed interim financial information was approved and authorised for issue by the Board of Directors of the Company on October 28, 2019.
Chief Executive Officer Director Chief Financial Officer
NOTES TO THE CONSOLIDATED CONDENSED INTERIM FINANCIAL STATEMENTSFor the period ended September 30, 2019 - Unaudited


1st Floor, N.I.C.L. Building, Abbasi Shaheed Road, Karachi-75530URL: www.searlecompany.com
Winning
ThroughTrustQuality Quarterly Report
Spetember 2019
3530
1852