winning chemistry working ceaselessly at ranbaxy
TRANSCRIPT


There is a winning chemistry working ceaselessly at Ranbaxy. Much more than creating new products, it is creating new possibilities.
This is the chemistry of Team Ranbaxy. A fascinating amalgamation of Thought
and Effort, Aspirations and Commitment, Man and Technology.
It is this unique chemistry that has made us what we are... India's first transnational. The largest Indian Pharma Company ranked among the top 10 global generic pharma companies. A vibrant, research-based global player, surpassing the US$ 1 Bn turnover mark in February 2004 (on a MAT* basis).
Our ability to transform ourselves and constantly rise up the value chain is driven by a strong emphasis on employee empowerment at every
level. Encouraging entrepreneurship, practicing delegation, rewarding commitment and creating opportunities for every single team member… a family of around 9000 individuals with a common Vision for 2012.
*Moving Annual Total

Drug Delivery Systems
Branding
Mergers & Acquisitions
Global Markets
Patented Technologies
Collaborations
Training
Teamwork
Research
Empowerment
Intellectual Wealth
Human Bridge
Delegation
Excellence
Commitment
Specialty PharmaNew Drug Discovery
AspirationsEntrepreneurshi p
*Moving Annual Total

Contents
January 2003n Ranbaxy launched Co-Amoxyclav
(Enhancin/Moxclav) in the US.
n Bayer, the licensing collaborator for Cipro once-a-day product, launched its 500mg dosage forms in the US market.
February 2003n Ranbaxy launched a high end advanced
Cephalosporin, Cefprozil, under the brand name Refzil O (Cefprozil).
n Ranbaxy launched its second branded product, Sotret (Isotretinoin), in the US.
April 2003n Ranbaxy rolls-out the Company's
Vision for 2012.
n Ranbaxy gains USFDA approval for commercialization of Riomet™ (Metformin HCl) oral solution 100 mg/ml.
n Ranbaxy launches the latest Cholesterol Reducing Agent, Rosuvas (Rosuvastatin) in India.
n Ranbaxy receives prestigious National Safety Awards for the Year 2001 & 2002.
October 2003n Ranbaxy receives The Economic Times
Award for Corporate Excellence - for the "Company of the Year".
n Ranbaxy and GlaxoSmithKline plc (GSK) entered into a drug discovery and clinical development collaboration covering a wide range of therapeutic areas signifying the recognition of Ranbaxy's research capabilities.
June 2003n Ranbaxy enters into Collaborative
Research with 'Medicines for Malaria Venture' (MMV), Geneva, for the development of Anti-Malarial Drug.
September 2003n Bayer,Ranbaxy's licensing collaborator
for Cipro once-a-day product (developed by Ranbaxy), launched the 1gm dosage form in the US market.
n Ranbaxy launches high-end Anti-Infective Injectable, Cilanem, for the first time in India.
Chairman’s Message . . . . . . . . . . 6
CEO & MD’s Message . . . . . . . . 10
Global Operations Review . . . . . 12
Financial Review . . . . . . . . . . . . 14
Corporate Governance. . . . . . . . 18
Environment Health . . . . . . . . . 26& Safety
Research & Development . . . . . 30
Quality Assurance . . . . . . . . . . . 33
n Ranbaxy signs an agreement with The William Jefferson Clinton Foundation to supply HIV/AIDS drugs to millions of people in developing countries at a significantly reduced price.
n Ranbaxy & Anna University sign an agreement to collaborate forNew Drug Discovery.
November 2003n President Bill Clinton visits Ranbaxy's
R&D centre to thank Ranbaxy and the other four partner companies of the Clinton Foundation who had signed an agreement to supply HIV/AIDS drugs.
December 2003n Ranbaxy signed an agreement to acquire
RPG (Aventis) SA along with its fully owned subsidiary, OPIH SARL, in France.
Milestones 2003

Annual Report 2003
Global Markets Review . . . . . . . 36
Product Review . . . . . . . . . . . . . 46
Global Licensing . . . . . . . . . . . . 49
Global Manufacturing . . . . . . . . 52
Information Technology . . . . . . 54
Corporate Affairs & . .. . . . . . . . . 56Corporate Communications
Human Resource . . . . . . . . . . . . 60
Global Supply Chain . . . . . . . . . 61
Board of Directors . . . . . . . . . . . . . . 62
Report of the Directors . . . . . . . . . . . 63
Ten Years at a Glance . . . . . . . . . . . . 73
Auditors' Report . . . . . . . . . . . . . . . . 74
Financial Statements of . . . . . . . . . . 76Ranbaxy
Consolidated Financial Statements– . 99Indian GAAP
Consolidated Financial Statements– 118US GAAP

Vision
Strategies Growth
Exports
Teamwork
Mission
Excellence Sharing
Empowerment Alliances
Teamwork
Leadershi p

Annual Report 2003
The Chemistry of Vision
The ability to envision the future, the acumen to inspire corporate evolution and the commitment to grow intellectual wealth...
These are the forces that drive Ranbaxy's management towards ever-higher goals.

Chairman's Message
6
"Global corporate community requires that a Company like Ranbaxy which aims at benchmarking its business processes on "Best of Class" basis, should continuously upgrade its own Corporate Governance systems."
Dear Shareholders,
I am happy to highlight certain salient aspects of your Company's performance during the Business Year 2003. In line with the vision articulated by Late Dr. Parvinder Singh, the former Chairman & Managing Director, to achieve US$ 1 Bn in sales by the year 2004, the Company successfully increased its global sales turnover from US$ 764 Mn in 2002 to US$ 972 Mn in 2003. While the United States, which accounted for an aggregate turnover during the year of US$ 412 Mn registered a very commendable step up from its 2002 performance of US$ 296 Mn, it was particularly encouraging that sales in Region-II, comprising Europe, CIS and Africa, rose even faster and touched the level of US$ 159 Mn in 2003, showing an increase of nearly 50% over the previous year. The acquisition by your Company of the generics business of Aventis Life Sciences under the rubric of Rhone-Poulenc Generics (RPG) at the end of 2003, has been a very notable step aimed at the expansion of its European operations. In strategic terms, the increasing share of the Company's European operations in its overall global sales constitutes a valuable counter poise to the commendable successes achieved by it in the US market. This is specially pertinent because putting too much store by the sales performance ina particular region can lead to greater chances of volatility because of the relatively rapid price erosions which characterize the generics market.
I am also glad to underscore the healthy turn-around in your Company's performance in the important India market (Region I) during the year. In the preceding four years since 1999, Ranbaxy's performance had trailed behind the performance of some of the prominent Indian peer group pharmaceutical companies, like Cipla, Sun Pharma and Dr. Reddy's Labs. But in 2003, Ranbaxy's secondary sales bettered the average for its peer group and contributed to an increase in the overall market share of your Company in domestic pharmaceutical formulations sales. This improvement was achieved by a more focused marketing effort on the one hand and the introduction of new products, especially, in the chronic-disease segments, on the other. Consequently, the share contributed by Antibiotics in total sales which had been 62% in 2002 came down to 61% in 2003, while the proportion contributed by other therapeutic products rose from 38% in 2002 to 39% in 2003. It is also noteworthy that while delivering this improved performance, the quality of sales has been further tightened, with the result that the average days outstanding in respect of domestic sales came down to 30 days in 2003 from 36 days in 2002.
As far as the Company's performance in some other key markets, like Germany, China, Brazil and Russia is
concerned, while there was evidence of distinct improvement in both top line and bottom line numbers in Russia and Germany, the performance in Brazil and China showed need for further improvements in terms of both new products as well as better management of cost and price parameters.
Research & DevelopmentRecognizing the vital role played by R&D in the overall operations and the future progress of your Company, great emphasis has continued to be accorded to this function. Against the overall expenditure of US$ 40 Mn in 2002, the outlay was increased to US$ 59 Mn in 2003. This included increase in the provisions for capital expenditure for US$ 8 Mn in 2003 against US$ 5 Mn in 2002. Likewise, the strength of trained scientific staff with Post-Graduate qualifications deployed in R&D went up from 583 in 2002 to 799 in 2003. Construction of a third building to house the expanding R&D activities was also initiated early in the year. The number of Abbreviated New Drug Application (ANDA) filings by the end of the year cumulatively stood at 121 in the USA. Of these, the ANDA filings in 2003 totaled 26 against 25 such filings in 2002. The number of new marketing approvals received from Regulatory Authorities in the USrose to 24 in 2003, as compared to 11 in 2002.
In order to synergize the strength in early drug discovery research possessed by leading multinationals with the second stage drug discovery capabilities of your Company including carrying out of in-vitro and in-vivo trials along with early stage clinicals, a research collaboration was arrived at with GlaxoSmithKline (GSK) during the latter half of the year.
Human ResourcesSince people constitute the most precious resource of a company like Ranbaxy, greater emphasis is being focused not only on recruiting personnel in the first instance, who combine professional domain competence with high ethical commitment, but also on the regular training of Ranbaxy staff, across the whole organization. During 2003, a total number of 23,616 man days of training were imparted at the managerial and shop floor levels, compared to 13,662 man days of training at these levels in the preceding year. Besides, in order to get independent feedback regarding the level of employees' satisfaction, some surveys were conducted during the year through external agencies. Efforts are underway to take remedial actions to overcome deficiencies which have been revealed during these surveys, so that the workforce at all levels perceives an environment of nurturing and growth and is, thereby, motivated to contribute optimally to the Company's performance. Benchmarking of salary levels of a number of key management positions

77
Chairman's Message Annual Report 2003
against global levels of compensation have also been put in place to retain high performing staff in critical positions.
Code of ConductI have been stressing from the beginning of my tenure as Chairman that your Company has to maintain the highest standards of ethical conduct throughout the organization. While all Ranbaxians are expected to autonomously adhereto such conduct and maintain complete ethical integrity while dealing with Company's affairs, organizational mechanisms have also to be instituted and appropriate practices put in place to exercise alert oversight and meaningful surveillance. In this context, the Operating Management has been asked to institute such an effective ethical oversight mechanism, including formalization of a Code of Conduct. I would urge all Ranbaxians to not only conduct themselves in an ethically unimpeachable manner at all times but also remain alert about any indications of impropriety which may come to their notice, for appropriate evaluation and action by the Company's supervisory authorities.
Corporate GovernanceThe clear move aimed at tightening up of Corporate Governance across the global corporate community requires that a Company like Ranbaxy which aims at benchmarking its business processes on "Best of Class" basis, should continuously upgrade its own Corporate Governance systems. Independent, Non-Executive Directors are now expected to play a much more significant oversight role for ensuring that all key functions of the Company are discharged in a manner that safeguards and enhances stakeholders' and shareholders' interests. As an Associate Member of the New York Conference Board, your Company has been able to access very useful information regarding the evolution of Corporate Governance guidelines in principal markets like USA and has stepped up its efforts to comply with those standards. Corporate Governance Committees of the Board, viz., Management Committee, Finance Committee, Audit Committee, Compensation Committee, Science Committee and Shareholders/Investors Grievance and Share Transfer Committee, have been working diligently, in tandem with the Operating Management, to provide meaningful guidance on matters impacting the Company's overall performance. Further details in this behalf appear in the Chapter on Corporate Governance appearing subsequently in the Annual Report. In this connection, it is particularly pertinent to mention that the scope of work of the Audit Committee is being expanded to cover not only issues concerning accurate financial reporting and financial disclosure but also that of careful assessment of the adequacies of systems which are in place to address various areas of potential risk for the Company. A comprehensive mapping of the Company's risk landscape is also underway.
In the middle of June 2003, an unfortunate incident occurred in one of the solvent recovery units at the Mohali- API (Active Pharmaceutical Ingredients) facility of your Company. This mishap occurred despite relevant precautions having been taken and led to the loss of the precious lives of four

8
Ranbaxians as well as one employee of a transport company whose vehicle had been parked in the vicinity. The injured were immediately moved to the neighboring state-of-the-art Fortis hospital where they were provided with the best possible emergency and indoor treatment. Close liaison was maintained with the families of victims. Independent feedback given by their next of kin was that the Company had earnestly done its best to alleviate the adverse consequences of the mishap. The Department of Environment, Health and Safety of your Company has further intensified its efforts to ensure that all possible precautionary measures remain in place at all production sites of the Company so that occurrence of such incidents can be prevented as far as possible.
Management ChangesTowards the end of the year, on December 22, 2003, the Board of Directors met to consider whether at the expiry of the present five-year term of the CEO & Managing Director, Mr. D. S. Brar, on July 4, 2004, he would be available to serve for a further term of the office beyond that date. On being informed by Mr. D. S. Brar that he would not be available to serve for a further tenure in that capacity and, in accordance with his advice, the Board of Directors decided that Dr. Brian W. Tempest, who had been serving as President (Pharmaceuticals) of your Company since January 2000, should be designated as his successor w.e.f. July 5, 2004. Dr. Brian W. Tempest brings with him over 32 years of experience in the pharmaceutical sector in the global arena, of which the last nearly nine years have been spent with your Company. He has contributed very commendably to developing the Company's product-portfolios and businesses in key markets.
It was also decided at this meeting, in accordance with Mr. D. S. Brar's recommendation, that in the vacancy caused by Dr. Brian W. Tempest's elevation, his position as President (Pharmaceuticals) should be filled by Mr. Malvinder Mohan Singh, Regional Director, Region I (India). It was noted that Mr. Malvinder Mohan Singh had conducted himself with commendable efficiency in both his crucial assignments as Director, Global Licensing during 2001 and 2002 and as Regional Director, India Region, during 2003 and had displayed robust leadership and team building qualities as well as high degree of industriousness and dedication.
It was also decided that in order to smooth the transition in the Company's stewardship from Mr. Brar to Dr. Tempest, the latter should be designated as Jt. Managing Director & CEO -Designate, w.e.f. January 1, 2004.
On behalf of the Board of Directors and on your behalf, I wish to place on record our sincere appreciation of the very competent and focused leadership provided to your Company by Mr. D. S. Brar during his tenure as CEO & Managing Director, which has resulted in the Company's sure-footed progression from a turnover of less than US$ 500 Mn in 1999 to nearly US$ 1 Bn in 2003. In his efforts, Mr. Brar received the cooperation of a professionally competent and motivated core team of senior executives looking after the Company's principal regional markets as well as its key functions, such as R&D, Finance, Legal and Corporate Affairs.
Dr. Brian Tempest who will take on the mantle of the Company's leadership as CEO & Managing Director in early
July this year holds a Ph.D in Chemistry from Lancaster University. He understands the strengths of our R&D both in developing generics as well as in developing new chemical entities and new drug delivery systems. He fully shares the Vision GARUDA adopted by your Company in late 2002 to strive to attain US$ 5 Bn in global sales by the year 2012. More importantly, he has deep insight and knowledge of the business processes of your Company. He is a seasoned leader as well as a team builder and believes in transparency and open communications inter-se between all professionals working for the Company. With this combination of high ethical commitment and professional domain competence and remarkable capacity for rigorous hard work, the Board of Directors is confident that your Company's future will rest in good hands when Dr. Tempest takes up the reins thereof later this year.
At the end of 2003, Mr. V.K. Kaul, Executive Vice President-Finance, laid down office as CFO of the Company, on retirement. His successor, Mr. Ram S. Ramasundar, had joined the Company as CFO-Designate in the middle of October, 2003. Mr. Kaul served your Company with great distinction, dedication and industriousness, coupled withthe highest standards of integrity for 28 years and has left an indelible mark in corporate financial circles with his acumen and insight.
His successor, Mr. Ramasundar, comes with strong credentials both in terms of academics and corporate experience as a former CFO of Pepsi Foods and a former CEO of Electrolux India, before taking up his assignment at Ranbaxy Laboratories Ltd. I have no doubt that Mr. Ramasundar will add great value to the Company's overall operations and will carry forward the robust tradition of sound and insightful financial management set by his predecessor. On behalf of the Board of Directors and all of you, I wish to formally offer him our best wishes for his professional success and personal happiness while serving the Company.
Closing RemarksIn closing, I would like to warmly thank the nearly 9000 Ranbaxians working in the various inter-related functions of Production, R&D, Supply Chain Management, Marketing, Regulatory Compliances, Quality Assurance, Human Resource and Development, Legal and Corporate Affairs, right from the level of shop-floor workers upwards for the dedicated work put in by them which has led to the Company returning a strong business performance during 2003. I am sure that by their continued efforts under the new leadership of Dr. Brian Tempest and his Core Corporate Team including the critical leadership being provided by our Regional Directors and Country Managers, and fully supported by our focused R&D efforts and world-class manufacturing competencies, your Company will continue to add value to all its stakeholders during the years ahead and progress diligently towards its Vision GARUDA goals.
Tejendra KhannaChairman
April 26, 2004

Chairman's Message Annual Report 2003

Dear Shareholders,
This is an important year in the journey of Ranbaxy for several reasons. Ours is a Company with huge ambition and bustling energy to match it. Various elements resonated in unison this year auguring a vibrant future ahead. We saw many milestones achieved, the most important of which was crossing the billion dollar revenue mark, ahead of the time we had planned for it. While it may seem yet another financial measure set in the global context of the life sciences industry, it served as a goal around which the entire Ranbaxy family rallied for the last decade. It was the vision that aligned our people and brought out the best in them. It is also the year that saw us renew our purpose with Vision GARUDA that will amplify this energy over the next decade.
Given our context in which we set our vision ten years ago as a small, India- based generic Company, we made decisions along the road that were perhaps counterintuitive and even over-reaching. Yet, the decisions made at various points of inflection along our journey stood us in good stead and bestowed upon Ranbaxy a position of leadership that was well earned. It is this leadership at home that we extended among generics world wide, and it is the people who delivered us here, now renewed and energized by new incumbents, that will see us to the next milestones of this inexorable march.
One key aspect that distinguishes Ranbaxy and puts it on a trajectory that is different from its competition, I believe, is an extraordinary display of commitment and grit. This year saw spectacular growth in the US market, keeping the Company among the top 10 generic companies of that market. We laid the foundation towards transforming ourselves into a specialty pharmaceutical company, in what will remain to be the Company's biggest market. Initiation of brand marketing functions in USA heralds our entry into the prescription space.
After reaching critical mass in USA, the Company focused its efforts in Europe to conclude the largest pharmaceutical acquisition from India in buying RPG (Aventis) in France. This sets the tone for a pursuit of this geography that will intensify going forward.
Innovation as the central engine of growth is a tenet that is perfectly understood and absorbed at Ranbaxy. We now move towards invention by gearing ourselves with a research strategy for the coming years which outlines the therapeutic areas that the Company will focus on and the extensive number of programs we will run concurrently, with the goal to produce the Company's own New Chemical Entity (NCE) to be marketed within the next decade. It will also catalyze collaborative research efforts which will not only bring novel and cutting edge technologies but also provide access to the immense experience that is required by the Company to move up in its R&D efforts. Our collaboration with GlaxoSmithKline (GSK), a world leader to help us access new targets and technologies, is a step in this direction. Collaborations with other companies are underway.
Orphaned diseases and orphaned drugs have been a way of the world of modern medicine. In reaching for performance and profitability, companies in the western world tend to ignore diseases unique to developing countries. The inability of these markets to reward these therapies with meaningful economics results in tropical diseases like malaria continuing to be a leading cause of mortality in many a large but poor population base. Our landmark agreement
"...we received prestigious corporate excellence awards - most coveted being The Economic Times - 'Company of the Year Award'."
CEO & MD's Message
10

CEO & MD's Message
large capacity of our people and create leaders in the Company.
I must add in conclusion, that the year gone by, for me has been every bit as exciting and educating as twenty six others before it. It has been my privilege to play a role in shaping the journey of this wonderful Company in some ways and I am now moving on, passing the mantle of leadership to capable stewards who I am confident, will steer the Company to even greater heights.
Davinder S. BrarCEO & Managing Director
April 26, 2004
Dr. Brian W. Tempest, JMD & CEO Designate (L) and Mr. D. S. Brar, CEO & MD (R)
Annual Report 2003
with Medicines for Malaria Venture (MMV) for malarial therapies, our work with other companies to bring significant price reduction in Anti Retro-Virals (ARVs) for AIDS, and our commitment to make drugs affordable to large sections of needy populations, reflects our belief that treating the weaker sections of our population can be profitable as well as socially responsible.
The year past has also been another year of gratifying corporate results; our financial performance improved on every count. We were able to achieve both value and qualitative growth with productivity indices reflecting significant improvement. New initiatives were undertaken to broad-base global operations and give further impetus to emerging markets. As operations become more complex and are spread across the globe, we are taking special initiatives to streamline our global supply chain which, when completed, will add to overall productivity and customer service.
It is perhaps in recognition of all these milestones that we received prestigious corporate excellence awards - the most coveted being The Economic Times - 'Company of the Year Award'.
There is now intensified corporate responsibility as we embark on another ambitious leg of the journey. Given our successes thus far and our financial size in the context of the industry at home, it behoves us to treat this responsibility with the seriousness it deserves. Our investment in people will remain the driving force behind our entry into the next horizon. Assimilating and creating a multicultural milieu will be critical to global success. It is the combined efforts of people which will determine our success tomorrow. We need to build on the

12
Dear Shareholders,
Ranbaxy had an excellent year with robust growth in sales, profits and in key operating parameters.
Ranbaxy's global sales grew by 22% to reach Rs 45,301 Mn (US$ 972 Mn). Dosage forms, sales at US$ 844 Mn represents 87% of the total sales compared to 85% in 2002. This richer mix contributed to the improvement in margins.
The consolidated Operating Profit Before Interest, Depreciation and Amortization grew by 40%, driven by new products, better results in key markets and operating efficiencies. Profit Before Tax crossed Rs. 10,000 Mn and was Rs. 10,147 Mn and has grown by 21.7% over last year. Profit After Tax and Minority Interest grew by 17% to reach Rs. 7,594 Mn (US$ 163 Mn).
We continued to improve Gross Working Capital (GWC) employed and also made substantial capital investments (US$ 70 Mn) during the year of which the larger part was in manufacturing, to enhance capacities. Return on Capital Employed (ROCE) was 39.5%.
A global project to improve supply chain management was also initiated during the year with the objective of improving customer service and operating efficiencies.
Key Markets
The United States of America continued to be the largest market of the Company with sales reaching US$ 412 Mn, a growth of 39% over last year, constituting 42% of the Company's sales.
With a total of 81 product approvals and 40 products pending approval, Ranbaxy continued to be amongst the fastest growing companies in the USA. Ranbaxy was ranked 9th amongst the generic companies in the USA.
There were a number of new molecules introduced, notably Amoxyclav that recorded sales in excess of US$ 65 Mn. An entry was made in the branded segment with the launch of Sotret (Isotretinoin).
Europe grew strongly with sales growing by 51% over last year to reach US$ 89 Mn. In the United Kingdom, sales grew by 60% to reach US$ 48 Mn, with the successful launch of Simvastatin.
In Germany, sales grew by 56% to reach US$ 14 Mn.
Ranbaxy entered France in January 2004, with the acquisition of RPG (Aventis), the fifth largest generic company in France.
BRIC Countries (Brazil, Russia, India and China) together constituted 26% of the total revenues of the Company with combined sales of US$ 248 Mn, a growth of 16% over last year.
Brazil - Ranbaxy continued to be ranked amongst the top 5 generic companies in Brazil.
In Russia, sales grew strongly by 55% over last year. Ranbaxy was the 17th fastest growing company in Russia.
"We continued to improve Gross Working Capital (GWC) employed and also made substantial capital investments during the year of which the larger part was in manufacturing, to enhance capacities."
Global Operations Review

Dr. Brian W. Tempest, JMD & CEO Designate (L) and Mr. Malvinder Mohan Singh, President, Pharmaceuticals (R)
Global Operations Review Annual Report 2003
In India, the domestic dosage forms business performed well with secondary sales growth of 18.6%. Ranbaxy outperformed the market with a better than market growth. The performance was a result of enhanced growth in the chronic and specialty business segments and also due to better growth of existing products coupled with new product successes. The business was able to enhance its prescription share by improving the quality of customer targeting and better focus on specialists.
In China, secondary sales grew by 28% with branded sales growing by 48%. Ranbaxy is ranked 28th amongst generic companies in China and was the 4th fastest growing company in Quarter 2 and Quarter 3 of 2003. New branded products were key in driving the sales.
The Consumer Healthcare Business, which was started in 2002 with its own sales force and FMCG marketing structure, performed strongly with over 31% growth in secondary sales of its flagship brand Revital. A range of Herbal products was also launched in January 2004.
A more detailed commentary on the key markets follows in the subsequent section.
Research and Development
The Company increased its R&D expenditure from US$ 40 Mn in 2002 to US$ 59 Mn in 2003 an increase of 48%. The R&D expenditure stood at 6.1% to net sales as against 5.2% in the previous year.
During the year, Ranbaxy and GlaxoSmithKline entered into a drug discovery and clinical development collaboration covering a wide range of therapeutic areas. The Company also entered into a collaborative research program with 'Medicines for Malaria Venture' (MMV), Geneva, for the development of an Anti-Malarial drug.
Ranbaxy's Novel Drug Delivery Systems (NDDS) program continued to make progress. During the year, the Company's once-a-day Ciprofloxacin (Cifran) product was launched in both 500 mg and 1 gm dosage forms by Bayer, triggering milestone and revenue-sharing payments.
The year also saw Ranbaxy sign an agreement with the William Jefferson Clinton Foundation to offer HIV/AIDS drugs in countries where the foundation is working.
A detailed review of R&D follows in the subsequent section.
The results were due to the exceptional talent, drive and commitment of around 9000 Ranbaxians across the globe.
Dr. Brian W. TempestJMD & CEO Designate
April 26, 2004

Key Parameters Consolidated
Particulars Unit of Measure 2003 2002
PBIDTA to Sales % 24.8 23.7
PBEOI to Sales % 21.6 20.1
PBT to Sales % 22.4 22.4
ROCE % 39.5 39.8
RONW % 36.9 38.2
Earnings per share (fully diluted) Rs. 39.16 29.97
Book Value per share Rs. 121.29 100.61@
Debt Equity Ratio Times 0.26 0.21
Inventories No. of Sale Days 75 80
Receivables No. of Sale Days 62 72
Dividend Rs. Mn 3156.3 2434.0
Tax on Dividend Rs. Mn 404.4 237.6
Total Rs. Mn 3560.7 2671.6
Total as % to PAT 44.8 42.8
PBIDTA - Profit before Interest, Depreciation, Tax and AmortizationPBEOI - Profit before Extra-ordinary itemsPBT - Profit before TaxPAT - Profit after TaxROCE - Return on Capital Employed RONW - Return on Net Worth
@ Post issue of Bonus Shares in the ratio of 3 for 5 in October, 2002
“Strong business performance in key markets with good volume growth in the higher value added dosage forms, combined with productivity improvements, cost management and working capital improvements...”
39.16
29.97
2003 2002
Earnings Per Share (Fully diluted) (Rs.)
100.61 @
Book Value Per Share (Rs.)
121.29
2003 2002
14
Financial Review
Financial Review
Mr. Ram S. Ramasundar, Executive Vice President-Finance & CFO (L) and Mr. Vinay Kaul, Member of Board of Directors (R)
Annual Report 2003
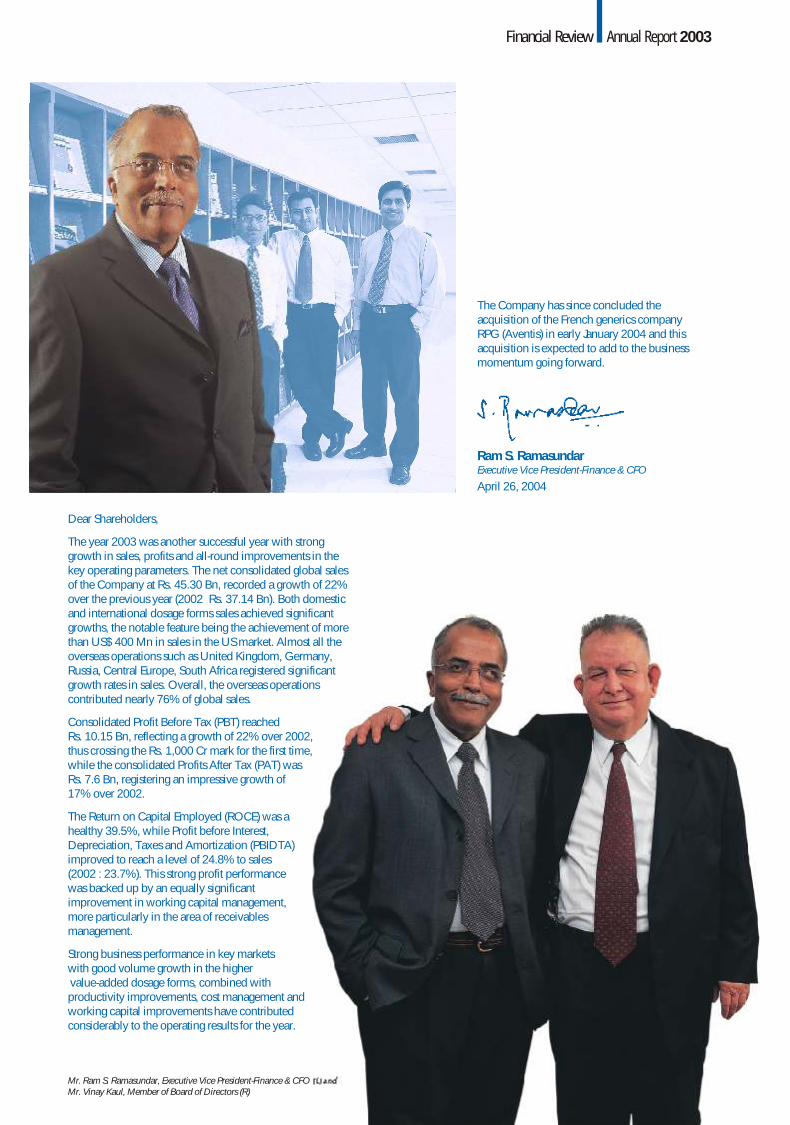
The Company has since concluded the acquisition of the French generics company RPG (Aventis) in early January 2004 and this acquisition is expected to add to the business momentum going forward.
Ram S. Ramasundar Executive Vice President-Finance & CFO
April 26, 2004
Dear Shareholders,
The year 2003 was another successful year with strong growth in sales, profits and all-round improvements in the key operating parameters. The net consolidated global sales of the Company at Rs. 45.30 Bn, recorded a growth of 22% over the previous year (2002 Rs. 37.14 Bn). Both domestic and international dosage forms sales achieved significant growths, the notable feature being the achievement of more than US$ 400 Mn in sales in the US market. Almost all the overseas operations such as United Kingdom, Germany, Russia, Central Europe, South Africa registered significant growth rates in sales. Overall, the overseas operations contributed nearly 76% of global sales.
Consolidated Profit Before Tax (PBT) reached Rs. 10.15 Bn, reflecting a growth of 22% over 2002, thus crossing the Rs. 1,000 Cr mark for the first time, while the consolidated Profits After Tax (PAT) was Rs. 7.6 Bn, registering an impressive growth of 17% over 2002.
The Return on Capital Employed (ROCE) was a healthy 39.5%, while Profit before Interest, Depreciation, Taxes and Amortization (PBIDTA) improved to reach a level of 24.8% to sales (2002 : 23.7%). This strong profit performance was backed up by an equally significant improvement in working capital management, more particularly in the area of receivables management.
Strong business performance in key markets with good volume growth in the higher value-added dosage forms, combined with productivity improvements, cost management and working capital improvements have contributed considerably to the operating results for the year.

Annual Report 2003
Standards
Integrity
Transparency Ethos
Values
Dedication
Commitment
TrustFocus
Ethics
Values

Annual Report 2003
Leadership isn't just about market-share. It's about responsibility towards the society at large. Ethics and standards are the very foundations of Ranbaxy's value chain. The bottom-line is, governance based on total transparency and trust.
The Chemistry of Values

Standards
Integrity
Bonds Ethos
Values
Dedication
Commitment
Trust Focus
Ethics
Values
Standards
Integrity
Bonds Ethos
Values
Dedication
Commitment
Trust Focus
Ethics
Values
Standards
Integrity
Bonds Ethos
Values
Dedication
Commitment
Trust Focus
Corporate Governance
18
1. THE COMPANY'S PHILOSOPHY ON CODE OF CORPORATE GOVERNANCEFor creation of wealth for shareholders on a sustainable and long-term basis and to maximize "total returns to shareholders", being the core of the mandate from shareholders, it is imperative for the Management to institutionalize a "Framework of Corporate Governance and Code of Practices" as an enabling methodology to strengthen decision-making processes and organization-wide compliance with core values of ethical integrity and reliability, while enhancing effective, harmonious and
transparent functioning amongst the Board of Directors, its Committees and the Executive Management to meet challenges and to make the best of opportunities in the years ahead.
Ranbaxy's first written internal Code of Corporate Governance was adopted by the Board in June 1999, well before SEBI introduced recommendatory standards for companies in India. The guidelines are reviewed and reaffirmed on an ongoing basis to ensure that the Code is observed in substance rather than in mere form.
2. BOARD OF DIRECTORS
Composition as on December 31, 2003
The Board comprises eleven Directors, including the Non-Executive Independent Chairman and three Executive Directors.
*Related to promoters.
The listing above excludes private, foreign and companies registered under Section 25 of the Companies Act, 1956.
Name of the Director Category Number of Number of Board Directorships Committee held in other memberships held companies in other companies
Mr. Tejendra Khanna, Chairman Non-Executive-Independent 3 2
Mr. J.W. Balani - do - - -
Mr. Vivek Bharat Ram - do - 4 2
Dr. P.S. Joshi - do - 1 -
Mr. Nimesh N. Kampani - do - 9 7
Mr. Vivek Mehra - do - - -
Mr. Harpal Singh * - do - 5 2
Mr. Surendra Daulet-Singh -do- 1 1
Mr. D.S. Brar Executive 1 -CEO & Managing Director
Dr. Brian W. Tempest -do- - -President-Pharmaceuticals and Whole-time Director
Mr. V.K Kaul - do - 7 7Executive Vice President-Finance& Corporate Services and Whole-time Director

Annual Report 2003Corporate Governance
19
3. BOARD MEETINGSDates of Board meetings are fixed in advance and agenda papers are circulated to Directors seven days before the meeting.
Meetings and AttendanceDuring the year 2003, eight Board Meetings were held : January 16, April 29, May 16, June 25, July 24, September 29, October 22 and December 22.
Attendance of Directors at Board Meetings and at the Annual General Meeting (AGM)
4. COMMITTEES OF THE BOARD
i. Audit CommitteeThe Audit Committee has been constituted as per Section 292 A of the Companies Act, 1956 and the guidelines set out in the Listing Agreements with the Stock Exchanges. The terms of reference include -
n Overseeing financial reporting processes.
n Reviewing periodic financial results, financial statements and adequacy of internal control systems.
n Approving internal audit plans and reviewing efficacy of the function.
n Discussion and review of periodic audit reports.
n Discussions with external auditors about the scope of audit including the observations of the auditors.
Minutes of meetings of the Audit Committee are circulated to members of the Committee and the Board is kept apprised.
Composition and AttendanceDuring the year 2003, five meetings of the Audit Committee were held : January 16, April 29, July 24, October 22 and November 24.
Name of the Member No. of Meetings attended
Mr. Tejendra Khanna, Chairman 5
Mr. Vivek Bharat Ram 5
Mr. Vivek Mehra 5
Mr. Harpal Singh 5
Mr. Surendra Daulet-Singh 5
Permanent Invitee - Mr. D.S. Brar 5
Permanent Invitee - Mr. V.K. Kaul 5
Invitee - Dr. Brian W. Tempest 4
Name of the No. of Whether Attended Director Board the AGM
Meetings held on attended June 25, 2003
Mr. Tejendra Khanna, Chairman 8 Yes
Mr. J.W. Balani - -
Mr. Vivek Bharat Ram 8 Yes
Dr. P.S. Joshi 8 Yes
Mr. Nimesh N. Kampani 5 Yes
Mr. Vivek Mehra 8 Yes
Mr. Harpal Singh 8 Yes
Mr. Surendra Daulet-Singh 7 Yes
Mr. D.S. Brar 8 Yes
Dr. Brian W. Tempest 8 Yes
Mr. V.K. Kaul 8 Yes
Members of the Audit Committee have requisite financial and
management expertise and have held or hold senior positions
in other reputed organizations.
The Statutory Auditors, Internal Auditor and the Director-in-
Charge of Finance are invited to attend and participate at
meetings of the Committee.
The Company Secretary acts as the Secretary to the
Committee.
ii. Management Committee
Terms of Reference of the Management Committee
include :
n Review and approval of business strategies and
policies, merger and acquisition proposals, medium
terms plans and annual budgets.
n Review operating performance for the global
organization.
n Approval of processes and practices relating to human
resources, succession planning for senior management
personnel.
n Review policies, processes and systems on
Environment, Safety and Ecology.
Minutes of meetings of the Management Committee are
circulated to members of the Committee and the Board is
kept apprised.
Composition and AttendanceDuring the year 2003, eight meetings of the Management
Committee were held : January 10, February 7, March 17,
May 16, May 31, July 25, August 6 and September 19.
Remuneration Policy
The Remuneration Policy of the Company for managerial
personnel is primarily based on the following criteria :
n Performance of the Company, its divisions and units.
n Track record, potential and performance of individual
managers.
n External competitive environment.
Remuneration of Directors
Remuneration of Executive Directors is decided by the Board,
based on recommendations of the Compensation Committee
as per the remuneration policy of the Company, within the
ceilings fixed by the shareholders. Remuneration of the
Executive Directors for the year ended December 31, 2003
was as follows :
Mr. Tejendra Khanna, Chairman 8
Mr. Vivek Bharat Ram 7
Mr. Nimesh N.Kampani 3
Mr. Harpal Singh 8
Mr. Surendra Daulet-Singh 5
Permanent Invitee - Mr. D.S. Brar 6
Permanent Invitee - Mr. V.K. Kaul 7
Invitee - Dr. Brian W. Tempest 5
Name of the Member No. of Meetings attended

Standards
Integrity
Bonds Ethos
Values
Dedication
Commitment
Trust Focus
Standards
Integrity
Bonds Ethos
Values
Dedication
Commitment
Trust Focus
Ethics
Values
Integrity
Dedication
Commitment
Trust
Ethics
Values
20
Executive Directors
# Retired on December 31, 2003
* Exclusive of provision for future liabilities in respect of retirement benefits (which are based on actuarial valuation done on overall Company basis).
** Each vested option is exercisable into one fully paid-up Equity Share against payment of Rs. 567 per share. Market price of the share on 7.2.2003 was Rs. 634.90 per share; hence stock options were at a discount of Rs. 67.90 per share. The options granted are exercisable till expiry of ten years from the date of grant. Vesting period will commence on the expiry of one year from the date of grant of options and the entitlement will be in the graduated scale equally over a period of five years as provided in the Employees Stock Option Scheme of the Company.
Remuneration to Non-executive DirectorsRemuneration to Non-Executive Directors comprises commission and sitting fees.
Commission is paid on the basis of
a. Membership of the Board and
b. The number of Committees of the Board that they serve as members.
---------------------------------- Rs.Lacs ------------------------------------
Mr. D.S. Brar 80.98 258.20 48.44 17.59 25000 up to 04.07.04 12 months
Dr. Brian W. Tempest 143.26 154.92 53.06 13.62 18000 up to 30.06.05 12 months
Mr. V.K. Kaul # 68.56 103.28 1.27 114.76 18000 up to 31.12.03 12 months
Name of the Salary & Commission Perquisites Retiral Stock Options ** Service Contract Director Allowances Benefits* (granted on Tenure Notice
7.2.2003) Period
Commission to be paid to Non-executive Directors for the business year 2003 is as under :
Non-Executive Directors
Name of the Director Commission Sitting Fees(Rs. Lacs) (Rs. Lacs)
Mr. Tejendra Khanna 10.50 2.02
Mr. J.W. Balani 2.50 -
Mr. Vivek Bharat Ram 8.50 1.90
Dr. P.S. Joshi 4.50 0.77
Mr. Nimesh N.Kampani 6.50 0.67
Mr. Vivek Mehra 6.50 1.39
Mr. Harpal Singh 6.50 1.52
Mr. Surendra Daulet-Singh 8.50 1.27
iii. Compensation Committee Hitherto, the Management Committee had been empowered to discharge the functions of Compensation Committee. However, as per SEBI Guidelines, the Board at its meeting held on July 24, 2003 decided to constitute a Compensation Committee, with the following terms of reference :
n Administration and superintendence of Employee Stock Option Scheme (ESOS).
n Formulation of the detailed terms and conditions of the ESOS.
n Grant of stock options.
n Recommendation for fixation and periodic revision of compensation of the Managing Director and Executive Directors to the Board for approval.
n Review and approve compensation policy (including performance bonus, incentives, perquisites and benefits) for senior management personnel (Vice President's and above).
Composition of Compensation Committee
During the year 2003, no meeting of the Committee was held, since compensation issues for the year 2003 had already been settled earlier in that year.
iv. Finance CommitteeTerms of Reference of Finance Committee include -
n Review of capital structure.
n Distribution policy.
n Financial policies, processes.
n Systems and controls covering accounting, treasury, taxation, forex, risk management, insurance and implementation of accounting standards.
Composition and Attendance
During the year 2003, one meeting of the Finance Committee was held : September 29.
Mr. Tejendra Khanna, Chairman
Mr. Vivek Bharat Ram
Mr. Nimesh N.Kampani
Mr. Harpal Singh
Mr. Surendra Daulet-Singh
Mr. D.S. Brar
Mr. V.K. Kaul
Mr. Tejendra Khanna, Chairman Yes
Mr. Vivek Bharat Ram Yes
Mr. Nimesh N.Kampani No
Mr. Vivek Mehra Yes
Mr. Surendra Daulet-Singh No
Permanent Invitee - Mr. D.S. Brar Yes
Permanent Invitee - Mr. V.K. Kaul Yes
Invitee - Dr. Brian W. Tempest Yes
Name of the Members
Permanent Invitees
Name of the Member Attendance

Standards
Integrity
Bonds Ethos
Values
Dedication
Commitment
Trust Focus
Standards
Integrity
Bonds Ethos
Values
Dedication
Commitment
Trust Focus
Ethics
Values
Integrity
Dedication
Commitment
Trust
Ethics
Values
Annual Report 2003Corporate Governance
6. DISCLOSURESA. Related Party Transactions
The Company has not entered into any transaction of material nature with the promoters, the Directors or the management, their subsidiaries or relatives etc. that may have any potential conflict with the interests of the Company.
B. Compliances by the Company
During the last three years, no penalties or strictures have been imposed on the Company by the Stock Exchanges or SEBI or any other statutory authorities on matters related to capital markets.
7. MEANS OF COMMUNICATIONA. The Company regularly furnishes/intimates unaudited as
well as audited financial results to the Stock Exchanges immediately after these are taken on record by the Board. The Results are not sent individually to the shareholders. These financial results are normally published in the Business Standard/Financial Express, the Tribune (Punjabi Edition) and are displayed on the website of the Company www.ranbaxy.com and simultaneously posted on the Electronic Data Information Filing and Retrieval website namely www.sebiedifar.nic.in. The website is also accessible through a hyperlink 'EDIFAR' from SEBI's official website, www.sebi.gov.in.
The official news releases and the presentations made to the investors/analysts are also displayed on the Company's website.
B. Management Discussion and Analysis Report forms part of the Report of the Directors.
8. SHAREHOLDER INFORMATION
Annual General Meeting- Date : June 25, 2004
- Time : 11.00 A.M.
- Venue : The National Institute of Pharmaceutical Education & Research (NIPER)Sector-67, S.A.S. Nagar (Mohali) - 160 062 (Punjab).
Financial Calendar -Adoption of Quarterly Results 3rd/4th week of
for the quarter ending
- June 30, 2004 July 2004
- September 30, 2004 October 2004
- December 31, 2004 January 2005
- March 31, 2005 April 2005
Book Closure Dates - June 12, 2004 to June 25, 2004
(Both days inclusive)
Dividend Payment date - on or before July 1, 2004
LISTING ON STOCK EXCHANGESThe Equity Shares of the Company as on date are listed on the Stock Exchanges at - Kolkata, Mumbai and National Stock Exchange. Pursuant to the delisting applications of the Company, the Stock Exchanges at Delhi, Ahmedabad and Ludhiana have delisted the Equity Shares of the Company effective November 17, 2003,
v. Science CommitteeTerms of Reference of Science Committee include -
n Approval of focus areas of research, especially New Drug Discovery Research (NDDR) and Novel Drug Delivery Systems (NDDS), R&D organizational structure and policies for the research and development function of the Company.
n Monitoring progress of NDDR and NDDS programmes and laying down a policy framework for collaborative R&D programmes.
Composition and AttendanceDuring the year 2003, two meetings of the Science Committee were held : March 31 and July 25.
vi. Shareholders/Investors Grievance and Share Transfer Committee
Composition and Attendance
During the year 2003, eight meetings of the Committee were held - January 8, March 10, April 10, May 26, June 18, July 23, October 3 and November 24.
The Company addresses all complaints, suggestions and grievances expeditiously and replies have been sent/issues resolved usually within 15 days unless there is a dispute over facts or any other legal constraint.
The Company received 43 shareholders' complaints from Stock Exchanges and the Securities and Exchange Board of India which, inter-alia, include non-receipt of dividend, annual report, Bonus shares, transfer of shares etc. The complaints were duly attended to and the Company has furnished necessary documents/information to the shareholders.
The Shareholders/Investors Grievance and Share Transfer Committee reviews complaints received and appropriate action is taken promptly.
No requests for share transfers are pending except those that are disputed or sub-judice.
Mr. S.K. Patawari, Company Secretary is the Compliance Officer of the Company.
5. GENERAL BODY MEETINGSThe last three Annual General Meetings were held as per details given below :
There was no requirement for a postal ballot in any of these years.
Dr. P.S. Joshi, Chairman 2
Mr. Tejendra Khanna 2
Mr. D.S. Brar 2
Permanent Invitees
Dr. Nityanand 2
Dr. Rashmi Barbhaiya 2
Mr. Tejendra Khanna, Chairman 8
Mr. Vivek Bharat Ram 8
Mr. D.S. Brar 5
Mr. V.K. Kaul 8
2001 29-6-2001 11.00 A.M. A-9-10 Industrial Area,S.A.S. Nagar, Punjab
2002 28-6-2002 11.00 A.M. A-9-10 Industrial Area,S.A.S. Nagar, Punjab
2003 25-6-2003 11.00 A.M. The National Institute of Pharmaceutical Education & Research, Sector 67, S.A.S Nagar, Punjab
Name of the Member No. of Meetings attended
Name of the Member No. of Meetings attended
Year Date Time Venue
21

6000
5500
5000
4500
4000
3500
3000
2500
1200
1000
800
600
400
200
Ran
baxy
Sha
re P
rice
(Rs.
)
BS
E S
ense
x (P
ts.)
Jan Feb Mar Apr May Jun Jul Aug Sep Oct Nov Dec
— Ranbaxy Share Price — BSE Sensex
* Note : Based on the weekly closing data of Ranbaxy (Rs. per share) and BSE Sensex (Pts.)
Stock Price Performance - Ranbaxy Vs BSE SensexYear 2003
Market Price Data (Rs.)
Month Bombay Stock Exchange National Stock Exchange (BSE) (NSE)
High Low High Low
January 2003 663.90 596.30 663.90 554.70
February 2003 655.00 611.55 700.00 612.00
March 2003 692.80 581.50 637.00 537.50
April 2003 693.00 622.50 725.00 619.25
May 2003 686.00 619.60 686.20 619.75
June 2003 792.15 673.90 793.00 670.35
July 2003 865.10 782.00 874.70 780.00
August 2003 1007.00 775.10 1007.85 775.05
September 2003 1075.00 901.55 1075.05 870.00
October 2003 1075.00 926.30 1075.00 925.20
November 2003 1075.00 959.90 1060.00 959.55
December 2003 1146.00 1013.10 1171.00 1014.10
January 15, 2004 and March 26, 2004 respectively. Final approval from Ludhiana Stock Exchange is awaited. Delisting application of the Company with the Stock Exchange at Kolkata is pending for approval. Global Depository Receipts (GDRs) are listed on the Stock Exchange at Luxembourg. The Company confirms that it has paid annual listing fees due to the Stock Exchanges.
STOCK CODE1. The National Stock Exchange of - Ranbaxy
India Ltd.
2. The Stock Exchange, Mumbai - 359 (Physical)
500359 (Demat)
3. The Calcutta Stock Exchange - 28367 (Physical)
Association Ltd. 10028367 (Demat)
REGISTRAR AND TRANSFER AGENTSM/s Alankit Assignments Ltd. (Alankit), 2E/8, 1st Floor, Jhandewalan Extension, New Delhi - 110 055 are the Registrar and Share Transfer Agent for physical shares of the Company. Alankit is also the depository interface of the Company with both NSDL and CDSL.
However, keeping in view the convenience of shareholders, documents relating to shares will continue to be received by the Company at - 25, Nehru Place, New Delhi - 110 019 Tel. No. : 011-26476092Email address : [email protected]
22

23
Standards
Integrity
Bonds Ethos
Values
Dedication
Commitment
Trust Focus
Ethics
Values
Annual Report 2003Corporate Governance
depositories i.e. National Securities Depository Limited (NSDL) and Central Depository Services (India) Limited (CDSL) expeditiously.
DEMATERIALIZATION OF SHARESThe shares of the Company are in compulsory demat segment and are available for trading in the depository systems of both the National Securities Depository Limited and the Central Depository Services (India) Limited. As on December 31, 2003, 170110404 Equity Shares of the Company, forming 91.68% of the Share Capital of the Company, stand dematerialized.
International Securities Identification Number - INE015A01010 (with NSDL and CDSL)
SHARE TRANSFER SYSTEMWith a view to expedite the process of share transfers, the Board of Directors of the Company has delegated the power of share transfer to some of the Directors with appropriate individual limits. The delegated Director(s) attend(s) to share transfer formalities at least once in a fortnight. The shares for transfers received in physical form are transferred expeditiously, provided the documents are complete and the shares under transfer are not under any dispute. Thereafter, an option letter for simultaneous demat of shares is sent to the shareholders within 15 days from the date of receipt. The share certificates duly endorsed are returned immediately to shareholders who prefer to retain the shares in the physical form. Confirmation in respect of the requests for dematerialization of shares is sent to the respective
Shareholding Pattern as on December 31, 2003
Distribution of Shareholding as on December 31, 2003
Promoters 59466836 32.05
Mutual Funds & UTI 5564648 3.00
Banks, Financial Institutions, 19088002 10.29Insurance Companies
FIIs 43752658 23.58
Private Corporate Bodies 3543892 1.91
Indian Public 35177619 18.96
NRIs & OCBs 2433842 1.31
GDRs 16516128 8.90
Total 185543625 100.00
1 - 50 33260 38.66 705807 0.38
51 - 100 11895 13.82 945121 0.51
101 - 200 11569 13.45 1773105 0.96
201 - 300 5450 6.33 1379940 0.74
301 - 400 4410 5.12 1521296 0.82
401 - 500 2958 3.44 1359398 0.73
501 - 600 2133 2.48 1180252 0.64
601 - 700 1859 2.16 1209150 0.65
701 - 800 1642 1.91 1253593 0.67
801 - 900 1070 1.24 911796 0.49
901 - 1000 1255 1.46 1206554 0.65
1001 - 2000 4872 5.66 6814046 3.67
2001 - 3000 1490 1.73 3660202 1.97
3001 - 4000 599 0.70 2071477 1.12
4001 - 5000 376 0.44 1685465 0.91
5001 & above 1201 1.40 157866423 85.09
Total 86039 100.00 185543625 100.00
Category No. of Shares held Percentage of Shareholding (%)
From To No. of Shareholders No. of SharesNumber % Total Number % Total

Integrity
Dedication Ethics
Values
Standards
Integrity
Bonds Ethos
Values
Dedication
Commitment
Trust Focus
Ethics
Values
24
Liquidity of SharesThe Equity Shares of the Company have been included in the Sensex of the leading Stock Exchanges.
Outstanding Stock Options
Number of Stock Options outstanding as on - 17,43,826 *
December 31, 2003.
Out of which 38,086 Stock Options have been exercised and are pending allotment.
* Options granted upto October 3, 2002 are entitled for additional shares (5,08,531 shares) on a proportionate basis in view of issue of bonus shares by the Company in the ratio of 3 for 5 in October 2002.
There are no outstanding warrants or any convertible instruments.
Plant Locations of the Company 1. A-8, A-9, A-10 & A-11, 2. Village Toansa, P.O. Railmajra
Industrial Area, Phase- III, Distt. Nawansahar - 144 533
Sahibzada Ajit Singh Nagar Punjab
Mohali- 160055 Punjab
3. Industrial Area 3 4. Village & PO Ganguwala
A.B. Road, Teh. Paonta Sahib,
Dewas-450001, Distt. Sirmour - 173 025,
Madhya Pradesh Himachal Pradesh
5. E-47/9, Okhla Industrial Area 6. E-2 & E-3, MIDC, Jejuri,
Phase-II, Okhla, Dist. Pune-412303
New Delhi-110020 Maharashtra
7. Plot No. B-2
Madkaim Industrial Estate,
Ponda, Goa
Address for Correspondence
Shareholders are requested to contact -
Mr. S. K. Patawari
The Company Secretary
Ranbaxy Laboratories Ltd.
25, Nehru Place,
New Delhi - 110 019
Tel. No. 011-26476092, 26452666-72 Fax No. 011-91-26465748
Email address : [email protected]
---------------------------------------------------------------------------------------------------------------------------------------
NON-MANDATORY REQUIREMENTS1. Chairman's Office
The Company maintains the Office of the Chairman at its Corporate Office at 19, Nehru Place, New Delhi-110 019 and also reimburses the expenses incurred in performance of his duties.
2. Remuneration Committee
The Company has constituted a Compensation Committee. Terms of Reference of the Committee have been described at 4(iii) herein above.
3. Shareholders Rights
The Quarterly financial results are published in the newspapers as mentioned at 7 above and also displayed on the website of the Company. The results are not separately circulated to the shareholders.

Integrity
Dedication Ethics
Values
Standards
Integrity
Bonds Ethos
Values
Dedication
Commitment
Trust Focus
Ethics
Values
25
Auditors' certificate on compliance with the conditions of corporate governance under clause 49 of the listing agreements
To the members of
Ranbaxy Laboratories Limited
We have examined the compliance of conditions of corporate governance by Ranbaxy Laboratories Limited ("the Company") for the year ended on December 31, 2003, as stipulated in clause 49 of the listing agreement of the Company with the stock exchange.
The compliance of conditions of corporate governance is the responsibility of the management. Our examination was limited to procedures and implementation thereof, adopted by the Company, for ensuring the compliance of the conditions of corporate governance. It is neither an audit nor an expression of opinion on the financial statements of the Company.
In our opinion and to the best of our information and according to the explanations given to us, we certify that the Company has complied with the conditions of corporate governance as stipulated in the abovementioned listing agreement.
We state that no investor grievances are pending for a period exceeding one month except where disputed or sub-judice, as per the records maintained by the Shareholders'/Investors' Grievance Committee.
We further state that such compliance is neither an assurance as to the future viability of the Company nor the efficiency or effectiveness with which the management has conducted the affairs of the Company.
For Walker, Chandiok & Co
Chartered Accountants
Place : New Delhi Vinod ChandiokDated : April 22, 2004 Partner
Membership No. 10093
Annual Report 2003Corporate Governance

26
Environment Health & Safety
Ranbaxy takes considerable pride in managing its operations with a high concern for safety and environment.
Substantial resources in terms of assets and manpower were invested during the past several years to improve the performance standards. The Government of India and the Government of Punjab recognized these efforts with awards for commendable safety performance.
After the Mohali fire accident in June 2003, safety and work-related procedures were reviewed, and investments for upgrading the safety and fire prevention hardware were taken up for implementation. The National Safety Council, Mumbai carried out a detailed Safety Audit of the Mohali-II plant and the recommendations made are under implementation.
Caring for the environment is a core corporate valueand as part of this commitment, Ranbaxy upgraded the environmental protection facilities to deliver standards that would meet and exceed statutory requirements. An investment of Rs. 14 Mn was made at Toansa (Punjab), by installing a state-of-the-art membrane filtration module, which would result in total recycling of the treated effluent, with zero-discharge to the environment, and a modern incineration plant for handling all hazardous solid and liquid wastes. The filtration unit is in the process of being commissioned, while the incinerator is nearing completion. Similar facilities for treating effluents will be installed at Mohali by the end of 2004, and at Dewas (Madhya Pradesh), by 2005.
Safety and work related procedures were reviewed, and investments for upgrading the safety and fire prevention hardware were taken up for implementation.

Environment Health & Safety Annual Report 2003

Out-think
Inspire
Specialize Enable
Discover
Initiate Innovate
Envision Learn
Launch Invent
Formulate
Develop
Create
NDDS

Annual Report 2003
The quest for wisdom beyond knowledge... The race towards new streams of understanding... Ranbaxy never tires in its quest towards new frontiers of discovery.
The Chemistry of Ideas

30
n Apart from this, a goal-oriented and multi-disciplinary team-driven approach coupled with operational efficiencies to reduce cost and timelines, will be emphasized to deliver quality clinical compounds.
n Finally, the Company will build alliances with pharmaceutical and biotechnology industry partners to access novel targets as well as corresponding hits and leads that will be optimized and tested in early clinical trials. These strategic imperatives have started showing results.
With this focus, the Drug Discovery Team made considerable progress in the area of New Drug Discovery Research.
Two innovative products have entered Proof-of-Concept studies in humans. RBx-2258, licensed to Schwarz Pharma, is progressing well in Phase II clinical trials for Benign Prostatic Hyperplasia and RBx-7796 entered separate Phase II trials for Allergic Rhinitis and Asthma.
After successful pre-clinical development, two Investigational New Drug (IND) applications were filed, one each for BPH and Urinary Incontinence. During the year, the drug discovery team filed a total of 41 patents.
The Company also entered into an alliance with GlaxoSmithKline (GSK), to discover and develop novel therapies in Ranbaxy's four focus therapeutic areas. In a first-of-its-kind agreement in India, GSK will provide hit molecules that act on drug targets specific to Ranbaxy and GSK. The Ranbaxy R&D team will optimize these hits to clinical candidates. In some of the cases, Ranbaxy will develop the compound to Phase IIa clinical trials. GSK will carry out late stage development of all compounds.
As its corporate social responsibility towards addressing unmet diseases in developing countries, the Company joined hands with 'Medicines for Malaria Venture' (MMV), Geneva, for the development of an Anti-malarial drug. MMV identified Ranbaxy as an ideal partner for this collaboration and will support the program. Under this collaboration, Ranbaxy's team of scientists will work together with University of Nebraska Medical Centre, Monash University and the Swiss Tropical Institute, to identify a lead candidate. Further developmental work, from pre-clinical to clinical studies, will be carried out by Ranbaxy. Besides, the Company will also have worldwide rights for the registration and commercialization of the product. Under this program, a synthetic peroxide is currently undergoing pre-clinical studies at Ranbaxy. Results with this compound are encouraging and with successful development, this molecule is expected to provide a cost-effective treatment for malaria, which would be a new and a superior Anti-malarial drug over the presently available medicines.
Research & Development
The Company made strong progress in R&D during the year
2003.
and introduced a
number of value-added new products (APIs & Formulations).
New Drug Discovery Research (NDDR)The Company's investment in New Drug Discovery continued to grow in 2003. A number of scientists were hired to constitute a talented Drug Discovery Team of over 200 medicinal chemists, pharmacologists, molecular and cellular biologists, biochemists, pharmacists and toxicologists.
The Company has mapped out a four-pronged Drug Discovery strategy, that will enable it to meet its Vision 2012.
n Discovery will continue its focus on four therapeutic areas: Infectious Diseases (Anti-bacterials and Anti-fungals), Urology [Benign Prostatic Hyperplasia (BPH) and Urinary Incontinence], Metabolic Diseases (Type 2 Diabetes, Hyperlipidemia) and Inflammatory / Respiratory Diseases (Asthma, Chronic Pulmonary Obstructive Disease and Rheumatoid Arthritis). These choices allow Ranbaxy to enter large markets with significant unattended medical needs and to build on its research strengths.
n Discovery will also primarily focus on developing best-in-class therapies involving targets for which Proof-of-Concept can be quickly and easily established in the clinic.
Driven by a multidisciplinary team of scientists with a zeal for innovation, quality and speed, the Company made significant strides in New Drug Discovery Research and Novel Drug Delivery Systems research

31
Novel Drug Delivery Systems (NDDS)Ranbaxy made significant progress in its NDDS programs during the year.
The Company successfully developed and launched 5 new products in the domestic market, in the area of Oral Controlled Release Systems, using its patented 'Platform Technologies'.
The Company filed 19 patents covering innovation in its NDDS program.
Ranbaxy also received the tentative approval for its first NDDS Abbreviated New Drug Application (ANDA) product, Metformin ER Tablet 500 mg, from US FDA.
A unique 'Platform Technology' on Gas Powdered Gastric Retention System for Spatial and Temporal Control Delivery, was licensed by Ranbaxy to Bayer AG (Germany) in 1999, for the development and marketing of once-a-day formulation of Ciprofloxacin (Cifran). Bayer launched the 1gm product in the US market in September 2003 under its brand name Cipro XR Tablets. The 500 mg product was earlier launched in January 2003 under the same brand name.
Ranbaxy's NDDS pipeline in the oral-controlled release products is progressing well. Company is evaluating other forms of delivery systems for future development.
Pharmaceutical ResearchDuring the year, 39 new products and line extensions were delivered for the domestic market.
In USA, 26 ANDAs were filed. The emphasis had been on first-to-file ANDAs with Para IV certification. In Europe,
Research & Development Annual Report 2003
77 filings, comprising 27 products were completed. This included filings of 5 products in 44 countries through the Mutual Recognition Procedure. The Pharmaceutical Research and Regulatory Affairs Group is geared to meet the requirements of the European accession countries and extend the current files of European Union to the newly included countries of Central and Eastern Europe in May 2004.
In the BRIC countries [Brazil, Russia (including Ukraine), India and China], a total number of 85 products were filed. These included 21 products for Brazil, 21 for Russia (including Ukraine), 35 for India and 8 for China. Additionally, 1 product was also developed for Japan.
During the year, the team filed 44 patents in this area.
Key Regulatory Filings and Approvals (January-December 2003)
@Includes tentative approval of Benazepril HCl Tablets, Fluconazole Tablets, Fluconazole Oral Suspension, Simvastatin Tablets, Pravastatin Sodium Tablets, Metformin ER Tablets, final approval for Loratadine, supplemental approvals for Lisinopril 30 mg Tablets and Doxycycline 75 mg Capsules in USA.
Key Countries Jan - Dec 2003
Approvals Filings @USA 24 26
Europe 36 77
BRIC
- Brazil 23 21
- Russia (Incl. Ukraine) 16 21
- India 24 35
- China 09 08
Rest of the World 468 748
Total 600 936

32
Chemical Research (Active Pharmaceutical Ingredients)
The Company continued with its focus on developing innovative, environment friendly and cost-effective technologies for high-value Active Pharmaceutical Ingredients (APIs). During the year, process developmental work was undertaken for 15 new APIs, including support for Para IV filings for 10 products. The Company also commercialized technologies for another 10 APIs.
The progress on developing New Improved Chemical Entities (NICEs) was further accelerated as a few other potential NICE candidates were identified for further development.
During the year, the Chemical Research team filed 41 patents.
Herbal Drug ResearchWith a focus on developing safe, effective, patentable and science based phytopharmaceuticals complying to international quality standards, the Company developed 3 herbal products under OTC segment, viz, Olesan Cough Syrup, Olesan Cough Syrup for Children, Eat-Ease (Appetite Enhancer for Children). Substantial emphasis was placed on product differentiation through standardization of botanical actives, minimum ingredients, batch to batch consistency and optimum dose. A number of products are under different phases of development. Work is also under progress for isolation and characterization of Active Principals (either as NCEs or potential lead compounds) to substantiate the Company's Drug Discovery program.
Intellectual Property Generated (January - December 2003)
Patent Applications* Filed in 2003
* These are first time (fresh) filings; not international or national filings of earlier applications filed in India.
Accepted / Granted / Published Patents (Unique**) in 2003
** Unique means any equivalent patents granted in other countries have not been counted.
Area INDIA PCT US Others Total
Area INDIA US Total
APIs
- Synthetic 40 -- 01 -- 41
- Fermentation 02 -- -- -- 02
Dosage Forms 43 -- 01 -- 44
NDDS 17 02 -- -- 19
Packaging 01 -- -- -- 01
NCEs 05 19 15 02 41
Total 108 21 17 02 148
APIs
- Synthetic 24 01 25
- Fermentation 02 -- 02
Dosage Forms 16 01 17
NDDS 05 01 06
NCEs 14 03 17
Total 61 06 67
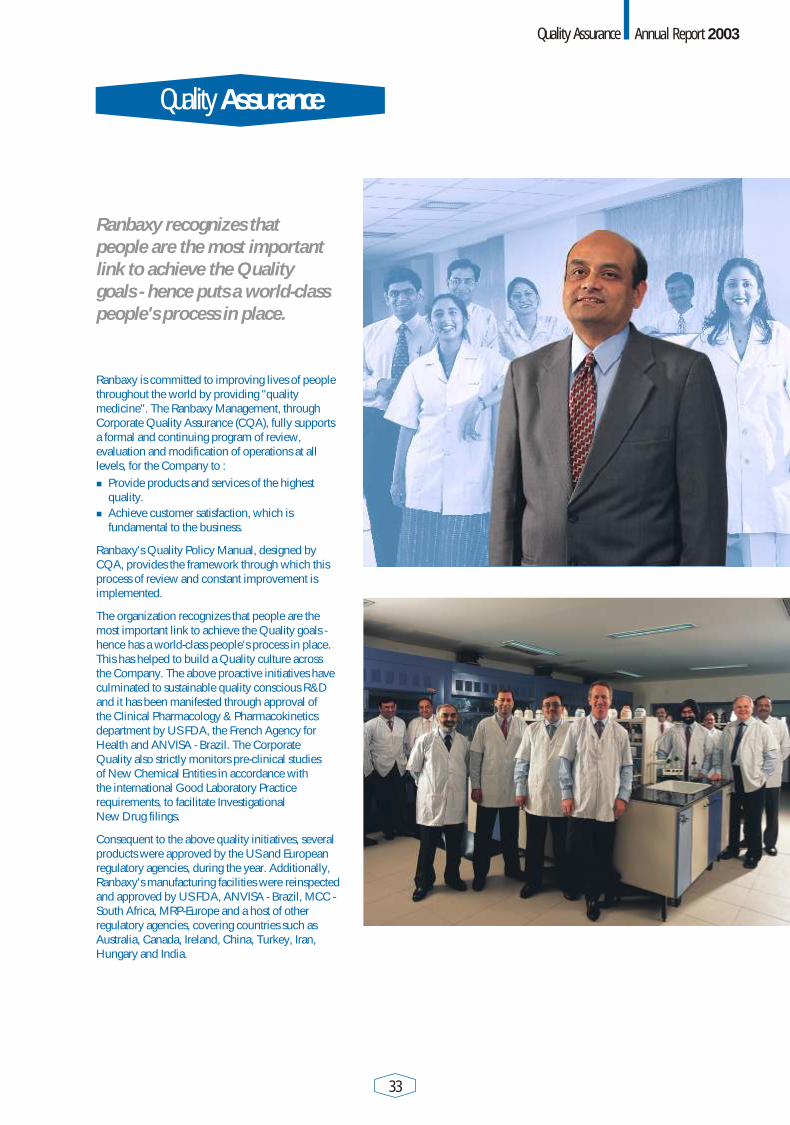
Ranbaxy is committed to improving lives of people throughout the world by providing "quality medicine". The Ranbaxy Management, through Corporate Quality Assurance (CQA), fully supportsa formal and continuing program of review, evaluation and modification of operations at all levels, for the Company to :
n Provide products and services of the highest quality.
n Achieve customer satisfaction, which is fundamental to the business.
Ranbaxy's Quality Policy Manual, designed by CQA, provides the framework through which this process of review and constant improvement is implemented.
The organization recognizes that people are the most important link to achieve the Quality goals - hence has a world-class people's process in place. This has helped to build a Quality culture acrossthe Company. The above proactive initiatives have culminated to sustainable quality conscious R&D and it has been manifested through approval of the Clinical Pharmacology & Pharmacokinetics department by US FDA, the French Agency for Health and ANVISA - Brazil. The Corporate Quality also strictly monitors pre-clinical studies of New Chemical Entities in accordance with the international Good Laboratory Practice requirements, to facilitate Investigational New Drug filings.
Consequent to the above quality initiatives, several products were approved by the US and European regulatory agencies, during the year. Additionally, Ranbaxy's manufacturing facilities were reinspected and approved by US FDA, ANVISA - Brazil, MCC - South Africa, MRP-Europe and a host of other regulatory agencies, covering countries such as Australia, Canada, Ireland, China, Turkey, Iran, Hungary and India.
33
Quality Assurance
Annual Report 2003Quality Assurance
Ranbaxy recognizes that people are the most important link to achieve the Quality goals - hence puts a world-class people's process in place.

Markets
Mantras
Generics
Acquisitions
Mergers
Collaborations
Pharma
Specialty Products
Branding
Reach
Partnerships

Annual Report 2003
A larger market share... A wider portfolio of products... And most importantly, a growing reflection of its innovative pursuits into the proprietary prescription products arena... That's what growth really means, to Ranbaxy.
The Chemistry of Growth

The Company accelerated its pace in the global markets, entering new markets of France and Spain, consequently gaining momentum and making a significant impact in the worldwide generic pharma space.

USA
New Products & MarketsIn line with the strategy, the Generics Product Business remained the mainstay of this region in 2003. The growth for the year was driven by the introduction of new products - the most significant of them being the generic version of Augmentin™, which was launched after a favorable Court decision for Ranbaxy against GlaxoSmithKline Beecham. Efforts to further increase market penetration was undertaken through the addition of Key sales and marketing personnel, as well as expanding warehousing and distribution expertise through the Company's own facilities located in Jacksonville, Florida. During the year, the Company expanded its warehousing and distribution space to 80,000 - sq. ft. Sales growth was maintained through 6 major customers representing a variety of classes of trading, including wholesalers, chain pharmacies (which includes pharmacy chains), mass merchandisers and food combination outlets. Sales were also through generic distributors and institutional buyers.
Fueling GrowthIn February 2003, the Brand Products Business division introduced Sotret™, the Ranbaxy brand for Isotretinoin Capsules, in addition to Proctosol HC® Cream and Suppositories. By the end of the year, Sotret™, gained a share of 8% (IMS December 2003) in the US market, as it competed against the innovator and two other brands. In November 2003, Dispermox™ Tablets for Oral Suspension, a dispersible form of Amoxicillin, was introduced as the first of many dosage forms, based on a technology platform, that is anticipated to yield more products in the near future. By the year-end, Ranbaxy also received approvals for Panaxine™ (Cephalexin Monohydrate) Tablets for Oral Suspension and Raniclor™ Chewable Tablets (Cefaclor).
Ranbaxy's business operations in the US performed strongly, with revenues at US$ 412 Mn (US$ 296 Mn in 2002), an increase of 39%, representing over 42% of the Company's global turnover. The year was marked by impressive sales of Cefuroxime Axetil in the first half, capturing over 90% of the market during that period, and the launch of some key molecules in the generics business. The region entered the branded business segment in a modest way with the approval and launch of new products. The OTC (Over The Counter) business continued to grow in volume with improved margins. The overall performance allowed Ranbaxy to be ranked amongst the top 10 companies (in terms of dollar volume) in the US generics pharmaceutical market in 2003.
Global Markets Review
Global Markets Review
Annual Report 2003
37
US$ 296 MnBrands OTC Generics
1% 8%
91%
Brands OTC Generics US$ 412 Mn
6% 8%
86%
2003
2002

The existing products have been launched using outsourced field forces and, additional sales forces have been identified for new products to be launched in 2004. These products will be promoted through doctors by over 600 sales representatives. Besides, various non-sales force promotions through mailers, doctor's meets, etc., would help create value and fuel the growth of the Brand Products Division in 2004, and serve as a platform for other product additions in the future.
Expanding Product PortfolioConcurrently in 2003, efforts to increase the ever-expanding product portfolio flourished in the institutional market through the Market Strategies Group that gained momentum and had a significant impact on institutional buyers including hospitals, clinics and managed care organizations.
The OTC business continued to grow with the launch of Loratadine (Claritin™) in the last quarter of 2003. The shift of product portfolio away from bulk products to fill finish and Rx to OTC switch products, helped improve the quality of sales and overall profitability of the OTC business.
38
Supporting all three businesses is the Regulatory Group that enabled a continual flow of FDA approved products, which totaled 24 during the year. 2003 was also significant as the Company gained its New Drug Approval (NDA) for Riomet™ (Metformin Liquid), that is expected to be a major contributor to the Brand Products Division, in 2004. The Regulatory Group filed 26 ANDA`s (Abbreviated New Drug Applications) in 2003, which will yield dividends for the Generic and Brand Products Division in future.
Proactive Business SolutionsDuring the year, the region set up systems and procedures and implemented software to proactively take steps to be in compliance with Government and Medicare/Medicaid reporting requirements, besides providing support business through value-added business solutions.
Market Control & LeadershipDuring 2003, a 1,50,000 sq.ft., manufacturing facility in New Jersey, was acquired to ensure sufficient manufacturing capacity. The facility would be upgraded over the next couple of years to meet the commercial quantities to support the marketing of various products in the US market. Supplementing the organic growth in 2003 were the inorganic elements of strategic alliances and partnerships that focused around products and technologies.
By the end of 2003, the overall regional team represented a total of 350 people, located in three different states of the US that included: Princeton and North Brunswick, New Jersey, Jacksonville, Florida and Gloversville, New York. As the Company grew and jobs were created, much of the talent was identified and provided from within these geographic locations. Ranbaxy has far exceeded the level of employment generation that it had anticipated for the state of New Jersey, at the time operations started.
Under the leadership of Mr. Dipak Chattaraj, Regional Director & President RPI, the Team achieved new heights. The key challenge will now be to sustain the established business and reach new heights in an extremely competitive and dynamic marketplace. The recent trend of 'authorized generics' is both an opportunity and challenge that Ranbaxy is faced with in the US and the Company is doing everything to position itself to meet the challenges and capitalize on the opportunities in the days to come. It was a year that can be best characterized as one that required dedication, commitment and sound business principles in achieving the level of performance that the Region has. More importantly, it was a year in which the entire regional team got together to become a major force in the US Healthcare system / pharmaceutical market.
EUROPE
Europe was the star performer in 2003 under the leadership of Mr. Peter Burema, Regional Director, Europe, CIS & Africa.
UNITED KINGDOMRanbaxy (UK) Limited (RUKL) witnessed a successful year, with a turnover of US$ 48.3 Mn, representing a growth of 60% over 2002. This was achieved through an increased presence in the 'Branded Market' and key day-one launch of Simvastatin in the generics sector.

The year was characterized by specific focus on improving the key financial parameters. This was further complimented by building a strong and dedicated field force, together with increased automation of the activities.
During the year, RUKL joined the global SAP platform, thereby providing integrated systems in order to meet the increasing dynamics of the organization and keep abreast with the ever-increasing technology advances and local environment requirements.
The Company increased its thrust in the branded segment, in line with Ranbaxy's commitment to move up the value chain. The branded focus is being strengthened with further expansion of the team to launch Ranbaxy's first true branded product.
The year was also marked by various team-building activities, among them being the rollout of the Vision GARUDA, within which RUKL would represent one of the key entities in attaining the global vision.
GERMANYDuring the year, Basics GmbH continued to grow its operations, achieving sales of US$ 13.7 Mn, representing a growth of 56%.
Two new products, Simvastatin and Co-Amoxiclav Tablets, were launched during the year, contributing significantly to the Company's performance during 2003. The Company is confident of further improving its position in the German marketplace in the coming year, with new product introductions during 2004.
2003 witnessed a series of healthcare cost reforms in the German pharma sector. Further reforms have been introduced from January 1, 2004, where apart from the 16% compulsory rebate, the Company's payment structure, pharmacist fee's and the payment to the doctors by patients will undergo a series of change. With the market becoming price sensitive, it is expected that all drugs under one category may have a common reference price.
FRANCEDuring the year Ranbaxy initiated the process of taking over RPG (Aventis), the generic pharma business of Aventis in France. This heralded the Company's entry into the world's fourth largest pharmaceutical market. The acquisition was formalized in January 2004 and Ranbaxy Pharmacie Generiques (RPG) was rolled out,
positioning Ranbaxy amongst the Top 5 Companies in the French generic pharma space.
The Company will continue to retain the name RPG, to leverage its strong brand equity and visibility in the French generic market and will invest additional resources on the ground to further strengthen and grow this business.
The Company is acknowledged as a reputed high quality and reliable generic player with a wide range of 52 molecules including 18 of the 20 best selling molecules representing its product portfolio. The major therapeutic areas of the Company include Cardiovasculars, Anti-infectives, Gastro-intestinals, Rheumatoid/Non-Steroidal Anti Inflammatory Drugs, Neurology and Analgesics. It is supported by a strong field force, business development and regulatory team.
POLANDIn the Polish market, Ranbaxy achieved a turnover of US$ 7.9 Mn, growing at 30% over 2002.
Two new CVS products, Celipres (Celiprolol) and Ramicor (Ramipril), were launched successfully creating new opportunities for higher growth, while a further 9 products were registered during the year.
Closer association with local partners - GlaxoSmithKline and Schwarz Pharma are expected to strengthen the operations position and growth in the next few years.
SPAINThe launch of Co-Amoxiclav along with subsequent launches of Ciprofloxacin and Ofloxacin, has represented a successful period in Spain.
Following this encouraging activity, Ranbaxy's Board of Directors approved the incorporation of a wholly-owned subsidiary, "Laboratorios Ranbaxy SL” in Barcelona, in December 2003.
Global Markets Review Annual Report 2003
39

The Company has been active in filing regulatory dossiers and a number of ongoing registrations are currently in progress to provide the new subsidiary with an adequate portfolio of products for immediate commencement of business in early 2004.
REST OF EUROPE
Rest of Europe represents Nordic countries, Benelux countries and other countries in Central and Southern Europe.
Much of the focus this year has been on the accession of ten new member states into Europe and the legal, medical and regulatory changes required to be completed by May 2004.
Ranbaxy is well placed to exploit the potential of these new entrants into Europe having already established itself successfully in all the major 'accession' markets. In Hungary, Ranbaxy became the fastest growing Pharma Company and achieved a market ranking of 38 in 3 years of its operation in the market.
'Blockbuster' launches of Simvastatin and Sertraline in Central Europe provided the platform for achieving double-digit million dollar sales in Central Europe.
Operations in Western Europe were strengthened with an increasing number of product introductions and key strategic market entry plans were put in place.
BRIC COUNTRIES
BRAZIL, RUSSIA, INDIA, CHINABRAZIL
In the year 2003, Ranbaxy Farmaceutica was ranked as the 5th largest generic company. 21 new products were registered in Brazil, out of which 12 were commercialized, as most of the approvals received from National Agencia de Vigilancia Sanitaria (ANVISA) were towards the last quarter of 2003.
Simvastatin, Amoxy-Clav, Levofloxacin, Norfloxacin and Lisinopril were the major selling products. More exclusive generic products are in the pipeline for commercialization, which will further strengthen the market share of Ranbaxy in Brazil.
The major thrust of the business was with the Top 10 distributors of Brazil and leading pharmacy chains.
An expanded Quality Testing Laboratory was also established during the year, leading to in-house testing of all the products marketed, some of which were being outsourced earlier.
RUSSIA
2003 was a landmark year for Ranbaxy's Russia business operations, both in global sales as well as profits. Primary Sales for Ranbaxy in 2003 was US$ 18.4 Mn, representing a growth of 55% with a robust growth in profits. The growth compared with the 15% Pharma market growth rate in Russia, during 2003.
During 2004, Ranbaxy will be opening a distribution company. This subsidiary will enable both increased regional coverage in Russia and enhance the range of Ranbaxy products offered in the Russian marketplace.
UKRAINE BELTFollowing reorganization at the start of 2003, Ukraine Belt now comprises of Ukraine, Moldova, Belarus, Central Asian Republics, Bulgaria and Romania. Ranbaxy is steadily improving its position in these countries.
Countries in the Ukraine Belt achieved global sales of US$ 12 Mn in 2003, representing a 58% growth over 2002.
UKRAINE
Ranbaxy is ranked 19th in the Ukrainian pharmaceutical market, constituting over 500 manufacturers (Q3 2003 IMS
40

Global Markets Review Annual Report 2003
data). Amongst the foreign manufacturers, Ranbaxy's ranking is 6th compared with 11th at the end of 2002.
Ranbaxy's core products, Cifran (Ciprofloxacin), Zanocin (Ofloxacin) and Norbactin (Norfloxacin) occupy leading positions in their respective product segments.
Ranbaxy celebrated its 10th anniversary in Ukraine, with participation by important persons from the government, medical and pharmaceutical community. The event enhanced the Company's image in the Ukraine market.
In keeping with Ranbaxy's image as one of the leaders among the top generic international pharmaceutical companies, Ukraine Belt team embarked upon a dynamic process of continuous growth in this region. This has been combined with Medico-marketing training conducted for Ukraine, Romania and Central Asian Republic (CAR) field force.
INDIA
The year 2003 witnessed commendable growth across the India region through a "team work" effort. In keeping pace with the essence of teamwork and employee spirit, a series of people-oriented initiatives were undertaken during the year. This helped the Company reach out to employees and develop a bond among members of the India region. A three-pronged approach involving programs such as "Team Building", "We-Care" platforms and various processes aimed at providing "Functional Support" were tailor-made to meet the above objectives.
In order to increase focus on brand building across various divisions, marketing activities were decentralized and aligned at the SBU (Strategic Business Units) level. This facilitated ownership at the SBU's and led to better control and implementation of strategies at the field level.
Industry Firsts and GainsThe initiatives brought about a "focus" on objectives set for the year, resulting in an increase in market share to 4.83%(a growth of 5.8%) in 2003 - higher than the market growth of 5.1%. India region saw the successful launch of premium molecules in acute and chronic therapies with many 'firsts' to its credit. In the highly competitive Statin market, Rosuvas (Rosuvastatin Tablets 5, 10 and 20 mg) was launched by Ranbaxy CV division, giving a further impetus to its Statin leadership position. Desval ER (Divalproex Extended Release Tablets of 125, 250 and 500 mg) saw Solus SBU's entry in the
Anti-epileptic market. Pharma SBU gained further fillip in the hospital market with the successful launch of its first penem, Cilanem (Imipenem + Cilastatin, vials of 250 and 500mg of each molecule).
Thriving Brand Competence
2003 was a 'Year of Change' for Ranbaxy Pharma SBU, setting in motion a change process that embraced every critical growth driver for the SBU.
While key 'Brands' were identified and prioritized based on the future potential and volume of business, the older brands were managed through a maintenance strategy. Efforts were made to develop special focus on communication and promotion of brands. Post Marketing Surveillance (PMS) studies, Continuous Medical Education (CMEs) and Round Table Meets became an integral part of the marketing mix employed by the SBU. Field force managers were trained to conduct CMEs; a record number of CMEs were conducted during the year. The formidable field force of Pharma augmented the strong relationship with the medical fraternity, by increased scientific information dissemination.
The coordinated efforts resulted in
n Pharma SBU attaining number 2 position in Cephalosporins from the fourth quarter of 2003, with a market share of 12% (Source: ORG, Dec'03).
n An aggressive entry in the premium injectables market with the launch of Cilanem (Imipenem+Cilastatin), Cefdiel I (Cefipime inj of 0.5 and 1 gm) and Ceftop [Cefoperazone + Sulbactam (vials containing 500 mg of Cefoperazone and 500 mg of Sulbactam, also available in 1gm strength of each molecule)].
n Rofibax (Rofecoxib Tablets of 12.5, 25 and 50 mg) despite the onslaught of various low priced brands, and Romilast (Montelukast Tablets of 4, 5 and 10 mg), Ranbaxy's brand in Asthma, maintained their No 1 positions.
Focused Presence
Project Pyramid set the stage for increasing Ranbaxy's Cardiovascular and Diabetes presence by creating a specialized SBU of Ranbaxy CV division, with an exclusive focus on Cardiovascular & Anti-Diabetics (CVD) market. After its formation in July 2002, the Ranbaxy CV team worked relentlessly to create a canvas for writing success stories.
Understanding the importance of the customer in the Cardiovascular Market, Ranbaxy CV launched sophisticated Customer Relationship Management (CRM) strategies like HDL (Hypertension, Diabetes, Lipids) Symposia and updates, to strengthen equity with Cardiologists, Diabetologists and Physicians. Four brands, identified as key drivers of growth for the year 2003, represented the 4 main therapeutic segments within the CVD market - Lipid Lowering Agents, Anti-hypertensives, Anti-Diabetics and Anti-coagulants. The four brands, Storvas (Atorvastatin Tablets of 5, 10 and 20 mg), Covance (Losartan Tablets of 25 and 50 mg) , Pioglar (Pioglitazone Tablets of 15 and 30 mg) and Ceruvin (Clopidogrel Tablets of 75 mg) showed strong growth and were primarily responsible for driving the divisional market shares.
Expanding Stancare RangeStancare SBU is focused on maximizing revenues in the area of Anti-infectives amongst the existing range and is aggressively exploring for additional molecules/brands in new therapy areas to exploit market potential. Stancare
41

42
2003 was on relationship building with core customers and suppliers. The division with its strong distributor network spread across India and with a product portfolio of over 215 Stock Keeping Units (SKUs) is managed by a well-knit team of over 30 people in the field. A strong and dedicated team of 15 manufacturers has been developed to cater to the ever-increasing product requirements. These initiatives were responsible for Blue -R's market leadership.
CHINA
During the year 2003, the Ranbaxy (Guangzhou China) Limited, (RGCL) improved its ranking from No. 31 to No. 27 (IMS MAT Q-4'03) amongst the leading Joint Venture companies operating in China and achieved sales of US$ 12.3 Mn, a growth of 87%.
The Company strengthened its presence in the high growth therapeutic segment of Cardiovasculars with Simcor (Simvastatin) being rated among the Top10 new launches of year 2003. Cepodem (Cefpodoxime Proxetil) also became the brand leader in the first year of launch. Cifran (Ciprofloxacin) brand continued to enjoy high levels of recognition amongst the medical fraternity, with a market share of 39.4%.
The sales of Tomiron, an Original Research Company (ORC) from Toyama, Japan, increased by three fold, a tribute to the Brand building capabilities of the sales and marketing Team. These capabilities have been further reinforced through the creation of a new Excel Team, which shall focus exclusively on the launch of new branded products.
During the year, the customer-base was expanded and geographical coverage of the products were further enhanced.
Eight new product filings were done and nine product approvals were granted by the State Food and Drug Administration (SFDA) in the year 2003.
RGCL, with diversification of its product range in different therapeutic segment and introduction of new products during the year 2003, has positioned itself well, after a steep price cut of 45% of its flagship brand in 2002. A solid foundation has been laid for stronger performance in the years to come.
REST OF THE WORLD
JAPANJapan, the second largest economy of the globe, is also the second largest Pharma market in the world. Ranbaxy entered the Japanese generic market in 2002 by striking a strategic alliance with a mid-sized Pharma company - NPI.
restructured its operation to re-engineer itself into a specialty-focused division in line with the strategic objective.
The flagship brand, Zanocin (Ofloxacin), registered a 46% growth over the previous year and maintained its market leadership in the segment. This has been achieved through creative segmentation and positioning of Zanocin OD (once-a-day), an NDDS (Novel Drug Delivery System) product. The year also witnessed the launch of Refzil-O (Cefprozil). Ranbaxy was the first company to launch this 3rd generation novel oral Cephalosporin which was received well in the market. The last quarter of 2003 saw intensified activity in the Urology segment due to the changing demographics of an aging population and a rise in urological disorders. A dedicated urology task force focusing on urologist to build strong foundation for future is in place.
Enhancing Market Share
Rextar implemented various systems and procedures, which brought about significant commercial discipline. Focus on prescription generation saw upward movement in certain brands like Spasril, Ultrazox, Roscilox and Statum range.
Year 2003 was a year of consolidation of market share and new initiatives for Rexcel as the division registered an increase in market share from 0.59% (ORG Dec 2002 MAT) to 0.63% (ORG Dec 2003 MAT).
Crosland's commitment to Dermatology was reinforced by the introduction of a new Anti-histamine brand, Teczine (Levocetirizine). The product was among the top 10 introductions in the industry during the year 2003 and was No. 1 among the new product introductions by Ranbaxy. Minoz (Minocycline), introduced in June 2003, also received excellent response.
Solus, the CNS SBU, dedicated to the service of neurologists and psychiatrists, consolidated its position in the CNS market. Solus is ranked No. 2, in the represented product market. Serlift, the No. 1 brand in the Sertraline category in India, maintained leadership position in the year 2003. The SBU also consolidated its position in the Antidepressant market with the launch of Cilentra (Escitalopram) and Olanex F (Olanzapine+Fluoxetine). In 2003, two new Antipsychotics, Socalm (Quetiapine) - the No. 2 brand in the segment and Aripra (Aripiprazole) - the No. 3 brand in the segment, were launched. Ground-breaking marketing strategies marked the launch of the product Desval ER (once daily NDDS Valproate) in the Anti-epileptics market for the first time in India. Both Desval ER and Selzic (Oxcarbazepine) have provided an opportunity to augment presence of Solus in the neurology segment. The year 2003 also reiterated Ranbaxy's commitment towards technological advancements in field operations through sales force automation of Solus, implementing an e-reporting system.
Super Specialties SBU continued its foray in the Anti-HIV segment through the launch of Virol ALZ Tablets (Abacavir 300 mg + Lamivudine 150 mg +Zidovudine 300 mg) and Virol Tablets (Abacavir 300 mg). Nephrology portfolio was enhanced through the launch of Ceriton (EPO).Xtroz (Gemcitabine) was launched in the Oncology segment . The division created a dependable pool of Key Opinion Leaders in all the three segments with increased enrollment of patients and a dedicated field force in all the 3 therapy areas.
Year 2003 saw Blue-R increase its ORG market share to 0.54% (0.49% in 2002), thus strengthening its position as the 2nd largest company in the Generics segment. The focus in
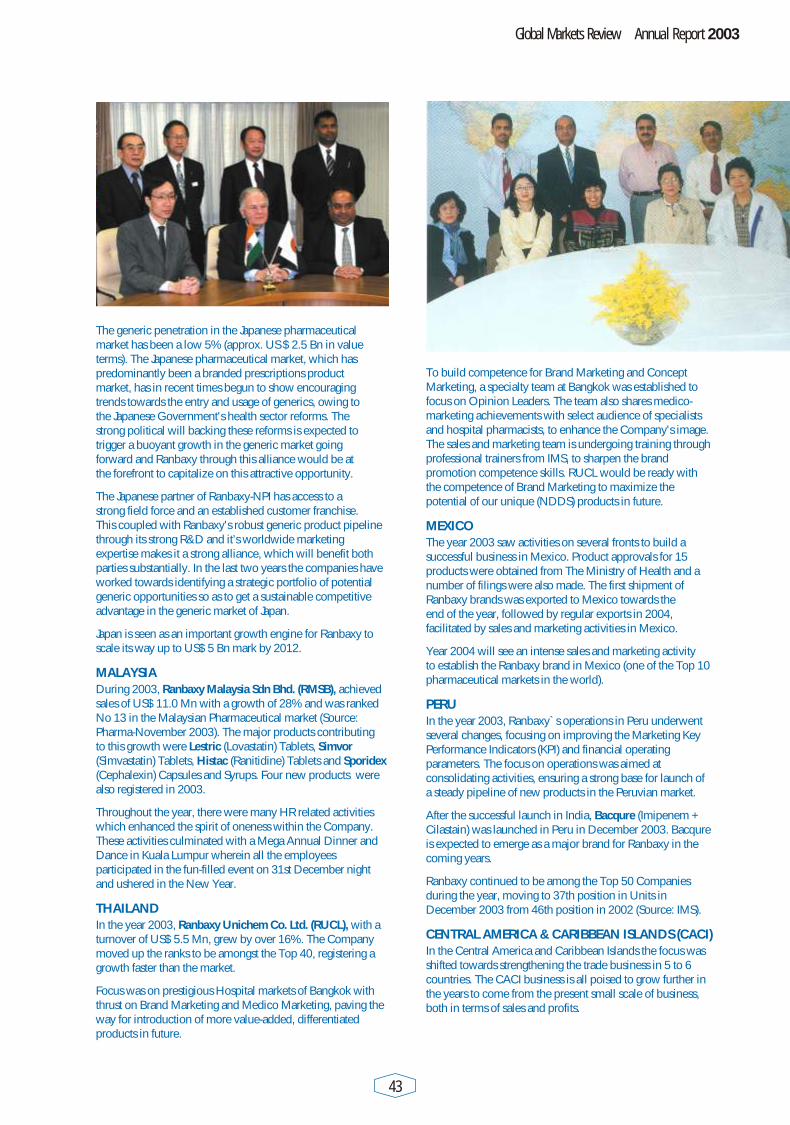
Global Markets Review Annual Report 2003
43
To build competence for Brand Marketing and Concept Marketing, a specialty team at Bangkok was established to focus on Opinion Leaders. The team also shares medico-marketing achievements with select audience of specialists and hospital pharmacists, to enhance the Company's image. The sales and marketing team is undergoing training through professional trainers from IMS, to sharpen the brand promotion competence skills. RUCL would be ready with the competence of Brand Marketing to maximize the potential of our unique (NDDS) products in future.
MEXICOThe year 2003 saw activities on several fronts to build a successful business in Mexico. Product approvals for 15 products were obtained from The Ministry of Health and a number of filings were also made. The first shipment of Ranbaxy brands was exported to Mexico towards the end of the year, followed by regular exports in 2004, facilitated by sales and marketing activities in Mexico.
Year 2004 will see an intense sales and marketing activity to establish the Ranbaxy brand in Mexico (one of the Top 10 pharmaceutical markets in the world).
PERUIn the year 2003, Ranbaxy`s operations in Peru underwent several changes, focusing on improving the Marketing Key Performance Indicators (KPI) and financial operating parameters. The focus on operations was aimed at consolidating activities, ensuring a strong base for launch of a steady pipeline of new products in the Peruvian market.
After the successful launch in India, Bacqure (Imipenem + Cilastain) was launched in Peru in December 2003. Bacqure is expected to emerge as a major brand for Ranbaxy in the coming years.
Ranbaxy continued to be among the Top 50 Companies during the year, moving to 37th position in Units in December 2003 from 46th position in 2002 (Source: IMS).
CENTRAL AMERICA & CARIBBEAN ISLANDS (CACI)In the Central America and Caribbean Islands the focus was shifted towards strengthening the trade business in 5 to 6 countries. The CACI business is all poised to grow further in the years to come from the present small scale of business, both in terms of sales and profits.
The generic penetration in the Japanese pharmaceutical market has been a low 5% (approx. US $ 2.5 Bn in value terms). The Japanese pharmaceutical market, which has predominantly been a branded prescriptions product market, has in recent times begun to show encouraging trends towards the entry and usage of generics, owing to the Japanese Government's health sector reforms. The strong political will backing these reforms is expected to trigger a buoyant growth in the generic market going forward and Ranbaxy through this alliance would be at the forefront to capitalize on this attractive opportunity.
The Japanese partner of Ranbaxy-NPI has access to a strong field force and an established customer franchise. This coupled with Ranbaxy's robust generic product pipeline through its strong R&D and it’s worldwide marketing expertise makes it a strong alliance, which will benefit both parties substantially. In the last two years the companies have worked towards identifying a strategic portfolio of potential generic opportunities so as to get a sustainable competitive advantage in the generic market of Japan.
Japan is seen as an important growth engine for Ranbaxy to scale its way up to US$ 5 Bn mark by 2012.
MALAYSIADuring 2003, Ranbaxy Malaysia Sdn Bhd. (RMSB), achieved sales of US$ 11.0 Mn with a growth of 28% and was ranked No 13 in the Malaysian Pharmaceutical market (Source: Pharma-November 2003). The major products contributing to this growth were Lestric (Lovastatin) Tablets, Simvor (Simvastatin) Tablets, Histac (Ranitidine) Tablets and Sporidex (Cephalexin) Capsules and Syrups. Four new products were also registered in 2003.
Throughout the year, there were many HR related activities which enhanced the spirit of oneness within the Company. These activities culminated with a Mega Annual Dinner and Dance in Kuala Lumpur wherein all the employees participated in the fun-filled event on 31st December night and ushered in the New Year.
THAILANDIn the year 2003, Ranbaxy Unichem Co. Ltd. (RUCL), with a turnover of US$ 5.5 Mn, grew by over 16%. The Company moved up the ranks to be amongst the Top 40, registering a growth faster than the market.
Focus was on prestigious Hospital markets of Bangkok with thrust on Brand Marketing and Medico Marketing, paving the way for introduction of more value-added, differentiated products in future.

44
Five products were launched during the year, two of which allowed RXSA to enter the chronic market segment. The Company also embarked on its first branded product launch exercise, with the introduction of Ceroxim (Cefuroxime Axetil).
Field operations were expanded during the year, with a new detailing team focusing on the brand promotion to specialists and key hospitals' doctors. This is expected to greatly benefit in the launch of new products like Cefpodoxime Proxetil and Sertraline, which RXSA plans to introduce in the first quarter of 2004 as branded generics.
Another significant development is the registration of four ARVs under ‘Thembalami’, the JV Company with Adcok Ingram, the largest pharmaceutical company in South Africa, which was established in 2002, to market ARVs in South Africa. Several more registrations are expected in the coming months. As one of the companies selected by the Clinton Foundation program for treatment of HIV positive patients, the Company expects to contribute appreciably in the fight against AIDS in South Africa.
EGYPTRanbaxy Egypt Ltd. (REYL) achieved a growth of 37% in sales in local currency (as per IMS), with strong growth in its new products backed by very sound marketing support. However, because of the steep devaluation in the value of the local currency, operating results in dollar terms was adversely affected, leading to turnover growth in US dollar terms of only 7%. Changes in legislation and consequent delay in registration of new products created a very challenging situation. Revised strategy, reorganization of marketing and sales organization, cost control and change in product focus which has been initiated by the local management to overcome this situation, are expected to help improve the situation in 2004.
MIDDLE EASTThe Middle East region, with its guiding objective of 'Achieving Sustainable Profitable Growth', continued its robust performance for the second year in a row. The region achieved sales of US$ 9.4 Mn, registering a healthy growth of 32% over the previous year.
Ranbaxy achieved the distinction of becoming the largest generic company in UAE. The Company is also the fastest- growing among the Top 20 companies, including innovators, and is out-growing the market by over 4 times. 3 among the 11 brands in 2003 were over a million US dollar brands and feature in the Top 50 in UAE.
AFRICAYear 2003 was a successful period for Ranbaxy in Africa, achieving total sales of US$ 40 Mn, a growth of 43% for the year.
The highlight for the year was the recognition of Ranbaxy as a leading supplier of Anti-Retro Virals (ARVs) in a majority of the countries in the African continent. With a large number of ARVs registered in more than 20 countries in Africa and a number of new formulations likely to be registered in the coming months, the Company is all set for a strong performance in 2004.
Successful entries into new markets including Ethiopia, Rwanda, Mozambique and Angola in 2003 have opened up new opportunities for growth in the coming year.
NIGERIARanbaxy Nigeria Limited (RXNL) consolidated its position as the 3rd largest Branded Generic Company in the Nigerian market with sales of US$ 12.7 Mn, a growth of 12% over 2002.
The successful launches of Revital, Klabax, Reftax and Vercef ensured consistent growth in 2003. In addition to the new product sales, the ARV segment showed remarkable growth fueled by an increase in the private market sales of ARV products. Ranbaxy, which has already established a leadership status in this segment, would strengthen it further in 2004, with the commencement of local manufacturing of pediatric dosage forms of ARVs in Nigeria.
RXNL continues its focus on providing quality service to the market and the strategy has proved to be effective by receiving a number of exclusive tenders from the Nigerian Ministry of Health. Successful marketing, public awareness and social responsibility activities contributed to the successes achieved by RXNL in Nigeria.
SOUTH AFRICA2003 was another exciting year for Ranbaxy (S.A.) (Pty) Ltd. (RXSA). The Company's sales increased from US$ 5.7 Mn to US$ 10.7 Mn, making it one of the fastest-growing companies in South Africa in 2003. Ranking within the local pharmaceutical market improved from 40 in December 2002 to 32 in December 2003.

Global Markets Review Annual Report 2003
45
Ranbaxy widened its operation in the Middle East, by commencing business in 3 additional countries viz., Kuwait, Lebanon and Saudi Arabia. Ranbaxy holds the distinction of being the first and only Indian Company present in these 3 countries.
In Sri Lanka, Ranbaxy registered a stellar performance despite a sluggish Pharma market. Ranbaxy raced to No. 2 rank (IMS Q4 MAT 2004), the highest ranking ever achieved since the Company started its operations in the country.
In Oman, Ranbaxy continued to maintain its leadership position in the private market for the fourth year in succession.
RGCH BusinessRanbaxy Global Consumer Healthcare (RGCH) completed a full year of business, achieving a turnover of Rs. 552 Mn in 2003, the highest achieved in past 7 years from the 4 brands: Revital, Pepfiz, Garlic Pearls and Gesdyp (Source:ORG)
The business achieved 30% growth in primary sales in 2003 over last year. This growth has been achieved even when the business moved from a traditional credit base collection format to a cash collection system of payment from 40 FMCG distributors. Business reported a 34% growth in secondary sales in 2003, thereby growing much faster than the Indian Pharmaceutical Industry (which grew by 5.1% according to ORG Chemist Audit Report). This is comparable to the FMCG business, which grew in single digit for the same period.
Revital, the key brand in RGCH portfolio, attained a 35% growth in secondary sales this year, with a market share of 67.1%. Revital became the 18th largest brand (in terms of sales) in the Indian Pharmaceutical market (Source: November 2003, ORG Chemist Audit Report), a significant improvement from its 32nd rank in September 2003, (a month before the brand was switched to OTC). This is the highest ranking achieved by Revital in two-and-a-half years.
Pepfiz performed exceedingly well in 2003 with a growth of 63.3% in primary sales, 74% in secondary sales and a market share of 5.1%.
The distribution infrastructure of RGCH continued to grow from strength to strength throughout the year in terms of number of distributors, number of exclusive Distributor Sales Representatives (DSRs) and coverage.
The Business Communication Strategy was to have an integrated communication with doctors at one end and consumers at the other. In line with this approach, the business brought together the effort to reach Doctors and to continue the prescription flow and retain and increase doctor-endorsement for RGCH brands. This was done along with consumer communication and widespread availability through enhanced coverage. The effort has resulted in Sales and Prescription growth.

Product Review
Ranbaxy has strong presence in all major therapeutic segments. Sales in 2003 demonstrated the width and strength of Ranbaxy product portfolio.
contributed US$ 63 Mn, followed by Cephalexin (Sporidex) US$ 51 Mn, Clindamycin US$ 34 Mn, Ciprofloxacin (Cifran) US$ 32 Mn, Minocycline US$ 23 Mn and Cefaclor (Keflor/Vercef) US$ 20 Mn.
Ganciclovir, launched in the US market this year, succeeded in garnering a large market share. Another significant launch in the US market was Dispermox, the branded version of Amoxicillin Tablets for oral suspension. Dispermox embodies a new dosage form of a time-tested Antibiotic to provide additional benefits in terms of dosing accuracy. This new dosage form of Amoxicillin is expected to be especially beneficial for pediatric patients. Ranbaxy also received US FDA approval to commercialize a similar dosage form of Cephalexin as Panixine DisperDose.
In India, Ranbaxy continued to be a force to reckon with in the Anti-infectives arena with its three brands - Sporidex, Cifran and Mox ranking among the Top 25 pharmaceutical brands as per the ORG-MARG. Ranbaxy also launched Cilanem (Imipenem+Cilastatin), a high end injectable Anti-infective for serious infections for the first time in the Indian market.
HIV/AIDSThe Anti-HIV business witnessed robust growth during 2003 with Ranbaxy emerging as one of the leading generic manufacturers of Anti-Retro Viral (ARV) drugs. The Company received WHO pre-qualification for its fixed dose combinations, Triviro-LNS Tablets (Lamivudine+ Stavudine+Nevirapine) and Coviro-LS Tablets (Lamivudine+ Stavudine), taking the tally of the Company's WHO pre-qualified Anti-HIV products to 22, the highest for any company. Ranbaxy presently markets 13 bio-equivalent generic ARVs in 34 countries globally. As a responsible corporate entity from a developing nation, Ranbaxy has constantly endeavored to provide quality ARV generic drugs at affordable prices. In pursuance of this objective, Ranbaxy entered into a landmark agreement with The William
Global audited pharmaceutical sales have been estimated by IMS World Review to reach US$ 466.3 Bn in the year 2003, with a robust growth rate of 9%. North America, Europe and Japan accounted for 88% of audited worldwide pharmaceutical sales. The top three therapeutic categories worldwide were Cholesterol and Triglyceride Reducers, Anti-ulcerants and Antidepressants.
Ranbaxy has strong presence in all major therapeutic segments. Sales in 2003 demonstrated the width and strength of the Ranbaxy product portfolio. Existing products strengthened their respective positions in the marketplace and were well supported by successful new product introductions. Some significant launches included Simvastatin in the UK market, Sotret (Isotretioin), Dispermox, Co-Amoxyclav and Ganciclovir in the US and Cilanem (Imipenem + Cilastatin), Rosuvas (Rosuvastatin), Refzil-O (Cefprozil), Desval ER (Divalporex ER), Aripra (Aripiprazole) and Roliten (Tolterodine) in the Indian market.
The Company is progressively evolving its branded products portfolio, keeping in view the proprietary business objective of 2012, while simultaneously maintaining focus on enriching and enlarging the generic business.
Ranbaxy Top 10
Anti-infectivesAnti-infectives, a US$ 18 Bn market, creates a perpetual opportunity for the drug industry, as new antibiotics are constantly needed to target resistant organisms. Anti-infectives franchise sustained dynamic momentum and remained the major revenue earner for Ranbaxy in 2003.
Cefuroxime Axetil was the star performer for second year in a row, earning over US$ 100 Mn in 2003. Co-Amoxyclav (Enhancin/Mox-clav) boosted by the launch in the US market, was the second best selling antibiotic, with US$ 85 Mn in sales. Amoxicillin and its combinations (Mox/Ranoxyl)
Rank Product Sales (US$ Mn)
1 Cefuroxime Axetil 103.1
2 Co-Amoxyclav 84.9
3 Amoxicillin & Combination 63.2
4 Cephalexin 51.2
5 Simvastatin 35.1
6 Clindamycin 34.8
7 Ciprofloxacin 33.0
8 Minocycline 23.6
9 Isotretinoin 21.9
10 Ranitidine 20.9
46

Jefferson Clinton Foundation to supply ARVs at reduced prices to 15 countries in Africa and the Caribbean. This agreement will affect millions of patients in these countries.
CardiovascularsCardiovascular drugs, with sales of over US$ 73 Mn, was the second largest therapeutic category for Ranbaxy in the year 2003.
Simvastatin (Simvor/Simvotin) was the best-selling Cardiovascular product and was also among the Top 5 products overall for Ranbaxy. ‘First day’ launch in the UK market contributed to a total sales of US$ 35 Mn. In the Indian market, Storvas, Ranbaxy's brand of Atorvastatin, maintained its leadership position with a 21% share of the total statins market. Ranbaxy also launched the most recent statin, Rosuvastatin (Rosuvas) in India to further augment its presence in this highly competitive segment.
Anti-hypertensive agents Lisinopril and Enalapril were other significant contributors to Cardiovascular segment for Ranbaxy.
MusculoskeletalFavorable demographics and a shift to technologically advanced products are fueling the growth in the musculoskeletal market. The demand for musculoskeletal products continues to grow with the aging population.
Rheumatology and Musculoskeletal drugs grossed approximately US$ 51 Mn with Ketorolac Tromethamine (Ketanov) being the major contributor to sales in the year 2003.
In India, Ranbaxy ranked at the top in terms of prescription share from the Orthopedist specialty. Notable among the musculoskeletal products in the Indian market were Rofibax (Rofecoxib) which remained the leading brand in the Cox-2 inhibitors market and Volini (Diclofenac), commanding a significant market share and maintainingits strong leadership position in the Topical Non Steroidal Anti-Inflamantory Drugs (NSAIDs) segment.
Gastrointestinals Ranbaxy markets a number of gastrointestinal products including Ranitidine, Proton pump inhibitors - Omeprazole, Esomeprazole, Lansoprazole and Pantoprazole, H. pylori eradication kits, Digestive enzyme combinations, Antacid combinations and various Laxatives. Gastrointestinal drugs registered sales of over US$ 49 Mn in 2003, strongly supported by sales of Ranitidine (Histac) and Omeprazole - (Omesec/Romesec).
Central Nervous System (CNS) Overall, the CNS segment contributed US$ 41.3 Mn sales in the year 2003. Lorazepam was the leading product in the CNS segment, closely followed by Citalopram and Pentazocine (Fortwin).
In the Indian market, Serlift (Sertraline) maintained its leadership brand status with a 27.6% market share. A significant achievement in this therapeutic area was the launch of Desval ER (Divalproex ER), a technically advanced and differentiated NDDS product for treatment of epilepsy, migraine and manic disorders.
Annual Report 2003Product Review
47

DermatologyDermatology is shaping up as a key therapeutic category for Ranbaxy, achieving sales of over US$ 41 Mn in the year 2003, registering a growth of 88.5% over last year. These strong trends were largely boosted by successful launch of Sotret, the branded version of the Anti-acne drug Isotretinoin, in the US market. Sotret was the leading Dermatological product for Ranbaxy in the year 2003, registering sales of US$ 22 Mn. In the Indian Market, Ranbaxy was ranked at the No. 2 position in terms of overall prescriptions from dermatologists.
NutritionalsRevital, Ranferon and Riconia have placed the Company in strong position in the Nutritional segment. Revital registered sales of over US$ 11 Mn, well supported by its OTC promotion in India. Media campaigns highlighting the value of this brand have been successful in increased visibility and sales. ‘Iron supplements’ including Ranferon/Fenules accounted for another significant contributor to this category. Riconia maintained its top position in the Indian market in the Multivitamin multimineral segment.
RespiratoryRespiratory drugs brought in US$ 27.8 Mn in sales in 2003, with Loratadine being the leading product. Romilast (Montelukast) maintained its leadership brand status in the oral solids respiratory market in India, with a market share of approximately 45%. Other key products for the Company in this segment include Fexofenadine (Altiva), Chericof and other Cough and Cold mixture preparations.
48
Global Licensing
Global Licensing at Ranbaxy focused on creating research alliances and networks during 2003. The highlight of the year was the signing of a path-breaking deal with a leading global pharma major, GlaxoSmithKline (GSK), in October 2003. The collaboration will provide an opportunity to both organizations to leverage each other's strengths in discovering and developing new drugs.
Ranbaxy also signed an agreement with Medicines for Malaria Venture (MMV), Geneva, to develop novel treatment therapies for Malaria. In this agreement, Ranbaxy will carry out the development, and file an Investigational New Drug (IND), once it has established efficacy and safety in the pre-clinical phase. MMV will fund the research and development expenditure, while Ranbaxy will retain the right to manufacture and market the product in specified territories.
In another partnership deal, Ranbaxy and Anna University, Chennai (India), signed an agreement for joint research on discovering new drugs. In this agreement, Ranbaxy will fund the Centre for Biotechnology (CBT), Anna University, to screen compounds from natural as well as synthetic sources in areas of Metabolic disorders, Urology, Inflammatory and Respiratory diseases. Ranbaxy will be responsible for pre-clinical and clinical development and commercialization of products discovered in this partnership.
Ranbaxy entered into a partnership agreement with Institute of Nuclear Medical and Allied Sciences (INMAS) Delhi, under the aegis of Defence Research Development Organization (DRDO ). Under this agreement, INMAS will conduct pharmaco-scintigraphy studies for Ranbaxy, which will enhance the efficiency of the product development process.
Global Licensing Annual Report 2003
49

Trends
Diversification
Licensing
Manufacturing
Developing
Value- additions
Markets
SynergyExpansion
Alliances
Value- additions

Annual Report 2003
The Chemistry of Change
To stay on top, it's vital to move on. And be a change leader. At Ranbaxy, the search for new vistas of opportunity is constantly transforming the organization, to make it more globally competitive.

Global Manufacturing
52
The excellent growth of the Company in terms of sales was matched with substantial capacity augmentation and modernization / automation of almost all the manufacturing facilities around the world, during 2003.
USA
In the US, the new liquid oral facility at Gloversville, New York, was approved by US FDA and was commissioned with
TMthe launch of Riomet , an Anti-diabetic liquid oral formulation.
In order to meet the robust growth in US markets, a new site was acquired, at New Brunswick, New Jersey, in late 2002. Work on the expansion of dosage forms capacity was carried out during 2003. The site was inspected and approved by US FDA in early 2004.
The existing Livingstone Avenue facility, in New Brunswick, New Jersey, was upgraded and modernized and substantial capacity expansion was carried out during the year.
ASIA PACIFIC
Work on modernization and capacity enhancement was carried out in the infusions facility and RGCL, Guangzhou, China.
Modernization / expansion was also carried out during the year at RMSB, Sungei Petani, Malaysia.
INDIA
Dosage Forms
In India, area expansion and modernization of the Cephalosporin facility at Dewas (Madhya Pradesh), was completed during the year, providing adequate capacity to meet future requirements.
Major capacity expansion work was initiated at the dosage forms facility at Paonta Sahib (Himachal Pradesh), where a new state-of-the-art facility is slated for commissioning by May, 2004. This will significantly enhance the existing capacity at Paonta Sahib.
Substantial capacity enhancement in the Fermentation facility at Paonta Sahib was completed as per schedule, during the year.
The dosage forms facilities at Paonta Sahib and Dewas had the unique distinction of being approved by WHO-Geneva, for manufacturing and supplying Anti-AIDS products throughout the world.
APIs (Active Pharmaceutical Ingredients)
Keeping in view the Company's philosophy to protect the environment, substantial investments were made in the API facility at Toansa (Punjab). The new integrated waste management system has membrane filtration, thermal evaporators and a state-of-the art incineration system. The system is under commissioning trials. Similar work is planned during the year at the Mohali (Punjab), facility.
All the facilities remained in compliance throughout the year. A record number of inspections, by various International Regulatory Agencies, were carried out successfully at various locations within India and in plants overseas.

Global Manufacturing Annual Report 2003

54
Information Technology, the Winning CatalystIn today's global business environment, processes to manage change and optimize out-performing delivery, are essential. In this scenario, Information Technology is no longer a mere resource to business; it now plays a major role as the catalyst in Ranbaxy's ‘Chemistry of Change’.
The focus of the Information Systems group has been to provide services across business verticals in the following key segments:
n Customer Interactions and Servicing
n Compliance: Financial and Regulatory
n Efficiency in Operations, including Visibility of Information to Decision Makers
n Technology based growth enablement and risk mitigation
Portal PresenceThe current flagship customer portal in India, www.ranbaxyfordoctors.com, continued its strong presence with more than 25 million hits during the year, even as the corporate website www.ranbaxy.com registered over 19 million hits in the same period. To enhance outreach to our customers and vendors, www.ranbaxypartners.com was launched to improve efficiency in our business processes by delivery of critical information, whilst bringing greater visibility into our system. New websites were established for focused information dissemination to our customers across the globe. Notable among these were www.aidonaids.com, www.sotret.com and www.dispermox.com
Customer Friendly SitesSimilarly, Ranbaxy's initiatives in the area of Customer Interactions and Servicing in the US have included implementation of best-in-class systems. This focus ensures consistent and effective handling of customer needs or any complaint, with subsequent reporting as per regulatory requirements. The Company’s US sites have been integrated onto a single voice/data communication platform, enabling a virtual integrated access to the customer services team. A significant part of Ranbaxy’s business with customers is transacted via EDI (Electronic Data Interchange). One of the leading US wholesalers recently ranked Ranbaxy's information delivery to them at the highest possible rank in their rating.
In the compliance arena, Ranbaxy has implemented industry leading solutions for Government Reporting, Medicaid claims validation and for Adverse Events Reporting. Standardization and migration of all Standard Testing Procedures and Product Specifications on a common Enterprise Document Management System across our manufacturing locations and R&D, was achieved with
workflow for change management protocols, providing user-friendly, secured access.
Field ForcesSales force automation has catalyzed field forces in various geographies. In India, a quantum jump was taken to digitize the field forces of the Mumbai headquartered sales divisions. The field forces in Brazil, South Africa and the US brand marketing divisions deployed electronic order processing and customer contact programs through various mobile devices and e-applications.
To improve internal productivity, the Company's employee portal, www.myranbaxy.com, was cascaded globally. My-Ranbaxy is a platform for Ranbaxians, irrespective of their location, to come together and share information and knowledge. Data warehouse application supported informed decision-making through analytics to India Region and Global Supply Chain. Key operating statistics and exceptions were shared using dashboards, Spectrum reports and KPI measurements. Workflows were deployed across some of the financial systems to improve compliance and also improve efficiency in operational processes and are continuously realigned to reflect changing requirements as a result of growth, including industry and regulator expectations in terms of governance and compliance.
Year of Change The year saw rollouts of our ERP (SAP R/3) to UK & Ireland extending global revenue coverage to approximately 90% through SAP. Our extended network also covered third party manufacturing of Dosage Forms and API intermediates. This side chain integration on the supply side helped improve our ex-India customer servicing. Implementation of bar-coding and warehouse management solutions in our Jacksonville distribution center, (USA), improved fill rate and accuracy significantly.
Ranbaxy is a leader in its peer group in deploying IT. The SAP R/3 delivery model of Ranbaxy was audited by SAP and awarded SAP Customer Competence Center (CCC) title to Ranbaxy. This was given in recognition of the outstanding quality of services to the user. The year also saw selection of SAP HR for global integration of HR function and advance production scheduling and optimising software from SAP (APO) to improve the effectiveness of our global supply chain.
R&DLikewise, R&D Informatics has taken major initiatives to improve productivity and reduce cycle time of speed-to-market. These include managing the creation and tracking of dossiers for worldwide submissions electronically,
...Information Technology is no longer a mere resource to business; it now plays a major role as the catalyst in Ranbaxy's ‘Chemistry of Change’.
Information Technology

55
standardizing core document management platform to manage scientific knowledge and decision data, enabling us to plan, conduct and analyze data from clinical studies electronically and ensure compliance with GCP/GLP and such other regulatory requirements with CFR 21 Part 11. Significant investments have been made in establishing a sound foundation for computing architecture, enable R&D to better manage scientific data and enabling the scientific community to make data-driven decisions on the development of the Ranbaxy product portfolio.
No technology deployment initiative would succeed without robust change in management programs including training and awareness. India locations alone invested over 1800-person days in IT related training.
Technology deployment was delivered through a robust backbone of network and hardware infrastructure. Research Informatics commissioned a state-of-the-art data center to support the exponential growth needs of our Drug Discovery and Development teams. Risk Mitigation was addressed through a Disaster Recovery site being commissioned for our ERP system, cluster servers for critical business applications including messaging, and providing redundancy links across our Wide Area Network (WAN) Productivity initiatives were taken up through Storage Area Network (SAN), Voice and Data Integration and bandwidth usage optimizers.
Closed Security System
Information security for both our external and internal customers continued to receive prime attention. During the year, Ranbaxy continued to enhance security by putting in multiple levels of defenses and continuous upgradation of security infrastructure. Recognizing the limitations of technology, a simultaneous focus was placed on raising user alertness through campaigns of user involvement in training and awareness sessions on IT security.
The larger goal at play for Ranbaxy Information Systems is to be the reagent of transformation to catalyze alignment of people and business processes to deliver "delight" to external and internal customers, and thus help the organization gain a competitive advantage in fulfilling its strategic objectives through innovative use of technology.
Annual Report 2003Information Technology

Ranbaxy has emerged as the most widely covered Pharma Company by the Indian media and the CC team is further building its media relations in key markets of USA and Europe.
CORPORATE AFFAIRS
Encompassing Government Relations, Public Policy, Public Affairs and Corporate Communications, the Corporate Affairs team gives the Company the necessary profile to be able to participate meaningfully and in a constructive manner in public initiatives such as industry-wide pharmaceutical policies and regulatory functions on a global scale.
The pre-requisite for this was to successfully establish Corporate Affairs teams for various regions responsible for covering all key markets such as the USA, Europe and BRIC countries.
During the year, constant external interface was maintained through industry associations to convey the Company's viewpoints on all major issues involving marketing approvals and fiscal policy at the highest levels in the respective governments.
The Corporate Affairs team plays a significant role in maintaining cordial relationship and rapport with the Central and State health regulatory offices in India and abroad, ensuring strict adherence to their laid down norms. The Company is represented effectively in All-industry bodies and Pharma specific industry associations, globally, through the Corporate Affairs team.
CORPORATE COMMUNICATIONS
The Corporate Communications team (CC) at Ranbaxy is responsible for building, maintaining and enhancing Ranbaxy's Global Corporate Image and Reputation. It manages all facets of communications with specific focus on strategizing and implementing External and Internal Relations of the organization, in all the key markets. The two adopted, applied and practiced in tandem have built a strong Corporate equity for Ranbaxy over the years. CC achieves the above objectives by aligning all communications with the Corporate Mission, Vision, Aspirations and Values. It is engaged in conceptualizing and developing various Communication tools across different mediums such as Annual Report, Newsletters, Brochures, Multimedia Presentations, Audio- Visuals, Films, Websites, Corporate Exhibits, Corporate Advertisements, Motivational Events, etc.
Today, Ranbaxy is not only a Company of repute in India, but is also one of the best companies in the world pharmaceutical market. The Company was recently conferred with The Economic Times (a leading Indian Business Daily) Corporate Excellence Award as “The Company of the Year” in October 2003, a testimony to Ranbaxy's practicing values.
Ranbaxy has emerged as one of the most widely-covered Pharma Company by the Indian media and the CC team is further building its media relations in the key markets of USA and Europe.
During the year, significant media coverage in leading international publications such as Wall Street Journal, New York Times, Sunday Times, Financial Times, Le Monde, The Economist, Finance Asia, Business Week, The Guardian, The Forbes and International Herald Tribune, reflects Ranbaxy's growing presence in the international media.
While keeping the external audiences abreast on the Company's developments, CC is also engaged in communicating with around 9000 strong Ranbaxy family and knits them together, bringing down the global barriers of distance and language. During 2003, CC played a significant role in the Vision GARUDA Cascade globally, by
56
Corporate Affairs & Corporate Communications

conceptualizing, developing and implementing the communication plan to prepare Ranbaxians for the next decade.
Together Ahead, the Company's global internal newsletter published by Corporate Communications, has emerged as a strong brand, reflecting the sentiments of diverse members of the Ranbaxy family.
Ranbaxy World the external magazine, on the other hand has successfully portrayed the face of Ranbaxy to the external world. Both the magazines, have won Association of Business Communicators of India (ABCI) awards for best publications in its category in the year 2003.
The Annual Report of the Company is a major image- building tool as it serves as a brochure cum balance sheet, thus attaining a high degree of importance for the CC team which is responsible for developing the concept, design and content for the brochure section and networks with various functions across the globe for the production of the annual report.
The Company's Corporate Website, www.ranbaxy.com, developed and maintained by CC, provides a comprehensive global perspective on Ranbaxy. It has seen a continuous rise in the number of hits and reported over 19 million cumulative
hits during the year, Currently, the monthly hits exceed 2 million.
During the year, the corporate crisis management plan was revisited and its scope was further extended to develop a comprehensive Crisis Management Manual, which was shared with all business heads across the globe, to prepare the organization for any eventual crisis.
A Corporate Identity Manual, which lays down the guidelines for standardizing the corporate visibility and ensuring its correct usage for strengthening Corporate Brand building, has helped in establishing Ranbaxy as an enduring brand globally.
The CC Team will continuously strive to establish Ranbaxy as a Quality Global Brand, practicing good governance, thereby contributing towards enhancing Image and Corporate Reputation.
57
Corporate Affairs & Corporate Communications Annual Report 2003

Caring
Training
Inspiring
Leveraging
Encouraging
Empowering
Rewarding Delegating
Coaching
Sharing
Daring

Annual Report 2003
The Chemistry of Heart
A mind that thinks... And a heart that cares. Together, these two forces have made Ranbaxy a caring, sharing organization committed to its people, stakeholders, customers… and humanity at large.

Sharing and Growing
sharing the strategic
intent, renewed vision and aspirations of Ranbaxy over the next ten years. The communication cascade was focused on bringing Vision GARUDA to life for Ranbaxy employees.
2003 was also a year of increased focus on listening and sharing employee thoughts and ideas and engaging employees in people processes. This took the form of various feedback surveys, focus group discussions and interviews. Significantly, business leaders championed many of these activities. Feedback was sought from employees, reinforcing the value the organization holds on individual contribution in these areas.
Bringing People Together
Employee development initiatives were evident in many areas of the organization, with a significant ramp up in the amount of time and resource invested in training initiatives.
This took the form of customized Corporate, Regional and Divisional initiatives and increased participation at external programs. The programs shared many common themes including leadership development and team building. There was an overall focus on learning from within, which involved bringing groups of Ranbaxians together in formal and informal learning forums. Programs on Marketing Excellence and SAP implementation saw a truly global mix of participants. Further, a comprehensive training strategy was evolved during the course of the year, which involved the identification of learning partners and has culminated in the formation of alliances with leading learning institutes.
Recognition was high on the agenda in many divisions and the year saw significant movement in recognizing contribution beyond performance-related rewards.
Finally, 2003 was a year where HR-focused IT initiatives were at the fore. Implementation of SAP-HR modules and IT training were the obvious highlights.
The year 2003 saw the Human Resources function reaching out and connecting with customers worldwide. The function led the communication roll-out of Vision 2012,
Human Resource
60

Global Supply Chain
During the year,
at Ranbaxy in April 2003. Christened, Project SPECTRUM (Supply- chain Planning for Enhancing Customer-service To Ranbaxy's Universal Markets), with the immediate objective to "Transform the Supply Chain to substantially improve customer service levels, whilst maintaining optimal inventory levels".
A team of 45 members from across the globe representing various functions worked together on designing the new planning process incorporating best global practices and making it seamless across demand and supply. Partnering with Accenture, the worlds leading consultants in supply chain management, Project SPECTRUM has, since inception, steadily unfurled supply chain global best practices to all the markets and manufacturing plants of Ranbaxy.
With initial roll-out in the seven pilot markets - USA, UK, Germany, China, India, Vietnam and Brazil and Pilot plants at Dewas and Mohali, in India, major process transformations were introduced into the system all across the "spectrum" of the supply chain, covering demand and supply planning.
Spectrum's approach has been focused on implementing a robust integrated planning process, supported by enhancements in supply chain organization and execution capabilities.
In addition, many specific initiatives were taken to increase flexibility of supply to end-customers. Dedicated teams worked on:
n Capacity Enhancement
n New Product Launch
n Complexity Management
n Standardization and Rationalization
n Supply-Chain Operating Model
A Global Supply Chain Organization, to support and effectively carry out the recommended process to deliver the desired results, has been structured and put in place.
Customer servicing is focused by a multi-tier approach to monitor performance and continuously improve customer servicing in terms of Delivery in Full and On Time (DIFOT). Simultaneously, Inventory holdings is being monitored for increasing Global Inventory turns.
“Supply Chain” was identified as an important area to be strengthened, leading to the Global Supply Chain transformation program being initiated
Global Supply Chain Annual Report 2003
61
Having covered more than 85% of our global demand with the new processes and all India based manufacturing plants, the plan is to roll out the new process to all markets and all global plants by April 2004.
Upon stabilization of processes in all markets and plants the team is sure to achieve improved customer servicing through process driven systems. Thereafter the organization is sure to gain momentum to attain the next objective - "Build Ranbaxy's supply chain capability to be a source of competitive advantage in the global generics market".
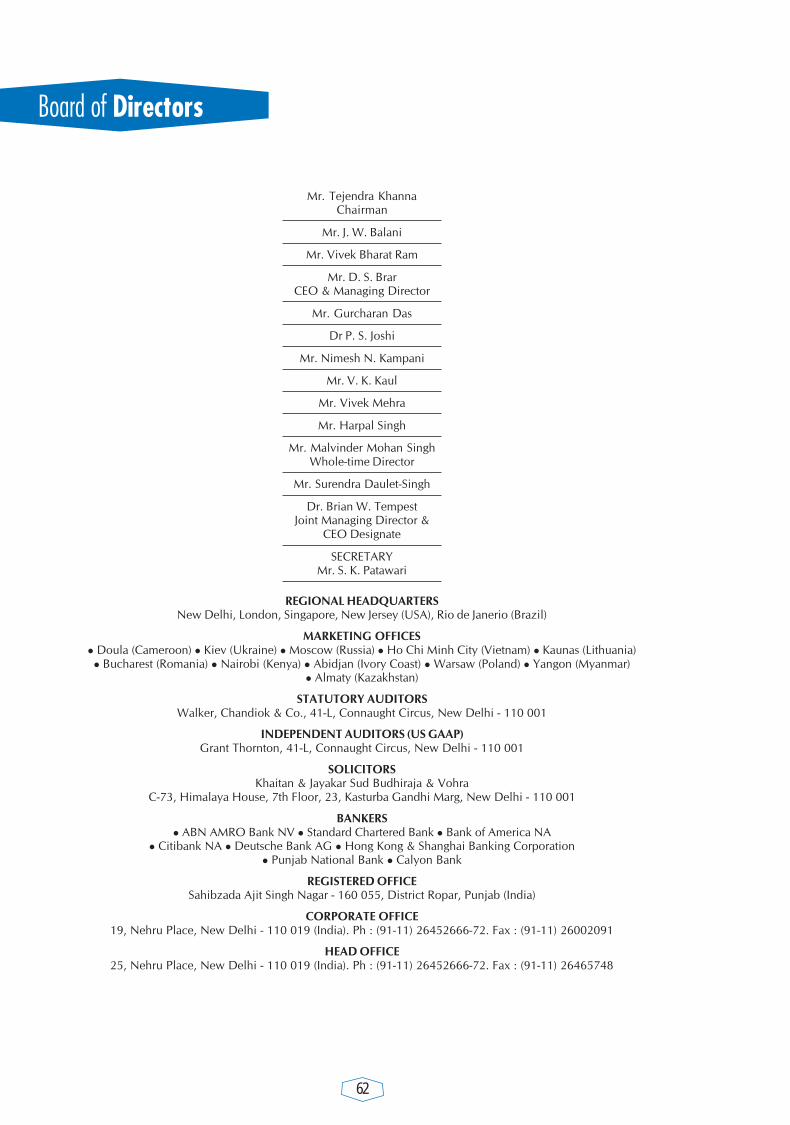
62
Mr. Tejendra KhannaChairman
Mr. J. W. Balani
Mr. Vivek Bharat Ram
Mr. D. S. BrarCEO & Managing Director
Mr. Gurcharan Das
Dr P. S. Joshi
Mr. Nimesh N. Kampani
Mr. V. K. Kaul
Mr. Vivek Mehra
Mr. Harpal Singh
Mr. Malvinder Mohan SinghWhole-time Director
Mr. Surendra Daulet-Singh
Dr. Brian W. TempestJoint Managing Director &
CEO Designate
SECRETARYMr. S. K. Patawari
REGIONAL HEADQUARTERSNew Delhi, London, Singapore, New Jersey (USA), Rio de Janerio (Brazil)
MARKETING OFFICESl Doula (Cameroon) l Kiev (Ukraine) l Moscow (Russia) l Ho Chi Minh City (Vietnam) l Kaunas (Lithuania)l Bucharest (Romania) l Nairobi (Kenya) l Abidjan (Ivory Coast) l Warsaw (Poland) l Yangon (Myanmar)
l Almaty (Kazakhstan)
STATUTORY AUDITORSWalker, Chandiok & Co., 41-L, Connaught Circus, New Delhi - 110 001
INDEPENDENT AUDITORS (US GAAP)Grant Thornton, 41-L, Connaught Circus, New Delhi - 110 001
SOLICITORSKhaitan & Jayakar Sud Budhiraja & Vohra
C-73, Himalaya House, 7th Floor, 23, Kasturba Gandhi Marg, New Delhi - 110 001
BANKERSl ABN AMRO Bank NV l Standard Chartered Bank l Bank of America NA
l Citibank NA l Deutsche Bank AG l Hong Kong & Shanghai Banking Corporationl Punjab National Bank l Calyon Bank
REGISTERED OFFICESahibzada Ajit Singh Nagar - 160 055, District Ropar, Punjab (India)
CORPORATE OFFICE19, Nehru Place, New Delhi - 110 019 (India). Ph : (91-11) 26452666-72. Fax : (91-11) 26002091
HEAD OFFICE25, Nehru Place, New Delhi - 110 019 (India). Ph : (91-11) 26452666-72. Fax : (91-11) 26465748

63
Your Directors have pleasure in presenting this 43rd Annual Report and Audited Accounts for the year endedDecember 31, 2003.
WORKING RESULTSRs. Millions
Year ended Year ended PercentageDecember 31, December 31, change
2003 2002
Net Sales 33982.69 26990.14 25.9
Profit before Interest, Depreciation and Amortisation 10041.36 7304.75 37.5
Interest 80.81 207.92
Depreciation 553.32 483.70
Amortisation 143.38 110.41
Profit before extra-ordinary items 9263.85 6502.72 42.5
Extra-ordinary Income 299.83 631.03
Profit before tax 9563.68 7133.75 34.1
Provision for tax 1615.89 897.94
Profit after tax 7947.79 6235.81 27.5
Balance as per last balance sheet 2192.04 992.41
Tax - earlier years (0.08) 576.13
Deferred revenue expenditure � (1455.70)
Transfer from:Foreign projects reserve 4.90 15.00
Balance available for appropriation 10144.65 6363.65
Appropriations:Dividend 3156.33 2434.00 29.7Tax on dividend 404.41 237.61Transfer to:� Foreign projects reserve 13.76 �� General reserve 3000.00 1500.00Surplus carried forward 3570.15 2192.04
10144.65 6363.65
CONSOLIDATED WORKING RESULTS (UNDER INDIAN GAAP)
Net Sales 44609.27 36418.45 22.5Profit before Interest, Depreciation and Amortisation 11238.58 8796.06 27.8Profit before extra-ordinary items 9796.04 7458.28 31.3Profit before tax 10147.03 8334.26 21.8Provision for tax 2538.13 1856.65Profit after tax 7608.90 6477.61 17.5Minority Interests 14.58 7.96Profit after tax and minority interests 7594.32 6469.65 17.4
OPERATIONSThe Company had a successful year under review with robust growth in sales and profits and further improvements inoperating parameters. Consolidated net sales during the year grew by 22%, while Profit after tax, registered an impressivegrowth of 17%. This strong performance was driven by an excellent growth in sales of dosage forms, operating efficienciesand cost effectiveness. The sales in USA reached US$ 412 Mn and constituted 42% of the consolidated sales. Sales inEurope grew by 51% over the prior year and contributed significantly to the results of the year. Overall, the overseas marketsconstituted 76% of the consolidated sales of the Company and most of the markets in which the Company operatesperformed well and registered strong performances.
DIVIDENDAn interim dividend of Rs.5 per share was paid in November 2003. Your Directors now recommend a final dividend ofRs.12 per share for the year ended December 31, 2003 taking the total dividend for the year to Rs.17 per share (2002 - totaldividend Rs.15 per share)
The payout ratio (total dividend as % of profit after tax) for the year 2003 is 39.7% (2002 - 39%).
Board of Directors & Report of The Directors

64
CHANGES IN CAPITAL STRUCTUREIssue of shares on exercise of Employees Stock Options
The Company allotted Equity Shares (on pari-passu basis) pursuant to exercise of stock options by the eligible employees assummarised below :
Date of Allotment No. of Shares
July 30, 2003 25,815October 13, 2003 41,994January 9, 2004 77,007April 14, 2004 77,894
CONSOLIDATED FINANCIAL STATEMENTSAudited Consolidated Financial Statements for the year ended December 31, 2003 under Indian GAAP and US GAAP formpart of the Annual Report.
SUBSIDIARIES AND JOINT VENTURESSome of the significant developments in respect of subsidiary companies are as follows :
i. An additional 15% share capital of Ranbaxy Farmaceutica Ltda (RFL), Brazil was purchased by Ranbaxy NetherlandsB.V (RNBV) taking the aggregate shareholding in RFL to 70%.
ii. RNBV acquired an additional 25% share capital of Ranbaxy PRP (Peru) S.A.C., accordingly it has now become awholly owned subsidiary of RNBV.
iii. With the acquisition of 4.33% share capital of Ranbaxy Guangzhou China Ltd. (RGCL) by RNBV, the aggregateshareholding in RGCL now stands increased to 83%.
iv. RNBV acquired additional 28.10% share capital of Ranbaxy Unichem Company Limited (RUCL), Thailand. RNBValso acquired 500,000 shares in RUCL, in the Rights Issue by RUCL. As a consequence, the aggregate shareholdingin RUCL has increased to 89.56%.
v. With the acquisition of additional 49.50% share capital of Unichem Pharmaceuticals Limited (UPL) by RNBV, theaggregate shareholding in UPL has increased to 98.50%.
vi. In December 2003, the Company signed an agreement to acquire RPG (Aventis) SA in France, subject to requisiteapprovals. RPG Aventis SA was the fifth largest generics company in France and this acquisition has given yourCompany a significant presence in the French generics market. The acquisition was completed in January 2004 andRPG Aventis is now a wholly owned subsidiary of the Company. RPG Aventis has since been renamed as RanbaxyPharmacie Generiques SAS.
vii. Laboratorios Ranbaxy SL has been incorporated in Barcelona, Spain in February, 2004 as a wholly owned subsidiary of RNBV.viii. The legal entities in USA were restructured to streamline the operations. Accordingly, now the holding company in
US is - Ranbaxy Inc. It has the following subsidiaries (i) Ranbaxy USA Inc. (ii) Ranbaxy Pharmaceuticals Inc.(iii) Ranbaxy Signature LLC and (iv) Ohm Laboratories Inc. As a part of this restructuring, Ranlab Inc. has been dissolved.
MANAGEMENT DISCUSSION AND ANALYSIS REPORTManagement Discussion and Analysis Report as required under the Listing Agreements with Stock Exchanges is enclosed atAnnexure 'A'.
EMPLOYEES STOCK OPTION SCHEMEInformation regarding the Employees Stock Option Scheme is enclosed at Annexure 'B'.
LISTING AT STOCK EXCHANGEPursuant to the delisting applications of the Company, the Stock Exchanges at Ludhiana, Ahmedabad and Delhi havedelisted the Equity Shares of the Company. Final approval from Ludhiana Stock Exchange is awaited. Delisting applicationof the Company with the Stock Exchange at Kolkata is pending for approval.
The Equity Shares of the Company continue to be listed on The Stock Exchange, Mumbai and The National Stock Exchange.The annual listing fees for the year 2004-2005 have been paid to these Exchanges.
DISCLOSURE OF PARTICULARSAs required by the Companies (Disclosure of Particulars in the Report of Board of Directors) Rules 1988, the relevantinformation and data is given at Annexure 'C'.
FIXED DEPOSITSThe Company neither accepted nor renewed any fixed deposits from the public during the year. In respect of existingdeposits that were due for repayment during the year under review, no deposits remained unclaimed.
DIRECTORS� RESPONSIBILITY STATEMENTIn terms of provisions of Section 217(2AA) of the Companies Act, 1956, (Act) your Directors confirm that :
(i) In the preparation of the annual accounts, the applicable accounting standards have been followed, along withproper explanation relating to material departures, wherever applicable.

65
(ii) The Directors have selected such accounting policies and applied them consistently and made judgements andestimates that are reasonable and prudent so as to give a true and fair view of the state of affairs of the Company as atthe end of the accounting year and of the profit of the Company for that period.
(iii) The Directors have taken proper and sufficient care for the maintenance of adequate accounting records in accordancewith the provisions of this Act for safeguarding the assets of the Company and for preventing and detecting fraud andother irregularities.
(iv) The Directors have prepared the annual accounts on a going concern basis.
DIRECTORSMr. D.S. Brar, CEO and Managing Director desired not to seek renewal of his appointment as the CEO and ManagingDirector upon expiry of his current term on July 4, 2004. Your Directors reluctantly accepted his request and placed onrecord their deep appreciation of his contribution during his long career with the Company since 1977, particularly for hisleadership in nurturing a competitive global organization and steering it admirably to achieve excellent growth and successduring his tenure as the CEO and Managing Director.
Dr. Brian W. Tempest, President-Pharmaceuticals and Whole-time Director of the Company was elevated and appointed bythe Board as Joint Managing Director and CEO Designate for the period from January 1, 2004 to July 4, 2004 and as ChiefExecutive Officer and Managing Director from July 5, 2004 to December 31, 2007. Requisite approval of shareholders forhis appointment and payment of remuneration is being sought at the ensuing Annual General Meeting.
Mr. Malvinder Mohan Singh, Regional Director-India Region of the Company was appointed as an Additional Director of theCompany effective January 1, 2004. The Board also appointed Mr. Malvinder Mohan Singh as President-Pharmaceuticalsand Whole-time Director effective January 1, 2004 for a period of five years. The Company has received a notice alongwithrequisite fee from a member under Section 257 of the Companies Act, 1956 proposing the candidature of Mr. Singh as aDirector of the Company. Requisite approval of shareholders for his appointment and payment of remuneration is beingsought at the ensuing Annual General Meeting.
Mr. V.K. Kaul, Executive Vice President-Finance & Corporate Services and Whole-time Director retired on December 31,2003 after an illustrious career with the Company of more than 28 years. Your Directors record their deep appreciation ofhis contribution during his long career with the Company.
Mr. V.K. Kaul was appointed as an Additional Director of the Company effective January 1, 2004 and holds office upto theAnnual General Meeting. The Company has received a notice alongwith requisite fee from a member under Section 257 ofthe Companies Act, 1956 proposing the candidature of Mr. Kaul as a Director of the Company.
Mr. Gurcharan Das was appointed as an Additional Director of the Company effective January 23, 2004 and holds officeupto the Annual General Meeting. He is a writer, author and a distinguished management consultant and advises variouscompanies on global corporate strategy. The Company has received a notice alongwith requisite fee from a member underSection 257 of the Companies Act, 1956 proposing the candidature of Mr. Das as a Director of the Company.
In accordance with the Articles of Association of the Company, Mr. Tejendra Khanna, Mr. Vivek Bharat Ram and Mr. VivekMehra retire by rotation as Directors at the ensuing Annual General Meeting and are eligible for re-appointment.
COST AUDITThe reports of M/s R.J. Goel & Co., Cost Accountants, in respect of audit of the cost accounts of the pharmaceuticalsubstances and dosage forms units of the Company for the year ended December 31, 2003 will be submitted to the CentralGovernment in due course.
AUDITORSM/s Walker, Chandiok & Co., Chartered Accountants, retire as Auditors of the Company at the conclusion of the ensuingAnnual General Meeting and have confirmed their eligibility and willingness to accept the office of the Auditors, if re-appointed.
PARTICULARS OF EMPLOYEESAs required under Section 217(2A) of the Companies Act, 1956 and Rules framed thereunder, the names and other particularsof employees receiving remuneration above the prescribed threshold are set out in the annexure appended to this Report.
ACKNOWLEDGEMENTSYour Directors acknowledge with gratitude the commitment and dedication of the employees at all levels that has contributedto the growth and success of the Company. The Directors would also like to thank other stakeholders including bankers andother business associates who have continued to provide support and encouragement and in particular, the members of themedical profession for their efforts to provide high quality ethical therapeutic products within India and abroad. TheDirectors take this opportunity to record their appreciation for all those who contributed to the success of your Companyand look forward to their continued support in the years to come.
On behalf of the Board of Directors
New Delhi (TEJENDRA KHANNA)Dated : May 11, 2004 CHAIRMAN
Report of The Directors

66
ANNEXURE A
MANAGEMENT DISCUSSION AND ANALYSIS REPORT
INDUSTRY STRUCTURE & DEVELOPMENTS
The Global Audited Pharmaceutical market sales grew by 9% in 2003 to reach US$ 466.3 billion. North America, Europeand Japan accounted for almost 88% of the worldwide pharmaceutical consumption in 2003.The North Americanpharmaceutical sales grew 11% to reach US$ 229.5 billion, constituting almost half of all global sales in 2003.Europe (EU)experienced sales growth of 8% to reach US$ 115.4 billion constituting 25% of the total market. The pace of growth in Japanaccelerated in 2003 to 11%, with total sales of US$ 52.4 billion constituting 11% of the total world market. Sales in LatinAmerica rose 6% to US$ 17.4 billion which is a sharp turnaround from the decline of 10% in 2002. Pharmaceutical salesin Asia, Africa and Australia grew 12% to reach US$ 37.3 billion.
The top ten therapy categories accounted for 30% of the total world market. Four of the leading ten therapy categories,Cholesterol & Triglyceride reducers, Anti-pychotics, Erythropoietin products and Anti-epileptics, each grew more than 10%with Anti-epileptics up 22% and Anti-pychotics up 20%. For the first time in 14 years, Cholesterol & Triglyceride reducersmoved ahead of Anti-ulcerants as the leading therapeutic class worldwide, with sales of US$ 26.1 Billion, an increase of 14%over 2002.
In 2003,there were 64 products with sales of over US$ 1 Billion and 23 of these were over US$ 2 Billion.
The Indian Pharmaceutical Market continues to be highly competitive and fragmented with about 24,000 players. The sizeof the Indian market was estimated to be at US$ 4.8 billion in 2003 having grown 5.1 % over last year. The Indianpharmaceutical market is ranked about 12th worldwide. Around 300 firms in this industry are in the organized sector,15000 being in the small-scale sector and the remaining being very small without any economies of scale. The total Indianproduction constitutes a little over 1% of the world market in value terms and 8 % in volume terms. India manufactures over400 bulk drugs and around 60,000 formulations being distributed through a network of 5,00,000 chemists all over thecountry.
Key developments in the Indian Pharmaceutical Sector include:
� New products launched in 2003 were the major growth drivers and accounted for around 45% of the overallmarket growth.
� Price competition continues to be intense with the average realisations declining by around 0.7%.
� The uncertainty of VAT introduction impacted the business in the first half of the year.
� The chronic therapy segment continues to improve and accounted for 26% of the total market as compared to25% in 2002.This segment mainly includes Anti diabetics, Cardiac and Neuro psychiatry.
OUTLOOK ON OPPORTUNITIES
The outlook for the global generic drug industry continues to be extremely positive. This can be attributed to several factorslike demographic trends, consumers' desire for quality and cheaper drugs, favorable political and regulatory climate andaccelerating patent expirations of branded drugs. The most significant driver for the next few years will be new patentexpirations. We estimate that around US$ 30 Billion of branded pharmaceuticals would come off patent protection over thenext few years.
Ranbaxy is well positioned to participate in this opportunity. The Company exports its products to over 100 countries andhas ground level operations in 34 countries with legal entities in 20 countries. It has a robust product pipeline andcumulative Abbreviated New Drug Applications (ANDAs) filed in the USA, as at 31st December 2003 were 121, withcumulative approvals of 81. The Company is also substantially increasing its product filings in Europe and other keymarkets.

67
OUTLOOK ON THREATS, RISKS AND CONCERNS
The risks of patent litigation, regulatory issues and product liability are a part of the global generics business, particularly inthe developed markets. The Company has implemented appropriate processes to regularly review risks and other threatsand to take suitable steps to safeguard its interests
In India, the growth rate is expected to be in single digit for the next few years. The chronic segment is likely to grow at a fasterrate than the acute segments and this would require companies in India to re-align their portfolios accordingly.
SEGMENT-WISE PERFORMANCE
Ranbaxy recorded global sales of US$ 972 Mn. registering a growth of 22% over last year. Dosage form sales constituted87% of the total global sales as compared to 85 % last year. The share of sales in overseas market was 76% as compared to72% last year.
INTERNAL CONTROL SYSTEMS AND ADEQUACY
There are well-established and documented operating procedures in the Company and its subsidiaries in India and overseas.An Internal Audit department consisting of a team of skilled employees carries out regular audits across all operations of theCompany, with reports being submitted to the Audit Committee of the Board of Directors. The Finance function is alsoadequately staffed with professionally qualified and experienced personnel.
FINANCIAL PERFORMANCE
For the year, the Company recorded net consolidated global sales of Rs. 45,301 Mn (USD 972 Mn), registering a growth of22% over last year (net of excise duty - Rs 44,609 Mn). Profit before interest, depreciation and amortization was Rs. 11,239Mn (USD 241 Mn), a growth of 28% over last year. Profit before tax at Rs.10,147 Mn (USD 218 Mn) was up by 22%, whileprofit after tax was Rs 7,609 Mn (USD 163 Mn) ,17 % better than last year.
This strong performance is attributable to increase in sales of higher value added dosage forms, initiatives taken to containcosts and improve operating efficiencies and better management of working capital.
HUMAN RESOURCES
Human resources are a valuable asset at Ranbaxy and the Company seeks to attract and retain the best talent available. TheCompany provides an environment, which encourages initiative, innovative thinking and recognizes and rewardsperformance. Training and development of its personnel is ensured through job rotation, on the job training, trainingprograms and workshops. The total number of employees of the Company as on December 31, 2003 stood at 8,788.
CAUTIONARY STATEMENT
Statements in this "Management Discussion and Analysis" describing the Company's objectives, estimates, expectationsor projections may be "forward looking statements" within the meaning of applicable securities laws and regulations.Actual results could differ materially from those expressed or implied. Important factors that could make a difference to theCompany's operations include Government regulations, patent laws, tax regimes, economic developments within Indiaand the countries within which the Company conducts business, litigation and other allied factors.
Report of The Directors

68
ANNEXURE B
Information regarding the Employees Stock Option Scheme(As on December 31, 2003)
(a) Options granted
(i) No. of options granted in the year 2003 : 9,32,950
(ii) Total No. of options grantedupto December 31, 2003 : 19,52,920
(b) Pricing formula : Average of the daily closing prices of the Equity Sharesof the Company at the National Stock Exchange for aperiod of twenty six weeks preceding to the date(s) ofgrant of options. On this basis exercise price of theoptions granted in the year 2003 were arrived atRs. 567 and Rs. 701 for the options granted on7.2.2003 and 18.8.2003 respectively.
(c) Number of options vested : 3,55,599
(d) Number of options exercised : 69,530
(e) Number of shares arising as a result of exercise of options : 1,10,656
(f) Number of options lapsed and forfeited : 1,39,564
(g) Variance of terms of options : NIL
(h) Money realised by exercise of options (Rs.) : 4,68,59,746
(i) Total Number of options in force : 17,43,826
Note: Options granted upto October 3, 2002 are entitled for additional shares (5,08,531) on a proportionate basiskeeping in view the issue of bonus shares by the Company in the ratio of 3 for 5 in October 2002.
(j) (i) Options granted in the year 2003 to senior managerial personnel :
Name Designation No. of OptionsMr. D.S. Brar CEO & Managing Director 25000Dr. Brian W. Tempest Joint Managing Director and CEO Designate 18000Mr. V.K. Kaul * Executive Vice President-Finance &
Corporate Services and Whole-time Director 18000Dr. Rashmi Barbhaiya President-R&D 12000Mr. B.K. Raizada ** Senior Vice President 6500Mr. Pushpinder Bindra Senior Vice President-Global Manufacturing 7500Mr. Udai Upendra Vice President-Global Human Resources 3000Mr. Dipak Chattaraj Regional Director-North America 7500Mr. Vinod Dhawan * Regional Director-Asia, Pacific &Latin America 3000Mr. Peter Burema Regional Director-Europe, CIS & Africa 5000Mrs. Vijaya Sampath *** Vice President-Legal & Secretarial 2000Dr. Naresh Kumar Vice President-Chemical Manufacturing 4000Mr. S.D. Kaul Vice President-Corporate Management 3000Dr. Kiran V.Marthak Vice President-Clinical Research & Medical Affairs 3000Mr. Rahul Goswami Vice President-Strategic Planning & CIO 3500Mr. K.Srinivas Vice President-API Business & Strategic Purchasing 3000Mr. Rajiv Malik **** Vice President-Pharma Research andRegulatory Affairs 7500Dr. Yatendra Kumar Vice President-Chemical Research 7500Mr. Ashok Kumar Rampal Vice President-NDDS 1500Mr. S.K. Chawla Vice President-Internal Audit 3000Mr. Atul Malhotra Head-Global Consumer Healthcare &
Regional Director-Asia Pacific & Middle East 3000Dr. A. K. Purohit Vice President-International Marketing Development 3500Mr. Lalit Ahluwalia Vice President-Business Finance 3500Mr. Jay Deshmukh Vice President-Intellectual Property 6000
* Retired on December 31, 2003** Retired on April 30, 2003*** Resigned effective December 31, 2003**** Resigned effective August 31, 2003

69
(ii) Employees who have been granted 5% ormore of the options granted during the year : Nil
(iii) Employees who have been granted options duringany one year equal to or exceeding 1% of theissued capital of the Company at the time of grant : Nil
(k) Diluted earnings per share (EPS)Before prior period and extra-ordinary items : Rs. 41.58After prior period and extra-ordinary items : Rs. 42.61
(l) (i) Method of calculation of employee : The Company has calculated the employeecompensation cost compensation cost using the intrinsic value of the
stock options
(ii) Difference between the employee compensationcost so computed at (i) above and the employeecompensation cost that shall have been recognizedif it had used the fair value of the options : Rs. 77.70 Mn (Increase)
(iii) The impact of this difference on profits and on : Profit After Tax (PAT) : Rs. 7947.79 MnEPS of the Company Less : Additional employee
compensation cost basedon fair value : Rs. 77.70 Mn
Adjusted PAT : Rs. 7870.09 Mn
Adjusted EPS : Rs. 42.19 Ha
(m) Weighted-average exercise price andfair value of Stock Options granted :
Stock options Weighted average Weighted average Closing market pricegranted on exercise price (in Rs) Fair value (in Rs) at NSE on the date of
grant (in Rs.)
12.01.2001 673 290.14 648.30
03.12.2001 595 376.88 738.95
01.04.2002 745 452.36 898.95
07.02.2003 567 265.10 634.90
18.08.2003 701 361.36 833.05
(n) Description of the method and significant : The Black Scholes option pricing model wasassumptions used during the year to estimate the developed for estimating fair value of tradedfair value of the options, including the following options that have no vesting restrictions andweighted average information: are fully transferable. Since Option pricing
models require use of substantive assumptions,changes therein can materially affect fair value ofoptions. The option pricing models do notnecessarily provide a reliable measure of fairvalue of options.
The main assumptions used in the Black- Scholes option-pricing model during the year were as follows :
Risk free interest rate : 5%
Expected life of options from the date(s) of grant : 10 years
Expected volatility : 33.83%
Dividend yield : 2.68%
Report of The Directors

70
ANNEXURE C
Information pursuant to Companies (Disclosure of Particulars in Report of Board of Directors) Rules, 1988 forming partof the Report of the Directors.
1. A) CONSERVATION OF ENERGY
� Rationalization of Motors and Pumps
a) Cooling Tower Pump sets have been replaced with optimum working pressure heads and horse power ofmotors has been rationalized.
b) Induction Motor (120 HP) was replaced by energy efficient motor for air compressor application.
c) Replacement of Chilled water pumps with energy efficient pumps.
� Installation of Auto Control Valve on the DG Cooling water main header. This resulted in shutting down onepump of 55 KW for 20 Hrs every day.
� Fan less fill less jet spray type cooling tower: Cooling tower having water flow rating 1000 Cu meter per Hour hadbeen replaced with Fan less fill jet spray type cooling tower.
� Tube light Electronic Ballast: Tube light copper ballast has been replaced by electronic ballast.
� Screw AC Compressor Chiller: Low efficiency reciprocating AC Compressors (Capacity 3*81 TR) and Vapourabsorption chiller capacity 330 TR had been replaced with highly energy efficient screw AC Compressor Chiller.
� Screw Air Compressor with variable frequency drive: Energy efficient screw air compressor with variable frequencydrive (Capacity 888 CFM) had been installed replacing low efficiency reciprocating air compressors.
� Rationalization of brine distribution pumping system.
� Installation of Vacuum boosters in dryers.
� Installation of variable frequency drive on FD fan of 12T boiler
B) IMPACT OF A) ABOVE :
� Rationalization of Motors and Pumps has resulted in annual saving of Rs. 7.0 Mn.
� Installation of Auto Control Valve on the DG Cooling water main header has resulted in shutting down one pumpof 55 KW for 20 Hrs every day, resulting in annual saving of Rs 1.2 Mn.
� Fan less fill less jet spray type cooling tower has resulted in annual savings of Rs 1.0 Mn.
� Tube light Electronic Ballast has resulted in annual saving of Rs 0.6 Mn.
2. RESEARCH & DEVELOPMENT
a) Specific areas in which R&D is carried out by the Company:
� Develop technology for Active Pharmaceutical Ingredients (APIs), key drug intermediates and conventional &value added innovative dosage forms - complying to international quality and regulatory norms.
� Develop "Platform Technologies" and "Products" in the area of Novel Drug Delivery Systems (NDDS).
� Design, synthesis and discovery of new drug molecules in select areas : Infectious diseases (antibacterials andanti-fungals), Urology (benign prostatic hyperplasia (BPH) and urinary incontinence), Metabolic Diseases (type 2diabetes, hyperlipidemia) and Inflammatory / Respiratory diseases (asthma, chronic pulmonary obstructive diseaseand rheumatoid arthritis).
� Develop Phyto-pharmaceuticals (OTC as well as ethical) with strong scientific footing, involving standardisationof botanical Actives, followed by their toxicity and clinical studies.
� GLP/cGCP complying Bioavailability / Bioequivalence, Toxicology and Clinical Studies (Phase - I, II & III).
� Innovation in packaging for improved patient convenience and compliance.
� Up-gradation of existing technologies / products on ongoing basis.
b) Benefits derived as result of R&D activities
� Technology to manufacture APIs and Dosage Forms.
� Oral Controlled Release Dosage Forms leading to better patient convenience and compliance.
� Generation of high quality data complying with the international regulatory requirements, for registration of APIsand generic dosage forms in India and abroad leading to speedy approvals.
� Improved productivity / process efficiencies.
� Internationally competitive prices and product quality.
� Safe and environment friendly processes.
� Generation of Intellectual wealth for the Company� Grant of process patents for both APIs as well as dosage forms (both conventional and novel drug delivery
systems) in USA, Europe and India.� Product patents in USA, Europe, India etc in the areas of drug discovery research.

71
� Self reliance and import substitution for conservation of Foreign Exchange.
� Foreign exchange earnings / savings.
� Speed to marketplace.
� Enhanced business through Licensing arrangements (Platform Technologies, NCEs etc) / strategic alliances /custom synthesis.
� Enhanced Global presence / visibility.
c) Future plan of action
� Continue augmenting R&D capabilities and productivity through technological innovations, use of modernscientific and technological aids, training and development, benchmarking and global networking.
� Greater thrust in the areas of Novel Drug Delivery Systems and New Drug Discovery Research.
� Enhance emphasis on Custom Synthesis and New Improved Chemical Entities to draw a greater leverage on thebuilt-in Chemical and Clinical Research infrastructure and capabilities.
� Continue developing innovative, commercially viable process know-hows for both APis and dosage forms.
� Expansion of Clinical Research infrastructure complying with international GLP/cGCP norms.
� Continue improvements in packaging for pharmaceuticals to ensure shelf-life/stability, quality and, better patientconvenience and compliance.
� Enhance national and international research networking and strategic alliances.
d) Expenditure on R&D Rs. MillionsYear ended Year ended
December 31, December 31,2003 2002
Capital 380.79 235.46Revenue 2380.49 1686.28Total 2761.28 1921.74
3. TECHNOLOGY, ABSORPTION, ADAPTATION AND INNOVATION :
a) Efforts in brief, made towards technology absorption and innovation
� As per 2(a) above.
b) Benefit derived as a result of the above efforts, e.g. product improvement, cost reduction, product development.
� As per 2(b) above.
Future course of action
� To continue developing innovative and commercially viable process know-how for APIs and dosage forms(conventional and Novel Drug Delivery System).
c) Information in case of imported technology (imports during last five years)
� Not applicable.
4. FOREIGN EXCHANGE EARNINGS AND OUTGO
a) Exports sales (excluding sales to Nepal) were Rs.24600.20 Mn for the financial year ended December 31, 2003.
� 901 product dossiers were filed with various international regulatory authorities and regulatory approvals werereceived for 576 product dossiers.
� Drug Master Files (DMFs) for APIs were filed with the regulatory authorities in several markets.
� Continued to receive income by way of royalty, technical and management service fee and dividend fromoverseas subsidiaries/affiliates.
b) Total Foreign exchange earning and outgo:
Rs. MillionsYear ended Year ended
December 31, December 31,2003 2002
Earnings 25,591.33 20156.18Outgo 10,099.37 8950.53
Report of The Directors

72
FORM - A
Form for disclosure of particulars with respect to conservation of energy
Current PreviousYear Year
A. Electricity and Fuel Consumption
1. Electricity
(a) Purchased Units (KWH) 78831535 80185981Total Amount (Rs. Mn) 308.04 299.43Rate/Unit (Rs.) Rs. 3.91 Rs. 3.73
(b) Own Generation
i) Through Diesel Generator Unit (KWH) 14988837 12038865Unit per Ltr. of Diesel Oil 3.74 3.57Cost/Unit Rs. 4.75 Rs. 4.51
ii) Through Steam Turbine/Generator Not Applicable Not Applicable
2. Coal (Specify quality and where used) Not Applicable Not Applicable
3. Furnace Oil Qty. (K. Ltrs.) 11567 12233Total Amount (Rs. Mn) 139.70 133.79Average Rate (Rs. per Ltr.) Rs. 12.08 Rs. 10.94
4. Others/internal generation Not Applicable Not Applicable
B. Consumption per unit of production
Units Standards Current Previous(if any) Year Year
ElectricityActive Pharmaceutical No specificIngredients (kwh per kg) standards - 44.91 50.48Dosage Forms (kwh per consumption 77.73 80.68
1000 packs) per unit dependson product mix
Furnace OilActive PharmaceuticalIngredients (Ltrs. per kg) 6.06 8.65Dosage Forms (K. Ltrs. per 0.01 0.01
1000 packs)Coal Not Applicable Not ApplicableOthers Not Applicable Not Applicable

73
Rs. Millions
1994-95 1995-96 1996-97 1997-98 1998 ** 1999 2000 2001 2002 2003
Results for the year
Sales 7122.4 8712.8 11482.1 13335.2 10640.5 15598.3 17366.6 20545.4 28197.9 # 35334.9 #
Index 1.0 1.2 1.6 1.9 2.0 2.2 2.4 2.9 4.0 5.0
Exports 3018.6 4068.0 5223.6 5956.9 4414.1 7323.7 8019.6 10290.8 18502.9 24674.6
Index 1.0 1.3 1.7 2.0 1.9 2.4 2.7 3.4 6.1 8.2
Gross Profit 1487.5 1828.9 2188.0 2387.6 1552.1 2562.5 3177.1 3924.1 7304.8 10041.4
Index 1.0 1.2 1.5 1.6 1.4 1.7 2.1 2.6 4.9 6.8
Profit before Tax 1303.7 1585.2 1869.4 2011.5 1240.4 2103.8 1945.4 2777.7 7133.8 9563.7
Index 1.0 1.2 1.4 1.5 1.3 1.6 1.5 2.1 5.5 7.3
Profit after Tax 1103.7 1350.2 1604.4 1866.5 1170.0 1968.8 1824.4 2519.6 6235.8 7947.8
Index 1.0 1.2 1.5 1.7 1.4 1.8 1.7 2.3 5.6 7.2
Equity Dividend 199.8 237.2 379.1 530.7 560.1 869.2 869.2 1158.9 2434.0 $ 3156.3
Index 1.0 1.2 1.9 2.7 2.8 4.4 4.4 5.8 12.2 15.8
Equity Dividend (%) 50 55 80 +++ 100 50 75 75 100 150 170
Earning per share (Rs.) 25.59 ++30.42 32.47 34.74 13.46 *** 16.99 15.74 7.32 28.86 42.61
Year-end Position
Gross Block+ 3291.8 4599.9 5848.0 7347.2 8045.6 8675.9 9241.5 9278.2 10448.8 12260.6
Index 1.0 1.4 1.8 2.2 2.4 2.6 2.8 2.8 3.2 3.7
Net Block 2598.0 3675.5 4605.9 5742.4 6135.5 6319.0 6443.7 6130.5 6753.9 7907.9
Index 1.0 1.4 1.8 2.2 2.4 2.4 2.5 2.4 2.6 3.0
Net Current Assets 5789.7 7562.1 9334.8 9032.8 8320.5 8157.5 8257.7 7454.5 9564.4 13412.9
Index 1.0 1.3 1.6 1.6 1.4 1.4 1.4 1.3 1.7 2.3
Net Worth 6430.3 8155.9 @@ 11550.0 @@ 12864.3 14008.3 14979.3 15826.9 17355.1 19623.9 24333.4
Index 1.0 1.3 1.8 2.0 2.2 2.3 2.5 2.7 3.1 3.8
Share Capital 430.5 ++443.7 494.1 537.2 1158.9 *** 1158.9 1158.9 1158.9 1854.5 1855.4
Reserve & Surplus 5999.8 7665.6 11055.9 12327.1 12849.4 13820.4 14667.6 16196.2 17769.4 22477.9
Book value pershare (Rs.) 149.08 ++199.6 233.74 239.44 120.9 *** 129.25 136.56 149.75 105.71 $$ 131.14
No. of Employees 4703 4778 6131 5655 5469 5347 5784 6424 6297 6797
Index :No. of times+ Includes Capital Work-in-Progress++ After Issue of Global Depository Shares & Post conversion of Debenture@ @ Includes Warrant option Money and Application Money pending allotment+++ Does not include Interim Dividend of Croslands research Laboratories for the year 1996-97** 9 months Apr-Dec. Indexation based on annualised figures for 9 months ended 31.12.98*** After 1:1 Bonus Issue and conversion of outstanding warrants.$ Includes Interim Dividend Rs 5 per share, prior to issue of bonus shares and Final Dividend of Rs 10 per share$$ Post issue of Bonus shares in the ratio of 3 for 5 in October, 2002.# Sales are stated net of excise duty received
Form A & Ten Years at A Glance

74
To the Members of Ranbaxy Laboratories Limited
We have audited the attached balance sheet of RanbaxyLaboratories Limited (�the Company�) as at December 31,2003 and also the profit and loss account and the cash flowstatement for year ended on that date annexed thereto. Thesefinancial statements are the responsibility of the Company�smanagement. Our responsibility is to express an opinionon these financial statements based on our audit.
We conducted our audit in accordance with auditingstandards generally accepted in India. Those standardsrequire that we plan and perform the audit to obtainreasonable assurance whether the financial statements arefree of material misstatement. An audit includes examining,on a test basis, evidence supporting the amounts anddisclosures in the financial statements. An audit also includesassessing the accounting principles used and significantestimates made by management, as well as evaluating theoverall financial statement presentation. We believe that ouraudit provides a reasonable basis for our opinion.
As required by the Manufacturing and Other Companies(Auditors� Report) Order, 1988, issued by the CentralGovernment of India in terms of sub-section (4A) of section227 of the Companies Act, 1956 (�the Act�) we give in theAnnexure, a statement on the matters specified in paragraphs4 and 5 of the said Order.
Further to our comments in the Annexure referred to above,we report that :
i) We have obtained all the information and explanationswhich to the best of our knowledge and belief werenecessary for the purposes of our audit;
ii) In our opinion, proper books of account as requiredby law have been kept by the Company so far asappears from our examination of the books;
iii) The balance sheet and profit and loss account dealtwith by the report are in agreement with the books ofaccount;
iv) In our opinion and to the best of our information andaccording to the explanations given to us, the financialstatements read to-gether with the notes thereoncomply with the accounting standards referred to insub-section (3C) of section 211 of the Act, give theinformation required by the Act in the manner sorequired and give a true and fair view in conformitywith the accounting principles generally accepted inIndia in the case of :
(a) the balance sheet, of the state of affairs of theCompany as at December 31,2003;
(b) the profit and loss account, of the profit for theyear ended on that date; and
(c) the cash flow statement, of the cash flows for theyear ended on that date.
v) On the basis of written declarations received from thedirectors and taken on record by the board ofdirectors, we report that none of the directors wasdisqualified as at December 31, 2003 from beingappointed as a director in terms of clause (g) of sub-section (1) of section 274 of the Act.
For Walker, Chandiok & CoChartered Accountants
Vinod ChandiokPartnerMembership No. 10093
Place : New DelhiDated : April 22, 2004

75
ANNEXURE TO THE AUDITORS� REPORT
Annexure to the auditors� report of even date to themembers of Ranbaxy Laboratories Limited on the financialstatements for the year ended December 31, 2003.
i) The Company is maintaining proper recordsshowing full particulars including quantitative detailsand situation of fixed assets. The Company�sprogramme of physical verification of all its fixedassets over a period of three years, is in our opinion,reasonable having regard to the size of the Companyand the nature of its fixed assets. Accordingly, aportion of the fixed assets has been physically verifiedduring the year by the management. Thediscrepancies noticed on such physical verificationwere not material and have been properly dealt within the books of account;
ii) None of the fixed assets has been revalued duringthe year;
iii) The stocks of finished goods, stores, spare parts andraw materials have been physically verified by themanagement during / at the end of the year. In ouropinion, the frequency of verification is reasonable;
iv) In our opinion, the procedures for physicalverification of stocks followed by the managementare reasonable and adequate in relation to the sizeof the Company and the nature of its business;
v) The discrepancies noted on physical verification ofstocks as compared to book records were notmaterial and the same have been properly dealt within the books of account;
vi) In our opinion, the valuation of stocks is fair andproper in accordance with the normally acceptedaccounting principles and is on the same basis as inthe preceding year;
vii) The Company has not taken any loan, secured orunsecured from companies, firms or other partieslisted in the register maintained under section 301of the Act. The management has certified that thereare no companies under the same management asdefined under sub-section (1B) of section 370 of theAct;
viii) The Company has not granted any loan, secured orunsecured, to companies, firms or other parties listedin the register maintained under section 301 of theAct. The management has certified that there are nocompanies under the same management as definedunder sub-section (1B) of section 370 of the Act;
ix) The parties to whom loans or advances in the natureof loans have been given by the Company are, exceptwhere provisions against doubtful amounts havebeen made, repaying the principal amounts asstipulated and have been regular in payment ofinterest, wherever applicable;
x) In our opinion and according to the informationand explanations given to us, there are adequateinternal control procedures commensurate with thesize of the Company and the nature of its businesswith regard to the purchase of stores, raw materials,components, plant and machinery, equipment andother assets and with regard to sale of goods;
xi) As per records of the Company, there were notransactions for purchase of goods and materialsand sale of goods, materials and services made inpursuance of contracts or arrangements required tobe entered in the register maintained under section
301 of the Act and aggregating during the year toRs.50,000 (Rupees fifty thousand) or more in respectof each party;
xii) As explained to us, the Company has a regularprocedure for determination of unserviceable ordamaged stores, raw materials and finished goodsand in our opinion adequate provision has beenmade in the books of account for the items sodetermined;
xiii) In our opinion and according to the information andexplanations given to us, the Company has compliedwith the provisions of section 58-A of the Act andthe Companies (Acceptance of Deposits) Rules, 1975with regard to the deposits accepted from the public;
xiv) In our opinion, reasonable records have beenmaintained by the Company for the sale and disposalof realisable by-products and scrap;
xv) In our opinion, the Company has an internal auditsystem commensurate with its size and the nature ofits business;
xvi) We have broadly reviewed the books of accountmaintained by the Company pursuant to the ordermade by the Central Government for maintenanceof cost records under clause (d) of sub-section (1) ofsection 209 of the Act and are of the opinion thatprima facie the prescribed accounts and records havebeen made and maintained. We have not, however,made a detailed examination of such accounts andrecords;
xvii) The Company has been regular in depositingprovident fund and employees� state insurance dueswith the appropriate authorities;
xviii) According to the information and explanations givento us, there are no undisputed amounts payable inrespect of income-tax, wealth-tax, sales-tax, customsduty and excise duty outstanding as at December31, 2003 for a period of more than six months fromthe date the same became payable;
xix) According to the information and explanations givento us and on the basis of the examination of thebooks of account carried out by us, no personalexpenses of employees , other than those payableunder contractual obligations or in accordance withgenerally accepted business practice, have beencharged to revenue account;
xx) The Company is not a sick industrial companywithin the meaning of clause (o) of sub-section (1) ofsection 3 of the Sick Industrial Companies (SpecialProvisions) Act, 1985;
xxi) In respect of trading activities, the Company has areasonable system of ascertaining damaged goodsand adequate provision has been made in theaccounts.
For Walker, Chandiok & CoChartered Accountants
Vinod ChandiokPartnerMembership No. 10093
Place : New DelhiDated : April 22, 2004
Auditors� Report

76
BALANCE SHEETAS AT DECEMBER 31, 2003 Rs. Millions
Schedule 2003 2002
SOURCES OF FUNDS
SHAREHOLDERS' FUNDSCapital 1 1,855.44 1,854.52Reserves and surplus 2 21,342.43 16,879.79
23,197.87 18,734.31
SHARE APPLICATION MONEY PENDING ALLOTMENT 19.87 0.30
LOAN FUNDSSecured 3 304.94 6.32Unsecured 4 37.62 62.67
342.56 68.99
Deferred tax liability (Net) 5 1,135.49 889.60
24,695.79 19,693.20
APPLICATION OF FUNDS
FIXED ASSETS 6Gross block 11,417.88 10,277.03Less : Depreciation 4,352.73 3,694.92
Net block 7,065.15 6,582.11
Capital works-in-progress 842.74 171.76
INVESTMENTS 7 3,375.01 3,374.98
CURRENT ASSETS, LOANS AND ADVANCESInventories 8 7,047.31 6,110.19Sundry debtors 9 4,829.44 7,029.45Cash and bank balances 10 985.30 1,013.96Other current assets 11 1,560.89 982.59Loans and advances 12 10,008.16 2,469.70
24,431.10 17,605.89
Less :CURRENT LIABILITIES AND PROVISIONSLiabilities 13 5,863.75 4,878.39Provisions 14 5,154.46 3,163.15
11,018.21 8,041.54
NET CURRENT ASSETS 13,412.89 9,564.35
24,695.79 19,693.20
SIGNIFICANT ACCOUNTING POLICIES 26
NOTES TO THE FINANCIAL STATEMENTS 27
The schedules referred to above form an integral part of the financial statements.This is the balance sheet referred to in our report of even date.
On behalf of the Board of Directors
For WALKER, CHANDIOK & CO TEJENDRA KHANNA D. S. BRAR DR. BRIAN W. TEMPESTChartered Accountants Chairman CEO & Managing Director Joint Managing Director
& CEO Designate
VINOD CHANDIOK MALVINDER MOHAN SINGH HARPAL SINGH VIVEK BHARAT RAMPartner Whole-time Director Director DirectorMembership No. 10093
RAM S. RAMASUNDARPlace : New Delhi Executive Vice President � S. K. PATAWARIDated : April 22, 2004 Finance & CFO Secretary

77
PROFIT AND LOSS ACCOUNTFOR THE YEAR ENDED DECEMBER 31, 2003 Rs. Millions
Schedule 2003 2002INCOMEOperating income 15 37,614.13 29,487.65Other income 16 210.54 202.83
37,824.67 29,690.48EXPENDITUREMaterials 17 14,522.15 12,060.31Manufacturing 18 1,386.08 1,310.80Personnel 19 2,479.15 1,949.34Selling, general and administration 20 7,015.44 5,355.12Research and development 21 2,380.49 1,686.28Prior period items 22 � 23.88
27,783.31 22,385.73
PROFIT BEFORE INTEREST, DEPRECIATION AND AMORTISATION 10,041.36 7,304.75Interest 80.81 207.92Depreciation and amortisation 23 696.70 594.11PROFIT BEFORE EXTRA-ORDINARY ITEMS 9,263.85 6,502.72Extra-ordinary items :Settlement compensation income
On closure of a contract � 485.53For dispute of patent 299.83 145.50
PROFIT BEFORE TAX 9,563.68 7,133.75Provision for tax 24 1,615.89 897.94PROFIT AFTER TAX 7,947.79 6,235.81Balance as per last balance sheet 2,192.04 992.41Tax - earlier years
Current (0.08) 4.59Deferred � 571.54
Deferred revenue expenditure � (1,455.70)
10,139.75 6,348.65Transfer from :Foreign projects reserve 4.90 15.00
Balance available for appropriation 10,144.65 6,363.65
APPROPRIATIONSDividend
Interim 927.95 579.48*Final (Proposed) 2,228.38 1,854.52
Tax on dividend 404.41 237.61Transfer to :
Foreign projects reserve 13.76 �General reserve 3,000.00 1,500.00
Surplus carried forward 3,570.15 2,192.04
10,144.65 6,363.65*Subject to deduction of tax at sourceEARNINGS PER SHARE ( Rs.) 25Before prior period and extra-ordinary items
Basic 41.81 32.89Diluted 41.58 32.86
After prior period and extra-ordinary itemsBasic 42.85 28.88Diluted 42.61 28.86
SIGNIFICANT ACCOUNTING POLICIES 26NOTES TO THE FINANCIAL STATEMENTS 27The schedules referred to above form an integral part of the financial statements.This is the profit and loss account referred to in our report of even date.
On behalf of the Board of Directors
For WALKER, CHANDIOK & CO TEJENDRA KHANNA D. S. BRAR DR. BRIAN W. TEMPESTChartered Accountants Chairman CEO & Managing Director Joint Managing Director
& CEO Designate
VINOD CHANDIOK MALVINDER MOHAN SINGH HARPAL SINGH VIVEK BHARAT RAMPartner Whole-time Director Director DirectorMembership No. 10093
RAM S. RAMASUNDARPlace : New Delhi Executive Vice President � S. K. PATAWARIDated : April 22, 2004 Finance & CFO Secretary
Balance Sheet & Profit and Loss Account
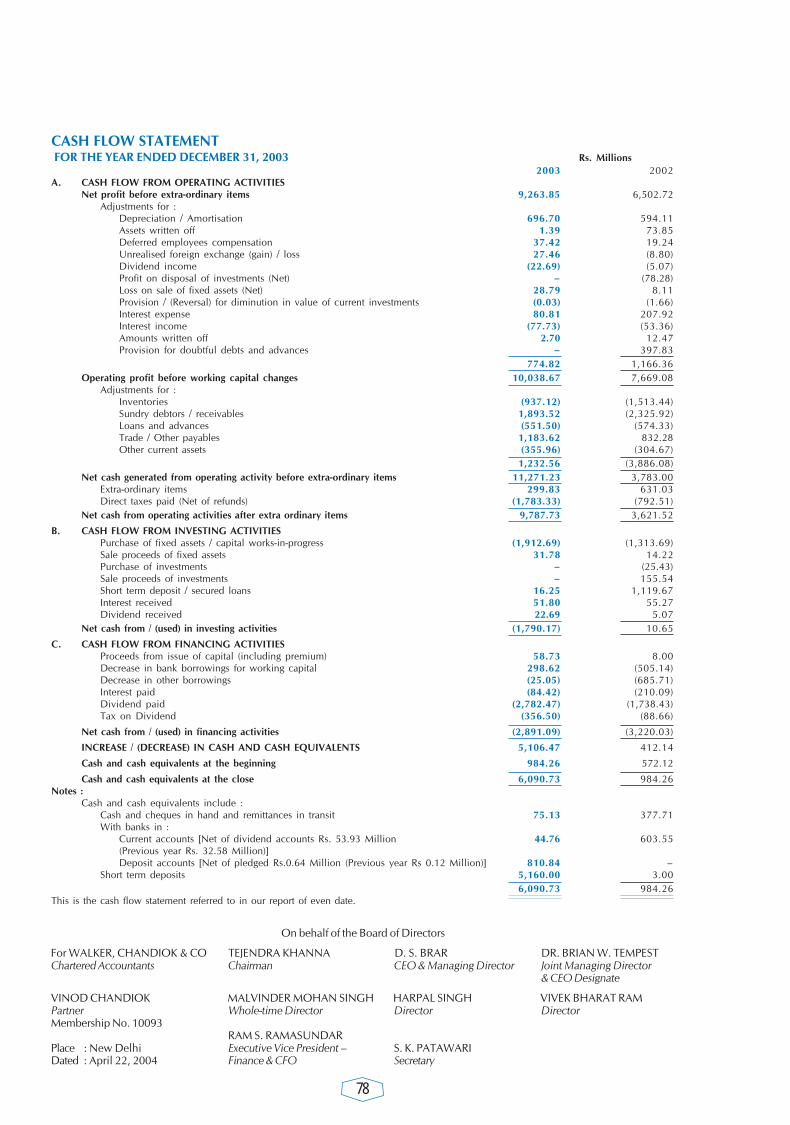
78
CASH FLOW STATEMENTFOR THE YEAR ENDED DECEMBER 31, 2003 Rs. Millions
2003 2002A. CASH FLOW FROM OPERATING ACTIVITIES
Net profit before extra-ordinary items 9,263.85 6,502.72Adjustments for :
Depreciation / Amortisation 696.70 594.11Assets written off 1.39 73.85Deferred employees compensation 37.42 19.24Unrealised foreign exchange (gain) / loss 27.46 (8.80)Dividend income (22.69) (5.07)Profit on disposal of investments (Net) � (78.28)Loss on sale of fixed assets (Net) 28.79 8.11Provision / (Reversal) for diminution in value of current investments (0.03) (1.66)Interest expense 80.81 207.92Interest income (77.73) (53.36)Amounts written off 2.70 12.47Provision for doubtful debts and advances � 397.83
774.82 1,166.36Operating profit before working capital changes 10,038.67 7,669.08
Adjustments for :Inventories (937.12) (1,513.44)Sundry debtors / receivables 1,893.52 (2,325.92)Loans and advances (551.50) (574.33)Trade / Other payables 1,183.62 832.28Other current assets (355.96) (304.67)
1,232.56 (3,886.08)Net cash generated from operating activity before extra-ordinary items 11,271.23 3,783.00
Extra-ordinary items 299.83 631.03Direct taxes paid (Net of refunds) (1,783.33) (792.51)
Net cash from operating activities after extra ordinary items 9,787.73 3,621.52
B. CASH FLOW FROM INVESTING ACTIVITIESPurchase of fixed assets / capital works-in-progress (1,912.69) (1,313.69)Sale proceeds of fixed assets 31.78 14.22Purchase of investments � (25.43)Sale proceeds of investments � 155.54Short term deposit / secured loans 16.25 1,119.67Interest received 51.80 55.27Dividend received 22.69 5.07
Net cash from / (used) in investing activities (1,790.17) 10.65
C. CASH FLOW FROM FINANCING ACTIVITIESProceeds from issue of capital (including premium) 58.73 8.00Decrease in bank borrowings for working capital 298.62 (505.14)Decrease in other borrowings (25.05) (685.71)Interest paid (84.42) (210.09)Dividend paid (2,782.47) (1,738.43)Tax on Dividend (356.50) (88.66)
Net cash from / (used) in financing activities (2,891.09) (3,220.03)
INCREASE / (DECREASE) IN CASH AND CASH EQUIVALENTS 5,106.47 412.14
Cash and cash equivalents at the beginning 984.26 572.12
Cash and cash equivalents at the close 6,090.73 984.26Notes :
Cash and cash equivalents include :Cash and cheques in hand and remittances in transit 75.13 377.71With banks in :
Current accounts [Net of dividend accounts Rs. 53.93 Million 44.76 603.55(Previous year Rs. 32.58 Million)]Deposit accounts [Net of pledged Rs.0.64 Million (Previous year Rs 0.12 Million)] 810.84 �
Short term deposits 5,160.00 3.006,090.73 984.26
This is the cash flow statement referred to in our report of even date.
On behalf of the Board of Directors
For WALKER, CHANDIOK & CO TEJENDRA KHANNA D. S. BRAR DR. BRIAN W. TEMPESTChartered Accountants Chairman CEO & Managing Director Joint Managing Director
& CEO Designate
VINOD CHANDIOK MALVINDER MOHAN SINGH HARPAL SINGH VIVEK BHARAT RAMPartner Whole-time Director Director DirectorMembership No. 10093
RAM S. RAMASUNDARPlace : New Delhi Executive Vice President � S. K. PATAWARIDated : April 22, 2004 Finance & CFO Secretary

79
SCHEDULES FORMING PART OF THE FINANCIAL STATEMENTSFOR THE YEAR ENDED DECEMBER 31, 2003
Rs. MillionsSCHEDULE 1 2003 2002
SHARE CAPITALAuthorised
199,000,000 (Previous year 199,000,000)Equity shares of Rs. 10 each 1,990.00 1,990.00
100,000 (Previous year 100,000)Cumulative preference shares of Rs 100 each. 10.00 10.00
2,000.00 2,000.00Issued, subscribed and paid up
185,543,625 (Previous year 185,452,098)Equity shares of Rs. 10 each fully paid 1,855.44 1,854.52
1,855.44 1,854.52
SCHEDULE 2RESERVES AND SURPLUSCapital reserve
As per last balance sheet 5.41 5.41Amalgamation reserve
As per last balance sheet 43.75 43.75Share premium
As per last balance sheet 5,832.99 6,520.06Add : Received during the year * 43.83 8.31
5,876.82 6,528.37Less : Utilised for issue of fully paid equity shares as bonus � 695.38
5,876.82 5,832.99* Includes Rs. 5.58 million (previous year Rs. 0.80 million) transferred from Employees Stock Options Outstanding
Foreign projects reserveAs per last balance sheet 135.13 150.13Add : Transfer from profit and loss account 13.76 �
148.89 150.13Less : Transfer to profit and loss account 4.90 15.00
143.99 135.13General reserve
As per last balance sheet 8,651.24 7,151.24Add : Transfer from profit and loss account 3,000.00 1,500.00
11,651.24 8,651.24Employee stock option
Employee stock options outstanding 164.06 112.69Less : Deferred employee compensation 112.99 93.46
51.07 19.23Surplus in profit and loss account 3,570.15 2,192.04
Total 21,342.43 16,879.79
SCHEDULE 3SECURED LOANSLoans from banks for working capital 304.94 6.32
304.94 6.32Secured against stocks, book debts, receivables andmovable properties, both present and future.
SCHEDULE 4UNSECURED LOANSFixed deposits 7.42 26.34Other than banks 3.86 10.02Deferred sales tax credit 26.34 26.31
37.62 62.67
Cash Flow Statement & Schedules

80
SCHEDULES FORMING PART OF THE FINANCIAL STATEMENTSFOR THE YEAR ENDED DECEMBER 31, 2003
Rs. Millions2003 2002SCHEDULE 5
DEFERRED TAX LIABILITY (NET)Deferred tax liability arising on account of :
Depreciation 1,418.69 1,292.591,418.69 1,292.59
Less : Deferred tax asset arising on account of :Provision for
Doubtful debts and advances 252.84 388.10Diminution in the value of investments � 4.37
Retirement benefits 25.61 5.29Others 4.75 5.23
283.20 402.991,135.49 889.60
SCHEDULE 6FIXED ASSETS Rs. Millions
AccumulatedGross block Depreciation / Net Block
AmortisationDescription 2002 Additions Deletions 2003 2003 2003 2002Land 366.47 17.70 22.50 361.67 � 361.67 366.47Buildings 1,392.29 81.40 � 1,473.69 337.13 1,136.56 1,095.55Plant and machinery 7,269.15 1,025.99 53.80 8,241.34 3,525.22 4,716.12 4,187.06Patents, trade marks and designs 716.90 � � 716.90 297.42 419.48 562.86Furniture and fixtures 365.88 61.01 4.74 422.15 149.91 272.24 238.10Vehicles 166.34 55.61 19.82 202.13 43.05 159.08 132.07Total 10,277.03 1,241.71 100.86 11,417.88 4,352.73 7,065.15 6,582.11Previous Year 9,184.43 1,235.74 143.14 10,277.03 3,694.92 6,582.11 6,036.65
Rs. MillionsSCHEDULE 7 2003 2002
INVESTMENTSCURRENTTrust securitiesOther than trade - unquoted41,089 US64 Bonds of Rs. 100 each (6.75% Tax Free) (Previous year 406,890 Units (1964 Scheme)) of the Unit Trust of India 4.11 4.08
4.11 4.08LONG TERMInvestments in government securitiesOther than trade - unquotedKisan Vikas Patra / Indira Vikas Patra 0.01 0.01Investments in shares of companies (fully paid)
Nature of Face Numbersinvestment value 2003 2002
Other than Trade :QuotedFortis Financial Services Ltd. Equity shares Rs. 10 100 100 * *The Great Eastern Shipping Company Ltd. Equity shares Rs. 10 500 500 0.03 0.03
0.03 0.03UnquotedFortis Healthcare Limited Equity shares Rs. 10 12,529,460 12,529,460 125.29 125.29Biotech Consortium India Ltd. Equity shares Rs. 10 50,000 50,000 0.50 0.50
125.79 125.79Subsidiary companies (Trade)DomesticVidyut Investments Ltd. Equity shares Rs. 10 25,008,400 25,008,400 250.08 250.08Ranbaxy Drugs Ltd. Equity shares Rs. 10 3,100,020 3,100,020 31.00 31.00
10% NCRP Rs. 10 250 250 * *Ranbaxy Fine Chemicals Ltd. Equity shares Rs. 10 5,550,000 5,550,000 55.50 55.50Ranbaxy Drugs and Chemicals Company(A public company with unlimited liability) Equity shares Rs. 10 1,550,000 1,550,000 15.50 15.50Solus Pharmaceuticals Ltd. Equity shares Rs. 10 3,000,700 3,000,700 30.01 30.01Rexcel Pharmaceuticals Ltd. Equity shares Rs. 10 1,000,000 1,000,000 10.00 10.00Gufic Pharma Ltd. Equity shares Rs. 100 4,900 4,900 535.22 535.22OverseasRanbaxy (Netherlands)BV., The Netherlands Ordinary shares Guilders 100 996,546 996,546 2,070.57 2,070.57Ranbaxy (Hongkong) Ltd., Hongkong Equity shares HK $ 1 2,400,000 2,400,000 9.84 9.84Ranbaxy (Guangzhou China) Ltd., China Capital contribution US $ 5,900,000 193.95 193.95Ranbaxy (Malaysia) Sdn. Bhd., Malaysia Ordinary shares Malaysian $1 2,242,383 2,242,383 25.16 25.16Ranbaxy (Nigeria) Ltd.,Nigeria Ordinary shares Naira 1 13,070,648 ** 6,535,324 7.40 7.40Ranbaxy Unichem Co. Ltd., Thailand Ordinary shares Bahts 100 206,670 206,670 21.20 21.20
3,255.43 3,255.433,385.37 3,385.34
Less: Provision for diminution in value of long term investments (10.36) (10.36)3,375.01 3,374.98
Details of investments purchased and redeemed during the year : 150,000,000 (Previous year Nil) units of HDFC Mutual Fund
NOTES1. * Rounded off to Nil.2. ** 1:1 bonus received during the year3. NCRP denotes Non convertible redeemable preference shares.

81
SCHEDULES FORMING PART OF THE FINANCIAL STATEMENTSFOR THE YEAR ENDED DECEMBER 31, 2003
Rs. MillionsSCHEDULE 8 2003 2002
INVENTORIES(As certified by the management)
Stores and spares 66.39 60.37Raw materials 2,945.87 2,265.87Packaging materials 410.09 403.29Finished goods
Own manufactured 2,097.44 2,063.47Others 530.71 539.76
Work-in-process 996.81 777.437,047.31 6,110.19
SCHEDULE 9SUNDRY DEBTORS(Considered good except where provided for)Debts over six months
Secured 1.18 15.95Unsecured 585.12 588.36
586.30 604.31Other debts
Secured 108.68 225.01Unsecured 4,443.74 6,789.19
4,552.42 7,014.205,138.72 7,618.51
Less : Doubtful and provided for 309.28 589.06 4,829.44 7,029.45
SCHEDULE 10CASH AND BANK BALANCESCash and cheques in hand 23.36 69.58Remittances in transit 51.77 308.13With scheduled banks in :
Current accounts 17.57 585.36Deposit accounts 811.48 0.12Unclaimed dividend accounts 53.93 32.58
With non-scheduled banks in :Current accounts 27.19 18.19
985.30 1,013.96
SCHEDULE 11OTHER CURRENT ASSETS(Unsecured, considered good except where provided for)
Export incentives accrued 1,196.01 871.95Exchange gain accrued on forward contracts 188.40 70.07Insurance claims 104.17 29.03Interest accrued 26.45 0.52Others 64.62 37.79
1,579.65 1,009.36Less : Doubtful and provided for 18.76 26.77
1,560.89 982.59
SCHEDULE 12LOANS AND ADVANCES(Considered good except where provided for)Secured 79.99 96.24UnsecuredAdvances recoverable in cash or in kind
or for value to be received 2,024.73 1,403.97Short term deposits 5,160.00 3.00Due from subsidiary companies 396.90 466.68Prepaid income-tax 2,723.28 940.04
10,384.90 2,909.93Less : Doubtful and provided for 376.74 440.23
10,008.16 2,469.70
Schedules

82
SCHEDULES FORMING PART OF THE FINANCIAL STATEMENTSFOR THE YEAR ENDED DECEMBER 31, 2003
Rs. MillionsSCHEDULE 13 2003 2002
CURRENT LIABILITIESAcceptances 410.80 497.13Sundry creditors 3,429.53 2,616.64Investor education & protection fund Unclaimed dividend * 53.93 32.58Other liabilities 1,968.61 1,727.55Interest accrued but not due on loans 0.88 4.49
5,863.75 4,878.39* Not due for deposit.
SCHEDULE 14PROVISIONSRetirement benefits 526.57 327.02Income-tax 2,399.51 981.61Proposed dividend 2,228.38 1,854.52
5,154.46 3,163.15SCHEDULE 15
OPERATING INCOMESALES
Domestic 11,326.98 10,391.47Less : Excise duty on sales 666.65 696.49
10,660.33 9,694.98Export 24,674.60 18,502.87
35,334.93 28,197.85Less : Trade discounts 1,352.24 1,207.71
33,982.69 26,990.14OTHERS
Royalty and technical know-how 841.86 644.90Technology licensing income 176.37 628.95Export incentives 1,793.54 1,117.63Exchange gain (Net) 743.29 74.36Commission � 0.26Sundries 76.38 31.41
3,631.44 2,497.5137,614.13 29,487.65
SCHEDULE 16OTHER INCOMEInterest 77.73 53.36Dividend 22.69 5.07Profit on sale of fixed assets 0.46 0.37Profit on sale of long term investments � 78.30Bad debts / advances recovered 0.92 14.36Unclaimed balances / excess provisions written back 23.12 17.30Miscellaneous 85.62 34.07
210.54 202.83SCHEDULE 17
MATERIALSRaw materials consumed 10,321.33 8,881.67Packaging materials consumed 1,354.04 1,119.16Finished goods purchased 3,091.08 3,009.39Increase in work in process and finished goods
Opening stockWork-in-process 777.43 623.54Finished goods Own manufactured 2,063.47 1,488.24 Others 539.76 318.97
3,380.66 2,430.75Less :Closing stock
Work-in-process 996.81 777.43Finished goods Own manufactured 2,097.44 2,063.47 Others 530.71 539.76
3,624.96 3,380.66(Increase) / Decrease (244.30) (949.91)Materials consumed 14,522.15 12,060.31

83
Rs. MillionsSCHEDULE 18 2003 2002
MANUFACTURINGStores and spares consumed 284.64 222.27Power and fuel 537.90 485.02Repairs and maintenance
Factory buildings 29.48 19.38Plant and machinery 44.78 44.56
Analytical charges 15.63 23.02Processing charges 420.03 324.46Excise duty 53.62 192.09
1,386.08 1,310.80
SCHEDULE 19PERSONNELSalaries,wages and bonus 2,154.94 1,689.84Contribution to provident and other funds 159.36 121.49Workmen and staff welfare 127.43 118.77Amortisation of deferred employees compensation 37.42 19.24
2,479.15 1,949.34
SCHEDULE 20SELLING, GENERAL AND ADMINISTRATIONRentals 156.86 135.16Rates and taxes 81.62 70.49Regulatory filing fee 50.57 48.41Printing and stationery 67.70 50.24Electricity and water 36.13 31.45Insurance 291.92 138.87Communication 164.88 128.46Legal and professional charges 958.06 592.23Travel and conveyance 438.70 394.34Running and maintenance of vehicles 39.54 35.65Repairs and maintenance
Buildings 1.71 2.51Others 68.05 53.45
Discounts 425.81 264.30Freight, clearing and forwarding 1,063.81 759.11Marketing and promotion services 64.20 122.40Advertising and sales promotion 1,822.64 1,306.51Conferences and meetings 63.76 87.88Commission 402.00 252.32Recruitment and training 70.51 41.98Assets written off 1.39 73.85Loss on sale of fixed assets 27.89 8.48Loss on sale of long term investments � 0.02Amounts written off [Net of reversal of provision for doubtful
debts and advances Rs. 351.28 Million (Previous year Nil)] 2.70 12.47Provision for doubtful debts and advances � 397.83Provision / (Reversal) for diminution in value of current investments (0.03) (1.66)Others 715.02 348.37
7,015.44 5,355.12
SCHEDULES FORMING PART OF THE FINANCIAL STATEMENTSFOR THE YEAR ENDED DECEMBER 31, 2003
Schedules

84
SCHEDULES FORMING PART OF THE FINANCIAL STATEMENTSFOR THE YEAR ENDED DECEMBER 31, 2003
Rs. MillionsSCHEDULE 21 2003 2002
RESEARCH AND DEVELOPMENT EXPENDITURESalaries, wages and bonus 442.01 306.40Contribution to provident and other funds 35.19 17.50Workmen and staff welfare 30.07 29.78Raw materials and consumables 621.70 548.00Power and fuel 55.15 46.73Clinical trials 269.08 133.20Bioequivalence studies 440.85 386.33Rentals 30.52 11.96Printing and stationery 13.75 9.54Insurance 13.14 9.16Communication 23.73 18.08Legal and professional charges 69.64 13.64Travel and conveyance 60.51 50.16Technical know how and consultancy 126.75 �Running and maintenance of vehicles 7.55 6.11Repairs and maintenance
Machinery 9.36 6.71Buildings 10.75 4.64Others 13.06 8.89
Recruitment and training 25.16 13.78Others 82.52 65.67
2,380.49 1,686.28
SCHEDULE 22
PRIOR PERIOD ITEMSSalaries,wages and bonusRetirement benefits � 9.99Contribution to provident and other funds � 0.25Export incentives reversed � 6.53Advertising and sales promotion � 7.11
� 23.88
SCHEDULE 23
DEPRECIATION AND AMORTISATIONDepreciationBuildings 40.39 38.16Plant and machinery 471.92 411.25Furniture and fixtures 23.72 20.30Vehicles 17.29 13.99
553.32 483.70Amortisation
Patents, trade marks and designs 143.38 110.41
696.70 594.11
SCHEDULE 24
PROVISION FOR TAXCurrent income-tax 1,370.00 770.00Deferred tax 245.89 127.94
1,615.89 897.94
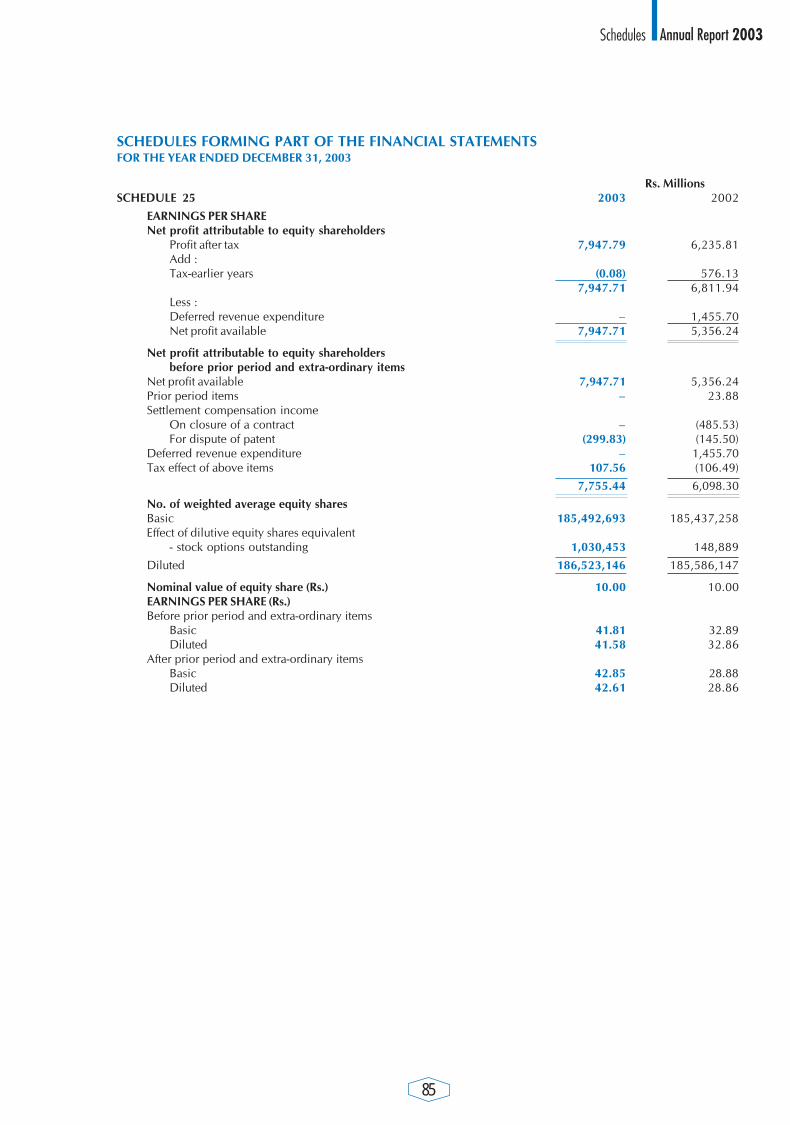
85
SCHEDULES FORMING PART OF THE FINANCIAL STATEMENTSFOR THE YEAR ENDED DECEMBER 31, 2003
Rs. MillionsSCHEDULE 25 2003 2002
EARNINGS PER SHARENet profit attributable to equity shareholders
Profit after tax 7,947.79 6,235.81Add :Tax-earlier years (0.08) 576.13
7,947.71 6,811.94Less :Deferred revenue expenditure � 1,455.70Net profit available 7,947.71 5,356.24
Net profit attributable to equity shareholdersbefore prior period and extra-ordinary items
Net profit available 7,947.71 5,356.24Prior period items � 23.88Settlement compensation income
On closure of a contract � (485.53)For dispute of patent (299.83) (145.50)
Deferred revenue expenditure � 1,455.70Tax effect of above items 107.56 (106.49)
7,755.44 6,098.30
No. of weighted average equity sharesBasic 185,492,693 185,437,258Effect of dilutive equity shares equivalent
- stock options outstanding 1,030,453 148,889
Diluted 186,523,146 185,586,147
Nominal value of equity share (Rs.) 10.00 10.00EARNINGS PER SHARE (Rs.)Before prior period and extra-ordinary items
Basic 41.81 32.89Diluted 41.58 32.86
After prior period and extra-ordinary itemsBasic 42.85 28.88Diluted 42.61 28.86
Schedules

86
SCHEDULES FORMING PART OF THE FINANCIAL STATEMENTSFOR THE YEAR ENDED DECEMBER 31, 2003
SCHEDULE 26
SIGNIFICANT ACCOUNTING POLICIES1. Basis of preparation
The financial statements of the Company are prepared under historical cost convention in accordance withthe Generally Accepted Accounting Principles (GAAP) applicable in India and the provisions of the CompaniesAct, 1956.
2. Use of estimates
The preparation of the financial statements in conformity with the GAAP requires management to make estimates andassumptions that affect the reported amounts of assets and liabilities and disclosure of contingent liabilities as at thedate of the financial statements and reported amounts of revenues and expenses for the year. Actual results could differfrom these estimates.
3. Fixed assets
Fixed assets are stated at cost (gross block) less accumulated depreciation. Capital works-in-progress includes advances.
4. Depreciation/Amortisation
a] Depreciation on fixed assets is provided on straight-line method at the rates and in the manner prescribed inschedule XIV to the Companies Act, 1956.
b] Cost of patents, trade marks and designs is being amortised over a period of five years.c] Premium paid on perpetual leasehold land is charged to revenue on termination/renewal of lease agreements.
5. Expenditure on regulatory approvals
Expenditure incurred for obtaining regulatory approvals and registration of products for overseas markets and productacquisition is charged to revenue.
6. Deferred employees compensation
The accounting value of stock options representing the excess of the market price over the exercise price of the sharesgranted under �Employees Stock Option Scheme� of the company, is amortised on straight-line basis over the vestingperiod as �Deferred employees compensation� and the unamortised portion of the cost is shown under Reserves andSurplus, in accordance with the SEBI (Employee Stock Option Scheme and Employee Stock Purchase Scheme)Guidelines, 1999.
7. Investments
a] Current investments are stated at lower of cost and fair value.b] Long term investments are stated at cost. Diminution in value of such investments (other than temporary decline)
is provided for separately.c] Profit/Loss on sale of investments is computed with reference to their average cost.
8. Valuation of inventories
Inventories are valued as under :
Stores & spares, raw materials and packaging materials - at weighted average cost.
Finished goods - at lower of cost and net realisable value.
Work-in-process - at cost upto estimated stage of process.
Where duty paid/indigenous materials are consumed, prior to duty-free import of materials under the AdvanceLicence Scheme, in manufacture of products for export, the estimated excess cost of such materials over that of dutyfree materials is carried forward in the cost of raw materials and charged to revenue on consumption of such duty-freematerials.
9. Revenue recoginition
a] Revenue from sale of goods is recognised when the significant risks and rewards in respect of ownership of thegoods are transferred to the customer and is stated inclusive of excise duty, net of trade discounts, sales returnand sales tax where ever applicable.
b] Dividend is recognised as and when the right to receive the income is established.c] Royalty, technical know-how and licencing income is recognised as revenue when earned, in accordance with
the terms of the relevant agreements.
10. Export benefits/incentives
a] Export entitlements under the Duty Entitlement Pass Book(�DEPB�) scheme are recognised in the profit and lossaccount when the right to receive credit as per the terms of the scheme is established in respect of the exports made.

87
b] Entitlements / obligation on account of Advance Licences for import of raw materials are accounted for onpurchase of raw materials and / or export sales.
11. Research and development
Revenue expenditure incurred on research and development is charged to revenue in the year it is incurred. Capitalexpenditure is included in the respective heads under fixed assets.
12. Taxes on income
Provision for tax for the year comprises estimated current income-tax determined to be payable in respect of taxableincome and deferred tax being the tax effect of timing differences representing the difference between taxable incomeand accounting income that originate in one period and are capable of reversal in one or more subsequent periods.
Provision for current income tax is the aggregate of the balance provision for tax for three months ended March 31, 2003and the estimated provision based on the taxable profit of remaining nine months up to December 31, 2003, the actualtax liability, for which, will be determined on the basis of the figures for the period April 1, 2003 to March 31, 2004.
13. Foreign exchange transactions
a] Investments in foreign companies are recorded at the exchange rates prevailing on the date of making theinvestments.
b] Transactions in foreign currencies are recorded at the rates prevailing on the date of the transactions. Monetaryitems denominated in foreign currency are restated at the rate prevailing on balance sheet date. Exchange gains/losses on settlement and on conversion of monetary items denominated in foreign currency are dealt with in theprofit and loss account, except for loans denominated in foreign currencies utilised for acquisition of fixedassets where the exchange gains/losses are adjusted to the cost of such assets.
c] Income and expenditure items at representative offices are converted at the respective monthly average rate.Monetary items at representative offices at the balance sheet date are converted using the year-end rates.Non-monetary assets are recorded at the rates prevailing on the date of the transaction.
d] Premium / discount on forward exchange contracts is recognised as income or expenditure over the period ofthe contracts.
14. Retirement benefits
a] Contributions in respect of provident fund, superannuation and gratuity are made to Trusts set up by theCompany for the purpose and charged to profit and loss account.
b] Provisions for liabilities in respect of gratuity, pension and leave encashment benefits are made based onactuarial valuation made by an independent actuary as at the balance sheet date.
15. Earnings per share
Basic earnings per share are calculated by dividing the net profit or loss for the year attributable to equity shareholdersby the weighted average number of equity shares outstanding during the year.
For calculating diluted earnings per share, the net profit or loss for the year attributable to equity shareholders and theweighted average number of options outstanding during the year are adjusted for the effects of all dilutive potentialequity shares.
16. Contingent Liabilities
Depending on facts of each case and after due evaluation of relevant legal aspects, claims against the Company notacknowledged as debts are provided or disclosed as contingent liabilities. In respect of statutory matters, contingentliabilities are provided or disclosed only for those demand(s) that are contested by the Company.
SCHEDULES FORMING PART OF THE FINANCIAL STATEMENTSFOR THE YEAR ENDED DECEMBER 31, 2003
SCHEDULE 26
SIGNIFICANT ACCOUNTING POLICIES (Contd.)
Schedules

88
SCHEDULES FORMING PART OF THE FINANCIAL STATEMENTSFOR THE YEAR ENDED DECEMBER 31, 2003
SCHEDULE 27
NOTES TO THE FINANCIAL STATEMENTS
1. Share capitala] Share capital includes :
(i) 146,849,494 (Previous year 146,849,494) Equity shares allotted as fully paid bonus shares by capitalisationout of share premium and reserves.
(ii) 3,281,154 (Previous year 3,281,154) Equity shares allotted as fully paid up pursuant to contract withoutpayment being received in cash.
b] Outstanding stock options for equity shares of the Company under the �Employees Stock OptionScheme� :
Date of grant Exercise price 2003 2002Rs. Rs. Numbers Numbers
January 12, 2001* 673.00 (420.63) 160,507 (256,811) 187,047 (299,275)December 3, 2001* 595.00 (371.88) 282,201 (451,522) 304,181 (486,690)April 1, 2002* 745.00 (465.63) 404,843 (647,749) 447,585 (716,136)February 7, 2003 567.00 � 894,275 � � �August 18, 2003 701.00 � 2,000 � � �
1,743,826 (1,356,082) 938,813 (1,502,101)
* The adjusted outstanding options and their adjusted exercise price in accordance with the Employees Stock Options Scheme of the Company consequent to issueof bonus shares on October 11, 2002, are given in the parenthesis.
c] Allotment of 18,497 Equity shares (Previous year 18,497 ) of Rs. 10 each, on payment of Rs. 125 per share(including Rs.115 on account of share premium) and 18,497 Equity shares (Previous year 18,497) of Rs. 10each on payment of Rs. 175 per share (including Rs. 165 on account of share premium), [in respect of 12% Fullyconvertible debentures of Rs. 300 each (1993 Series) in terms of the letter of offer dated September 20, 1993already converted], has been kept in abeyance under provisions of section 206-A of the Companies Act, 1956.
2. Fixed assetsa] Land includes:
(i) cost of leasehold land Rs. 196.24 million (Previous year Rs. 179.92 million).(ii) freehold land, valued at Rs. 12.24 million (Previous year Rs. 12.24 million) purchased alongwith building
etc.(iii) cost of land Rs. 49.25 million (Previous year Rs. 71.75 million) pending registration in the name of the
Company.b] Buildings include cost of 10 shares of Rs. 50 each fully paid in a co-operative housing society.c] Capital works-in progress includes:
(i) advances Rs. 123.94 million (Pervious year Rs. 19.97 million).(ii) pre-operative expenses Rs. 16.89 million (Previous year Rs. 4.44 million) as detailed below :
Rs. MillionsDescription 2003 2002Opening balance 4.44 4.92Add : Addition during the year
Salaries, wages and bonus 16.82 5.93Contributions to provident and other funds 1.14 0.29Workmen and staff welfare 0.26 0.19Raw materials 0.30 0.43Power and fuel 2.82 1.08Rentals 0.06 0.22Insurance 0.46 0.01Others 8.17 6.01
34.47 19.08Less : Capitalised during the year 17.58 14.64
Balance 16.89 4.44

89
3. Cash and bank balances :
(i) Deposit receipts of Rs. 0.64 million (Previous year Rs 0.12 million) pledged with Government Authorities.
(ii) Balances with non scheduled banks in current accounts :
Maximum balanceRs. Millions Rs. Millions
2003 2002 2003 2002
AB Vilnius Bankas, Kaunas, Lithuania 2.87 0.04 9.33 3.84ABN AMRO BANK, Bucharest, Romania 0.15 0.17 1.52 1.06ABN AMRO Bank, Moscow, Russia 0.65 1.69 13.20 15.24Banque Internationale Pour Le
Commerce Et L�industrie duCameroun, Doula, Cameroon 0.84 3.62 4.73 10.48
Barclays Bank of Kenya Ltd, Nairobi Kenya 1.36 2.71 10.90 2.95Banque Nationale De Paris, Ho Chi Minh City, Vietnam � � � 6.10Bank Handlowy W Warszawie SA, Warsaw, Poland 10.97 3.61 10.46 10.30Barclays Bank Plc, London, United Kingdom � * � *Credit Lyonnais, Vietnam 7.09 0.03 16.45 9.53Credit Lyonnais, Kiev, Ukraine * 0.19 7.79 6.88Citi Bank, Almaty, Kazakhstan 0.77 0.99 3.35 2.98Myanma Investment and Commercial Bank
Yangon, Myanmar 0.90 2.96 26.11 8.79Societe Generale De Banques Au CamerounDoula, Cameroon � * � *The Hongkong & Shanghai BankingCorporation, Ocean Bldg, Singapore 1.55 2.08 9.08 6.41The Hongkong & Shanghai Banking
Corporation, Jakarta, Indonesia � � � 0.11The Hongkong & Shanghai Banking
Corporation, Hongkong, China 0.04 0.10 0.10 0.14* Rounded off to Nil
Total 27.19 18.19
4. Amounts due from :An officer of the Company 0.82 0.94 0.94 1.05Directors (Loans advanced beforebecoming directors) � � � 0.02
5. Borrowings on commercial paper � � � 500.00
Rs. Millions2003 2002
6. InvestmentsQuoted
Aggergate book value (Net of provision) 0.02 0.02Market value 0.08 0.02
UnquotedAggergate book value (Net of provision) 3,374.99 3,374.96
7. Interest accrued on investments 0.02 �
8. Sundry debtors include debts due from subsidiary companies 1,917.53 4,286.50
SCHEDULES FORMING PART OF THE FINANCIAL STATEMENTSFOR THE YEAR ENDED DECEMBER 31, 2003
SCHEDULE 27
NOTES TO THE FINANCIAL STATEMENTS (Contd.)
Schedules

90
9. Loans and advances include :Secured loans to employees 79.99 96.24Advances recoverable in cash or in kind or for value to be received include dues from :
Employees 71.62 72.44Suppliers 88.78 90.95Security deposits 34.37 30.44
10. Unsecured loans due for repayment within one year 12.72 25.74
11. Sundry creditors include due to :a] Subsidiary companies 148.62 63.48b] Small scale indusrial undertakings 144.74 64.20
Total outstanding dues of small scale industrial undertakings have been determined to the extent such parties havebeen identified on the basis of information available with the Company. The parties to whom the Company owessums outstanding for more than 30 days as at the balance sheet date are:Anasthetic Gases Pvt. Ltd. Ankur Drugs & Pharma Ltd. Askas Plastic Pvt. Ltd. AutofitsBhasin Packwell Pvt. Ltd. Everest Industrial Corporation Imperial Packaging Company Kallin IndustriesKejariwal Industries Laxon Drugs Mahabir Industries Mayura OffsetMedicamen Biotech Ltd. Metakaps Engineering Co. National Electronic Corporation NBZ Pharma Ltd.Niranjan Containers Pvt. Ltd. Orchid Healthcare Packs and Packaging Ramesh Industries (Indore)Ranq Pharmaceuticals & Excipients P.Ltd. Real Gas & Chemicals Sampre Nutrition Saurav ChemicalsSidmak Laboratories (India) Ltd. Srikem Laboratories Pvt.Ltd. Sukkan Industries Tauras Chemicals Pvt. Ltd.Tatva Chintan Pharma Pvt. Ltd. Vevek Pharmachem (India) Ltd. Zenna Plastics Ltd.
Rs. Millions2003 2002
12. Interest income :Interest on
Current investments - other than trade 0.16 0.09Income-tax refunds
Current year 1.00 7.08Prior years � 17.04
Loans and deposits:Short term deposits 35.35 19.13Subsidiary companies 31.79 2.93Employees loans 5.68 6.47Others 3.75 0.62
77.73 53.36
13. Dividend from investments :a] Current
Other than trade 18.70 �b] Long term
Other than trade 0.01 0.01Subsidiary companies 3.98 5.06
22.69 5.07
14. Tax deducted at source on :Interest received 13.96 6.14Dividend received 0.07 0.16
15. Interest paid on fixed period loans 21.67 92.87
16. Exchange gain on outstanding forward exchangerate contracts to be recognised in the subsequent year 206.80 96.46
SCHEDULES FORMING PART OF THE FINANCIAL STATEMENTSFOR THE YEAR ENDED DECEMBER 31, 2003
SCHEDULE 27
NOTES TO THE FINANCIAL STATEMENTS (Contd.)
Rs. Millions2003 2002

91
17. Payment to auditorsa] Statutory auditors
Audit feeStatutory 4.50 4.00Tax 2.00 1.40
Other mattersTaxation 0.09 0.12Management services � 0.60Certification 1.79 0.77Travel and out of pocket 0.09 0.27Service tax 0.66 0.34
9.13 7.50b] Cost auditors
Audit fee 0.42 0.39Certification 0.21 0.30Travel and out of pocket 0.04 0.27
0.67 0.9618. Dividend
a] Interim dividend includes Rs. 0.24 million paid for the year 2002 on 23,718 shares of Rs. 10 each, allotted underthe Employees Stock Option Scheme between close of the year 2002 and the record date for such dividend.
b] Proposed dividend includes Rs. 1.86 million on 1,54,901 shares of Rs. 10 each allotted under the EmployeesStock Option Scheme after December 31, 2003 which are eligible for such dividend.
Rs. Millions19. a] Directors� remuneration* 2003 2002
Salaries and allowances 33.00 29.16Contribution to provident and other funds 4.16 3.54Directors� fee 0.95 0.48Commission 57.04 50.65Perquisites** 10.28 11.01
105.43 94.84
* Exclusive of provision for future liabilities in respect of retirement benefits (which are based on actuarial valuationdone on overall Company basis) and amortisation of deferred employees compensation on grant of stockoptions under �Employees Stock Option Scheme� of the Company.Excludes Rs. 6.72 million (Previous year Rs. 3.62 million) paid as gratuity to a director upon his retirement by thegratuity trust set up by the company,
** Where the monetary value of the benefits is not ascertainable , they have been determined based on theprovisions of Income - tax Act, 1961.
b] Determination of net profits in accordance with the provisions of section 349 of the Companies Act, 1956and commission payable to directors.
Rs. Millions2003
Profit before tax as per profit and loss account 9,563.68Add :
Directors� remuneration (including commission)charged in accounts 105.43
105.43
9,669.11Less :
Provision for diminution in the value of investments reversed 0.03Insurance claims received 59.40
59.43Net Profit 9,609.68Commission to directors :(As determined by the Board of Directors)Whole-time 51.64Others 5.40
57.04
SCHEDULES FORMING PART OF THE FINANCIAL STATEMENTSFOR THE YEAR ENDED DECEMBER 31, 2003
SCHEDULE 27
NOTES TO THE FINANCIAL STATEMENTS (Contd.)
Rs. Millions2003 2002
Schedules

92
20. Contingent liabilitiesClaims not acknowledged as debts 946.89 244.06Direct and indirect taxes 24.52 58.72Guarantees to banks on account of:
Subsidiary companies 437.64 607.39Joint ventures/Associates � 400.00
Bills purchased/discounted under letters of credit � 76.52
21. Capital commitments (Net of advances) 387.99 60.78
22. Related party disclosuresRelated party disclosures as required under Accounting Standard on �Related Party Disclosures� issued by theInstitute of Chartered Accountants of India are given below :
a] Relationship :
i) Subsidiary companiesDomesticRanbaxy Drugs and Chemicals Company Ranbaxy Fine Chemicals Limited Rexcel Pharmaceuticals Limited(A public company with unlimited liability) Ranbaxy Drugs LimitedSolus Pharmaceuticals Limited Vidyut Travel Services LimitedVidyut Investments Limited Gufic Pharma LimitedOverseasRanbaxy (Netherlands) BV, Netherlands Ranbaxy NANV, The Netherlands Antilles Ranbaxy Pharmaceuticals BV, Rotterdam AlbrandswarrdRanbaxy (Hong Kong) Limited, Hong Kong Ranbaxy (Poland) Sp Zoo, Poland Ranbaxy Ireland Limited, IrelandRanbaxy Mauritius Limited, Mauritius* Ranbaxy Nigeria Limited, Nigeria Ranbaxy (S.A.) Proprietary Limited, South AfricaRanbaxy Egypt Limited, Egypt Ranbaxy Europe Limited, U.K. Ranbaxy Holding (UK) Ltd., U.KRanbaxy (Guangzhou China) Limited, China Ranbaxy (UK) Limited, U.K Ranbaxy Do Brazil Ltda, BrazilRanbaxy Farmaceutica Ltda, Brazil Basics GmbH , Germany. Ranbaxy Pharmaceuticals Inc., U.S.ARanbaxy Vietnam Company Ltd., Vietnam Ranbaxy Panama SA, Panama Unichem Distributors Ltd., Thailand (Partnership)#Ohm Laboratories Inc., U.S.A Ranpharm Inc., U.S.A Ranchem Inc., U.S.ARanbaxy PRP(Peru) SAC Ranlab Inc., U.S.A Unichem Pharmaceuticals Ltd., ThailandRanbaxy (Malaysia) Sdn. Bhd. Ranbaxy France SAS, France Bounty Holdings Company Limited, ThailandRanbaxy Unichem Company Ltd., Thailand Ranbaxy Signature LLC Ranbaxy, IncRanbaxy USA, Inc.
ii) Joint Venture and AssociatesOverseasThembalami Pharmaceuticals (PTY) Ltd. #Vorin Laboratories Limited **# No transactions during the year.* Ceased to be a subsidary during the year.** Ceased to be as associate during the year
iii) Key management personnel Entities over which significant influence is exercisedMr. D. S. Brar Madhubani Investment (P) Ltd.
Suraj Hotel (P) Ltd.Green Valley Land & Development (P) Ltd.Suraj Overseas (P) Ltd.
Dr. Brian W. Tempest �Mr. V. K. Kaul ANR Securities (P) Ltd.Dr. Rashmi Barbhaiya �Mr. Ram S. Ramasundar �
SCHEDULES FORMING PART OF THE FINANCIAL STATEMENTSFOR THE YEAR ENDED DECEMBER 31, 2003
SCHEDULE 27
NOTES TO THE FINANCIAL STATEMENTS (Contd.)
Rs. Millions2003 2002

93
SCHEDULES FORMING PART OF THE FINANCIAL STATEMENTSFOR THE YEAR ENDED DECEMBER 31, 2003
SCHEDULE 27
NOTES TO THE FINANCIAL STATEMENTS (Contd.)
b] The following transactions were carried out with related parties in the ordinary course of business.i) Subsidiary companies, joint ventures and associates.
Rs. MillionsSubsidiary Joint Venturescompanies and Associates
2003 2002 2003 2002
Purchase of materials/finished goods 41.62 48.85 115.73 348.22Sale of finished goods 16,490,54 11,122.68 � 64.33Services rendered/other receipts 30.26 8.16 � 0.90Services availed and sharing of expenses 456.54 145.80 0.04 �Guarantee commission � � 2.82 0.69Claims and discounts allowed 754.84 345.84 � �Loans/advances given 7,324.70 2,228.03 � 166.40Interest received 31.79 2.93 � 5.26Purchase of investments � 0.14 � �Royalty paid 0.24 0.24 � �Royalty and technical know-how fee received 447.25 525.17 � �Dividend received 3.98 5.06 � �Balance at the end of the year :
Loans/advances given * 396.90 466.68 � �Other receivables 1,917.53 4,286.50 � 4.41Payables 148.62 63.48 0.86 97.31Guarantees given 437.64 607.39 � 400.00
* Includes provision for doubtful debtsand advances 350.00 350.00 � �
ii) Key management personnel and their relativesRemuneration to key management personnel 124.83 99.18Interest on fixed deposits � *Rent paid 3.00 4.41Security deposits :
Received 0.19 �Balance at the end of the year :Security deposits :
Received 0.95 �* Rs. 3,770/- (rounded off to nil)
Schedules

94
SCHEDULES FORMING PART OF THE FINANCIAL STATEMENTSFOR THE YEAR ENDED DECEMBER 31, 2003
SCHEDULE 27
NOTES TO THE FINANCIAL STATEMENTS (Contd.)
23. Additional information pursuant to paragraphs 3 & 4 of part II of schedule VI to the Companies Act,1956.(As certified by the management and accepted by the auditors)
a] Particulars of installed capacities and actual production
2003 2002
Unit of Installed Actual Installed Actualmeasure capacity production capacity production
Dosage FormsTablets Nos./Millions 3,761.30 2,804.63 3,701.30 2,610.46Capsules Nos./Millions 1,610.00 1,310.84 1,284.00 1,388.54Dry syrups/Powders Bottles /Millions 24.20 33.96 24.20 28.68Ampoules Nos./Millions 74.40 94.91 74.40 81.54Vials Nos./Millions 32.40 33.50 32.40 32.78Liquids Kilolitres � 1,349.54 - 1,104.31Drops Kilolitres � 33.23 - 35.95
Active pharmaceuticals indegredientsand drug intermediates Tonnes 1,877.35 2,046.79 2,589.20 2,715.58
Medical aids Nos./Millions � 0.09 � 0.07
Ointments Tonnes * 278.78 * 455.53
* In different denominations than actual production
Notes :1. Installed capacity being effective operational capacity has been calculated on a double shift basis for dosage
forms facilities and on a three shift basis for active pharmaceuticals ingredients and drug intermediates.2. Actual production includes production at loan licencees locations
b] Stocks and sales of finished goodsSales Opening stock Closing stock
Unit of Quantity@ Rs. Quantity Rs. Quantity Rs.measure Millions Millions Millions
Dosage FormsTablets Nos./Millions 3,688.69 16,981.72 542.97 728.02 577.62 768.33
3,521.41 13,511.30 370.97 485.66 542.97 728.02Capsules Nos./Millions 1,674.90 6,043.86 260.09 338.76 221.21 255.31
1,825.13 4,790.71 345.41 218.33 260.09 338.76Dry syrups/Powders Bottles/Millions 46.02 3,021.30 10.55 114.86 6.78 159.34
29.62 1,638.12 4.87 82.16 10.55 114.86Ampoules Nos./Millions 99.15 724.13 15.28 51.59 16.24 48.38
86.18 549.64 15.33 56.43 15.28 51.59Vials Nos./Millions 141.99 1,675.79 6.68 147.58 9.64 147.09
101.08 1,402.43 8.59 80.66 6.68 147.58Liquids Kilolitres 5,094.38 1,009.14 845.72 113.97 807.97 101.20
4,319.06 1,009.21 89.81 42.95 845.72 113.97Drops Kilolitres 35.78 41.44 3.21 1.19 1.89 1.53
35.36 39.87 2.62 1.50 3.21 1.19Active pharmaceuticals
indegredients andDrugs intermediates Tonnes 2,206.80 8,432.72 142.95 877.57 138.32 922.18
2,869.61 7,648.79 68.23 580.63 142.95 877.57Medical aids Nos./Millions 0.12 395.15 0.04 148.35 0.05 182.03
0.14 307.08 0.07 93.53 0.04 148.35Ointments Tonnes 773.69 877.71 90.88 51.67 80.41 36.25
689.71 766.76 82.07 43.80 90.88 51.67Others (Chemicals etc.) � 338.99 � 29.67 � 6.51
� 519.01 121.56 � 29.67Inter unit transfers � (3,540.37) � � � �
� (3,288.58) � � � �Less : Excise duty � (666.65) � � � �
� (696.49) � � � �
TOTAL � 35,334.93 � 2,603.23 � 2,628.15
� 28,197.85 � 1,807.21 � 2,603.23
@ Inclusive of physician samples.Figures in italics are for 2002.

95
SCHEDULES FORMING PART OF THE FINANCIAL STATEMENTSFOR THE YEAR ENDED DECEMBER 31, 2003
SCHEDULE 27
NOTES TO THE FINANCIAL STATEMENTS (Contd.)
2003 2002Unit of Measure Quantity Rs. Millions Quantity Rs. Millions
c] Purchases of finished goods for resaleTablets Nos./Millions 918.71 764.85 1,082.95 554.03Capsules Nos./Millions 325.19 271.50 351.27 321.30Dry Syrups/Powders Bottles/Millions 8.29 147.32 � �Ampoules Nos./Millions 5.20 21.28 4.59 16.66Vials Nos./Millions 111.45 575.79 66.39 416.02Liquids Kilolitres 3,707.09 289.76 3,970.66 368.36Drops Kilolitres 1.23 1.19 � �Bulk drugs / chemicals Tonnes 155.38 443.25 228.75 473.38Medical aids Nos./Millions 0.04 177.18 0.04 218.91Ointments Tonnes 484.44 184.05 242.99 77.08Others 214.91 563.65
TOTAL 3,091.08 3,009.39
d] Consumption of raw materials @Pencillin G Potassium First Crystals Metric tonnes 915.41 661.43 1,278.92 1,094.336APA Metric tonnes 230.93 361.96 213.98 389.89Pen V Potassium Metric tonnes 300.08 254.52 294.06 318.21D-Alpha Phenyl Glycine and its Salts Metric tonnes 184.76 128.16 266.52 161.76Others � 9,345.15 � 7,346.56
TOTAL 10,751.22 9,310.75
e] Consumption of raw materials, components and spares @Raw Components, Raw Components
materials spares & materials spares &Packaging Packagingmaterials * materials *
Indigenous Rs. Millions 5,983.90 1,665.27 4,398.28 1,447.01As % of total 55.66 % 90.97 % 47.24 % 97.57 %
Imported Rs. Millions 4,767.32 165.21 4,912.47 36.03As % of total 44.34 % 9.03 % 52.76 % 2.43 %
* Inclusive of components and spares used for maintenance of plant and machinery.@ Inclusive of materials consumed for research and development
Rs. Millions
2003 2002
f] Imports on C. I. F. basis :Raw materials 5,027.38 4,898.66Components and spares 39.04 36.03Capital goods 250.94 143.74
g] Expenditure in foreign currenciesInterest 9.42 1.15Royalty paid 1.20 0.95Legal and professional charges 804.60 463.59Others 3,966.18 2,539.54
h] Dividend to non-resident shareholders(in foreign currency)
InterimNo. of shareholders 34 35No. of shares held 39,596 24,486Dividend remitted (Rs. Million) 0.20 0.10Year to which it relates 2003 2002
FinalNo. of shareholders 35 35No. of shares held 40,879 24,486Dividend remitted (Rs. Million) 0.41 0.19Year to which it relates 2002 2001
Schedules

96
On behalf of the Board of Directors
For WALKER, CHANDIOK & CO TEJENDRA KHANNA D. S. BRAR DR. BRIAN W. TEMPESTChartered Accountants Chairman CEO & Managing Director Joint Managing Director
& CEO Designate
VINOD CHANDIOK MALVINDER MOHAN SINGH HARPAL SINGH VIVEK BHARAT RAMPartner Whole-time Director Director DirectorMembership No. 10093
RAM S. RAMASUNDARPlace : New Delhi Executive Vice President � S. K. PATAWARIDated : April 22, 2004 Finance & CFO Secretary
SCHEDULES FORMING PART OF THE FINANCIAL STATEMENTSFOR THE YEAR ENDED DECEMBER 31, 2003
SCHEDULE 27
NOTES TO THE FINANCIAL STATEMENTS (Contd.)Rs. Millions
2003 2002i] Earnings in foreign exchange
F.O.B. value of exports 23,460.67 17,749.12(excluding Nepal)Technology licensing income 176.37 628.85Royalty/Technical consultancy fees 839.47 641.23Dividends 3.98 5.07Settlement compensation income
On closure of a contract � 485.53For dispute of patent 299.83 145.50
Others (freight, insurance & others) 811.01 500.89
24. Information pursuant to clause 32 of the listing agreementswith stock exchanges.
Maximum balanceRs. Millions Rs. Millions
2003 2002 2003 2002
Loans and advances in the nature of loans to :
a] Wholly-owned subsidy companies withno specified payment scheduleRanbaxy Drugs and Chemicals Company � 7.42 7.42 9.02(A public company with unlimited liability)Ranbaxy Fine Chemicals Ltd. 0.12 55.60 56.35 116.47Vidyut Investments Ltd. 350.62 * 353.78 * 7,629.70 1,440.61Vidyut Travel Services Ltd. 43.15 * 46.81 * 46.81 51.50Ranbaxy Drugs Ltd. 3.02 * 3.07 * 3.07 3.07
b] Others - for acquisition of shares in Company orany of its subsidiary CompanyRanbaxy Employees Welfare Society@ � 37.51 * 37.51 75.48
* Interest free.@ Set up for acquisition of shares under "Employees Stock Option Scheme"
25. Previous year figuresPrevious year figures have been regrouped / recast wherever considered necessary to make them comparable withthose of the current year.
Signatories to schedules 1 to 27

97
RANBAXY LABORATORIES LIMITED
BALANCE SHEET ABSTRACT AND COMPANY�S GENERAL BUSINESS PROFILE
I. REGISTRATION DETAILS :
Registration No. 0 0 3 7 4 7 State Code : 1 6
Balance Sheet Date : 3 1 1 2 2 0 0 3
Date Month Year
II. CAPITAL RAISED DURING THE YEAR (AMOUNT IN RS. THOUSANDS)
Public Issue : N I L Rights Issue : N I L
Employees Stock Options : 9 1 5 Bonus Issue : N I L
Private Placement : N I L
III. POSITION OF MOBILISATION AND DEPLOYMENT OF FUNDS (AMOUNT IN RS. THOUSANDS)
Total Liabilities : 3 5 7 1 3 9 8 8 Total Assets : 3 5 7 1 3 9 8 8
Source of Funds
Paid-up-Capital : 1 8 5 5 4 3 6 Reserves & Surplus : 2 1 3 4 2 4 2 4
1 9 8 6 9 *
Secured Loans : 3 0 4 9 4 2 Unsecured Loans : 3 7 6 1 5
Application of Funds
Net Fixed Assets : 7 9 0 7 8 7 7 Investments : 3 3 7 5 0 1 4
Net Current Assets : 1 3 4 1 2 8 8 6 Misc. Expenditure : N I L
Accumulated Losses : N I L
* Share application money pending allotment
IV. PERFORMANCE OF COMPANY (AMOUNT IN RS. THOUSANDS)
Turnover : 3 3 9 8 2 6 9 3 Total Expenditure : 2 7 7 8 3 3 2 6
Profit / Loss before Tax : 9 5 6 3 6 7 9 Profit / Loss after tax : 7 9 4 7 7 8 9
Earning Per Share in Rs. 4 2 Dividend Rate (%) : 1 7 0
V. GENERIC NAMES OF THE THREE PRINCIPAL PRODUCTS OF THE COMPANY
Item Code No. 2 9 4 1 9 0
Product Description C E F A C L O R
Item Code No. 2 9 4 2 0 0
Product Description C E P H A L E X I N
Item Code No. 2 9 4 1 1 0
Product Description A M O X Y C I L L I N
+ -4
+ -4
On behalf of the Board of Directors
TEJENDRA KHANNA D. S. BRAR DR. BRIAN W. TEMPESTChairman CEO & Managing Director Joint Managing Director
& CEO Designate
MALVINDER MOHAN SINGH HARPAL SINGH VIVEK BHARAT RAMWhole-time Director Director Director
RAM S. RAMASUNDARPlace : New Delhi Executive Vice President � S. K. PATAWARIDated : April 22, 2004 Finance & CFO Secretary
Schedules & Balance Sheet Abstract
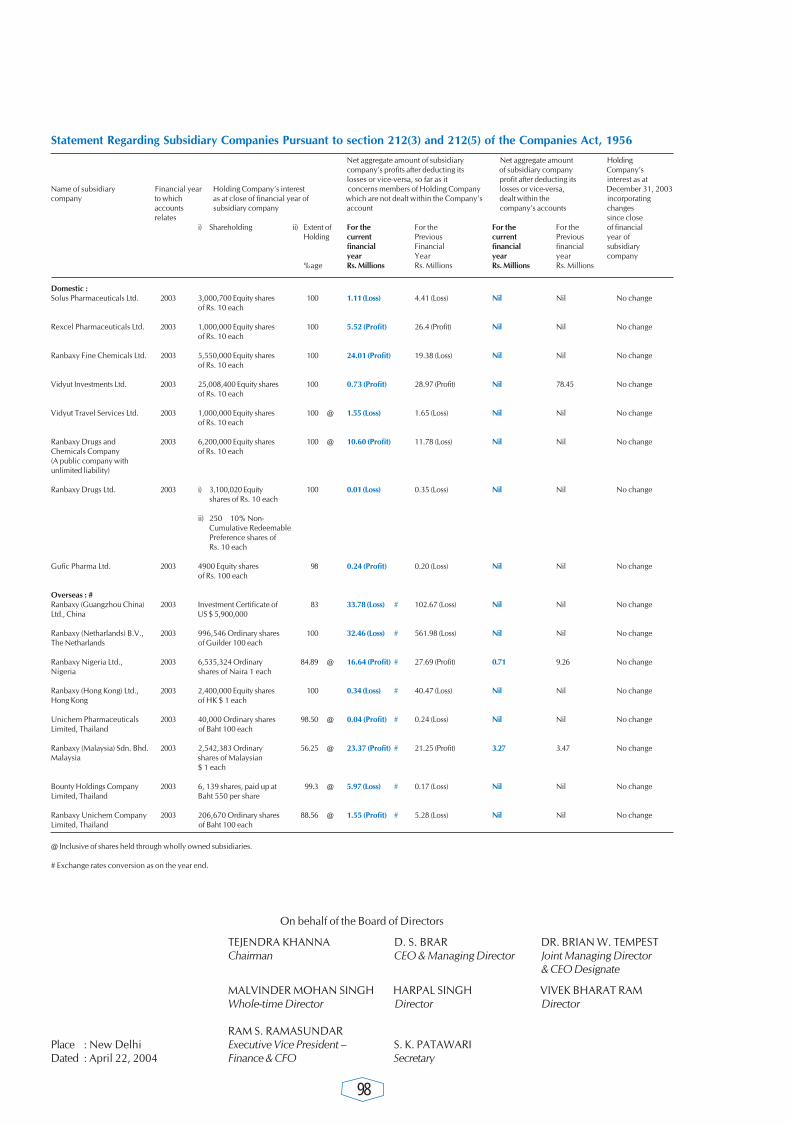
98
Statement Regarding Subsidiary Companies Pursuant to section 212(3) and 212(5) of the Companies Act, 1956
Net aggregate amount of subsidiary Net aggregate amount Holdingcompany�s profits after deducting its of subsidiary company Company�slosses or vice-versa, so far as it profit after deducting its interest as at
Name of subsidiary Financial year Holding Company�s interest concerns members of Holding Company losses or vice-versa, December 31, 2003company to which as at close of financial year of which are not dealt within the Company�s dealt within the incorporating
accounts subsidiary company account company�s accounts changesrelates since close
i) Shareholding ii) Extent of For the For the For the For the of financialHolding current Previous current Previous year of
financial Financial financial financial subsidiaryyear Year year year company
%age Rs. Millions Rs. Millions Rs. Millions Rs. Millions
Domestic :Solus Pharmaceuticals Ltd. 2003 3,000,700 Equity shares 100 1.11 (Loss) 4.41 (Loss) Nil Nil No change
of Rs. 10 each
Rexcel Pharmaceuticals Ltd. 2003 1,000,000 Equity shares 100 5.52 (Profit) 26.4 (Profit) Nil Nil No changeof Rs. 10 each
Ranbaxy Fine Chemicals Ltd. 2003 5,550,000 Equity shares 100 24.01 (Profit) 19.38 (Loss) Nil Nil No changeof Rs. 10 each
Vidyut Investments Ltd. 2003 25,008,400 Equity shares 100 0.73 (Profit) 28.97 (Profit) Nil 78.45 No changeof Rs. 10 each
Vidyut Travel Services Ltd. 2003 1,000,000 Equity shares 100 @ 1.55 (Loss) 1.65 (Loss) Nil Nil No changeof Rs. 10 each
Ranbaxy Drugs and 2003 6,200,000 Equity shares 100 @ 10.60 (Profit) 11.78 (Loss) Nil Nil No changeChemicals Company of Rs. 10 each(A public company withunlimited liability)
Ranbaxy Drugs Ltd. 2003 i) 3,100,020 Equity 100 0.01 (Loss) 0.35 (Loss) Nil Nil No changeshares of Rs. 10 each
ii) 250 10% Non-Cumulative RedeemablePreference shares ofRs. 10 each
Gufic Pharma Ltd. 2003 4900 Equity shares 98 0.24 (Profit) 0.20 (Loss) Nil Nil No changeof Rs. 100 each
Overseas : #Ranbaxy (Guangzhou China) 2003 Investment Certificate of 83 33.78 (Loss) # 102.67 (Loss) Nil Nil No changeLtd., China US $ 5,900,000
Ranbaxy (Netharlands) B.V., 2003 996,546 Ordinary shares 100 32.46 (Loss) # 561.98 (Loss) Nil Nil No changeThe Netharlands of Guilder 100 each
Ranbaxy Nigeria Ltd., 2003 6,535,324 Ordinary 84.89 @ 16.64 (Profit) # 27.69 (Profit) 0.71 9.26 No changeNigeria shares of Naira 1 each
Ranbaxy (Hong Kong) Ltd., 2003 2,400,000 Equity shares 100 0.34 (Loss) # 40.47 (Loss) Nil Nil No changeHong Kong of HK $ 1 each
Unichem Pharmaceuticals 2003 40,000 Ordinary shares 98.50 @ 0.04 (Profit) # 0.24 (Loss) Nil Nil No changeLimited, Thailand of Baht 100 each
Ranbaxy (Malaysia) Sdn. Bhd. 2003 2,542,383 Ordinary 56.25 @ 23.37 (Profit) # 21.25 (Profit) 3.27 3.47 No changeMalaysia shares of Malaysian
$ 1 each
Bounty Holdings Company 2003 6, 139 shares, paid up at 99.3 @ 5.97 (Loss) # 0.17 (Loss) Nil Nil No changeLimited, Thailand Baht 550 per share
Ranbaxy Unichem Company 2003 206,670 Ordinary shares 88.56 @ 1.55 (Profit) # 5.28 (Loss) Nil Nil No changeLimited, Thailand of Baht 100 each
@ Inclusive of shares held through wholly owned subsidiaries.
# Exchange rates conversion as on the year end.
On behalf of the Board of Directors
TEJENDRA KHANNA D. S. BRAR DR. BRIAN W. TEMPESTChairman CEO & Managing Director Joint Managing Director
& CEO Designate
MALVINDER MOHAN SINGH HARPAL SINGH VIVEK BHARAT RAMWhole-time Director Director Director
RAM S. RAMASUNDARPlace : New Delhi Executive Vice President � S. K. PATAWARIDated : April 22, 2004 Finance & CFO Secretary

99
Auditors' report to the Board of Directors of the RanbaxyLaboratories Limited.
We have audited the attached consolidated balance sheetof Ranbaxy Laboratories Limited ( "the company") itssubsidiaries and joint venture (as per list appearing in Note15 on Schedule 26) collectively referred to as "the RanbaxyGroup" as at December 31, 2003 and also the consolidatedprofit and loss account and the consolidated cash flowstatement for the year ended on that date annexed thereto.These financial statements are the responsibility of theRanbaxy Group's management and have been prepared bythe management on the basis of separate financial statementsand other financial information regarding components. Ourresponsibility is to express an opinion on these financialstatements based on our audit.
We conducted our audit in accordance with the auditingstandards generally accepted in India. Those Standardsrequire that we plan and perform the audit to obtainreasonable assurance about whether the financial statementsare free of material misstatement. An audit includesexamining, on a test basis, evidence supporting the amountsand disclosures in the financial statements. An audit alsoincludes assessing the accounting principles used andsignificant estimates made by management, as well asevaluating the overall financial statement presentation. Webelieve that our audit provides a reasonable basis for ouropinion.
We did not audit the financial statements of someconsolidated entities, whose financial statements reflect totalassets of Rs. 21,053.99 million as at December 31,2003,the total revenue of Rs. 28,204.22 million and cash flowsamounting to Rs.115.53 million for the year then ended.These financial statements and other financial informationhave been audited by other auditors whose reports havebeen furnished to us and our opinion in respect thereof isbased solely on the report of other auditors.
We report that the consolidated financial statements havebeen prepared by the Ranbaxy Group's management inaccordance with the requirements of Accounting Standard(AS) 21, Consolidated financial statements and AccountingStandard (AS) 27, Financial Reporting of interests in JointVenture, issued by the Institute of Chartered Accountants ofIndia.
Based on our audit and on consideration of reports of otherauditors on separate financial statements and on the otherfinancial information of the components, and to the best ofour information and according to the explanations given tous, we are of the opinion that the attached consolidatedfinancial statements give a true and fair view in conformitywith the accounting principles generally accepted in India;in case of :
(a) the consolidated balance sheet, of the state of affairsof the Ranbaxy Group as at December31, 2003;
(b) the consolidated profit and loss account, of the profitfor the year ended on that date; and
(c) the consolidated cash flow statement, of the cashflows for the year ended on that date.
For Walker, Chandiok & CoChartered Accountants
Vinod ChandiokPartnerMembership No 10093
Place : New DelhiDated : April 22, 2004
Section 212 & Consolidated Auditors' Report

100
CONSOLIDATED BALANCE SHEETAS AT DECEMBER 31, 2003
Rs. Millions
Schedule 2003 2002SOURCES OF FUNDSSHAREHOLDERS' FUNDS
Capital 1 1,855.44 1,854.52Reserves and surplus 2 19,706.24 15,963.63
21,561.68 17,818.15
SHARE APPLICATION MONEY PENDING ALLOTMENT 19.87 0.30
MINORITY INTERESTS 166.41 188.00
LOAN FUNDSSecured 3 2,483.87 1,436.52Unsecured 4 3,366.01 2,521.21
5,849.88 3,957.73
DEFERRED TAX LIABILITY (NET) 5 942.99 840.79
28,540.83 22,804.97
APPLICATION OF FUNDSFIXED ASSETS 6
Gross block 16,322.97 14,631.50Less : Depreciation 6,395.52 4,956.95
Net block 9,927.45 9,674.55
Capital works-in-progress 1,004.98 191.13
INVESTMENTS 7 168.08 370.21
CURRENT ASSETS, LOANS AND ADVANCESInventories 8 9,558.44 9,002.51Sundry debtors 9 7,511.17 7,987.98Cash and bank balances 10 1,579.88 1,493.51Other current assets 11 1,623.89 1,016.65Loans and advances 12 11,075.99 3,533.50
31,349.37 23,034.15Less :CURRENT LIABILITIES AND PROVISIONS
Liabilities 13 7,790.91 6,221.17Provisions 14 6,118.14 4,243.90
13,909.05 10,465.07
NET CURRENT ASSETS 17,440.32 12,569.08
28,540.83 22,804.97
SIGNIFICANT ACCOUNTING POLICIES 25
NOTES TO THE CONSOLIDATED FINANCIAL STATEMENTS 26
The schedules referred to above form an integral part of the consolidated financial statements.This is the consolidated balance sheet referred to in our report of even date.
On behalf of the Board of Directors
For WALKER, CHANDIOK & CO TEJENDRA KHANNA D. S. BRAR DR. BRIAN W. TEMPESTChartered Accountants Chairman CEO & Managing Director Joint Managing Director
& CEO Designate
VINOD CHANDIOK MALVINDER MOHAN SINGH HARPAL SINGH VIVEK BHARAT RAMPartner Whole-time Director Director DirectorMembership No. 10093
RAM S. RAMASUNDARPlace : New Delhi Executive Vice President � S. K. PATAWARIDated : April 22, 2004 Finance & CFO Secretary

101
Rs. MillionsSchedule 2003 2002
INCOMEOperating income 15 48,232.26 38,414.92Other income 16 485.57 267.47
48,717.83 38,682.39EXPENDITURE
Materials 17 17,874.07 15,395.22Manufacturing 18 1,887.34 1,742.02Personnel 19 4,546.69 3,253.49Selling, general and administration 20 10,749.08 7,785.97Research and development expenditure 21 2,422.66 1,686.29Prior period items (0.59) 23.34
37,479.25 29,886.33PROFIT BEFORE INTEREST, DEPRECIATION AND AMORTISATION 11,238.58 8,796.06
Interest 251.89 386.74Depreciation 22 763.11 661.24Amortisation :
Trade marks and product licenses 22 248.05 214.80Goodwill 22 179.49 75.00
PROFIT BEFORE EXTRA-ORDINARY ITEMS 9,796.04 7,458.28Extra-ordinary itemsSettlement compensation income
On closure of a contract 51.16 730.48For dispute of patent 299.83 145.50
PROFIT BEFORE TAX 10,147.03 8,334.26Provision for tax 23 2,538.13 1,856.65PROFIT AFTER TAX 7,608.90 6,477.61Minority interests 14.58 7.96PROFIT AFTER TAX AND MINORITY INTERESTS 7,594.32 6,469.65Tax - earlier years :
Current (0.08) 5.39Deferred (5.23) 571.58
Depreciation - earlier year (284.33) �Expenditure on regulatory approvals - earlier years � (1,479.49)
7,304.68 5,567.13Transfer from :
Foreign projects reserve 4.90 15.00Balance available for appropriation 7,309.58 5,582.13APPROPRIATIONS
DividendInterim 927.95 579.48Final (proposed) 2,228.38 1,854.52
Tax on dividend 404.41 237.61Transfer to :
Foreign projects reserve 13.76 �General reserve 3,735.08 2,910.52
7,309.58 5,582.13* Subject to deduction of tax at sourceEARNINGS PER SHARE (Rs.) 24
Before prior period and extra-ordinary itemsBasic 39.15 33.36Diluted 38.93 33.30
After prior period and extra-ordinary itemsBasic 39.38 30.01Diluted 39.16 29.97
SIGNIFICANT ACCOUNTING POLICIES 25NOTES TO THE CONSOLIDATED FINANCIAL STATEMENTS 26The schedules referred to above form an integral part of the consolidated financial statements.This is the consolidated profit and loss account referred to in our report of even date.
On behalf of the Board of Directors
For WALKER, CHANDIOK & CO TEJENDRA KHANNA D. S. BRAR DR. BRIAN W. TEMPESTChartered Accountants Chairman CEO & Managing Director Joint Managing Director
& CEO Designate
VINOD CHANDIOK MALVINDER MOHAN SINGH HARPAL SINGH VIVEK BHARAT RAMPartner Whole-time Director Director DirectorMembership No. 10093
RAM S. RAMASUNDARPlace : New Delhi Executive Vice President � S. K. PATAWARIDated : April 22, 2004 Finance & CFO Secretary
*
Consolidated Balance Sheet & Profit and Loss Account
CONSOLIDATED PROFIT AND LOSS ACCOUNTFOR THE YEAR ENDED DECEMBER 31, 2003

102
CONSOLIDATED CASH FLOW STATEMENTFOR THE YEAR ENDED DECEMBER 31, 2003
Rs Millions2003 2002
A. CASH FLOW FROM OPERATING ACTIVITIESNet Profit before extra-ordinary items and minority interests 9,796.04 7,458.28
Adjustments for :Depreciation / Amortisation 1,011.16 852.25Assets written off 3.88 75.19Goodwill 179.49 75.00Deferred employees compensation 37.42 19.24Exchange (gain ) / loss (133.97) 22.24Dividend income (20.02) (1.34)Profit on disposal of investments (Net) (94.32) (76.67)Loss on sale of fixed assets (Net) 33.49 7.32Provision for diminution in value of current investments (0.03) 11.77Interest expense 251.89 386.74Interest income (248.84) (84.41)Amounts written off 185.62 33.51Provision for doubtful debts and advances 98.84 370.47
1,304.61 1,691.31
Operating profit before working capital changes 11,100.65 9,149.59Adjustments for :
Inventories (555.93) (1,624.82)Sundry debtors / receivables 243.94 (1,555.25)Loans and advances (929.46) 135.67Trade/Other payables 1,660.98 191.02Other current assets (373.10) (411.15)
46.43 (3,264.53)
Net cash generated from operating activity before extra-ordinary items 11,147.08 5,885.06Extra-ordinary items 350.99 875.98Direct taxes paid (Net of refunds) (2,813.51) (1,585.29)
Net cash from operating activity after extra-ordinary items 8,684.56 5,175.75
B. CASH FLOW FROM INVESTING ACTIVITIESPurchase of fixed assets / capital works-in-progress (2,982.42) (2,141.20)Sale proceeds of fixed assets 409.26 495.58Purchase of investments � (254.51)Sale proceeds of investments 296.48 246.35Short term deposit / secured loans 2.77 271.86Interest received 248.84 84.41Dividend received 20.02 1.34
Net cash from / (used) from investing activities (2,005.05) (1,296.17)
C. CASH FLOW FROM FINANCING ACTIVITIESProceeds from issue of capital (including premium) 58.73 8.00Minority interest (21.59) (7.96)Decrease in bank and other borrowings 1,892.15 (1,280.52)Interest paid (251.89) (386.74)Dividend paid (2,782.47) (1,738.43)Tax on Dividend (356.50) (88.66)
Net cash from / (used) in financing activities (1,461.57) (3,494.31)
INCREASE / (DECREASE) IN CASH AND CASH EQUIVALENTS 5,217.94 385.27
Cash and cash equivalents at the beginning 1,459.47 1,074.20
Cash and cash equivalents at the close 6,677.41 1,459.47
Notes :Cash and cash equivalents include :
Cash and cheques in hand and remittances in transit 139.86 398.27With banks in :
Current accounts [Net of dividend accounts Rs. 53.93 million 390.67 1,016.02(Previous year Rs. 32.58 million)]
Deposit accounts 986.88 42.18Short term deposits 5,160.00 3.00
6,677.41 1,459.47
This is the consolidated cash flow statement referred to in our report of even date
On behalf of the Board of Directors
For WALKER, CHANDIOK & CO TEJENDRA KHANNA D. S. BRAR DR. BRIAN W. TEMPESTChartered Accountants Chairman CEO & Managing Director Joint Managing Director
& CEO Designate
VINOD CHANDIOK MALVINDER MOHAN SINGH HARPAL SINGH VIVEK BHARAT RAMPartner Whole-time Director Director DirectorMembership No. 10093
RAM S. RAMASUNDARPlace : New Delhi Executive Vice President � S. K. PATAWARIDated : April 22, 2004 Finance & CFO Secretary

103
SCHEDULES FORMING PART OF THE CONSOLIDATED FINANCIAL STATEMENTSFOR THE YEAR ENDED DECEMBER 31, 2003
Rs. MillionsSCHEDULE 1 2003 2002
CAPITALAuthorised199,000,000 (Previous year 199,000,000)
Equity shares of Rs. 10 each 1,990.00 1,990.00100,000 (Previous year 100,000)
Cumulative preference shares of Rs. 100 each 10.00 10.00
2,000.00 2,000.00Issued, subscribed and paid up185,543,625 (Previous year 185,452,098)
Equity shares of Rs. 10 each 1,855.44 1,854.52
1,855.44 1,854.52SCHEDULE 2
RESERVES AND SURPLUSCapital reserve 38.86 32.92Amalgamation reserve 43.75 43.75Revaluation reserve 109.54 111.86Share premium * 5,876.82 5,832.99Foreign projects reserve 143.99 135.13Employee stock options outstanding 51.07 19.23General reserve 13,442.21 9,787.75
19,706.24 15,963.63*Includes Rs. 5.58 million (previous year Rs. 0.80 million)transferred from Employees Stock Options Outstanding
SCHEDULE 3
SECURED LOANSTax exempt bonds � 17.97Loans from banks 2,472.56 1,411.75Deferred payment credits 11.31 6.80
2,483.87 1,436.52
SCHEDULE 4
UNSECURED LOANSFixed deposits 7.42 26.34
Short term loansBanks 3,292.71 2,431.89Others 39.54 36.67
3,332.25 2,468.56
Deferred sales tax credit 26.34 26.31
3,366.01 2,521.21
SCHEDULE 5
DEFERRED TAX LIABILITY (NET)Deferred tax liability arising on account of :
Depreciation 1,488.49 1,340.39
1,488.49 1,340.39Less : Deferred tax asset arising on account of :
Provision for:Doubtful debts and advances 389.22 393.35Diminution in the value of investments � 4.37
Tax benefit on carried forward losses 13.05 21.80Retirement benefits 95.31 7.81Others 47.92 72.27
545.50 499.60
942.99 840.79
Consolidated Cash Flow Statement & Schedules

104
SCHEDULES FORMING PART OF THE CONSOLIDATED FINANCIAL STATEMENTSFOR THE YEAR ENDED DECEMBER 31, 2003
Rs. MillionsSCHEDULE 7 2003 2002
INVESTMENTSCURRENTTrust securitiesOther than trade - unquoted41,089 US64 Bonds of Rs. 100 each (6.75% Tax Free)(Previous year 406,890 Units (1964 Scheme)) of the Unit Trust of India 4.11 4.08
4.11 4.08
LONG TERMInvestments in government securitiesOther than trade - unquotedKisan Vikas patra / Indira Vikas patra 0.01 0.01Investments in shares of companies (fully paid)
Nature of Face Numbersinvestment value 2003 2002
Trade :UnquotedNihon Pharmaceuticals Industry Co. Ltd., Japan Equity shares Yen 500 32,000 32,000 27.06 27.06Sidmak Laboratories (India) Limited Equity shares Rs. 10 16,733 16,733 10.54 10.54
QuotedVorin Laboratories Limited Equity shares Rs. 10 � 4,018,383 � 202.16
37.60 239.76Other than trade :QuotedFortis Financial Services Ltd. Equity shares Rs. 10 353,250 353,250 14.49 14.49The Great Eastern Shipping Company Ltd. Equity shares Rs. 10 500 500 0.03 0.03UnquotedFortis Healthcare Limited Equity shares Rs. 10 12,529,460 12,529,460 125.29 125.29Biotech Consortium India Ltd. Equity shares Rs. 10 50,000 50,000 0.50 0.50
140.31 140.31
182.03 384.16
Less : Provision for diminution in value of long term investments 13.95 13.95
168.08 370.21Details of investments purchased and redeemed during the year :
150,000,000 (Previous year Nil) units of HDFC Mutual Fund
SCHEDULE 6
FIXED ASSETS Rs. Millions
Gross block Accumulated Net BlockDepreciation /Amortisation
Description 2002 Additions Deletions 2003 2003 2003 2002
Goodwill 1,499.97 102.60 � 1,602.57 507.02 1,095.55 1,172.43Trade marks and product licenses 1,231.60 18.75 � 1,250.35 693.99 556.36 785.66Land 511.63 17.70 140.84 388.49 � 388.49 511.63Buildings 2,007.00 342.11 64.78 2,284.33 439.53 1,844.80 1,636.66Plant and machinery 8,487.16 1,494.38 62.81 9,918.73 4,436.53 5,482.20 5,009.60Furniture and fixtures 681.69 111.82 184.95 608.56 237.05 371.51 374.56Vehicles 203.37 67.93 26.52 244.78 69.85 174.93 176.02Assets taken on lease
Plant and machinery 3.10 � 2.18 0.92 0.19 0.73 2.55Equipments 4.52 5.01 0.96 8.57 5.27 3.30 4.26Vehicles 1.46 14.21 � 15.67 6.09 9.58 1.18
Total 14,631.50 2,174.51 483.04 16,322.97 6,395.52 9,927.45 9,674.55
Previous year 13,250.51 2,087.72 706.73 14,631.50 4,956.95 9,674.55

105
SCHEDULES FORMING PART OF THE CONSOLIDATED FINANCIAL STATEMENTSFOR THE YEAR ENDED DECEMBER 31, 2003
Rs. MillionsSCHEDULE 8 2003 2002
INVENTORIESStores and spares 68.14 67.01Raw materials 3,477.99 2,719.44Packaging materials 538.86 505.33Finished goods 4,244.04 4,786.30Work-in-process 1,229.41 924.43
9,558.44 9,002.51
SCHEDULE 9SUNDRY DEBTORS(Considered good except where provided for)Secured 170.32 301.04Unsecured 7,744.45 8,559.60
7,914.77 8,860.64Less : Doubtful and provided for 403.60 872.66
7,511.17 7,987.98
SCHEDULE 10CASH AND BANK BALANCESCash and cheques in hand 64.10 74.20Remittances in transit 75.76 324.07Balances with banks:
Current accounts 444.60 1,048.60Deposit accounts 995.42 46.64
1,579.88 1,493.51
SCHEDULE 11OTHER CURRENT ASSETS(Unsecured, considered good except where provided for)Export incentives accrued 1,196.01 871.95Exchange gain accrued on forward contracts 179.09 70.07Insurance claims 104.22 29.07Interest accrued 2.53 38.01Others 164.82 76.06
1,646.67 1,085.16Less : Doubtful and provided for 22.78 68.51
1,623.89 1,016.65
SCHEDULE 12LOANS AND ADVANCES(Considered good except where provided for)Secured 127.39 130.16Unsecured
Advances recoverable in cash or in kindor for value to be received 2,714.35 1,788.97
Short term deposits 5,160.00 3.00Prepaid Income-tax 3,452.40 1,832.56
11,454.14 3,754.69Less : Doubtful and provided for 378.15 221.19
11,075.99 3,533.50
SCHEDULE 13CURRENT LIABILITIESAcceptances 410.80 527.93Sundry creditors 4,458.13 3,299.44Other liabilities 2,921.98 2,393.80
7,790.91 6,221.17
SCHEDULE 14PROVISIONSRetirement benefits 548.27 341.22Income-tax 3,341.49 2,048.16Proposed dividend 2,228.38 1,854.52
6,118.14 4,243.90
Consolidated Schedules

106
SCHEDULES FORMING PART OF THE CONSOLIDATED FINANCIAL STATEMENTSFOR THE YEAR ENDED DECEMBER 31, 2003
Rs. MillionsSCHEDULE 15 2003 2002
OPERATING INCOMESales and Services
Sales 45,301.32 37,137.59Less : Excise duty on sales 692.05 719.14
44,609.27 36,418.45Services 13.50 10.11
44,622.77 36,428.56Others
Export incentives 1,793.54 1,117.63Technology licensing income 176.37 639.94Net exchange gain / (loss) 1,004.99 (22.24)Sundries 634.59 251.03
3,609.49 1,986.36 48,232.26 38,414.92
SCHEDULE 16OTHER INCOMEInterest 248.84 84.41Dividend 20.02 1.34Profit on sale of long term investments 94.32 80.16Profit on sale of assets 2.39 2.31Bad debts / advances recovered 3.38 15.42Unclaimed balances and excess provisions 42.94 18.23Miscellaneous 73.68 65.60
485.57 267.47SCHEDULE 17
MATERIALSRaw materials consumed 11,998.59 10,914.80Packaging materials consumed 1,697.42 1,403.40Finished goods purchased 3,940.78 4,052.52Increase in work in process and finished goods
Opening stockWork-in-process 924.43 849.11Finished goods 4,786.30 3,886.12
5,710.73 4,735.23Less :Closing stock
Work-in-process 1,229.41 924.43Finished goods 4,244.04 4,786.30
5,473.45 5,710.73(Increase) / Decrease 237.28 (975.50)Materials consumed 17,874.07 15,395.22
SCHEDULE 18MANUFACTURINGPower and fuel 554.93 503.54Excise duty 56.14 192.72Stores and spares consumed 348.80 249.43Analytical charges 60.53 55.42Processing charges 729.10 560.31Repairs and maintenance
Factory buildings 32.68 103.19Plant and machinery 105.16 77.41
1,887.34 1,742.02
SCHEDULE 19PERSONNELSalaries,wages and bonus 3,923.92 2,806.56Contribution to provident and other funds 277.31 193.96Workmen and staff welfare 308.04 233.73Amortisation of deferred employees compensation 37.42 19.24
4,546.69 3,253.49

107
SCHEDULES FORMING PART OF THE CONSOLIDATED FINANCIAL STATEMENTSFOR THE YEAR ENDED DECEMBER 31, 2003
Rs. MillionsSCHEDULE 20 2003 2002
SELLING, GENERAL AND ADMINISTRATIONRentals 325.76 257.75Rates and taxes 132.37 120.87Printing and stationery 112.48 79.20Insurance 469.46 195.53Communication 247.37 237.88Legal and professional charges 1,386.39 999.97Travel and conveyance 656.93 550.30Discounts 527.17 361.15Freight, clearing and forwarding 1,414.80 1,045.58Advertising and sales promotion 2,612.30 1,647.66Conferences and meetings 99.30 111.18Commission 498.75 356.55Amounts written off [Net of reversal of provision for doubtful
debts and advances Rs. 351.28 Million (Previous year Nil)] 264.25 33.51Assets written off 3.88 75.19Provision for doubtful debts and advances 20.21 370.47Provision / (Reversal) for diminution in value of investments (0.03) 11.77Loss on sale of fixed assets 34.52 9.63Loss on sale of long term investments � 3.49Others 1,943.17 1,318.29
10,749.08 7,785.97
SCHEDULE 21RESEARCH AND DEVELOPMENT EXPENDITURESalaries, wages and bonus 442.01 306.40Contribution to provident and other funds 35.19 17.50Workmen and staff welfare 30.07 29.78Materials and consumables 621.70 548.00Power and fuel 55.15 46.73Clinical trials 269.08 133.20Bioequivalence studies 440.85 386.33Rentals 30.52 11.96Rates and taxes � 2.21Printing and stationery 13.75 9.54Insurance 13.14 9.16Communication 23.73 18.08Legal and professional charges 111.83 13.64Travel and conveyance 60.51 50.16Others 275.13 103.60
2,422.66 1,686.29
SCHEDULE 22DEPRECIATION AND AMORTISATIONDepreciationBuilding 62.51 58.04Plant and machinery 627.16 526.48Furniture and fixtures 43.53 58.36Vehicles 21.86 19.24Assets taken on lease
Plant and machinery 0.09 0.26Equipments 4.47 0.28Vehicles 5.81 0.31
765.43 662.98Less : Transfer from revaluation reserve (2.32) (1.74)
763.11 661.24AmortisationTrade marks and product licenses 248.05 214.80Goodwill 179.49 75.00
427.54 289.80 1,190.65 951.04
Consolidated Schedules

108
SCHEDULES FORMING PART OF THE CONSOLIDATED FINANCIAL STATEMENTSFOR THE YEAR ENDED DECEMBER 31, 2003
Rs. MillionsSCHEDULE 23 2003 2002
PROVISION FOR TAXCurrent income-tax 2,439.01 1,759.50Deferred tax 99.12 97.15
2,538.13 1,856.65SCHEDULE 24
EARNINGS PER SHARENet profit attributable to equity shareholders
Profit after tax and minority interests 7,594.32 6,469.65Add :Tax-earlier years (5.31) 576.97
7,589.01 7,046.62Less :Depreciation - earlier years 284.33 �Expenditure on regulatory approvals - earlier years � 1,479.49Net profit available 7,304.68 5,567.13
Net profit attributable to equity shareholdersbefore prior period and extra-ordinary itemsNet profit available 7,304.68 5,567.13Prior period items (0.59) 23.34Settlement compensation income
On closure of a contract (51.16) (730.38)For dispute of patent (299.83) (145.50)
Depreciation - earlier years 284.33 �Expenditure on regulatory approvals - earlier years � 1,479.49Tax effect of above items 24.13 (8.55)
7,261.56 6,185.53No. of weighted average equity shares
Basic 185,492,693 185,437,258Effect of dilutive equity shares equivalent
� stock options outstanding 1,030,453 318,203
Diluted 186,523,146 185,755,461
Nominal value of equity share (Rs.) 10.00 10.00EARNINGS PER SHARE (Rs.)
Before prior period and extra-ordinary itemsBasic 39.15 33.36Diluted 38.93 33.30
After prior period and extra-ordinary itemsBasic 39.38 30.01Diluted 39.16 29.97

109
SCHEDULES FORMING PART OF THE CONSOLIDATED FINANCIAL STATEMENTSFOR THE YEAR ENDED DECEMBER 31, 2003
SCHEDULE 25
SIGNIFICANT ACCOUNTING POLICIES
1. Basis of presentationThe consolidated financial statements are prepared and presented under the historical cost convention on accrualbasis of accounting in accordance with the accounting policies of the parent company unless otherwise stated.
2. Use of estimatesThe preparation of the financial statements in conformity with the GAAP requires management to make estimates andassumptions that affect the reported amounts of assets and liabilities and disclosure of contingent liabilities as at thedate of the consolidated financial statements and reported amounts of revenues and expenses for the year. Actualresults could differ from these estimates.
3. Principles of consolidationThe consolidated financial statements include the financial statements of Ranbaxy Laboratories Limited ('the Company'),the parent company, its subsidiaries and a joint venture (collectively referred to as 'Ranbaxy Group').The consolidated financial statements have been combined on a line-by-line basis by adding the book values of likeitems of assets, liabilities, income and expenses after eliminating intra-group balances/transactions and resultingunrealized profits in full. The amounts shown in respect of reserves comprise the amount of the relevant reserves as perthe balance sheet of the parent company and its share in the post-acquisition increase in the relevant reserves of theconsolidated entities.Interest in Joint Ventures is accounted for by the proportionate consolidation method.The excess/deficit of cost to the parent company of its investment over its portion of equity in the consolidated entitiesat the respective dates on which the investment in such entities was made is recognised in the financial statements asgoodwill/capital reserve. The parent company's portion of equity in such entities is determined on the basis of bookvalues of assets and liabilities as per the financial statements of the entities as on the date of investment and if notavailable, the financial statements for the immediately preceding period adjusted for the effects of significant transactions.Newly acquired entities have been consolidated from the respective dates of their acquisition.The consolidated financial statements are presented, to the extent possible, in the same format as that adopted by theparent company for its separate financial statements.
4. Fixed assetsFixed assets are stated at cost (gross block) less accumulated depreciation. Capital works-in-progress includes advances.In case of revalued fixed assets, the incremental value on revaluation is carried under revaluation reserve and anamount equivalent to the depreciation on incremental value is withdrawn from the revaluation reserve to compensateadditional depreciation on incremental amount.
5. Depreciation/Amortisationa] Depreciation on fixed assets is provided on straight line method over useful life estimated by the management or
on the basis of depreciation rates prescribed under respective domestic laws.b] Goodwill arising on acquisition of subsidiaries/business is amortised on straight-line basis over the estimated
period of benefit, not exceeding twenty years.c] Cost of trade marks and product licenses are amortised over five years.d] Premium paid on perpetual leasehold land is charged to revenue on termination/renewal of lease agreements.
6. Investmentsa] Current investments are stated at lower of cost and fair value.b] Long term investments are stated at cost. Diminution in value of such investments (other than temporary decline)
is provided for separately.c] Profit/Loss on sale of investments is computed with reference to their average cost.
7. Valuation of InventoriesInventories are valued as under:Stores & spares, raw materials and packaging materials - at weighted average cost or using first in first out methodFinished goods - at lower of cost and net realisable valueWork-in-process - cost upto estimated stage of process
8. Expenditure on regulatory approvalsExpenditure incurred for obtaining regulatory approvals and registration of products for overseas markets and productacquisition is charged to revenue.
9. Deferred employees compensationThe accounting value of stock options representing the excess of the market price over the exercise price of the sharesgranted under "Employees Stock Option Scheme" of the Company is amortised on straight-line basis over the vesting periodas "Deferred employees compensation" and the unamortised portion of the cost is shown under Reserve and Surplus inaccordance with the SEBI (Employee Stock Option Scheme and Employee Stock Purchase Scheme) Guidelines, 1999.
Consolidated Schedules

110
SCHEDULES FORMING PART OF THE CONSOLIDATED FINANCIAL STATEMENTSFOR THE YEAR ENDED DECEMBER 31, 2003
SCHEDULE 25
SIGNIFICANT ACCOUNTING POLICIES (Contd.)
10. Revenue recognitiona] Revenue from sale of goods is recognised when the significant risks and rewards in respect of ownership of the
goods are transferred to the customer and is stated inclusive of excise duty, net of trade discount, sales return andsales tax where ever applicable.
b] Dividend is recognised as and when the right to receive the income is established.c] Royalty, technical know-how and licencing income is recognised as revenue when earned, in accordance with
the terms of the relevant agreements.
11. Export benefits/incentivea] Export entitlements under the Duty Entitlement Pass Book ("DEPB") scheme are recognised in the profit and loss
account when the right to receive credit as per the terms of the scheme is established in respect of the exports made.b] Entitlements / obligation on account of Advance Licences for import of raw materials are accounted for on
purchase of raw materials and / or export sales.
12. Research and developmentRevenue expenditure incurred on research and development is charged to revenue in the year it is incurred.Capital expenditure is included in the respective heads under fixed assets.
13. Foreign exchange translationsa] Investments in foreign entities are recorded at the exchange rates prevailing on the date of making the investments.b] Transactions in foreign currencies are recorded at the rates prevailing on the date of the transaction. Monetary
items denominated in foreign currency are restated at the rate prevailing on balance sheet date.Exchange gains / losses on settlement and on conversion of monetary items denominated in foreign currency aredealt with in the profit and loss account, except for loans denominated in foreign currencies utilised for acquisitionof fixed assets where exchange gain/losses are adjusted to the cost of such assets.
c] Income and expenditure items at representative offices are translated at the monthly average exchange rate of theirrespective foreign currencies. Monetary items at representative offices at the balance sheet date are translatedusing the year-end rates. Non-monetary assets are recorded at the rates prevailing on the date of the transaction.
d] Indian Rupee is the reporting currency for the Ranbaxy Group. However, the local currencies of overseassubsidiaries and joint venture are different from the reporting currency of the Ranbaxy Group. The translation oflocal currencies into Indian Rupee is performed for assets and liabilities (excluding share capital, opening reservesand surplus and fixed assets), using the exchange rate as at the balance sheet date, for revenues, costs andexpenses using weighted average exchange rate during the reporting period. Share capital and opening reservesand surplus and fixed assets are carried at historical cost. Resultant currency translation exchange gain/loss isadjusted in general reserve under reserves and surplus.
e] Premium / discount on forward exchange contracts is recognised as income or expenditure over the period of thecontracts.
14. Retirement benefitsa] Contributions to specific schemes are charged to the profit and loss account of the year.b] Provisions for future liabilities in respect of gratuity, pension and leave encashment benefits are made on the basis
of actuarial valuation made by an independent actuary as at the balance sheet date.
15. Earnings per shareBasic earning per share are calculated by dividing the net profit or loss for the year attributable to equity shareholdersby weighted average number of equity shares outstanding during the year.For calculating diluted earnings per share, the net profit or loss for the year attributable to equity shareholders and theweighted average number of options outstanding during the year are adjusted for the effects of all dilutive potentialshares.
16. Taxes on incomeProvision for tax for the year comprises estimated current income-tax determined to be payable in respect of taxableincome and deferred tax being the tax effect of timing differences representing the difference between taxable andaccounting income that originate in one period and are capable of reversal in one or more subsequent periods.The charge for current tax is calculated in accordance with the relevant domestic tax regulations.
17. Contingent liabilitiesDepending on facts of each case and after due evaluation of relevant legal aspects, claims against the Company notacknowledged as debts are provided or disclosed as contingent liabilities. In respect of statutory matters, contingentliabilities are provided or disclosed only for those demand(s) that are contested by the Company.

111
1. Share capital
a] Share capital includes:
(i) 146,849,494 (Previous year 146,849,494) Equity shares allotted as fully paid bonus shares by capitalisationout of share premium and reserves.
(ii) 3,281,154 (Previous year 3,281,154) Equity shares allotted as fully paid up pursuant to contract withoutpayment being received in cash.
b] Outstanding stock options for equity shares of the parent company under the "Employees Stock Option Scheme" :
Date of grant Exercise price 2003 2002Rs. Numbers Numbers
January 12, 2001* 673.00 (420.34) 160,507 (256,811) 187,047 (299,275)December 3, 2001* 595.00 (371.88) 282,201 (451,522) 304,181 (486,690)April 1, 2002* 745.00 (465.63) 404,843 (647,749) 447,585 (716,136)February 7,2003 567.00 � 894,275 � � �August 18,2003 701.00 � 2,000 � � �
1,743,826 (1,356,082) 938,813 (1,502,101)
* The adjusted outstanding options and their adjusted exercise price in accordance with the Employees StockOptions Scheme of the Company consequent to issue of bonus shares on October 11, 2002, are given in theparenthesis.
c] Allotment of 18,497 equity shares (Previous year 18,497) of Rs. 10 each, on payment of Rs. 125 per share(including Rs. 115 on account of share premium) and 18,497 equity shares (Previous year 18,497) of Rs. 10each on payment of Rs. 175 per share (including Rs. 165 on account of share premium), [in respect of 12% Fullyconvertible debentures of Rs. 300 each (1993 Series) in terms of the letter of offer dated September 20, 1993already converted], has been kept in abeyance under provisions of section 206-A of the Companies Act, 1956.
2. Secured loans:
Loans under different categories are secured against certain assets, property, equipment and other immovable property,inventories and receivable of the parent company or concerned subsidiary.
Rs. Millions2003 2002
3. Loan due within one year 4,914.44 825.24
4. General reserve includes translation reserve (20.26) 365.21
5. Fixed assets
Land includes:
a] cost of leasehold land Rs. 199.41 million (Previous year Rs. 298.21 million).
b] cost of freehold land Rs. 49.25 million (Previous year Rs. 187.08 million)pending registration in the name of the Company.
6. Investments
QuotedAggregate book value (Net of provision) 1.07 203.23Market value 2.64 105.61
UnquotedAggregate book value (Net of provision) 167.01 166.98
7. Exchange gain on outstanding forward exchange rate contractsto be recognised in the subsequent year 182.83 96.46
8. Deposit accounts with banks include pledged withGovernment Authorities and others 8.54 4.46
SCHEDULES FORMING PART OF THE CONSOLIDATED FINANCIAL STATEMENTSFOR THE YEAR ENDED DECEMBER 31, 2003
SCHEDULE 26
NOTES TO THE CONSOLIDATED FINANCIAL STATEMENTS
Consolidated Schedules

112
9. Remuneration to directors of parent company*
Salaries and allowances 33.00 29.16Contribution to provident and other funds 4.16 3.54Directors' fee 0.95 0.48Commission 57.04 50.65Perquisites ** 10.28 11.01
105.43 94.84
* Exclusive of provision for future liabilities in respect of retirement benefits (which are based on actuarial valuationdone on overall Company basis) and amortisation of deferred employees compensation on grant of stockoptions under "Employees Stock Option Scheme" of the Company.
Excludes Rs. 6.72 million (previous year Rs. 3.62 million) paid as gratuity to a director upon his retirement by thegratuity trust set up by the company.
** Where the monetary value of the benefits is not ascertainable, they have been determined based on the provisionof Income-tax Act, 1961.
Rs. Millions2003 2002
10. Contingent liabilities
Claims not acknowledged as debts 948.73 244.06Direct and indirect taxes 25.12 59.74Guarantees to banks/others on account of joint ventures 4.81 400.00Bills purchased/discounted under letters of credit 4.01 81.53
11. Capital commitments (Net of advances) 474.69 61.19
12. Leases
Particulars in respect of assets taken on lease required to be disclosed underaccounting standard on "Leases" issued by Institute of Chartered Accountants of India.
a] Minimum lease payments outstanding 11.31 7.40b] Present value of minimum lease payments 9.74 6.80c] Amounts due
Minimum lease Present value of minimumpayments lease payments
Rs. Millions Rs. Millions2003 2002 2003 2002
(i) not later than one year 6.94 3.05 5.90 2.90
(ii) later than one year but 4.37 4.35 3.84 3.90not later than five years
13. Related party disclosures
Related party disclosures as required under accounting standard on "Related Party Disclosures" issued by the Instituteof Chartered Accountants of India are given below:
a] Relationship:
(i) Joint Ventures and Associates
Thembalami Pharmaceuticals (PTY) Ltd. #
Vorin Laboratories Ltd. *
# No transactions during the year* Ceased to be an associate during the year
SCHEDULES FORMING PART OF THE CONSOLIDATED FINANCIAL STATEMENTSFOR THE YEAR ENDED DECEMBER 31, 2003
SCHEDULE 26
NOTES TO THE CONSOLIDATED FINANCIAL STATEMENTS (Contd.)Rs. Millions
2003 2002

113
(ii) Key management personnel Entities over which significant influence is exercised
Mr. D. S. Brar Madhubani Investment (P) Ltd.Suraj Hotel (P) Ltd.Green Vally Land & Development (P) Ltd.Suraj Overseas (P) Ltd.
Dr. Brian W. Tempest �
Mr. V. K. Kaul ANR Securities (P) Ltd.
Dr. Rashmi Barbhaiya �
Mr. Ram S. Ramasundar �
b] The following transactions were carried out with related parties in the ordinary course of business.
Rs. Millions2003 2002
(i) Joint Ventures and Associates.
Purchase of materials/finished goods 115.73 348.22Sale of finished goods � 65.71Services rendered/other receipts � 0.90Services rendered/other payments 0.04 �Loans/Advances given � 632.80Interest received 2.82 16.83Guarantee commission received � 0.69Balance at the end of the year :
Other receivables 0.86 4.41Payables � 97.31Guarantees provided � 400.00
(ii) Key management personnel and their relatives
Remuneration to key management personnel 124.83 99.18Interest paid on fixed deposits � *Rent paid 3.00 4.41Security deposits :
Received 0.19 �Balance at the end of the year :
Security deposits : Received 0.95 �
* Rs. 3,770 rounded off to nil.
14. Segment information
Business segments
For management purposes, the Group reviews the performance on the basis of business units identified asPharmaceuticals and Other businesses, which are reportable segments.
Pharmaceuticals segment comprise of manufacture and trading of formulations, Active Pharmaceuticals Ingredientsand Intermediate (API), Generics, Drug discovery and Consumer Health Care products.
Other businesses comprise of manufacture of Laboratory chemicals, manufacture and trading of Animal Health careproducts and chartering of aircrafts.
Geographic Segments
The Group's business is organized into four key geographic segments. Revenues are attributable to individual geographicsegments based upon the location of the customer.
Other Information
All segment revenue, expenses, assets and liabilities are directly attributable to the segments and disclosed accordingly.
Segment revenue, segment expenses and segment results include transfers between business segments. Inter-segmenttransfers are accounted for at selling price to the transferring segment. Such transfers are eliminated on consolidation.
The accounting policies consistently used in the preparation of the financial statements are also applied to revenuesand expenditure of individual segments.
SCHEDULES FORMING PART OF THE CONSOLIDATED FINANCIAL STATEMENTSFOR THE YEAR ENDED DECEMBER 31, 2003
SCHEDULE 26
NOTES TO THE CONSOLIDATED FINANCIAL STATEMENTS (Contd.)
Consolidated Schedules

114
Segment information disclosures as required under accounting standard on "Segment Reporting" issued by Institute ofChartered Accountants of India.
a] Primary segment informationRs. Millions
Pharmaceuticals Others Segment Total Elimination Total
2003 2002 2003 2002 2003 2002 2003 2002 2003 2002REVENUEExternal revenue 47,043.66 37,309.07 1,188.60 1,105.85 48,232.26 38,414.92 � � 48,232.26 38,414.92Inter segment revenue 82.45 51.93 25.60 19.00 � � (108.05) (70.93) � �
Total revenue 47,126.11 37,361.00 1,214.20 1,124.85 48,340.31 38,485.85 (108.05) (70.93) 48,232.26 38,414.92
RESULTS
Total segment results 9,711.37 7,573.81 149.57 72.76 9,860.94 7,646.57 � � 9,860.94 7,646.57Interest expense (251.89) (386.74)Interest income 248.84 84.41Extraordinary items 350.99 875.98Unallocated corporate income net of expenses (61.85) 114.04Income taxes (2,538.13) (1,856.65)
Profit after tax 7,608.90 6,477.61
OTHER INFORMATION
Segment assets 37,307.72 29,463.70 882.13 689.04 38,189.85 30,152.74 � � 38,189.85 30,152.74
Unallocated assets 4,260.03 3,117.30
Total assets 42,449.88 33,270.04
Segment liabilities 12,541.81 10,176.55 160.32 129.68 12,702.13 10,306.23 � � 12,702.13 10,306.23
Unallocated liabilities 8,166.20 5,145.36
Total liabilities 20,868.33 15,451.59
Capital Expenditure 1,848.38 1,901.24 53.02 22.22 1,901.40 1,923.46 � � 1,901.40 1,923.46
Depreciation /Amortisation 1,176.52 938.97 14.13 12.07 1,190.65 951.04 � � 1,190.65 951.04
Non cash expenses other than depreciation/ amortization 68.20 441.54 7.09 4.12 75.29 445.66 � � 75.29 445.66
Unallocated non cash expenses 284.97 �
360.26 445.66
b] Secondary segment information - Geographical
Rs. Millions
India Europe North America Asia Pacific
2003 2002 2003 2002 2003 2002 2003 2002
(i) Segment revenue 12,556.55 9,715.89 7,795.40 3,845.21 19,370.96 14,403.81 4,680.89 3,881.10
(ii) Segment assets 28,036.68 20,234.84 � � 6,364.33 6,534.66 � �
(iii) Capital expenditure 1,243.96 1,316.68 � � 412.12 448.14 � �
SCHEDULES FORMING PART OF THE CONSOLIDATED FINANCIAL STATEMENTSFOR THE YEAR ENDED DECEMBER 31, 2003
SCHEDULE 26
NOTES TO THE CONSOLIDATED FINANCIAL STATEMENTS (Contd.)

115
15. Consolidated financial statements comprise the financial statements of the parent company and its subsidiaries listedbelow :Subsidiary Country of Effective group
incorporation shareholding (%)Ranbaxy Drugs and Chemicals Company India 100.00(A public company with unlimited liability)Ranbaxy Drugs Limited India 100.00Ranbaxy Fine Chemicals Limited India 100.00Rexcel Pharmaceuticals Limited India 100.00Solus Pharmaceuticals Limited India 100.00Vidyut Investments Limited India 100.00Vidyut Travel Services Limited India 100.00Ranbaxy Do Brasil Ltda. Brazil 100.00Ranbaxy Egypt Limited Egypt 100.00Basics GmbH Germany 100.00Ranbaxy (Hong Kong) Limited Hong Kong 100.00Ranbaxy Ireland Limited Ireland 100.00Ranbaxy (Netherlands) B.V. Netherlands 100.00Ranbaxy N.A.N.V Netherlands 100.00Ranbaxy Pharmaceuticals BV Netherlands 100.00Ranbaxy Panama, S.A. Panama 100.00Ranbaxy Poland Sp. Zoo. Poland 100.00Ranbaxy (S.A.) Proprietary Limited South Africa 100.00Ranbaxy (UK) Limited United Kingdom 100.00Ranbaxy Europe Limited United Kingdom 100.00Ranbaxy Holdings (UK) Limited United Kingdom 100.00Ohm Laboratories Inc. United States of America 100.00Ranbaxy Pharmaceuticals Inc. United States of America 100.00Ranlab Inc. United States of America 100.00RanPharm Inc. United States of America 100.00Ranchem Inc. United States of America 100.00Ranbaxy Vietnam Company Limited Vietnam 100.00Ranbaxy France SAS France 100.00Ranbaxy, Inc. United States of America 100.00Ranbaxy USA, Inc. United States of America 100.00Unichem Distributors (Limited partnership), Thailand 99.96Gufic Pharma Limited India 98.00Unichem Pharmaceuticals Limited Thailand 98.50Bounty Holdings Company Limited Thailand 99.30Ranbaxy Nigeria Limited Nigeria 84.89Ranbaxy(Guangzhou China) China 83.00Ranbaxy PRP (Peru) S.A.C. Peru 100.00Ranbaxy Unichem Company Limited Thailand 88.56Ranbaxy Signature LLC United States of America 67.50Ranbaxy (Malaysia) Sdn. Bhd. Malaysia 56.25Ranbaxy Farmaceutica Ltda. Brazil 70.00
Joint VentureThembalami Pharmaceuticals (PTY) Ltd South Africa 50.00
16. Previous year figuresPrevious year figures have been regrouped / recast wherever considered necessary to make these comparable withthose of the current year.
Signatories to schedules 1 to 26
SCHEDULES FORMING PART OF THE CONSOLIDATED FINANCIAL STATEMENTSFOR THE YEAR ENDED DECEMBER 31, 2003
SCHEDULE 26
NOTES TO THE CONSOLIDATED FINANCIAL STATEMENTS (Contd.)
On behalf of the Board of Directors
For WALKER, CHANDIOK & CO TEJENDRA KHANNA D. S. BRAR DR. BRIAN W. TEMPESTChartered Accountants Chairman CEO & Managing Director Joint Managing Director
& CEO Designate
VINOD CHANDIOK MALVINDER MOHAN SINGH HARPAL SINGH VIVEK BHARAT RAMPartner Whole-time Director Director DirectorMembership No. 10093
RAM S. RAMASUNDARPlace : New Delhi Executive Vice President � S. K. PATAWARIDated : April 22, 2004 Finance & CFO Secretary
Consolidated Schedules

116
Rs. MillionsExchange Capital Reserves Total Total Detail of Turnover / Profit Provision Profit Proposed
rates for assets liabilities Investments* Services before for after dividendconversion (exempt in taxation taxation taxation
as on case ofDecember investment31, 2003 subsidiaries)
Solus Pharmaceuticals Ltd. � 30.01 (5.52) 30.56 6.07 � 30.34 (1.54) 0.22 (1.32) �
Rexcel Pharmaceuticals Ltd. � 10.00 31.92 75.13 33.21 � 126.84 8.58 3.32 5.26 �
Ranbaxy Fine Chemicals Ltd. � 55.50 4.63 186.15 126.02 1.74 344.45 30.28 6.26 24.01 �
Vidyut Investments Ltd. � 250.08 27.73 659.25 381.44 � � 0.82 (0.09) 0.91 �
Vidyut Travel Services Ltd. � 10.00 (3.20) 53.38 46.58 � 13.11 (0.57) 0.98 (1.55) �
Ranbaxy Drugs and � 62.00 (1.17) 60.95 0.12 34.30 � 10.60 � 10.60 �Chemicals Company(A public company withunlimited liabililty)
Ranbaxy Drugs Ltd. � 31.00 (0.36) 33.68 3.04 31.00 � (0.01) � (0.01) �
Gufic Pharma Ltd. � 0.50 0.05 1.27 0.72 � � 0.27 0.02 0.25 �
Ranbaxy (Guangzhou China) Ltd., 5.5100 359.53 (179.72) 429.11 249.30 � 510.65 (40.70) � (40.70) �China
Ranbaxy (Netherlands) B.V., 45.6050 2,508.41 1,386.39 15,819.80 11,925.00 43.21 25,830.21 2,324.64 878.62 1,446.03 �(Consolidated) The Netherlands
Ranbaxy Nigeria Ltd., 0.3257 13.03 67.23 299.10 218.84 � 542.98 28.63 9.05 19.57 4.56Nigeria
Ranbaxy (Hong Kong) Ltd., 45.6050 14.04 (51.76) 3.15 40.87 � 8.18 (0.77) � (0.77) �(Consolidated), Hong Kong
Bounty Holdings Company Ltd., 1.1502 6.33 (6.17) 0.20 0.04 � � (6.01) � (6.01) �Thailand
Ranbaxy Unichem Company Ltd., 1.1502 115.02 (19.09) 171.53 75.53 0.42 258.22 4.78 3.03 1.75 �Thailand
Unichem Pharmaceuticals Ltd., 1.1502 4.60 (4.62) 0.03 0.05 � � 0.05 0.01 0.04 �Thailand
Ranbaxy Malaysia Sdn. Bhd., 11.9997 96.00 81.47 346.95 169.48 � 500.03 57.27 15.49 41.78 13.51Malaysia
FINANCIAL DETAILS OF THE SUBSIDIARY COMPANIESFOR THE YEAR ENDED DECEMBER 31, 2003

117
*Detail of Investments
Name of the subsidiary Particulars Nature of investments Face value Numbers AmountRs. Millions
Ranbaxy Fine Chemicals Ltd. Ranbaxy Drugs and Chemicals Company Equity Shares Rs. 10 1,550,000 1.74(A public company with unlimited liabililty)
Ranbaxy Drugs and Chemicals Company Sidmak Laboratories (India) Ltd. Equity Shares Rs. 100 16,733 34.30(A public company with unlimited liabililty)
Ranbaxy Drugs Ltd. Ranbaxy Drugs and Chemicals Company Equity Shares Rs. 10 3,100,000 31.00(A public company with unlimited liabililty)
Ranbaxy (Netherlands) B.V., Nihon Pharmaceuticals Industry Co. Ltd., Japan Equity Shares Yen 500 32,000 25.73(Consolidated) The Netherlands Ranbaxy (Guangzhou China) Ltd., China Capital Contribution 17.48
Ranbaxy Unichem Company Ltd., Bounty Holdings Company Ltd., Thailand Ordinary Shares 0.08Thailand Unichem Distributors Ltd., Capital Contribution 0.34
Partnership, Thailand
FINANCIAL DETAILS OF THE SUBSIDIARY COMPANIES (Contd.)FOR THE YEAR ENDED DECEMBER 31, 2003
Note:
In terms of approval granted by the Central Government under Section 212(8) of the Companies Act, 1956, a copy of the Balance Sheet, Profitand Loss Account, Report of the Board of Directors and the Report of the Auditors of the subsidiary companies have not been attached withAnnual Report of the Company. The Company will make available these document and the related details upon request by any investor of theCompany and of its subsidiary. These documents will also be available for inspection by any investor at the Head Office of the Company at25, Nehru Place, New Delhi � 110 019 and that of the subsidiary companies concerned.
Financial Details of The Subsidiary Companies

118
REPORT OF INDEPENDENT ACCOUNTANTS
Board of Directors and Stockholders
Ranbaxy Laboratories Limited and Subsidiaries
We have audited the accompanying consolidated balance sheets of Ranbaxy Laboratories Limited and subsidiaries
as of December 31, 2003 and 2002, and the related consolidated statements of income and cash flows for the
years then ended. These financial statements are the responsibility of the Company's management. Our
responsibility is to express an opinion on these financial statements based on our audits.
We conducted our audits in accordance with auditing standards generally accepted in the United States of
America. Those standards require that we plan and perform the audits to obtain reasonable assurance about
whether the financial statements are free of material misstatement. An audit includes examining, on a test basis,
evidence supporting the amounts and disclosures in the financial statements. An audit also includes assessing
the accounting principles used and significant estimates made by management, as well as evaluating the overall
financial statement presentation. We believe that our audits provide a reasonable basis for our opinion.
In our opinion, the financial statements referred to above present fairly, in all material respects, the consolidated
financial position of Ranbaxy Laboratories Limited and its subsidiaries as of December 31, 2003 and 2002, and
the consolidated results of their operations and their consolidated cash flows for the years then ended, in conformity
with accounting principles generally accepted in the United States of America.
GRANT THORNTON
New Delhi, India
April 22, 2004

119
RANBAXY LABORATORIES LIMITED AND SUBSIDIARIES
CONSOLIDATED BALANCE SHEET(All amounts in Rupees Million, unless otherwise stated)
As at December 31,
2003 2002
ASSETS
Current assetsCash and cash equivalents 6,680.34 1,451.66Restricted cash 61.95 41.87Accounts receivable, net of allowances 7,467.95 7,973.10Inventories 9,573.45 9,020.81Deferred income taxes 360.89 473.87Income taxes recoverable 3,544.21 1,885.90Other current assets, net of allowances 4,149.97 2,143.15
Total current assets 31,838.76 22,990.36
Property, plant and equipment, net 6,710.48 5,117.66Deferred income taxes 145.23 164.36Investment securities 166.75 270.35Intangible assets, net 2,285.13 2,489.98Other assets 334.23 530.14
Total assets 41,480.58 31,562.85
LIABILITIES AND STOCKHOLDERS EQUITY
Current liabilities
Borrowings from banks and financial institutions 2,894.53 2,401.67Current portion of long term debt 2,025.53 974.96Accounts payable 4,437.73 3,301.03Income taxes payable 3,066.79 1,829.62Accrued expenses 794.68 1,255.09Other current liabilities 2,614.67 1,467.25
Total Current Liabilities 15,833.93 11,229.62
Long-term debt, excluding current portion 930.11 590.86Deferred revenues 87.00 31.18Deferred income taxes 644.68 476.29Other liabilities 502.87 479.72
Total Liabilities 17,998.59 12,807.67
Minority interest 165.94 186.97Commitments and contingencies (See Note J, K and T)
Stockholders equity
Common stock, Rs 10.00 par value,199,000,000 equity shares authorized,185,543,625 equity shares (2002 - 185,452,098)issued and outstanding as at December 31, 2003 1,855.44 1,854.52
Additional paid in capital 6,060.76 5,945.99
Deferred stock-based compensation (112.99) (93.46)
Retained earnings 15,207.58 10,465.16Accumulated other comprehensive income 305.26 396.00
Total stockholders equity 23,316.05 18,568.21
Total Liabilities and Stockholders equity 41,480.58 31,562.85
The accompanying notes are an integral part of these financial statements.
Auditors' Report & Consolidated Balance Sheet � US GAAP

120
RANBAXY LABORATORIES LIMITED AND SUBSIDIARIES
CONSOLIDATED STATEMENTS OF INCOME(All amounts in Rupees Million, unless otherwise stated)
As at December 31,
2003 2002
Revenues
Product sales, net of allowances 45,254.49 37,075.72
Service income 711.44 807.32
Other revenues 3,411.79 2,142.13
49,377.72 40,025.17
Cost of revenues (excluding depreciation and amortization) 20,462.51 17,817.96
Gross profit 28,915.21 22,207.21
Operating expenses
Selling, general and administrative expenses 15,033.94 10,962.74
Research and development expenses 2,422.33 1,686.29
Depreciation and amortization 1,226.52 966.60
Total operating expenses 18,682.79 13,615.63
Operating income 10,232.42 8,591.58
Equity in loss of affiliate 3.22 -
Interest expense 251.93 388.48
Interest income 248.33 83.07
Other income 394.92 254.47
Income before income taxes and minority interest 10,620.52 8,540.64
Income taxes 2,729.29 1,806.88
Minority interest 9.84 8.03
Net income 7,881.39 6,725.73
Earnings per equity share
Basic 42.49 36.27
Diluted 42.25 36.24
Weighted average number of equity shares used incomputing earnings per equity share
Basic 185,492,693 185,437,258
Shares representing employees stock options outstanding 1,030,453 148,889
Diluted 186,523,146 185,586,147
The accompanying notes are an integral part of these financial statements.

121
RANBAXY LABORATORIES LIMITED AND SUBSIDIARIES
CONSOLIDATED STATEMENTS OF STOCKHOLDERS EQUITY AND COMPREHENSIVE INCOME(All amounts in Rupees Million, unless otherwise stated)
Common stock
No. of Amount Addional Deferred Retained Comprehensive Accumulated Totalshares paid in stock earnings income otherstockholders'
capital based comprehensive equitycompensation income (loss)
Balance as at January 1, 2002 185,432,969 1,854.32 5,872.52 (47.03) 5,491.36 371.06 13,542.23
Receipt on exercise of stock options 19,129 0.20 7.50 7.70
Receipt of share application moneypending allotment 0.30 0.30
Deferred stock-based compensation 65.67 (65.67) -
Amortization of deferred stockbased compensation 19.24 19.24
Cash dividend paid (1,738.43) (1,738.43)
Reversal of accumulated profits of anequity affiliates on becoming a subsidiary (13.50) (13.50)
Comprehensive income
Net income 6,725.73 6,725.73 6,725.73
Translation adjustment 22.78 22.78 22.78
Realized gain reversed on saleof equity securities (9.48) (9.48) (9.48)
Unrealized holding gain onmarketable debt securities 1.32 1.32 1.32
Unrealized holding gain onmarketable equity securities 10.32 10.32 10.32
6,750.67
Balance as at December 31, 2002 185,452,098 1,854.52 5,945.99 (93.46) 10,465.16 396.00 18,568.21
Receipt on exercise of stock options 91,527 0.92 38.24 39.16
Receipt of share application moneypending allotment 19.58 19.58
Deferred stock-based compensation 56.95 (56.95) �
Amortization of deferred stock basedcompensation 37.42 37.42
Cash dividend paid (3,138.97) (3,138.97)
Comprehensive income
Net income 7,881.39 7,881.39 7,881.39
Translation adjustment (89.42) (89.42) (89.42)
Unrealized holding loss onmarketable debt securities (1.32) (1.32) (1.32)
7,790.65
Balance as at December 31, 2003 185,543,625 1,855.44 6,060.76 (112.99) 15,207.58 305.26 23,316.05
The accompanying notes are an integral part of these financial statements.
Consolidated Statements of Income & Stockholders Equity and Comprehensive Income � US GAAP

122
RANBAXY LABORATORIES LIMITED AND SUBSIDIARIES
CONSOLIDATED STATEMENTS OF CASH FLOWS(All amounts in Rupees Million, unless otherwise stated)
As at December 31,
2003 2002
Cash flows from operating activitiesNet income 7,881.39 6,725.73Adjustments to reconcile net income to net cash and
cash equivalents provided by/ (used in) operating activitiesDepreciation and amortization 1,226.52 966.60Deferred tax expense 285.17 48.90Allowance for doubtful receivables 20.62 574.38Loss/ (gain) on disposal of property, plant and equipment 15.09 (25.26)Gain on disposal of investment (172.65) (75.78)Property, plant and equipment written off 2.41 74.57Amortization of employees stock option plan expense 37.42 19.24Minority interest 9.84 8.03
Changes in operating assets and liabilitiesAccounts receivable 357.24 (1,371.18)Inventories (658.79) (2,195.53)Prepaid expenses and other current assets (3,803.27) (1,146.54)Other non-current assets 214.93 91.05Accounts payable 1,356.21 (413.13)Other current liabilities 1,836.02 1,470.27Other non-current liabilities (7.88) 206.98
Net cash provided by operating activities 8,600.27 4,958.33
Cash flows from investing activitiesExpenditure on property, plant and equipment (2,580.49) (1,273.99)Cash paid for acquisition of minority interest in subsidiaries (130.35) (114.05)Proceeds from sale of property, plant and equipment 34.29 17.65Proceeds from sale of investment 296.48 158.16Purchase of intangibles (12.25) (369.27)Purchase of investments � (52.35)Restricted cash (21.92) (9.60)Maturity of restricted cash balances 2.98 87.50
Net cash used in investing activities (2,411.26) (1,555.95)
Cash flows from financing activitiesProceeds from/ (repayment of) borrowings from banks and
financial institutions, net 476.32 (1,315.26)Repayment of long term debt (157.53) (55.32)Principal payments under capital lease obligations (3.82) (3.01)Proceeds from issuance of term loans 1,643.27 111.80Payment of dividend (including tax) (3,138.97) (1,738.43)Receipt from employees on exercise of stock options 58.74 8.00Receipt of share application money from minority stockholders � 14.12Payment of dividend to minority interest in subsidiaries (5.64) (4.23)
Net cash provided by financing activities (1,127.63) (2,982.33)
Net increase in cash and cash equivalents during the year 5,061.38 420.05Effect of exchange rate changes on cash and cash equivalents 167.30 42.58
Cash and cash equivalents at the beginning of the year 1,451.66 989.03
Cash and cash equivalents at the end of the year 6,680.34 1,451.66
Supplemental disclosuresCash paid during the year for interest 260.55 397.48Cash paid during the year for income taxes 2,098.48 1,789.38Assets under capital leases capitalized during the year 2.43 4.57
The accompanying notes are an integral part of these financial statements.

123
RANBAXY LABORATORIES LIMITED AND SUBSIDIARIES
NOTES TO CONSOLIDATED FINANCIAL STATEMENTSDecember 31, 2003 and 2002(All amounts in Rupees Million, unless otherwise stated)
NOTE A - SUMMARY OF SIGNIFICANT ACCOUNTING POLICIES
A summary of the significant accounting policies applied in the preparation of the accompanying financial statements follows:
1. Organization and Nature of operations
Ranbaxy Laboratories Limited ("RLL" or the "Company"), a public limited company, was incorporated on June 16, 1961and presently, together with its subsidiaries (hereinafter collectively referred to as the "Group") operates as an integratedinternational pharmaceutical organization with businesses encompassing the entire value chain in the marketing,production and distribution of dosage forms and active pharmaceutical ingredients. The Group is also engaged in thebusiness of diagnostics, animal healthcare products, laboratory reagents, fine chemicals and consumer healthcare products.
The Group presently has manufacturing facilities in seven countries, namely India, United States of America, Ireland,China, Malaysia, Nigeria and Vietnam. Their major markets include United States of America, India, Europe and Brazil.The United States of America remained the largest market due to buoyant sales of Cefuroxime Axetil tablets, as well asother major products, which include - Amoxy Clav, Isotretnoin, Cephalexin, Clindamycin and Minocycline. The researchand development activities of the Group are principally carried out at its facilities in Gurgaon, near New Delhi, India.
The Company's shares are listed for trading on leading stock exchanges in India and its Global Depository Receipts(covering equity shares of RLL) are listed on the Luxembourg stock exchange.
2. Principles of consolidation
The consolidated financial statements include the financial statements of RLL and all its subsidiaries which are morethan 50 percent owned and controlled. An entity in which RLL has directly or indirectly, through other subsidiaryundertakings, a controlling interest is classified as a subsidiary.
The Group accounts for investments by the equity method of accounting where it is able to exercise significant influenceover the operating and financing policies of the investee. The Group's equity in the income/loss of equity methodaffiliates is included in the statement of operations.
All material inter-company transactions and balances, between the entities included in the consolidated financialstatements, have been eliminated.
Details of the entities, which presently form part of the Group and are consolidated under RLL are as follows:
Name of entity Country of Shareholdingincorporation
Ranbaxy Drugs and Chemicals Company India 100.00%Ranbaxy Drugs Ltd. India 100.00%Ranbaxy Fine Chemicals Ltd. India 100.00%Rexcel Pharmaceuticals Ltd. India 100.00%Solus Pharmaceuticals Ltd. India 100.00%Vidyut Investments Ltd. India 100.00%Vidyut Travel Services Ltd. India 100.00%Ranbaxy (Netherlands) B.V. The Netherlands 100.00%Ranbaxy N.A.N.V. The Netherlands 100.00%Ranbaxy (S.A.) (Proprietary) Ltd. South Africa 100.00%Ranbaxy Pharmaceuticals Inc. and subsidiaries United States of America 100.00%Ranbaxy Holdings (U.K.) Ltd. United Kingdom 100.00%Ranbaxy (U.K.) Ltd. United Kingdom 100.00%Ranbaxy Ireland Ltd. Ireland 100.00%Ranbaxy (Hong Kong) Ltd. Hong Kong 100.00%Ranbaxy Egypt (L.L.C.) Egypt 100.00%Ranbaxy Poland S.P. Z.o.o. Poland 100.00%Ranbaxy Pharmaceuticals BV The Netherlands 100.00%Ranbaxy Europe Ltd. United Kingdom 100.00%Basics GmbH Germany 100.00%Ranbaxy Do Brazil Ltda Brazil 100.00%Ranbaxy Panama, S.A. Panama 100.00%Ranbaxy Vietnam Company Ltd. Vietnam 100.00%Ranbaxy France SAS France 100.00%Rexcel Egypt (L.L.C.) Egypt 100.00%Ranbaxy-PRP (Peru) S.A.C. Peru 100.00%Unichem Distributors Ltd. Thailand 99.96%Bounty Holdings Co. Ltd. Thailand 99.30%
Consolidated Statements of Cash Flows & Notes to Consolidated Financial Statements � US GAAP

124
Unichem Pharmaceuticals Ltd. Thailand 98.50%Gufic Pharma Limited India 98.00%Ranbaxy Unichem Company Ltd.(Formerly Ranbaxy (Thailand) Co. Ltd.) Thailand 88.56%Ranbaxy Nigeria Ltd. Nigeria 84.89%Ranbaxy (Guangzhou China) Ltd. Republic of China 83.00%Ranbaxy Farmaceutica Ltda(Formerly Ranbaxy S.P. Medicamentos Ltda) Brazil 70.00%Ranbaxy Malaysia Sdn. Bhd. Malaysia 56.25%Thembalami Pharmaceuticals (Pty.) Ltd. South Africa 50.00%
3. Basis of presentation
The accompanying consolidated financial statements have been prepared under the historical cost convention on theaccrual basis of accounting in conformity with accounting principles generally accepted in the United States of America("US GAAP"), to reflect the financial position, results of operations and cash flows of the Group.
4. Use of estimates
In preparing the Group's financial statements in conformity with accounting principles generally accepted in the UnitedStates of America, the Group's management is required to make estimates and assumptions that affect the reportedamounts of assets and liabilities and the disclosure of contingent assets and liabilities at the date of the financial statementsand the reported amounts of revenues and expenses during the reporting period; actual results could differ from thoseestimates. The management's estimates for charge-backs, rebates, discounts and returns, future obligations under employeebenefit plans, the useful life of tangible and intangible assets and the realization of deferred tax assets represent particularlysensitive estimates.
5. Exchange rate translation
The functional currency of the Company, including its consolidated domestic and foreign subsidiaries, has been determinedin accordance with the primary economic environment in which the respective entities operate.
In respect of entities for which the functional currency is other than the Indian Rupee, the reporting currency of RLL, theassets and liabilities are translated into Indian Rupees at the appropriate year-end exchange rates. Income and expensesare translated using the monthly average exchange rates in effect during the year being reported. The resulting translationadjustments are reported as a component of accumulated other comprehensive income.
Transactions in foreign currency are translated into the functional currency of the respective Group Company at theaverage rates of exchange prevailing in the month of the transaction. Monetary assets and liabilities in foreign currencyare translated into the functional currency of the respective Group Company at the rate of exchange prevailing at thebalance sheet date. All foreign exchange gains and losses are recorded in other revenues in the accompanying consolidatedfinancial statements. The foreign currency exchange gain/ (loss) included in the consolidated statements of income forthe years ended December 31, 2003 and 2002 was Rs 1,382.17 million and Rs 74.68 million, respectively.
6. Cash and cash equivalents
Cash and cash equivalents include all highly liquid investments with an original maturity of three months or less.Restricted cash represents deposits that have been pledged with banks and will mature within one year.
7. Inventories
Inventories consist of raw materials, work-in-process, finished goods, and packaging materials, and are stated at thelower of cost or market value. Cost is determined using the weighted average and first-in-first-out methods for rawmaterials, packaging materials and stores and spares and includes the purchase price and attributable direct costs, lesstrade discount. Cost in the case of work-in-process and finished goods comprises of direct labor, material costs andproduction overheads.
Allowance for potentially obsolete or slow moving inventory is made on the basis of the management's analysis ofinventory levels, expiration dates and prevailing market conditions.
8. Property, plant and equipment
Property, plant and equipment including assets acquired under capital lease agreements are stated at historical cost lessaccumulated depreciation. Depreciation is calculated on the straight-line method over the estimated useful life of the
RANBAXY LABORATORIES LIMITED AND SUBSIDIARIES
NOTES TO CONSOLIDATED FINANCIAL STATEMENTSDecember 31, 2003 and 2002(All amounts in Rupees Million, unless otherwise stated)
Name of entity Country of Shareholdingincorporation
NOTE A (continued)

125
respective assets. Assets under capital leases and leasehold improvements are amortized over the lower of theirestimated useful lives or the term of the lease.
Advances paid for the acquisition of property, plant and equipment outstanding at the balance sheet date and the costof property, plant and equipment not put to use before such date are disclosed as 'Capital work-in-progress'. The interestcost incurred for funding an asset during its construction period is capitalized based on the actual investment in the assetand the average cost of funds; and was immaterial during the years ended December 31, 2003 and 2002. The capitalizedinterest is included in the cost of the relevant asset and is depreciated over the estimated useful life of the asset.
The Group has determined the estimated useful lives of assets for depreciation purposes as follows:
Leasehold land Over the life of the leaseBuildings 30-50 yearsPlant and machinery 5-15 yearsFurniture and fixtures 5-10 yearsOffice equipment 3-10 yearsVehicles 5 years
Expenditures for maintenance and repairs, including planned major maintenance activities, are expensed as incurred.When assets are retired or otherwise disposed of, the cost of the asset and related accumulated depreciation are eliminatedfrom the financial records. Any gain or loss on disposition is credited or charged to income.
9. Intangible Assets (see Note C)
Intangible assets consist of goodwill, acquired license agreements, brands, purchased trademarks, technical know-howand other intangibles identified on acquisition. Intangible assets are recorded at cost on the date of acquisition, withgoodwill representing the excess of purchase cost over the fair value of the net tangible and other intangible assetsacquired.
Pursuant to Statement of Financial Accounting Standards No. 142 "Goodwill and Other Intangible Assets", the Groupceased amortizing goodwill effective January 1, 2002 and instead goodwill is tested for impairment, atleast annually.Other intangibles are amortized over the expected benefit period or the legal life, whichever is lower.
10. Revenue Recognition
Product sales
Revenue from sales of active pharmaceutical ingredients and formulation products is recognized when significant risksand rewards in respect of ownership of products are transferred to the customer, generally on shipment of products, andwhen the following criteria are met:
� Persuasive evidence of an arrangement exists;
� The price to the buyer is fixed and determinable; and
� Collectibility of the sales price is reasonably assured.
Allowance for certain chargebacks, discounts and rebate programs made available to customers pursuant to industrystandards are estimated and recorded as a reduction from sale at the time of shipment. Allowances for sales returns areprovided for based on estimates and for most jurisdictions have not been material. Accounts are charged to bad debtexpense as they are deemed uncollectible based upon management's periodic review of the accounts.
Service income
License fees
Non-refundable upfront payments received are deferred and recognized in the consolidated statements of income on astraight-line basis over the estimated development period. Other milestone payments received are recognized inaccordance with the terms prescribed in the license agreement and where the Group has no future obligations orcontinuing involvement pursuant to such milestone payment.
The Group receives payments under various development, manufacturing, supply and distribution agreements. Underthe terms of these agreements, certain amounts may be received by the Group prior to the commercial launch of aproduct and fulfillment of the Group's obligations under such agreements. These amounts are recorded as deferredrevenue and are amortized to revenue from the date of commercial launch through the term of the related agreement.
Royalty
Royalty income is based on sales made by third parties and is recognized on an accrual basis, in accordance with theterms of the respective agreements.
RANBAXY LABORATORIES LIMITED AND SUBSIDIARIES
NOTES TO CONSOLIDATED FINANCIAL STATEMENTSDecember 31, 2003 and 2002(All amounts in Rupees Million, unless otherwise stated)
NOTE A (continued)
Notes to Consolidated Financial Statements � US GAAP

126
Other revenues
Other revenues include claim settlements, export incentives and net foreign exchange gains. Revenues under claimsettlement agreements are recognized in accordance with the terms of the respective settlement agreements in theperiod in which the claim is received. Import incentives and foreign currency gains are recognized on an accrual basis,in accordance with the applicable terms.
11. Investment securities
Investment securities consist of available for sale equity securities and non- marketable equity securities and are accountedfor by the cost method.
Available for sale securities are carried at fair value based on quoted market prices. Unrealized holding gains and losses,net of the related tax effect, on available for sale securities are excluded from earnings and are reported as a separatecomponent of stockholders' equity until realized. Decline in the fair value of any available for sale security below costthat is determined to be other than temporary is charged to the statement of income. Realized gains and losses from thesale of available for sale securities are determined on average cost method and are included in earnings.
Non-marketable equity securities are accounted for by the cost method and are stated at cost, less provision for anydecline other than temporary decline in value.
Interest and dividend income is recognized when earned.
12. Shipping and handling costs
Shipping and handling costs incurred to transport products to customers are included in selling, general and administrativeexpenses. Expenses relating to inward receipt of materials are classified under cost of revenues.
13. Advertising costs
Costs associated with advertising are expensed as incurred; and amounted to Rs 2,240.17 million and Rs 1,633.91million for the years ended December 31, 2003 and 2002 respectively.
14. Start-up costs
Costs of start-up activities including organization costs are expensed as incurred.
15. Income taxes
The Group Companies account for deferred income taxes under the full liability method, in accordance with theprovisions of Statement of Financial Accounting Standards No. 109 "Accounting for Income Taxes". Deferred incometax assets and liabilities are recognized for the future tax consequences attributable to differences between carryingamounts of existing assets and liabilities in the financial statements and their respective tax basis. Deferred income taxassets and liabilities are measured using enacted tax rates as on the date of the financial statements. The effect ondeferred income tax assets and liabilities of a change in tax rates is recognized in the statement of income in the periodof change. Based on management's judgment, the measurement of deferred income tax assets is reduced, if necessary,by a valuation allowance for any tax benefits for which it is more likely than not that some portion or all of such benefitswill not be realized.
16. Research and development costs
Research and development expenditures are expensed as incurred; and amounted to Rs 2,422.33 million andRs 1,686.29 million for the years ended December 31, 2003 and 2002 respectively. Capital expenditure incurred onequipment and facilities acquired or constructed for research and development activities and having alternative futureuses, is capitalized as property, plant and equipment when acquired or constructed.
17. Valuation of long-lived assets
The Group follows the guidance of Statement of Financial Accounting Standards No. 144, "Accounting for the Impairmentor Disposal of Long-lived Assets." The Group Companies review long-lived assets and certain identifiable intangiblesheld and used for possible impairment whenever events or changes in circumstances indicate that the carrying amountof an asset may not be recoverable. If such assets are considered to be impaired, the impairment is measured by theamount by which the carrying value of the assets exceeds the fair value of the assets. Assets to be disposed are reportedat the lower of the carrying value, or the fair value less the cost to sell.
18. Operating leases - lessee accounting
Lease rental expenses on operating leases are charged to expense over the lease term as they become payable. Certainoperating lease agreements provide for scheduled rent increases over the lease term. Rental expense for these leases isrecognized on a straight-line basis over the lease term.
RANBAXY LABORATORIES LIMITED AND SUBSIDIARIES
NOTES TO CONSOLIDATED FINANCIAL STATEMENTSDecember 31, 2003 and 2002(All amounts in Rupees Million, unless otherwise stated)
NOTE A (continued)

127
19. Other comprehensive income
Statement of Financial Accounting Standards No. 130, "Reporting Comprehensive Income", establishes rules for thereporting of comprehensive income and its components. Comprehensive income is defined as all changes in equityfrom non-owner sources. For the Group, comprehensive income consists of net earnings, changes in the cumulativeforeign currency translation adjustments and unrealized holding gains and losses on available for sale securities. TheCompany reports comprehensive income in the consolidated statements of stockholders' equity.
20. Earnings per share
In accordance with Statement of Financial Accounting Standards No. 128, "Earnings per share", basic earnings per shareis computed using the weighted average number of common shares outstanding during the period. Diluted earnings pershare is computed using the weighted average number of common and dilutive common equivalent shares outstandingduring the period.
21. Stock-based compensation
The Company uses the intrinsic value based method as prescribed by Accounting Principles Board Opinion No. 25,"Accounting for Stock Issued to Employees", to account for its employee stock based compensation plan. The Companyhas therefore adopted pro forma disclosure provisions of Statement of Financial Accounting Standards No. 123,"Accounting for Stock-based Compensation" ("SFAS No. 123"), as amended by Statement of Financial AccountingStandards No. 148, "Accounting for Stock-based Compensation Transition and Disclosure, an amendment of SFAS No.123" ("SFAS No. 148"). Accordingly, compensation expense is recognized over the vesting period of the options basedon the difference, if any, between the market value of the stock of the Company on the date of grant of the stock optionand the amount to be paid by the employee for exercising the option. As permitted by SFAS No. 123, the Company haselected to continue to employ the intrinsic value based method of accounting and has followed the disclosure requirementsof SFAS No. 148.
22. Derivative financial instruments
The Company enters into forward foreign exchange contracts where the counterparty is generally a bank. The Companypurchases forward foreign exchange contracts to mitigate the risk of changes in foreign exchange rates on accountsreceivable. These contracts do not qualify for hedge accounting under Statement of Financial Accounting Standards No.133, "Accounting for Derivative Instruments and Hedging Activities" ("SFAS No. 133"), as amended. Any derivative thatis either not designated as a hedge, or is so designated but is ineffective per SFAS No. 133, is marked to market andrecognized in income immediately.
As at December 31, 2003 and 2002 the Company recognized a mark-to-market gain on non-effective hedges of Rs 678million and Rs 142 million respectively, which has been included in "other revenues" in the statement of income and"other current assets" in the balance sheet.
23. Dividend
Dividends on common stock are recorded as a reduction of equity when approved by the stockholders.
23. Reclassification
Certain prior period amounts have been reclassified to conform to the current period presentation.
24. Recent Accounting Pronouncements
In April 2003, the Financial Accounting Standards Board (the "FASB") issued Statement of Financial Accounting StandardsNo. 149, "Amendment of Statement 133 on Derivative Instruments and Hedging Activities" ("SFASNo. 149"), applicable for fiscal period beginning after December 15, 2003. This Statement amends and clarifies financialaccounting and reporting for derivative instruments, including certain derivative instruments embedded in other contracts(collectively referred to as derivatives) and for hedging activities under SFAS No. 133, "Accounting for DerivativeInstruments and Hedging Activities" ("SFAS No. 133"). This Statement amends SFAS No. 133 for decisions made (1) aspart of the Derivatives Implementation Group process that effectively required amendments to SFASNo. 133, (2) in connection with other Board projects dealing with financial instruments, and (3) in connection withimplementation issues raised in relation to the application of the definition of a derivative, in particular, the meaning ofan initial net investment that is smaller than would be required for other types of contracts that would be expected tohave a similar response to changes in market factors, the meaning of underlying and the characteristics of a derivativethat contains financing components. The management is currently evaluating the effect, if any, that implementation ofthis statement may have on the financial statements of the Group.
Notes to Consolidated Financial Statements � US GAAP
RANBAXY LABORATORIES LIMITED AND SUBSIDIARIES
NOTES TO CONSOLIDATED FINANCIAL STATEMENTSDecember 31, 2003 and 2002(All amounts in Rupees Million, unless otherwise stated)
NOTE A (continued)

128
In May 2003, the FASB issued Statement of Financial Accounting Standards No. 150, "Accounting for Certain FinancialInstruments with Characteristics of both Liabilities and Equity", applicable for fiscal period beginning after December15, 2003. This Statement establishes standards for how an issuer classifies and measures certain financial instrumentswith characteristics of both liabilities and equity. It requires that an issuer classify a financial instrument that is within itsscope, which may have previously been reported as equity, as a liability (or an asset in some circumstances). Thisstatement is effective for financial instruments entered into or modified after May 31, 2003, and otherwise is effective atthe beginning of the first interim period beginning after June 15, 2003. The Group adopted the provisions of thisstatement, which do not have an impact on the consolidated financial position or results of operations.
In January 2003, FASB issued FASB Interpretation No. 46, "Consolidation of Variable Interest Entities". FIN 46 clarifiesthe application of Accounting Research Bulletin 51, "Consolidated Financial Statements", for certain entities that do nothave sufficient equity at risk for the entity to finance its activities without additional subordinated financial support fromother parties or in which equity investors do not have the characteristics of a controlling financial interest ("variableinterest entities"). Variable interest entities within the scope of FIN 46 will be required to be consolidated by theirprimary beneficiary. The primary beneficiary of a variable interest entity is determined to be the party that absorbs amajority of the entity's expected losses, receives a majority of its expected returns, or both. FIN 46 applies to variableinterest entities created after January 31, 2003, and to variable interest entities in which an enterprise obtains an interestafter that date. It applies in the first fiscal year or interim period beginning after June 15, 2003, to variable interestentities in which an enterprise holds a variable interest that it acquired before February 1, 2003. Management hasevaluated its contractual arrangements with certain entities which might fall within the purview of the above guidanceand does not believe that any of these entities qualify as VIEs as defined by FIN 46.
In November 2002, the Emerging Issues Task Force ("EITF") reached a consensus opinion on EITF No. 00-21, "RevenueArrangements with Multiple Deliverables", which requires that revenue arrangements with multiple deliverables beaccounted for based on a determination of whether the multiple deliverables qualify to be accounted for as separateunits of accounting. The EITF consensus is effective prospectively for revenue arrangements entered into in fiscal periodsbeginning after June 15, 2003. The Group adopted the provisions of this statement, which do not have a material impacton the consolidated financial position or results of operations.
NOTE B - BUSINESS COMBINATIONSIn June 2001, the FASB issued Statement of Financial Accounting Standards No. 141, "Business Combinations" ("SFASNo. 141"), which requires that the purchase method of accounting be used for all business combinations consummatedafter June 30, 2001. SFAS No. 141 also specifies the criteria that intangible assets acquired in a purchase methodbusiness combination must meet to be recognized and reported apart from goodwill, noting that any purchase priceallocated to an assembled workforce may not be accounted separately.
Acquisition of shares in Ranbaxy Malaysia Sdn. Bhd, Malaysia.
On September 3, 2002, Ranbaxy Netherlands B.V. ("RNBV") acquired 28.25 percent equity stake in Ranbaxy MalaysiaSdn. Bhd. ("RMSB"), a company incorporated in Malaysia and engaged in manufacturing and marketing products fororal use comprising liquid formulations, tablets, capsules and granules for suspension. The management has consideredthe net asset value of RSMB as its fair value on the date of acquisition. This acquisition was accounted for by thepurchase method and the resultant negative goodwill amounting to Rs 6.82 million, being the excess of the proportionatefair value of Rs 18.51 million over the corresponding purchase price of Rs 11.69 million, was allocated as a pro-ratareduction to the cost basis of buildings on consolidation.
Acquisition of minority interest in Ranbaxy Farmaceutica Ltda., Brazil
During 2003, RNBV acquired an additional 15 percent stake in Ranbaxy Farmaceutica Ltda. (formerly Ranbaxy S.P.Medicamentos Ltda.) ("RFL"), a company incorporated in Brazil, from the stockholders of record on that date, resultingin a total holding of 70 percent in RFL. The management has considered the net asset value of RFL as its fair value on thedate of acquisition. This acquisition was accounted for as a purchase and goodwill amounting to Rs 77.58 million wasrecorded upon acquisition, as the excess of the purchase price of Rs 92.70 million over the aggregate of the proportionatefair value of the net assets acquired.
NOTE C - GOODWILL AND INTANGIBLE ASSETSOn January 1, 2002, the Group adopted Statement of Financial Accounting Standards No. 142, "Goodwill and OtherIntangible Assets" ("SFAS No. 142"). Adoption of SFAS No. 142 did not result in reclassification of existing goodwill andintangible assets. As required by SFAS No. 142, the Group companies identified their reporting units and assigned assetsand liabilities, including goodwill to the reporting units on the date of adoption. Subsequently, the Group companies
RANBAXY LABORATORIES LIMITED AND SUBSIDIARIES
NOTES TO CONSOLIDATED FINANCIAL STATEMENTSDecember 31, 2003 and 2002(All amounts in Rupees Million, unless otherwise stated)
NOTE A (continued)

129
compared the fair value of the reporting unit to its carrying value including goodwill, to determine whether goodwill isimpaired at the date of adoption. This transitional impairment evaluation did not indicate an impairment loss. Subsequentto the adoption of SFAS No. 142, the Group does not amortize goodwill but instead tests goodwill for impairment atleast annually. The carrying value of the goodwill and net other intangible assets on the date of adoption was Rs 785.60million and Rs 1,351.65 million respectively.
Acquired and amortized intangible assets comprise:
Expected benefit period (in years) 2003 2002
Trademarks, brands and licenses 5 - 10 1,755.10 1,777.00Non-compete 10 271.40 271.40Technical know-how 5 96.92 80.30Goodwill � 1,258.02 1,156.68
3,381.44 3,285.38
Less: Accumulated amortization (1,096.31) (795.40)
2,285.13 2,489.98
The aggregate amortization expense for the years ended December 31, 2003 and 2002 was Rs 313.74 million andRs 126.78 million respectively. The amortization expense for the year ended December 31, 2003 included an impairmentloss of Rs 55 million in respect of goodwill relating to a subsidiary in China.
During the year 2003 the Company revised the estimated useful life for certain intangible assets, which management believesbetter reflects the expected benefit period of the underlying intangible assets. Accordingly, had the Company continued tofollow the earlier rates for providing amortization, the net profit for the year would be higher by Rs 132.01 million.
Amortization expense for intangibles subject to amortization is expected to approximate Rs 269.15 million in 2004,Rs 164.43 million in 2005, Rs 162.68 million in 2006, Rs 161.00 million in 2007 and Rs 159.94 million in 2008.
NOTE D - CASH AND CASH EQUIVALENTSAs of December 31, 2003 and 2002, cash and cash equivalents consisted of the following:
2003 2002
Cash and cheques in hand 84.79 74.27
Remittances in transit 75.95 324.07
Balances with banks and financial institutions
Time deposits 6,111.68 0.46
Foreign currency bank balances 27.19 18.19
Other balances 380.73 1,034.67
6,680.34 1,451.66
NOTE E - ACCOUNTS RECEIVABLEThe accounts receivable as of December 31, 2003 and 2002 are stated net of allowance for doubtful accounts, salesreturns and chargebacks. The Group Companies maintain an allowance for doubtful accounts on all accounts receivable,based on present and prospective financial condition of the customer and ageing of the accounts receivable afterconsidering historical experience and the current economic environment. Accounts receivable are generally not secured.
The activity in the allowance for doubtful accounts receivable is given below:
2003 2002
Balance at the beginning of the year 873.97 589.70
Allowance for doubtful debts for the year 18.48 572.19
Accounts receivable written off during the year (485.75) (287.92)
Balance of at the end of the year 406.70 873.97
Notes to Consolidated Financial Statements � US GAAP
RANBAXY LABORATORIES LIMITED AND SUBSIDIARIES
NOTES TO CONSOLIDATED FINANCIAL STATEMENTSDecember 31, 2003 and 2002(All amounts in Rupees Million, unless otherwise stated)
NOTE C (continued)

130
NOTE F - INVENTORIESAs of December 31, 2003 and 2002, inventories consisted of the following:
2003 2002
Finished goods 3,203.08 4,792.55Work in process 280.69 924.43Raw materials 5,533.95 2,796.40Packing materials 555.73 507.43
9,573.45 9,020.81
NOTE G - PROPERTY, PLANT AND EQUIPMENTProperty, plant and equipment comprise of the following :
2003 2002
Freehold land 192.13 217.31Leasehold land 181.78 179.90Buildings 2,139.83 1,811.79Plant and machinery 7,894.08 7,120.31Furniture and fixtures 356.75 304.05Office equipment 1,647.95 1,218.01Vehicles 260.80 219.22Capital work-in-progress 1,007.04 189.84
13,680.36 11,260.43
Less : Accumulated depreciation (6,969.88) (6,142.77)
6,710.48 5,117.66
Capital lease assets comprise of the following :
2003 2002
Plant and machinery 0.89 0.94Office equipment 8.99 9.37Vehicles 17.32 14.84
27.20 25.15
Less : Accumulated depreciation (12.81) (6.62)
14.39 18.53
Depreciation expense for assets acquired under capital lease for the year ended December 31, 2003 and 2002 wasRs 6.99 million and Rs 4.35 million, respectively.
NOTE H - INVESTMENT SECURITIES
As of December 31, 2003 As of December 31, 2002
Gross Gross Gross GrossUnrealized Unrealized Unrealized Unrealized
Carrying Holding Holding Carrying Holding Holdingvalue Gains Losses Fair Value value Gains Losses Fair Value
Equity securities 14.52 � (13.45) 1.07 216.68 � (113.31) 103.37Non-marketable 162.06 � (0.50) 161.56 163.40 � (0.50) 162.90equity securitiesReadily marketable 4.12 � � 4.12 5.90 � (1.82) 4.08debt securities
180.70 � (13.95) 166.75 385.98 � (115.63) 270.35
RANBAXY LABORATORIES LIMITED AND SUBSIDIARIES
NOTES TO CONSOLIDATED FINANCIAL STATEMENTSDecember 31, 2003 and 2002(All amounts in Rupees Million, unless otherwise stated)

131
Dividends from securities available for sale, during the years ended December 31, 2003 and 2002 were Rs 20.02million and Rs 1.34 million respectively and are included in other income. Proceeds from sale of securities available forsale were Rs 296.48 million and Rs 154.44 million during the years ended December 31, 2003 and 2002 respectively.
NOTE I - OTHER ASSETSOther assets comprise of the following :
2003 2002
Prepaid expenses 313.97 224.68Loans and advances, net 1,197.97 247.76Trade advances 98.53 182.00Balances with statutory authorities 1,208.08 1,392.26Deposits 1,015.65 566.75Others, net 650.00 59.84
4,484.20 2,673.29Less : Current assets (4,149.97) (2,143.15)
334.23 530.14
NOTE J - BORROWINGS FROM BANKS AND FINANCIAL INSTITUTIONSThe Group Companies have availed working capital and short term loans from banks and financial institutions, expiringat various dates through December 31, 2004, providing an aggregate borrowing capability of Rs 9,310.44 million,primarily to finance their working capital requirements. The interest rates for these facilities are primarily based on theLondon Inter-bank Offer Rate ("LIBOR") or the Euro Inter-bank Offer Rate ("EURIBOR") with local currency borrowingsbeing based on country-specific benchmark rates. Accordingly, interest rates ranged from 3 percent to 23 percent, withthe majority averaging approximately 3 percent. Details of the borrowings from banks are given below :
2003 2002
Overdraft facilities 1,039.72 763.75Short term loans 1,854.81 1,637.92
2,894.53 2,401.67
Majority of these facilities are secured by some of the underlying assets of the borrowing subsidiary and contain financialcovenants and restrictions on indebtedness. These borrowings are further supported by the following :
2003 2002
Corporate guarantee issued by RLL 106.83 197.75Corporate guarantee issued by RNBV and Letter of comfort from RLL 431.77 654.73Letter of comfort/ Letter of awareness from RLL 1,774.22 1,198.10Charge over assets of the subsidiary and Letter of comfort from RLL 581.71 351.09
2,894.53 2,401.67
NOTE K - LONG TERM DEBTLong-term debt comprise of the following :
2003 2002
Term loan from banks and financial institutions 1,890.93 1,132.94Unsecured loans 991.79 390.47Others 61.61 27.18Capital lease obligations 11.31 15.23
2,955.64 1,565.82Less : Current portion of long term debt (2,025.53) (974.96)
930.11 590.86
Notes to Consolidated Financial Statements � US GAAP
RANBAXY LABORATORIES LIMITED AND SUBSIDIARIES
NOTES TO CONSOLIDATED FINANCIAL STATEMENTSDecember 31, 2003 and 2002(All amounts in Rupees Million, unless otherwise stated)
NOTE H (continued)

132
Long-term debts other than unsecured loans are secured by a charge over the property, plant and equipment andcurrent assets of the borrowing Group Company and contain financial covenants and restrictions on indebtedness.
An interest rate profile of long-term debt is given below :
2003 2002
Term loan from banks and financial institutions 2.12 - 3.12 percent 3.07 percent
Unsecured loans 2.07 - 9.00 percent 3.56 - 9.00 percent
Others 6.00 - 8.50 percent 4.00 - 7.00 percent
The maturity profile of long-term debt outstanding, other than capital lease obligations (refer note T), is given below :
Year ending December 31,
2004 2,019.912005 712.922006 178.982007 11.322008 21.20
2,944.33
NOTE L - STOCKHOLDERS' EQUITY
a) Common Stock
The Company presently has only one class of common stock. For all matters submitted to vote in the shareholdersmeeting, every holder of common stock, as reflected in the records of the Company on the date of the stockholders'meeting have one vote in respect of each share held.
On October 11, 2002 the Company issued Bonus shares in the ratio of "three for five" to stockholders of record onOctober 4, 2002. All references in the consolidated financial statements to number of shares and per share amounts ofthe Company's equity shares have been retroactively restated to reflect the increased number of equity shares outstandingas a result of the bonus issue.
b) Dividends
Indian statutes mandate that the dividends shall be declared out of the distributable profits only after the transfer of upto 10% of net income computed in accordance with regulations to a general reserve. Should the Company declare andpay dividends, such dividends are required to be paid in Indian rupees to each holder of equity shares in proportion tothe number of shares held by him to the total equity shares outstanding as on that date. During the years endedDecember 31, 2003 and 2002, the Company distributed dividends of Rs 2,782.48 million and Rs 1,738.43 million, atthe rate of 150 percent of common stock in both years.
During the year Ranbaxy Malaysia Sdn. Bhd. and Ranbaxy Nigeria Limited distributed dividends to stockholders, otherthan RNBV and RLL, of Rs 5.11 million (Rs 3.09 million during 2002) at the rate of 12 percent of common stock andRs 0.53 million (Rs 1.14 million during 2002) at the rate of 33 percent of common stock, respectively.
NOTE M - EMPLOYEE STOCK INCENTIVE PLANRLL has an Employees Stock Option Scheme (the "Scheme"), which provides for grant of stock options in RLL to eligiblemanagement employees of RLL and its subsidiaries.
The Scheme is administered by the Management Committee of the Board ("the Committee"). The criteria for grantingoptions are essentially on the basis of performance and the managerial grade of the employee. Some options can bedistributed, at the discretion of the Committee, to select employees on the basis of significance of contribution duringthe year, potential of the employee and criticality of the position held. The Scheme does not presently permit grant ofoptions to any employee to exceed 25,000 in a year. The Scheme further provides that the exercise price of options isto be determined at the average of the daily closing prices of equity shares of RLL at the National Stock Exchange ofIndia, during a period of twenty-six weeks preceding the date of grant of options. The options are to vest in a gradedmanner over a period of 5 years from the date of grant with 20 percent of the options vesting at the end of each year.Options not exercised upon the expiry of 10 years from the date of the grant lapse.
As the number of shares that an individual employee is entitled to receive and the price of the option is known at the
RANBAXY LABORATORIES LIMITED AND SUBSIDIARIES
NOTES TO CONSOLIDATED FINANCIAL STATEMENTSDecember 31, 2003 and 2002(All amounts in Rupees Million, unless otherwise stated)
NOTE K (continued)

133
grant date, the Scheme is considered as a fixed grant. The compensation cost recorded for the years ended December31, 2003 and 2002 was Rs 37.42 million and Rs 19.24 million respectively. Stock option activity under the Scheme isas follows :
Year ended December 31, 2003
Weighted-Weighted- average
Stock options Range of average remaining(numbers) exercise prices exercise price contractual life
(Rs) (Rs) (years)
Outstanding, beginning of the year 938,813 595 - 745 682.05 8.89Granted during the year 932,950 567 - 701 567.29 9.10Forfeited during the year (68,138) 567 - 745 628.69 �Exercised during the year (57,446) 567 - 745 682.55 �Lapsed during the year (2,353) 595 - 745 708.11 �
Outstanding, end of the year 1,743,826 567 - 745 622.77 8.47Exercisable at the end of the year 279,569 567 - 745 622.77 �
Year ended December 31, 2002
Weighted-Weighted- average
Stock options Range of average remaining(numbers) exercise prices exercise price contractual life
(Rs) (Rs) (years)
Outstanding, beginning of the year 540,285 595 - 745 625.80 9.58Granted during the year 470,450 745 745.00 9.26Forfeited during the year (59,447) 595 - 673 672.18 �Exercised during the year (12,084) 595 - 673 638.09 �Lapsed during the year (391) 595 595 �
Outstanding, end of the year 938,813 595 - 745 682.05 8.89Exercisable at the end of the year 109,208 595 - 745 682.05 �
Pursuant to the issue of bonus shares on October 11, 2002, the employees to whom options were granted until October4, 2002 are entitled for additional shares on exercise of options in the ratio of "three for five".
The Company uses the intrinsic value based method of APB No. 25 to account for its employee stock based compensationplan. The Company has therefore adopted the pro forma disclosure provisions of SFAS No. 123 as amended by SFASNo. 148.
Had compensation cost been determined in a manner consistent with the fair value approach described in SFASNo. 123, the Company's net income and earnings per share as reported would have been reduced to the pro formaamounts indicated below :
2003 2002
Net income
As reported 7,881.39 6,725.73Less : Stock-based employee compensation expense determined
under fair value based method, net of tax effects 77.70 47.25
Adjusted pro forma 7,803.69 6,678.48
Earnings per share : BasicAs reported 42.49 36.27Adjusted pro forma 42.07 36.01
Earnings per share : DilutedAs reported 42.25 36.24Adjusted pro forma 41.84 35.99
Notes to Consolidated Financial Statements � US GAAP
RANBAXY LABORATORIES LIMITED AND SUBSIDIARIES
NOTES TO CONSOLIDATED FINANCIAL STATEMENTSDecember 31, 2003 and 2002(All amounts in Rupees Million, unless otherwise stated)
NOTE M (continued)

134
The fair value of each option is estimated on the date of grant using the Black-Scholes model with the following assumptions :
2003 2002
Dividend yield 2.68 percent 2.30 percentExpected life 10 years 10 yearsRisk free interest rate 5 percent 6 percentVolatility 33.83 percent 38 percent
The Black-Scholes option-pricing model was developed for estimating fair value of traded options that have no vestingrestrictions and are fully transferable. Since options pricing models require use of subjective assumptions, changestherein can materially affect fair value of the options. The options pricing models do not necessarily provide a reliablemeasure of fair value of the options.
NOTE N- RELATED PARTY TRANSACTIONSThe Group has entered into transactions with the following related parties :a) The relationship with Vorin Laboratories Ltd. ("Vorin"), a step down subsidiary, ceased to be that of parent and subsidiary
on December 6, 2002 and consequently Vorin became an associate, with the Company holding 49 percent equitystake. Subsequently, on approval of a scheme of amalgamation of Vorin with Matrix Laboratories Ltd. ("Matrix") withretroactive effect from the appointed date i.e. April 1, 2002, by the appropriate High Courts, the shareholding of theGroup in Matrix post merger declined below 20 percent. During 2003, the Group has disposed off its shareholding inVorin and therefore the financial statements of Vorin have not been consolidated. Transactions with Vorin until the dateof disposal of shares have been disclosed below.
b) Transactions with equity partners of the Group Companies, which include H.B. Farma Laboratorios (a companyincorporated in Brazil and holds a 2 percent equity stake in Ranbaxy Farmaceutica Ltda.), for the purchase of activepharmaceutical ingredients, formulations and services.The following is a summary of material related party transactions during the year :
Purchases from 2003 2002
Equity partners of Group Companies � 2.92Associate 115.73 348.22
Sales to
Associate � 64.33
Services rendered/ other receipts
Associate � 0.90
Interest received fromAssociate � 5.26
Other income from
Equity partners of Group � 0.53Associate 2.82 0.69
Other expenses paid to
Equity partners of Group � 0.38Associate 0.04 �
Related party balances at year-end comprise of the following :
Amounts due from 2003 2002
Equity partners of Group Companies 1.66 2.71Associate � 4.41
1.66 7.12
Amounts due to
Equity partners of Group Companies � 10.31Associate 0.86 97.31
0.86 107.62
RANBAXY LABORATORIES LIMITED AND SUBSIDIARIES
NOTES TO CONSOLIDATED FINANCIAL STATEMENTSDecember 31, 2003 and 2002(All amounts in Rupees Million, unless otherwise stated)
NOTE M (continued)

135
NOTE O - INCOME TAXESThe provision for income taxes comprises of the following :
2003 2002
Income before income taxesDomestic 8,245.05 6,365.26Foreign 2,375.47 2,175.38
10,620.52 8,540.64
Current income tax expenseDomestic taxes 1,380.93 774.12Foreign taxes 1,063.19 983.86
Deferred income tax expense / (benefit)Domestic taxes 443.28 115.14Foreign taxes (158.11) (66.24)
Total 2,729.29 1,806.88
The tax effect of significant temporary differences that resulted in deferred income tax assets and liabilities and adescription of the items that create those differences are given below :
Deferred income tax assets- Current 2003 2002
Accounts receivable, net of allowances 217.54 287.02Provisions for inventory obsolescence and other write-downs 43.50 13.28Deferred revenue expenditure charged off completely 2.35 1.40Capital lease obligations 0.56 0.74Other current assets � 104.63Current liabilities 96.94 66.80
360.89 473.87
Deferred income tax assets- Non current
Intangibles 52.17 65.67Capital lease obligations 0.80 1.80Net operating loss 162.48 73.09Other non current assets 1.00 0.01Investments 2.82 23.79
Valuation allowance (74.04) �
145.23 164.36
Deferred income tax liabilities - Non current
Intangible assets � (69.33)Property, plant and equipment (644.68) (406.96)
(644.68) (476.29)
Net deferred income tax (liability)/asset (138.56) 161.94
The enacted tax rate in India is 35.875 percent but the effective tax rate for the Group is 25.70 percent. The reductionin the effective tax rate is mainly on account of export earnings being exempt from tax in India, earnings derived fromunits set up in backward areas within India for which the Company is eligible for tax concessions under the local lawsand the incremental deductions available under Indian tax laws for research and development activities.In assessing the realizability of deferred income tax assets, management considers whether it is more likely than not thatsome portion or all of the deferred income tax assets will be realized. The ultimate realization of deferred income taxassets is dependent upon the generation of future taxable income during the periods in which the temporary differencesbecome deductible. The amount of the deferred income tax assets considered realizable, however, could be reduced inthe near term if estimates of future taxable income during the carry forward period are reduced.A valuation allowance has been established against the deferred income tax asset on account of the tax effect of theoperating losses carry forward of Ranbaxy Ireland Limited and Ranbaxy (Guangzhou China) Limited.
Notes to Consolidated Financial Statements � US GAAP
RANBAXY LABORATORIES LIMITED AND SUBSIDIARIES
NOTES TO CONSOLIDATED FINANCIAL STATEMENTSDecember 31, 2003 and 2002(All amounts in Rupees Million, unless otherwise stated)

136
Net operating losses of Rs 733.54 million and Rs 251.05 million for December 31, 2003 and 2002 are eligible to becarried forward beyond five years. The applicable local tax laws allow the net operating losses to be carried forward aslong as the respective entity continues its business.
Deferred income taxes on undistributed earnings of the Group's overseas operations have not been recognized as suchearnings are considered to be indefinitely reinvested. The aggregate undistributed earnings considered to be indefinitelyreinvested are approximately Rs 2,723.88 million and Rs 1,327.38 million as of December 31, 2003 and 2002 respectively.
NOTE P - EMPLOYEE BENEFIT PLAN
a) Gratuity
In accordance with applicable Indian laws, the Company and its Indian subsidiaries provide for gratuity, a definedbenefit retirement plan ("the Gratuity Plan") covering eligible employees. The Gratuity Plan provides for a lump sumpayment to vested employees on retirement, death, incapacitation or termination of employment of amounts that arebased on salary and tenure of employment. Liabilities with regard to the Gratuity Plan are determined by actuarialvaluation and contributed to the Gratuity Fund Trust ("the Trust"). Trustees administer contributions made to the Trustand invest in specific designated securities as mandated by law, which generally comprise central and state governmentbonds and debt instruments of government-owned corporations.
The following table sets out the funded status of the Gratuity Plan and the amounts recognized in the Group's consolidatedfinancial statements :
2003 2002
Change in the benefit obligationsProjected Benefit Obligations ("PBO") at the beginning of the year 140.14 114.10Service cost 16.86 12.26Interest cost 11.21 10.27Actuarial (gain)/loss 39.16 16.25Benefits paid (19.59) (12.74)
PBO at the end of the year 187.78 140.14
Change in plan assetsFair value of plan assets at the beginning of the year 159.02 144.05
Actual return on plan assets 17.50 15.47Employer contributions 44.96 12.24Benefits paid (19.59) (12.74)
Plan assets at the end of the year 201.89 159.02
Net gratuity cost for the years ended December 31, 2003 and 2002 included the following components :
2003 2002
Service cost 16.86 12.26Interest cost 11.21 10.27Expected return on assets (17.50) (15.47)Actuarial loss 39.16 16.24
Net gratuity cost 49.73 23.30
The actuarial assumptions used in accounting for the Gratuity Plan were as follows :
2003 2002
Discount rate 8% 9%Rate of increase in compensation levelsManagement employees 5% 5%Other employees 4.5% 5%Rate of return on plan assets 8% 10%
NOTE O (continued)
RANBAXY LABORATORIES LIMITED AND SUBSIDIARIES
NOTES TO CONSOLIDATED FINANCIAL STATEMENTSDecember 31, 2003 and 2002(All amounts in Rupees Million, unless otherwise stated)

137
In respect of certain other employees of the Company, the gratuity benefit is provided through annual contributions toa fund managed by The Life Insurance Corporation of India ("LIC"). Under this scheme, the settlement obligationremains with the Company, although LIC administers the fund and determines the annual contribution premium requiredto be paid by the Company. In respect of the Indian subsidiaries, gratuity benefit is provided on the basis of actuarialvaluation, performed by an independent actuary at the balance sheet date. Expenses incurred in respect of these employeesapproximated Rs 2.95 million and Rs 1.79 million for the years ended December 31, 2003 and 2002 respectively.
b) Superannuation benefit
Apart from being covered under the Gratuity Plan described earlier, certain employees of the Company and its Indiansubsidiaries participate in a superannuation benefit; a defined contribution plan administered by the LIC. The Companyand its Indian subsidiaries make annual contributions based on a specified percentage of salary of each covered employee.The Company and its Indian subsidiaries do not have any further obligation to the superannuation plan beyond makingsuch contributions. Upon retirement or separation after completion of service of 5 years, an employee becomes entitledfor pension, as determined by the LIC, which is paid directly to the concerned employee. The Company and its Indiansubsidiaries contributed approximately Rs 41.08 million and Rs 30.44 million to the superannuation plan during theyears ended December 31, 2003 and 2002 respectively.
c) Pension plans
RPI participates in a savings plan under Section 401(k) of the Internal Revenue Code ("Code") covering substantially alleligible employees. The plan allows for employees to defer up to 15% of their annual earnings (within limitations, asadjusted by Section 415(b)(1)(A) of the Code) on a pre-tax basis through voluntary contributions to the plan.
The plan provides that RPI can make optional contributions in an amount up to the maximum allowable by Section 404of the Code. Employees are 25% vested with regard to the employer's contribution following one year of service andfully vested after three years of service. For the years ended December 31, 2003 and 2002, the contributions to the planwere Rs 15.64 million and Rs 13.36 million, respectively.
RPI failed to remit salary deferral contributions and loan repayments to MetLife during the period commencing February2000 through 2002 in a timely manner. RPI, acting on behalf of the Plan's trustees, has corrected this breach and is nowseeking a Department of Labor ("DOL") no action letter in accordance with the terms of the DOL's Voluntary FiduciaryCompliance ("VFC") Program. Management does not expect there to be any significant costs associated with this procedure.
RLL and one of its Indian subsidiaries also have a retirement pension scheme, which is linked to superannuation benefitsdescribed above. This pension scheme is applicable for all management employees who retire after completion of serviceof 10 years or are separated after completion of service of 20 years, based on salary and tenure of employment. Suchpension amount is reduced by the amount payable by LIC under the superannuation plan and is payable as additionalpension. The liability for such additional pension is determined and provided on the basis of actuarial valuation.
The following table sets out the status of the pension plan and the amounts recognized in the Group's consolidatedfinancial statements :
2003 2002
Change in the benefit obligationsProjected Benefit Obligations ("PBO") at the beginning of the year 245.05 164.21Service cost 22.52 11.16Interest cost 19.86 10.36Actuarial (gain)/loss 141.15 66.32Benefits paid (8.56) (7.00)
PBO at the end of the year 420.02 245.05
Net pension cost for the years ended December 31, 2003 and 2002 included the following components :
2003 2002
Service cost 22.52 11.16Interest cost 19.86 10.36Actuarial loss 137.90 57.46
Net pension cost 180.28 78.98
RANBAXY LABORATORIES LIMITED AND SUBSIDIARIES
NOTES TO CONSOLIDATED FINANCIAL STATEMENTSDecember 31, 2003 and 2002(All amounts in Rupees Million, unless otherwise stated)
NOTE P (continued)
Notes to Consolidated Financial Statements � US GAAP

138
The actuarial assumptions used in accounting for the Pension Plan were as follows :
2003 2002
Discount rate 8% 9%
Rate of increase in compensation levels 5% 5%
RLL and its Indian subsidiaries contributed approximately Rs 180.55 million and Rs 78.14 million to the pensionscheme during the years ended December 31, 2003 and 2002 respectively.
d) Deferred compensation plan
RPI maintains a nonqualified, deferred compensation plan for certain executive employees. Each participating employeemay elect to defer up to 100% of their compensation. The employees' contributions to the Plan are invested in certainfunds based on each employee's investment election and the fair market value of those funds are recorded as a long-term asset with a corresponding liability representing future benefits payable to the employees.
e) Vacation pay plan
RLL and its Indian subsidiaries permit encashment of privilege leave accumulated by their employees on retirement,separation and during the course of service. The liability for encashment of privilege leave is determined and providedon the basis of actuarial valuation performed by an independent actuary at balance sheet date.
The following table sets out the status of the Vacation pay plan of RLL and the corresponding amounts recognized in theGroup's consolidated financial statements :
2003 2002
Change in the benefit obligationsProjected Benefit Obligations ("PBO") at the beginning of the year 66.89 50.18Service cost 11.58 8.90Interest cost 5.35 4.52Actuarial (gain)/loss 27.12 13.12Benefits paid (16.95) (9.83)
PBO at the end of the year 93.99 66.89
Net vacation pay cost for the years ended December 31, 2003 and 2002 included the following components:
2003 2002
Service cost 11.58 8.90Interest cost 5.35 4.52Actuarial loss 27.12 13.12
Net vacation pay cost 44.05 26.54
The actuarial assumptions used in accounting for the Vacation pay plan were as follows:
2003 2002
Discount rate 8% 9%
Rate of increase in compensation levelsManagement employees 5% 5%Other employees 4.5% 5%
RLL and its Indian subsidiaries provided approximately Rs 46.63 million and Rs 27.57 million towards the liability forencashment of privilege leave for the years ended December 31, 2003 and 2002 respectively.
f) Other benefit plans
RLL and certain Group Companies also have defined contribution plans, which are largely governed by local statutorylaws of the respective countries and cover the eligible employees of the subsidiary. These schemes are funded both bythe members and by monthly company contributions, primarily based on a specified percentage of the employee'ssalary. The total contribution to these schemes during the years ended December 31, 2003 and 2002 are Rs 139.78million and Rs 121.26 million, respectively.
RANBAXY LABORATORIES LIMITED AND SUBSIDIARIES
NOTES TO CONSOLIDATED FINANCIAL STATEMENTSDecember 31, 2003 and 2002(All amounts in Rupees Million, unless otherwise stated)
NOTE P (continued)

139
NOTE Q - SEGMENT REPORTINGSFAS No. 131 "Disclosures About Segments of an enterprise and Related Information", sets out the standards for theway that public business enterprises report information about operating segments and related disclosures aboutproducts and services, geographical areas and major customers.
Operations of the Company predominately relate to manufacture of pharmaceuticals (dosage forms, active pharmaceuticalingredient and drug intermediates), trading in pharmaceutical products, drug discovery research and novel drug deliverysystems research, collectively referred to as "Pharmaceuticals" business. The Company is also engaged in operationsrelating to charter of aircraft, manufacture of laboratory chemicals and manufacture of pharmaceutical products foranimal health care and diagnostics, collectively referred to as "Other" business. The Chief Operating Decision Makerevaluates the Group's performance and allocates resources based on an analysis of various performance indicators bythe above-mentioned segments.
Revenue and expenditure in relation to segments is categorized based on items that are individually identifiable to thatsegment.
Geographic segments are based on location of the customer of the Company.
Information by reportable business segments for the year 2003 :
Particulars Pharmaceuticals Others Total
Revenues 48,227.20 1,258.57 49,485.77Less: Inter-segment revenue (82.45) (25.60) (108.05)
Net revenues 48,144.75 1,232.97 49,377.72
Operating expensesCost of revenues 19,817.89 752.67 20,570.56Selling, general and administrative 14,390.82 344.18 14,735.00Depreciation and amortization 1,210.20 16.32 1,226.52Research and development 2,422.33 � 2,422.33
37,841.24 1,113.17 38,954.41
Less: Inter-segment expenses (25.60) (83.38) (108.98)
Net operating expenses 37,815.64 1,029.79 38,845.43
Net income before unallocated items 10,329.11 203.18 10,532.29
Reconciliation to net incomeUnallocated corporate expenses (299.87)Financial expenses, net (3.60)Other income, net 394.92Income taxes (2,729.29)Equity in loss of affiliate (3.22)Minority interest (9.84)
Net income as per Consolidated Statement of Income 7,881.39
Information relating to assets Pharmaceuticals Others Total
Total assets 36,390.98 880.74 37,271.72
Less : Inter-segment assetsAccounts receivable, net of allowances � (4.48) (4.48)Other current assets, net of allowances (595.76) (1.98) (597.74)Other non-current assets � � �
(595.76) (6.46) (602.22)
Net assets employed 35,795.22 874.28 36,669.50
Unallocated corporate assets 4,811.08
Total assets 41,480.58
RANBAXY LABORATORIES LIMITED AND SUBSIDIARIES
NOTES TO CONSOLIDATED FINANCIAL STATEMENTSDecember 31, 2003 and 2002(All amounts in Rupees Million, unless otherwise stated)
Notes to Consolidated Financial Statements � US GAAP

140
Information by reportable business segments for the year 2002 :
Particulars Pharmaceuticals Others Total
Revenues 38,918.11 1,177.93 40,096.04Less: Inter-segment revenue (51.24) (19.63) (70.87)
Net revenues 38,866.87 1,158.30 40,025.17
Operating expensesCost of revenues 17,125.61 761.67 17,887.28Selling, general and administrative 10,579.05 348.31 10,927.36Depreciation and amortization 951.87 14.73 966.60Research and development 1,686.29 � 1,686.29
30,342.82 1,124.71 31,467.53
Less: Inter-segment expenses (15.45) (54.60) (70.05)
Net operating expenses 30,327.37 1,070.11 31,397.48
Net income before unallocated items 8,539.50 88.19 8,627.69
Reconciliation to net incomeUnallocated corporate expenses (36.11)Financial expenses (305.41)Other income, net 254.47Income taxes (1,806.88)Minority interest (8.03)
Net income as per Consolidated Statement of Income 6,725.73
Information relating to assets Pharmaceuticals Others Total
Total assets 27,794.12 763.23 28,557.35
Less : Inter-segment assetsAccounts receivable, net of allowances (4.93) (5.37) (10.30)Other current assets, net of allowances (456.84) (1.48) (458.32)Other non-current assets (11.72) � (11.72)
(473.49) (6.85) (480.34)
Net assets employed 27,320.63 756.38 28,077.01
Unallocated corporate assets 3,485.84
Total assets 31,562.85
Information by reportable geographic segments :
Revenue Property plantand equipment
2003 2002 2003 2002
India 13,984.29 9,715.89 4,991.70 3,850.54
Europe 7,770.80 3,845.21 311.14 262.00
Asia Pacific 4,656.77 3,881.10 167.61 190.00
North America 19,366.84 14,403.81 1,153.74 764.52
Rest of the world 3,599.02 8,179.16 86.29 50.60
49,377.72 40,025.17 6,710.48 5,117.66
RANBAXY LABORATORIES LIMITED AND SUBSIDIARIES
NOTES TO CONSOLIDATED FINANCIAL STATEMENTSDecember 31, 2003 and 2002(All amounts in Rupees Million, unless otherwise stated)
NOTE Q (continued)

141
NOTE R - STRATEGIC AGREEMENT TERMINATIONIn January 2002, RLL and RPI received settlement payments approximating Rs 734.26 million relating to the terminationof certain strategic alliance agreements with a third party and recorded the same as "other revenues". Under the termsof this agreement, RPI purchased certain equipment, patents, trademarks and other intellectual property from the thirdparty. The cost of the assets purchased approximated Rs 2.43 million, together with a Rs 2.43 million transition feecharged by the third party, was offset against the settlement proceeds paid to RPI.
NOTE S - FINANCIAL INSTRUMENTS AND CONCENTRATIONSFinancial instruments that potentially subject the Group to concentrations of credit risk consist principally of cashequivalents, accounts receivables, other receivables, investment securities and deposits. By their nature, all such financialinstruments involve risk including the credit risk of non-performance by counter parties. The Company's cash equivalentsand time deposits are invested with banks. The Company monitors the credit worthiness of its customers to which itgrants credit terms in the normal course of the business.
RLL and RPI accounted for approximately 43 percent and 39 percent (48 percent and 36 percent for 2002) of theGroup's consolidated revenues in the fiscal 2003. At December 31, 2003 and 2002, two customers of RPI accounted forapproximately 35 percent and 12 percent of its gross accounts receivable. During 2003 and 2002, there were twocustomers, each of whom individually accounted for approximately 10 percent of its net sales. For the years endedDecember 31, 2003 and 2002, the net sales of 10 products represented approximately 20 percent and 28 percent of thetotal net sales of the Group.
The carrying amounts of cash and cash equivalents, accounts receivables, other receivables, accrued liabilities, andaccounts payable approximate fair value, because of the short-term maturities of these financial instruments. The carryingamounts of capital lease obligations, long-term debt and time deposits approximate their fair values as these carryinterest rates which reflect market rate for borrowings with similar terms and maturities currently available to theCompany. The fair value of the long-term deposits cannot be estimated as the maturity of these deposits is not presentlyknown.
The Company enters into certain forward foreign exchange contracts where counter party is generally a bank. TheCompany does not consider the risk of non-performance by the counterparty to be significant. The aggregate contractedprincipal of the Company's derivative financial instruments outstanding as at December 31, 2003 and 2002 areRs 31,115.84 million and Rs 8,051.28 million, respectively. The forward foreign exchange contracts mature betweenone and fifteen months.
NOTE T - COMMITMENTS AND CONTINGENCIESLeases
The future capital lease obligations are as follows :
Year ending December 31,
2004 5.62
2005 4.90
2006 2.63
2007 0.16
13.31
Less : Interest 2.00
11.31
The obligations of the Group have been included in other current liabilities/ other liabilities, depending on the period inwhich the principal portion is payable.
RLL and the Group companies lease office premises and residential facilities under both cancelable and non-cancelableoperating leases. Rent expense for the years ended December 31, 2003 and 2002 are approximately Rs 188.15 millionand Rs 153.31 million, respectively.
RANBAXY LABORATORIES LIMITED AND SUBSIDIARIES
NOTES TO CONSOLIDATED FINANCIAL STATEMENTSDecember 31, 2003 and 2002(All amounts in Rupees Million, unless otherwise stated)
Notes to Consolidated Financial Statements � US GAAP

142
The minimum rental commitments under the non-cancelable operating leases are approximately as follows :
Year ending December 31,
2004 95.39
2005 92.04
2006 73.91
2007 46.50
2008 and thereafter 32.39
340.23
Other Contingencies
RLL and some Group Companies are involved in certain claims, tax assessments and litigation arising in the ordinarycourse of business, primarily related to alleged patent infringement for products that the Group currently manufactures,sells or distributes or intends to manufacture, sell or distribute. In certain claims and litigation, the Group Companiesare named as a Co-defendant, along with others, including RLL. Further, certain of the company's products have ahigher regulatory risk profile, and accordingly the company has increased its product liability coverage. The companyevaluates the requirements for establishing provisions for such claims, assessments and litigation pursuant to SFAFNo. 5. Management believes that these matters, taken individually or in the aggregate, will not have material adverseimpact on the Group's financial position or results of operations. A summary of the contingencies existing as at December31, 2003 and 2002 is as follows :
2003 2002
Claims against the Company not acknowledged as debts 948.73 244.06Guarantees to banks 4.81 400.00Bills purchased/discounted under letters of credit 4.01 81.53Demand for taxes pending disposal of appeal(s) 25.12 59.74
982.67 785.33
Ranbaxy (U.K.) Limited, together with six other non related companies, is party to a claim brought against them by theSecretary of Health and others relating to pricing of certain products. Management at this time does not consider itnecessary to make a provision in these financial statements in respect of this claim.
Capital purchase commitments of the Group as at December 31, 2003 and 2002 are Rs 474.69 million and Rs 61.19million respectively.
Strategic Agreements
The Group, in the ordinary course of business, has and may enter into strategic research, manufacturing, distributionand selling agreements. These agreements may call for certain financial commitments either pre- or post-commerciallaunch of a product. Certain commitments are fixed in amount and certain are dependent on future sales volumes.
NOTE U - SUBSEQUENT EVENTSOn January 5, 2004, the Company acquired RPG (Aventis) S.A., a French company engaged in the business ofmanufacturing generic pharmaceuticals, together with its wholly owned subsidiary, OPIH SARL. The major therapeuticareas of the acquired company include Cardiovasculars, Anti-infectives, Gastrointestinals, Rheumatoid/ Non-steroidalAnti-inflammatory Drugs, Neurology and Analgesics. The transaction will be accounted for as a business combinationunder SFAF No. 141 in the subsequent year upon finalization of purchase price allocation. During the year endedDecember 31, 2003, the acquired company earned revenues of Rs 2,989.23 million.
RANBAXY LABORATORIES LIMITED AND SUBSIDIARIES
NOTES TO CONSOLIDATED FINANCIAL STATEMENTSDecember 31, 2003 and 2002(All amounts in Rupees Million, unless otherwise stated)
NOTE T (continued)

143
RECONCILIATION BETWEEN THE FINANCIAL STATEMENTS UNDER INDIAN GAAP AND US GAAP
Material differences between the financial statements under the Indian GAAP and U.S. GAAP are primarily attributable to therequirements of U.S. GAAP for accounting of depreciation of property, plant and equipment, amortization of goodwill &intangibles and forward foreign exchange contracts which are summarized below :
Description Indian GAAP U.S. GAAP
Depreciation of property, At rates prescribed under respective Based on estimated useful lifeplant and equipment domestic laws and regulations of assets
Goodwill and intangibles To be amortized over estimated Such assets with indeterminateuseful life lives subjected to test of
impairment at each balancesheet date
Forward foreign exchange Premiums earned/paid accounted in Contracts that are not effectivecontracts income statement over the term of hedges are recorded at year end
contracts at their fair value and resultantgain/loss recognized in theresults of operations
A reconciliation of net income as per Indian GAAP and US GAAP is set out below :
Rs Million
2003 2002
Net income as per U.S. GAAP 7,881 6,726
Additional depreciation on property, plant and equipment 128 145
Non-amortization of goodwill (122) (183)
Forward foreign exchange contracts at fair value at year end (418) (72)
Deferred taxes 186 (48)
Others (61) (98)
Net income as per Indian GAAP 7,594 6,470
RANBAXY LABORATORIES LIMITED AND SUBSIDIARIES
Notes to Consolidated Financial Statements & Reconciliation between the Financial Statements under Indian GAAP and US GAAP

144
NOTES