windsor hotel building noi overview 2016 actuals current ... · properties: windsor hotel - 843...
TRANSCRIPT

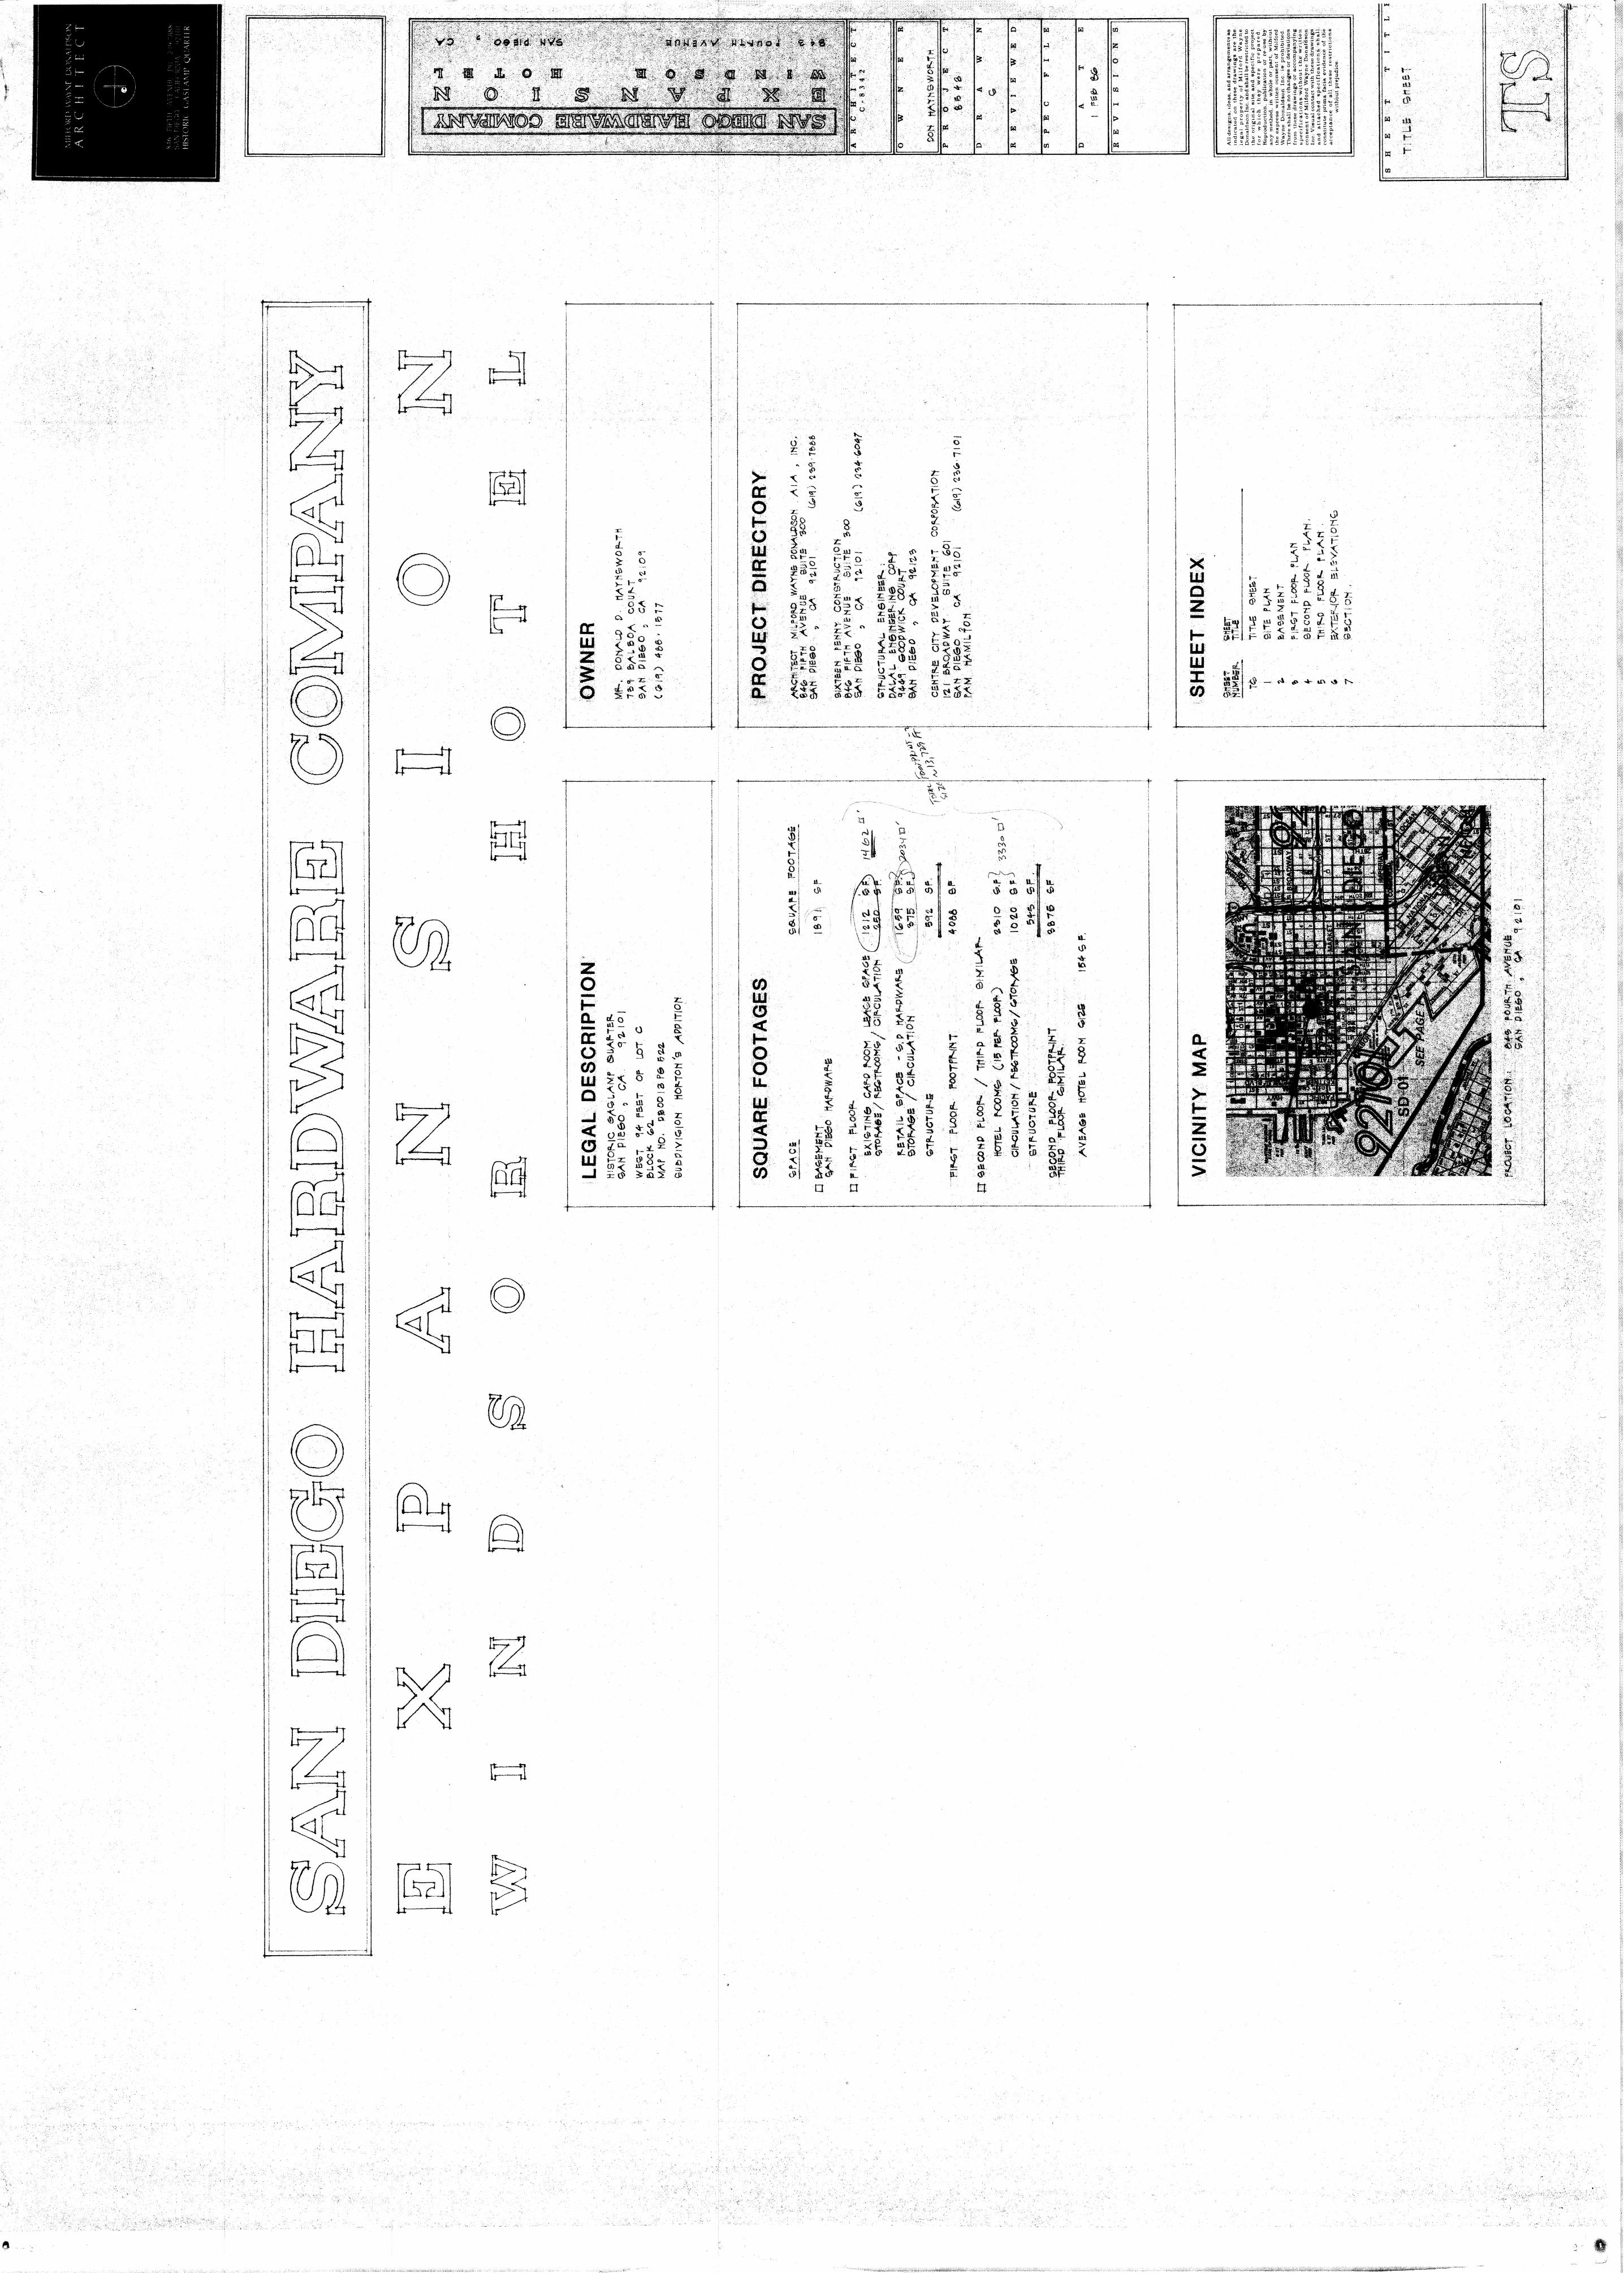
Windsor Hotel Building NOI Overview
2016 Actuals Current Annualized NOI
Category Amount Category Amount
Hotel NOI 64,975.00$ Hotel NOI 72,000.00$
Restaurant Rent Income 158,350.00$ Restaurant Rent Income 163,896.00$
NNN Reimbursement 11,350.00$ NNN Reimbursement 11,904.00$
Property Taxes (20,951.00)$ Property Taxes (21,183.00)$
Property Insurance (10,780.00)$ Property Insurance (11,000.00)$
Repairs (1,029.00)$ Repairs (2,500.00)$
Legal/Professional (2,382.00)$ Legal/Professional (2,500.00)$
Fees, Permits, Misc (370.00)$ Fees, Permits, Misc (400.00)$
Windsor NOI 2016 199,163.00$ Windsor Current NOI est. 210,217.00$

Hughes ManagementProperties: Windsor Hotel - 843 Fourth Avenue San Diego, CA 92101Period Beginning: Jan 2016Period Ending: Dec 2016Account Name Jan 2016 Feb 2016 Mar 2016 Apr 2016 May 2016 Jun 2016 Jul 2016 Aug 2016 Sep 2016 Oct 2016 Nov 2016 Dec 2016 Total
Operating Income & Expense
Income
Residential Rent Income 16,250.00 14,762.00 16,191.17 16,455.00 15,410.00 15,680.00 14,820.00 14,780.00 15,530.00 14,155.00 16,850.00 15,280.00 186,163.17
Commercial Rent 0.00 0.00 0.00 0.00 0.00 0.00 0.00 0.00 0.00 0.00 100.00 0.00 100.00
Other Income
Application Fees 0.00 0.00 0.00 0.00 0.00 0.00 0.00 0.00 0.00 0.00 90.00 0.00 90.00
Late Fees 275.00 200.00 200.00 150.00 0.00 0.00 50.00 0.00 60.00 50.00 0.00 100.00 1,085.00
Laundry 158.85 276.15 262.80 0.00 261.15 122.85 210.79 212.85 83.55 197.40 144.14 279.50 2,210.03
Total Other Income
Total Operating Income
Expense
Advertising & Promotion 327.84 390.90 298.76 327.67 266.01 362.01 323.79 266.01 455.90 294.41 0.00 96.00 3,409.30
Credit & Background Reports 15.00 15.00 0.00 0.00 0.00 15.00 15.00 0.00 15.00 45.00 0.00 0.00 120.00
Deposit Refunds 560.00 0.00 0.00 790.00 730.00 0.00 -279.16 0.00 1,100.00 550.00 556.57 540.00 4,547.41
Licenses & Permits 0.00 0.00 0.00 0.00 0.00 101.86 0.00 0.00 0.00 0.00 0.00 0.00 101.86
Maintenance
Doors, Locks & Keys 0.00 0.00 549.30 0.00 50.00 0.00 50.00 0.00 0.00 236.68 0.00 0.00 885.98
Fire & Safety 0.00 0.00 207.59 0.00 0.00 0.00 0.00 0.00 0.00 0.00 0.00 0.00 207.59
Other Repairs & Maint. 622.21 499.16 446.25 460.80 307.20 737.28 702.36 1,148.40 387.36 1,631.55 1,813.80 1,625.40 10,381.77
Painting 414.81 199.44 0.00 0.00 0.00 593.80 468.24 765.60 258.24 0.00 0.00 124.49 2,824.62
Pest Control 97.00 52.00 52.00 187.00 135.00 284.00 232.00 322.00 601.00 236.00 1,594.26 1,500.00 5,292.26
Plumbing 0.00 0.00 731.06 0.00 0.00 186.00 0.00 0.00 606.24 0.00 0.00 0.00 1,523.30
Total Maintenance
Management Fees 2,352.58 2,285.72 2,480.77 2,490.75 2,350.67 2,370.43 2,262.12 2,248.93 2,351.03 2,160.36 2,577.62 2,348.93 28,279.91
Office Expense
Bank Service Charges 6.00 0.00 0.00 -0.90 0.00 0.00 0.00 0.00 0.00 0.00 0.00 0.00 5.10
Postage & Delivery 0.00 0.00 0.00 0.00 0.00 0.00 20.88 0.00 0.00 0.00 0.00 0.00 20.88
Office Supplies 47.06 149.22 68.85 26.50 54.42 0.00 0.00 93.93 30.94 0.00 25.04 0.00 495.96
Total Office Expense
Payroll
Wages, Taxes & Work Comp 2,811.79 3,207.77 2,577.18 2,323.80 2,639.71 2,516.11 2,536.51 2,662.20 2,985.00 3,343.20 2,829.46 2,644.20 33,076.93
433.85 476.15 462.80 150.00 261.15 122.85 260.79 212.85 143.55 247.40 234.14 379.50 3,385.03
16,683.85 15,238.15 16,653.97 16,605.00 15,671.15 15,802.85 15,080.79 14,992.85 15,673.55 14,402.40 17,184.14 15,659.50 189,648.20
1,134.02 750.60 1,986.20 647.80 492.20 1,801.08 1,452.60 2,236.00 1,852.84 2,104.23 3,408.06 3,249.89 21,115.52
53.06 149.22 68.85 25.60 54.42 0.00 20.88 93.93 30.94 0.00 25.04 0.00 521.94
Windsor Hotel Cash Flow 2016.12
Created on 01/04/2017 Page 1

Account Name Jan 2016 Feb 2016 Mar 2016 Apr 2016 May 2016 Jun 2016 Jul 2016 Aug 2016 Sep 2016 Oct 2016 Nov 2016 Dec 2016 Total
Total Payroll
Supplies
Building Maint. Supplies 134.31 241.33 23.74 0.00 120.18 416.73 252.93 200.65 328.75 227.13 466.32 374.69 2,786.76
Janitorial Supplies 525.17 451.83 951.86 382.31 467.61 745.91 365.63 479.11 227.19 280.53 226.77 0.00 5,103.92
Room Supplies 0.00 0.00 0.00 0.00 0.00 0.00 344.24 0.00 285.00 172.12 688.48 0.00 1,489.84
Total Supplies
Taxes 0.00 0.00 0.00 0.00 0.00 0.00 0.00 0.00 0.00 0.00 0.00 60.08 60.08
Utilities
Cable TV 464.18 464.18 464.18 464.18 481.79 481.79 481.79 481.79 481.79 481.79 481.79 481.79 5,711.04
Electric & Gas 905.82 1,185.71 1,006.02 914.70 426.77 943.81 937.94 1,128.38 1,189.61 1,118.24 632.18 1,041.49 11,430.67
Telephone & Internet 79.06 79.02 89.44 89.37 191.93 81.57 84.22 108.22 135.22 84.70 84.10 84.15 1,191.00
Trash and Recycling 109.46 109.46 148.96 109.46 109.46 109.46 109.46 114.39 114.39 230.39 160.39 114.39 1,539.67
Water and Sewer 0.00 0.00 0.00 273.23 0.00 792.79 0.00 782.53 0.00 581.94 0.00 1,757.30 4,187.79
Total Utilities
Total Operating Expense
NOI - Net Operating Income 7,211.56 5,907.41 6,558.01 7,766.13 7,340.40 5,064.30 6,172.84 4,190.71 4,120.89 2,728.36 5,047.36 2,866.59 64,974.56
Other Income & Expense
Other Expense
Owner Transfer 7,211.56 5,907.41 6,558.01 7,766.13 7,340.40 5,064.30 6,172.84 4,190.71 4,120.89 2,728.36 5,047.36 2,866.59 64,974.56
Total Other Expense
Net Other Income -7,211.56 -5,907.41 -6,558.01 -7,766.13 -7,340.40 -5,064.30 -6,172.84 -4,190.71 -4,120.89 -2,728.36 -5,047.36 -2,866.59 -64,974.56
Total Income 16,683.85 15,238.15 16,653.97 16,605.00 15,671.15 15,802.85 15,080.79 14,992.85 15,673.55 14,402.40 17,184.14 15,659.50 189,648.20
Total Expense 16,683.85 15,238.15 16,653.97 16,605.00 15,671.15 15,802.85 15,080.79 14,992.85 15,673.55 14,402.40 17,184.14 15,659.50 189,648.20
Net Income
Cash Flow
2,811.79 3,207.77 2,577.18 2,323.80 2,639.71 2,516.11 2,536.51 2,662.20 2,985.00 3,343.20 2,829.46 2,644.20 33,076.93
659.48 693.16 975.60 382.31 587.79 1,162.64 962.80 679.76 840.94 679.78 1,381.57 374.69 9,380.52
1,558.52 1,838.37 1,708.60 1,850.94 1,209.95 2,409.42 1,613.41 2,615.31 1,921.01 2,497.06 1,358.46 3,479.12 24,060.17
9,472.29 9,330.74 10,095.96 8,838.87 8,330.75 10,738.55 8,907.95 10,802.14 11,552.66 11,674.04 12,136.78 12,792.91 124,673.64
7,211.56 5,907.41 6,558.01 7,766.13 7,340.40 5,064.30 6,172.84 4,190.71 4,120.89 2,728.36 5,047.36 2,866.59 64,974.56
0.00 0.00 0.00 0.00 0.00 0.00 0.00 0.00 0.00 0.00 0.00 0.00 0.00
0.00 0.00 0.00 0.00 0.00 0.00 0.00 0.00 0.00 0.00 0.00 0.00 0.00
Windsor Hotel Cash Flow 2016.12
Created on 01/04/2017 Page 2

Account Name Jan 2016 Feb 2016 Mar 2016 Apr 2016 May 2016 Jun 2016 Jul 2016 Aug 2016 Sep 2016 Oct 2016 Nov 2016 Dec 2016 Total
Beginning Cash 1,000.00 1,000.00 1,000.00 1,000.00 1,000.00 1,000.00 1,000.00 1,000.00 1,000.00 1,000.00 1,000.00 1,000.00 1,000.00
Beginning Cash + Cash Flow 1,000.00 1,000.00 1,000.00 1,000.00 1,000.00 1,000.00 1,000.00 1,000.00 1,000.00 1,000.00 1,000.00 1,000.00 1,000.00
Actual Ending Cash 1,000.00 1,000.00 1,000.00 1,000.00 1,000.00 1,000.00 1,000.00 1,000.00 1,000.00 1,000.00 1,000.00 1,000.00 1,000.00
Windsor Hotel Cash Flow 2016.12
Created on 01/04/2017 Page 3

Hughes ManagementProperties: Windsor Hotel - 843 Fourth Avenue San Diego, CA 92101Period Beginning: Jan 2017Period Ending: Aug 2017Account Name Jan 2017 Feb 2017 Mar 2017 Apr 2017 May 2017 Jun 2017 Jul 2017 Aug 2017 Total
Operating Income &Expense
Income
Residential Rent Income 16,140.00 15,865.00 16,340.00 15,680.00 16,562.50 15,630.00 15,740.00 16,834.55 128,792.05
Other Income
Late Fees 100.00 50.00 100.00 165.00 127.50 127.50 0.00 100.00 770.00
Laundry 0.00 261.30 254.57 122.85 151.94 89.86 366.76 0.00 1,247.28
Vending Income 0.00 0.00 0.00 0.00 0.00 0.00 0.00 130.33 130.33
Total Other Income
Total Operating Income
Expense
Advertising & Promotion 0.00 0.00 96.00 0.00 0.00 105.60 0.00 0.00 201.60
Credit & BackgroundReports
60.00 30.00 0.00 0.00 0.00 0.00 0.00 0.00 90.00
Deposit Refunds 200.00 0.00 550.00 950.00 0.00 -200.00 0.00 0.00 1,500.00
Maintenance
Fire & Safety 0.00 0.00 93.50 0.00 0.00 586.33 0.00 250.00 929.83
Other Repairs & Maint. 935.66 250.15 199.37 106.03 783.72 760.68 328.68 228.96 3,593.25
Painting 614.78 166.76 132.91 70.69 522.48 507.12 219.12 152.64 2,386.50
Pest Control 1,587.72 2,221.03 236.00 54.00 56.00 356.00 56.00 56.00 4,622.75
Plumbing 0.00 35.00 0.00 0.00 0.00 0.00 0.00 70.00 105.00
Janitorial 0.00 0.00 0.00 31.50 210.00 0.00 0.00 0.00 241.50
Maintenance 0.00 130.00 0.00 0.00 0.00 0.00 0.00 0.00 130.00
Total Maintenance
Management Fees 2,443.50 2,443.50 2,504.19 2,395.18 2,509.24 2,377.10 2,416.01 2,559.73 19,648.45
Office Expense
Bank Service Charges 0.00 0.00 0.00 0.00 0.00 7.00 0.00 0.00 7.00
Office Supplies 42.53 37.26 14.52 22.32 39.53 0.00 0.00 5.44 161.60
Total Office Expense
Payroll
Wages, Taxes & WorkComp
2,214.71 2,144.65 1,486.62 1,836.64 1,989.00 2,067.20 3,021.63 2,922.80 17,683.25
100.00 311.30 354.57 287.85 279.44 217.36 366.76 230.33 2,147.61
16,240.00 16,176.30 16,694.57 15,967.85 16,841.94 15,847.36 16,106.76 17,064.88 130,939.66
3,138.16 2,802.94 661.78 262.22 1,572.20 2,210.13 603.80 757.60 12,008.83
42.53 37.26 14.52 22.32 39.53 7.00 0.00 5.44 168.60
Windsor Hotel Cash Flow 2017.08
Created on 09/07/2017 Page 1

Account Name Jan 2017 Feb 2017 Mar 2017 Apr 2017 May 2017 Jun 2017 Jul 2017 Aug 2017 Total
Total Payroll
Professional Services
Legal Expenses 0.00 0.00 0.00 0.00 0.00 0.00 0.00 240.00 240.00
Total ProfessionalServices
Supplies
Building Maint.Supplies
372.64 319.35 86.86 58.07 162.77 245.66 350.00 96.90 1,692.25
Janitorial Supplies 289.68 182.37 281.80 180.12 257.19 216.44 259.53 568.80 2,235.93
Room Supplies 403.55 540.76 0.00 0.00 0.00 218.28 75.40 0.00 1,237.99
Total Supplies
Utilities
Cable TV 481.79 481.79 481.79 481.79 481.79 481.79 481.79 481.79 3,854.32
Electric & Gas 1,009.23 1,212.84 1,127.27 1,084.40 56.89 990.57 1,016.22 1,277.38 7,774.80
Telephone & Internet 83.60 87.19 79.33 87.52 29.04 149.41 92.16 92.16 700.41
Trash and Recycling 114.39 114.39 114.39 114.39 114.39 114.39 149.39 217.84 1,053.57
Water and Sewer 0.00 912.62 0.00 0.00 817.60 838.71 0.00 880.95 3,449.88
Total Utilities
Total Operating Expense
NOI - Net OperatingIncome
5,386.22 4,866.64 9,210.02 8,495.20 8,812.30 6,025.08 7,640.83 6,963.49 57,399.78
Other Income & Expense
Other Expense
Owner Transfer 5,386.22 4,866.64 9,210.02 8,495.20 8,812.30 6,025.08 7,640.83 6,963.49 57,399.78
Total Other Expense
Net Other Income -5,386.22 -4,866.64 -9,210.02 -8,495.20 -8,812.30 -6,025.08 -7,640.83 -6,963.49 -57,399.78
Total Income 16,240.00 16,176.30 16,694.57 15,967.85 16,841.94 15,847.36 16,106.76 17,064.88 130,939.66
Total Expense 16,240.00 16,176.30 16,694.57 15,967.85 16,841.94 15,847.36 16,106.76 17,064.88 130,939.66
Net Income
2,214.71 2,144.65 1,486.62 1,836.64 1,989.00 2,067.20 3,021.63 2,922.80 17,683.25
0.00 0.00 0.00 0.00 0.00 0.00 0.00 240.00 240.00
1,065.87 1,042.48 368.66 238.19 419.96 680.38 684.93 665.70 5,166.17
1,689.01 2,808.83 1,802.78 1,768.10 1,499.71 2,574.87 1,739.56 2,950.12 16,832.98
10,853.78 11,309.66 7,484.55 7,472.65 8,029.64 9,822.28 8,465.93 10,101.39 73,539.88
5,386.22 4,866.64 9,210.02 8,495.20 8,812.30 6,025.08 7,640.83 6,963.49 57,399.78
0.00 0.00 0.00 0.00 0.00 0.00 0.00 0.00 0.00
Windsor Hotel Cash Flow 2017.08
Created on 09/07/2017 Page 2

Account Name Jan 2017 Feb 2017 Mar 2017 Apr 2017 May 2017 Jun 2017 Jul 2017 Aug 2017 Total
Cash Flow
Beginning Cash 1,000.00 1,000.00 1,000.00 1,000.00 1,000.00 1,000.00 1,000.00 1,000.00 1,000.00
Beginning Cash + CashFlow
1,000.00 1,000.00 1,000.00 1,000.00 1,000.00 1,000.00 1,000.00 1,000.00 1,000.00
Actual Ending Cash 1,000.00 1,000.00 1,000.00 1,000.00 1,000.00 1,000.00 1,000.00 1,000.00 1,000.00
0.00 0.00 0.00 0.00 0.00 0.00 0.00 0.00 0.00
Windsor Hotel Cash Flow 2017.08
Created on 09/07/2017 Page 3