wind waves and sediments calm stephen monismith jeremy bricker, satoshi inagaki, and nicole jones...
TRANSCRIPT

Wind waves and sediments
Calm
Stephen MonismithJeremy Bricker, Satoshi Inagaki, and Nicole Jones
Stanford University
Windy
Supported by UPS Foundation and CALFED ERP

Sediment model (ca. 1999)
• TRIM3D - Casulli code as modifed by Ed Gross - calibrated for Winter/Spring 1995
• Sediment model = 3D transport + standard cohesive sediment model (Inagaki and Bricker)
• Use Krone’s (1962) values for sediment model parameters (Erodability etc.)
• (for seds) Increase bed stress to min. drag coeff. value
• (for seds) Include wave friction factor in bed stress calculation
• Waves modeled using USACE Shore Protection Manual

(kg/m3)
Tide Only
Waves:H=0.6m T=2.8s
Effects of waves on computed concentrations (1 m below
MLLW)

Wave Estimation
Shore Protection Manual (US Army Corps of Engineers, 1984)
(s) period wave:
(m)height wave:
T
H
(m) depth :
(m) fetch :
(m/s) speed wind:
d
F
U A

Wave Estimation
Fetch
SF PORTS winds Wind from W
Winds
+
N

Comparison: Measurement vs Prediction at Coyote Point
(using SFO wind)

Modeled sediment concentrations with and without winds
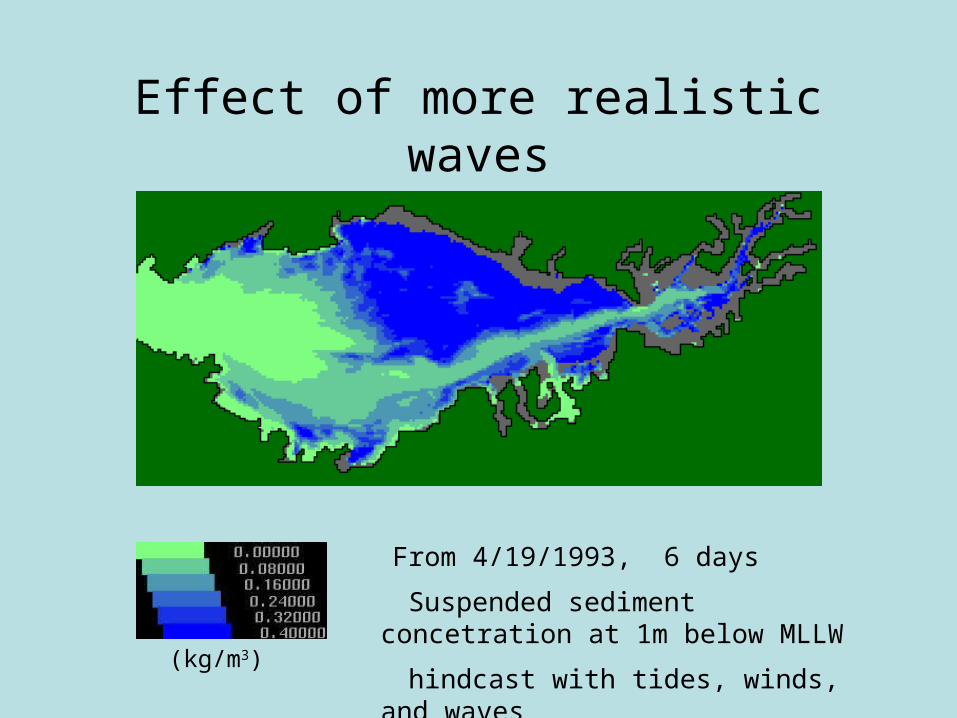
Effect of more realistic waves
(kg/m3)
From 4/19/1993, 6 days
Suspended sediment concetration at 1m below MLLW
hindcast with tides, winds, and waves
Two wave models
QuickTime™ and a decompressor
are needed to see this picture.
QuickTime™ and a decompressor
are needed to see this picture.
Shore Protection SWAN (Bricker)

QuickTime™ and a decompressor
are needed to see this picture.


Wind waves over shallow estuarine shoals
Steady bottomboundary layer
Steady surface boundary layer
Whitecapping-affected layer
Wind stress
z
U(z)
-dP/dx(tides)
Oscillatory bottom boundary layer

Coyote Pt. observations

Tidal stage and sea state at Coyote Point, June-July 2002

Conditions at Coyote Point, June-July 2002
QuickTime™ and a decompressor
are needed to see this picture.
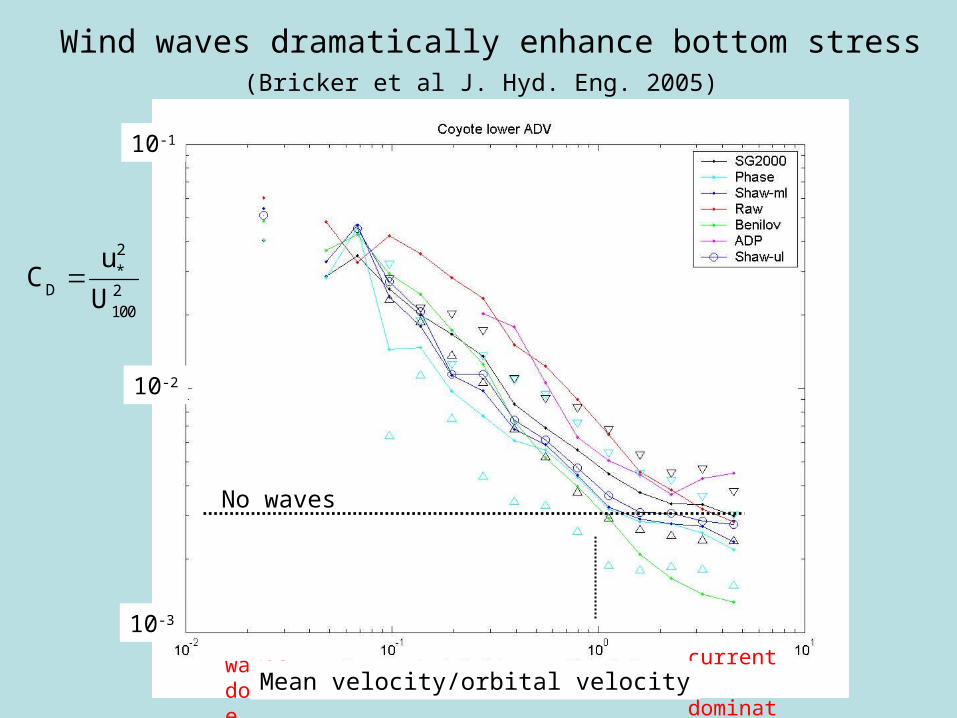
currents dominate
waves dominate
Wind waves dramatically enhance bottom stress(Bricker et al J. Hyd. Eng. 2005)
C
D
u*2
U1002
10-2
10-1
10-3
Mean velocity/orbital velocity
No waves

Effect on drag coefficient
QuickTime™ and a decompressor
are needed to see this picture.
15 x 10-3
10 x 10-3
5 x 10⁻³
“canonical”

Wind waves in Suisun Bay
Jones and Monismith JPO 2008
QuickTime™ and a decompressor
are needed to see this picture.
Wind

Breaking

QuickTime™ and a decompressor
are needed to see this picture.
Turbulence due to breaking
Bre
akin
g
Bott
om
BL
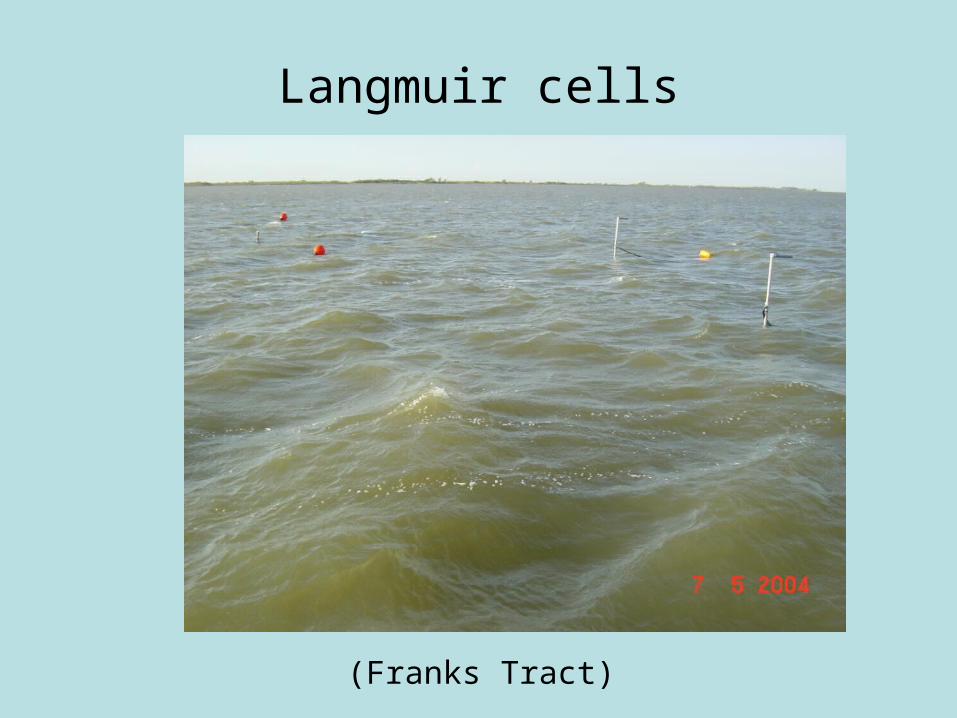
Langmuir cells
(Franks Tract)

Wind wave evolution
QuickTime™ and a decompressor
are needed to see this picture.
QuickTime™ and a decompressor
are needed to see this picture.
Day

Summary
• Waves important to sediment dynamics on shoals
• Waves modify bottom drag and thus flows and transport on shoals
• Waves modify vertical turbulent mixing of sediments on shoals

Needs
• Validated wave model for SF Bay (SWAN?)
• Wave data for whole bay• Spatially variable parameters for
sediment model (Sedflume?)• Parametrization of effects of wave
damping by soft muds
• Compare sediment model (with waves) to both short and long term data sets

The bottom (Elkhorn Slough)