wind tunnels and flight - ulisboaltces.dem.ist.utl.pt/lxlaser/lxlaser2000/papers/pdf/01_2.pdffluid...
TRANSCRIPT
1
Wind Tunnels and Flight
by
Henry McDonald, James Ross, David Driver, and Stephen Smith
NASA Ames Research CenterMoffett Field, CA, 94035 USA
ABSTRACT
The problem of extrapolating wind-tunnel data to flight conditions has been with us since the early days ofaviation. The Wright brothers faced the problem, as has everyone else who used wind-tunnel data as part oftheir aircraft design process. The techniques used for correcting wind-tunnel data for wall and mountingeffects are applied meticulously, but they are usually limited to linear flow approximations. The remainingissues for extrapolation are geometric differences between models and airplanes, non-linear effects of wind-tunnel walls and mounting systems, and the effects of Reynolds number. These effects are poorly understoodor difficult to predict and they can result in a new aircraft falling short of its guaranteed performance. Thecurrent practice in wind-tunnel data corrections are summarized and the missing physics identified. Currentwork on improving our understanding of the pertinent aerodynamics and to improve extrapolation methodsare presented along with a discussion of further areas of inquiry.
1. INTRODUCTION
In view of the current limitations of predictive analyses, nearly all aircraft designs are tested in wind tunnelsin order to accurately estimate performance. These wind tunnel tests are carefully performed to reduce thefinancial risk of missing the performance guarantees given to the buyers of the airplane. Mack andMcMasters1 reported in 1992 that a 1% reduction in drag was worth several million dollars per year to anoperator’s fleet of aircraft. Clearly, missing the drag or other performance guarantees on the negative sidecan result in significant economic penalties for a manufacturer. Even missing the performance on the positiveside means that the design point was miscalculated, possibly resulting in an overly conservative design andreduced profit margin.
In order to minimize the possibility of such occurrences, aircraft manufacturers have developed rigoroustesting procedures. The procedures are important not only to assure repeatable, high quality measurementsbut also to account for the fact that the aerodynamic characteristics of a model in a wind tunnel are notidentical to that of the full-size airplane in flight. There are many aspects to this problem including wall andmounting interference, geometric fidelity of the model, and mismatches in Reynolds number. The schemesused for many of these corrections and for extrapolation to flight are tightly held by the aircraft industrybecause of the potential competitive advantage they may provide. In spite of the best engineering efforts inperforming the extrapolations, there are still many instances in which some aspect of the aerodynamics orcontrol of a new design fall short of requirements.
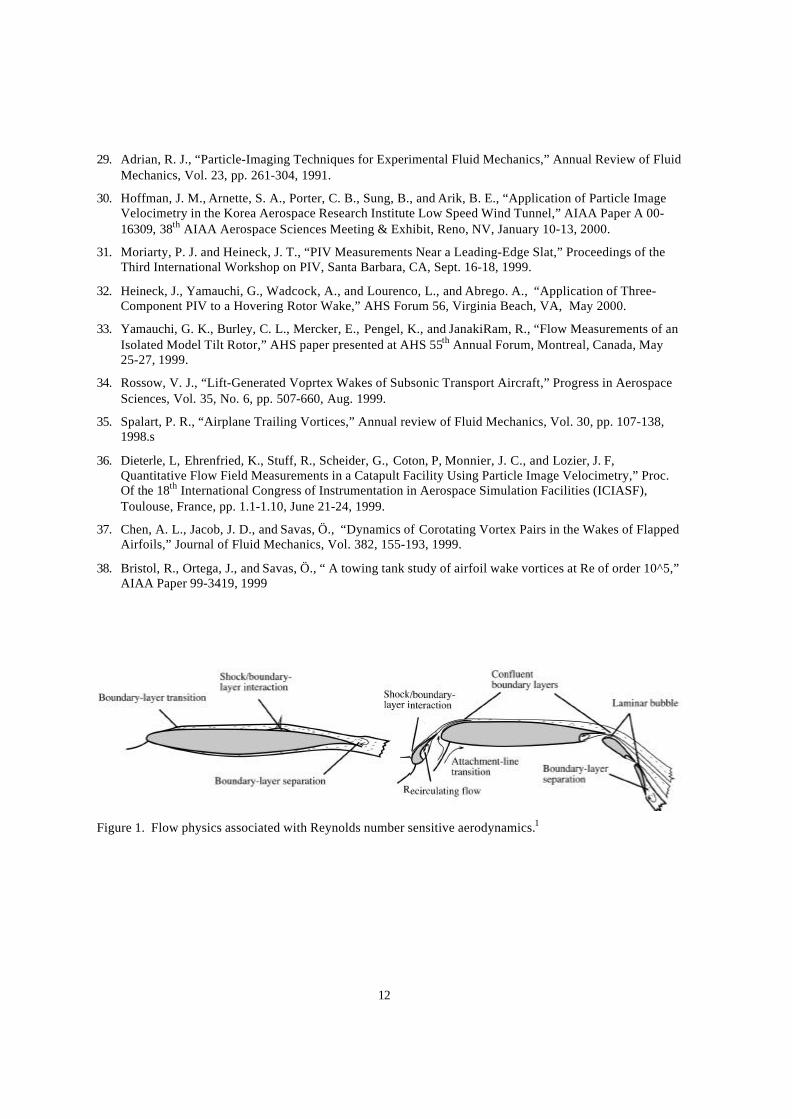
The reasons for these extrapolation errors are not fully understood, but are often attributed to the effects ofReynolds number. This is justified, to a large extent, because of the complex, Reynolds number sensitivefluid mechanics associated with the aerodynamic performance for both cruise and high-lift wingconfigurations. Figure 1 illustrates some of these complexities. Boundary-layer transition, shock/boundary-layer interaction, and flow separation near the trailing edge all affect cruise wing performance. For the multi-element airfoils associated with take-off and landing configurations, shock/boundary-layer interaction,attachment-line transition, confluent boundary layers, laminar separation bubbles, boundary-layer transition,and recirculating separated flows are the relevant complex flow features.
There has been considerable work aimed at reducing the uncertainty of Reynolds-number extrapolation. It isnot easy, however, to completely separate the effects of aeroelastic model deformation from the trueReynolds number effects. In light of the importance and current uncertainties of the extrapolation process,

2
this research should continue and be augmented in both the theoretical and experimental areas. We willdiscuss some of this work in the context of how wind tunnels affect aircraft design. We will also presentsome current work with an emphasis on the experiments where laser techniques have provided importantaero/fluid-dynamics measurements that were previously unavailable.
2. THE ROLE OF WIND-TUNNEL TESTING IN THE DESIGN PROCESS
The aerodynamic design processes used by aircraft manufacturers are varied and generally not fully disclosedto protect features of competitive advantage. For the purposes of this discussion however, a generic designprocess can be thought of as consisting of a conceptual phase, preliminary phase, and a final phase. Duringthe conceptually design phase, simple analysis methods are used to determine the overall design featuresrequired to meet the proposed mission. The mission is a result of market surveys, customer requests, orprojected new markets. The tools used to develop a conceptual design generally employ a large measure ofempiricism and low-order aerodynamics computations. Using these tools, the designer can relatively quicklydetermine the span, wing area, overall length, propulsion requirements, and weight for an aircraft. It is in thisphase of design where the likelihood of a commercially viable airplane, that might satisfy the givenrequirements, is first determined.
The next stage of the design process employs much more sophisticated analysis tools to determine theexpected aerodynamic performance, weight, and cost of the airplane. A great deal of iteration betweendisciplines is required at this point in order to arrive at acceptable compromises and a design that can stillcarry out the desired mission. It is during this phase that wind tunnel testing may first begin. Much of thetesting at this stage has been replaced by computational fluid dynamics (CFD) methods that now accurateenough to compute the cruise performance and to estimate the high-lift capability. Some wind tunnel testingmay still be performed in order to assess a unique design feature or to validate the CFD generatedinformation.
In the final design phase, cruise performance, control authority, off-design behavior, and high-liftperformance must be accurately assessed. More of this work is done computationally as the methods areimproved, but there remain sufficient shortfalls in both the accuracy of CFD as well as the ability to generatethe quantity of data required to completely characterize the aerodynamic characteristics. Cruise performanceis often predicted accurately by Reynolds Averaged Navier-Stokes (RANS) methods, but high-liftperformance and off-design conditions are not. In addition, it is still much too time consuming to generatethe large aerodynamic and stability and control databases using CFD.
2.1 Wind-Tunnel Data Correction
Given that the purpose of wind tunnel testing is to predict the performance and behavior of a vehicle in flight,it is important to make corrections or adjustments to wind tunnel data to account for differences between thewind tunnel and flight environments. These corrections generally fall into two categories. First, it isnecessary to correct the data for the non-ideal flow environment of the wind tunnel created by the tunnelwalls and the mounting system. Second, experimental procedures may be used to simulate higher Reynoldsnumbers than can be achieved in the wind tunnel.
Wind tunnels are normally designed with increasing cross-sectional area through the length of the test sectionto compensate for boundary layer growth on the walls. This compensation is never perfect, so a longitudinalpressure gradient exists in the test section that produces a buoyancy force on the model. Buoyancycorrections are made based on measurements of the empty-tunnel pressure gradient and the streamwisevariation in model cross-sectional area. Stream angle corrections are made to account for errors in flow anglewith respect to the wind-tunnel axis. To assess the stream angle correction, the model is tested upright andinverted. The reference stream angle is the angle that leads to matching lift curves for the two orientations.
The presence of any model in the wind tunnel also creates a local reduction of cross-sectional area, and anassociated increase in local velocity. The effects of the locally elevated dynamic pressure caused by theconstraining effect of the tunnel walls are normally determined by analytical or computational solutions ofpotential flow equations. This so-called blockage correction may in some cases be lumped together with
3
corrections for other wall-induced effects, such as the induced flow angles. The influence of the walls may berepresented by the presence of a system of image vortex and source elements. These elements, in particularthe image vortices, induce a net upwash on the model that leads to spurious reduction of induced drag on themodel. Potential flow models may be used to determine the integrated upwash angle and induced dragincrement associated with the image vortex system. Finally, the model support system may induce non-representative forces and moments on the model that must be corrected, normally by an incremental methodusing alternate or dummy supports. More detailed descriptions of basic wind-tunnel testing procedures andcorrection schemes can be found in the literature.2-5
In order to more closely match flight conditions, the state of the boundary layer on the model must beconsidered. In the case of fully turbulent, attached flow on both the model and the flight vehicle, a simplecorrection can be made for the reduction in skin friction coefficient with increased Reynolds number. Thelower Reynolds number flow on the model however, is generally not fully turbulent. Therefore, the boundarylayer on both the wing and fuselage is tripped using properly located and sized roughness elements.Unfortunately, a tripped, low-Reynolds number boundary layer does not behave the same as one experiencingnatural transition at a higher Reynolds number. This is one of the driving factors in having very highReynolds number test facilities. Various strategies exist for determining where to force boundary layertransition. The most obvious approach is to force boundary layer transition as close to the leading edge aspractical to obtain a fully turbulent condition on the model. In this case, the drag data must be corrected forthe change in skin friction coefficient with Reynolds number, and for the estimated drag of the transitiondevice(s).
Another approach determines the transition location such that the momentum thickness at the trailing edge onthe model matches that expected in flight. This would presumable give the correct drag level directly. Fortransonic transport aircraft, the shock position is strongly affected by boundary layer displacement thickness,and thinner laminar boundary layers may more accurately represent the displacement thickness at flightconditions. In this case, transition would likely be forced just ahead of the shock to avoid any unusual shockinteraction with a laminar boundary layer. Corrections are then applied for the reduced skin friction in thelaminar region as well as for the reduced turbulent drag and for the drag caused by trip devices.
An interesting fall out of the extrapolation issue is that companies tend to use specific wind tunnels forparticular types of testing. This is because the engineers understand how the wall and mounting correctionsare applied and they develop a base of experience with extrapolating measured performance to flightconditions for various airplanes tested in these particular wind tunnels. Moving to different wind tunnelsrequires recalibrating the engineers’ understanding of the data obtained there and increases the uncertainty inusing the data.
2.2 Other Extrapolation Issues
Once wind-tunnel data have been corrected to emulate flight conditions (at least to first order), additionalcorrections are still needed to obtain sufficiently accurate performance estimates. These include correctionsfor geometric fidelity (incomplete modeling of airplane details and different aeroelastic deformation of anairplane compared to its corresponding wind-tunnel model), and the non-linear effects of Reynolds numberdifferences. Of these two general effects, geometry differences are responsible for the largest uncertainties inextrapolating wind tunnel data.
For cruise configurations, geometry corrections are made using both CFD and empirical methods. Forexcrescence drag in cruise, empirical methods are very effective. Industry engineers have a great deal ofexperience in accounting for the drag associated with airplane parts and details that are too small to reproduceaccurately at model scale within a realistic budget. Aeroelastic deformation is accounted for by designing themodel in the shape expected for 1-g flight. That means that the off-design conditions (particularly for higherg loadings) will not be measured for exactly the same configuration in the wind tunnel as occurs in flight.CFD can be used to estimate some of the aerodynamic effects of these deformations.
For flight conditions off of the cruise design point where incipient flow separation may exist, extrapolating toflight conditions is much more difficult because of non-linear Reynolds number effects. In particular, it is

4
difficult to extrapolate the margin in lift coefficient above cruise before the onset of buffet, and the change inpitch stability that occurs at that point. At some angle of attack above the cruise condition, some portion ofthe wing begins to experience significant transonic shock-induced separation. The characteristics of sweptwings usually predispose the outboard wing sections to separate first, causing an inboard, and thus forwardshift of the aerodynamic center. This forward shift is associated with an undesirable loss of pitch stability.Naturally it is paramount to know how severe this behavior is, and at what point it occurs.
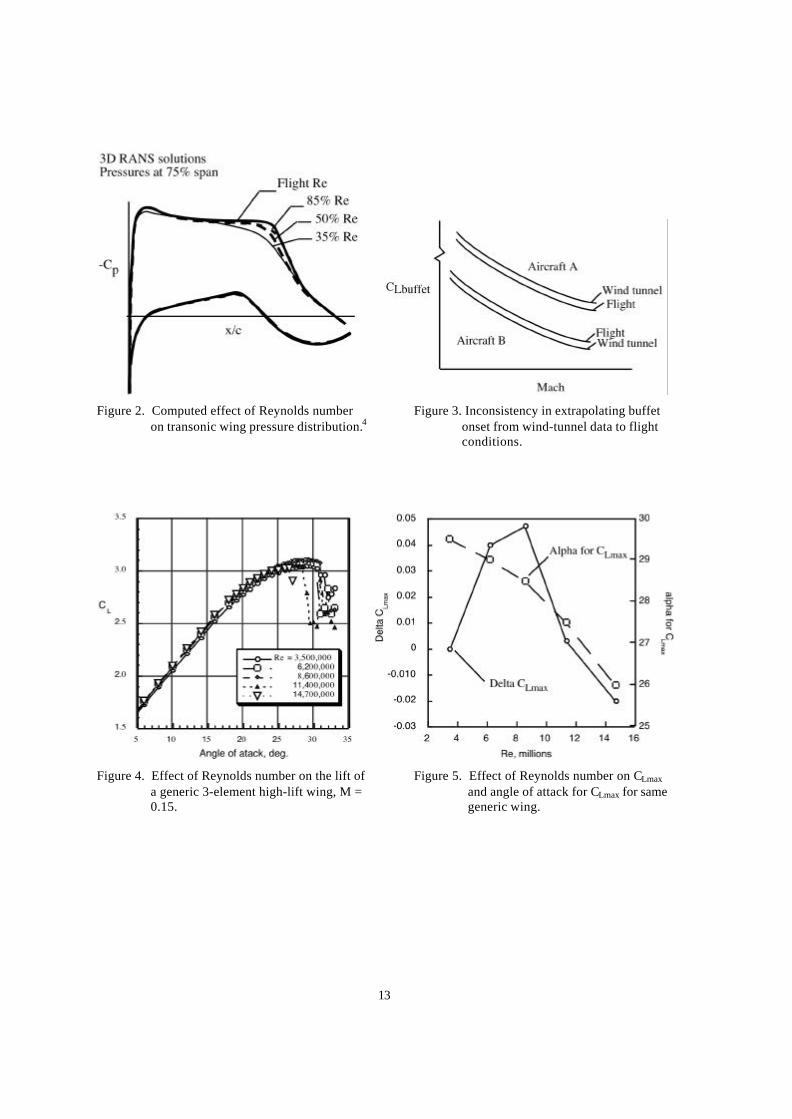
The complex shock-boundary layer interactions involved in buffet onset are highly sensitive to Reynoldsnumber. The sensitivity of shock location and strength to Reynolds number is shown in figure 2. These arecomputed pressure distributions from Goldhammer and Steinle4 that show an increase in shock strength withincreasing Reynolds number. The increase in adverse pressure gradient associated with Reynolds numbercould lead to earlier onset of buffet than expected if testing were performed at less than 50% of flightReynolds number. The difficulty in extrapolating buffet onset to flight conditions is notionally illustrated infigure 3. The lift coefficient (CL) for buffet onset as a function of Mach number is shown for two differentairplanes. Included are curves for both the wind tunnel results and flight. Note that the extrapolation has adifferent sign for these two aircraft and the designers must know what causes this difference in behavior inorder to avoid surprises.
CFD methods are emerging as a useful approach for determining and correcting for the influence of Reynoldsnumber on buffet onset. Confident application of CFD to this problem requires extensive experimentalvalidation and perhaps more importantly, detailed flow diagnostic measurement of turbulence and separationcharacteristics.
As uncertain as the picture is for buffet onset, it is even more uncertain for high-lift flight regimes. There aremany more complex and interacting flow features for high-lift configurations than for cruise (figure 1). Inaddition, high-lift performance is very sensitive to the rigging of the flaps and slats relative to theirneighboring elements. Because of this sensitivity, the brackets used to hold the slats and flaps on wind-tunnelmodels must be extremely stiff – often requiring that they be larger than would be given by physical scalingof the model. For example, the slat tracks on a particular transport aircraft are on the order of 4 cm wide. Ona 4.2% model of the airplane that was tested in a pressurized low-speed wind tunnel, the large aerodynamicloading required slat brackets that would scale to nearly 8 cm wide on the airplane. The wider slat bracketsshed larger wakes over the main element and flap which reduces the maximum lift of the model relative tomore accurately sized brackets. Another concern for high-lift models is that the flap and slat elementsthemselves are not stiff enough to resist bending under load during testing, resulting in gap variations acrosstheir spans that are not representative of what is found on the actual airplane. These aeroelastic deformationsof the model add uncertainty to the interpretation of the wind-tunnel data.
The high-lift performance of multi-element airfoils is also very sensitive to Reynolds number. A recentexperiment examined the effect of Reynolds number on the aerodynamic performance of a 3-element high-liftsystem on a generic wing in the 12-Foot Pressure Wind Tunnel at NASA Ames Research Center. The results,for one particular rigging of the single-slotted flap and slat, are shown in figures 4 and 5. Figure 4 shows thelift curves at several Reynolds numbers, from 3.5 to 14.7 million. It is clear that Reynolds number (ordynamic pressure since it varies directly with Reynolds number in this wind tunnel) has an impact on the liftcharacteristics, changing the slope of the curve, the maximum lift, and the angle of attack at stall. Themaximum lift coefficient (CLmax) is a parameter that directly affects the operating cost of an airplane since itlimits the maximum weight. The variations shown in figure 5 are sufficient to cause an airplane to fail inmeeting the manufacturer’s guarantees. Given the variations shown for this range of Reynolds number (anddynamic pressure), it is unclear how to extrapolate to flight conditions (Reynolds number up to 50 million).This is particularly true since the relative importance of Reynolds number and deformation of the modelcannot be easily determined.
New experimental techniques are now available to measure the deformation of models during testing. Themeasurements are done optically either by tracking the motion of markers on the model surface6 or by Moireinterferometry.7 Simply knowing the deformation as a function of Reynolds number doesn’t necessarily

5
clarify the extrapolation issues, but it will allow a more detailed examination of geometry versus flow physicsusing CFD.
To complicate the picture for high-lift, unsteady flows in the region of the slat and flap coves also have astrong influence on the aerodynamic performance and the detailed flow physics.8-10 At this point there areinsufficient data to determine whether the character of the unsteadiness changes with Reynolds number.What is clear is that the current state of the art in CFD does not capture this aspect of the flow over multi-element wings, limiting the use of computational methods in detailed high-lift design.
2.3 Aerodynamic Noise
Another area that is becoming more important in aircraft development is noise. With air traffic increasing atabout 5% per year, many airports are limiting their hours of operation to reduce the noise impact on thesurrounding community. As a result, manufacturers are looking seriously at noise as a market-limitingcharacteristic of new aircraft. While much of the noise is from the engine, the airframe (high-lift devices andlanding gear) is a significant contributor, particularly during approach. Experiments in the 12-Foot PressureWind Tunnel have shown that there is a minimum Reynolds number below which airframe noisemeasurements may be as much as 2dB in error. Figure 6 shows the flap-tip noise sources on a transportaircraft at the same lift conditions for 2 different Reynolds numbers along with the associated spectra. Thisstudy showed that above a chord Reynolds number of approximately 3.5 million, the noise sources do notchange. For this particular model, the lift curves also did not change above 3.5 million. This is a single resultfor a particular high-lift system and wing and may not be universally true. More work is needed to discernthe complete connection between aerodynamics and airframe noise, in particular, the unsteady flowsassociated with multi-element airfoils.
Although rotorcraft issues are mostly outside the scope of this paper, noise is also a significant issue forhelicopter and tiltrotor operations. Blade vortex interaction (BVI) noise that occurs during descending flightcan be very loud and may limit rotorcraft operations at some airports because of community annoyance. Thelocation and strength of the rotor wake relative to the rotor blades are important for BVI noise generation, soproper modeling of BVI intensity and directionality and the evaluation of potential noise reduction schemesrequire that the dynamics and aerodynamics of the rotor are adequately represented. Hence, measurements ofBVI noise are ideally performed on large or full-scale models, which require large testing facilities in order tomeasure noise in the far-field (typically 1-2 rotor diameters). These far field measurements can then be usedto extrapolate to flight/fly-over conditions.12 Dynamically scaled small-scale rotors are also used for BVIinvestigations. The benefit of using small-scale rotors in a large wind tunnel is that far field noisedirectionality can be mapped over a greater area than for a full-scale rotor. In either case, large wind tunnelfacilities with low background noise and anechoic walls are critical for rotorcraft BVI measurements.
2.4 Wind-Tunnel Flow Quality
The observation that different wind tunnels give different answers for the same model and nominal flowconditions has been recognized since the early 1900’s. Bacon and Reid13 summarized the difference incritical Reynolds number for spheres in different wind tunnels. They attributed the differences to thevariations in both mounting system and free-stream turbulence. Several years earlier, Prandtl14 suggested thatthe drag of a sphere be used to characterize the turbulence levels of wind tunnels. For many years, thetransition Reynolds number of a sphere was used as a measure of flow quality in wind tunnels.
As engineers improved the flow quality in wind tunnels, the correlation with sphere drag was insufficient todiscern subtle turbulence effects. Research at DFVLR in the 1980s indicated that aside from turbulenceintensity, the frequency content of the free stream plays a role in causing premature transition.15 That worklooked at boundary-layer transition on a 6:1 prolate spheroid in several low-speed wind tunnels. For higherspeeds, a 10° cone has been used in a similar manner to characterize the influence of free-stream turbulenceon boundary-layer transition. Dougherty and Fisher16,17 provided the most extensive database on the subjectlooking at both wind-tunnel and flight data for the same cone model. Wolf and Laub19 also used a 10° cone ina later study to characterize the flow in a new quiet supersonic wind tunnel.
6
More recently, Watmuff19 showed that transition on a flat plate is extremely sensitive to free-streamdisturbances. In his meticulously run experiment, he found that a flow with nearly immeasurably small non-uniformities in the free-stream still has a large effect on the growth of instability waves in the boundary layer.In this experiment it was not the free-stream turbulence (~0.05% in the axial direction) but the small velocitydefects remaining from screen non-uniformities that affected boundary-layer stability.
This sort of research will help us to understand the effect that free-stream turbulence has on aerodynamicsmeasurements, but will require a long-term commitment in order to connect the fundamental fluid mechanicsto measured aerodynamic performance. Of particular importance are the conditions leading to rapid changescaused by nonlinear viscous effects (e.g. onset of flow separation).
2.5 Arcjet Flow State
For hypersonic flight, one of the most important features to model is the heat transferred to the vehicle. Thearcjet is the best way to simulate that harsh flow environment. Fundamentally, arcjets provide a long duration(10’s of minutes) of high enthalpy flow that simulates the local heating environments expected for high-speedtrans-atmospheric vehicles such as reusable launch vehicles (RLV) and planetary entry probes. The processof generating high enthalpy flows result in a highly energized, supersonic free stream that is very complex inthat it is not in chemical equilibrium and contains gas species in excited states in a frozen flow regime. Thisis not an exact analog for the flight conditions in which the vehicle experiences a strong bow shock generatedin a relatively cold and quiescent atmosphere that is in thermal and chemical equilibrium.
The development of the next generation of reusable launch vehicles will demand significant improvements inNASA’s Thermal Protection System (TPS) technology to achieve the required safety and reliability. TPSdevelopment requires understanding of testing conditions in arcjet flows such as enthalpy, pressure,temperature, velocity, species states, and their distribution within the arcjet flow free stream. Arcjets havebeen primarily used to test heating environments 'local' to TPS test articles. There has been a strong emphasison improving the understanding of the response of TPS materials, especially in areas of energyaccommodation due to surface catalytic recombination, through measurements and modeling analysis.Furthermore, since the arcjets only simulate flight conditions, rather than duplicate them, obtaining'traceablility to flight' has been an issue. There is a need to improve the characterization of arcjet flow fieldsand corresponding CFD modeling.
The challenges of TPS development are even more difficult for ablating TPS materials, since the materialactively participates (and alters) the local flow field around the TPS. In addition to critical needs in improvedarcjet characterization20 and modeling for TPS development, future capabilities are sought which will enablearcjets to be used as aerothermodynamic test facilities for use in sub-scale testing of TPS components andvehicles.
3. CURRENT RESEARCH ACTIVITIES
A great deal of work has been done on improving the understanding of various aspects of aerodynamicspertinent to design and testing. More recently, the experimental research has concentrated on validation ofcomputational methods. These efforts have ranged from idealized model problems to full aircraft geometry.A sampling of these experiments are summarized below. Much of the work cited here was performed atNASA Ames Research Center, but this is not to imply that work in this area is not done elsewhere, just thatthese results were more readily available to us.
3.1 Transonic Buffet Experiment
The discussion above described some of the problems in predicting the onset of buffet either computationallyor experimentally. One study of this subject is that described by Olsen, et al21, which included bothcomputations and experiments to document the current ability of CFD to predict the onset of buffet on arealistic transonic wing. A photo of the model is shown in figure 7. The tests were performed in the HighReynolds Number Channel #2 at NASA Ames Research Center.22 This is a small pressurized wind tunnelthat can run at up to 7 atmospheres and Mach numbers up to 0.9. The maximum Reynolds number for theexperiment was 12 million, i.e. 25-50% of flight values.
7
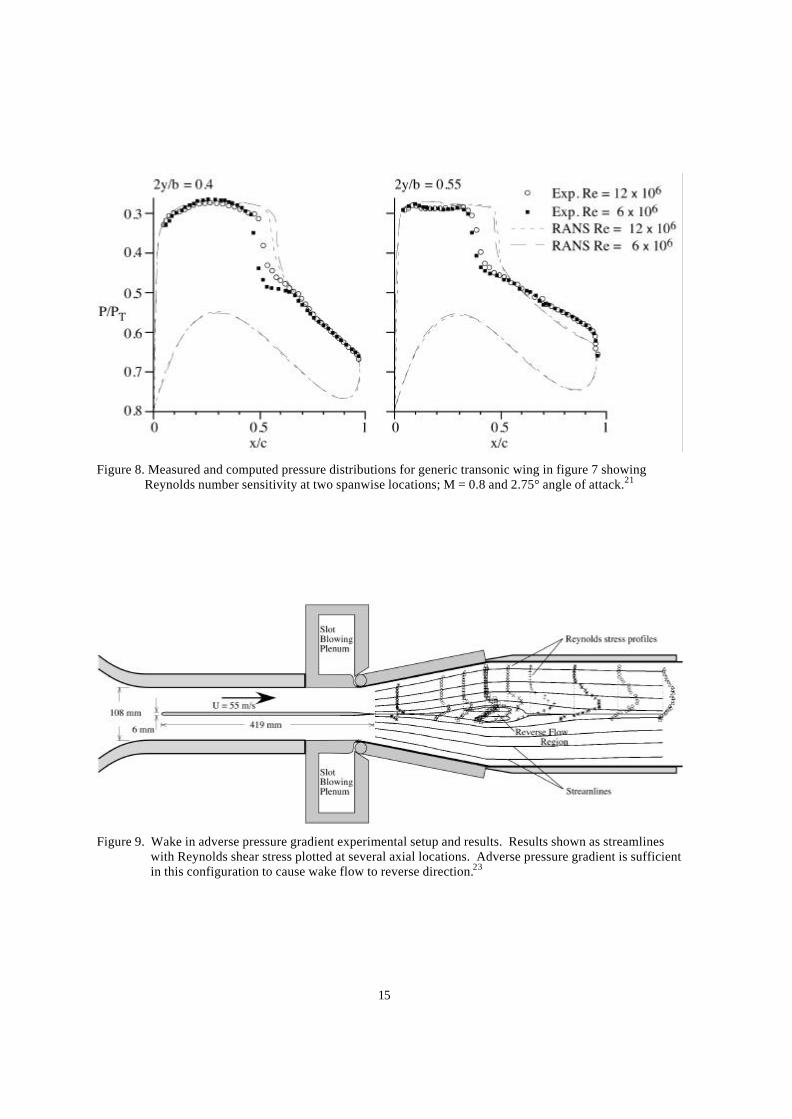
Figure 8 shows the pressure distributions for a condition of shock-induced separated flow. The computedpressures in this case do not match the experiment very well. The computations miss the shock location butthe authors report that the separation point is closely predicted (and that the computations predict attachedflow cases quite well). This indicates that the shape of the separated wake is incorrect, affecting the shocklocation and the resulting loads on the wing. The computations also do not show the same sensitivity toReynolds number as the measurements indicate. The computations clearly are missing some aspect of theflow physics, more than likely it is in the turbulence modeling in the RANS code. Further work is required inthis area including well-coordinated experiments and computations as well as flight experiments, which arenecessary in order to understand buffet onset in the flight environment.
3.2 Wake in Adverse Pressure Gradient
Accuracy of CFD predictions for separated flow fields is a strong function of the accuracy of the turbulencemodel used in such flows. While there has been much improvement in turbulence modeling of separatedflows in the past 15 years (e.g. the use in design codes of models such as Johnson-King, SST(k-ω), andSpalart-Allmaras and other more realistic models) there remains a tendency to under-predict the size of theseparation. Improvements to turbulence modeling are still required and demand high fidelity experiments.Accurate measurements of the turbulent fluctuation correlations (in particular the Reynolds shear stresses) areessential. These data are then used to guide the turbulence modeling effort.
One example of an experiment used to guide turbulence modeling for high-lift aerodynamics is a study of awake in an adverse pressure gradient performed by Driver and Mateer23 in the NASA Ames High ReynoldsNumber Channel #1. Flow behind a splitter plate was made to reverse direction by virtue of the adversepressure gradient induced on the flow by a divergent wall test section (figure 9). This flow is an analog ofwake of the main element encountering an adverse pressure gradient as it passes over a highly deflected flapon a wing configured for landing. Data were obtained with a 2 component LDV system with a 100 microninterrogation volume operating in back scatter and using Fourier transform signal processing. Flow reversalcan be seen in the wake downstream of the splitter plate (figure 9). Superimposed on the streamlines shownin figure 9 are the measurements of the –uv Reynolds shear stress. A rapid growth in the shear stress is seenwith distance along the separation – CFD usually predicts an even faster growth in Reynolds shear stress.These data are currently being used to examine the ability of a number of turbulence models to accuratelyreproduce this flow field.
3.3 PLANAR-DOPPLER VELOCIMETRY EXPERIMENTS
A relatively recently developed optical technique, called Planar Doppler Velocimetry (PDV), is capable ofdetermining instantaneous, three-dimensional velocity vectors of moving particles or solid material in a laserlight sheet everywhere in the field of view.24-27 The measurements depend on directly detecting the Dopplershift in the laser light caused by the relative motion between the reflecting material in the flow and thecamera. PDV holds the promise of being very well suited for use in large wind tunnels in which large areasof the flow field are of interest.
3.3.1 Flap-Tip Vortex
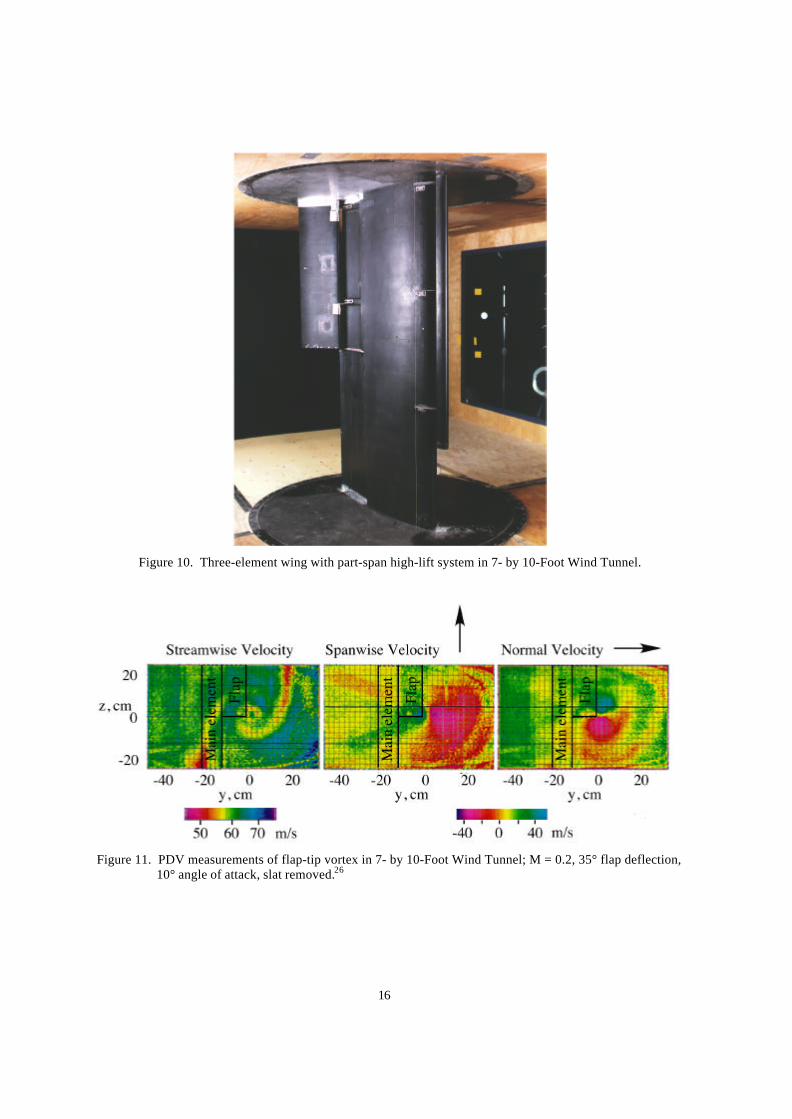
One of the early large wind tunnel applications of the technique was during a study of airframe noise in the 7-by 10-Foot Wind Tunnel at NASA Ames Research Center.28 The model mounted in the wind tunnel is shownin figure 10. It is a modified 2-D, multi-element airfoil arrangement with the flap extending across half thespan. In the photograph, the slat extends across the 75% of the span but it could also extend across the fullspan or removed completely.
Figure 11 shows the 3-component wake measurements ~1 m downstream of the flap tip/trailing edge. In thiscase, the leading edge slat was not present. From left to right, the figure shows the streamwise, spanwise, andnormal velocities. The streamwise velocity contours clearly show the viscous wake from the wing and flaprolling up into the tip vortex. The other two components show the characteristic signature of a vortex.28

8
3.3.2 Rotor wake in Forward Flight
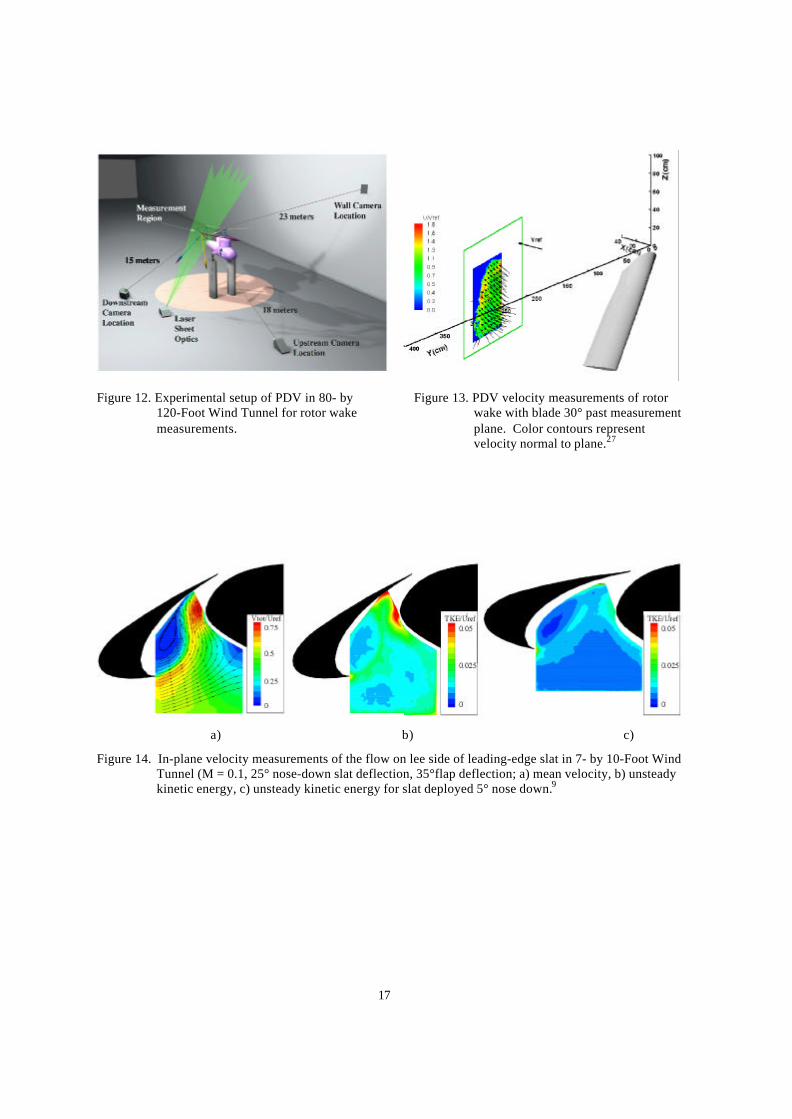
A recently completed experiment in the 80- by 120-Foot Wind Tunnel at NASA Ames Research Centerexamined the wake from a full-scale rotor in forward flight at one azimuthal station.27 Three measurementcameras observing the plane of interest from 3 different angles provided the information necessary todetermine all three components of velocity. The set up for the experiment is shown in figure 12. Oneinstantaneous measurement is shown in figure 13. The color contours indicate the velocity normal to themeasurement plane while the vectors show all 3 components. This proof-of-concept test demonstrated theviability of PDV measurements in the large wind tunnel but further development is needed to generateuniform seeding (particularly in the open return 80- by 120-Foot Wind Tunnel) and to obtain the ~1 m/saccuracy demonstrated in laboratory experiments.
3.4 PARTICLE IMAGE VELOCIMETRY EXPERIMENTS
Particle Image Velocimetry (PIV) is another method of acquiring instantaneous measurements of fluidvelocities in a plane. Small tracer particles are introduced to the flow and short pulse duration, high-poweredlaser light sheets illuminate and freeze the motion of the particles. The positions of the tracer particles arecaptured using a standard photographic lens in conjunction with a digital camera. The displacement of thetracer particles over a short duration of time is used to calculate fluid velocities from two sequential digitalimages. A number of researchers have refined this technique to the point of being practical for use in largewind tunnels.29-31
3.4.1 High-Lift Aerodynamics
One of the aspects of high-lift aerodynamics and noise generation that is least understood is the flow aroundthe lee-side of the leading-edge slat. As shown in figure 1, there is a relatively large area of separated flowwith a reattachment point very close to the slot between the slat trailing edge and the main element leadingedge. This is an area of very large velocity fluctuations and it is also a relatively large noise source. It is alsoresponsible for generating a very unsteady wake downstream of the slat. Hot-wire measurements are difficultto obtain in this area (but have been obtained8,9) because of the large variation in mean-flow direction and theproblems associated with traversing a probe through the region. Optical access for LDV measurements isalso very limited. PIV offers a very attractive (though still challenging) method for obtaining acomprehensive set of data throughout the region of interest.
Figures 14a and b show PIV measurements behind the slat for a Mach number of 0.1, a 25° slat deflection(nose down), and 10° angle of attack.9,31 The model used in this investigation is the same as is shown infigure 10. Only two velocity components were obtained in this experiment, primarily because of the difficultoptical access but also because the spanwise velocity component is small in this region and it is probably notan important component of the unsteady flow. The mean velocities, obtained from an average of 100instantaneous measurements, are shown in figure 14a. The region of recirculating flow is very apparent, as isthe large acceleration of the flow approaching the slat gap. Figure 14b shows a measure of the flowunsteadiness, TKE = (u’ 2 + v’ 2)/U8
2, which gives an indication of where the unsteadiness originates and howit might affect both the mixing of the slat wake over the main element and the noise generated in the slot.Figure 14c shows the contours of the same unsteadiness parameter for a lower slat deflection (5°). The lowerslat deflection increases the aerodynamic load on the slat and the unsteadiness is very much reduced.
A similar experiment was performed in the Basic Aerodynamics Research Tunnel at NASA LangleyResearch Center.10 The focus of that experiment was on the wake of the slat as it passes over the mainelement. The wake was measured using a 2-D PIV system. A different 3-element, 2-D airfoil was used inthis experiment although the shape of the slat was the same as in the previously described study. The sameconclusions were reached concerning the reduction in the wake unsteadiness with increased aerodynamicloading on the slat (angle of attack in this case). Much more work remains in this area if we are to develop afull understanding of the effects of the unsteady shear layers, both in the wake and on the lee-side of a slat,sand to relate these flow features to noise production.

9
3.4.2 Rotor Wake in Hover
The measurement of rotor wake velocities has been performed using a number of techniques, both point-wiseand planar (see PDV measurements above). PIV is another method by which an entire plane of data can beobtained simultaneously. 3D PIV is particularly attractive for this application.
Measurements of a two-bladed rotor on a hover test stand were made using 3D PIV at the Army HoverChamber at NASA Ames Research Center (figure 15)32. Equipped with rectangular-planform NACA 0012blades, the rotor had a diameter of 2.3 meters and a chord of 19.1 cm. With the collective set at –8° and arotor rpm of 870, the tip Mach number was 0.31 and the thrust coefficient was 0.005.
Figure 16 shows one set of instantaneous data of the rotor wake where the first blade is 30° past the laserplane and the second blade is at 210°. Figure 16a shows the in-plane velocity vectors and color contoursindicating the out-of-plane velocity. Figure 16b shows the same data with vorticity shown in the contours.The vortex generated by the blade at 30° is located in the lower left of the plots. The wake from the otherblade is above and to the right of the earlier vortex. The vortex from the second blade shows some distortiondue to the presence of the viscous wake defect. The vorticity plot shows that the strength of the shed vorticesremains relatively constant. Similar experiments have been performed at the Duits-Nederlandse 8- by 6-Meter Wind Tunnel for rotors both in hover and in forward flight.33
Having the ability to resolve an instantaneous plane of velocity data offers the opportunity to performmeaningful time-averaging of unsteady vortex fields. In particular, it is possible to eliminate the smearingeffect that vortex wander has on pointwise measurements. The problem is that a pointwise measurement is ata fixed point in space. If the measurement is near the core of a vortex and the vortex moves randomly relativeto its mean position, the resulting point measurement becomes both a time and spatially averaged quantity(relative to the vortex center). This problem is particularly acute for vortices since the velocity gradients arelarge near the core. Using PIV, the center of the vortex can be determined in every instantaneous velocitymeasurement and both the vortex motion and the instantaneous velocity distribution can be determined. Thecoordinate system can then be tied to the center of the vortex and a meaningful time average of the vortexstructure can be determined.
Tiltrotor aircraft are relatively new in the operational air fleet of the US Marines (V-22) and will soon be partof the civil aviation fleet (Bell 609). The recent crash of a V-22 may have been caused by the so-calledvortex ring mode in which the descent rate is approximately equal to the rotor downwash velocity causing asignificant loss of lift. This is suspected to be a problem only when the forward speed is very low becausevortex ring mode has been observed only at low forward speed on helicopters. The differences in the diskloadings of helicopters and tiltrotors and the substantially larger twist on tiltrotor blades require that furtherexperiments be done to better understand the phenomenon. Another area of interest for tiltrotors andhelicopters is in operating in the wakes of buildings, oil rigs, and ships. Wind-tunnel experiments, both largeand small scale, are currently underway and will play an important role in understanding these problems andpossible design or operational changes to eliminate them. Non-intrusive, laser-based measurements will playa large role in these experiments.
3.4.3 Wake Vortices
One of the hard limits on airport traffic growth is the restriction placed on the spacing of aircraft in theterminal area. The minimum spacing is set to assure that catastrophic encounters with wake vortices do nothappen at altitudes too low to allow safe recovery. There has been a great deal of work in assessing the safetyhazard posed by wake vortices34,35 but so far, no practical ways to reduce the rotational velocities in the wakehave been identified. A number of researchers have recently looked at the physics of aircraft wake roll upwith the intent of finding ways to reduce the hazard. Dieterle, et al36 used PIV to measure the wake generatedby a transport aircraft model in free flight after having been launched from a catapult. Chen, et al37, andBristol, et al38 examined the details of the wake roll up process behind a rectangular wing with a simulatedflap segment. These measurements were made using a 2-D PIV system in a water tow tank. In thisarrangement, the measurement plane remained fixed and the model towed through it and down the channel.The time history of the roll up was recorded from which the 3-D evolution of the wake in the measurement

10
plane was reconstructed. These measurements show details not easily seen in air which may lead to a betterunderstanding of the physics and possible alleviation techniques. Figure 17 shows one such measurement asan iso-surface of vorticity. There is a great deal of interaction between the 4 vortices shed by the wing, whichis very important to the wake-vortex hazard problem and the possibility of alleviation.
4. CONCLUDING REMARKS
In spite of tremendous progress in both CFD and wind tunnel capability, there is still significant risk inextrapolating wind-tunnel results to flight conditions. This places aircraft manufacturers at risk wheneverthey introduce new products. The remaining open issues are in the geometric fidelity of wind tunnel andcomputational models relative to flight vehicles, Reynolds number extrapolation, and effects of wind-tunnelflow quality. Because of the uncertainty in extrapolation, further research is needed in order to understandthe sources of the uncertainty and ways to overcome them. More experimental research is also needed toimprove the predictive capability of CFD methods so that they may be used with confidence in a wider rangeof flight/design conditions. This work will require advanced, non-intrusive measurement techniques in orderto generate the high quality data to gauge computational results against.
Acknowledgements
The contributions of many individuals were essential to assembling the information in this paper. Theauthors extend particular thanks to Dan Bencze, Don Durston, J. T. Heineck, Bob McKenzie, Mike Reinath,Paul Wercinski, and Gloria Yamauchi for their valuable input.
References
1. Mack, M.D. and McMasters, J.H., “High Reynolds Number Testing in Support of Transport AirplaneDevelopment,” AIAA paper 92-3982, 17th AIAA Aerospace Ground Testing Conference, Nashville, TN,July 6-8, 1992.
2. Rae, W. H., Jr. and Pope, A., Low-Speed Wind Tunnel Testing, John Wiley & Sons, New York, 1984.
3. Herriot, J.G.: Blockage Corrections for Three-Dimensional-Flow Closed-Throat Wind Tunnels, withConsideration of the Effect of Compressibility. NACA Report 995, 1950.
4. Goldhammer, M.I. and Steinle, F.W., “Design and Validation of Advanced Transonic Wings Using CFDand Very High Reynolds Number Wind Tunnel Testing,” 17th ICAS Congress, Stockholm, Sweden, Sept.9-14, 1990, Proceedings Vol. 1, AIAA, Inc., Washington DC, 1990, pp. 1028-1042.
5. Ewald, B. F. R. (editor), “Wind Tunnel Wall Correction,” AGARDograph 336, North Atlantic TreatyOrganization, October 1998.
6. Burner, A. W. and Martinson, S. D., “Automated Wing Twist and Bending Measurements UnderAerodynamic Load,” AIAA paper 96-2253, 19th AIAA Advanced Measurement and Ground TestingTechnology Conference, New Orleans, LA, June 1996.
7. Flemming, G. A., Soto, H. L., South, B. W., and Bartram, S. M., “Advances in Projection MoireInterferometry Development for Large Wind Tunnel Applications,” SAE paper 1999-01-5598, 1999SAE/AIAA World Aviation Congress, San Francisco, CA, October, 1999.
8. McGilnley, C. B., Anders, J. B., and Spaid, F. W., “Measurements of Reynolds Stress Profiles on a High-Lift Airfoil,” AIAA paper 98-2620, 16th AIAA Applied Aerodynamics Conference, Albuquerque, NM,June 1998.
9. Moriarty, P. J., Unsteady Measurements of a Three-Dimensional High-Lift System, PhD Dissertation,Stanford University, May 2000.
10. Paschal, K., Jenkins, L., and Yao, C., “Unsteady Slat-Wake Characteristics of a High-LiftConfiguration,” AIAA paper A00-16070, 38th AIAA Aerospace Sciences Meeting & Exhibit, Reno, NV,January 10-13, 2000.
11
11. Hayes, J., Horne, W., Jaeger, S., and Soderman, P., “Measurements of Reynolds Number Effect onAirframe Noise in the 12-Foot Pressure Wind Tunnel,” AIAA paper 99-1959, 5th AIAA/CEASAeroacoustics Conference, Seattle, WA, May 10-12, 1999.
12. Signor, D. B., Watts, M. E., Hernandez, F. J., and Felker, F. F., “Blade-Vortex Interaction Noise: AComparison of In-Flight, Full-Scale and Small-Scale Measurements,”
13. Bacon, D.L. and Reid, E.G., “The Resistance of Spheres in Wind Tunnels and in Air,” NACA ReportNo. 185, Ninth Annual Report of the National Advisory Committee for Aeronautics - 1923, GovernmentPrinting Office, Washington DC, 1924.
14. Prandtl, L., “Der Luftwiderstand von Kugeln,” Nachr. D. K. Ges. D. Wissensch, Gottingen, Math. phys.Kl., 1914, p. 177.
15. Meier, J. U., Michel, U., and Kreplin, H.-P., “The Influence of Wind Tunnel Turbulence on the BoundaryLayer Transition,” Perspectives in Turbulence Studies, Springer– Verlag, Heidelberg, Germany, 1987.
16. Dougherty, N.S. and Fisher, D. F., “Boundary Layer Transition on a 10-Degree Cone: WindTunnel/Flight Data Correlation,” AIAA Paper 80-0154, 18th AIAA Aerospace Sciences Meeting,Pasadena, CA, January 1980.
17. Fisher, D. F. and Dougherty, N. S., “In-Flight Transition Measurement on a 10° Cone at Mach Numbersfrom 0.5 to 2.0,” NASA TP-1971, June 1982.
18. Wolf, S. W. D. and Laub, J. A., “NASA Ames Laminar Flow Supersonic Wind Tunnel (LFSWT) Testsof a 10° Cone at Mach 1.6,” NASA TM-110438, March 1997.
19. Watmuff, J.H., “Detrimental Effects of Almost Immeasurably Small Freestream NonuniformitiesGenerated by Wind-Tunnel Screens,” AIAA Journal, Vol. 36, No. 3, pp 379-386, March 1998.
20. Fletcher, D. G. and Bamford, D. J., “Arcjet Flow Characterization Using Laser-Induced Fluorescence ofAtomic Species,” AIAA Paper No. 98-2458, 7th AIAA/ASME Joint Thermophysics and Heat TransferConference, 1998.
21. Olsen, M.E., Driver, D.M., Shairer, E.T., and Naughton, J., “The ROCK (AST-1) Wing: Design,Experiment, and Computation,” AIAA Paper 2000-0670, AIAA 38th Aerospace Sciences Meeting andExhibit, Reno, NV, January 10-13, 2000.
22. McDevitt, J. B., Poleck, T. E., and Hand, L. A., "A New Facility and Technique for Two-DimensionalAerodynamic Testing,” Journal of Aircraft, Vol. 20, No. 6, 1983, pp. 543-551.
23. Driver, D. M. and Mateer, G. M., “Wake Flow in an Adverse Pressure Gradient,” to be presented at theSAE/AIAA World Aviation Congress, San Diego, CA, Oct. 10-12, 2000
24. Meyers, J. F., “Doppler Global Velocimetry. The Next Generation?,” AIAA 91-0337, 29th AIAAAerospace Ground Testing Conference, Nashville, TN, January 6-8, 1992.
25. Elliott, G. S. and Beutner, T., J., “Molecular Filter Based Planar Doppler Velocimetry,” Progress inAerospace Sciences, Pergamon Press, Vol. 35, 1999, pp. 799-845.
26. Reinath, M. S., “Doppler Global Velocimeter Development for Large Wind Tunnels,” accepted forpublication in Institute of Physics Journal of Measurement Science and Technology.
27. McKenzie, R.L. and Reinath, M.S., “Planar Doppler Velocimetry Capabilities at Low Speeds and ItsApplication to a Full-Scale Rotor Flow,” AIAA Paper No. 2000-2292, 21st AIAA AdvancedMeasurement Technology and Ground Testing Conference, Denver, CO, June 19-22, 2000.
28. Storms, B. L., Hayes, J. A., Ross, J. C., and Moriarty, P. J., “Aeroacoustic Measurements of Slat Noiseon a Three-Dimensional High-Lift System,” AIAA Paper 99-1957, 5th AIAA/CEAS AeroacousticsConference, Seattle, WA, May 1999.
12
29. Adrian, R. J., “Particle-Imaging Techniques for Experimental Fluid Mechanics,” Annual Review of FluidMechanics, Vol. 23, pp. 261-304, 1991.
30. Hoffman, J. M., Arnette, S. A., Porter, C. B., Sung, B., and Arik, B. E., “Application of Particle ImageVelocimetry in the Korea Aerospace Research Institute Low Speed Wind Tunnel,” AIAA Paper A 00-16309, 38th AIAA Aerospace Sciences Meeting & Exhibit, Reno, NV, January 10-13, 2000.
31. Moriarty, P. J. and Heineck, J. T., “PIV Measurements Near a Leading-Edge Slat,” Proceedings of theThird International Workshop on PIV, Santa Barbara, CA, Sept. 16-18, 1999.
32. Heineck, J., Yamauchi, G., Wadcock, A., and Lourenco, L., and Abrego. A., “Application of Three-Component PIV to a Hovering Rotor Wake,” AHS Forum 56, Virginia Beach, VA, May 2000.
33. Yamauchi, G. K., Burley, C. L., Mercker, E., Pengel, K., and JanakiRam, R., “Flow Measurements of anIsolated Model Tilt Rotor,” AHS paper presented at AHS 55th Annual Forum, Montreal, Canada, May25-27, 1999.
34. Rossow, V. J., “Lift-Generated Voprtex Wakes of Subsonic Transport Aircraft,” Progress in AerospaceSciences, Vol. 35, No. 6, pp. 507-660, Aug. 1999.
35. Spalart, P. R., “Airplane Trailing Vortices,” Annual review of Fluid Mechanics, Vol. 30, pp. 107-138,1998.s
36. Dieterle, L, Ehrenfried, K., Stuff, R., Scheider, G., Coton, P, Monnier, J. C., and Lozier, J. F,Quantitative Flow Field Measurements in a Catapult Facility Using Particle Image Velocimetry,” Proc.Of the 18th International Congress of Instrumentation in Aerospace Simulation Facilities (ICIASF),Toulouse, France, pp. 1.1-1.10, June 21-24, 1999.
37. Chen, A. L., Jacob, J. D., and Savas, Ö., “Dynamics of Corotating Vortex Pairs in the Wakes of FlappedAirfoils,” Journal of Fluid Mechanics, Vol. 382, 155-193, 1999.
38. Bristol, R., Ortega, J., and Savas, Ö., “ A towing tank study of airfoil wake vortices at Re of order 10^5,”AIAA Paper 99-3419, 1999
Figure 1. Flow physics associated with Reynolds number sensitive aerodynamics.1
13
Figure 2. Computed effect of Reynolds numberon transonic wing pressure distribution.4
Figure 3. Inconsistency in extrapolating buffetonset from wind-tunnel data to flightconditions.
Figure 4. Effect of Reynolds number on the lift ofa generic 3-element high-lift wing, M =0.15.
Figure 5. Effect of Reynolds number on CLmax
and angle of attack for CLmax for samegeneric wing.

14
Figure 6. Effect of Reynolds number on airframe noise. Color contours are sound pressure levels at 15 kHzmeasured using a phased microphone array. The spectrum was obtained by integrating the sourcelevels at each frequency.11
Figure 7. Photograph of the generic transonic wing in High-Reynolds number Channel #2. Darker patchesare from oil film; the spacing of dark and light areas of oil indicate the level of skin friction.Spanwise locations noted are where data was taken in following figure.
15
Figure 8. Measured and computed pressure distributions for generic transonic wing in figure 7 showingReynolds number sensitivity at two spanwise locations; M = 0.8 and 2.75° angle of attack.21
Figure 9. Wake in adverse pressure gradient experimental setup and results. Results shown as streamlineswith Reynolds shear stress plotted at several axial locations. Adverse pressure gradient is sufficientin this configuration to cause wake flow to reverse direction.23
16
Figure 10. Three-element wing with part-span high-lift system in 7- by 10-Foot Wind Tunnel.
Figure 11. PDV measurements of flap-tip vortex in 7- by 10-Foot Wind Tunnel; M = 0.2, 35° flap deflection,10° angle of attack, slat removed.26
17
Figure 12. Experimental setup of PDV in 80- by120-Foot Wind Tunnel for rotor wakemeasurements.
Figure 13. PDV velocity measurements of rotorwake with blade 30° past measurementplane. Color contours representvelocity normal to plane.27
a) b) c)
Figure 14. In-plane velocity measurements of the flow on lee side of leading-edge slat in 7- by 10-Foot WindTunnel (M = 0.1, 25° nose-down slat deflection, 35°flap deflection; a) mean velocity, b) unsteadykinetic energy, c) unsteady kinetic energy for slat deployed 5° nose down.9

18
Figure 15. 3DPIV set up for measuring rotor wake in hover.
a) b)Figure 16. Instantaneous velocity vectors in the measurement plane. Color contours show: a) normal
velocity, b) out of plane vorticity.32

19
Figure 17. PIV measurements of wake vortex development behind simplified wing with a flap. Iso-surfaceof vorticity. Data corresponds to a distance from 0 to 100 spans aft of the wing. Merging of theco-rotating tip/flap vortex pairs after one orbit is clearly evident.38