wind pressures on low-slope roofs: asce 7-16 standard and … · is keyed to asce/sei 7-16, has...
TRANSCRIPT
Wind Pressures on Low-Slope Roofs: ASCE 7-16 Standard and Fourth
Edition of RCIF MonographStephen Patterson, RRC, PE
Roof Technical Services, Inc.1944 Handley Drive, Fort Worth, TX 26112
Phone: 817-233-9450 • E-mail: [email protected]
and
Madan Mehta, PEUniversity of Texas at Arlington
601 West Nedderman Drive, Arlington, TX 76019Phone: 817-272-2801 • E-mail: [email protected]
R C I I n t e R n a t I o n a l C o n v e n t I o n a n d t R a d e S h o w • M a R C h 1 4 - 1 9 , 2 0 1 9 P a t t e R S o n a n d M e h t a • 1 7 5

Abstract
The standard published by the American Society of Civil Engineers (ASCE) and the Structural Engineering Institute (SEI), titled Minimum Design Loads and Associated Criteria for Buildings and Other Structures, is used for designing building structures and their com-ponents. The standard is revised periodically. Its latest revision, which was scheduled for publication in 2016, became available in 2017 and is known as ASCE/SEI 7-16. The next edition of the monograph is scheduled for 2022.
ASCE/SEI 7-16 contains a number of revisions in the wind load chapters of the stan-dard. This presentation examines these revisions and how they impact low-slope roof assem-bly design in resisting wind uplift. It also describes wind uplift design of roof assemblies in accordance with ASCE 7-16, with several illustrative examples.
As the fourth edition of the RCIF monograph Wind Pressures on Low-Slope Roofs, which is keyed to ASCE/SEI 7-16, has just been published and is available for purchase, this pre-sentation addresses the topics covered in the monograph, with particular focus on the fun-damentals of wind uplift on low-slope roofs. The use of wind pressure tables included in the monograph, which allow the selection of wind pressure values without detailed calculations and converting them to FM Global wind uplift ratings, is explained. The paper examines the use of ultimate strength design-safety provisions in wind uplift design of roof assemblies in place of the commonly used allowable stress design provision.
Speakers
Stephen Patterson, RRC, PE – Roof Technical Services, Inc. – Fort Worth, TX
STEPHEN L. PATTERSON is a licensed engineer and Registered Roof Consultant with more than 40 years of experience in the roofing industry. Patterson has been director of engineering/technical director of two roofing manufacturers, general manager of a roofing contracting company, and, for the past 34 years, has been a consulting engineer/roof consultant. Patterson has coauthored Roof Design and Practice (published by Pearson Inc.), Drainage Design (published by the RCI Foundation), and Wind Pressures on Low-Slope Roofs (published by the RCI Foundation), as well as a number of other technical papers and articles on roofing.
Madan Mehta, PE, PhD – University of Texas at Arlington – Arlington, TX
MADAN MEHTA is a professor of architecture at the University of Texas at Arlington. A licensed professional engineer (in Texas), and member of the American Society of Civil Engineers, he has worked in India, Australia, the United Kingdom, Saudi Arabia, and the United States. Dr. Mehta is the author of several full-length books, a num-ber of monographs, and research papers on architectural engineering (particularly on roofing). His 1000-page book on Building Construction, published by Pearson Inc., is one of the two most widely used books by practicing architects, students of architecture, and construction engi-neers in North America.
1 7 6 • P a t t e R S o n a n d M e h t a R C I I n t e R n a t I o n a l C o n v e n t I o n a n d t R a d e S h o w • M a R C h 1 4 - 1 9 , 2 0 1 9
The standard published by the Structural Engineering Institute (SEI) of the American Society of Civil Engineers (ASCE), titled Minimum Design Loads and Associated Criteria for Buildings and Other Structures, is used for designing buildings and other structures. The standard is revised periodi-cally to keep abreast of the developments in this important field because the determina-tion of loads on a building is fundamental to ensuring the building’s safety and per-formance.
Various editions of this standard, des-ignated as the ASCE/SEI 7 standard (but commonly known as ASCE 7) are distin-guished from each other by a two-digit number at the end of each designation, which refers to the year of the standard’s revision. For example, ASCE 7-98 stan-dard implies that it was revised in 1998. Similarly, ASCE 7-10 implies the standard’s revision occurred in 2010.
The current edition of the standard was released in March 2017 but is designated as ASCE 7-16 standard because the target year for its release was 2016. The revision immediately preceding 2016 was in 2010, called ASCE 7-10 standard. The next revi-sion of the standard is targeted for 2022, to be known as ASCE 7-22 standard.
An ASCE 7 standard is a comprehensive document that deals with all types of loads, such as dead loads, live loads, rain loads, snow loads, wind loads, seismic loads, and so on. Its revision is accomplished through a transparent, consensus-based process by a group of ASCE 7 committees, where each committee is composed of experts and stakeholders for a particular load type. The most important part of the ASCE 7-16 stan-dard of interest to roofing professionals is that related to wind pressures on roofs. This part is covered in the wind load chapters of the standard.
ROOFING ASSEMBLY AS PART OF COMPONENTS AND CLADDING (C&C) IN ASCE 7 STANDARD
In dealing with wind pressures on build-ings, it is important to distinguish between wind pressures on individual building com-
ponents and the building as a whole. A building is an assemblage of its components that are connected together with nails, screws, bolts, welds, adhesives, and so on. For safety and performance reasons, each component must have the necessary strength to resist the design wind pressure.
In addition to each component having sufficient strength, the building as a whole must also be adequately strong to resist wind loads. Even if all components of the building are strong against wind, the build-ing as a whole may not be. For example, wind may cause a building to become skewed in shape (rack), slide, or overturn as a whole, without causing any or major failure of its components.
The wind resistance of a building as a whole is provided by the structural inter-action between its vertical and horizontal assemblies (walls, structural frame, floor, and roof diaphragms) that work collectively as a system to provide the required strength and stability to the building while transfer-ring all loads to the ground. ASCE 7 stan-dard refers to this structural system as the main wind-force resisting system (MWFRS).
The elements of the building that receive wind pressure directly and transfer it to MWFRS, such as roof deck, insulation, cover board, fasteners, adhesive beads, etc., are referred to as components and cladding (C&C). Note that some elements, though loaded individually as C&C, can also be part of MWFRS, if they are part of a vertical or horizontal diaphragm, such as the roof deck or roof joists as part of the roof diaphragm.
The two of the six chapters in the wind load section of ASCE 7 relevant to wind-resistant roofing design are Chapter 26 (General Wind Load Requirements) and Chapter 30 (Wind Loads on Components and Cladding). Chapters 27 to 29 deal with MWFRS, and Chapter 31 with wind tunnel testing.
WHAT THIS PAPER ADDRESSES AND ITS TWO-PART FORMAT
The foregoing discussion briefly under-lines that although a roof assembly is a small part of a building as a whole,
the determination of wind pressures on it requires an understanding of wind–build-ing interaction in addition to some grasp of the structural engineering fundamentals. In fact, a flip through wind load chapters of ASCE 7-16 reveals how complex the subject is, as it deals with such unwieldy topics as the statistical aspects of extreme wind speeds, atmospheric boundary layers, ground roughness, the building’s exposure classification, building envelope types, local topography, building geometry, and so on.
Part One: The complexity just stated is aggravated by periodic revisions of the standard. Therefore, the first part of this paper presents various revisions made in ASCE 7-16 over its previous (ASCE 7-10) version that relate specifically to low-slope roofs. This part also summarizes the pos-sible impact of these revisions on the cur-rent design and construction practices for low-slope roofs.
Part Two: The second part of this paper introduces the fourth edition of the mono-graph, titled Wind Pressures on Low-Slope Roofs published by the RCI Foundation (RCIF). This edition of the monograph is keyed to the ASCE 7-16 version and, hence, it includes all the revisions mentioned in Part One and illustrates their application with several numerical examples.
PART ONE: CHANGES IN ASCE 7-16 FOR LOW-SLOPE ROOFS
One of the major revisions incorporated in wind load chapters of ASCE 7-10 was to reorganize them in six chapters (Chapters 26 to 31) in place of the one-chapter orga-nization in ASCE 7-05 and the standard’s prior versions.1,2 The multiple-chapter orga-nization substantially improved the clarity and accessibility of the provisions. The six-chapter organization of ASCE 7-10 has been retained in ASCE 7-16.3 However, while the standard’s provisions and the commentary were bound in a single volume in ASCE 7-10, they have been separated into two sep-arate volumes in ASCE 7-16. This separation allows simultaneous reading of the provi-sions and commentary for those using the standard’s print version, further improving
Wind Pressures on Low-Slope Roofs: ASCE 7-16 Standard and Fourth Edition of RCIF Monograph
R C I I n t e R n a t I o n a l C o n v e n t I o n a n d t R a d e S h o w • M a R C h 1 4 - 1 9 , 2 0 1 9 P a t t e R S o n a n d M e h t a • 1 7 7
its accessibility. The digital version of the standard, through its website, which can be found at asce7.online, includes several other useful features.
Another helpful (formatting) change in ASCE 7-16 relates to transferring the veloc-ity pressure equation and velocity pres-sure exposure classifications in one chapter (Chapter 26) in place of duplicating the information in four other chapters (Chapters 27 to 30). The changes (from ASCE 7-10 to ASCE 7-16) that impact wind pressures on low-slope roofs are described in the follow-ing sections.
1. Ground Elevation Factor New to ASCE 7-16The wind pressure on building surfaces
is due to the kinetic energy contained in moving air, which is a function of wind speed and the density of air. The density of air, assumed in ASCE 7-10 and all its previ-ous versions, is the one for air at standard temperature and pressure (15°C at mean sea level). The constant (0.00256) in velocity pressure equation is based on air density at sea level. The reduction in air density at higher elevations (and the resulting lower wind pressure) was ignored in all previous versions of ASCE 7.
This fact has been recognized in ASCE 7-16, and a new factor, called ground elevation factor (symbolized by Ke) has been introduced in ASCE 7-16. The factor Ke
modifies the constant 0.00256 so that ASCE 7-16 velocity pressure equation is shown in Equation 1.
qz = 0.00256 Ke Kd Kz Kzt (V2)Equation 1
Where:qz = velocity pressure at height z above
ground in psf;Ke = ground elevation factor; Kd = wind directionality factor; Kz = height and site exposure factor; Kzt is the topography factor; and V = basic wind speed for the site in mph.
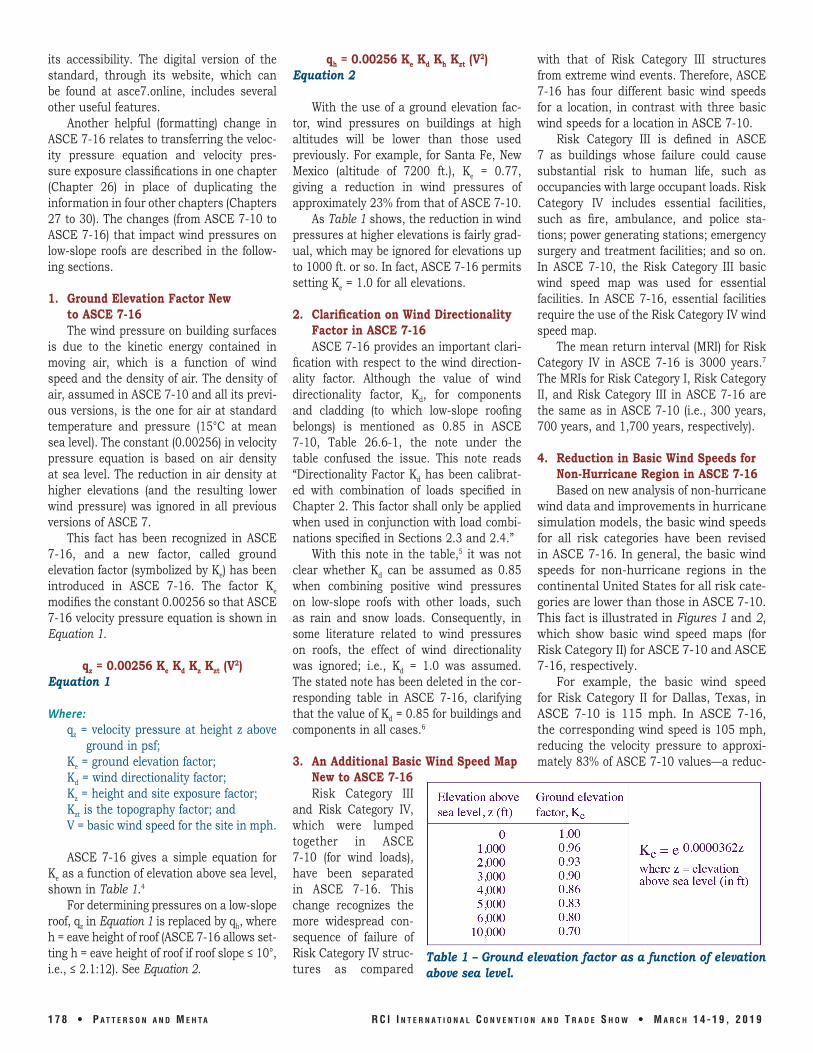
ASCE 7-16 gives a simple equation for Ke as a function of elevation above sea level, shown in Table 1.4
For determining pressures on a low-slope roof, qz in Equation 1 is replaced by qh, where h = eave height of roof (ASCE 7-16 allows set-ting h = eave height of roof if roof slope ≤ 10°, i.e., ≤ 2.1:12). See Equation 2.
qh = 0.00256 Ke Kd Kh Kzt (V2)Equation 2
With the use of a ground elevation fac-tor, wind pressures on buildings at high altitudes will be lower than those used previously. For example, for Santa Fe, New Mexico (altitude of 7200 ft.), Ke = 0.77, giving a reduction in wind pressures of approximately 23% from that of ASCE 7-10.
As Table 1 shows, the reduction in wind pressures at higher elevations is fairly grad-ual, which may be ignored for elevations up to 1000 ft. or so. In fact, ASCE 7-16 permits setting Ke = 1.0 for all elevations.
2. Clarification on Wind Directionality Factor in ASCE 7-16ASCE 7-16 provides an important clari-
fication with respect to the wind direction-ality factor. Although the value of wind directionality factor, Kd, for components and cladding (to which low-slope roofing belongs) is mentioned as 0.85 in ASCE 7-10, Table 26.6-1, the note under the table confused the issue. This note reads “Directionality Factor Kd has been calibrat-ed with combination of loads specified in Chapter 2. This factor shall only be applied when used in conjunction with load combi-nations specified in Sections 2.3 and 2.4.”
With this note in the table,5 it was not clear whether Kd can be assumed as 0.85 when combining positive wind pressures on low-slope roofs with other loads, such as rain and snow loads. Consequently, in some literature related to wind pressures on roofs, the effect of wind directionality was ignored; i.e., Kd = 1.0 was assumed. The stated note has been deleted in the cor-responding table in ASCE 7-16, clarifying that the value of Kd = 0.85 for buildings and components in all cases.6
3. An Additional Basic Wind Speed Map New to ASCE 7-16Risk Category III
and Risk Category IV, which were lumped together in ASCE 7-10 (for wind loads), have been separated in ASCE 7-16. This change recognizes the more widespread con-sequence of failure of Risk Category IV struc-tures as compared
with that of Risk Category III structures from extreme wind events. Therefore, ASCE 7-16 has four different basic wind speeds for a location, in contrast with three basic wind speeds for a location in ASCE 7-10.
Risk Category III is defined in ASCE 7 as buildings whose failure could cause substantial risk to human life, such as occupancies with large occupant loads. Risk Category IV includes essential facilities, such as fire, ambulance, and police sta-tions; power generating stations; emergency surgery and treatment facilities; and so on. In ASCE 7-10, the Risk Category III basic wind speed map was used for essential facilities. In ASCE 7-16, essential facilities require the use of the Risk Category IV wind speed map.
The mean return interval (MRI) for Risk Category IV in ASCE 7-16 is 3000 years.7 The MRIs for Risk Category I, Risk Category II, and Risk Category III in ASCE 7-16 are the same as in ASCE 7-10 (i.e., 300 years, 700 years, and 1,700 years, respectively).
4. Reduction in Basic Wind Speeds for Non-Hurricane Region in ASCE 7-16Based on new analysis of non-hurricane
wind data and improvements in hurricane simulation models, the basic wind speeds for all risk categories have been revised in ASCE 7-16. In general, the basic wind speeds for non-hurricane regions in the continental United States for all risk cate-gories are lower than those in ASCE 7-10. This fact is illustrated in Figures 1 and 2, which show basic wind speed maps (for Risk Category II) for ASCE 7-10 and ASCE 7-16, respectively.
For example, the basic wind speed for Risk Category II for Dallas, Texas, in ASCE 7-10 is 115 mph. In ASCE 7-16, the corresponding wind speed is 105 mph, reducing the velocity pressure to approxi-mately 83% of ASCE 7-10 values—a reduc-
Table 1 – Ground elevation factor as a function of elevation above sea level.
1 7 8 • P a t t e R S o n a n d M e h t a R C I I n t e R n a t I o n a l C o n v e n t I o n a n d t R a d e S h o w • M a R C h 1 4 - 1 9 , 2 0 1 9

tion of 17%. Note that (105/115)2 = 0.83 = 83%, as the velocity pressure is propor-tional to the square of wind speed.
The reduction in wind speed is more pronounced on the West Coast. Thus, while the ASCE 7-10 basic wind speed for San Francisco, California, is 110 mph (for Risk Category II), the corresponding value for ASCE 7-16 is 92 mph. Because (92/110)2 = 0.7, it gives a reduction in velocity pressure of approximately 30%.
For many situations, the reduction in non-hurricane wind speeds in ASCE 7-16 has not resulted in corresponding decrease in wind pressures on low-slope roofs for buildings with roof height ≤60 ft. because of the higher values of external pressure coef-ficients (GCp) introduced in ASCE 7-16, as explained in Section 9 below.
The wind pressure values for low-slope roofs in non-hurricane regions with roof heights >60 ft. have been reduced substan-tially in ASCE 7-16 because the GCp values for such buildings have not changed in ASCE 7-16; i.e., they remain the same as in ASCE 7-10 (see Section 9 below).
5. Changes in Basic Wind Speeds for Hurricane-Prone Regions in ASCE 7-16The definition of a hurricane-prone
region in ASCE 7-16 remains the same as in ASCE 7-10; i.e., it is the region on the U.S. Atlantic Ocean and the Gulf of Mexico coasts where the basic wind speed for Risk Category II is greater than 115 mph. This region also includes the islands of Hawaii, Puerto Rico, Guam, the Virgin Islands, and Samoa. ASCE 7-16 wind speed contours in hurricane-prone regions of the continental U.S. are geometrically similar to those in ASCE 7-10, as shown in Figures 1 and 2. However, ASCE 7-16 contours have shifted
slightly outward (toward the Atlantic Ocean) for the continental U.S. for some locations. Consequently, the land mass covered by the hurricane-prone region has contracted a little.
This has resulted in a small reduction in basic wind speeds of some locations along the Atlantic Ocean as compared with those in ASCE 7-10, while for the other locations, the basic wind speeds have not changed. For example, the basic wind speed for Boston, Massachusetts, in ASCE 7-10 (Risk Category II) is 128 mph, while that in ASCE 7-16 is 120 mph. For Miami, Florida, ASCE 7-16 basic wind speed is the same as for ASCE 7-10—170 mph.
The outward shifting of hurricane wind speed contours (in some locations of the continental U.S.) has resulted in a few locations shifting from the hurricane-prone region into a non-hurricane-prone region. For example, for Tallahassee, Florida, ASCE 7-10 basic wind speed for Risk Category II
was 118 mph, which places it in the hurri-cane-prone region. The corresponding value for ASCE 7-16 is 114 mph, placing it in the non-hurricane-prone region.
This change has implications on the use of aggregate-surfaced roofs, as the 2018 IBC (and its previous versions) imposes a blan-ket ban on the use of aggregate-surfaced roofs in a hurricane-prone region.8 In a non-hurricane-prone region, there is no blanket ban, but the IBC restricts the use of such roofs above a certain roof height (Figure 3).
R C I I n t e R n a t I o n a l C o n v e n t I o n a n d t R a d e S h o w • M a R C h 1 4 - 1 9 , 2 0 1 9 P a t t e R S o n a n d M e h t a • 1 7 9
Figure 1 – ASCE 7-10 basic wind speed map for Risk Category II buildings (with permission of the American Society of Civil Engineers).
Figure 3 – Section 1504.8 of the 2018 International Building Code.
Figure 2 – ASCE 7-16 basic wind speed map for Risk Category II buildings (with
permission of the American Society of Civil Engineers). Observe the reduction in basic
wind speeds in non-hurricane regions of the continental United States as compared with
those of ASCE 7-10, shown in Figure 1.

6. Effective Basic Wind Speed Maps for the Islands of Hawaii New to ASCE 7-16
Microzoned “effective basic wind speed” maps, not provided in ASCE 7-10, have been added in ASCE 7-16 for the islands of the state of Hawaii for all four risk categories.9 One such map for the island of Kauai for Risk Category II is shown in Figure 4. The effective wind speed refers to the basic wind speed modi-fied by large-scale topographical features lying beyond 650 ft. (200 m) of the building’s location. The provision of the effective wind speed maps is a simplification that allows ignoring the large-scale topographi-cal features because they have been accounted for in the maps. In other words, the topographic factor for such features, Kzt, equals 1.0. Local topography (finer-scale terrain con-ditions), however, must be considered to determine the corresponding value of Kzt.
7. New Website for Location-Specific ASCE 7-16 Basic Wind SpeedsASCE has created a website that gives
location-specific ASCE 7-16 basic wind speeds for all four risk categories. Referred to as the ASCE 7 Hazard Tool, it not only provides ASCE 7-16 basic wind speeds,
but also ASCE 7-10 basic wind speeds and other building loads-related hazard data, such as seismic acceleration, ground snow load, rain load, and so on. At the time of writing this paper, access to basic wind speed data was free of cost from this tool. Its address is https://asce7hazardtool.online/.
8. Building Enclosure Classifications Refined in ASCE 7-16
As wind strikes a build-ing, its enve-lope surfaces are subjected to toward-the-surface pres-sure (positive pressure) or away-from-sur-face (negative pressure; i.e., suction). For a rectangular building with a low-slope roof, the windward wall is subject-ed to positive pressure, while all other walls and a low-slope roof are under negative pres-sure (Figure 5).
As no building can be perfectly airtight (particularly under an extreme wind event), the positive pressure on the windward wall causes the air to enter the building interior through it and exit from the other walls. The infiltrating air pressurizes the building inte-rior, causing outward pressure on the walls and uplift on the roof (Figure 6).
The magnitude of interior pressure is a function of the porosity of the walls of the building. ASCE 7 classifies buildings’ porosity under different types and refers to it as the building’s enclosure classifications. ASCE 7-10 (and the prior versions) had three enclosure classifications: (i) enclosed buildings, (ii) partially enclosed buildings, and (iii) open buildings.
The classification is based on the quan-titative description of the porosity of walls. A simple-to-understand, qualitative interpre-tation of this description, commonly used in day-to-day practice, is given in Figure 7.
The three enclosure classifications of ASCE 7-10 did not cater to multistory park-ing garages. With large openings in all walls, they do not qualify as “enclosed” buildings. They also do not qualify as “open” build-ings because the area of openings in each of their walls is well below the minimum of 80% required to qualify as an “open” build-ing. Because a “partially enclosed” building is essentially one that has large opening(s) in one wall with no (or small) openings in other walls, a multistory parking garage does not belong to this classification either.
Figure 4 – ASCE 7-16 micro-zoned effective basic wind speed map (Risk Category II) for the island of Kauai in Hawaii (with permission of the American Society of Civil Engineers).
Figure 5 – Exterior pressurization of building envelope surfaces by wind.
Figure 6 – Interior pressurization of building spaces by wind.
1 8 0 • P a t t e R S o n a n d M e h t a R C I I n t e R n a t I o n a l C o n v e n t I o n a n d t R a d e S h o w • M a R C h 1 4 - 1 9 , 2 0 1 9

To overcome this deficiency, ASCE 7-16 has added a fourth enclosure classification called “partially open,” shown in Figure 7. The definitions of the three classifications of ASCE 7-10 (enclosed, partially enclosed, and open) have been retained in ASCE 7-16, and the “partially open” classification does not have an independent (quantita-tively specified) definition. It is a default classification so that if a building does not meet the requirements of “enclosed,” “par-tially enclosed,” or “open” classification, it belongs to a “partially open” classification.10
In the absence of the “partially open” classification in ASCE 7-10, did a multistory parking garage not get assigned to any clas-sification? Because the default classification in ASCE 7-10 was the “enclosed” classifica-tion, a parking garage was assigned to the “enclosed” classification.
Figure 7 indicates that in terms of the magnitude of interior pressurization, there is no difference between the “enclosed” and “partially open” classifications. In terms of exterior pressure coefficients, the “enclosed” and “partially open” classifications are also identical. Thus, for all practical purposes, there has been no change in ASCE 7-16 with respect to enclosure classifications except that the type of enclosure classifica-tion for parking garages has been recog-nized as a distinct classification.
9. Low-Slope Roof Pressure Coefficients and Roof Zones RedefinedIn determining wind pressures on low-
slope roof surfaces, ASCE 7 gives the follow-ing equation (see Equation 3):
p = qh (GCp – GCpi)Equation 3
Where:qh = velocity pressure at roof height h,
determined from Equation 2, where h = eave height.
GCp = exterior pressure coefficient, and GCpi = interior pressure coefficient, rep-
resenting interior pressurization.
ASCE 7-16 values for GCpi are given in Table 2.11 Note that they are the same for the “enclosed” and the “partially open” clas-sification.
For GCp values, ASCE 7 divides roofs into two categories based on roof height h:12
1. h ≤ 60 ft.2. h > 60 ft.
No Change in Roof Zones and GCp Values for Roof Height h > 60 ft.
GCp values are not constant over an entire roof area but vary according to roof zone, being highest at roof corners, lower on roof perimeter, and lowest in the field-of-roof. For h > 60 ft., the three roof zones (corner, perimeter, and field-of-roof) are shown in Figure 8. There has been no change in the layout of roof zones or their dimensions from ASCE 7-10 to ASCE 7-16.13 The beneficial effect of a para-pet (3 ft. or high-er) on roof pres-sures, which assumes pres-sures on corners
the same as the perimeter pressures, also remains unaltered in ASCE 7-16.
Major Changes in Roof Zones and GCp Values for Roof Height h ≤ 60 ft.
As a result of the analysis (published in 2014) of an extensive wind tunnel test data database obtained in 2005, the layout of roof zones and their dimensions has been modified substantially from ASCE 7-10 to ASCE 7-16. ASCE 7-16 can have up to four roof zones (corners, perimeter, exterior field-of-roof, and interior field-of-roof) in place of three roof zones in ASCE 7-10. The actual number of roof zones is a function of roof height and its plan dimensions, as shown in Figures 11A and 11B. The dimensions (length and width) of zones are also different in ASCE 7-16.14
A comparison between GCp values of ASCE 7-16 and ASCE 7-10 and the corre-sponding roof zone layouts (for h ≤ 60 ft.) is illustrated in Figure 9. Note that there is an increase in GCp values in ASCE 7-16 over those of ASCE 7-10. The increase has made GCp values (for perimeter and corner in ASCE 7-16) consistent with corresponding GCp values for h > 60 ft. For example, GCp
values for corner and perimeter in ASCE 7-16 (for h ≤ 60 ft.) from Figure 9 are -2.3 and -3.2, respectively. They are exactly the same in ASCE 7-16 for h > 60 ft. (shown in Figure 8).
R C I I n t e R n a t I o n a l C o n v e n t I o n a n d t R a d e S h o w • M a R C h 1 4 - 1 9 , 2 0 1 9 P a t t e R S o n a n d M e h t a • 1 8 1
Figure 7 – Enclosure classifications of ASCE 7-10 and ASCE 7-16.
Figure 8 – Roof zones and GCp values for roof height, h > 60 ft. in ASCE 7-16 (applicable to roofs with a slope ≤ 7°, i.e., ≤ 1.5:12). These have not changed from ASCE 7-10.
Table 2 – GCpi values for various enclosure classifications.

In ASCE 7-10, GCp values for h ≤ 60 ft. (-1.8 and -2.8) were much lower than for h > 60 ft. (-2.3 and -3.2). This used to result in a substantial and an unexplainable abrupt increase in the calculated pressure for a roof height, h = 61 ft. against that of h = 60 ft.
The increase in GCp values in ASCE 7-16 for h ≤ 60 ft. is compensated for by the reduction in wind speeds for most locations in non-hurricane regions. In the case of Dallas, Texas, for example, the field-of-roof pressures have increased in ASCE 7-16 but the corner and perimeter pressures are essentially the same (Figure 10). For instance, ASCE 7-16 pressures for Dallas, Texas, on roof perimeter (for an enclosed building, Exposure B, and h = 60 ft.) is 50.8 psf—just a little higher than ASCE 7-10 pressure of 48.7 psf. For the western United States, where ASCE 7-16 basic wind speeds are much lower than ASCE 7-10 speeds, roof pressures in ASCE 7-16 are lower than ASCE 7-10 pressures (see Example 3 in Section 11).
In hurricane-prone regions, where ASCE 7-16 wind speeds are essentially the same as ASCE 7-10 wind speeds, the pressures for h ≤ 60 ft are higher for all roof zones because ASCE 7-16 wind speeds are the same as in ASCE 7-10, but GCp values have increased (see Example 2 in Section 11 below).
The roof zone layout pattern, shown in
Figure 9 (for h ≤ 60 ft.), leads to five differ-ent possibilities, depending on the relative dimensions of roof height and the plan dimensions of the building, as shown in Figures 11A and 11B. A large roof (com-pared with building height) has all four
roof zones present; smaller roofs may have three zones, two zones, or only one zone. As a major change, it will impact wind design and construction of low-slope roofs sub-stantially for h ≤ 60 ft.15
Beneficial Effect of Roof Parapet ≥3 ft. High Retained in ASCE 7-16
The beneficial effect of a parapet (3 ft. or higher) on roof pressures, which assumes pressures on corners the same as the perimeter pressure, remains unaltered in ASCE 7-16 for all roof heights.
Revision in Velocity Pressure Exposure Coefficient for Roof Height ≤30 ft.
In ASCE 7-10, the velocity pressure exposure coefficient, Kz, for Exposure B and roof height ≤30 ft. was constant. In ASCE 7-16, this has been revised so that the revised values vary with roof height—as they do for Exposure C and Exposure D.
Wind Pressures on Rooftop EquipmentA few other revisions that pertain to
rooftop equipment, including photovoltaic (PV) panels, have been either revised or included for the first time in ASCE 7-16.16
Figure 9 – ASCE 7-10 and ASCE 7-16 roof zones and GCp values for roofs (h ≤ 60 ft.) (applicable to roofs with a slope ≤ 7°, i.e., ≤ 1.5:12).
Figure 10 – A comparison of wind pressure values (enclosed building) for Dallas, Texas, on roofs (h ≤ 60 ft.) of ASCE 7-16 and ASCE 7-10. This illustration takes into account the difference in wind speeds for Dallas, Texas (105 mph for ASCE 7-16 and 115 mph in ASCE 7-10). Note that ASCE 7-16 wind pressures have increased for the field-of-roof but remain almost the same as in ASCE 7-10 for perimeter and corner.
1 8 2 • P a t t e R S o n a n d M e h t a R C I I n t e R n a t I o n a l C o n v e n t I o n a n d t R a d e S h o w • M a R C h 1 4 - 1 9 , 2 0 1 9

PART TWO: ASCE 7-16-BASED RCIF WIND PRESSURE MONOGRAPH
As mentioned at the beginning of this paper, the RCIF publishes a monograph titled Wind Pressure on Low-Slope Roofs. The current (fourth) edition is keyed to ASCE 7-16. It functions as a handbook for roofing professionals as it includes wind pressure tables from which wind pressure values for various roof zones may be read.
In addition to serving as a handbook, the monograph also serves as a primer on wind pressures on low-slope roofs. It pro-vides roofing professionals with a simplified explanation of how wind affects buildings. It covers the fundamentals of wind pressures, wind loads, the difference between ultimate and nominal (allowable stress design) wind pressures, basic wind speed, mean recur-rence intervals of basic wind speed, risk categories, and so on.
The fundamentals covered give roofing professionals a theoretical background so that they are able to comprehend how the monograph tables have been arrived at and apply that information to situations beyond those covered by the tables. It comprises five chapters and a number of appendixes over 160 pages and consolidates all provi-sions of ASCE 7-16 applicable to low-slope roofs in a single publication.
10. Wind Pressure Tables in RCIF MonographThe tables have been formulated for three
(out of four) building enclosure classifications: 1. Enclosed2. Partially open3. Partially enclosed
“ E n c l o s e d ” and “partially open” classifica-tions are grouped together because their GCp and GCpi
values are identical. The “open” enclosure classification (all
walls ≥ 80% open) is not included in the tables because of its rarity, but it is covered in the monograph. The basic wind speeds included in the tables are 85 mph to 210 mph in steps of 5 mph (i.e., 85 mph, 90 mph, 95 mph, etc., to 210 mph). This covers all possible wind speeds for the U.S. and its territories. Note that the basic wind speeds in the tables are ultimate wind speeds. Therefore, the resulting wind pressures on a roof are ultimate pres-sures.
Local topography, ground elevation fac-tor, and effect of a parapet are not included in the tables. In other words, Kzt = 1.0, Ke = 1.0 and parapet is assumed to be absent or
< 3 ft. high. If the site’s topography requires its consideration, reference to the relevant monograph appendix is required. If ground elevation is to be considered, its value can be obtained from Table 1.
To read the values of wind pressure on a roof, a roofing professional needs the following information:
1. Basic wind speed for the location, which can be obtained accurately from the website mentioned in Section 7.
2. Building’s enclosure classification: enclosed building, partially enclosed building, partially open building, or open building.
3. Site exposure: B, C, or D.
A partial snapshot (for roof height, h up to 80 ft.) of a typical monograph table is shown in Figure 12. An actual table extends to h = 500 ft. As previously mentioned, table values give ultimate pressures (Pult), which implies that the load factor of 1.6 (applied separately
R C I I n t e R n a t I o n a l C o n v e n t I o n a n d t R a d e S h o w • M a R C h 1 4 - 1 9 , 2 0 1 9 P a t t e R S o n a n d M e h t a • 1 8 3
Figure 12 – A snapshot of a part of a typical monograph table. Note that while this table ends at h = 80 ft., the monograph tables extend to h = 500 ft.
Figure 11A – Five possible roof zone layout patterns based on ASCE 7-16 for h ≤ 60 ft. shown in Figure 9. Three patterns are shown here and the other two in Figure 11B.
Figure 11B – Five possible roof zone layout patterns based on ASCE 7-16 for h ≤ 60 ft. shown in Figure 9. Two patterns are shown here and the other three in Figure 11A.

in ASCE 7-10) is embedded in the ultimate pressures of ASCE 7-16, as further explained in Section 12.
Wind Pressures for Roof Height and Wind Speed and Other Than Table Values
A simple interpolation between adjacent roof heights in a table is acceptable if the roof height of the actual building is differ-ent from those included in the table. The same applies to wind speed. For example, if the wind speed for a location is 113 mph, one can obtain the values by averaging the values from the tables for 110 mph and 115 mph. But if a precise estimate of pressures is needed, it can be obtained from any table for the given enclosure classification.
For example, Figure 10 gives ASCE 7-16 pressures for wind speed, V = 105 mph (“enclosed” building). This table can be used to obtain uplift pressure for V = 160 mph (“enclosed” building) by simply multiplying the pressures shown in the table for V = 105 mph to obtain the values for V = 160 mph. The multiplier = (160/105)2 = 2.322.
For example, the perimeter pressure given in Figure 10 (V = 105 mph) for h = 50 ft. and Exposure B = 48.2 psf. The corresponding pressure for 160 mph = 48.2(2.322) = 111.9 psf. In Figure 12, this value is 112.0 psf. The difference between 111.9 psf and 112.0 psf is due to the round-ing off in the table values and the multiplier.
11. Wind Pressure Calculations on a Roof From First PrinciplesMost roofing professionals will use the
monograph as a handbook to read wind pressure values from the tables. In some situations, however, calculating wind pres-sures from basic fundamentals and using ASCE 7-16 provisions may become neces-sary. To serve that end, the monograph includes a step-by-step procedure with sev-
eral examples explaining the procedure’s use. A few examples given in the monograph are presented here.
Example 1 Using the step-by-step procedure, deter-
mine the ultimate wind uplift pressures per ASCE 7-16 on the roof of a two-story office building in downtown Galveston, Texas, which measures 80 x 80 ft. in plan. The roof is a low-slope roof (roof pitch ≤ 1.5:12), and the roof’s eave height is 30 ft. (Figure 13). Glazed fenestration has been designed to be impact resistant and safe against failure from wind pressure. Assume Kzt = 1.0.
Solution Step 1. Office building belongs to Risk
Category II (explained in the monograph).Step 2. From the ASCE 7 website
(https://asce7hazardtool.online), the basic wind speed for downtown Galveston, Texas, V, for Risk Category II building per ASCE 7-16 = 150 mph.
Step 3. Exposure category of site is B (downtown area).
Step 4. h = 30 ft.
Step 5. Kh = (2.01)[30/1200](2/7) = 0.7006; the algebraic form of this expression is from ASCE 7-16 and included in the monograph.
Step 6. Kzt = 1.0 (given).Step 7. Ke = 1.0 (Galveston is at sea
level).Step 8. Kd = 0.85 (see Section 2).Step 9. qh = 0.00256(Kh)(Kzt)(Ke)(Kd)(V)2
(From Equation (2))= 0.00256(0.7006)(1.0)(1.0)(0.85)(150)2
= 34.3 psf.Step 10. Galveston, TX lies in a wind-
borne debris region (because basic wind speed for Risk Category II > 140 mph). However, because the glazing is impact resistant and safe against wind pressure, we bypass this step and go to Step 11.
Step 11. Because the glazing is impact resistant and safe against breakage by wind pressure, it is classified as “non-opening.” Hence, the building’s enclosure classification is “enclosed.” (Note that ASCE 7 requires that a glazing below 60 ft. in a windborne region must be impact resistant. If the glazing were not impact resistant, it would be considered as having openings and the building would be classified as a “partially enclosed.”)
Step 12: h = 30 ft. (< 60 ft.). Therefore, from Figure 9:
GCp (field-of-roof—interior) = -0.9 GCp (field-of-roof—exterior) = -1.7 GCp (perimeter) = -2.3 GCp (corner) = -3.2Step 13. GCpi = 0.18 (Table 2)Step 14. Since no information is provid-
ed about roof parapet, we will assume that the parapet height is < 3 ft.—a conservative assumption.
Step 15. p = qh [(GCp) - (GCpi)]
Figure 13 – Plan and section of the office building in Example 2.
Figure 14A – Wind pressure on the office building in Example 2. These are per ASCE 7-16. B – Wind pressures on the same building per ASCE 7-10. Note the substantial increase in ASCE 7-16 wind pressures as compared with ASCE 7-10 pressures for reasons explained in Step 16 of this example.
1 8 4 • P a t t e R S o n a n d M e h t a R C I I n t e R n a t I o n a l C o n v e n t I o n a n d t R a d e S h o w • M a R C h 1 4 - 1 9 , 2 0 1 9

p (field-of-roof—interior) = 34.3[-0.9 - 0.18] = -37.0 psf
p (field-of-roof—exterior) = 34.3[-1.7 - 0.18] = -64.5 psf
p (perimeter) = 34.3[-2.3 - 0.18] = -85.1 psf
p (corner) = 34.3[-3.2 - 0.18] = -115.9 psf
Step 16. In Figure 14A, various roof zones are identified and the correspond-ing wind pressures are shown. Figure 14B shows the wind pressures on the same building per ASCE 7-10. Observe the sig-nificant increase in ASCE 7-16 pressures for all roof zones. This is because of the increase in GCp values in ASCE 7-16. The basic wind speed for Galveston, TX (being in a hurricane-prone region) has not changed in ASCE 7-16 from ASCE 7-10.
Additionally, note that the roof zone under a pressure of -37.0 psf is only 8 x 8 ft. (= 64 sq. ft.)—a mere 10% of the total roof area. For ease of construction, a roof designer will most likely assume this zone as being under -64.5 psf—a huge increase from ASCE 7-10 pressure of -40.5 psf.
Example 2
Using the step-by-step procedure, deter-mine the ultimate wind uplift pressures on the roof of the office building of Figure 13, which is located in downtown San Francisco, California. Assume no topo-graphical features at the site. The windows, although resistant to wind pressure, are not resistant to wind-borne debris.
SolutionStep 1. Risk Category II building Step 2. From ASCE 7 website (https://
asce7hazardtool.online), the basic wind speed for San Francisco, V, for Risk Category II building per ASCE 7-16 = 92 mph.
Step 3. Exposure of site is B (downtown area).
Step 4. h = 30 ft.Step 5. Kh = (2.01)[30/1200](2/7) =
0.7006; the algebraic form of this expres-sion is from ASCE 7-16 and included in the monograph.
Step 6. Kzt = 1.0 (given). Step 7. Ke = 1.0Step 8. Kd = 0.85Step 9. qh = 0.00256(Kh)(Kzt)(Ke)(Kd)(V)2 =
0.00256(0.7006)(1.0)(1.0)(0.85)(92)2 = 12.9 psf
Step 10. San Francisco is not in hurri-cane-prone region and, hence, not in a wind-
borne debris region. Therefore, the glazed fenestration does not need impact protection.
Step 11. Because the windows are resistant to wind pressure, they are con-sidered as “non-openings.” The enclosure classification of the building is “enclosed.”
Step 12. h = 30 ft., which is < 60 ft. Therefore:
GCp (field-of-roof—interior) = -0.9 GCp (field-of-roof—exterior) = -1.7 GCp (perimeter) = -2.3 GCp (corner) = -3.2Step 13. GCpi = 0.18 (Table 2)Step 14. Since no information is pro-
vided about a roof parapet, we assume that the parapet is < 3 ft. high—a conservative assumption.
Step 15. p (field-of-roof—interior) = 12.9[-0.9 - 0.18] = -13.9 psf
p (field-of-roof—exterior) = 12.9[-1.7 – 0.18] = -24.2 psf
p (perimeter) = 12.9[-2.3 – 0.18] = -32.0 psf
p (corner) = 12.9[-3.2 – 0.18] = -43.6 psf
Step 16. In Figure 15A, various roof zones are identified and the corresponding pressures are shown. Figure 15B shows wind pressures on the same building per ASCE 7-10. Observe that ASCE 7-16 pres-sures are lower in corner and perimeter zones than those of ASCE 7-10 despite higher GCp values of ASCE 7-16. The reason is that V7-16 = 92 mph is much lower than V7-10 = 110 mph because San Francisco is in a non-hurricane region. For ease of construction, here also, a roof designer will likely assume the 8- x 8-ft. roof zone (shown to be under a pressure of -13.9 psf) as being under the pressure of -24.3 psf.
Example 3 Using the step-by-step procedure, deter-
mine the ultimate wind uplift pressures on the low-slope roof of a high-rise office build-ing measuring 100 x 150 ft. in plan. The envelope of the building consists of glass curtainwalls whose glazing is resistant to wind-borne debris and wind pressure. Roof height = 500 ft., and a 2-ft., 9-in. high para-pet is provided. The building is located in downtown Miami, Florida. Kzt = 1.0. Assume no topographic features.
SolutionStep 1. An office building is a Risk
Category II building.Step 2. From the ASCE 7 website
(https://asce7hazardtool.online), the basic wind speed for downtown Miami, Florida, V, for a Risk Category II building per ASCE 7-16 = 169 mph.
Step 3. Exposure category of site is B (downtown area).
Step 4. h = 500 ft. (given).Step 5. Kh = (2.01)[500/1200](2/7) =
1.5652; the algebraic form of this expres-sion is from ASCE 7-16 and included in the monograph.
Step 6. Kzt = 1.0 (given)Step 7. Ke = 1.0 (Miami, FL is at sea
level).Step 8. Kd = 0.85Step 9. qh = 0.00256(Kh)(Kzt)(Ke)(Kd)(V)2 =
0.00256(1.5652)(1.0)(1.0)(0.85)(169)2 = 97.3 psf
Step 10. All fenestration is impact resis-tant and wind pressure resistant. Therefore, we proceed to Step 11.
Step 11. Because the glazing is impact and wind pressure resistant, and there are no
R C I I n t e R n a t I o n a l C o n v e n t I o n a n d t R a d e S h o w • M a R C h 1 4 - 1 9 , 2 0 1 9 P a t t e R S o n a n d M e h t a • 1 8 5
Figure 15A – Wind pressure on the office building in Example 3. These are per ASCE 7-16. B – Wind pressures on the same building per ASCE 7-10. Note that ASCE 7-16 pressures are lower than ASCE 7-10 pressures as explained in Step 16 of this example.

“openings” in the walls immediately below the roof, the enclosure classification is “enclosed.”
Step 12: h = 500 ft., which is > 60 ft. Therefore, from Figure 8:
GCp (field-of-roof) = -1.4 GCp (perimeter) = -2.3 GCp (corner) = -3.2Step 13. GCpi = 0.18 (Table 2)Step 14. The parapet is < 3 ft. high.
Hence, no protective effect obtained from the parapet.
Step 15. p (field-of-roof) = 97.3[-1.4 - 0.18] = -153.7 psf
p (perimeter) = 97.3[-2.3 - 0.18] = -241.3 psf
p (corner) = 97.3[-3.2 - 0.18] = -328.9 psf
Step 16. In Figure 16, various roof zones are identified and the corresponding uplift pressures are shown.
12. Safety Provisions in Roof DesignDespite the advances made in structural
engineering, the current methods avail-able to determine the loads on buildings are approximate. In other words, a perfect (100%) reliability in determining the loads on buildings or components does not exist. For example, as shown in the previous sec-tions, the wind pressure on a roof zone is a function of several factors, such as the peak wind speed, building site’s exposure, building’s enclosure classification, ground elevation above sea level, and so on. There is a great deal of approximation in the numeri-cal values assigned to these factors based on the assumptions that are only as close to reality as possible, but do not represent a 100% reality.
A similar lack of reli-ability pre-vails in esti-mating the r e s i s t a n c e (i.e., strength) of the build-ing/compo-nent. With respect to a roof assem-bly, the uncertainty in determining the resistance to wind uplift is due to such factors as
workmanship, construction site quality con-trol, differences in the test specimen versus actual roof construction (despite both utiliz-ing the same materials), age-related deterio-ration of assembly, and so on.
The imperfections (uncertainties) inher-ent in estimating the loads and resistance are dealt with by using two alternative design approaches: 1) allowable strength design (ASD) approach and 2) load and resistance factor design (LRFD) approach, also called ultimate strength design (USD) approach. Of the two approaches, ASD is older, and has been replaced by the more rational USD approach.
ASD Approach in GeneralIn the ASD approach, the estimation of
loads (such as the dead load, live load, wind load, etc.) is based on peak values that are likely to occur during the structure’s service life (typically assumed as 50 years for Risk Category II structures). These loads are referred to as service loads or working loads.
All service loads that may act on a structure/component simultaneously are combined linearly (i.e., without any modifi-cation) to obtain the total load on it, and the resistance required to carry them is deter-mined. We will call the required resistance the service load resistance, RSL.
We then calculate the resistance of the structure/component that is furnished to carry the loads, based on material proper-ties and structural analysis. We call this the nominal resistance, RNOM. The term “nomi-nal” is used to signify that the uncertainties in 1) estimating the loads and 2) computing the resistance of the structure/component
have not been accounted for. To account for the uncertainties, RNOM
is divided by the factor of safety to obtain the practical, as furnished, resistance, RPR
so that:
RPR = [RNOM/FOS]Equation 4
For safety considerations, the practi-cal resistance, RPR, must be ≥ the required resistance, RSL, that is:
RPR ≥ RSLEquation 5
From Equations 4 and 5:
RNOM ≥ (FOS)RSLEquation 6
A minimum FOS = 2.0 was commonly used in most structural design using the ASD approach17 and was adopted in wind-resistant design of roofs.
ASD Applied to Wind Design of Low-Slope Roofs
Up until ASCE 7-05, wind-resistant design was based on service load pressures, obtained by using the service load wind speed for a location, defined as the peak wind speed that has a mean return interval (MRI) of 50 years (for Risk Category II). The 50-year MRI implies that the probability of the wind speed at a location equaling or exceeding the nominal wind speed in any one year = (1/50) = 0.02 = 2%. This is simi-lar to the probability of a fair cubical dice bringing up a certain number at any given throw = 1/6 = 0.167 = 16.7%.
However, the probability that the service load wind speed will be equaled or exceeded during the service life (of 50 years) of a building is: P50 = 0.64 = 64%; P25 = 0.4 = 40%; P10 = 0.18 = 18%. These are fairly high probabilities of exceedance; and, therefore, the use of a high FOS, such as 2.0 (or greater) is reasonable in the light of several uncertainties just mentioned.
Because the only structural criterion to be satisfied with respect to wind design of a low-slope roof is the resistance to uplift pressure, its required resistance is simply equal to the uplift pressure on the roof. Thus, RSL = PSL, where PSL = service load uplift pressure.
If RNOM is the uplift resistance of the roof
Figure 16 – Wind pressures on the office building in Example 4 per ASCE 7-16. Note that ASCE 7-10 pressures on this building are the same as ASCE 7-16 pressures because GCp values have not changed. The basic wind speed for Miami, FL, has also not changed, being in the hurricane-prone region.
1 8 6 • P a t t e R S o n a n d M e h t a R C I I n t e R n a t I o n a l C o n v e n t I o n a n d t R a d e S h o w • M a R C h 1 4 - 1 9 , 2 0 1 9

assembly as furnished (based on laboratory testing), then from Equation 6:
RNOM ≥ FOS(PSL)Equation 7
With minimum FOS = 2.0, Equation (8) becomes:
RNOM ≥ 2.0(PSL)Equation 8
Thus, if the uplift pressure, PSL, on a roof zone = 45 psf, then RNOM for that zone must be ≥ 2.0(45 psf), i.e., ≥ 90 psf.
Therefore, the generally accepted indus-try method for low-slope roof design, using ASD, involves the following steps:
1. Calculate the uplift pressure, PSL, for each roof zone using the procedure given in ASCE 7.
2. Calculate the nominal uplift resis-tance, RNOM, to be furnished for each zone using Equation 8.
3. Select a roof assembly that has been tested by an approved testing agen-cy, such as Factory Mutual (FM) or Underwriters Laboratory (UL), whose uplift strength equals or exceeds the value obtained from Step 2.
USD Approach in GeneralIt has long been known that the nature
of uncertainties in load and resistance are vastly different. Therefore, accounting for the two types of uncertainties (in load and the resistance) through one combined factor—FOS in ASD approach—is unsat-isfactory. This is more evident when we consider that a typical building is subjected to a number of different load types—dead load, live load, wind load, earthquake load, and so on. The level of uncertainty in each load type is different. For example, the level of uncertainty in determining the dead load is much smaller than in live load or wind load. Therefore, the safety provisions for each load type have to be different.
Similarly, in dealing with the resistance of the member, one deals with a host of dif-ferent strength types—compressive strength, tensile strength, bending strength, shear strength, pull-out strength—and so on. The level of uncertainty in their determination varies. Consequently, the safety provision for each strength type has to be different.
Thus, the fundamental difference between the ASD and USD approaches is
that in ASD, one single safety provision (FOS) is used, while in USD, there are two (partial) safety provisions—one for the loads on the structure/component and the other for its furnished resistance.
The factor that used to account for the uncertainty in load in USD has been called the load factor, which is greater than 1.0. For example, the load factor for dead load is 1.2; that for live load is 1.6. In other words, in USD, we magnify (i.e., multiply) the ser-vice loads by the respective load factors (LF). The product so obtained is called the ultimate load. Based on the ultimate load, we determine the required resistance of the structure/component, denoting it as RUL.
Based on the structure/component’s cross-sectional dimensions, material prop-erties, and structural analysis, we deter-mine the as-furnished resistance of the structure/component, calling it the nomi-nal resistance, RNOM. To account for the uncertainties (in analytical procedures and material properties), we multiply RNOM by the strength reduction factor, 𝛟. The 𝛟 factor is always < 1.0. In other words, we calculate the resistance of the structure/component and reduce it by multiplying it with 𝛟.
The resulting product [𝛟 (RNOM)] is the practical, as-furnished resistance of the structure/component, RPR. For a safe design:
RPR = [𝛟 (RNOM)] ≥ RULEquation 9
USD Applied to Wind Design of Low-Slope Roofs
From ASCE 7-10 onward, wind pres-sures are based on USD approach. The load factor for wind load in ASCE 7-05 was 1.6. In ASCE 7-10 and ASCE 7-16, the load fac-tor is not applied separately (as was done in ASCE 7-05 and its earlier versions), but merged into the basic wind speed for the location. Consequently, the basic wind speed (in ASCE 7-10 and ASCE 7-16) is the ultimate wind speed, and the wind pres-sure obtained using this basic wind speed is called the ultimate pressure, PUL. Thus:
PUL = 1.6PSLEquation 10Where:
PSL = service load pressure of ASCE 7-05 (and its earlier versions).
Note that PUL signifies that all uncer-
tainties in determining the wind pressures (including that dealing with the uncertainty in estimating the wind speed) have been taken care of in the ultimate wind speed. In other words, the safety provision for loads is built into the wind speed.
As the load factor does not account for the uncertainties related to the roof’s (uplift) resistance (strength as furnished), an additional safety factor is needed. From Equation 10:
PSL = ( 1 )PUL = 0.625PULEquation 11
The International Building Code allows the use of 0.6 in place of 0.625,18 so that:
PSL = 0.6PULEquation 12
Substituting the value of PSL from Equation 12 in Equation 8, we get:
RNOM ≥ 2.0(0.6PUL), i.e.,
RNOM ≥ 1.2PULEquation 13
Equation 13 states that the nominal uplift resistance (i.e., the furnished uplift resistance) of the roof assembly should be ≥ 1.2 times the ultimate uplift pressure on it.
Because ( 1 ) = 0.83, Equation 13 can also be written as:
(0.83)RNOM ≥ PULEquation 14
The number 0.83 may be viewed as the 𝛟 factor—the strength reduction fac-tor. Because Equations 13 and 14 are essentially identical, one can use either to design a roof assembly. However, the use of Equation 13 is simpler, and the design of a roof assembly can be obtained from the following steps, as illustrated in Example 4:
1. Calculate PUL for each roof zone using the ASCE 7-16 procedure (or read it from the monograph).
2. Calculate the (required) nominal uplift resistance for each zone, RNOM = 1.2(PUL).
3. Select a roof assembly that has been tested by an approved testing agen-cy, such as FM or UL, whose uplift strength equals or exceeds the value obtained from Step 2).
R C I I n t e R n a t I o n a l C o n v e n t I o n a n d t R a d e S h o w • M a R C h 1 4 - 1 9 , 2 0 1 9 P a t t e R S o n a n d M e h t a • 1 8 7
1.2

It is important to emphasize that the number 1.2 in Equation 13 is a safety fac-tor that addresses the uncertainties in the materials and construction of roof assem-blies. ASCE 7 does not deal with this issue. The roofing industry may consider revising it based on such parameters as: 1) mandated inspection of roof construction by third-par-ty, qualified inspectors versus no mandated inspection, 2) differentiating between fully adhered roofing (where all roof components are fully adhered) and anchored roof assem-blies, and others.
Example 4 Determine the ultimate wind uplift pres-
sures (PUL) for various roof zones and then specify corresponding FM-rated assemblies for the low-slope roof of a building with eave height, h = 50 ft. Basic wind speed for the location = 160 mph. The site lies in Exposure B, elevation above sea level = 500 ft. (assume Ke = 1.0) and site topography is flat, i.e, Kzt = 1.0. The roof has a 3-ft.-high parapet.
Solution The ultimate pressures on the roof, PUL,
have been obtained from Figure 12, from which the uplift resistances of the assembly to be furnished, RNOM, are:
Field-of-roof (interior): PUL = -48.8 psf; RNOM = 1.2(-48.8) = -58.6 psf
Field-of-roof (exterior): PUL= -84.9 psf; RNOM = 1.2(-84.9) = -101.9 psf
Perimeter: PUL = -112.0 psf; RNOM = 1.2(-112.0) = -134.5 psf
Corner: Same as perimeter RNOM = -134.5 psf (because of parapet ≥ 3 ft. high).
Because FM ratings are in steps of 15 psf, the required FM ratings for wind uplift are:
Field-of-roof (interior): FM 1-60Field-of-roof (exterior): FM 1-105Perimeter: FM 1-135Corner: FM 1-135
CONCLUSIONSASCE 7-16 includes several modifica-
tions from ASCE 7-10, such as the change in basic wind speed maps for the conti-nental U.S. and its territories; the addition of microzoned, effective basic wind speed maps for the islands of Hawaii; the addition of a new ground elevation factor clarifying the definition of wind directionality factor; and the addition of one enclosure classifica-tion. The most significant change, however, is in relation to roofs with roof height, h ≤ 60 ft.
The paper makes a plea to the roofing industry to embrace the use of the USD approach and move away from the use of the ASD approach, realizing that the ultimate pressures include a (partial) safe-ty provision incorporated into them. The additional safety factor of 1.2 is required to account for the quality of roof construc-tion.
It should be noted that, in this approach, the overall safety provision remains unal-tered from the “2.0 factor” used in the ASD approach, considered archaic in academia and the profession. It is the authors’ hope that the roofing industry will adopt the USD approach as presented.
The monograph has been updated to include all the modifications mentioned. Tables for ultimate pressures and various numerical examples, which explain how the table pressure have been arrived at, have been updated.
ACKNOWLEDGMENTSThe authors gratefully acknowledge
the following experts for their meticulous reviews of this paper: Thomas Smith, RRC, AIA, FSEI, TLSmith Consulting Inc.; Scott Hinesley, RRC, PE, REI Engineers Inc.; Edward Sheridan, RRC, PEng., Fishburn Sheridan & Associates Ltd.
REFERENCES1. American Society of Civil Engineers/
Structural Engineering Institute: ASCE 7-10 Standard Minimum Design Loads for Buildings and Other Structures, pp. 241–364. 2010.
2. American Society of Civil Engineers/Structural Engineering Institute: ASCE/SEI 7-05 Standard, Minimum Design Loads for Buildings and Other Structures, pp. 21–80. 2005.
3. American Society of Civil Engineers/Structural Engineering Institute: ASCE 7-16 Standard, Minimum Design Loads for Buildings and Other Structures, pp. 245–390. 2016.
4. Ibid. p. 268.5. ASCE 7-10, p. 251.6. ASCE 7-16, p. 266.7. ASCE 7-16, pp. 256–257.8. International Code Council:
International Building Code (2018), Section 1504.8, p. 343. 2018.
9. ASCE 7-16, pp. 256–265.10. Ibid. p. 271. 11. Ibid.12. Ibid. p. 333. 13. Ibid. p. 363.14. Ibid. p. 336.15. Ibid. p. 782.16. Thomas Smith. “How Do I Load
Thee.” Professional Roofing. October 2017.
17. Alasdair Beal. “A History of the Safety Factors.” The Structural Engineer. U.K. 89(20). 18 Oct. 2011.
18. International Code Council. International Building Code (2018), Section 1609.3.1, p. 377. 2018.
1 8 8 • P a t t e R S o n a n d M e h t a R C I I n t e R n a t I o n a l C o n v e n t I o n a n d t R a d e S h o w • M a R C h 1 4 - 1 9 , 2 0 1 9