wind pressure coefficents for gable roofs · pdf filewind pressure coefficents for gable roofs...
TRANSCRIPT
WIND PRESSURE COEFFICENTS FOR
GABLE ROOFS OF INTERMEDIATE SLOPES
KA1 WANG
A Thesis
at
the School for Building
Presented in Partial Fulfillment of the Requirements
for the Degree of Master of AppIied Science
at
Concordia University
Montreai, Quebec, Canada
October 1998
0 Kai Wang, 1998
National Library of Canada
Bibliothèque nationale du Canada
Acquisitions and Acquisitions et Bibliographie Services services bibliographiques
395 Wellington Street 395. rue Wellington Ottawa ON K I A ON4 Ottawa ON K1A ON4 Canada Canada
The author has granted a non- L'auteur a accordé une licence non exclusive licence allowing the exclusive permettant à la National Library of Canada to Bibliothèque nationale du Canada de reproduce, loan, distribute or sell reproduire, prêter, distribuer ou copies of this thesis in microfom, vendre des copies de cette thèse sous paper or electronic formats. la forme de microfiche/film, de
reproduction sur papier ou sur format électronique.
The author retains ownership of the L'auteur conserve la propriété du copyright in this thesis. Neither the droit d'auteur qui protège cette thèse. thesis nor substantial extracts fiom it Ni la thèse ni des extraits substantiels may be printed or otherwise de celle-ci ne doivent être imprimés reproduced without the author's ou autrement reproduits sans son permission. autorisation.

ABSTRACT
WIND PRESSURE COEFFICENTS FOR
GABLE ROOFS OF INTERMEDIATE SLOPES
Kai Wang
The present study examines the suitability of the current wind provisions of the National
Building Code of Canada for design wind loads on gable roofs of intermediate roof
angles (IO0-30'). The shidy is initiated by the discrepancies fomd in recent research
projects against the current design wind loading provisions for such roofs.
Five building models with roof angles of 10' lS0, 20°, 25' and 30' equipped with an
interchangeable roof slope panel have been tested in a typical open country exposure in
the boundary layer wind tunnel of the Centre for Building Studies at Concordia
University. The experirnental setthgs satisSr the corresponding wind tunnel simulation
critena specified in the wind load test standards of American Society of Civil Engineers.
Local and area-averaged roof pressure coefficients have been obtained fiom the wind
tunnel measurements. Extreme value analysis has been performed to estabiish the peak
pressure coefficient values. This thesis presents a comparative study based on the
experimental data, which consists of two parts. The f i s t part includes the cornparisons of
iii
the measured results with those fiom other researches. The cornparisons show that the
present experimental results are appropnate and suitable for application to codification.
The second part of the study examines the suitability of the current wind provisions by
comparing the present results with those specified in the provisions. It appears that there
is underestimation of the extreme suctions in the current wind provisions, particularly
those on the ndge and edge regions of the roofs with intermediate slopes.
As a result of the present study, an alternative zoning and loading definition is attempted,
accompanied by a set of new curves. At the same time, the coda1 roof categories are re-
arranged. The proposed design roof wind pressure coefficients are somewhat higher than
the current design values.

The author wishes to express his sincere gratitude to his s u p e ~ s o r s Drs. T. Stathopoulos
and H. Wu for their excellent guidance and support during this study. The author is most
gratefd to Dr. P. J. Saathoff for his suggestions and timely assistance in experiments and
thesis writing.
Special thanks are due to Mr. S. Bélanger for his cornputer expertise, Dr. Suresh Kumar
for his constructive suggestions, and the China-Quebec Education Exchange Program for
the International Tuition Fee Exemption.
Special appreciation is felt for my family, particularly for my wife Hui and my sister Yi,
for the love and encouragement during the study.

TABLE OF CONTENTS
... LIST OF FIGURES ....................................................................................................... viu ... LIST OF TABLES ......................................................................................................... xni ..................................................................................................... LIST OF SYMBOLS xiv
CHAPTER 1 INTRODUCTION ............... ............................................................. 1
1.1 Generai ..........................~......................................-................................................... 1
. . ................................................................................. ......... 1.2 Scope and Objectives .. 3
........ CHAPTER 2 LITERATURE REVIEW 7
............................................... ............................ 2.1 Description of Previous Work .. 7
2.2 Justification of the Present Study ...................................................................... 14
............................ C W T E R 3 EXPERIMENTAL METHODOLOGY ............ 17
3.1 Wind Tunnel and Atmospheric Boundary Layer Wind Simulation ...................... 17
............................................................................................ 3 -2 Mode1 Configurations 23
. . . 3.3 Data Acquisitron and Processing ........................................................................... 29
........................ 3.3 -1 Data Acquisition System and Meamernent Program Setting 29
3 3 3 2 Data Processing System ................................................................................. 3 1
3 -4 Repeatability of Experimental Resul ts .................................................................. 3 5
CKAPTER 4 RIESULTS ANX) DISCUSSION ......... .. .............. ........................ 3 7
4.1 General Descriptions ............................................................................................. 37
4.2 Previous Data and Present Resdts ........................................................................ 3 9
................................................................................... 4.3 Local Pressure Coefficients 49
4.4 Area-Averaged Pressure Coefficients .............. .. .... ... ...................................... 64

CHAPTER 5 APPLICATION FOR STANDARDS AND CODES OF PRACTICE .*.**.........*.................. ....*........**...,......... ............................................................................ 75
5.1 Detailed Description of the Current Wind Provisions ........................................ 75
5.2 Cornparisons with the Current Wind Provisions ................................................... 78
............................................................ 5.3 Alternative Code and Standard Provisions 86
5.4 Assessrnent of the Increase of Design Wind Loads Brought by the Proposed
........................................................................................ Provisions ......................... .. 91
.............................. C W T E R 6 CONCLUSIONS ANI) RECOMMENDATlONS 95
................................................... 6.1 Summary and Conclusions of the Present Smdy 95
6.2 Recommendations for Fumire Study on this Topic .......................................... 97
REFERENCES ......................... ....................................................................................... 99
APPENDICES
Appendix- l Roof Pressure Coefficient Contours for Typical Wind Azimuths ......... 104
Appendix-2 Corner Wind Pressure Coefficients as Function of Wind Azimuth ...... 115
Appendix-3 Compatison of the Experimental Data Tested on each Slope with the
................................................................ Current Design Wind Pressure Coefficients 126
vii
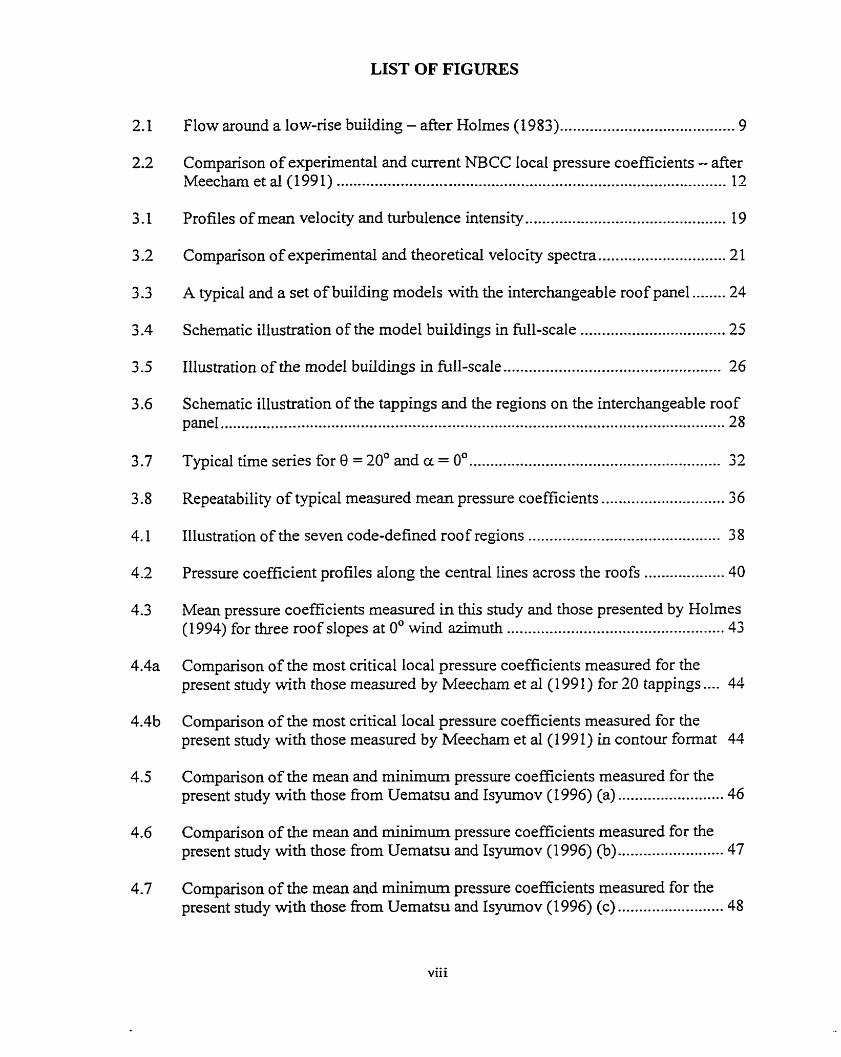
LIST OF FIGURES
......................................... . 2.1 Flow around a low-rise building afier Holmes (1983) 9
2.2 Comparison of experimental and curent NBCC local pressure coefficients . after Meecham et al (1 99 1) ........................................................................................... 12
............................................... 3.1 Profiles of mean velocity and turbulence intensity 19
............................ 3.2 Cornparison of experimental and theoretical velocity spectra 21
3.3 A typical and a set of building models with the interchangeable roof panel ........ 24
3.4 Schematic illustration of the mode1 buildings in full-scale ........... .. ..................... 25
................................................... 3 -5 Illustration of the mode1 buildings in full-scale 26
3.6 Schematic illustration of the tappings and the regions on the interchangeable roof panel ...................................................................................................................... 28
........................................................... 3.7 Typical time series for 0 = 20' and a = 0' 32
3.8 Repeatability of typical measured mean pressure coefficients ................... ... .... 36
4.1 Illustration of the seven code-defrned roof regions ............................................. 38
4.2 Pressure coefficient profiles dong the central lines across the roofs ................... 40
4.3 Mean pressure coefficients measured in this study and those presented by H o h e s ................................................... (1994) for three roof slopes at 0° wind azimuth 43
4.4a Comparison of the most cntical local pressure coefficients measured for the present study with those measured by Meecham et al (1 99 1) for 20 tappings .... 44
4.4b Comparison of the most critical local pressure coefficients measured for the present study with those measured by Meecham et al (1 99 1) in contour format 41
4.5 Comparison of the mean and minimum pressure coefficients measured for the present study with those from Uematsu and Isyumov (1996) (a) ......................... 46
4.6 Comparison of the mean and minimum pressure coefficients measured for the present study with those from Uematsu and Isyumov (1996) (b) ......................... 47
4.7 Comparison of the mean and minimum pressure coefficients measured for the ......................... present study with those from Uematsu and Isyumov (1996) (c) 48
viii

................ ............. 4.8 Most critical local pressure coefficients for the 1 Oo-roof ... 51
Most critical local pressure coefficients for the 15'-roof ..................................... 52
..................................... Most criticai local pressure coefncients for the 20'-roof 53
.................................... Most critical local pressure coefficients for the 25'-roof 54
..................................... Most critical local pressure coefficients for the 3O0-roof 55
........................... Minimum local pressure coefficients at taps near Ridge corner 57
Most critical local pressure coefficients dong the roof gable end as functions of roof angle (8) ........................................................................................................ 59
Most critical local pressure coefficients near the roof gable end as fiuictions of roof ang!e (8) ................................................................................................. 61
Area-averaged pressure coefficients as functions of wind azimuth for the entire ...................... ............................. area of region A (Eaves corner) ... 65
Area-averaged pressure coefficients as fiinctions of wind azimuth for the entire ............................................................................. area of region B (ridge corner) 66
Area-averaged pressure coefficients as functions of wind azimuth for the entire area of region E (Gable edge) .............................................................................. 67
Area-averaged pressure coefficients as h c t i o n s of roof angle for Eaves corner. ridge corner. Apsx edge and Eaves edge ............................................................. 69
Area-averaged pressure coefficients as h c t i o n s of roof angle for Gable edge. Ridge and Interior .................. ........... .................................................. 70
Area-averaged pressure coefficients for the roof regions of Eaves corner. Ridge .............. corner and Apex edge as functions of their tributary are* respectively 73
Area-averaged pressure coefficients for the roof regions of Eaves edge. Gable edge. Ridge and Interior as functions of their tributary area, respectively .......... 74
............. Wind provisions for the low building gable roofs . d e r NBCC (1995) 77
Cornparison of peak pressure coefficients between the present results and NBCC .............................. coda1 provisions for each of the 7 roof regions. respectively 79
5.3 Comparison of test values and the canadian code provisions for the 4 zones on the ............................................................................................... 10'-3 0' gable roofs 81
5.4 Comparison of expenmental values measured on the 10'-roof and the code values specified for gable roofs in slope range (0°<0~100) ............................................. 83
5.5 Comparison of experimental values measured on the 30'-roof with the code values specified for gable roofs in dope range (30°<%4j0) ............................... 84
5.6 Comparison of experimental values measured on the 25'-roof with the code values specified for gable roofs in slope range (30°<0~45') ............................... 85
5.7 Experimental most critical peak pressure coefficients. current NBCC and . . proposed new coda1 provisions ............................................................................ 89
A- 1 . Pressure field on the quartering roof of 10' dope at O0 wind azîmuth .............. 105
............ A.1.2 Pressure field on the quartering roof of 10' slope at 60' wind azimuth 105
A.1.3 Pressure field on the quartenng roof of 10' dope at 90' wind azimuth ............ 106
A4.4 Pressure field on the quartering roof of 10' dope at 13.5' wind azimuth .......... 106
A.1.5 Pressure field on the quartering roof of 15' dope at 0' wind azimuth .............. 107
A-1 6 Pressure field on the quartering roof of 15' dope at 60' wind a u t h ............ 107
A.1.7 Pressure field on the quartering roof of 15' dope at 90' wind azimuth ............ 108
.......... A.1.8 Pressure field on the quartering roof of 15' dope at 135' wind azimuth 108
A.1.9 Pressure field on the quartering roof of 20' dope at 0' wind azimuth .............. 109
A- 1.1 O Pressure field on the quartering roof of 20' dope at 60' wind azïmuth ............ 109
A- 1.1 1 Pressure field on the quartering roof of 20' slope at 90' wùid azimuth ............ 110
A-1 -12 Pressure field on the quartenng roof of 20' slope at 135' wind azirnuth .......... 110
A- 1.13 Pressure field on the quartering roof of 25" dope at 0' wind azùnuth .............. 111
A.1.14 Pressure field on the quartering roof of 25' slope at 60' wind azirnuth ............ 111
A4.15 Pressure field on the quartering roof of 25" slope at 90' wind azimuth ............ 112
A.1.16 Pressure field on the quartering roof of 25' slope at 135' wind azimuth .......... 112
A-1.17 Pressure field on the quartering roof of 30' slope at 0' wind azimuth ............ 1 13
A-1.1 8 Pressure field on the quartering roof of 30' siope at 60' wind azimuth .......... 1 13
A-1.19 Pressure field on the quartering roof of 30° slope at 90' wind azimuth .......... 1 14
A-1 -20 Pressure field on the quartering roof of 30° slope at 135' wind azimuth ........ 1 14
A-2.1 Local pressure coefficient distribution on Eaves corner for 10' roof, al1 azimuths ..................................... ... ............................................................................... 116
A-2.2 Local pressure coefficient distribution on Ridge corner for 10' roof, al1 azimuths ...................... - .................................................................................... 117
A-2.3 Local pressure coefficient distribution on Eaves corner for 15' roof, al1 azirnuths ..................................... . .............................................................. 118
A-2.4 Local pressure coefficient distribution on Ridge corner for 15' roof, all azimuths .................................................................................................................. 119
A-2.5 Local pressure coeficient distribution on Eaves comer for 20' roof, al1 azirnuths ...................-....*..*......-...*.. * ........................................ * ........................... 120
A-2.6 Local pressure coefficient distribution on Ridge corner for 20' roof, al1 azimuths ........................................................................................................................ 121
A-2.7 Local pressure coefficient distribution on Eaves comer for 25' roof, al1 azirnuths ...................................................................................................................... 122
A-2.8 Local pressure coefficient distribution on Ridge comer for 25' roof, al1 azimuths ......................................................................................................................... 123
A-2.9 Local pressure coefficient distribution on Eaves comer for 30' roof, ail azimuths ............................................................................................................... 124
A-2.10 Local pressure coefficient distribution on Ridge corner for 30" roof, ail azimuths ....................................................................................................................... 125
A-3.1 Cornparison of the experimental results obtained for the 10'-roof with the current wind provisions specified for the whole intermediate siope range (lO0<9s30") ................................................................................................. 127
A-3.2 Cornparison of the experimental results obtained for the 15'-roof with the current wind provisions specified for the whole intermediate slope range (1 0°<00 O") ..-... .. ... .. ... .. ... ... ... .. . .. ..... ... . . . . . .. . .. . . . . . . . . . . . . . 128

A-3.3 Comparison of the experimental results obtained for the 20'-roof with the current wind provisions specified for the whole intermediate dope range (1 0'4~3 0 9 ..................................................................................................... 129
A-3.4 Comparison of the expenmental results obtained for the 25'-roof ~4th the current wind provisions specified for the whole intermediate dope range (loo.e~0O) ............................ ... ............................................................ 130
A-3 -5 Cornparison of the expenmental results obtained for the 30'-roof with the current wind provisions specified for the whole intermediate slope range
..................................................................................................... (1 0°<013 0') 13 1
xii

LIST OF TABLES
Cornparison of the experirnental settings with the criteria of the ASCE standard for wind loading tests (ASCE Draft, 1997) - the cunrent geometrical scale is 1 :400 ... 22
Tapping combinations used in area-averaged pressure calculations ................... .... 28
Regional most critical local pressure coefficients ........................... .... .................... 63
Minima of the area-averaged most critical pressure coefficients for the seven regions in their entire sizes, respectively ........................................................... 72
Comparison of the proposed and current codal definitions on slope range ....... . . . .. 87
Comparison of the proposed and current codal definition on pressure zoning ....... 87
Comparison of the proposed wind design pressure coefficients with those from the current wind provisions and those fiom p M o u experimental findings ................. 90
Zone weighting factors (F) of three different roofs ................................................. 93
Comparison of the proposed and current wind provisions in terms of expected values of design local suction coefficients for three roof co~gurat ions ................ 94
.-. Xl l l
LIST OF SYMBOLS
gable wall length [-]
geostrophic drag coefficient; gust effect factor
pressure coefficient
mean pressure coefficient
minimum pressure coefficient
maximum pressure coefficient
root-mean-square pressure coefficient
geometric weighting factor
mid-roof height
eaves height &]
long wall length [LI
longitudinal integral scale of turbulence [LI
fiequency [TI]
probability
pressure FL'~]
mean pressure PL"]
minimum pressure FL*~]
m&um pressure [FL-~]
spectral density fûnction of velocity p2T-']
mean wind velocity at gradient height PT']
mean wind velocity PT']
xiv

r m s wind velocity &TI]
height above the ground-leveI [-1
gradient height [LI
wind incidence angle
roof angle
standard deviation

CHAPTER 1
INTRODUCTION
Low building gable roofs are heavily loaded during strong winds. Severe wind darnage
on the roofs has ofien been reported. In order to minimize the wind damage, the National
Building Code of Canada w C C , 1995) and the Amencan Wind Standard (ASCE-7,
1995), as well as many other national and international wind standards and codes of
practice, have specified detailed provisions for these low building roofs. However, with
the increasing use of fast-assembled and iight-weighted structural members and
components in roof design and construction, better performance of roofs has necessitated
the continuous updating process of the wind standards and codes of practice, d e r
research finding s fYom wind tunnel experimentation and Ml-scale investigation.
In addition to the valuable full-scale investigation, wind tunnel experimentation plays an
important role in the evaluation of design roof wind loads. However, an accurate wind
tunnel simulation for low building roofs remains hard to achieve because lots of factors

are involved in wind tunnel simulation. The variation in approach flow properties such as
the velocity profile, turbulence intensity and length scale, the variation in building size
and roof geometry, and the variation in terrain condition, building grouping etc. have
great influences on the roof wind loads (Stathopoulos, 1984a). It has been reported that
using different wind tunnel experimental simulations to measure wind loading on an
identical mode1 might obtain different pressure coefficients sometimes over 40 percent
(Si11 et al, 1992). The difficulty in accurate wind tunnel simulations was regarded as a
trademark for the low building wind loading tests and prevented most previous wind
tunnel experiments from codification usage.
Up-to-date achievement in accurate wind tunnel simulation cornes out as the ASCE wind-
tunnel load-test standard (ASCE Dr&, 1997), after research findings for more than two
decades. This standard sets cnteria to regdate the wind tunnel experimental studies that
aim to be used for codification purposes.
The present study is to examine the suitability of the current wind provisions for gable
roofs of intermediate slopes of the National Building Code of Canada (NBCC, 1995).
This study consists of a comparative research based on experimental measurements
cmied out in a wind tunnel. These experiments have been elaborately simulated,
following the ASCE wind loading test standard (ASCE Draft, 1997). This research is
justified by the discrepancies found in previous research findings against the current wind
provisions, which is focusing on the roofs in the intermediate roof range (1 0'-30').

1.2 SCOPE AND OBJECTIVES
Wind standards and codes of practice have specified detailed provisions for gable roofs
of pitched slopes. However, recent research results have shown discrepancies fiom the
codal specifications for roofs of intermediate slopes. Therefore, there is a need to cary
out a detailed research study to examine the validity of the current wind provisions.
Generally speaking, the scope of the present n idy is to examine the suitability of the
current wind provisions of the National Building Code of Canada W C C , 1995):
specified for gable roofs of intermediate slopes (1 0°<0i300).
As defined in the current wind provisions, a given gabled roof may fall into one out of
three roof ranges depending on its roof angle (0), narnely quasi-flat roof (0°-4i100),
intermediate roof ( 1 0 ~ 4 G 0 ~ ) , and high-pitched roof (30°<0~450). In fact, the
intermediate slope is a comrnon roof style for low-rise buildings. Primary reasons to
choose this roof style include prevention of rain and snow accumulation. Steeper roofs
are less prevalent, but they are constructed to achieve aesthetic appeal or also functional
use in extreme snowfall environments. The examination of the codal definition of the
roof angle range is one of the objectives of the present study.
In addition to roof slope categorization, the current wind provisions are also specified in
terms of pressure coefficients appropriate to provide design wind loads for roof elements
and components in various locations. A roof surface is made up of different roof regions
(eaves and ndge corners; eaves, apex and gable edges; ridge; and interior). These regions,

which may be different for each roof angle range, can be grouped into a set of pressure
zones, provided that the appropriate regions are govemed by similar design pressure
coefficients. For these appropriate pressure zones, a set of design pressure coefficient
curves is provided. The assessrnent of suitability of pressure zones is another objective of
the present study.
In order to attain these objectives, a series of wind tunnel experiments have been
conducted in the present study. Five gable roof models of intermediate roof dopes (1 oO,
lSO, 20°, 25' and 30') have been tested in a simulated open country exposure in the
Building Aerodynamic Laboratory of the Centre for BuiIding Studies at Concordia
University. The experiments rigidy followed the Arnencan Society of Civil Engineers
(ASCE) wind loading test standard (ASCE Draft, 1997). Detailed rneasurements have
been carried out in order to produce the required local and area-averaged wind pressure
coeflficients.
The approach followed in the present research work consists of validating the
experimental resul-ts through cornparisons with previous research findings; comparing
measured data with the current wind provisions; exarnining the appropriateness of roof
regions, pressure zoning and loading, as presently described in the Code. Finally, a new
set of provisions will be proposed, and its feasibility will be discussed. This will be
particularly important if design wind pressure coefficients are increased, since this will
have inference on the cost of roof and its construction.

1.3 THESIS ORGANTZATION
The next chapter discusses the previous work in this area. The justification of the need of
the present study is aiso elaborated.
Chapter 3 presents the atmospheric boundary layer wind tunnel experimental techniques
and describes the aerodynamic characteristics of the simulated upstrearn flow. Details of
the instrumentation, mode1 configuration, and data acquisition and processing are
described. The current experimentai settings are also compared with the respective
criteria specified in the ASCE standard (ASCE Dr&, 1997). The comparison shows that
the present wind t u e 1 experiments satisfy the standard in terms of accurate simulation
and the present experimental results obtained could be suitable for codification purposes.
Chapter 4 presents the experimental results in terms of their variations with roof angle
and wind azimuth, compared with those fiom previous studies. The latter is for validation
purposes. The discussions provide global picîures on the local and area-averaged pressure
coefficients with their regional distributions. Afier that, these pressure coefficients are
formed into the coda1 format used by the current wind provisions for further codification
usage.
In Chapter 5, the examination of the suitability of the current wind provisions for the
intermediate roof range is conducted. Through detailed comparison of the present resdts

wiîh the current wind provisions, it is fomd that there is underestimation of the peak
suctions in the current wind provisions, particularly for the corner and edge regions.
Modifications dso seem necessary for the codai zoning and slope deffition.
Consequently, new provisions are attempted and discussed from the feasibility point of
view.
Finaily, conclusions and suggestions for M e r research on this topic are provided in
Chapter 6 .
CHAPTER 2
LITERATURE REVIEW
2.1 DESCRIPTION OF PREVIOUS WORK
W i d tunnel studies on Iow buiIding roof wind loading began in the mid-1960s,
accompanied with researches for improving techniques of accurate wind tunnel
simulation. Previous work has provided considerable insights into the turbulent action of
roof wind loads, and also provided reliable wind tunnel simulation techniques.
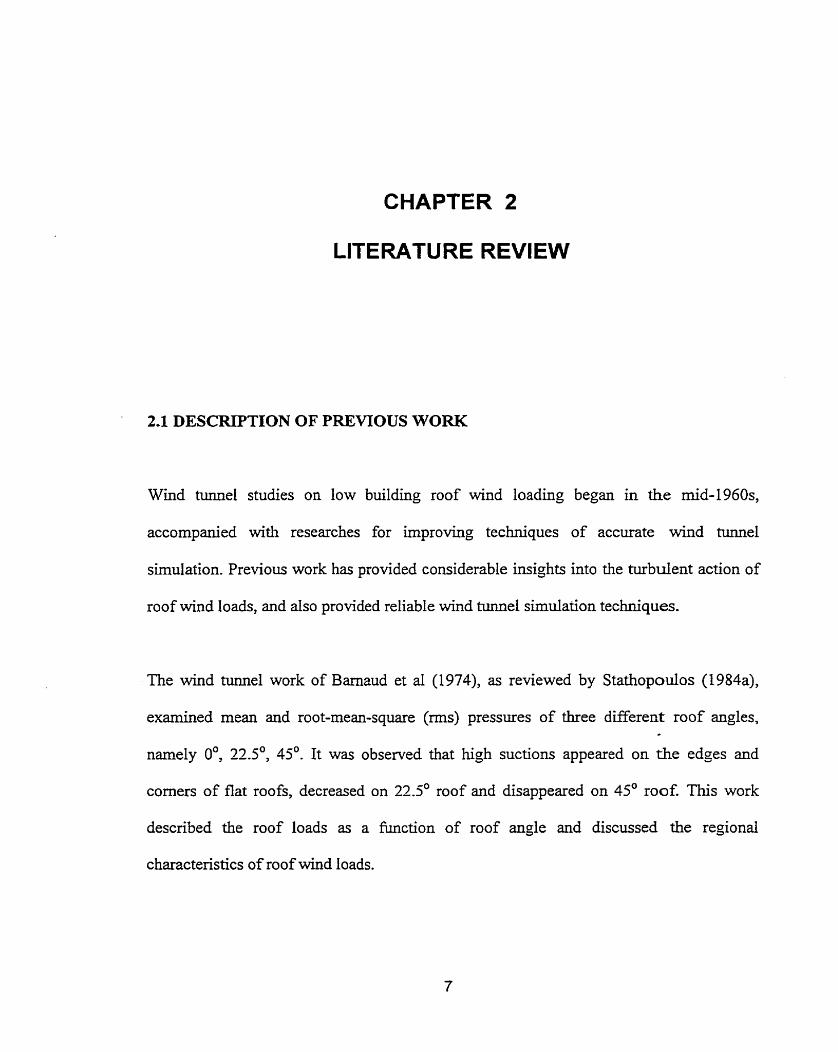
The wind tunnel work of Bamaud et al (1974), as reviewed by Stathopoulos (1984a),
examined mean and root-mean-square (rms) pressures of three different roof angles,
namely 0°, 22S0, 45'. It was observed that high suctions appeared on the edges and
corners of fiat roofs, decreased on 22.5' roof and disappeared on 45' roof. This work
described the roof loads as a function of roof angle and discussed the regionai
characteristics of roof wind loads.

Vickery (1976), as reviewed by Stathopoulos (1984a), exarnined four gable roof
buildings with roof angles of 0°, 6", 12" and 22', the latter two of which fell into the
intermediate roof range. Roof pressure distributions were found essentially continuous
across the ndge in the cases of the 0'- and 6°-roofs. When approaching the 12'-roof, there
was a separation of the flow at the ndge accompanied by a remarkable change of the
wind loading magnitude. The pressure coefficient irnmediately bebd the ndgeline was
similar to that at the leading edge but fell away rapidly towards the trailing edge. In the
case of the 22'-roof, the flow pattern and the load distribution are not far fiom those for
the 12'-roof except that pressure coefficients on the leeward roof slope were roughly
constant,
In this study, Vickery (1976) indicated that the pressure variation as a function of roof
dope was associated with the flow separation. On nearly flat roofs, the flow separated at
the leadinp edge, then reattached and rernained attached over the ridgeline and through to
the trailing edge. When the roof angle approached 12O, the flow reattached on the
windward slope and then re-separated at the ridgeline before reattaching on the leeward
slope. When approaching 22', the flow did not reattach &er separation at the ndgeline
and the leeward roof was in a region of constant suction. Furthermore, this work implied
that the wind loads distributed on different roof areas could show similar pressure
coefficients, which is important for codification purposes.
Stathopoulos (1979) carried out a series of experimental studies on low-rise buildings
with gable roofs. Four slopes of flat (O0), 1 : 12 (4.8'), 4: 12 (1 8.4') and 12: 12 (45') were

selected for tests. This work systematically described the loads on low-rise buildings.
Based on the experirnental results, the subsequent codification was made by
Stathopoulos, Surry and Davenport (1985). This work has become the theoretical and
experimental basis of the current wind provisions of NBCC and ASCE-7.
Holmes (198 1) conducted expenments with a set of gable buildings with overhangs. The
roof angles were IO0, l jO, 20' and 30'. This work provided valuable experimental data
that are used in the present study. Holmes (1983) also described the variation of the flow
separation associated with the flow turbulence as illustrated in Figure 2.1. It was
indicated that the turbulence characteristics inherent in the flow have strong influence on
the roof wind loads.
SEPARATION "BUBBLE"
UPWIND VELOClT FLUCTüATING IN AND DIRECTION
SHEAR HlGH TURBUL
LAYER
.ENCE
POSITIONS : LOW TURBULENCE
Fi,gure 2.1 Flow around a low-rise building - d e r Holmes (1983)
To provide information for design loads for agricultural and horticultural buildings in the
United Kingdom, Hoxey and Moran (1983) carried out a full-scale expenmental program
to study the effects of low building geometries on wind loads. As part of the program, a
set of gable buildings with intemediate roof slopes (1 1°, 15O, 22' and 26') were selected

for studying the wind loading effect of roof angle. Although the geometry of the model
buildings was not in consistent style, Hoxey and Moran (1983) concluded that there was
certain inadequacy of many national standards with respect to the prediction of wind
loads on low-nse buildings.
Saathoff and Melbourne (1989) studied the peak roof loading generation mechanism by
inves tigating the occurrence of the large pressures and the accompany ing vortex
generation. The intermittent peaks were observed when the separated wind flow rolled up
to form a large vortex near the surface. The increase of wind flow turbulence reduced the
size of flow separation bubble. The magnitude of the peak was found to be strongly
dependent on the inherent turbulence intensity and turbulence length scale. This work is
important for accurate wind tunnel simulation for roof loading measurement, since this
study indicated that different simulations of wind turbulence in wind tunnel can bring
variation in roof pressure coefficient to certain extent.
Richardson, Robertson, Hoxey and Surry (1990) carried out a collaborative research
program called Silsoe Structure Building Project. The initial purpose of this project was
to improve the wind tunnel measurement techniques by comparison of the wind tunlel
data with full-scale data. The field test data were collected in England while the wind
tunnel results were measured on the scaled models in Canada. The roof angles of the
model buildings were 10' and 15'. The 10'-building had curved eaves that could be
modified into regular sharp ones. In these experiments, only the Ioads dong the roof
central line across the ridgeline were measured. Richardson et al (1990), as well as

Savory, Dalley and Toy (1992), reported that the wind tunnel underestimated the peak
suctions while it overestimated rrns pressures in cornparison with the full-scale
measurements. However, the reason behind the discrepancies was not clearly explained
by the authors.
S tathopoulos and Saatho ff (1 99 1), Meecham, Surry and Davenport (1 99 1) worked
separately on the wind loading distributions on gable models with identical roof dope,
which is 4:12 (18.4' roof angle). Some of their results were compared with the current
wuid provisions specified for gable roofs of intermediate slopes.
The results of Stathopoulos and Saathoff (1991) indicated that for some cases the
measured peak negative coeffkient was approximately 20 percent higher than that
indicated in the current wind provisions. For instance, a peak suction coefficient of -5.0 at
the region of ndge corner was derived fiom their experimental results, while the design
pressure coefficient is -4.1 as indicated in the current wind provisions.
Most critical local pressure coefficients measured by Meecham et al (1 99 1) are shown on
the upper part of FigÜre 2.2. The bottom part of Figure 2.2 shows data extracted fkom the
current wind provisions by multiplying by 1.25 to eliminate the directionality factor,
which will be discussed in Chapter 4. Although the trend of the experimental result of
Meecham et al (1991) is similar with that of the current w-ind provisions, their
experimental results are indeed higher in many roof locations than those indicated in the
current wind provisions.

Enveloped Experimental Peak Negative CpCg's
Enveloped Experimental Peak Negative (Unfactored) CpCg's
Figure 2.2 Cornparison of the experimental and NBCC local pressure coefficients (multiplied by 1.25) on a gable roof of 18.4', afier Meecham et al (1 99 1)
Siil, Cook, and Fang (1992) reviewed the studies on the Aylesbury Comparative
Experiment. The Aylesbury Comparative Experiment project formulated an experimental
wind tunnel program with the objective of estimating tunnel-to-tunnel differences in the
pressure measurements in order to improve the current wind tunnel simulation
techniques. The experiment was based on the Building Research Establishment full-scale
experimental building, a low-rise building with gable roof at Aylesbury, England. Wind
tunnel results had been reported fiom seventeen wind tunnels world wide that were
carried out on the identicd modeIs at 2 : 100 scde. In general, the resuIts indicated that the
lab-to-lab variation in mean pressure coefficients was above 40 percent. However, the
valuable databases obtained were very helpful to improve wind tunnel simulation
techniques.
Ginger and Letchford (1992) investigated the flow separation and vortex formation
mechanism on a set of canopy roofs with roof angles of 0°, jO, 10°, 15', 22.5' and 30'. A
flow visualization test was c k e d out using oïl flow on the 22.5' roof. The r e s u l ~ agreed
well with those of Saathoff and Melbourne (1989), demonstrating that the flow
separation, particularly the vortex formation, was the cause of the large peak roof loads.
Furthermore, it was reported that the peak loads on roof corners were accompanied by a
stable conical vortex for the whole set of the slopes tested under oblique wind attacks.
Mean and rms pressure coefficients at corner and edge regions of a Bat rectangular roof
were measured by Tieleman, Surry and Lin (1994) under different wind profiles. The
measured results were compared with the field data obtained at Texas Tech University. It
was emphasized that better simdation of the turbulence scale could reduce the
inaccuracies of the wind tunnel results. Furthemore, this work and Surry and Lin (1995)
stated that rninor modification of roof geometry could affect roof loads to a large extent.
Separately, Tieleman, Surry and Lin (1994) and Kawai and Nishirnura (1 996) introduced
hypotheses of physical interpretation of the correlation of the flow characteristics in the
comer conical vortex with the roof surface pressure distribution directly beneath the
vortex. These studies dso provided suggestions on how to irnprove the wind tunnel
measurement techniques.
In order to provide an empïricai formula for estimating the design pressure coefficients
on gable roofs by using peak factor approach, Uematsu and Isyumov (1996) measured the
wind pressure coefficients on the leading edge a ~ d comer regions of a set of gabled-roof
buildings with the dope of 4:12 (18.4'). n i e time-space correlation of the pressure
distribution was investigated, based on the cross-spectra of the pressure fluctuations.
Effects of the spatial and time averages on the peak pressures were discussed. The work
was expected to contribute to the update of the Japanese wind standards.
2.2 JUSTIFICATION OF THE PRESENT STUDY
Previous studies have used three kinds of approaches to evaluate low-building roof loads,
narnely wind tunnel experimentation, full-scale investigation and theoretical simulation.
It can be found that the state of the art wind tunnel experimentation remaùis as the
practical approach in evaluation of roof wind loads, though the valuable theoretical
simulation and full-scale investigation have experienced developments recently, as
descnbed in Hoxey and Moran (1983), Tieleman et al (1994) and Kawai and Nishimura
(1996). However, despite the reliability of wind tunnel experimentation, accurate wind
tunnel simulation appears difficult for the current wind tunnel measurement techniques.
as indicated by Richardson et al (1990) and Cook et al (1 992). Errors in wind tunnel
experimentd results should be seriously concerned.
Regardless of difficulty in accurate wind tunnel simulation, significant achievements in
determination of low-building design wind loads have been made (Stathopoulos et al,
1985), leading to the development of the current format of wind provisions for low-
building roofs adopted by NBCC and ASCE-7. A key cornponent in this development
was the extensive experimental program camied out by Stathopoulos (1979) in which a
variety of low-rise buildings with different sizes, heights, roof slopes and upstream
exposures were examined.
Controversies have been presented in recent studies against the current wind provisions
of NBCC, with respect to the gable roofs of intermediate slopes. Examples include those
presented by Hoxey and Moran (1983), Meecham, Surry and Davenport (1991) and
Stathopoulos and Saathoff (1 99 1). However, there exist two reasons preventing those
research results fkom further codification usage. The first is that ordy few roof angles
were incorporated into these studies for the wind loading effect of roof angle, whose

effect on roof wind loads is so strong as shown in the preceding literature review. In fact,
most experirnents of these studies were carried out on various modek but with the
identical roof slope of 4:12. A single roof angle might not be sufficient to represent the
total intermediate slope range. Another reason was that there were inconsistencies in
experimental wind huuiel simulation, which will be fuily discussed in Chapter 4
In surnmary, the literature review shows that it is necessary to carry out a comparative
study to examine the suitabiiity of the current wind provisions. The study should be built
on wind tunnel experimental results based on commonly recognized experimental critena
in order to ensure consistency with full-scale data. Moreover, the tests should be able to
represent the intermediate slope as a whole range. Generally speaking, the present study
has incorporated these features so that it could be applied to the update of the current
wind provisions.
As a matter of fact, the present study follows the critena of the ASCE wind loading test
standard (1997). A set of five models with roof angles of IO0, l jO , 20°, 25' and 30' have
been constmcted in order to represent the intermediate roof range; and wind loading
information has been intensively measured. Two types of cornparison have been made:
first, the present results are compared with previous data; second, the present results are
compared with the current wind provisions. The f i s t type is for validation purposes, and
the second is to examine the suitability of the current wind provisions.
CHAPTER 3
EXPERIMENTAL METHODOLOGY
3.1 WIND TUMVEL AND ATMOSPHJ3RIC BOUNDARY LAYER WlND
SIMULATION
The experiments have been carried out in the boundary layer wind tunnel of the Centre
for Building Studies at Concordia University. The working section of the wind tunnel is
12.2m long and 1.8m wide. It has an adjustable roof height around 1.8m to provide
negligible pressure gradient in the test section. More details about this wind tunnel are
given by Stathopoulos (1984b) and M e r information on wind tunnel can be obtahed
Simiu and Scanlan (1986).
The boundary layer wind flow was simulated using trïangular boards, a steel plate and
carpet roughness. Four boards of the same triangdar shape were erected side by side on
the screen of the tunnel entrance and bound to the screen. The base and the height of each
of the boards are 190mm and 1200mm, respectively. The distance between the centre of
one of the two end boards to the tunnel wall is 350mm and the distance between the

boards themselves is 3 6 5 m centre to centre. The steel plate of 150mm height was
placed on the floor at a distance of 750mm parallel to the screen. Carpet roughness was
placed on the tunnel floor. These settings are used to generate an appropriate wind
profile rnatching that in typical open country exposure.
For the experimentd program, scaling factors of time, velocity and length were
determined at first. The length scale depended on the ratio of the thickness of the
simulated boundary layer to that in the real condition. The gradient height of 650mm
developed over the wind tunnel floor could approxhnately match 260m boundary layer
thickness in full-scale given the length scale as 1 :400. The free-stream wind speed in the
wind tunnel was set at 1 2 S d s given the assurnption of the velocity scale as 1:4, to
simulate the full-scale velocity of 5 0 d s at the atmospheric boundary layer height.
Corresponding to the lenath scale of 1 :400 and the velocity scale of 1:4, the time scale
was determined as 1:IOO. In this scale system, a 6-second sampling period matched an
equivalent 1 O-minute full-scale sarnpling period.
Figure 3.1 shows the longitudinal mean-velocity profile (VN,,) and turbulence-intensity.
profile ( V A , which were measured by a hot wire. In this figure, Z is a variable height
over the tunnel floor and 2, is the gradient height over the floor; V represents the wind
speed and V, is the tunnel wind speed at the gradient height, which was set at 12.5ds.
Also in this figure, the theoretical simulation of the expenmental mean-velocity profile
indicates that a power law simulation with an exponent of 0.14 is appropriate for the wind
tunnel simulation.
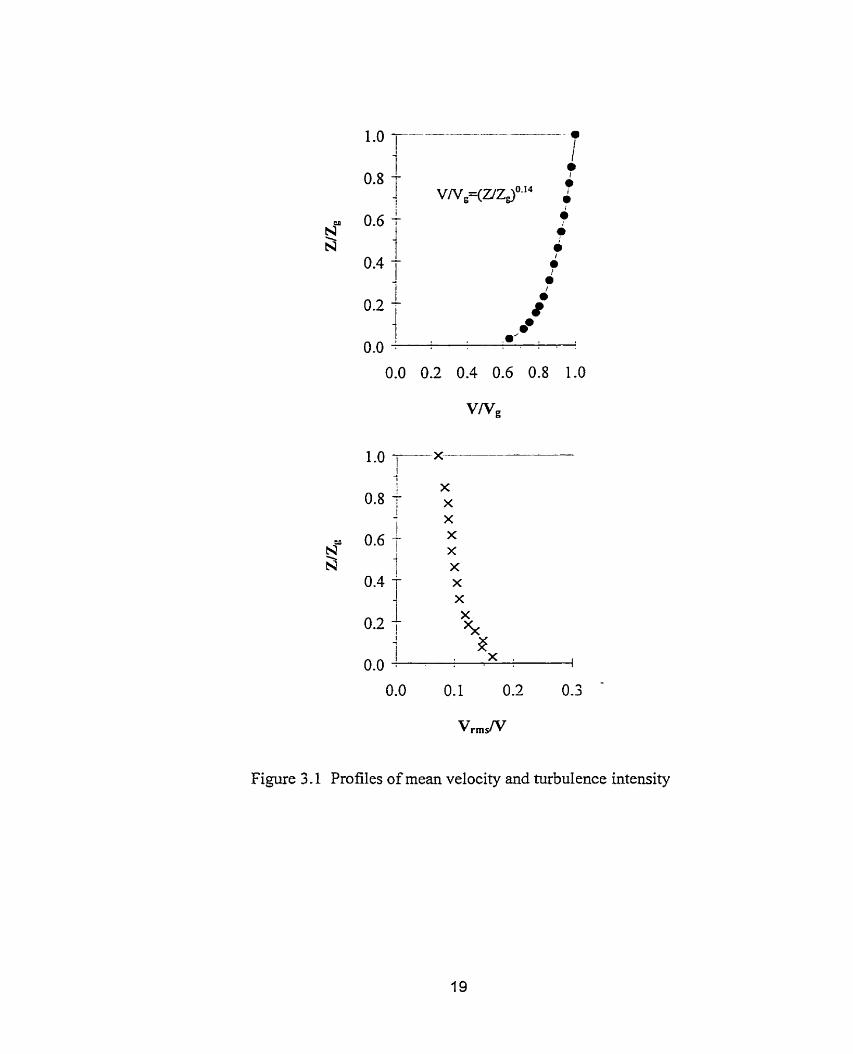
Figure 3.1 Profiles of mean velocity and turbulence intensity
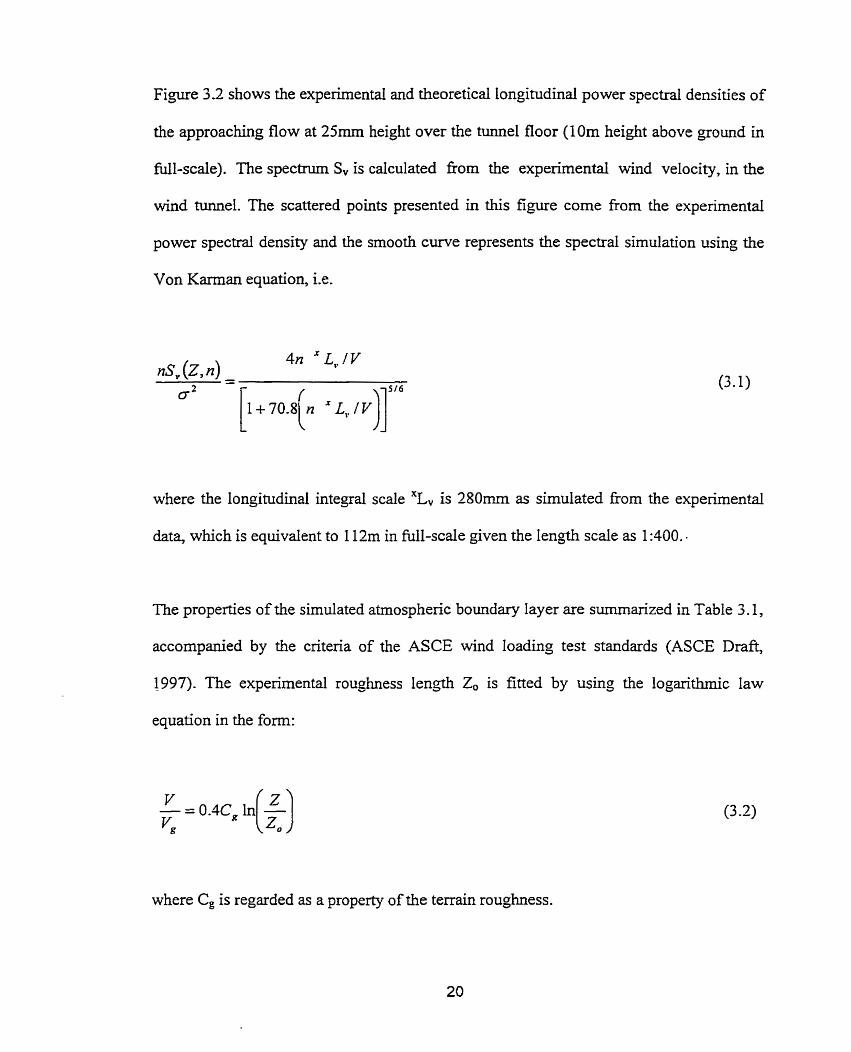
Figure 3.2 shows the experimental and theoretical longitudinal power spectral densities of
the approaching flow at 25mrn height over the tunnel floor (10m height above ground in
full-scale). The spectnun Sv is calculated fkom the experimental wind velocity, in the
wind tunnel. The scattered points presented in this figure corne fiom the experimentai
power spectral density and the smooth curve represents the spectral simulation using the
Von Karman equation, i.e.
where the longitudinal integral scale 'Lv is 2 8 0 m as simulated fiom the experimental
data, which is equivalent to 1 12m in full-scale given the lenad SC& as 1:400. -
The properties of the simulated atmospheric boundary layer are s m a r i z e d in Table 3.1,
accompanied by the critena of the ASCE wind loading test standards (ASCE Draft,
1997). The expenmental roughness len-gth 2, is fitted by using the logarithmic law
equation in the form:
where Cg is regarded as a property of the terrain roughness.

0.01
Figure 3 -2
0.1
Cornparison of experimental
10
and theoretical velocity
1 O0
spectra

Table 3.1 Cornparison of the experimental setting with the corresponding criteria of the ASCE Standard for wind Ioading tests (ASCE Dr&, 1997) - the curent geometrical scale is 1 :400
Terrain Description
1 Roughness length z,
I Gradient height Z ,
Mean veiocity power-law exponent a Longitudinal turbulence-intensity at z = 10m in full-scaie Integral length scale of Z = 10 m
Turbulence "L(m) 1 Z = 200m
Standard open country exposure
Open flat terrain; grass; few isoIated obstacles
0.03 m
Wind tunnel simuIation
Carpet roughness 0.07 mm
-1 scale values
Table 3.1 shows that the parameters of the present wind tunnel simulation generally
satise the criteria (ASCE Drafi, 1997), which indicates that the results obtained fiom the
present wind tunnel experiments could be appropnate and suitable for codification usage
as f;tr as accurate simulation is concemed.
3.2 MODEL CONFIGWTIONS
Five gable roof models with an interchangeable roof panel have been used for the wind
tunnel experiments. Figure 3.3 shows the original models in the wind tunnel. These
models had a set of roof angles of IO0, 15", 20°, 25" and 30°, which were used to
represent the intemediate slope range. The dimensions of the models are shown in Figure
3.4. The interchangeable panel had an area of 150x52 mm2, which was quivalent to
60x20.8m2 in Ml-scale. The five models had the sarne eaves height (h) of 27.5mm (1 lm
in Ml-scale) and the same long wall length (L) of 150 mm (60m in full-scale), but varied
mid-roof heights and varied building spans (B). Thus there is a variation of the ratio of
long wall length to building span (L/B). However, the difference of this ratio is not
considered significant in the present study.
The perspective view of these models is shown in Figure 3.5. It is indicated in this figure
that the wind azirnuth (a) started at O0 when the wind was normal to the ndgeline. It
increased in counter-clockwise direction.

Figure 3.3 A typical and a set of building models with the interchangeable roof panel

Fi-pre 3.4 Schematic illustration of the mode1 buildings in Ml-scale

Figure 3.5 Illustration of the mode1 buildings in full-scale
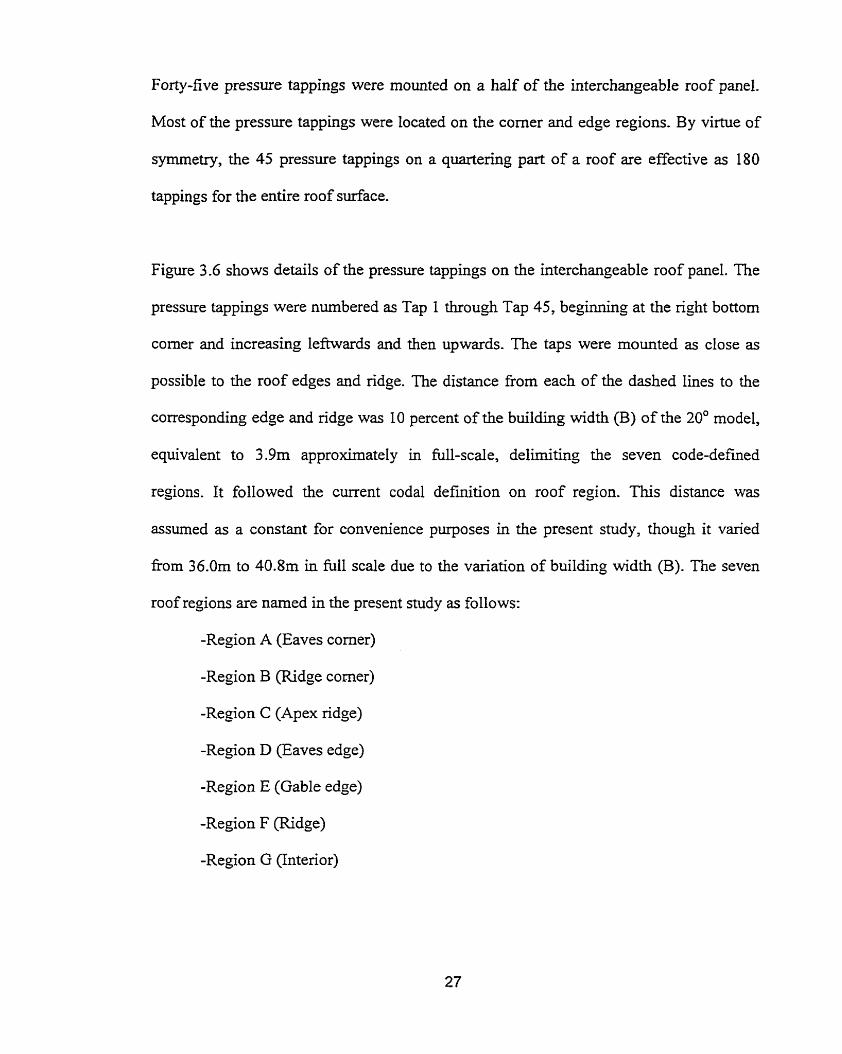
Forty-five pressure tappings were rnounted on a half of the interchangeable roof panel.
Most of the pressure tappings were located on the comer and edge regions. By virtue of
symmetry, the 45 pressure tappings on a quartering part of a roof are effective as 180
tappings for the entire roof surface.
Figure 3.6 shows details of the pressure tappings on the interchangeable roof panel. The
pressure tappings were nurnbered as Tap 1 through Tap 45, beginning at the nght bottom
comer and increasing leftwards and then upwards. The taps were rnounted as close as
possible to the roof edges and ridge. The distance firom each of the dashed lines to the
corresponding edge and ndge was 10 percent of the building width (B) of the 20' model,
equivalent to 3.9m approximately in full-scale, delirniting the seven code-defmed
regions. It followed the curent coda1 definition on roof region. This distance was
assurned as a constant for convenience purposes in the present study, though it varied
fiom 36.0m to 40.8m in full scale due to the variation of building width (B). The seven
roof regions are named in the present study as follows:
-Region A (Eaves comer)
-Region B (Ridge corner)
-Region C (Apex ndge)
-Region D (Eaves edge)
-Region E (Gable edge)
-Region F (Ridge)
-Region G (Intenor)

Figure 3.6 Schematic illustration of the tappings and the regions on the interchangeable roof panel (unit: mm)
Table 3.2 Tapping combinations used in area-averaged pressure calculations
Area code 1 Tapping A-O 1 The worst local
, . , A-5 1,899 A-6 1,8,9,11 A-7 1,2,8,9,10 A-8 1,2,8,9,10, i 1,12 B-O The worst local B- 1 36,39 B-2 3 6-3 7 , - -,- - B-3 1 39,40 B-4 1 36,37,39 B-5 36,37,38,39,40 C-O The worst local C- 1 3 1,41 D-O The worst iocal
Full-scale area(m2) 1 Area code Tapping 50.1 1 E-O The worst local
- . , , . , 5.8 E-5 18,19,20,21,22 9.6 26,.27,28 9.6 1 F-O The worst local
50.1 1 F-2 32,42 2.3 1 F-3 32,33,42,43 4.1 1 7 32,33,34,42,13,44 4.8 32.33.34.35 6.9 42,43,44,45 11.6 The worst local

Table 3.2 presents the combinations of those pressure tappings for the calculations of the
most critical area-averaged pressure coefficients, accompanied by their corresponding
full-scale areas. These tapping combinations were presumed to expose to the most criticai
area-averaged wind Ioads since the area-averaged loads here were merely the electricd
averages of the local loads that have been found to be the Iargest ones.
3.3 DATA ACQUISITION AND PROCESSING
3.3.1 Data Acquisition System and Measurement Program Setting
Pressure tappings consisting of lOmm length steel tubes of 0.8 mm inside diameter were
mounted on the mode1 roof panel, with flexible tubes 61 Ornm length and l.6mm interior-
diameter leading them to the pressure transducer. Restnctors were inserted within the
tubes at halfway of tube length, to provide a flat fiequency response above 100 Hz.
Frequencies of pressure fluctuations at the tappings are expected to be well below this
value (Saathoff and Stathopouios, 1992).
The 45 tubes were divided into 3 groups, 15 tubes each group. These 15 tubes of each
group could be in turn connected with the Scanivalve ZOC-14 electronic pressure
transducer that has altogether 16 pressure channels. Consequentiy, the 15 pressure
tappings of each group were comected to the 15 pressure channels on the pressure
transducer, while one pressure channel remained was lefi to be used by the pitot tube in
order to rneasure the reference fiee-stream velocity pressure.

A Scanivalve HyScan-1000 system was used for the data acquisition. A 60-MHz 80486-
based PC-AT computer was utilized to host the HyScan-1000 system and to control the
data acquisition. The pressure scanning systern was prograrnrned to record the pressure
signds through an andog/digit converter with the fiequency of 256Hz. The data were
streamed directly into the hard drive as time senes. During the pressure acquisition u s ,
the HyScan-1000 system provided the function of real-time visualization of the
magnitudes of the roof pressures. It is noteworthy that the mesuring fiequency response
of 256- is adequate in reducing the attenuation of wind peaks in wind tunnel
measurernent (Holmes, 1 9 84).
During the pressure signal acquisitions, every pressure tapping in each of the three
tapping groups was measured with six segments of pressure data in a given experimental
setting. Each data segment had a 6-second sampling time and in 256Hz sampling
frequency. Taking into account the M e scale, the sampling time and frequency of each
segment were equivalent to approximate 10 minutes and 3Hz in full-scale, respectively.
The five models were hvestigated for d l azimuths by virtue of the real-time visualization
fimction of the HyScan-1000 system, which could provide clear pictures of roof pressure
variations during data sampling. Thus some pressures in some wind azimuths which did
not appear critical were not saved into the hard disk space. AIthough the data samples
have been reduced in this way, 250MB hard disk space has been consurned at the final.
The detailed measurements were performed for the following eighteen wind azimuths: O0
(wind direction normal to the ridgeline), l jO, 30°, 45 O, 55', 60°, 65', 70°, 90 O (wind

direction normal to the gable wall), 120°, 130°, 13j0, 140°, 1 XI0, 1 80°, 22j0, 270' and
3 15'. These wind azirnuths appear either as critical azirnuths or characteristic ones.
3.3-2 Data Processing System
Roof pressure signals have been collected in form of time series. Typical time series
obtained are illustrated in Figure 3.7. Data processing programs were developed by using
the FORTRAN77 programrning language to calculate the local and area-averaged
pressure coefficients including their peaks.
Equations for the evaluation of the mean, minimum, maximum, and rms pressure
coefficients are presented as follows:
Mean pressure coefficient:
pressure coefficient:
Maximum pressure coeffkient:
Rms. pressure coefficient:

TAP 1 1
O 5 10 15 20 25 30 Second
TAP 7 1 4 1 1
O 5 1 O 15 20 25 30 Second
Figure 3.7 Typicd time series for 8 = 20' and a = 0'

where VH is the reference wind velocity measured at the mid-roof height in accordance
with the coda1 definition; p is the air density. In order to obtain their peaks, the Type4
extreme value analysis approach is used, which is descnbed in detail in the nex? sections.
Extrerne values of times series are important in determining the design wind Ioads.
Generally, the Type-1 extreme value analysis approach is regarded suitable as far as low-
building roof Ioading predictions are concemed (Mayne and Cook, 1980); and the
working approach (Gumbel, 1958) is briefly introduced as follows.
Let X, be the random variable associated with the extreme value of the initial variable X.
The cumulative distribution f ic t ion of the Type-1 asymptotic form for the distribution of
X, is as follows:
P(X, < x ) = exp(-exp(-(x - u) / s))
where u corresponds to a characteristic largest value of the initial variable X (mode) and s
corresponds to a measure of dispersion of X,. The extrema1 parameters s and u can be
estimated by u s h g Gumbel's plot by taking twice the logarithm on both sides of Equation
3 -7, which becomes:
The probability term P can be determined as follows: the observed extreme values, in
present case is 18 extreme values, evenly extracted from the 6x6-second pressure record

time senes (the 3 highest peaks fiom each segment), are sorted into ascending order of
magnitude, d e r which cach is assigned a rank, r, where r = 1 for the smalfest and r = Q
for the largest of Q values. An estimate of P corresponding to each extreme value can be
calculated fiom their ranks using the following equation:
r p z - Q + 1
The mode (u) and dispersion (s) can be detemiined fiom plotting Equation 3.8. Mode
corresponds to the x value when
is zero and the dispersion is the slope of the Iine fitting the data.
The scheme for generating the area-averaged pressure coefficients has been presented in
Table 3.2. It is noteworthy that the electric averaging approach utilized for the present
study to measure the instantaneous spatially averaged pressure acting over a rectangular
area is different -fiom the pneumatic averaging technique developed by Surry and
Stathopoulos (1 978).

3.4 REPEATABILITY OF MEASUREMENT RESULTS
Figure 3.8 shows the repeatabiiity of the wind tunnel results. Two sets of C,,, data have
been measured in the sarne experirnental setting on two occasions, 30 days apart, on Taps
1 to 45 on the 15'-roof under 60' wind azimuth. Such an agreement is typical for other
cases tested and it is quite encouraging for M e r application of the present experirnental
resdts.

Figure 3.8 Repeatability of typical measured mean pressure coefficients

CHAPTER 4
RESULTS AND DISCUSSION
4.1 GENERAL DESCRIPTIONS
The current wind provisions classi@ the low-building gable roofs into three categones in
terms of roof dope. The provisions also separate the roof into seven roof regions, based
on distributions of most critical local pressure coefficients on these roof regions. This is
shown in Figure 4.1, which will
Furthemore, the wind pressure
- loadùlg definitions for the roofs
be intensively used in this and the following chapters.
coefficient specifications provide pressure zoning and
based on the similarities of their regional most-critical
pressure coefficients. These roof regions can be grouped into pressure zones, provided
that the regions grouped together have similarity in terms of their most critical regional
pressure coefficients. For the intermediate roofs, the pressure zones can be called as Zone
1 (Eaves and Ridge Corners), which includes Regions A and B, Zone 2 (Edges near
Apex), which includes Regions C and E, Zone 3 (Edge and Ridge), which includes
Region D and F, and Zone 4 (Interior), which hcludes Region G.
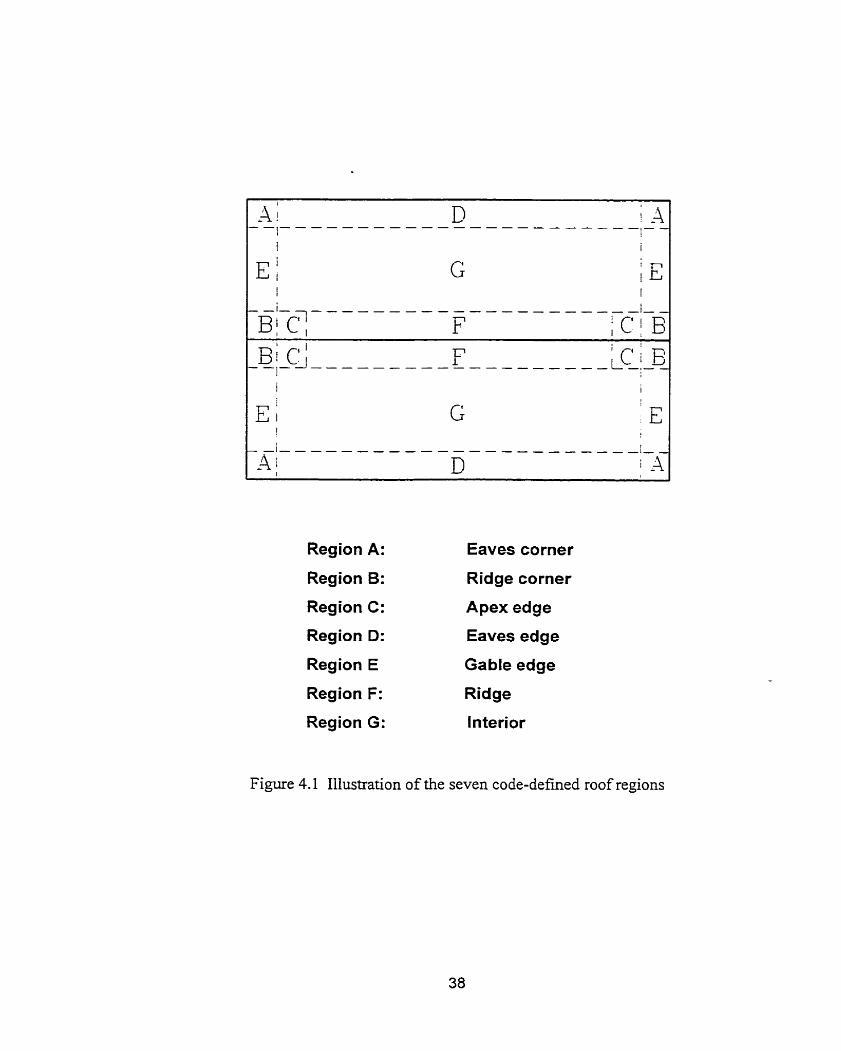
Region A: Eaves corner
Region B: Ridge corner
Region C: Apex edge
Region D: Eaves edge
Region E Gable edge
Region F: Ridge
Region G: lnterior
Figure 4.1 Illustration of the seven code-defined roof regions

In this chapter, the discussion on the present results is carried out with respect to roof
region, pressure zoning and loading and dope range, which are the major concems of the
curent wind provisions. The fmdings in this discussion will provide solid information for
the codification process carried out in the next chapter. Prior to the discussion, the
cornparisons of the present results with those fiom previous studies are conducted at first
for the purpose of validating the present experimental results.
4.2 PREWOUS DATA AND PRESENT RESULTS
In this section, the present wind pressure coefficients obtained fiom four wind azimuths
of 0" 60°, 90" and 135" are compared with the previous research fmdings. The zero wind
direction is a characteristic wind direction and the dope effect on flow separation and
attachment has been mostly investigated by previous studies in this wind direction. At the
same time, it has been found that most critical pressure coefficients are generally induced
by around 60°, 90" and 135" wind azimuths.
Figure 4.2 compares the experimental pressure coefficients measured at O0 wind azimuth
along the central lines of the roofs across ndge with those fiom previous studies. These
diagrams describe the relationship between the roof pressure distribution and the flow
separation, besides the validation of the results of the present study.
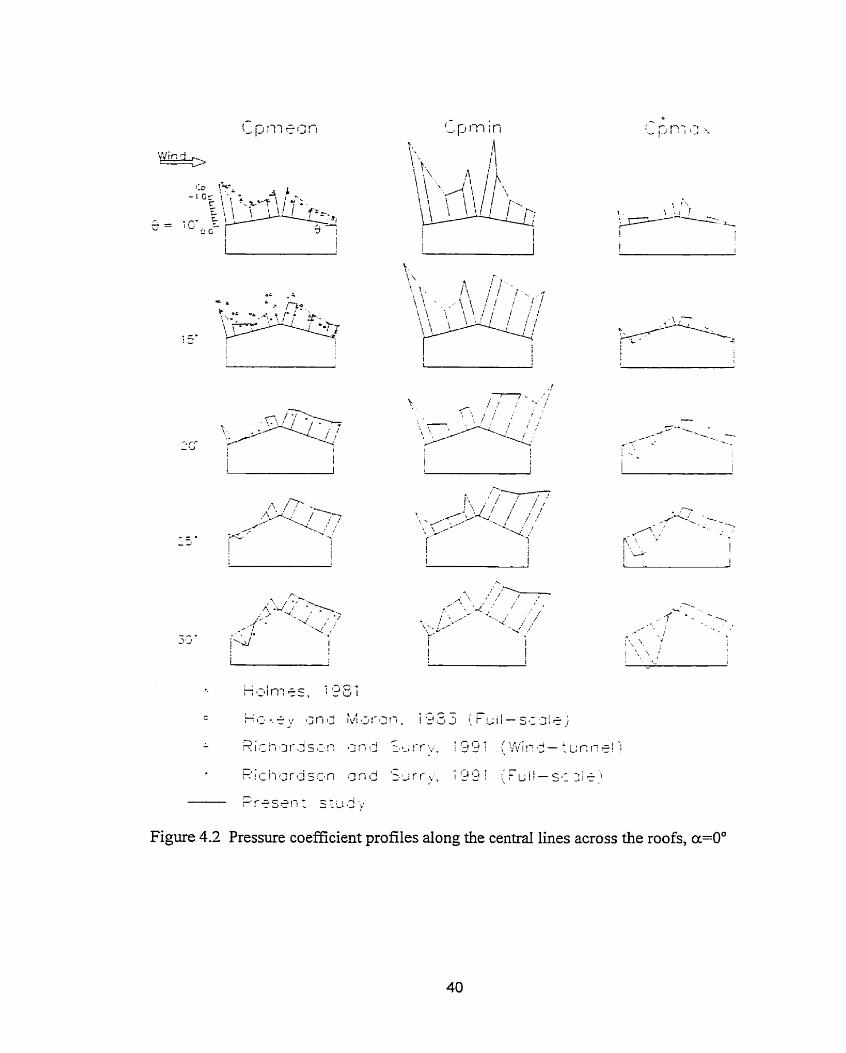
Figure 4.2 Pressure coefficient profiles dong the central lines across the roofs, a=OO
The data incorporated in Figure 4.2 corne from the previous wind tunnel and full-scale
research studies for cornparison purposes, which include Holmes (1981), Hoxey and
Moran (1983) and Richardson and Surry (1991). It is noted that al1 of these previous data
available are mean pressure coefficients.
While a strong wind flow separation occurs at the leading edge when 6 =IO0 and l5', high
suctions are induced near the eaves and the ridge. When 6 =30°, a different flow pattern is
created with flow attaching ont0 the leading edge (positive mean) and accelerating or
even separating half way (negative mean) over the windward slope. In the latter case, the
maximum pressure coefficients over the windward slope exceed, in maa@tude, the
minimum pressure coefficients. Furthemore, the other two circumstances (8 =20° and
25") represent the transition of flow pattern, which is quite complex as indicated by the
variations in mean and fluctuating pressure coefficients. Except for the IO0-roof, the
Ieeward slopes are exposed to similar negative pressures somewhat independent of the
roof angle due to the second separation from the ridgeline.
For the IO0-roof, both the wind tunnel and full-scale data measured by Richardson and
Surry (1 99 1) agree well with the present results. For the 15'-roof, the full-scale data from
Hoxey and Moran (1983) agree well with the wind-tunnel data fiom Richardson and
Surry (1991) but they have higher values than those measured in the present study.
Agreement is better among the results of Holmes (1 98 l), the full-scale data of Richardson
and Surry (1991) and those of the present study. For the 20"- and 30"-roofs, only the

pressure coefficients measured by Holmes (1981) are available, whose values are
comparabIy lower than those of the present study.
Generaily speaking, in spite of some differences in terms of building dimension and flow
characteristics, these wind tunnel results appear to be in reasonable agreement. Some of
the differences in the pressure coefficients could be also due to differences in the
experimentai settings. More details about the experimental settings used in the previous
studies, when available, are presented in the following comparisons.
Figure 4.3 presents mean pressure coefficient contours for the normal wind direction,
measured on the roofs of 15O, 20" and 30" by Holmes (1994) and by the present study.
The agreement between these two studies is generally satisfactory, though the present
data measured for the corner regions are comparably larger than those of Holmes (1994).
The difference shown in the cornparison may be amibuted to the difference in the
geometrical ratio of eaves height to the long wall length (h/L), which is 0.2 for the present
study while that of Holmes (1994) is 0.4. Furthermore, it is noted that the eaves had
overhangs in the study of Holmes (1994).
In Figure 4.4a, the present data measured for the 20" roof are compared wïth those
measured by Meecham et al (1 99 1) on a 18.4" roof (slope: 4: 12). Both studies are carried
out on wind-tunnel open country exposures; however, the power-law exponent was equal

Present study
Holmes (1 994)
Figure 4.3 Mean pressure coefficients measured in this snidy and those presented by Holmes (1994) for three roof slopes at O" wind azùnuth
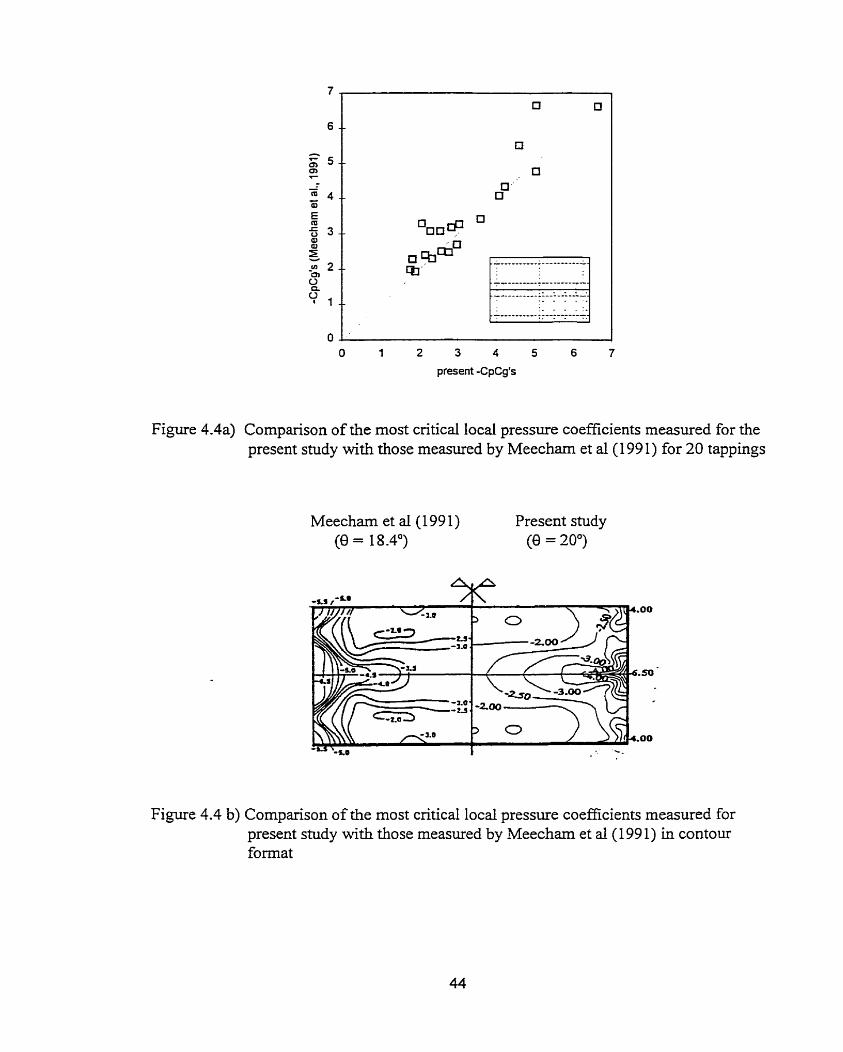
Figure 4.4a) Cornparison of the most critical local pressure coefficients measured for the present study with those measured by Meecham et al (1991) for 20 tappings
Meecham et a i (1991) Present study (9 = 18.4") (0 = 20')
Figure 4.4 b) Cornparison of the most cntical local pressure coefficients rneasured for present study with those measured by Meecham et a l (1991) in contour format

to 0.14 in the present study as opposed to 0.19 in the research of Meecham et al (1 991).
The cornparison is in terms of most critical local pressure coefficients, with the present
results interpolated into the corresponding locations of those tested by Meecharn et al
(1991). Figure 4.4b compares the same data in pressure coefficient contour form. The
data of Meecham et al (1991) seem to be somewhat higher than those of the present
study, paaicularly for those on the region of Eaves corner.
The discrepancies are Iikely due to the differences between the two studies in wind
simulation and mode1 configuration. Since the terrain exposure of Meecham et al (1991)
is rougher than that of the present study and rougher terrain could induce higher peak
pressure coefficients (Holmes, 1983), the differences in the pressure coefficients are
reasonable. The difference could also be attributed to the difference in the roof dopes that
rnay strongly affect the roof wind loads as discussed before.
Figures 4.5 through 4.7 show the pressure coefficient contours from Uematsu and
Iysumov (1996) and the present study, both of which are based on the experimental mean
and minimum values. The rnaapitudes of the pressure coefficients of Uematsu and
Iysumov (1996) are higher than those of the present study. This is not surprishg since the
terrain exposure simulated by Uematsu and Isyumov (1996) was rougher as indicated by
its power law exponent of 0.17. The roof angle tested by Uematsu and Isyumov (1996) is
the same as that of Meecharn et al (1 991) of 18.4' (dope: 4: 12), which is also different
from the present 20'-roof taken into the comparisons.

Uematsu and Isyumov(1996)
(0 = 18.4')
!
Present study
(0 = 20")
I -. L :
L.1: ,!' 6 0 =
Mean pressure coefficients
Minimum pressure coefficients
Figure 4.5 Cornparison of the mean and minimum pressure coefficients measured for the present study with those fiom Uematsu and Isyumov (1996)

Uematsu and Isyumov(l996) (9 = 1 8.4")
Present study
Mean pressure coefficients
Minimum pressure coefficients
Figure 4.6 Cornparison of the mean and minimum pressure coefficients measured for the present study with those fkom Uematsu and Isyumov (1996)

Uematsu and Isyurnov(1996) (0 = I 8.4")
Present study (0 = 30')
Mean pressure coefficients
Minimum pressure coefficients
Figure 4.7 Cornparison of the mean and minimum pressure coefficients measured for the present study with those fiom Uematsu and Isyumov (1996)
The present results so far have been compared with data fiom previous wind tunnel and
full-scale studies in terms of mean and minimum pressure coefficients. Although some
differences have been found through the comparisons, the agreement is generally
reasonable.
It is a1so to be noted that al1 of those experimental data from different studies are not f a
from each other in terrns of pressure magnitude. However, data £iom Meecharn et al
(1 99 1) and Uematsu and Isyurnov (1 996) are generally higher than the present results,
while the wind tunnel data of Holmes (1994) and the full-scale data fiom Richardson and
Surry (1991) are generally lower than the present ones. Moreover, the data fiom Holmes
(1 98 1) agree well with the present results, for the particular configuration of 15" roof
angle.
Therefore, the present experimental results appear consistent with those of previous
studies for sirnila configurations. This validation process, dong with the appropriate
wind tunnel simulation (see Table 3 4 , shows that the results of the present study are
suitable for codification purposes.
4.3 LOCAL PRESSURE COEFFICIENTS
Roof stnicturd components, such as boIts, fasteners and secondary structural members,
are directly exposed to local wind forces. Local suction seerns to play a more important
role for gable roofs of intermediate slopes. For simplicity, the term pressure used in this
thesis could be applied to both positive pressure and negative pressure (suction),
depending on the magnitudes of the respective pressure coefficients. The most cntical
local pressure coefficients and their distributions are important for the codai d e f ~ t i o n s
on roof region and pressure zoning and loading. In this section, research fmdings on the
behaviour of the local pressure coefficients will be presented at first, followed with the
regiond most criticai local pressure coefficients and the conditions for their occurrences.
At the sarne time, the respective parts of the current wind provisions will be discussed.
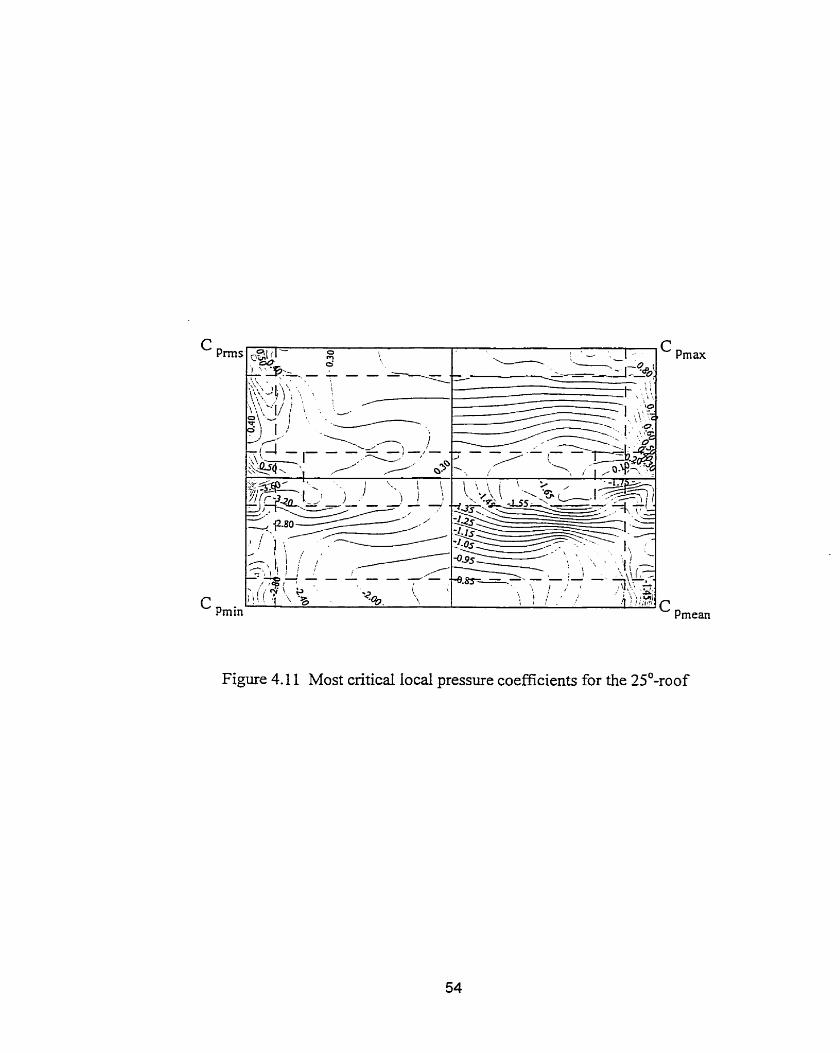
The distributions of the most critical mean, minimum, maximum and rms local pressure
coefficients measured fiom al1 pressurc tappuigs are presented in pressure contour forms
in Figures 4.8 through 4.12, and the distributions of those local pressures coefficients
under the wind azimuths of 60°, 90°, 135' are presented in Figures A-1 -1 through A- 1 -20
in Appendix-1. These pressure contours provide global pictures for the local pressure
distributions. It is to be noted that dl these pressure contours have taken advantage of the
symmetries of the roof models, thus the contours on a quartering part of a roof c m reflect
those for the entire roof. In these figures, the dashed lines superimposed on these pressure
contours delùnit the boundaries of the code-defined roof regions, which has been shown
in Figure 3.6.
It is found in these pressure contours b a t the regional charactenstics of these local
pressure coeffkients are distinctive, and the current coda1 definition on roof region seems

Pmax
Pmean
Fiame 4.8 Most critical local pressure coefficients for the IO0-roof

Prnax
Pmean
Figure 4.9 Most critical local pressure coefficients for the 1 s'-roof

Figure 4.10 Most criticai local pressure coefficients for the 2O0-roof
Pmax
Pmean
Figure 4.11 Most critical iocal pressure coefficients for the 25'-roof

Pmax
Pmean
Figure 4.12 Most critical local pressure coefficients for the 3 0'-roof

appropnate. The most cntical local pressure coefficients on most parts of the roof regions
near gable ends and ridgeline are very high, particularly for Ridge comer. These large
pressure coefficients are accompanied by the conical vortices just behind the ridge
(Kanda and Maruta, 1993). On the other hand, the most critical local pressure coefficients
on Eaves edge are relatively low. It shows that the wind loading effect of the first
separation of flow occuming at the leading edges is not so strong as that at ndge and
gable ends. Furthemore, the local most cntical pressure coefficient distributions on Apex
edge (Region C) do not show distinctive characteristics by comparison with those
pressure coefficients on their neighbourhood.
Figure 4.13 shows the minimum local pressure coefficients measured at Taps 29, 36, 39,
40 and 4 1 that are located near Ridge comer. When the wind azimuth (a) is around 13 5',
the peak suction appears with a coefficient of -5.1 on the 10'-roof, and of -6.6 on the 20'-
roof Such peak suction decreases when the roof angle reaches 25O, and almost disappears
on the 30'-roof. The coefficient of -6.6 measured on the 20'-roof is the Iargest value of
the pressure coefficients measured in the whole experimental program. It is also f o n d
that these local pressure coefficients are relatively low for most of the wind azimuths,
which shows that the directionality factor has to be considered in evaluation of the roof
wind loads. Furthemore, the local pressure coefficients measured on the 20'-roof are
generally higher than those measured on the other roofs for almost al1 these local
tappings, while the local pressure coefficients of the 30'-roof have considerable smailer
values.

-7.0 O 60 120 180 240 300 360
Azirn uth a (degree) Azim uth a (degree)
-6.0 r A g= 25'
-7.0 O 60 120 180 240 300 360
Azim uth a (degree) O 60 120 180 240 300 360
Azim uth a (degree)
-7.0 ! O 60 120 180 240 300 360
Azim uth a (degree)
Figure 4.13 Minimum local pressure coefficients at taps near Ridge corner
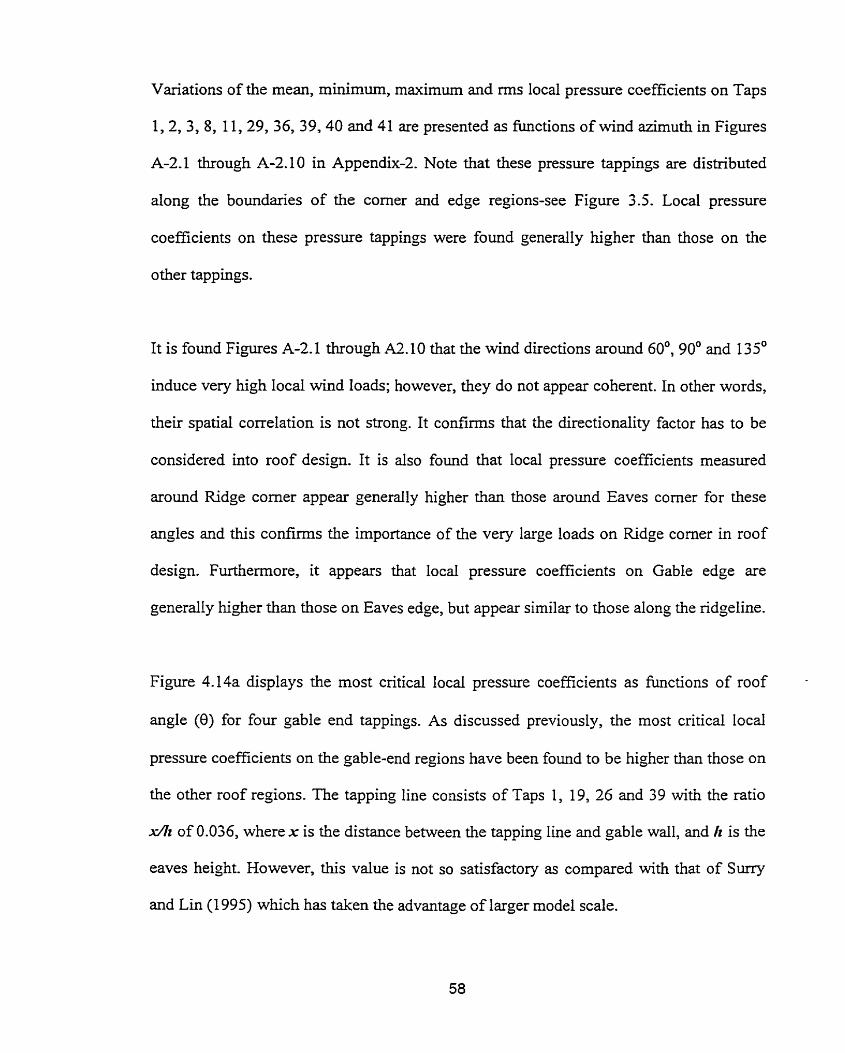
Variations of the mean, minimum, maximum and m s local pressure coefficients on Taps
1,2,3, 8, 11,29, 36,39,40 and 41 are presented as functions of wind azimuth in Figures
A-2.1 through A-2.10 in Appendix-2. Note that these pressure tappings are distributed
along the boundaries of the comer and edge regions-see Figure 3.5. Local pressure
coefficients on these pressure tappings were found generally higher than those on the
other tappings.
It is found Figures A-2.1 through A2.10 that the wind directions around 60°, 90' and 135'
induce very high local wind loads; however, they do not appear coherent. In other words,
their spatial correlation is not strong. It confirms that the directionality factor has to be
considered into roof design. It is also found that local pressure coefficients measured
around Ridge comer appear generally higher than those around Eaves corner for these
angles and this confirms the importance of the very large loads on Ridge comer in roof
design. Furthemore, it appears that local pressure coefficients on Gable edge are
generally higher than those on Eaves edge, but appear similar to those along the ridgeline.
Figure 4.14a displays the most critical local pressure coefficients as fimctions of roof -
angle (O) for four gable end tappings. As discussed previously, the most critical local
pressure coefficients on the gable-end regions have been found to be higher than those on
the other roof regions. The tapping line consists of Taps 1, 19, 26 and 39 with the ratio
d z of 0.036, where x is the distance between the tapping line and gable wall, and It is the
eaves height. However, this value is not so satisfactory as compared with that of Surry
and Lin (1 995) which has taken the advantage of larger mode1 scale.

Tap 1 Tap 19
Tap 26 Tap 39
Figure 4.14a) Most critical local pressure coefficients along the roof gable end as functions of roof angle (8)
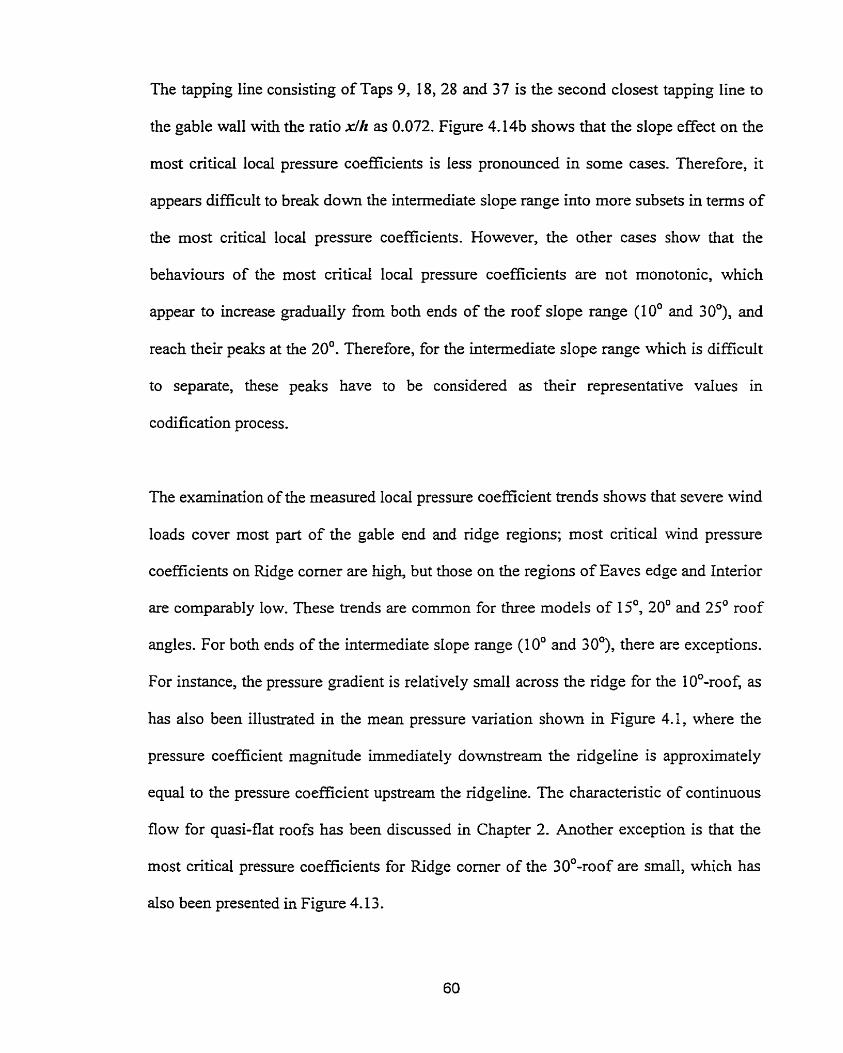
The tapping line consisting of Taps 9, 18,28 and 37 is the second closest tapping line to
the gable wall with the ratio xfh as 0.072. Figure 4.14b shows that the slope effect on the
most critical local pressure coefficients is less pronounced in some cases. Therefore, it
appears difficult to break down the intermediate dope range into more subsets in t ems of
the most critical local pressure coefficients. However, the other cases show that the
behaviours of the most cnticai local pressure coefficients are not monotonie, which
appear to increase gradually fiom both ends of the roof slope range (IO0 and 30°), and
reach their peaks at the 20'. Therefore, for the intermediate slope range which is difficult
to separate, these peaks have to be considered as their representative values in
codification process.
The examination of the measured local pressure coefficient trends shows that severe wind
loads cover most part of the gable end and ndge regions; most cntical wind pressure
coefficients on Ridge comer are high, but those on the regions of Eaves edge and Interior
are comparably low. These trends are cornmon for three models of ljO, 20' and 25' roof
angles. For both ends of the intermediate slope range (1 0' tuid ;O0), there are exceptions.
For instance, the pressure gradient is relatively small across the ndge for the IO0-roof, as
has also been illustrated in the mean pressure variation shown in Figure 4.1, where the
pressure coefficient magnitude imrnediateiy downstream the ridgeline is approximately
equal to the pressure coefficient upstream the ridgeline. The characteristic of continuous
flow for quasi-flat roofs has been discussed in Chapter 2. Another exception is that the
most criticai pressure coefficients for Ridge comer of the 30'-roof are small, which has
also been presented in Figure 4.13.

Tap 9
Tap 28
Tap 18
10 15 20 25 30
e ( O )
Tap 37
Figure 4.14b) Most criticai local pressure coefficients near the roof gable end as functions of roof angle (8)

The discussion on the most critical local pressure coefficients presented as functions of
roof angle may lead to some modifications to be proposed for the current wind provisions
in terms of the slope range, particularly related to die classification of both ends of the
dope range. The most critical local pressure coefficients, together with their occurrence
conditions in terms of roof angle and wind azimuth are presented in Table 4.1. These
information and discussion will be addressed in the following chapter.

Table 4.1 Regional most criticai local pressure coefficients
Note: the acronym 'T39-20- 150" represents Tap39,20° roof angle and 150" wind azimuth
C,,, 1.2 0.8
Occurrence location TO 1 - 1 0-065 T39-20- 1 50
Region A R e ~ o n B
Occurrence location T l 1-30-030 T30-30-000
Cpmin -4.9 -6.6

4.4 -A-AVERAGED PRESSZTRE COEFFICIENTS
In addition to local pressure coefficients, area-averaged pressure coeEcients are very
significant. The wind loads acting on roof members and cladding are generally due to
area-averaged pressures. Most cntical area-averaged pressure coefficients are important
in order to examine the suitability of the current wind provisions. In fact, the design wind
loads presented in the current wind provisions are made up of the most critical area-
averaged pressure coefficients specified as fünctions of tributary area. In this section,
variations of the most cntical area-averaged pressure coefficients obtained in the present
study will be discussed as functions of roof angle and wind azimuth. Furthemore, the
most critical area-averaged pressure coefficients will be arranged as functions of tributary
area, in consistent with the curent codal format,
Figures 4.15 through 4.17 display the area-averaged pressure coefficients as functions of
wind azimuth for Eaves comer, Ridge corner and Gable edge in their entire areas,
respectively. Recall that in the preceding section the local pressure coefficients measured
on these three regions are generally larger than those on the other roof regions. The most
critical suction coefficient of -3.2 occurs when wind azimuth a=90° and roof angle 8=2j0
for Eaves corner. The most critical pressure coefficient of 1.1 occurs on the 30'-roof
under 30' wind azimuth. For Ridge comer, the most critical suction coefficient equals to
-4.7 on the 20'-roof at 140' wind direction; the most cntical pressure coefficient equals to
0.3 on the 30'-roof under 30' wind azimuth. For Gable edge, the minimum pressure
coefficient of -2.9 occurs when a is130° on the 15'-roof, whereas the peak positive
pressure coefficient equals 0.8 occurring when a is 30' on the 30'-roof.
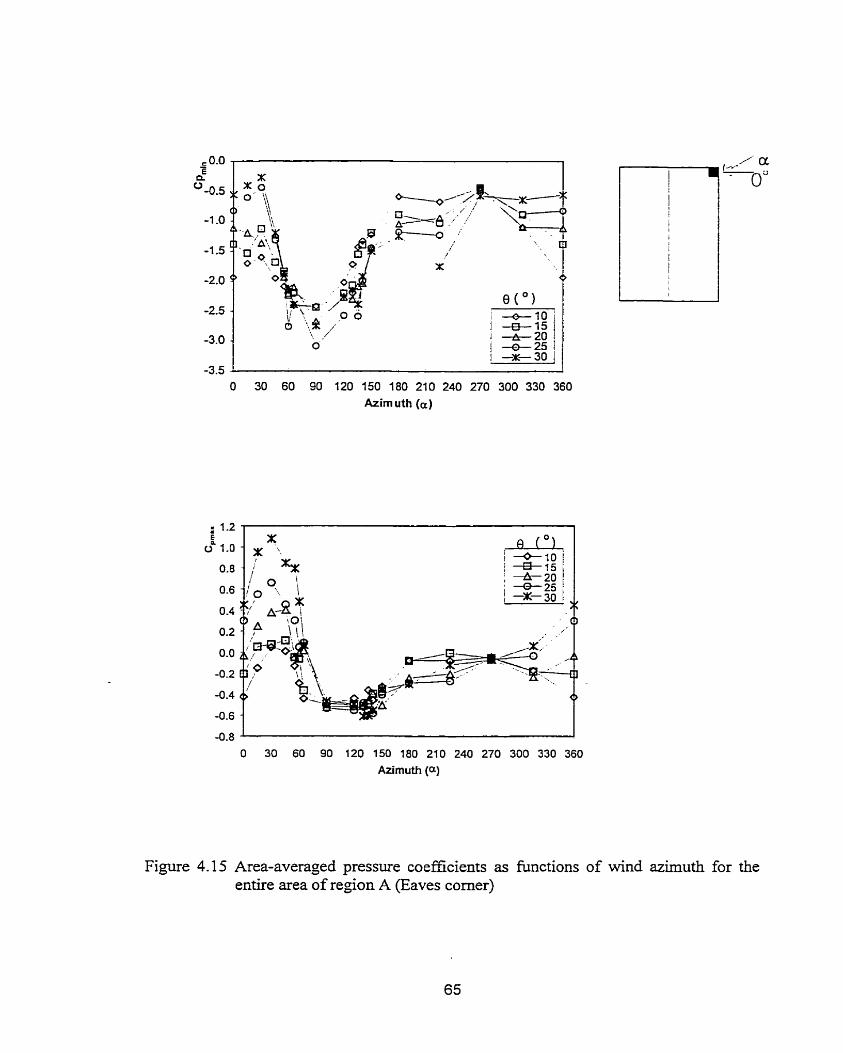
O 30 60 90 120 150 180 210 240 270 300 330 360
Azim uth (a)
O 30 60 90 120 150 180 210 240 270 300 330 360
Azim uth (a)
Figure 4.15 Area-averaged pressure coefficients as functions of wind azimutth for the entire area of region A (Eaves corner)
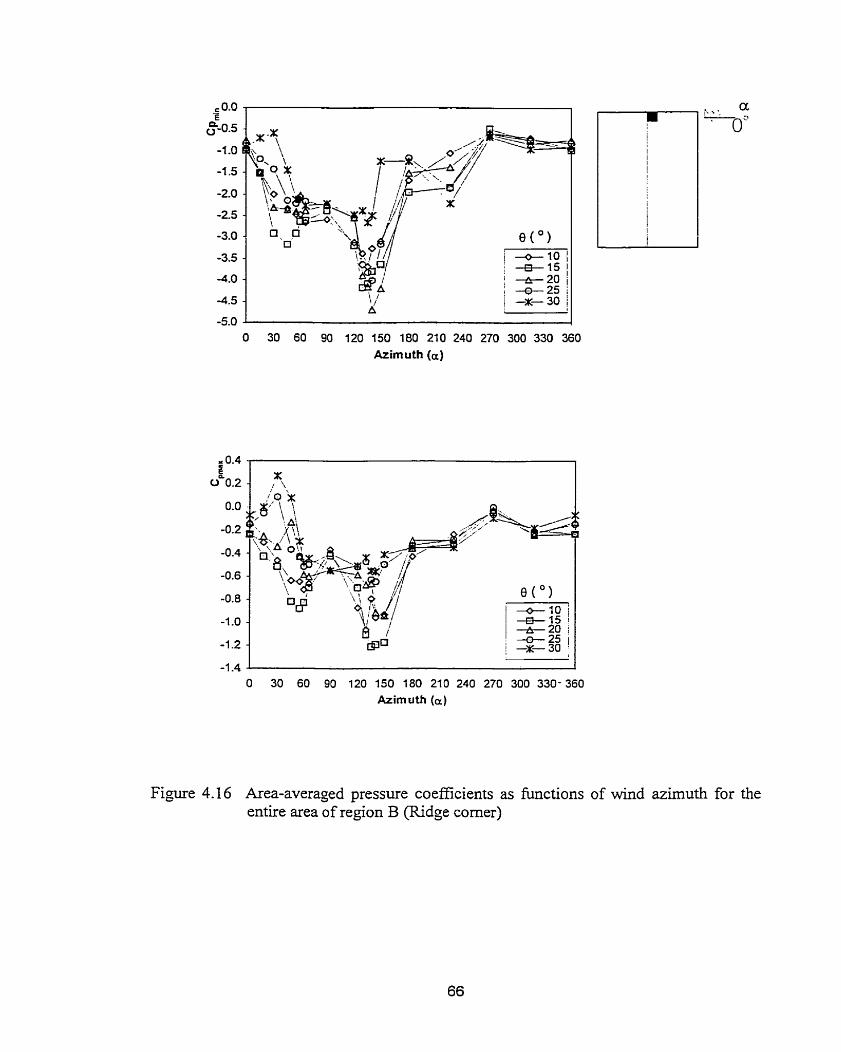
.. O 30 60 90 120 150 180 210 240 270 300 330- 360
Azimuth (a)
Figure 4.16 Area-averaged pressure coefficients as functions of wind azimuth for the entire area of region B (Ridge corner)

O 30 60 90 120 150 180 210 240 270 300 330 360 Azim uth (a)
1
O 30 60 90 120 150 180 210 240 270 300 330 360 Azimuth (a)
Figure 4.17 Area-averaged pressure coefficients as functions of wind azimuth for region E (Gable edge)
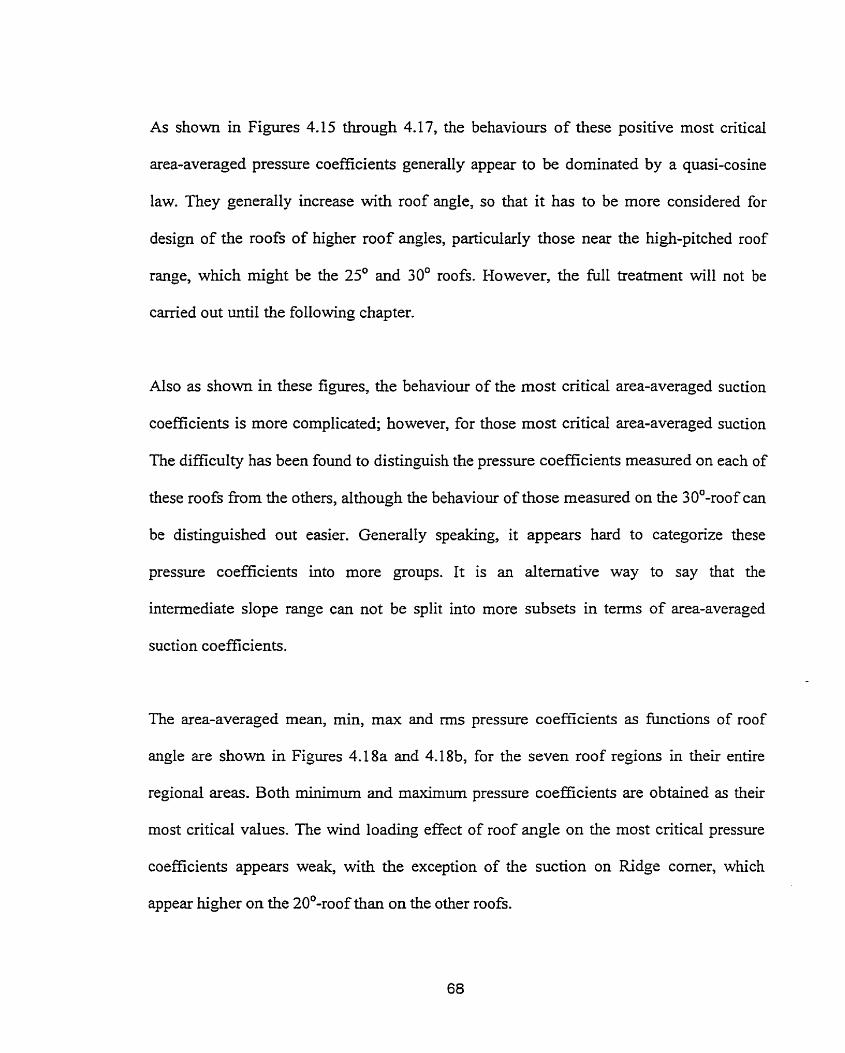
As shown in Figures 4.15 through 4.17, the behaviours of these positive most cnticai
area-averaged pressure coefficients generally appear to be dorninated by a quasi-cosine
law. They generally increase with roof angle, so that it has to be more considered for
design of the roofs of higher roof angles, particularly those near the high-pitched roof
range, which might be the 25' and 30' roofs. However, the full treatrnent will not be
carried out until the foliowing chapter.
Also as shown in these figures, the behaviour of the most critical area-averaged suction
coefficients is more complicated; however, for those most critical area-averaged suction
The diffrculty has been found to distinguish the pressure coefficients measured on each of
these roofs fiom the others, dthough the behaviour of those measured on the 30'-roof can
be distinguished out easier. Generally speaking, it appears hard to categorize these
pressure coefficients into more groups. It is an alternative way to Say that the
intermediate slope range c m not be split into more subsets in texms of area-averaged
suction coefficients.
The area-averaged mean, min, max and miç pressure coefi7cients as hc t i ons of roof
angle are shown in Figures 4.18a and 4.18b, for the seven roof regions in their entire
regional areas. Both minimum and maximum pressure coefficients are obtained as their
rnost critical values. The wind loading effect of roof angle on the most critical pressure
coefficients appears weak, with the exception of the suction on Ridge corner, which
appear higher on the 20"-roof than on the other roofs.

Q(")
Eaves corner
Apex edge
O ( " )
Ridge corner
Eaves edge
Figure 4.18a) Most critical area-averaged pressure coefficients as functions of roof angle for Eaves Corner, Ridge corner, Apex edge and Eaves edge
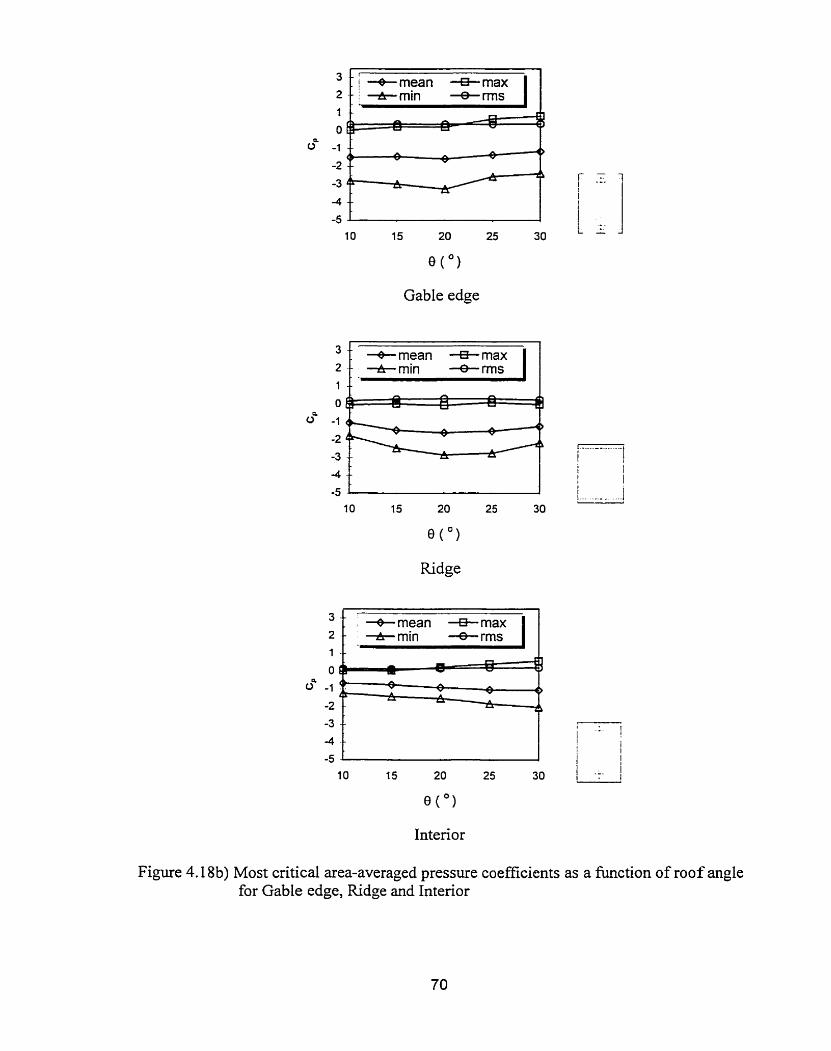
W " )
Gable edge
Ridge
Figure 4.18b) Most cntical area-averaged pressure coefficients as a function of roof angle for GabIe edge, Ridge and Interior

The most critical area-averaged pressure coefficients that are associated with their
respective roof angles and wind azimuths for each of the seven roof regions are presented
in Table 4.2. These results, accompanied with those already shown in Table 4.1, may
have distinctive usage in the codification process.
The most cntical area-averaged pressure coefficients for each of the seven regions as
functions of the tributary area are presented in Figures 4.19 and 4.20, in the sarne format
as that used by the current wind provisions. Figure 4.19 shows that the negative pressure
coefficients on Ridge corner are significandy higher than those in the other roof regions.
At the same time, it is also distinctive that the difference between the pressure
coefficients of the IO0-roof and those of the other roofs is relatively small. Finally,
positive pressure coefficients are low with the exception of those for the 30'-roof. Al1
these information will be discussed in the following chapter.
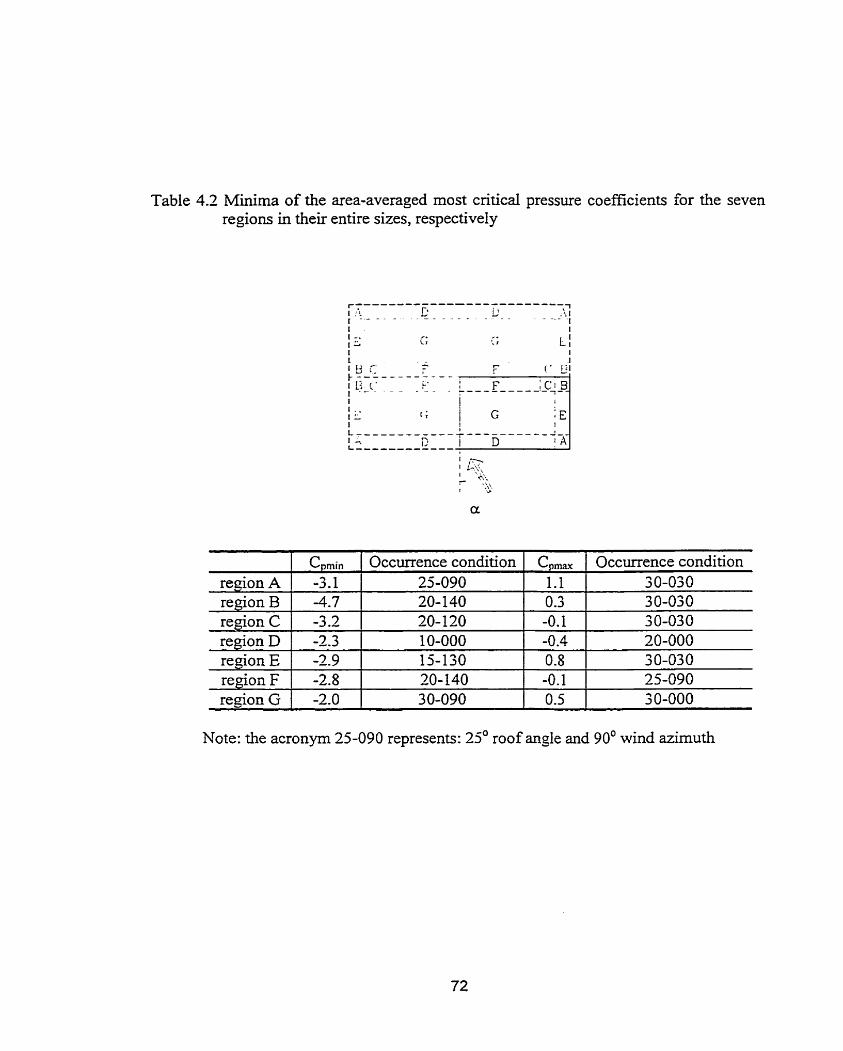
Table 4.2 Minima of the area-averaged most critical pressure coefficients for the seven regions in their entire sizes, respectively
Note: the acronym 25-090 represents: 25' roof angle and 90' wind azimuth
re-ion A region B region C region D
Cpmin -3.1 -4.7 -3.3 -2.3
region E 1 -2.9 region F 1 -2.8
Occurrence condition 25-090 20- 140 20- 120 10-000 15-130 20-140 -
C,, 1.1 0.3 -0.1 -0.4
Occurrence condition 30-030 30-030 30-030 20-000
0.8 -0.1
30-030 25-090
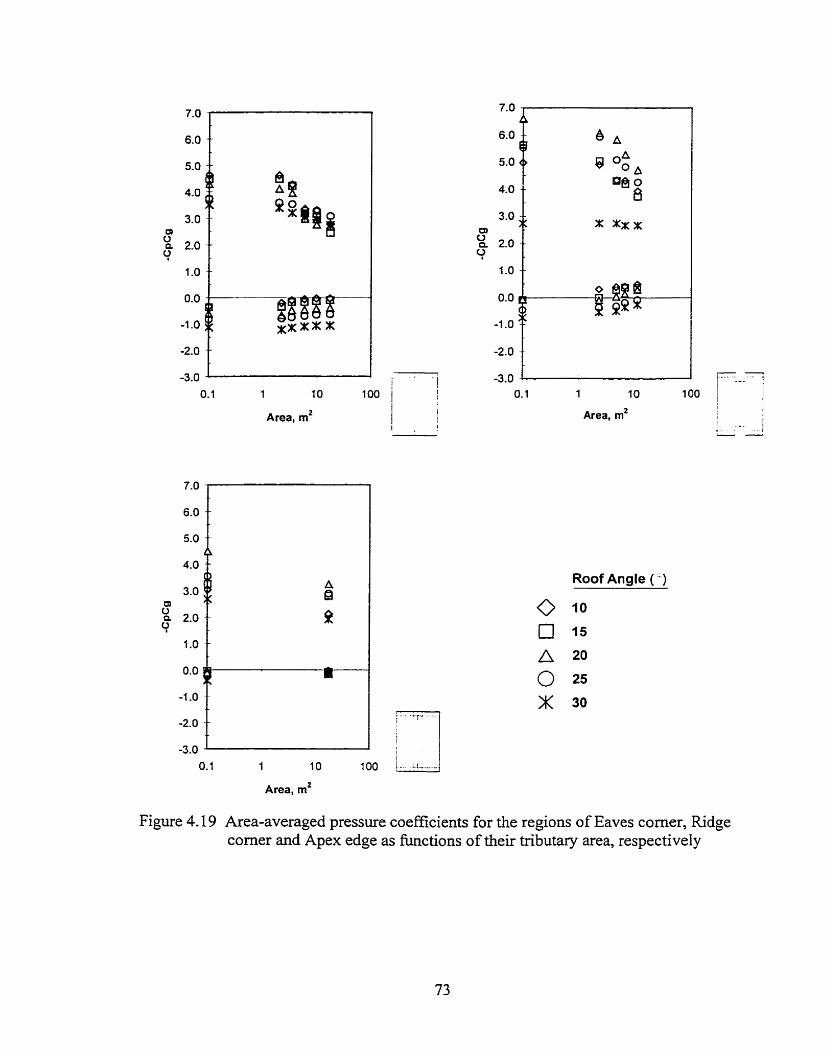
Area, mZ
O. 1 1 10 100 j ...- l4 .-.... 1 Area, rnZ
1 10
Area, m2
Roof Angle ( -)
O 10
O 15
A 20
O 25
x 30
Figure 4.19 Area-averaged pressure coefficients for the regions of Eaves corner, Ridge corner and Apex edge as h c t i o n s of their tributary area, respectively

0.1 1 1 O 100
Area, m2
-3.0
0.1 1 1 O 100
Area, rnZ Area, m2
Figure 4.20 Area-averaged pressure coefficients for the regions of Eaves edge, Gable edge, Ridge and Interior as Eunctions of their tributary area
CHAPTER 5
APPLICATION FOR STANDARDS AND CODES OF
PRACTICE
5.1 DETAILED DESCRIPTION OF THIE CURRENT M?ND PROVISIONS
The current wind provisions of NBCC (1995) have already been referred in this thesis.
The codification process arriving at the current codal format is briefly described as
follows. It is to be noted that the principle of simplicity goes throughout this process.
-As indicated in the previous chapters, the codal defrnition of roof region depends on the
distribution of the experimental most critical local and area-averaged pressure
coefficients. The roof areas where the local most critical pressure coefficients show
similar magnitudes are grouped into a set of regions respectively, namely Region A
(Eaves comer), Region B (Ridge comer), Region C (Apex ndge), Region D (Eaves
edge), Region E (Gable edge), Region F (Ridge) and Region G (Interior). The roof
regions where the regional most criticd pressure coefficients show similar magnitudes

are grouped into a set of pressure zones respectively, narnely, Eaves and Ridge Corners,
Edges near Apex, Edges and Interior. Furthemore, roofs of different roof angles can be
grouped together, provided that the corresponding zones of these roofs show similarity in
tems of most cntical pressure coefficients. The slope ranges are defmed in the current
wind provisions as: the quasi-flat roof (0°G3~100), the intermediate roof (1 0°<8G00) and
the high-pitched roof (30°43~450). The format of the current wind provisions for gable
roofs of intemediate slopes and those for other roof ranges is Uustrated in Figure 5.1.
It has to be noted that the design pressure coefficients in the current codal format are
arranged as functions of tributary area denoted as C,C, in accordance with the current
codal format for the design pressure coefficients of high-rise buildings. More explanation
on the notation has been provided by Davenport (1983).
In the current wind provisions, the most critical pressure coefficients measured in the
wind tunnel have been multiplied by a reduction factor of 0.8 to account for
directionality. This is based on the consideration of the unlikeliness of the extreme wind
speed coming from the most cntical wind direction for each point on the roof
(Stathopoulos, 1979). In this chapter, the measured most critical pressure coefficients that
will be employed into the cornparison with the codal values are multiplied by this 0.8
reduction factor. Further codal information on design wind loads of low-rise buildings
c m be found in various standards and codes of practice.

Note: z = I O % of least horizontal dimension or 40% of height, fi, which is Iess. AIso z 2lm. z 24% of least horizontal dimension.
Figure 5.1 Wind provisions for the low-building gable roofs, after NBCC (1995)

5.2 COMPARISONS WITH THE CURRENT WIND PROVISIONS
Local most critical pressure coefficients measured in this study are compared with design
wind pressure coefficients in Figure 5.2. The seven diagrms in this figure apply to the
seven code-defmed regions. The top straight lines in these diagrams represent the design
suction coefficients for the smalIest tributary area, while the bottom straight lines indicate
the design pressure coefficients.
As shown in this figure, the current wind provisions appear to have underestimated the
local peak suction on the regions of Ridge corner, Gable edge and Ridge. Also s h o w in
this figure, the wind Ioading effect of roof angle on the most critical local pressure
coefficients appears less pronounced.
The distributions of the most critical pressure coefficients in the positive domain are
almost uniform, though the most critical local pressure coefficients of the 30'-roof are
Iarger than those on the other roofs.
The most critical suction coefficients Vary frorn region to region and reach their peaks on
the 20'-roof. These suction coefficient values decrease gradually towards both ends of the
intermediate dope range and reach their minima at either end. This shows the difficulty
to divide the intermediate slope range into, Say, two subsets. Any attempted division
would require three or more intervais and this would not be appropnate from the
simplicity viewpoint.
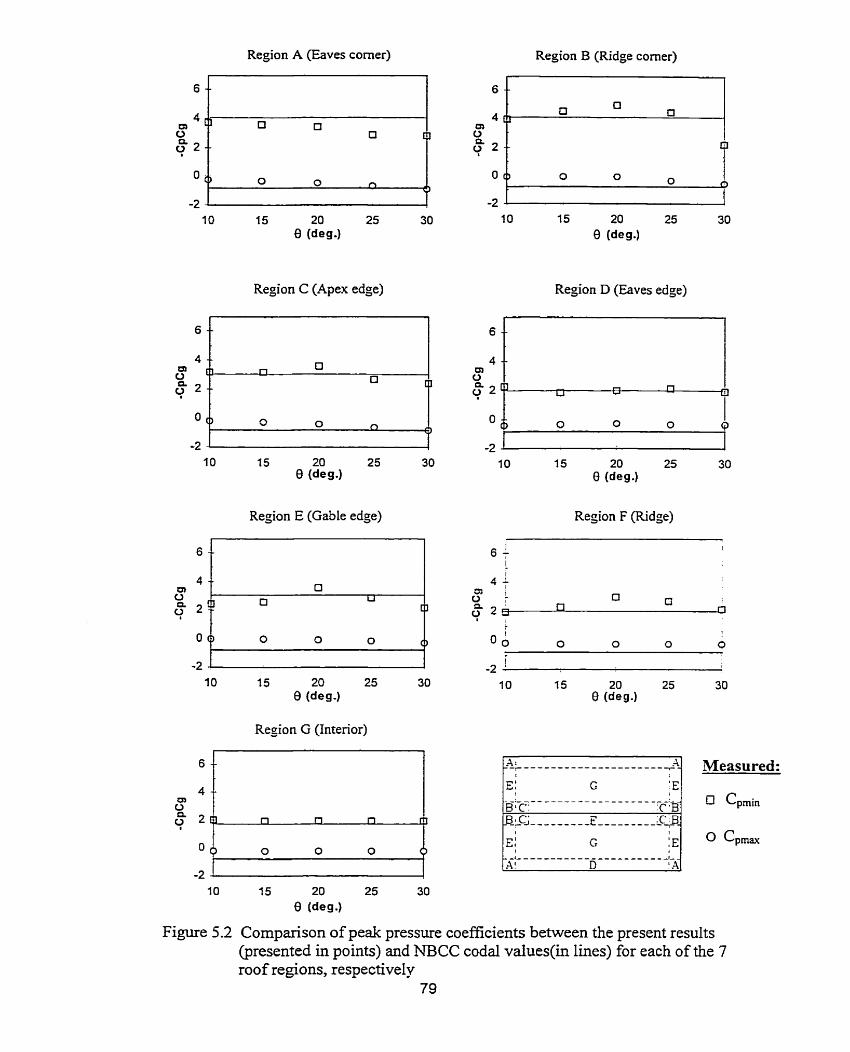
Region A (Eaves comer) Region B (Ridge corner)
Region C (Apex edge) Region D (Eaves edge)
Region E (Gable edge)
8 ideg-1
Region G (Interior)
Region F (Ridge)
Figure 5.2 Cornparison of peak pressure coefficients between the present results (presented in points) and NBCC coda1 vdues(in lines) for each of the 7 roof regions, respectiveIy
79

The most critical pressure coefficients, both local and area-averaged obtained in the
present study, have been arranged into the same format of the current wind provisions
and compared with the current design wind pressure coefficients. The results are shown
in Figure 5.3. Four diagrarns of this figure correspond to the four current defined pressure
zones, respectively. This figure is used to examine the agreement of the present
experimentd results with those specified in the current wind provisions. Furthemore,
Figures A-3.1 through A-3.5 in Appendix-3 provide the sarne comparisons, although
separately for each individual roof angle tested in the present study in order to provide a
view of the cornparison results.
The differences between the present results and those fiom the current wind provisions
appear apparent, as s h o w in Figure 5.3. The most cntical suction coefficients measured
in the present study of Zone l(Eaves and Ridge Corners) and Zone 2 (Edge near Apex)
have exceeded the current design suction coefficients to certain extents, although for the
other two zones (Edge and Ridge, and Interior), the agreement of the present results and
the current wind provisions appears well.
A M e r examination of this fiaure indicates that the pressure coefficients obtained on
the 10'-roof show similarity with those for the other three roofs of lsO, 20' and 25' in
magnitude. On the other hand, the pressure coefficients measured on the 30'-roof show
seern out of order of those measured on the other four roofs.

Generally speaking, there is underestimation of peak suctions for the roof corner and
ndge regions in the current wind provisions, and the roof range definition seems not
suitable. As a resulf some updating work needs to be done for the current wind
provisions; and some ideas have been invoked by the previous discussions. For instance,
the 10'-roof may be taken into the intermediate roof range. On the other hand, the 30'-
roof may be taken out of the intermediate roof range, and put into the high-pitched range,
if it is more appropriate. In addition, the 25'-roof shodd be examined to see whether its
loading definition would also be suitable for classification in the higher-pitched roof
range. Figures 5.4 through 5.6 will be used to examine whether these ideas are suitable or
not.
In Figure 5.4, the experimental results obtained on the 10'-roof for each of the seven roof
regions are combined into the three pressure zones defmed in the current wind provisions
for the quasi-flat roof range (O04K1O0). The current codal definition on pressure zoning
for the quasi-flat roof range can aiso be referred to Figure 5.1. The cornparison in this
figure shows that it may not be suitable to place the 10'-roof in the quasi-flat range. In
fact, by comparing Figure 5.4 with Fiagure 5.3, the 10'-roof appears quite clearly to
belong to the intermediate roof range.
In Figures 5.5 and 5.6, the experimental results obtained on the 25'- and 30'-roofs for
each of the seven roof regions are combined into four pressure zones in conformity with
the respective codal pressure zoning definition for the high slope range (30'4145'). The
definitions for these pressure zones have also been provided in Figure 5.1.

6.0 , Roof Angle (O)
NBCC provisions
0.0 0 e- /-
Eaves Corner -1 .O -
Area, mZ
O _/----
0-
[ntcrior Roof
-1.0 - Edge
Area, m2
Figure 5.4 Cornparison of experimentai values measured on 10' roof with the code values specified for gable roofs in slope range ( O 0 q S 1 0')

Roof Angle ('2
- NBCC provisions
Edge near Apex Eavives and Ridge Corner
1 10
Area, m2
2.0 x 00 . --x---x- 9 1.0-
0.0 Edge and Ridge * m x
-1.0 - Interior Roof
Area, m2 Area, mZ
Figure 5.5 Cornparison of experimental values measured on 30' roof with the code values specified for gable roofs in dope range (30°<g1450)

Roof &?le ( O )
O 25
NBCC provisions
Edge ne= Apex 0.0 '
O 00 O 0 0 . -,-. .
-1.0 - !
Eaves and Ridge Corner
1 10
Area, m2 Area, m2
Edge and Ridge 0.0 - O O O
Intenor Roof
Area, m2
Figure 5.6 Cornparison of expenmental values measured on 25' roof with the code values
specified for gable roofs in dope range (30°<~M50)

Figure 5.5 shows that the distributions of the pressure coefficients on the 30°-roof agree
well with the definition of the current wind provisions on the high-pitched roof range. In
fact, the agreement is much better than that shown in Figure 5.3 for the intermediate
slope range. Therefore, it is better to take the 30°-roof out of the intermediate slope range
and classifi it into the high-pitched roof range. However, this is not the case for the 25'-
roof as Figure 5.6 indicates. Clearly, it would have been desirable to examine this issue
for additional roof angles between 25' and 30'. However, in the interirn and with respect
to the codal definition of the dope range, sorne modification in the dope definitions may
be proposed, namely, quasi-flat range (0°<8~10'), intermediate range ( 1 0 ° 3 0 0 0 ) and
high-pitched range (30°~014S0).
5.3 ALTERNATIVE CODE AND STANDARD PROVISIONS
The examination of the current wind provisions has been completed. The current codal
definition on dope range has been modified so that the 10'-roof be taken out of the quasi-
flat roof range and put into the intermediate slope range. In the meantirne, the 30'-roof
would be taken out of the intermediate slope range and relocated into the high-pitched
r ~ o f range. The attempted and current codal definition on slope range is shown in Table
5.1. From the attempted intemediate roof range, the current pressure zoning definition is
modified. The attempted zoning definition is shown in Table 5.2, in association with the
current definition. The attempted pressure zones can be called as Corner, Ridge and
Gable Edge-Zone 1, Ridge Corner -Zone 2, and Interior and Eaves Edge-Zone 3.
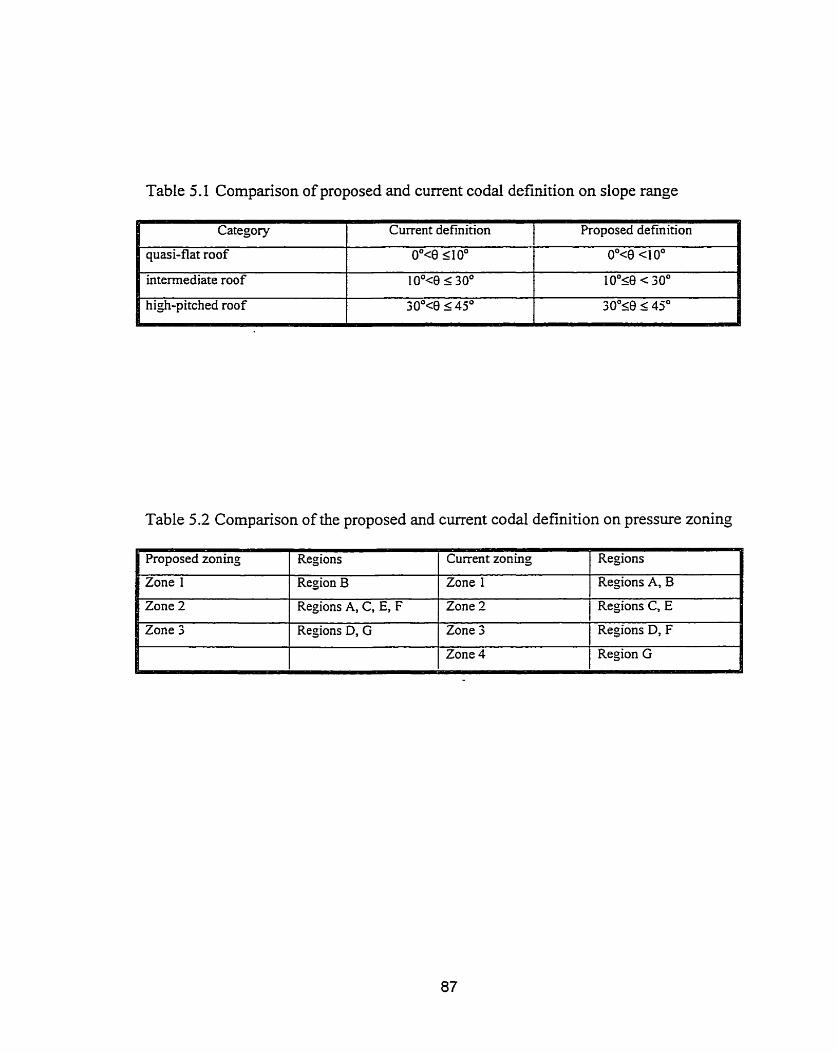
Table 5.1 Comparison of proposed and current codal definition on dope range
I
I
high-pitched roof 3 0 ° 4 1 45" I 30°<8 < 45"
quasi-flat roof
intemediate roof
Table 5.2 Comparison of the proposed and current codal definition on pressure zoning
Proposed definition Category
Proposed zoning 1 Regions 1 Curent zoning Regions
1 Current definition
0°<0 rlOO
10°<8 1 30°
I 1
Zone 1 ( Region B ) Zone 1 1 Regions A, B
0°<8 <1 O"
lO0l8 c 30"
I Zone 2 Regions A, C, E, F Zone 2 1 Repions C, E
1 1
Zone 3 1 Regions D, G 1 Zone 3 1 Regions D, F 1 1 I 1 Zone 4 1 Region G

A new set of design wind pressure coefficients h a . been fomulated with the principle of
simplification taken into account. The proposed design wind pressure coefficients are
presented in Figure 5.7 dong with the current provisions corresponding to the most
critical areas of the new zones (Wu et al, 1998). The proposed c w e s quasi-envelope the
most critical local and area-averaged pressure coenicients obtained in the present
experimental study. There are several reasons for that, merely related to economics and
the acceptance of any new specifications for codes and standards not to fully envelope the
measured pressure coefficients. For instance, the variability of measured peak values is
such that it would be adequately claimed that small convenient reductions could be
tolerated for simplicity and economy.
Furthemore, the new set of local design wind pressure coefficients have been compared
with respect to available experimentd data and the current wind provisions. The
cornparison shows that the proposed provisions are generally compatible with the data
fiom previous studies, although they may be overall somewhat more expensive in their
implementation.

0.0 Zone 1
-1.0 " - I
. .
Area, rnz
Area, mZ
Zone 3
0.0 a O-- . . . . . . . . . - Zone 2
..... ........ -1.0 - 2. L
-2.0 -
-3.0 . A .-:-*- ..-.
0.1 1 10 1 O0 O Area, mZ
Roof Angle ( )
O 10
15
a 20
0 25
--- NBCC provisions
Proposed provisions
Figure 5.7 Experirnental most critical pressure coefficients, current NBCC and proposed new codai provisions

Table 5.3 Cornparison of the proposed wind design pressure coefficients with those from the current wind provisions and those fiom previous experimental findings
-on coefficients for each region

5.4 ASSESSMIENT OF lNCREASE OF DESIGN WIND LOADS BROUGHT
BY THE PROPOSED PROVISIONS
From the econornics point of view, updating of the current wind provisions may have
large-scale effects on the cost of roof construction, since safety and economy always fight
against each other in engineering. Thus it is necessary to assess the feasibility of the
proposed provisions in terms of the increases of design wind loads in comparison to the
current ones.
A number of assumptions have been made for the cornparison. Typical roof cases have
been selected. The roof gable wall length would be equal to or longer than 10m. The
ratios of roof Iength over roof width of these roofs have been considered as I : 1, 2: 1 and
3:L The notations of L and B, which have been applied for long wall length and gable
waIl length, are now used for roof length and width, implying that the difference between
roof width with its horizontal projection is neglected. Moreover, for simplicity, only local
pressure coeEcients, which can be applied for roof cladding with tributary area 5 lm2,
have been considered suice only a "feeling" of the potential increase is to be provided in
the present study. Furthemore, positive pressure coefficients have not been considered
here, albeit their values are smaller as indicated in Figure 5.7, simply because positive
wind loads are not generally dominant for the design of a roof.
Under the given assumptions, the weighting factor (F) of each pressure zone, which
represents the ratio of the zone's size to the entire roof size, can be obtained for each of
91

the three roof cases by considering the areas of their respective pressure zones, as
specified in Figure 5.7. These factors have been calculated and presented in Table 5.4.
With the weighting factors of Table 5.4, the cornparison of the proposed provisions with
the current ones in terms of local suction coefficient values can be carried out by using
the equation:
where (CpC&,or is the expected or "average" design local pressure coeficient, i denotes
the respective zone number and C,C, represent design local suction coefficient for the
proposed and current provisions, as specified in Figure 5.7. The results of this
cornparison are shown in Table 5.5. Please not that this cornparison is simplified since the
current provisions have applied to the new Zones 1, 2 and 3 in an approxirnate way. For
instance, design pressure coefficients on Zone 1 have considered the most cntical roof
corner value, whereas respective current provisions for Zone 3 have adopted the
predorninant intenor roof suction coefficient.
Clearly, the proposed wind provisions appear to increase the design pressure coefficients
by approximately 15%, at least as far as local roof suction are concerned. This is not
excessive and may be wel1 justified by considering the results of the present study and
previous findings as well.

Table 5.4 Zone weighting factors (F) of three different roofs
Roof geometry (L:B)
Lonel
7one2
Total roof area
Loning Areas 1 Weighting factors (F) I

Table 5.5 Cornparison of the proposed and current provisions in terms of expected values of design local suction coefficients for three roof configurations
(1) Roof 1 (L:B=I : A )
1 1 1 Proposed provisions 1 Current provisions 1 I J
Zone I Fi (CpCg)iti (cpCg)i (CpCJiFi 1 0.32 1.18 4.1 1.31 2 1 0.04 5.0 O 20 4.1 0.16 3 1 0 -64 2.3 1.4/ 1 1. l 1 1-09
(2) Roof 2 (L:B=2:1)
1 I 1 Proposed provisions 1 Current provisions i
(3) Roof 3 (L:B=3:1)
1 1 1 Proposed provisions [ Current provisions 1

CHAPTER 6
CONCLUSIONS AND RECOMMENDATIONS
6.1 SUMRlARY AND CONCLUSIONS OF THE PRESENT STUDY
A series of wind tunnel mode1 tests have been carried out to examine the suitability of the
current wind provisions of NBCC (1995) for low buildings in the intermediate roof slope
range (1 0°<8~00). Five gable roof models with roof angles of 1 0°, 15', 20°, 25' and 30"
have been investigated in wind tunnel. These roof models were assumed to be
representative for gable roofs of intermediate slopes. This addresses the cnticisms on the
current approach that low building roofs within the intermediate slope range are designed
by testing models with only one roof dope (1 8.4"). In order to provide an accurate wind
tunnel simulation, the experimental settings are designed to follow the respective criteria
requested in the ASCE wind loading test standard (ASCE Draft, 1997). An intensive set
of experimental results has been obtained and applied for codification process.
Pnor to the application of the experimental results obtained, the present data were
compared with data fiom previous studies. Although there are some differences among
these experimental studies, the comparisons seem satisfactory. This and the adequacy of
wind -el simulation c o n f m the suitability of the present experimentai results for
codification purposes.
A series of comparisons have been canied out to examine the adequacy of the current
wind provisions in the National Building Code of Canada for the design of gable roofs
with angles Iower or higher than 18.4'. The codal definitions of slope range, roof region
category, pressure zonuig category and design wind pressure coefficients have been
discussed, respectively. Although the experimental resdts generally agree with the
current wind provisions, the latter clearly underestimate the peak suctions on corner and
edge regions. Moreover, the roof angles involved within the current slope category
definition may be somewhat changed.
An alternative set of provisions has been denved fiom these cornparisons and
discussions. The current codal definition on the roof regions has been maintained but the
pressue zoning definition has been modified. For the proposed pressure zones, a new set
of design wind pressure coefficients has been formulated. Furthermore, the slope range
definition has also been somewhat modified.
For the proposed wind provisions, a preliminary assessrnent of the increase of the design
wind loads has been conducted. It appears that the proposed wind provisions may
increase the design local wind loads for gable roofs of intermediate slopes by an amount,
typically varying between 6 and 16 percent depending on the building's geometry.

6.2 MCOMMENDATIONS FOR FUTURE STUDY ON THIS TOPIC
A set of five gable roof models with roof angles in the intexmediate slope range has been
tested and various interesting results have been found. The interval between these roof
angles was set at jO, in order tu sufficientiy model the wind pressure distributions for the
entire intermediate slope range. This assurnption was justified by cornparison with the
experiments conducted in previous studies. However, the results obtained show that the
pressure distributions on the intermediate dope roof could be very sensitive to the roof
slope. Therefore, it would be of interest in a future study to model roofs with adjustable
roof angle to detect differences in the pressure distributions correspondhg to a very srnall
variation of roof slope.
In the present study, severd factors afTecting the wind loads on low-building gable roofs
of intermediate siopes have not been taken into account, because only the suitability of
the curent wind provisions is the major concern of the present study. For instance, the
variation of the upstrearn terrain exposure and the actud building codiguration have not
been included in the scope of the present study. In order to better understand the
behaviour of wind pressures on roofs, these factors should be considered.
In fact, low-rise buildings with gable roofs may be Iocated either in open couiry or in
suburban exposure. Besides the isolated case of the present study, such buildings could
also be in grouping or surrounded by other obstacles such as fences, trees. Moreover,
gable roofs uften have overhangs and other decorative components. The roofs may be
exposed not only to the boundary layer wind but aiso to other storm systems, for instance,
tomadoes. In order to protect low building gable roofs fiom wind damage, the wind
loading effects of the above-mentioned factors need M e r studies for future update of
the codes and standards of practice.
REFERENCES
ASCE 7-95 (1995) Minimum Design Loads for Building and Other Stuctures, Arnerican
Society of Civil Engineers, New York, N.Y.
ASCE Standard (1997) Wind Tunnel Testing for Building and Other Structures @raft),
Amencan Society of Civil Engineers, New York, N.Y.
Davenport, A. G. (1983) On the Assessment of the Reliability of Wmd Loading on Low
Buildings, J. Wind Eng. Ind. Aerodyn., 1 1 ,2 1-37.
Ginger, J. D. and Letchford, C. W. (1992) Peak Wind Loads under Delta Wing Vortices
on Canopy Roofs, 1. Wind Eng. Ind. Aerodyn., 41-44, 1739-1 750.
GumbeI, E. J. (1958) Statistics of Extremes, Columbia University Press.
Hensen, S. O and Sorensen, E. G. (1986) The Aylesbury Experiment. Cornparison of
Mode1 and Full-scale Tests, J. Wind Eng. Ind. Aerodyn., 22, 1-22.
Holmes, J. D. (1981) Wind Pressures and Forces on Tropical Houses, Technicd Report,
Aus~alian House Research CounciI.
Holmes, J. D. (1983) Wind Loads on Low Rise Buildings - A Review, Commonyeaith
Scientific and Mustrial Research Organization (CSIR0)-Division of Building
Research.
Holmes, J. D. (1 984) Effects of Frequency Response on Peak Pressure Measurements, J.
Wind Eng. Ind. Aerodyn., 1 7, 1-9.
Holmes, J. D. (1994) Wind Pressures on Tropical Housing, J. Wind Eng. Ind. Aerodyn.,
53, 105-123.

Hoxey, R P. and Moran, P. (1983) A Full-scale Study of the Geometrïc Parameters that
Influence Wind Loads on Low Rise Buildings, J. Wind Eng. Ind. Aerodyn., 13,
277-28 8.
Kanda, M. and Manita, E. (1993) Charactenstics of Fluctuating Wind Pressure on Long
Low-Rise Buildings with Gable Roofs, J. Wind Eng. Ind. Aerodyn., 50, 173-1 82.
Kawai, H. and Nishimura, G. (1996) Characteristics of Fluctuating Suction and Conical
Vortices on a Flat Roof in Oblique Flow, J. Wind Eng. Ind. Aerodyn., 60, 21 1-
225.
Kramer, C. and Gerhardt, H. J. (1991) Wind Pressure on Roofs of Very Low and Very
Large Industrial Buildings, J. Wind Eng. Ind. Aerodyn., 38,285-295.
Levitan, M. L. Mehta, K. C., V m , W. P. and Holmes, J. D. (1991) Field Measurements
of Pressures on the Texas Tech Building, J. Wind Eng. Ind. Aerodyn., 38, 235-
247.
Mayne, J. R. and Cook, N. J. (1980) Proceedings of the Fifth International Conference on
Wind Engineering, Pengamon Press, 1339-1 355.
Meecham, D., Surry, D. and Davenport, A. G. (1991) The Magnitude and Distribution of
Wind-Induced Pressures on Hip and Gable Roofs, J. Wind Eng. Ind. Aerodyn.,
3 8,257-272.
Mousset, S. (1986) The International Aylesbury Collaborative Experiment in C. S. T. B.,
J. Wind Eng. Ind. Aerodyn., 23, 19-36.
NBCC, (1995) Supplement to the National Building Code of Canada, Associate
Cornmittee on the National Building Code, National Research Council of Canada,
Ottawa.

Richardson, G. M., Robertson, A. P., Hoxey, R P. And Surry , D. (1990) Full-scale and
Model Investigation of Pressures on an IndustriaUAgricultural Building, J. Wind
Eng. Ind. Aerodyn., 36, 1053-1062.
Richardson, G. M. and Surry, D. (1991) Cornparisons of Wind-Tunnel and Full-scale
Surface Pressure Measurements on Low-Rise Pitched Roof Buildings, J. Wind
Eng. Ind. Aerodyn., 3 8,249-256.
Richardson, G. M. and Surry , D. (1992) The Silsoe Buildings: A Cornparison of Pressure
Coefficients and Spectra at Model and Full-scale, J. Wind Eng. Ind. Aerodyn., 41 -
44, 1653- 1664.
SaathofX, P. J. and Melbourne, W. H. (1989) The Generation of Peak Pressures in
SeparatedlReattaching Flows, J. Wind Eng. Ind. Aerodyn., 32, 12 1 - 134.
Saathoff, P. J. and Stathopoulos, T. (1992) Wind Loads on Buildings with Sawtooth
Roofs, J. Stnict. Eng., 118,429-446.
Savory, E., Dalley, S. and Toy, N. (1992), The Effects of Eaves Geometry, Model Scale
and Approach Flow Conditions on Portal Frame Building Wind Loads, J. Wind
Eng. Ind. Aerodyn., 4 1-44, 1665- 1676.
Sill, B. L., Cook, N. J. and Blackmore, P. A. (1989) IAWE Aylesbury Comparative
Experirnent - Preliminary Results of Wind Tunnel Comparisons, J. Wind Eng.
Ind. Aerodyn., 32,285-303.
Sill, B. L. and Cook, N. J. (1 990) The Aylesbury Comparative Experiment: A Statu
Report, J. Wind Eng. Ind. Aerodyn., 3 6, 1047- 1052.
Sill, B. L., Cook, N. J. and Fang, C. (1992) The Aylesbury Comparative Experirnent: A
Final Report, J. Wind Eng. Ind. Aerodyn., 41-44, 1553-1 564.

Simiu, E. and Scanlan, R. H., Wind Effects on Structures: An Introduction to Wind
Engineering. John Wiley & Sons, New York, 1986.
Surry, D. and Stathopoulos, T. (1978) An Experimental Approach to the Economicai
Measurement of Spatially-Averaged Wind Loads. J Wind Eng. Ind. Aerodyn.,2,
3 85-3 97.
Stathopoulos, T. (1979) Turbulent Wind Action on Low Rise Buildings, Ph. D. Thesis,
The University of Western Ontario.
Stathopoulos, T. (1984a) Wmd Loads on Low-Rise Buildings: A Review of the State of
the Art, Engng. Strct., Vol. 6, April.
Stathopoulos, T. (1984b) Design and Fabrication of a Wind Tunnel for Building
Aerodynamics, J. Wind Eng. Ind. Aerodyn., 16, 36 1-376.
Stathopoulos, T., Surry, D. and Davenport, A. G. (1985) A Simplified Mode1 of Wind
Pressure Coefficients for Low-Rise Buildings, In Proc. ICO S SAR' 85.
Stathopoulos, T. and Sazthoff, P. J. (1991) Wind Pressure on Roofs of Various
Geometries, J. Wuld Eng. Ind. Aerodyn., 3 8,273-284.
Surry, D. and Lin, J. X. (1995) The Effect of Surroundings and Roof Corner Geometric
Modifications on Roof Pressures on Low-Rise Buildings, J. Wind Eng. Ind.
Aerodyn., 58, 113-138.
Tieleman, H. W., Surry, D. and Lin, J. X, (1994) Characteristics of Mean and Fluctuating
Pressure Coefficients under Corner (Delta Wing) Vortices, J. Wind Eng. Ind.
Aerodyn., 52,263-275.
Uematsu, Y. and Isyurnov, N. (1996) Wind Pressure Acting on the Leading Edge and
Corner Regions of a Low-Rise Building - A Study of the CWC Low-Rise
Building Data Base, Technical Paper of University of Western Ontario.
Wu, H., Wang, K. and Stathopoulos, T. (1998) Pressure Coefficients for Gable Roofs of
Intermediate Slopes, Presented for the Eastern European Wind Engineering
Conference, Prague, September 7- 1 1.
Appendix-1
Roof Pressure Coefficient Contours for Typical Wind Azimuths

c pm!
C pmin prnean
Figure A-1.1 Pressure field on the quartering roof of 10" dope at O" wind azimuth
prna..
prnean
Figure A-1.2 Pressure field on the quartering roof of 10" slope at 60' wind azimuth

Figure A-1 -3 Pressure field on the quartering roof of 1 0° slope at 90" wind azimuth
Figure A- 1.4 Pressure field on the quartering roof of 10" dope at 135" wind azirnuth
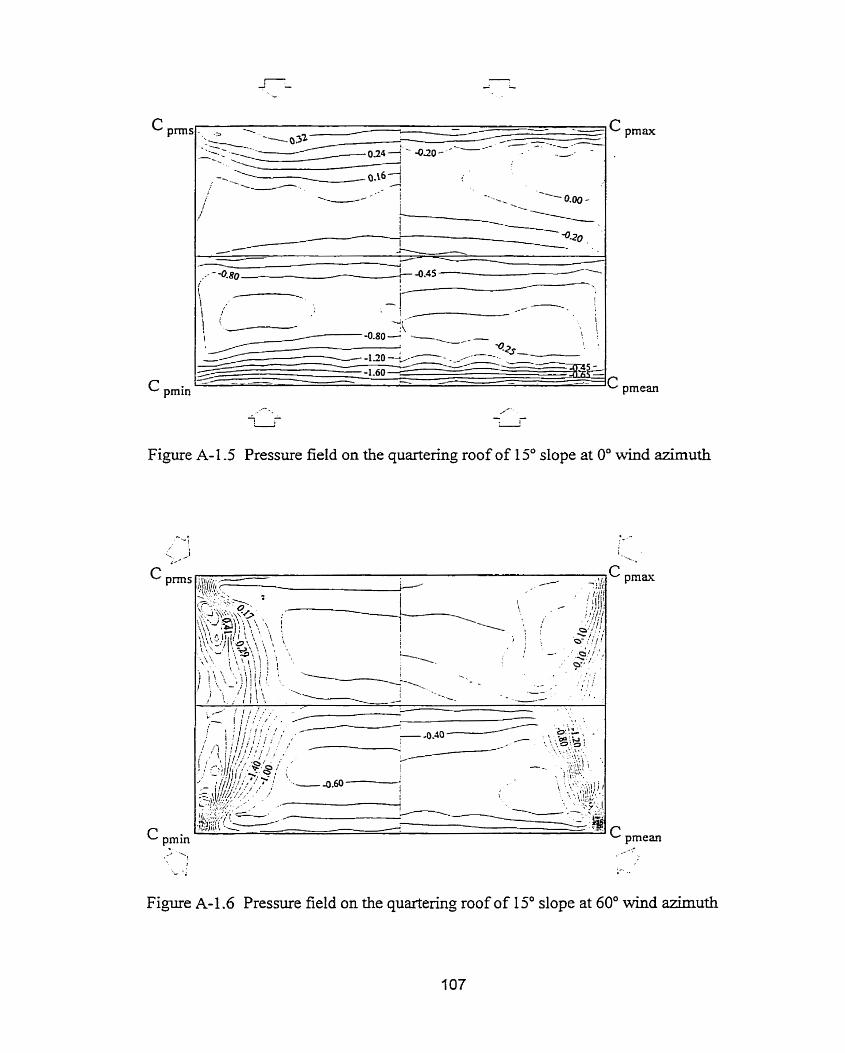
C pmean
Figure A-1 -5 Pressure field on the quartering roof of 15' slope at O" wind azimuth
C prnean
I ^ . -
Figure A-1.6 Pressure field on the quartering roof of 15" slope at 60' wind azimuth


Figure A-1.9 Pressure field on the quartering roof of 20" dope at O" wind azimuth
Fiame A-1 .1 O Pressure field on the quartering roof of 20" dope at 60" wind azirnuth
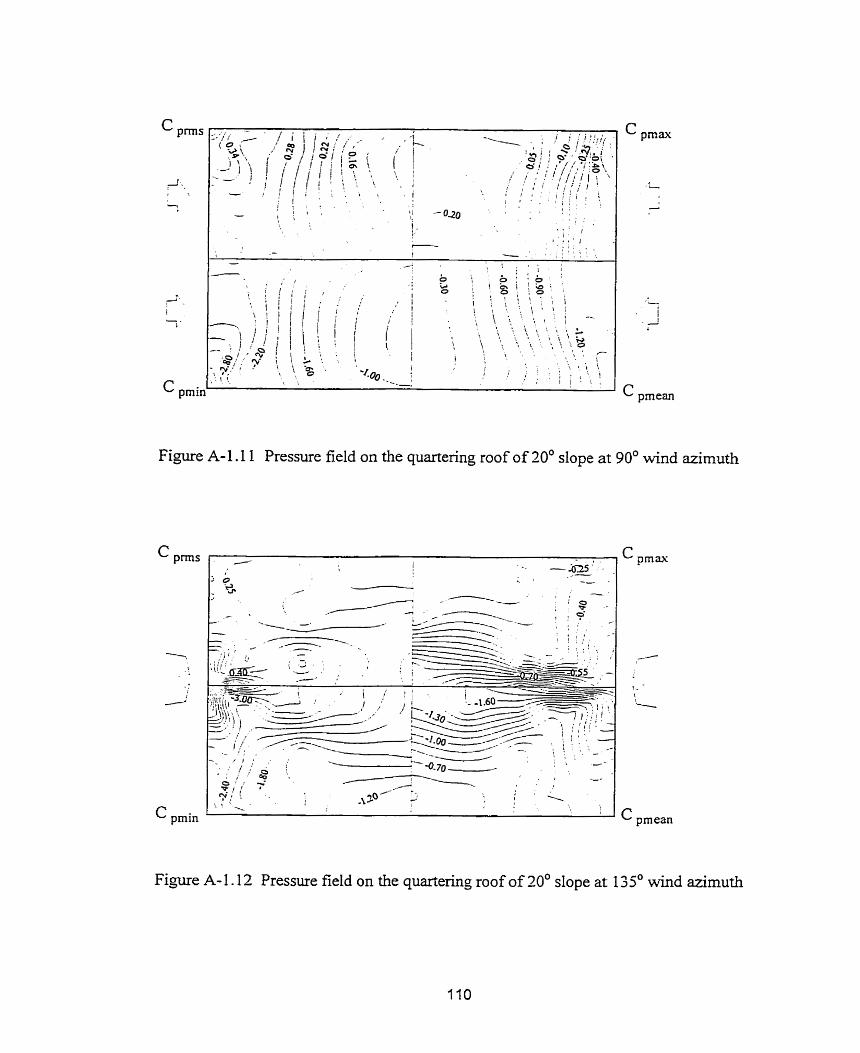
Figure A-1.1 1 Pressure field on the quartering roof of 20' dope at 90' wind azimuth
m
prnean
Figure A- 1.12 Pressure field on the quariering roof of 20' slope at 135' wind azimuth
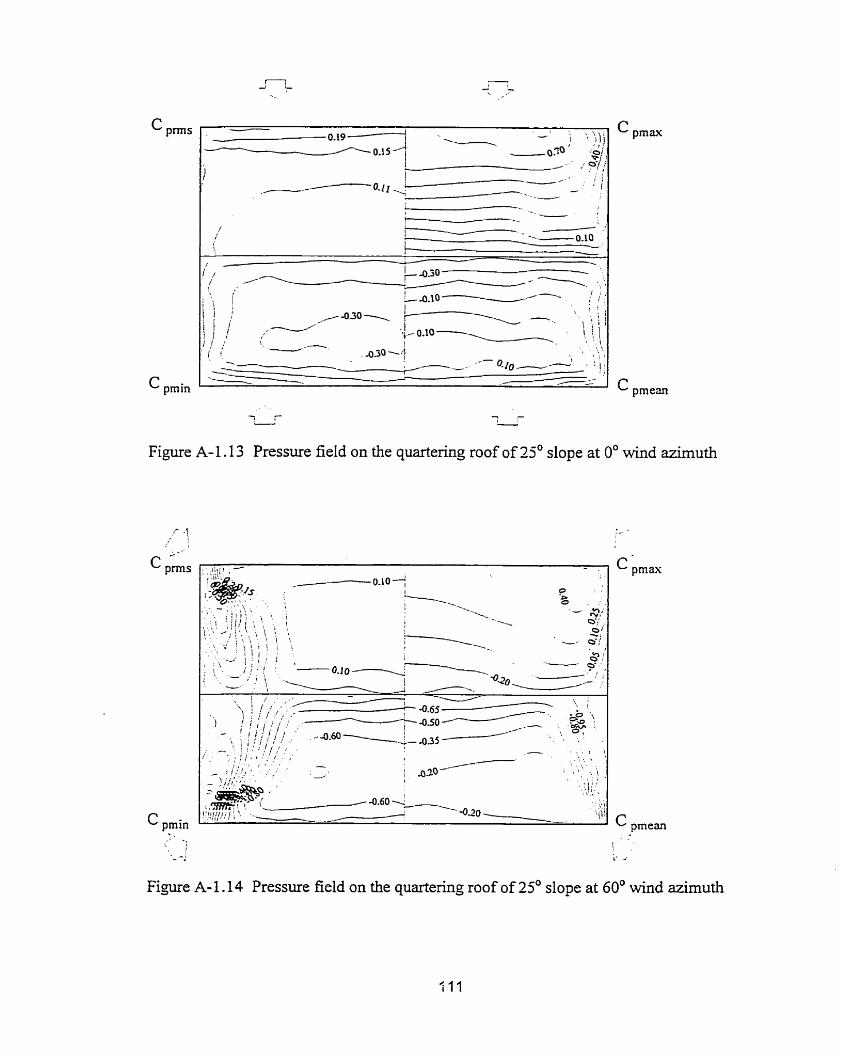
C pms
C pmin C pmean
Figure A-1.13 Pressure field on the quartering roof of 25' slope at 0' wind azimuth
C pmin
Fi,gure A-1.14 Pressure field on the quartering roof of 25' slope ai 60' wind azimuth

Figure A-1.15 Pressure field on the quartering roof of 25' dope at 90' wind azimuth
C pmax
r
1
Fi,we A- 1.1 6 Pressure field on the quartenng roof of 25' dope at 13 j0 wind azimuth

C pmr
C pmin
C pmax
C prnean
Figure A-1.17 Pressure field on the quartering roof of 3 0' slope at 0' wind azimuth
s -
1
!
C pmin '
-. ' >,
. - I \
C pmaw
m pmean - , ,
I
L - -'
Figure A-1.18 Pressure field on the quartering roof of 30' slope at 60' wind azimuth

C prnean
Fiagure A- 1.19 Pressure field on the quartering roof of 30" slope at 90' e n d azimuth
C prnean
Figure A-1.20 Pressure field on the quartering roof of 30' dope at 135' whd azimuth

Corner Wind Pressure Coefficients as Functions of Wind Azimuth
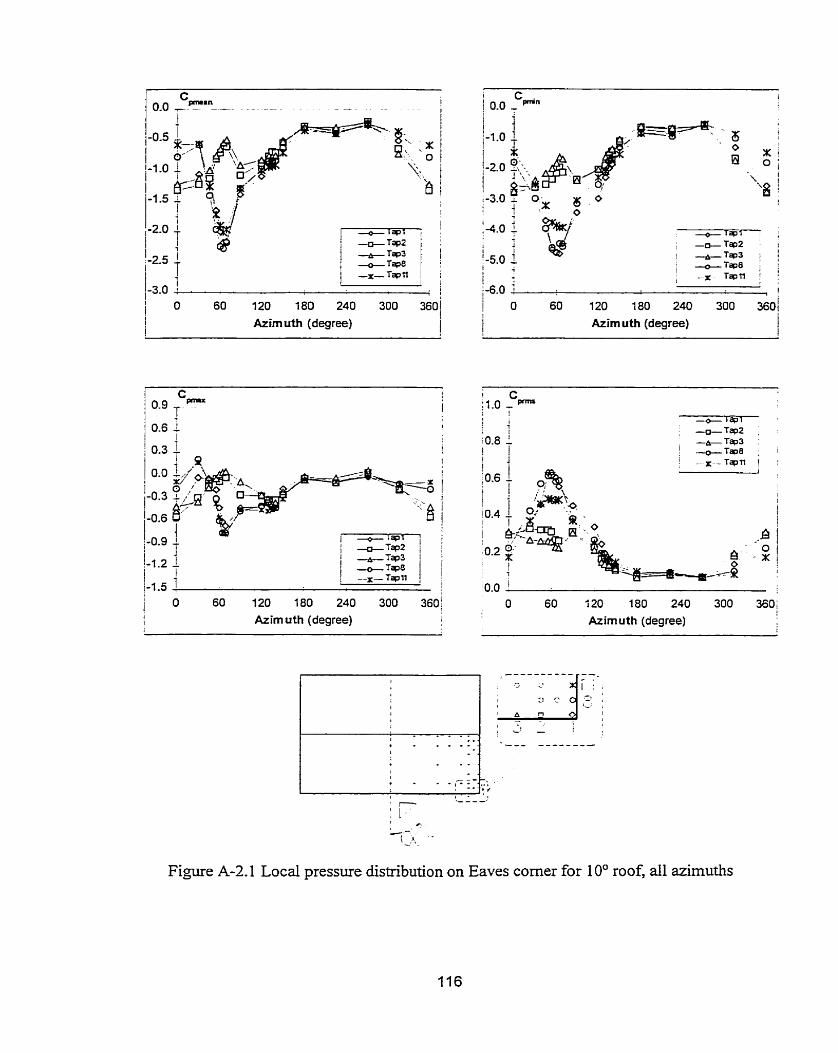
1 -0.5 1
I eg- 1
Os e:' .: 1 -1.0 + \ i
-1.5 - 9 r B i
i Azimuth (degree)
1 I 1 - - ~ - T ~ I I i i-1.5
1 O 60 120 180 240 300 3601
I Azim uth (degree) 1
l
i Azim uth (degree)
! I
Azim uth (degree) I
Figure A-2.1 Local pressure distribution on Eaves corner for 10" roof, dl azirnuths
j -3.0 ' I 1
O !
60 120 180 240 300 3601
Azim uth (degree) i 1
I Azim uth (degree)
l Azim uth (degree) , ! Azim uth (degree)
Figure A-2.2 Local pressure distribution on Ridge corner for 10' roof, al1 azimuths

Azim uth (degree)
i-1.5
1 O 60 120 180 240 300 3601 Azim uth (degree) I
1
!
1 1
l Azirn uth (degree) I I
1 1
10.0 ' 1 I
i O 60 120 180 240 300 3601 , Azim uth (degree) I
Figure A-2.3 Local pressure distribution on Eaves corner for 15' roof, dl azimurhs

60 120 180 240 300 360 Azim uth (degree)
1 O 60 120 180 240 300 360i 1 Arim uth (degree) 1 !
0 60 120 180 240 300 3601
i Azim uth (degree)
i O 60 120 180 240 300 360; I Azim uth (degree) !
Figure A-2.4 Local pressure distribution on Ridge corner for 15' roof, al1 azimuths
I i O 60 120 180 240 300 360! O 60 120 180 240 300 3601
I
, Azim u th (degree) Azirn uth (degree) 1 1
i O 60 120 180 240 300 3601 ! Azirn uth (degree) !
Azim uth (degree)
Figure .&2.5 Locd pressure distribution on Eaves corner for 20' roof, al1 azimuths
1-7.0 ' 1 O 60 120 180 240 300 360; i i Azim u th (degree) i
I O 60 120 180 240 300 360i 1 Azim u th (degree) i
j
l
h . 5 . 1
i 0 60 120 I B O 240 300 360;
I 1 Azim uth (degree) ,
L Azim uth (degree)
i
Figure A-2.6 Local pressure distribution on Ridge corner for 20' roof, al1 azimuths
7 I
I 1
O 60 120 180 240 300 360; Azirn uth (degree) f 1 Azirnuth (degree) 1
1
Azim uth (degree) i 1
Azim uth (degree) , !
Figure A-2.7 Local pressure distribution on Eaves corner for 25' roof, d l azimuths

i i ! 4
i-3.5 1 i i i i / O 60 120 180 240 300 3601
: Azim uth (degree) L 1
I 1
1
Azim uth (degree) l
! 1 3
Azim uth (degree) i
1 Azim uth (degree) I
Figure A-2.8 Local pressure distribution on Ridge corner for 25' roof, ail azïmuths

Azim uth (degree) i
Azim u th (degree)
Azim uth (degree) i
l Azim uth (degree) !
Figure A-2.9 Local pressure distribution on Eaves corner for 30' roof, al1 azimuths
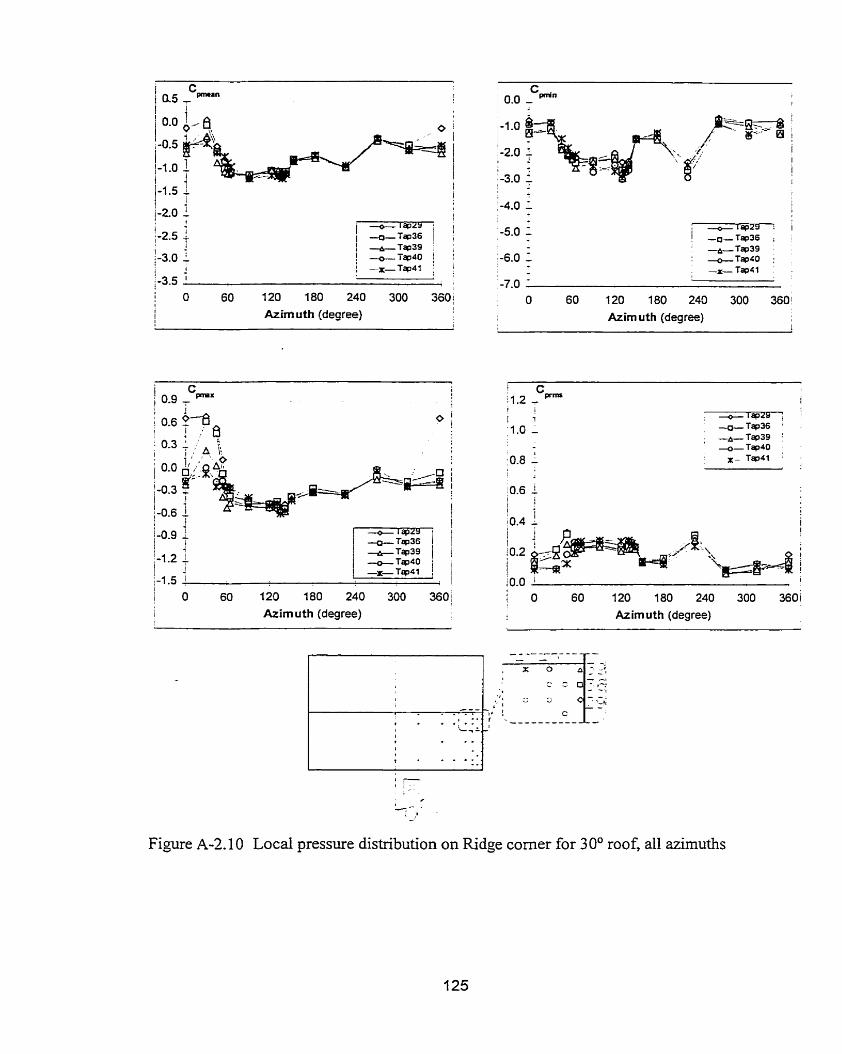
1 Azim uth (degree) Azirn uth (degree)
O 60 120 180 240 300 3601
Azim uth (degree) Azim u th (degree)
Figure A-2.10 Local pressure distribution on Ridge corner for 30' roof, al1 azirnuths

Cornparison of the Experirnental Data Tested on each Slope with the Current Design Wind Pressure Coefficients

Roof Anole (O)
O 10
N8CC provisions
0- 0.0 0 Eaves and Ridge Corner /-Y-
Edge near Apex - -1.0 -
1 !-i ;- - * , - . ,, l
-3.0 1 . ; .I O. 1 1 10 1 O0
Area, mZ
Zone 1 Zone 2
-1.0 - Edge and Ridge
-3.0 '
0.1 1 2' 0 Area, rn
L ' I
Zone 3
0.0 ? oq- --
-1.0 - Interior Roof
-2.0 - -3.0 '
O. 1 1 1 O 1 O0 Area, m2
Zone 4
Figure A-3.1 Cornparison of the experimental results obtained for the 10'-roof with the curent wuld provisions specified for the whole 10'-30' slope range

Roof Anale ('1 O 15
NBCC provisions
0 , ,- t l l i n U u Eaves and Ridge Corner
- Edge near Apex
Zone 1 Zone 2
0.0 '
Edge and Ridge
U
i -1.0 lntenor Roof
i I -2.0 - ! r
-3.0 ' 0.1 1 10 100
Area, m2
Zone 3 Zone 4
Figure A-3.2 Cornparison of the experimental results obtained for the 15'-roof with the current wind provisions specified for the whole 1 0'-3 0' slope range
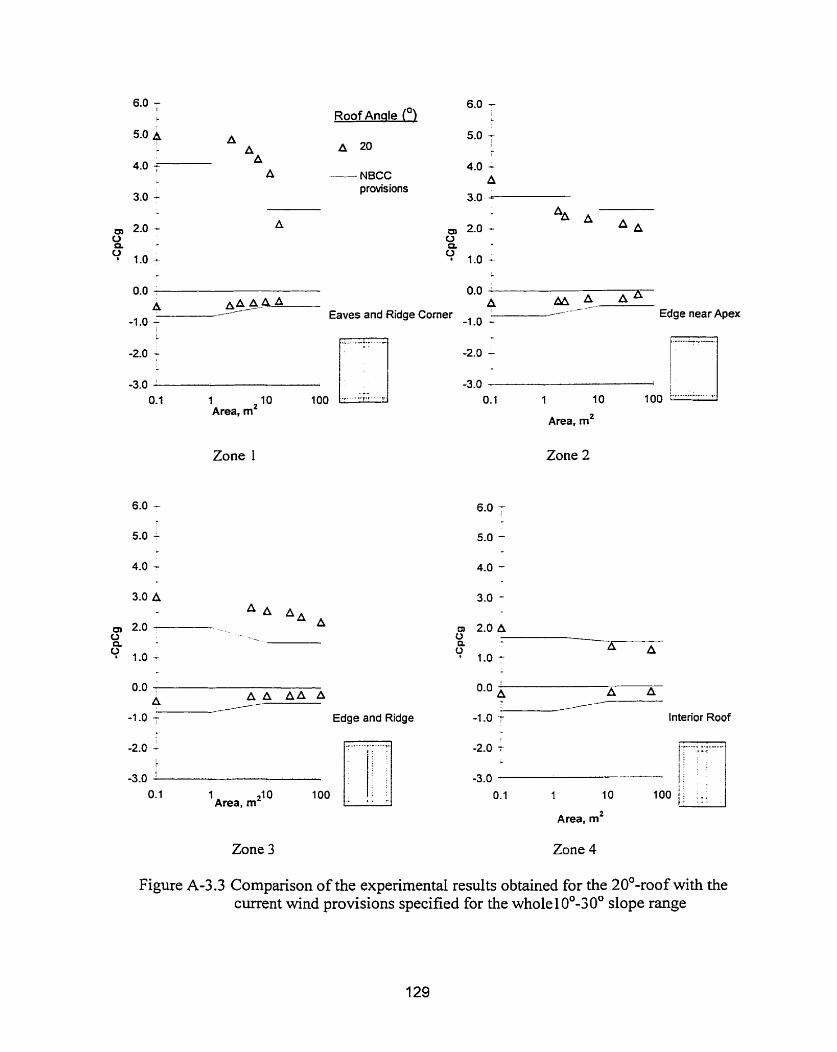
Roof Ansle ('2
- NBCC provisions
0.0 0.0 - A A A A A A A M * ._- Edge near Apex
Eaves and Ridge Corner -1 - -1.0 -
-3.0 '
0.1 1 10 Area, mZ
Zone 1
Area, rnZ
Zone 2
0.0 A A A A A A
-1 .O f Edge and Ridge
-2.0 - -3.0 '
0.1 1 Area, m 21 0 100 * . -
0.0 a A A
-1 .O - lnterior Roof
0.1 1 10 100 j ; .:: / Area, m2
Zone 3 Zone 4
Figure A-3.3 Cornparison of the expenmental results obtained for the 20'-roof with the current wind provisions specified for the wholelOO-30' slope range

O 0 O NBCC
provisions
Loo*- T Eaves and Ridge Corner Edge near Apex
1 10 Area, m2
Zone 1
1 10
Area, mZ
Zone 2
0 O
-1 .O - lntenor Roof
I
O -1.0 -
t Edge and Ridge l
-2.0 b
. . . -3.0 ' . . .
. . . 0.1 1 21 0
Area, rn Area, m2
Zone 4 Zone 3
Figure A-3.4 Cornparison of the experimental results obtained for the 25'-roof with the current wind provisions specified for the whole 10'-3 O* dope range
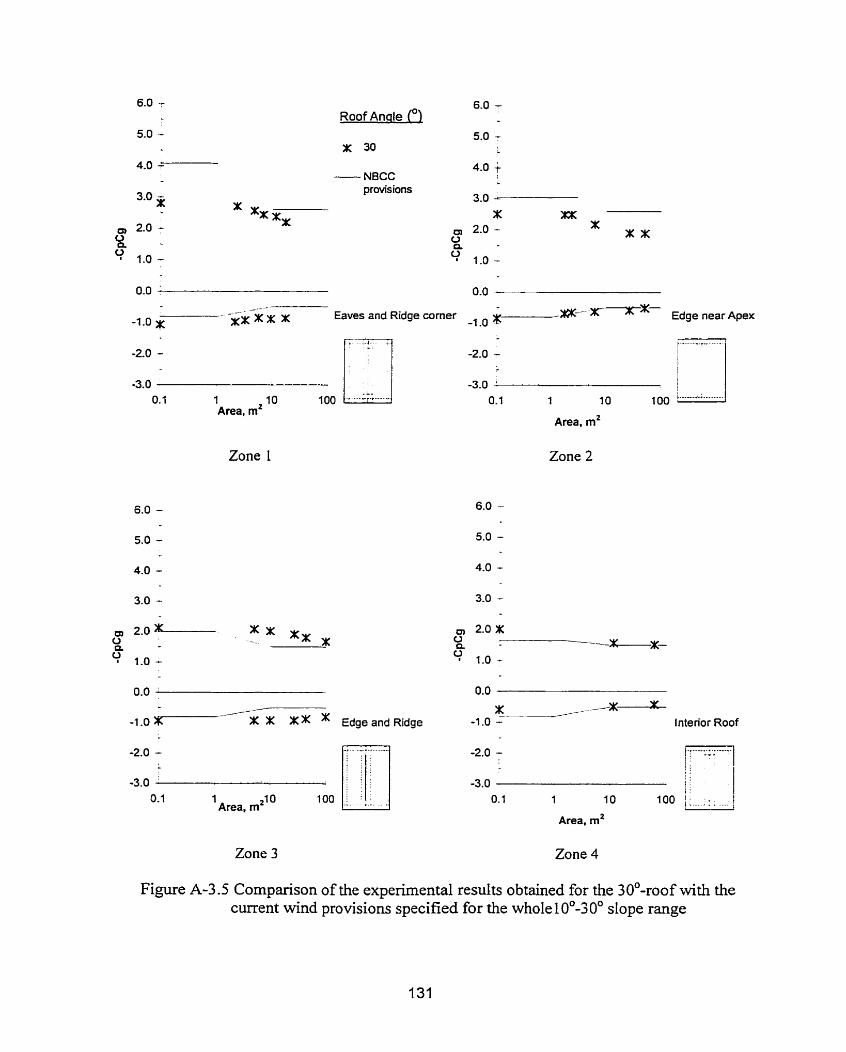
Roof Anale ('1
NBCC provisions
___- _ --- -1.0 * , x x x x Eaves and Ridge corner i--21- xnx- Edge near Apex
-1 .O
-2.0 -
-3.0 - 0.1 1 10 100
Area, rn2
Zone 1
-1 .O 7 / x x x Edge and Ridge
-2.0 - -3.0
o. 1 1 21 0 100 Area, m
Zone 3
Area, m2
Zone 2
* _ - . - - m ' Y -1.0 - Inte rior Roof
-3.0 0.1 1 10 1 O0
Area, m2
Zone 4
Figure A-3.5 Comparison of the experimental results obtained for the 30'-roof with the current wind provisions specified for the whole 10'-3 0' slope range