wind loads - roofs
DESCRIPTION
pres. by holmes on winds loads on roofsTRANSCRIPT

Large roofs and sports stadiums
Wind loading and structural response
Lecture 20 Dr. J.D. Holmes

Large roofs and sports stadiums
• Entertainment centres, exhibition centres, sports arenas etc
• Quasi-steady approach is not applicable
• Resonant effects can be significant
• Bending moments in arches and domes are sensitive to distribution of wind load

Large roofs and sports stadiums
• General flow characteristics :
• Mainly attached flow on large roofs
Separation
“bubble”
Stagnation
Point
Fluctuating re-
attachment
point
Shear layer positions:
High turbulence
Low turbulence

Large roofs and sports stadiums
• General flow characteristics :
• On arched roof, separation occurs downstream of apex
Separation
point
Large roofs and sports stadiums
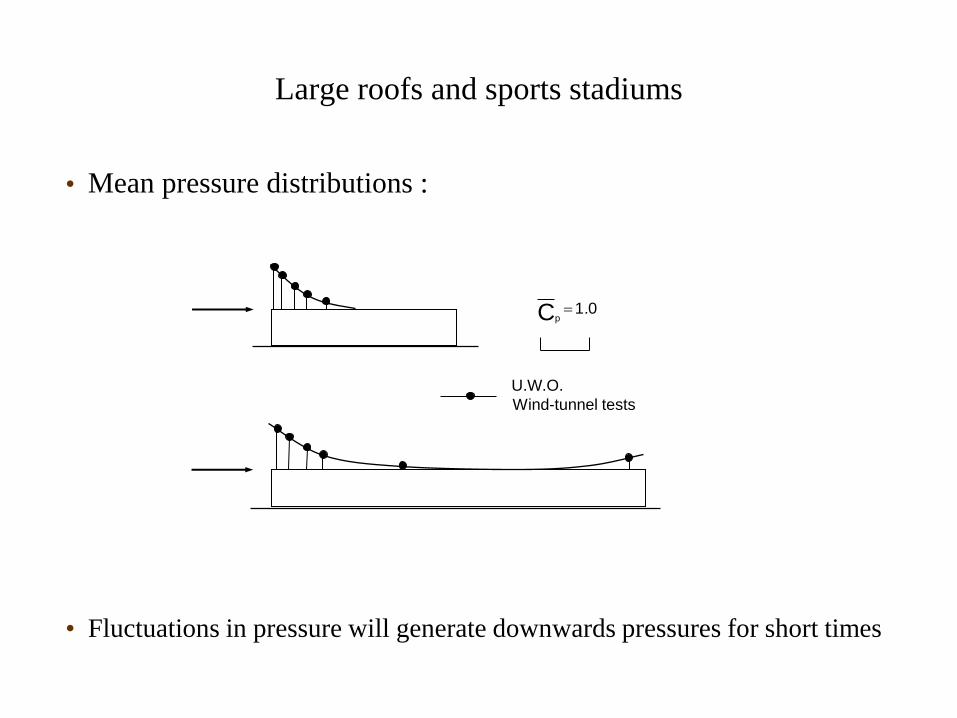
• Mean pressure distributions :
• Fluctuations in pressure will generate downwards pressures for short times
U.W.O.
Wind-tunnel tests
1.0Cp

Large roofs and sports stadiums
• Mean net pressure distributions (cantilevered stadium roof):
gap at rear reduces net pressures
-1.3 -1.2
-1.1
-1.0
-0.7 -0.6
-0.4 -0.2
-0.1
-0.8
0.0 0.2 0.1
0.1
0.0
-1.4
C/L
blocked at rear
Large roofs and sports stadiums
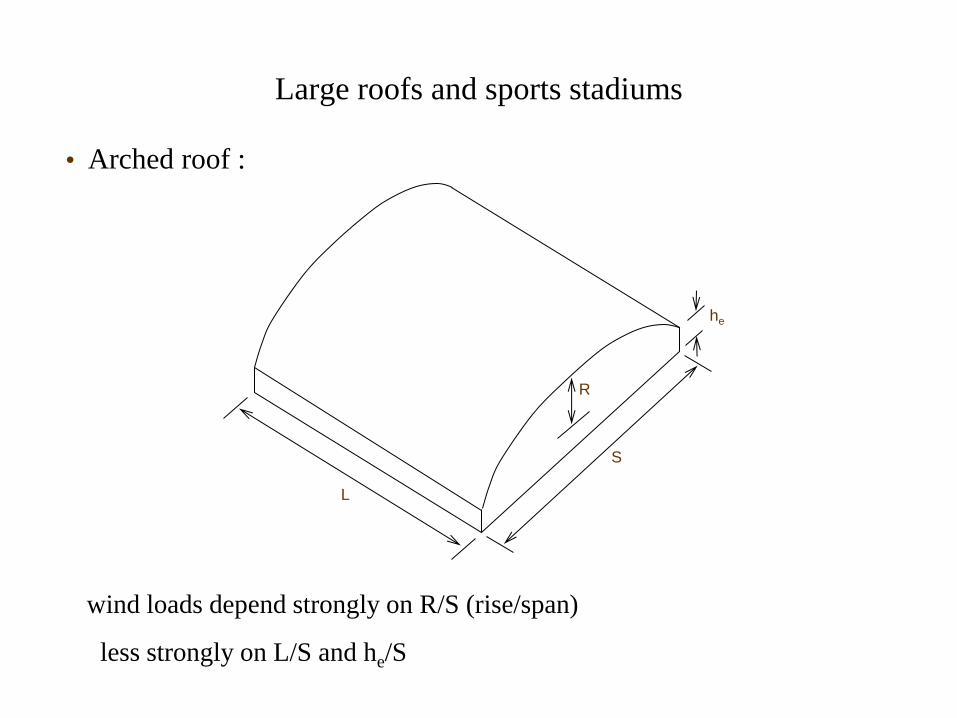
• Arched roof :
wind loads depend strongly on R/S (rise/span)
less strongly on L/S and he/S
L
S
R
he

Large roofs and sports stadiums
• Arched roof (Cp) :
R/S = 0.2 he/R = 0.45 L/S = 1.0 = 0o
+0.4
-0.4 -0.8
+0.3
0
+0.2
-0.3
-0.6 -0.3 +0.5 -0.5
-0.4 -0.5
-0.25
increasing L/S pressures on roof become more negative

Large roofs and sports stadiums
• Arched roof (Cp) : -0.3
0
-0.7
+0.2
-1.0
-0.4 -0.5
-0.7
+0.4
+0.3
0
+0.2 +0.3
+0.2
-0.4
0
-0.2 -0.7
-0.6
-0.6 -0.5
-0.5
-0.4 +0.1
-0.45
-0.5
-0.6 -0.7
-0.9 higher negative values

Large roofs and sports stadiums
• Arched roof (Cp) :
-0.2
-0.25 -0.3 -0.4
-0.5
-0.7
-0.9
+0.4
+0.2
+0.5
0 -0.7
-0.5 -0.3
-0.2 -0.15 -0.5
-0.15
R/S = 0.5 he/R = 0.45 L/S = 1.0 = 0o
lower negative values
positive
Large roofs and sports stadiums
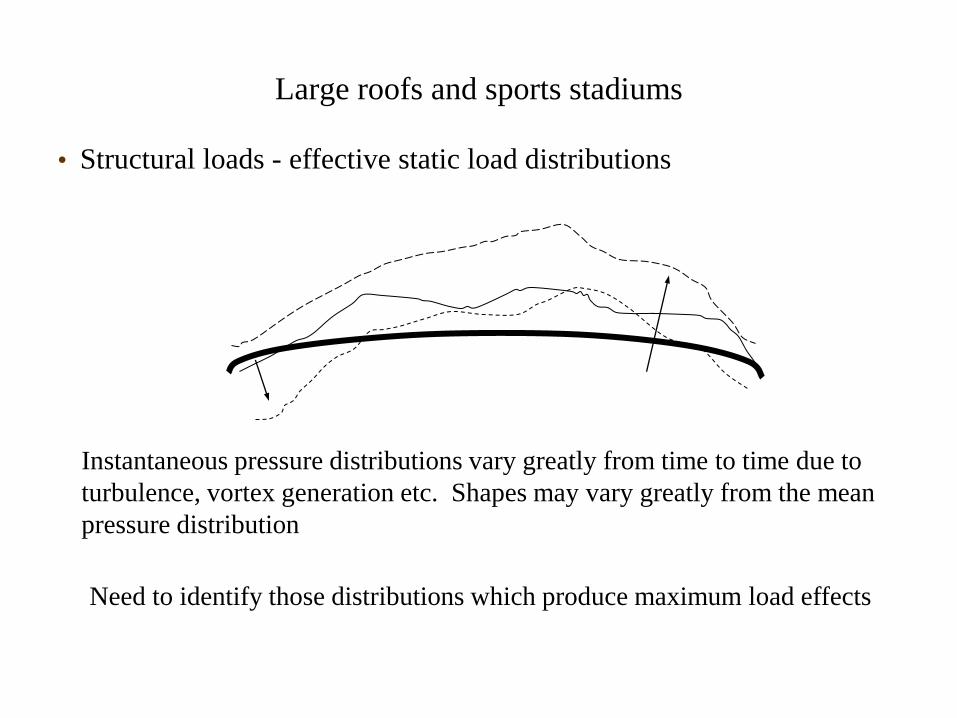
• Structural loads - effective static load distributions
Instantaneous pressure distributions vary greatly from time to time due to
turbulence, vortex generation etc. Shapes may vary greatly from the mean
pressure distribution
Need to identify those distributions which produce maximum load effects
Large roofs and sports stadiums
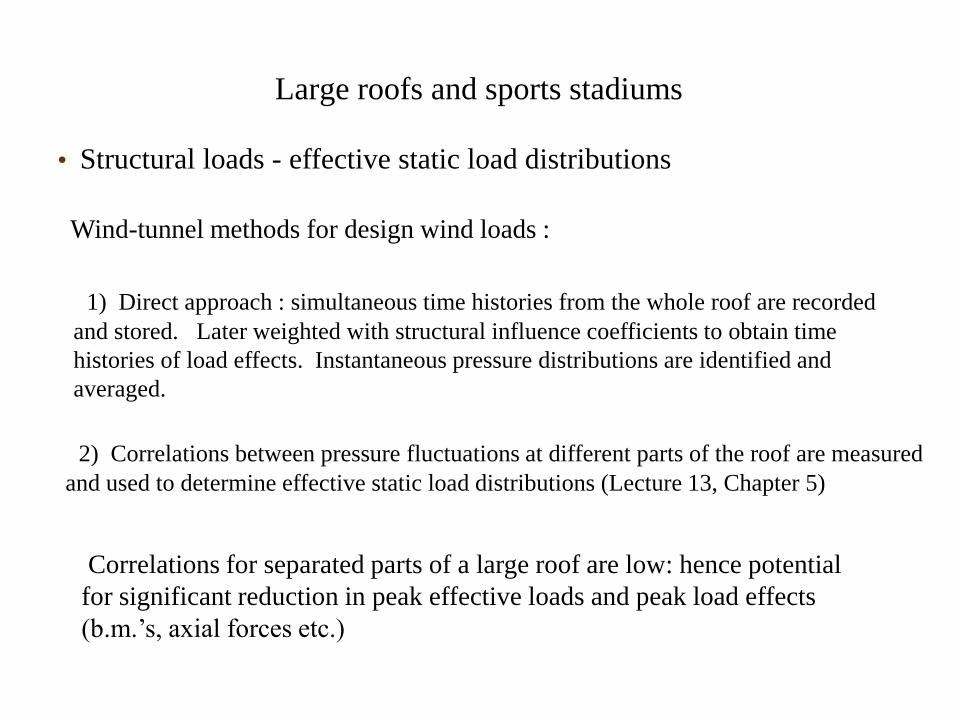
• Structural loads - effective static load distributions
Wind-tunnel methods for design wind loads :
1) Direct approach : simultaneous time histories from the whole roof are recorded
and stored. Later weighted with structural influence coefficients to obtain time
histories of load effects. Instantaneous pressure distributions are identified and
averaged.
2) Correlations between pressure fluctuations at different parts of the roof are measured
and used to determine effective static load distributions (Lecture 13, Chapter 5)
Correlations for separated parts of a large roof are low: hence potential
for significant reduction in peak effective loads and peak load effects
(b.m.’s, axial forces etc.)

Arch roof (Kasperski,1992) :
Extreme load distribution for the support reaction, R
Extreme load distribution for the bending moment at C
Gust pressure envelope
C =0.5pCR
45
+
-
Large roofs and sports stadiums
• Structural loads - effective static load distributions
Large roofs and sports stadiums
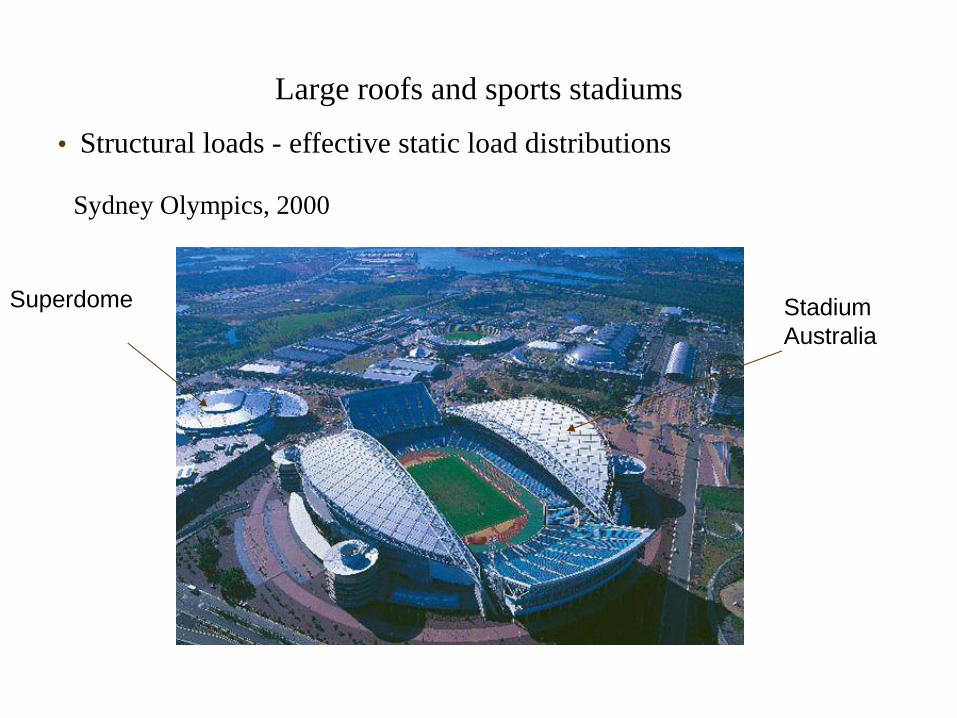
• Structural loads - effective static load distributions
Sydney Olympics, 2000
Superdome Stadium
Australia

Large roofs and sports stadiums
• Structural loads - effective static load distributions
Sydney Olympics, 2000 - 1/500 wind-tunnel model
Stadium
Australia Superdome
Large roofs and sports stadiums
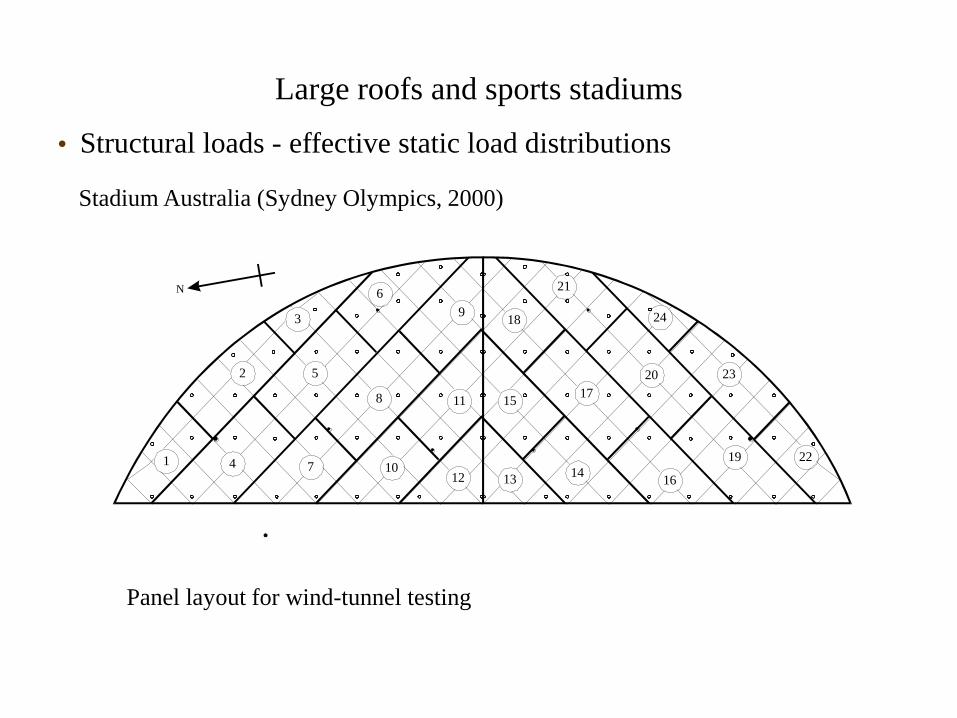
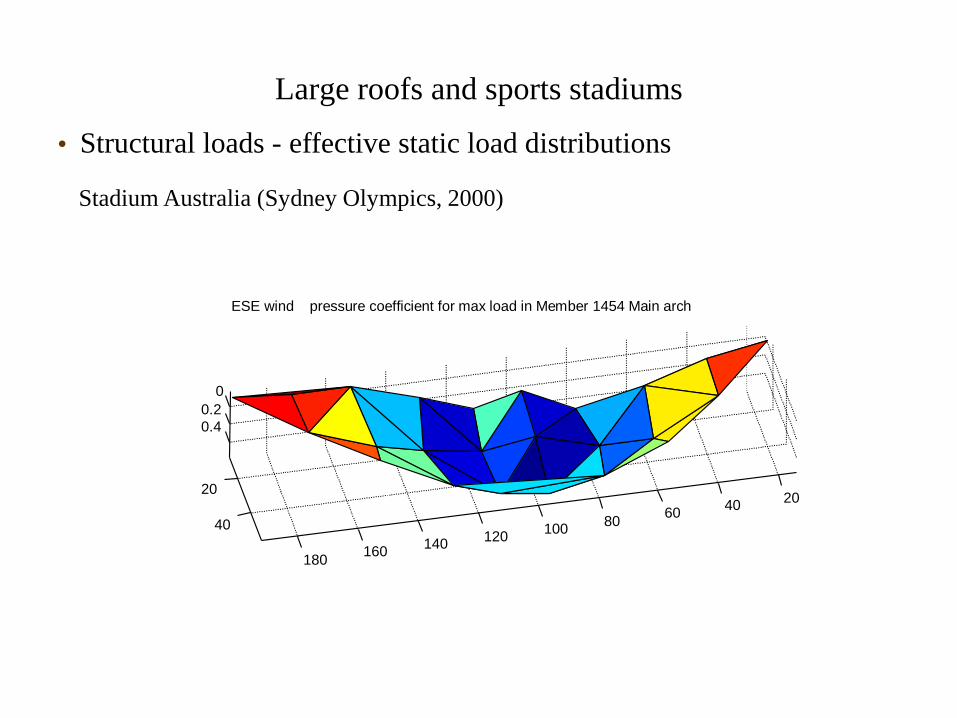
• Structural loads - effective static load distributions
Stadium Australia (Sydney Olympics, 2000)
22
23
24
19
20
21
18
17
1614
13
15
1210741
2 5
6
118
93
N
Panel layout for wind-tunnel testing
Large roofs and sports stadiums
• Structural loads - effective static load distributions
Stadium Australia (Sydney Olympics, 2000)
20
40
60
80
100
120
140
160
180
20
40
-0.4
-0.8
-1.2
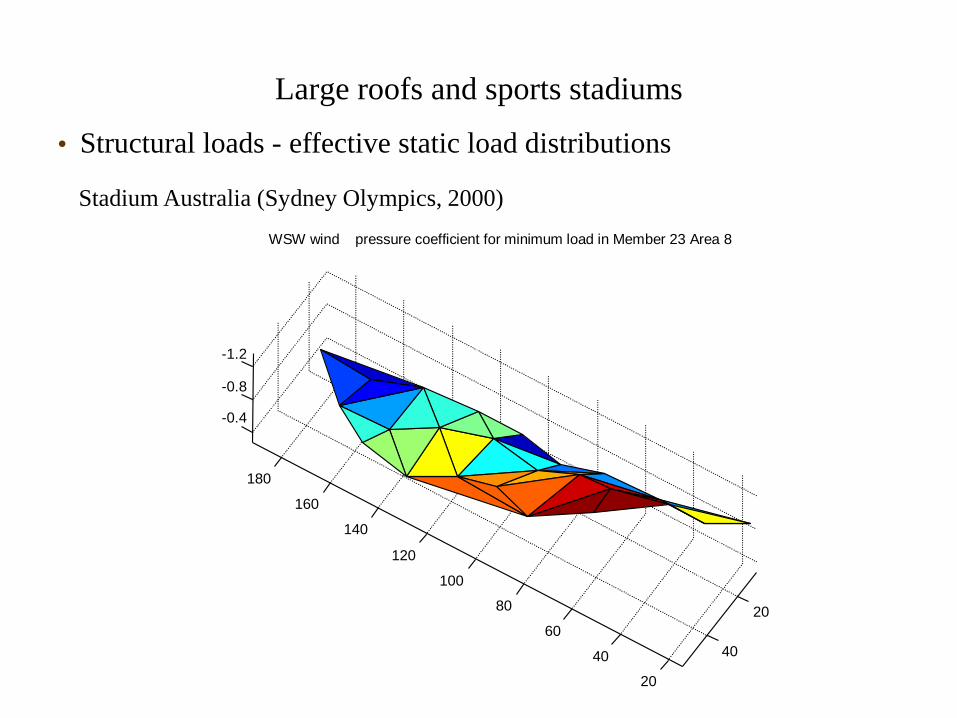
WSW wind pressure coefficient for minimum load in Member 23 Area 8
Large roofs and sports stadiums
• Structural loads - effective static load distributions
Stadium Australia (Sydney Olympics, 2000)
2040
6080
100120
140160
180
20
40
0.4
0.2
0
ESE wind pressure coefficient for max load in Member 1454 Main arch
Large roofs and sports stadiums
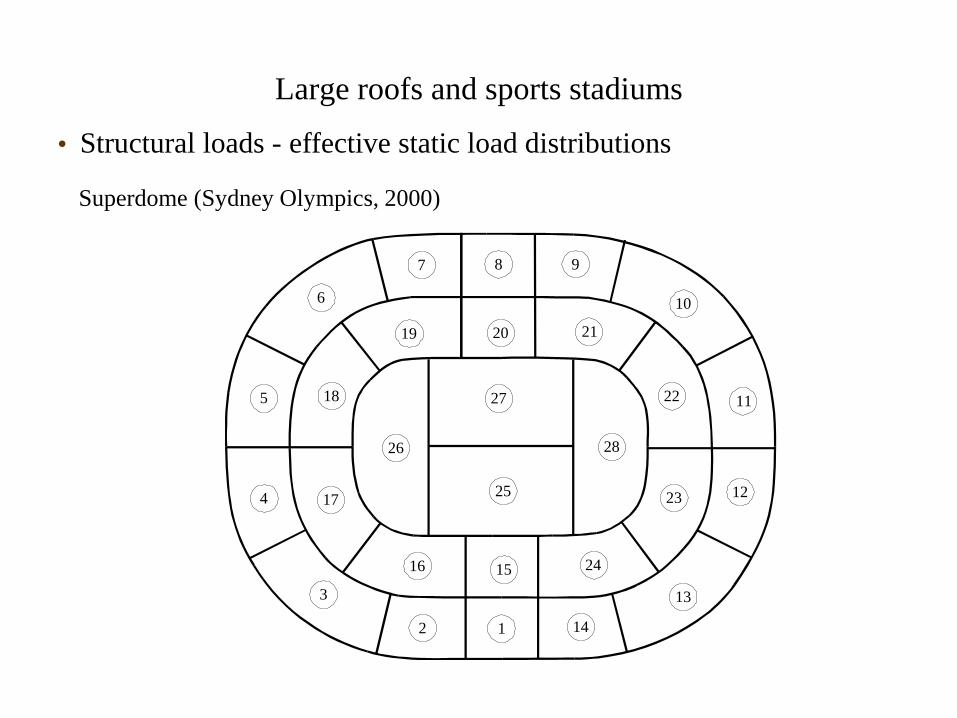
• Structural loads - effective static load distributions
Superdome (Sydney Olympics, 2000)
12
3
4
5
6
7 8 9
10
11
12
13
14
1516
17
18
19 20 21
22
23
24
25
26
27
28

Large roofs and sports stadiums
• Structural loads - effective static load distributions
Superdome (Sydney Olympics, 2000)
-0.6
-0.5
-0.4
-0.3
-0.2
-0.1
0
0.1
0.2
0.3
1 2 3 4 5 6 7 8 9 10 11 12 13 14 15 16 17 18 19 20 21 22 23 24 25 26 27 28
Panel Number
Pre
ss
ure
/k
Pa
Extreme pressure limits Correlation approach Direct approach
WSW
SSE
Effective static load distributions for axial loads in a particular roof member

Large roofs and sports stadiums
• Structural loads - contribution from resonant modes
Usually not significant for roofs supported all round or on two sides
Very large roofs may have several modes below 1 Hertz
- contributions to load effects depend on similarity of mode shapes with
influence lines
May be significant for cantilevered roofs :
0 Time
Vertical
upwards