wind lidar activities in the united states - nrel.gov · how good is good enough when it comes to...
TRANSCRIPT

Wind Lidar Activities in the United States Andrew Clifton, Jennifer Newman, Alexandra St. Pé, G. Valerio Iungo, Sonia Wharton, Tommy Herges, Matthew Filippelli, Philippe Pontbriand, and Evan Osler
December 15, 2016 NREL/PR-5000-67644
IEA Wind Task 32 General Meeting Glasgow, Scotland

2
• Jennifer Newman, National Renewable Energy Laboratory (NREL) Improving Lidar Turbulence
• Alexandra St. Pé, University of Maryland Baltimore County (UMBC) U-SPARC: UMBC- atmoSpheric Profiling for Advancing offshoRe wind researCh
• G. Valerio Iungo, University of Texas Dallas Proactive monitoring of an onshore windfarm
• Sonia Wharton, Lawrence Livermore National Laboratory (LLNL) Wind Forecasting Improvement Project (WFIP) 2
• Tommy Herges, Sandia National Laboratories Lidar measurements at SWIFT
• Matthew Filippelli, AWS Truepower 2016 Lidar Applications Snapshot
• Philippe Pontbriand, Renewable Energy Systems (RES) C-FARS: Industry Consortium for Advancement of Remote Sensing
• Evan Osler, Renewable NRG Systems Wind Energy Lidar Trends in North America.
Contributions
Contributions were requested from approximately 20 U.S.-based members of the International Energy Agency Wind Task 32 group and are presented as is, with modifications for different slide aspect ratios or to satisfy a two-slide
limit. Inclusion does not imply endorsement by NREL or the U.S. Department of Energy (DOE), or agreement with the content. Questions about contributions should be directed to the slides’ author(s).
All nonattributed slides were prepared by Andrew Clifton, NREL

3
Dec. 2016: First U.S. Offshore Wind Plant Begins Commercial Operations!
• Block Island Wind Plant, Rhode Island
• 5x Alstom Halide Turbines
• Resource assessment (2011) and turbine installation (2016) supported by wind lidar.
Text from zephirlidar.com Provided by Andrew Clifton, NREL
Block Island Turbines. Photo by Dennis Schroeder, NREL

4
A Method To Improve Turbulence Measured By Lidar • Motivation: We have a good handle on mean wind speeds from lidar in flat terrain, but
measurements of turbulence intensity (TI) are still a challenge • Current Work: Lidar Turbulence Error Reduction Algorithm (L-TERRA)
• Algorithm is dynamic – A new set of corrections is applied for every 10-minute period
• The Big Question: How good is good enough when it comes to lidar turbulence? • We will never get exactly the same values that we would get from a cup or sonic anemometer.
Variance contamination
Volume averaging
Noise
Slide and images provided by Jennifer Newman, NREL

5
A Method To Improve Turbulence Measured By Lidar
Contact E-mail: [email protected] Phone: +1 303-275-4998
Before L-TERRA
After L-TERRA
Remaining Challenges • Turbulence intensity accuracy improves
on average, but still a large amount of scatter—L-TERRA is not currently capturing all the physics
• Currently using simulations to better understand how the three-dimensional flow field affects lidar turbulence intensity estimates.
Slide and images provided by Jennifer Newman, NREL

Motivation Demonstrate the advantages of Doppler wind lidar measurements for understanding the frequency of complex rotor-layer wind structures (i.e., vertical wind speed and direction and turbulence profiles) in the offshore Mid-Atlantic USA environment
• Activity: July-August 2013 collected offshore wind measurements (40–220 meters [m]) in Maryland’s Wind Energy Area (Windcube V2 Offshore)
Classified vertical wind speed profile ‘shapes’ using goodness of fit to mathematical expressions and other criteria
Method
Schematic of Classified Rotor-Layer Wind ‘Shapes’
• Once ‘shapes’ were classified, UMBC investigated relationships with meteorological drivers and turbine-available power estimates.
U-SPARC: UMBC- atmoSpheric Profiling for Advancing offshoRe wind researCh
Slide provided by UMBC

Contact: Ruben Delgado ([email protected]) Website: http://lidar.umbc.edu/wind-energy/
Motivation:
Only ~17% of data classified as Type 1, power-law fit; majority of data set ‘unexpected’ shapes (Types 3-6); ~18% of data ‘reversed’ wind profile shapes
Offshore lidar measurements are extremely valuable for characterizing rotor-layer wind conditions that deviate from expected ‘logarithmic-like’ power law shapes
Investigating impact of classified profile shapes on coastal turbine’s performance and relationships with atmospheric stability
• Collecting long-term scanning wind lidar measurements off Maryland’s coast (Nov 2014-present)
Rotor equivalent wind speed (REWS) available power estimate = 5 to 11% less than hub-height estimate, depending on wind profile shape
2 4 6 8 10 12 140
4080
120160200
Example of Classified Rotor-Layer Wind Profile 'Types'
Measured
Fit
1 2 3 4 5 6 7 8 9Hei
ght (
m)
04080
120160200
04080
120160200
Wind Speed (m/s)0 2 4 6 8 10 12 14
1R 12R
5 66R
4R 3R3
4
2
5R
Radial wind measurements Ocean City, Maryland
U-SPARC: UMBC- atmoSpheric Profiling for Advancing offshoRe wind researCh
Lessons Learned Take-Away/Next Steps
Slide provided by UMBC

Proactive Monitoring of a Land-Based Wind Farm
Site: Panhandle, Texas Subarray of 25 turbines; 2.3 megawatts (MW) Supervisory control and data acquisition and
meteorological data available
G. Valerio Iungo, email: [email protected] Web: www.utdallas.edu/windflux
Motivation: • Evidence of power losses due to wake interactions • Need for improved wake models for real-time coordinated wind farm control.
UTD Mobile Lidar Station Two long-range scanning lidars
Arrays of sonic anemometers and licors
Slide provided by UT Dallas

Proactive Monitoring of a Land-Based Wind Farm
Cumulative power losses: • Losses for 4% of the total power production under
stable atmospheric boundary layer (ABL) conditions • 2.4% loss under convective conditions • Evidence of wake-related losses at the 2nd row
(center) and 3rd row (top) for southerly wind directions • Underperformance of turbine 7 for SE wind directions
due to a spacing of 3.5 rotor diameters from turbine 8.
Convective ABL Stable ABL
Effects of atmospheric stability on wind turbine wakes and wake interactions: • Experimental power curves show generally larger
power production under convective ABL conditions • Wind turbine wakes recover faster under convective
ABL conditions as a consequence of higher turbulence intensity and flow entrainment
• Reproducing effects on wakes due to atmospheric stability is essential for accurate power predictions and wind farm control.
Slide provided by UT Dallas

10
How good are wind forecasts in complex terrain? Can we improve them? • Columbia River Gorge
(Oregon/Washington border) o Area of complex flow o Four gigawatts installed capacity
• Competitive award in 2013 • Field campaign from summer 2015 to
early 2017 • Comparing observations to WRF model
improvements • Validated improvements will flow into
operational forecasts.
Wind Forecasting Improvement Project (WFIP2)
Focus area: Wasco, Oregon
~250 km
Columbia River Gorge
Portland
Seattle
The Team: • Vaisala (DOE Funding Opportunity Announcement awardee) leads a team
including individuals from University of Colorado, Boulder, National Center for Atmospheric Research, Sharply Focused, Lockheed Martin, Texas Tech University, the University of Notre Dame, Iberdrola Renewables, Southern California Edison, Cowlitz County Public Utility District, Eurus Energy, Bonneville Power Administration, and Portland General Electric.
• DOE National Labs: NREL, Pacific Northwest National Laboratory, LLNL, Argonne National Laboratory
• National Oceanic and Atmospheric Administration

11
(a)
d
Pink dots are individual wind turbines
Observations
Model
Results from Lidar – Model Comparison
Slide provided by Sonia Wharton, [email protected]. All images used with permission.
The WFIP2 Model domain
A lidar deployed as part of WFIP2

12 AWS Truepower, LLC. © 2016
AWS Truepower – 2016 Lidar Application Snapshot
Preconstruction Lidar Activities Application Description Photo Dedicated offshore measurements
On behalf of MassCEC, AWST is supporting the monitoring, operations and analysis of a Windcube V2 offshore of Martha’s Vineyard, MA. Data is planned for public use.
Floating lidar validation
AWST validated UMaine’s prototype DeepCLidar floating lidar system (Windcube V2 offshore) against Carbon Trust framework; the system passed all KPIs
Stand-alone wind map validation
Design, implementation, and analysis of campaigns employing stand-alone lidar data sets for wind model validation / adjustment (after verification with a tower)
Mobile shear verification
Supported legacy approach of using lidar as a mobile, short-term measurement tool for shear (and veer) characterization
Slide and all images provided by AWS Truepower

13 AWS Truepower, LLC. © 2016
AWS Truepower – 2016 Lidar Application Snapshot
Postconstruction Lidar Activities Application Description Photo Permanent met mast replacement
Supported siting, installation, SCADA integration and operation of a profiling lidar in lieu of a permanent met mast on an operating project; data accepted by utility
Forecasting support
On behalf of HECO, AWST is supporting operations and analysis of Windcube 100S as part of an integrated solar and wind forecasting system. Arc scans also set up to support potential wake analyses of adjacent farm.
Power performance measurement methods development
Participate in IEA Task 32 round robin for Uncertainties in Power Performance measurements; Develop Power curve test methods to accommodate lidar use in IEC 61400-12-1 ed. 2
Initiate multi-lidar power curve test – one two-beam nacelle lidar, one four-beam nacelle lidar, one ground-based profiling lidar, one IEC hub height mast all evaluating the same turbine; to be deployed Q1 2017
Slide and all images provided by AWS Truepower

14 AWS Truepower, LLC. © 2016
AWS Truepower – 2016 Lidar Application Snapshot
Needs and Activities for 2017
• Design Inputs: Expand lidar use in suitability assessments and offshore design basis development
• Complex Terrain: Encourage better mast, lidar, and flow model configurations to enhance analyses at complex sites
• Broaden Overall Usage: Encourage more frequent and longer duration lidar deployments for terrestrial and offshore projects (pre and postconstruction)
• Power Performance Tests: Conduct lidar-based power performance tests; experimentally and commercially.
Thanks! Matthew V. Filippelli
Principal Engineer – AWS Truepower [email protected]
+1 518 213 0044 x 1015
Slide provided by AWS Truepower

Industry Consortium for Advancement of Remote Sensing (C-FARS)
• 2016 Founding Members:
Five major North American wind project owners, developers, and operators
• Industry Remote Sensing Facilitator
Federated private industry consortium enabling collaboration on projects promoting the acceptance of remote sensing
• Private Industry Players \
Private industrial players supporting the different working groups
Who How
• Create Consensus
Seek private industry consensus around the use of remote sensing; speak with a common voice
• Build Bridges
Build bridges between industry players, research centers, normalization body, and tasks
• Rapidly Address Private Industry Remote Sensing Needs:
Steer short-term projects aimed at supporting private industry needs
Why
• Access to Information
Give access to a large pool of industry remote sensing data from private sector
• Support Remote Sensing Validation Projects
Join members' resources to support short-term practical projects validating use of remote sensing
• Jointly Present Results
Present compelling results to banks, third parties, and other stakeholders
Slide provided by RES

C-FARS: Progress and Projects Proposal
• Projects Proposal • Project Outcome • Remote sensing – performance
validation
• Evaluation of performance indicators for the main remote sensing technologies commercially available
• Demonstration of their respective ability to reduce project uncertainty
• Demonstration of level of consistency across the various technologies (lidar, sodar)
• Evaluation of their performance in various climatic conditions
• Filling the gap to achieve bankability of standalone remote sensing in noncomplex terrain
• Develop the largest industry data set of remote sensing collocation with International Electrotechnical Commission (IEC)-compliant masts in noncomplex terrain
• Evaluate average performance parameters for the entire data set (sodar and lidar) in comparison to IEC compliance mast
Members expression of interest
First grant application (Canada)
Governance definition
Official launch
Projects kickoff
September 2016 November 2016 Jan-Feb 2017 March 2017 April 2017 …
Philippe Coulombe-Pontbriand (Canada) Energy Lead, RES-Americas
[email protected] 1 (514) 525-2113 ext 228
Brian Healer Vice President, Development Services
[email protected] 1 (303) 439-4217
Slide provided by RES

• Most projects now utilize remote sensing in the wind resource assessment (WRA) phase
• 60-m met towers are still the standard despite hub heights in the 80–100 m range, leaving an important height gap for RSDs to fill for shear uncertainty reduction
• Sodars still outnumber Doppler lidars in terms of field use, but lidars have gained significant ground in last 2–3 years
• Lidars tend to be used in conservative (i.e., less mobile) ways, and with greater value placed on on-site verification vs. predeployment third- party validation, compared to European norms
• Project developers and WRA analysts are especially busy with production-tax-credit-related deadlines; anecdotally, there is less time and room for innovation in WRA techniques than there would be in times of lesser development pressures.
Wind Energy Lidar Trends in North America: Preconstruction
WINDCUBE + propane fuel cell adjacent to 60-m XHD mast in southern Ontario, Canada
Contact: Evan Osler at [email protected] or 802/482-2255 x545
Slides authored by Evan Osler Renewable NRG Systems
Slide and photo provided by Renewable NRG Systems

• Lidar use for operational power performance testing (PPT) has increased dramatically in popularity (hub-height method in spirit of IEC -12-1:2005)
• All else equal, general preference for ground-based lidar compared to nacelle lidar in simple terrain operational PPT
• Unlike majority of preconstruction projects, majority of wind farms do not use RSDs actively; this is slowly changing
• Impact of four-beam Wind Iris on ability to perform operational PPT in complex terrain is potentially significant
• With many projects underperforming, there is both a need for operational wind measurements and, in many cases, budget challenges to doing so
• A broad portion of the industry on the operational side is unfamiliar or only vaguely familiar with IEC -12-1 rev 2 and the rotor-equivalent wind speed (REWS) concept.
Wind Iris (two-beam) temporarily installed for calibration of upgraded turbine control sensor hardware in California
contact Evan Osler at [email protected]
Wind Energy Lidar Trends in North America: Postconstruction
Slides authored by Evan Osler Renewable NRG Systems
Slide and photo provided by Renewable NRG Systems
19
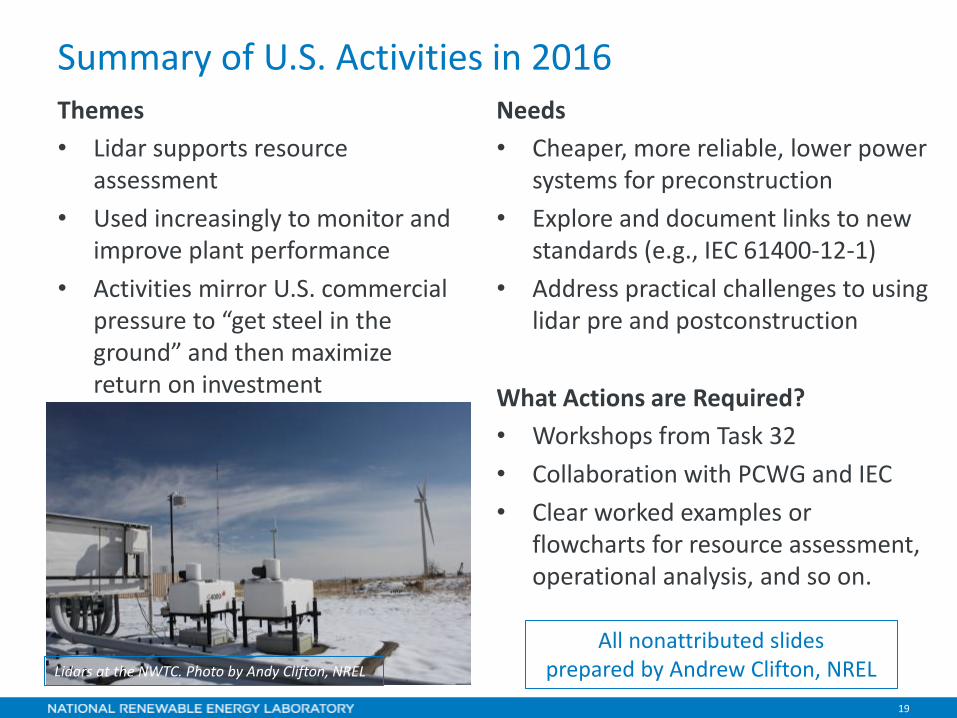
Summary of U.S. Activities in 2016
• Lidar supports resource assessment
• Used increasingly to monitor and improve plant performance
• Activities mirror U.S. commercial pressure to “get steel in the ground” and then maximize return on investment
• Cheaper, more reliable, lower power systems for preconstruction
• Explore and document links to new standards (e.g., IEC 61400-12-1)
• Address practical challenges to using lidar pre and postconstruction
Themes Needs
• Workshops from Task 32 • Collaboration with PCWG and IEC • Clear worked examples or
flowcharts for resource assessment, operational analysis, and so on.
What Actions are Required?
All nonattributed slides prepared by Andrew Clifton, NREL Lidars at the NWTC. Photo by Andy Clifton, NREL

20
Let’s talk! [email protected] +1 303 513 0095
A multimegawatt wind turbine and 1-MW photovoltaic field at the National Wind Technology Center at the National Renewable Energy Laboratory. Photo by Dennis Schroeder, NREL
• Jennifer Newman, NREL Improving Lidar Turbulence
• Ruben Delgado, UMBC U-SPARC: UMBC- atmoSpheric Profiling for
Advancing offshoRe wind researCh
• G. Valerio Iungo, University of Texas Dallas Proactive monitoring of an onshore windfarm
• Sonia Wharton, LLNL Wind Forecasting Improvement Project (WFIP) 2
• Tommy Herges, Sandia National Laboratories Lidar measurements at SWIFT
• Matthew Filippelli 2016 Lidar Applications Snapshot
• Philippe Pontbriand, RES C-FARS: Industry Consortium for Advancement of
Remote Sensing
• Evan Osler, NRG Wind Energy Lidar Trends in North America