wind energy simulation - teratec · 18.05.2006 · wind energy simulation c. montavon, i. jones-...
TRANSCRIPT
Wind Energy SimulationC. MONTAVON, I. JONES- ANSYS UK
présenté par Dr D. TSCHUMPERLE- ANSYS France
28 & 29 juin 2011Forum TERATEC 2011
Content
BackgroundgWhy CFDWho should be using CFDWho should be using CFDProcess automation
Meshing/ Modelling / Reporting
Case StudiesSingle wakeMultiple wakes and forestry (Blacklaw wind farm) Multiple wakes offshoreComplex terrain (Bolund)
28 & 29 juin 2011Forum TERATEC 2011
Conclusion
Background
Wind Industry faced with the need to consider more difficult sites yfor Wind Farms:
Terrain with complex orographyLarge wind farms where multiple-wake effects are relevantDense forests
Simple linearised tools (and parameterised models) have limitations for these casesCFD increasingly being used
Need for tools that can be used reliably by non CFD specialistsAutomation of simulation process required
Driven by customer needs for practical prediction capability
28 & 29 juin 2011Forum TERATEC 2011
N-S Solvers vs. Linearised models
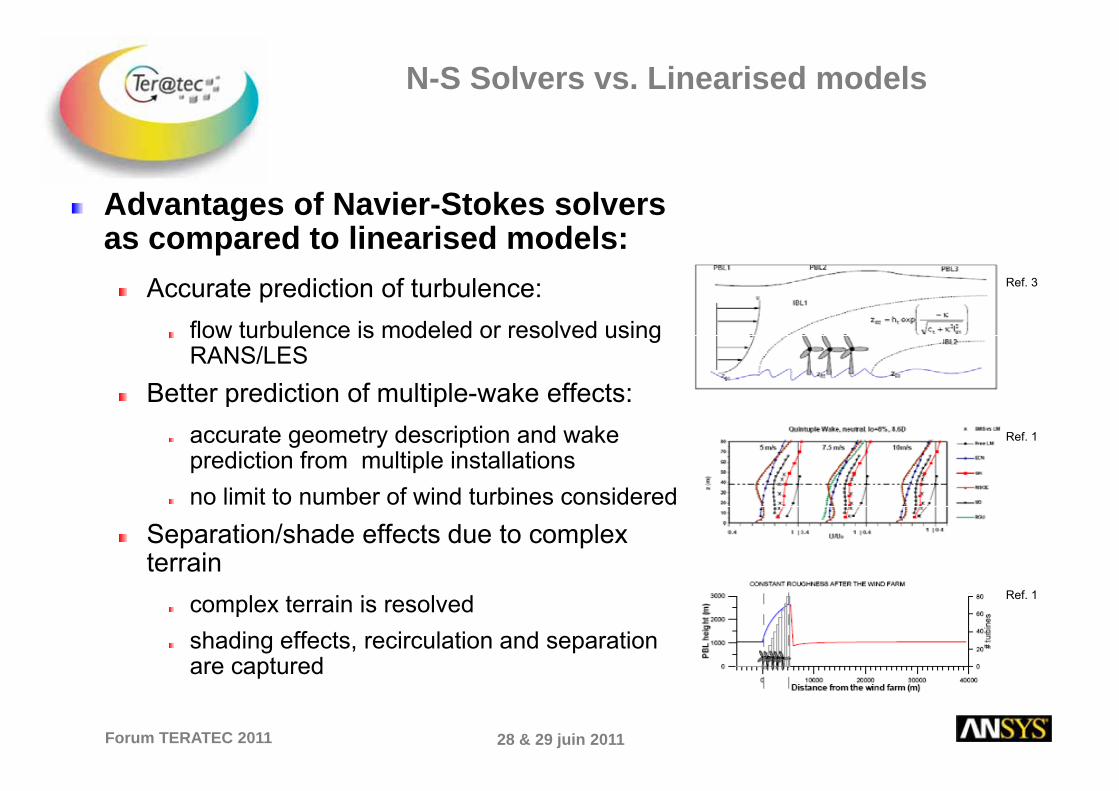
Advantages of Navier-Stokes solvers gas compared to linearised models:
Accurate prediction of turbulence: Ref. 3
flow turbulence is modeled or resolved using RANS/LES
Better prediction of multiple-wake effects:Better prediction of multiple-wake effects:accurate geometry description and wake prediction from multiple installations
Ref. 1
no limit to number of wind turbines consideredSeparation/shade effects due to complex terrain
complex terrain is resolvedshading effects, recirculation and separation are captured
Ref. 1
28 & 29 juin 2011Forum TERATEC 2011
are captured
N-S Solvers vs. Linearised Models
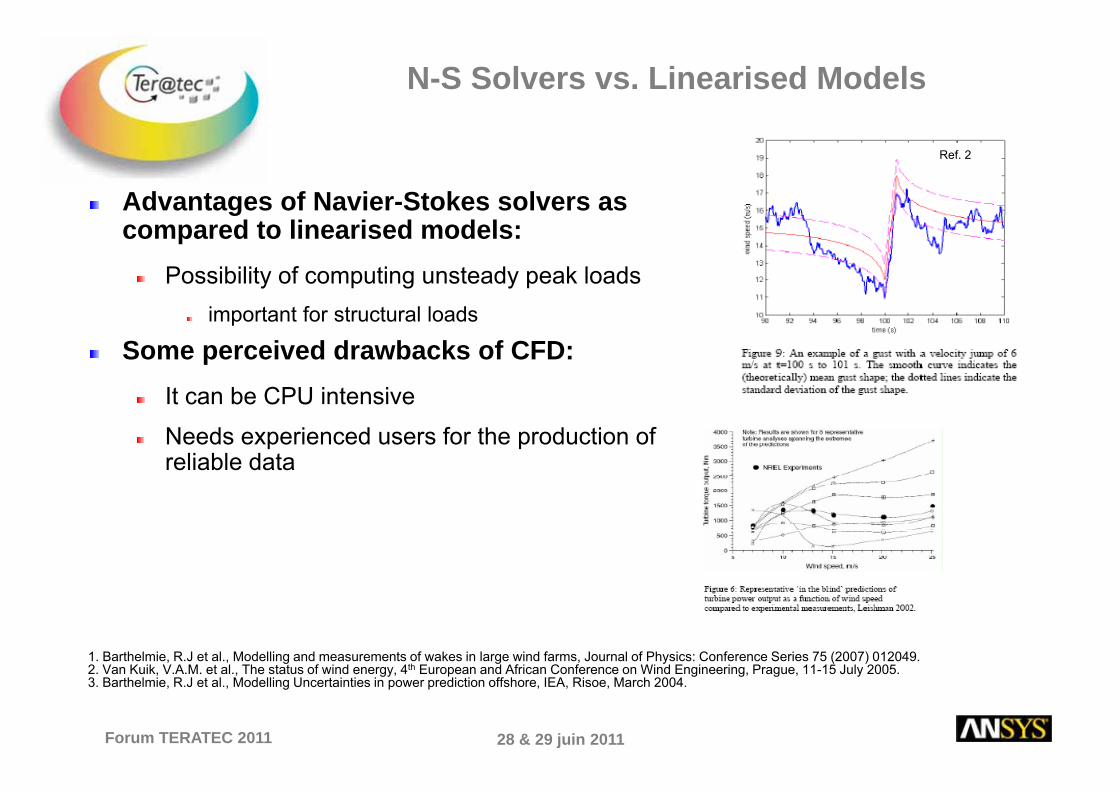
Advantages of Navier-Stokes solvers as
Ref. 2
compared to linearised models:Possibility of computing unsteady peak loads
important for structural loads
Some perceived drawbacks of CFD:It can be CPU intensiveIt can be CPU intensive
Needs experienced users for the production of reliable data
1. Barthelmie, R.J et al., Modelling and measurements of wakes in large wind farms, Journal of Physics: Conference Series 75 (2007) 012049.2 V K ik V A M t l Th t t f i d 4th E d Af i C f Wi d E i i P 11 15 J l 2005
28 & 29 juin 2011Forum TERATEC 2011
2. Van Kuik, V.A.M. et al., The status of wind energy, 4th European and African Conference on Wind Engineering, Prague, 11-15 July 2005.3. Barthelmie, R.J et al., Modelling Uncertainties in power prediction offshore, IEA, Risoe, March 2004.

Limitations of Linearised Models
Linearised models operate outside their recommendedLinearised models operate outside their recommended envelope when flow separation occurs:Measured by Ruggedness Index (RIX) percentage area over aMeasured by Ruggedness Index (RIX), percentage area over a radius of 3500m where slope > 0.3 Equivalent to 16.7° critical angleEquivalent to 16.7 critical angle
‘If the RIX is > 0%, parts of the terrain are steeper than 0.3 and flow separation may occur in some sectors. This situation is generally
t id th f l f WA P d di tioutside the performance envelope of WAsP and prediction errors may be expected. Large RIX values will lead to large errors in the flow modelling. ‘
Mortensen, Landberg and Troen, WAsP Utility Programs Manual, Sept 2004, Riso
28 & 29 juin 2011Forum TERATEC 2011
g y g pNational Laboratory
Alaiz Hill
Complex Terrain, RIX 16%p ,
‘As it is shown CFD extrapolates wind speed between masts moreAs it is shown, CFD extrapolates wind speed between masts more accurately in almost all cases giving an average absolute error of 1.75% significantly less than the others: 5.67% for WAsP Engineering and 5.41% for WAsP.’
D. Cabezón, A. Iniesta, E. Ferrer, I. Martí, ‘Comparing linear and non linear wind flow models’, , , , , p g ,http://www.ewec2006proceedings.info/allfiles2/825_Ewec2006fullpaper.pdf
28 & 29 juin 2011Forum TERATEC 2011

Influence of Forestry
Forestry has a big influence on flow separationy g pIncreases tendency for flow to separateCritical angle for recirculation reduced by ~ ¼° per metre of tree heightCritical angle for recirculation reduced by ¼ per metre of tree height
12m trees -> critical angle ~14°20m trees -> critical angle ~12°
P. Stuart, I. Hunter, R. Chevallaz-Perrier, G. Habenicht, ‘Predicting and Understanding the Breakdown of Linear Flow Models ‘ , http://ewec2009proceedings.info/proceedings/index.php?page=info2&id=151&id2=619&ordre=45&tr=&searchin=&what=&searchtext=&day=4&top=&fil1=&fil2=&fil2&ord1=&sess=#top
Ross, AN; Vosper, SB (2005), ‘Neutral turbulent flow over forested hills’, Q J ROY METEOR SOC, 131, 1841-1862. doi:10.1256/qj.04.129.
28 & 29 juin 2011Forum TERATEC 2011
Who should be using CFD
Wind Farm DevelopersWind Farm Developers
Initial resource assessmentIs this a good place for a wind farmIs this a good place for a wind farm
Detailed layout planningNumber of turbines, locationsEffect of wakes, forestry management
Investors
Will there be a ret rn on in estment (ROI)Will there be a return on investment (ROI)
Turbine manufacturer
Turbulence levels leading to turbine failureTurbulence levels, leading to turbine failure
IEC guidelines for turbulence intensity
28 & 29 juin 2011Forum TERATEC 2011
Tools for Automated Solution
Wi dM d ll t f t l d d ANSYSWindModeller: set of tools wrapped around ANSYS commercial CFD products:
To allow non CFD experts to perform wind farm analyses inTo allow non-CFD experts to perform wind farm analyses in automated wayDriving ANSYS CFX or FLUENT flow solverProvide access to State Of The Art CFD software Customised setup and post-processing scripts can easily be altered
fby the user to further develop the tools Allows advanced user to encapsulate their own expertiseF t t d d lti tFast turnaround on modern multi-core systems
28 & 29 juin 2011Forum TERATEC 2011

Tools for Automated Solution
ObjectivejFrom Map to Mesh to CFD to ReportData Extraction and Automation of Analysis
CFD solution + automated post-processing
28 & 29 juin 2011Forum TERATEC 2011
WindModeller: Simulation Process
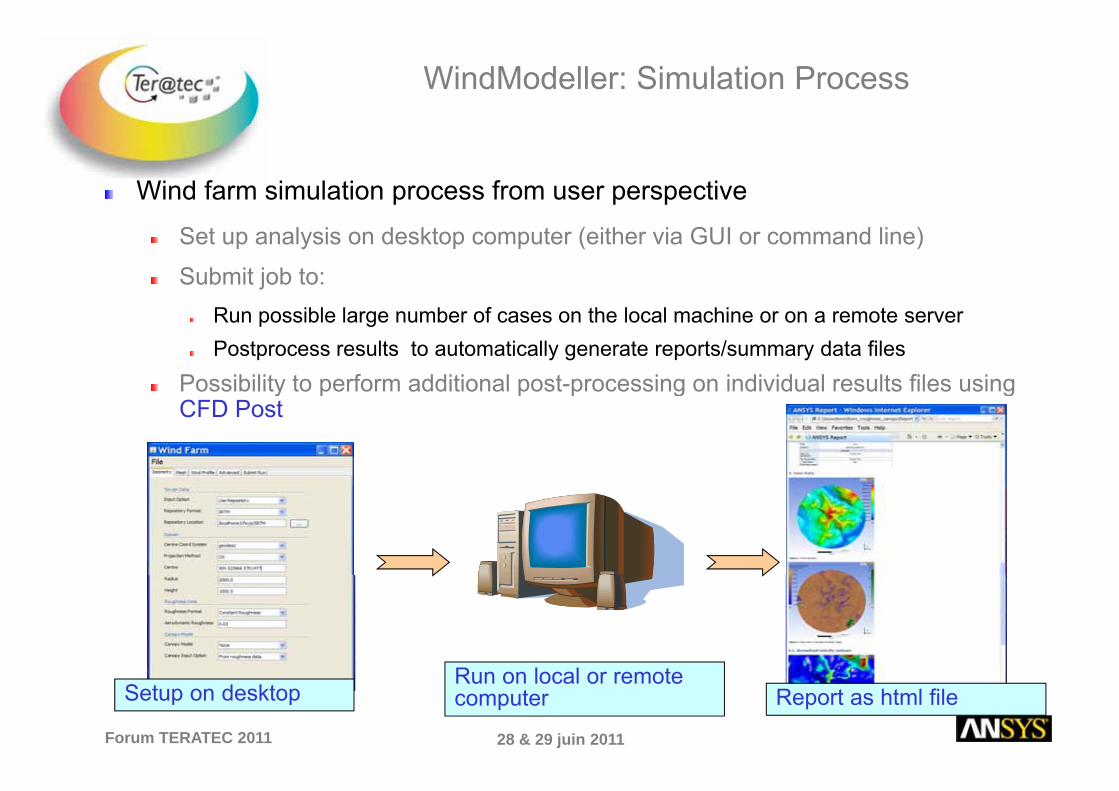
Wind farm simulation process from user perspective
Set up analysis on desktop computer (either via GUI or command line)
Submit job to:Run possible large number of cases on the local machine or on a remote server Postprocess results to automatically generate reports/summary data files
Possibility to perform additional post-processing on individual results files using y p p p g gCFD Post
28 & 29 juin 2011Forum TERATEC 2011
Setup on desktopRun on local or remote computer Report as html file
Meshing Approach
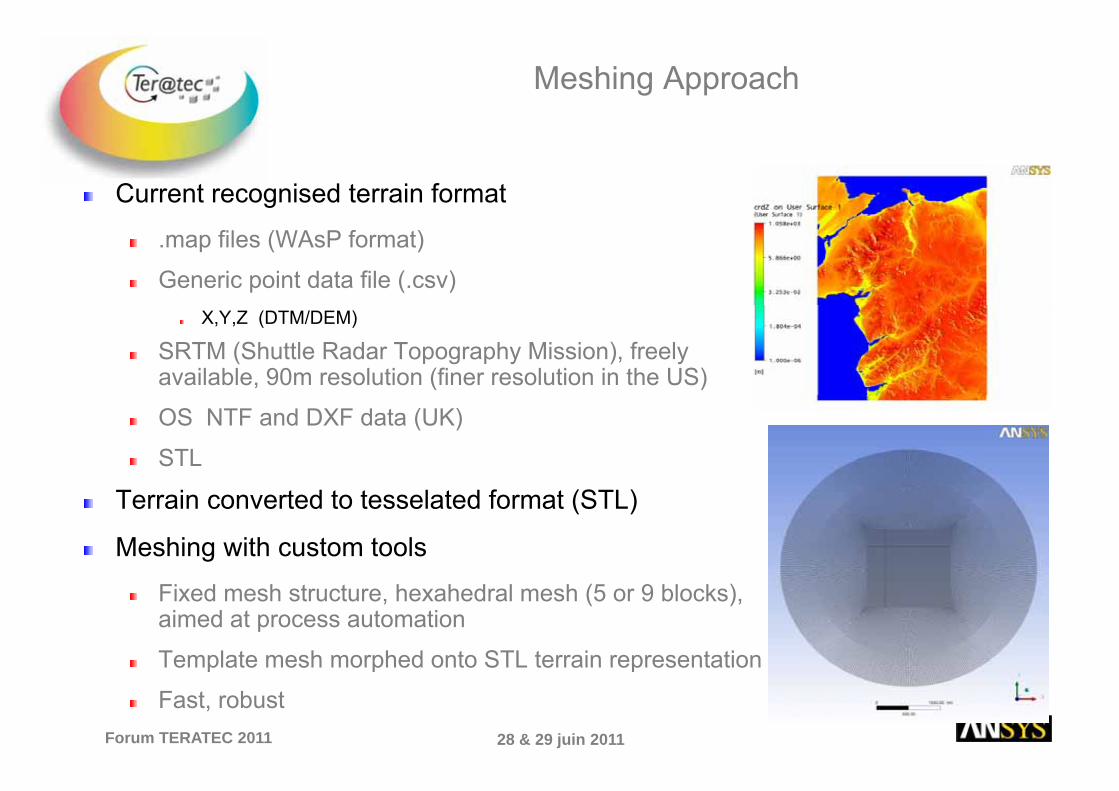
Current recognised terrain format
.map files (WAsP format)
Generic point data file (.csv) X,Y,Z (DTM/DEM)
SRTM (Shuttle Radar Topography Mission), freely available, 90m resolution (finer resolution in the US)
OS NTF and DXF data (UK)
STL
Terrain converted to tesselated format (STL)
Meshing with custom tools
Fixed mesh structure, hexahedral mesh (5 or 9 blocks), aimed at process automation
Template mesh morphed onto STL terrain representation
28 & 29 juin 2011Forum TERATEC 2011
Template mesh morphed onto STL terrain representation
Fast, robust
Meshing: User Input
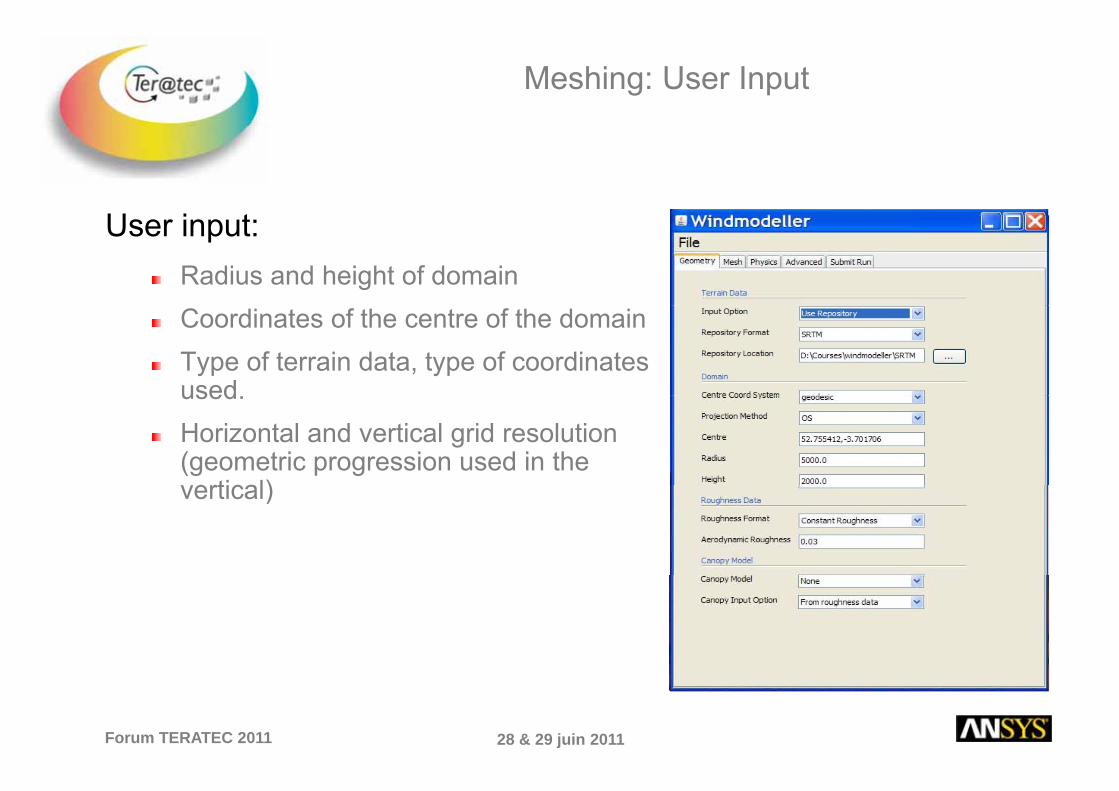
U i tUser input:Radius and height of domainCoordinates of the centre of the domainType of terrain data, type of coordinates usedused.Horizontal and vertical grid resolution (geometric progression used in the vertical)vertical)
28 & 29 juin 2011Forum TERATEC 2011
Setup
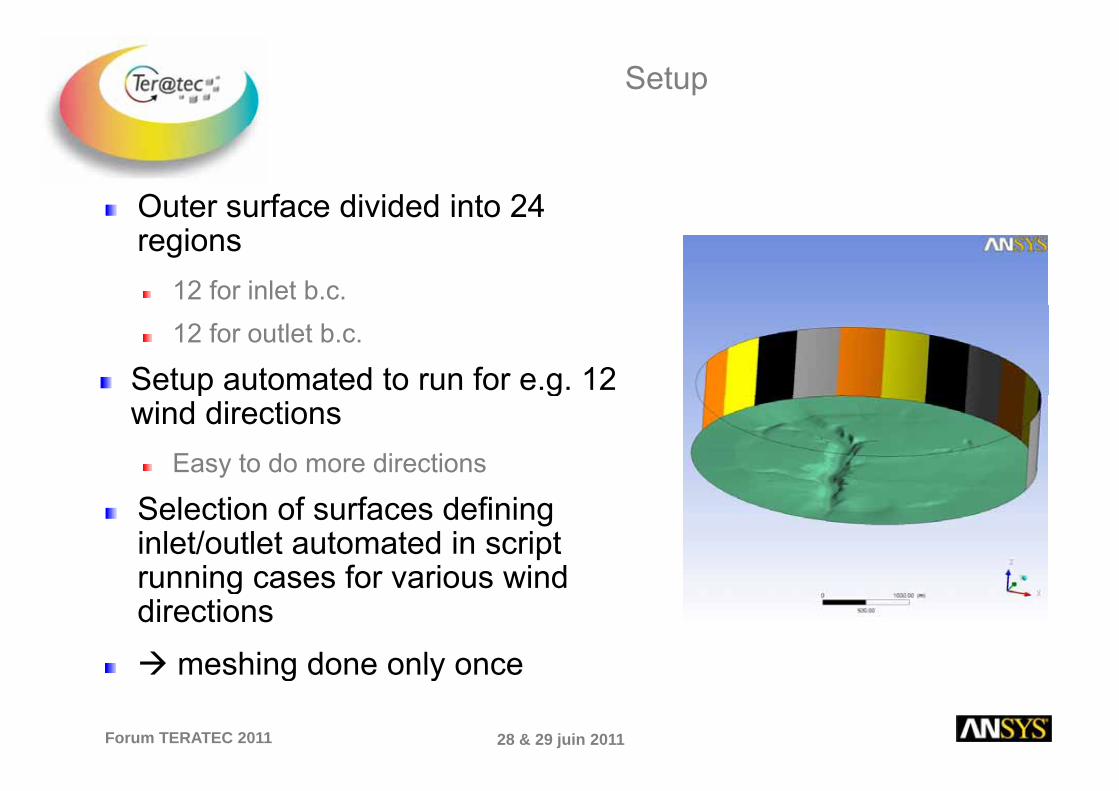
Outer surface divided into 24Outer surface divided into 24 regions
12 for inlet b.c. 12 for outlet b.c.
Setup automated to run for e.g. 12 p gwind directions
Easy to do more directions
Selection of surfaces defining inlet/outlet automated in script running cases for various windrunning cases for various wind directions
meshing done only once
28 & 29 juin 2011Forum TERATEC 2011
meshing done only once
Flow Modelling in WindModeller
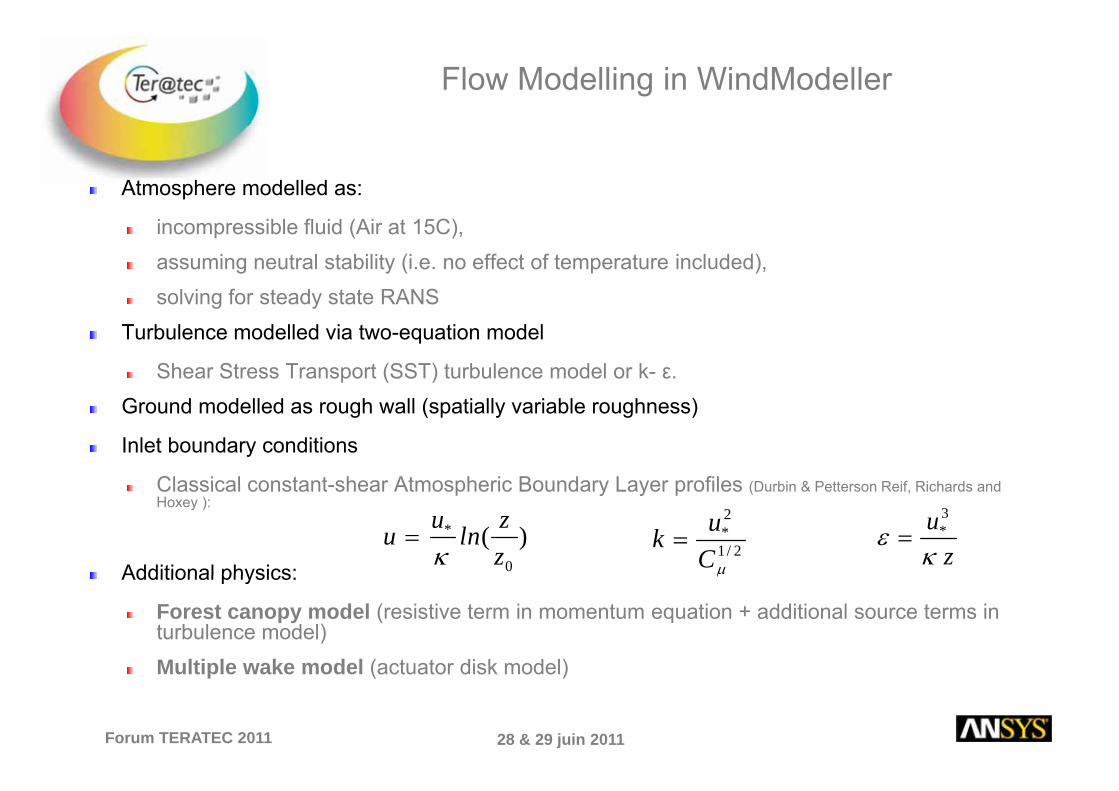
Atmosphere modelled as:
incompressible fluid (Air at 15C), assuming neutral stability (i.e. no effect of temperature included), solving for steady state RANSg y
Turbulence modelled via two-equation model
Shear Stress Transport (SST) turbulence model or k- ε.Ground modelled as rough wall (spatially variable roughness)
Inlet boundary conditions
Classical constant-shear Atmospheric Boundary Layer profiles (Durbin & Petterson Reif Richards andClassical constant-shear Atmospheric Boundary Layer profiles (Durbin & Petterson Reif, Richards and Hoxey ):
Additional physics:2/1
2*
μCuk =u u ln z
z= * ( )κ 0 z
uκ
ε3*=
Additional physics:
Forest canopy model (resistive term in momentum equation + additional source terms in turbulence model)Multiple wake model (actuator disk model)
μ
28 & 29 juin 2011Forum TERATEC 2011
Multiple wake model (actuator disk model)
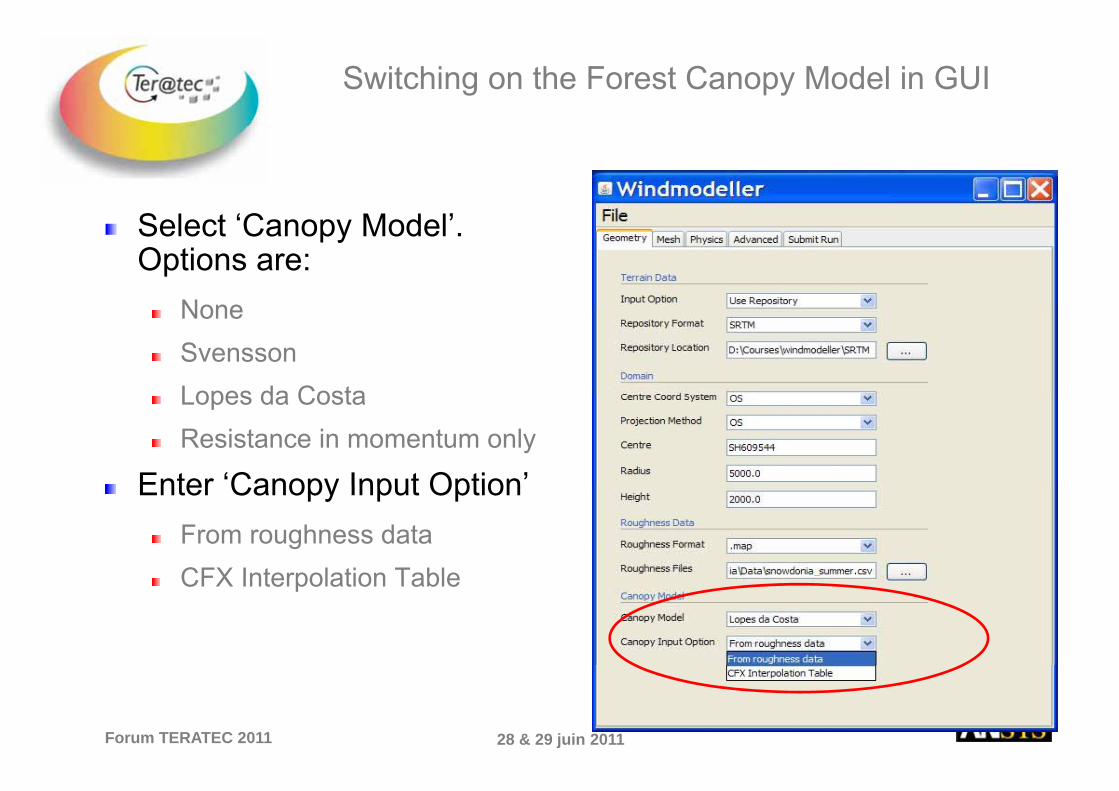
Switching on the Forest Canopy Model in GUI
S l t ‘C M d l’Select ‘Canopy Model’. Options are:
NoneNoneSvenssonLopes da CostaLopes da CostaResistance in momentum only
Enter ‘Canopy Input Option’Enter Canopy Input OptionFrom roughness dataCFX Interpolation TableCFX Interpolation Table
28 & 29 juin 2011Forum TERATEC 2011

Wake Modelling
Hierarchy of Wake Models available in ANSYSHierarchy of Wake Models available in ANSYS CFDResolved blade modelsVirtual Blade ModelsSimple Actuator Disk ModelsSimple Actuator Disk Models
Provide practical model for calculations with many turbinestu b esInput is turbine thrust curve, turbine diameter, turbine hub heightProvides momentum sink in cylindrical volume surrounding each turbineBasis of Models for WindModeller
28 & 29 juin 2011Forum TERATEC 2011
Basis of Models for WindModeller
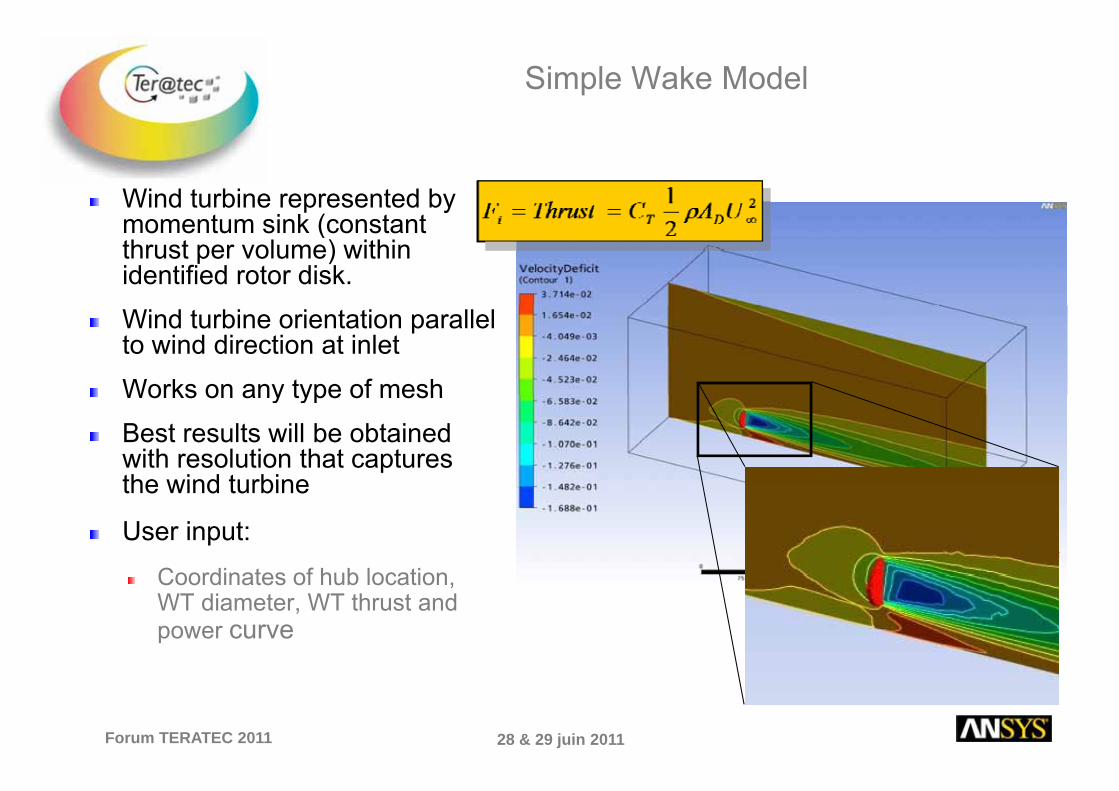
Simple Wake Model
Wind turbine represented by t i k ( t tmomentum sink (constant
thrust per volume) within identified rotor disk.Wind turbine orientation parallel to wind direction at inletWorks on any type of meshWorks on any type of mesh Best results will be obtained with resolution that captures the wind turbinethe wind turbine
User input:
Coordinates of hub locationCoordinates of hub location, WT diameter, WT thrust and power curve
28 & 29 juin 2011Forum TERATEC 2011
Mesh Adaption to Resolve WT rotor
Two ways to resolve wind turbine rotor:Two ways to resolve wind turbine rotor:Resolve rotor in initial mesh
Requires meshing for each wind directionRequires meshing for each wind directionDifficult to keep good quality boundary layer mesh when rotor is present
Resol e rotor ith mesh adaption d ring sol tion stageResolve rotor with mesh adaption during solution stageAdaption criteria based on gradients of additional variable defining the wind turbine locationAdvantage:
only one initial mesh (i.e. no need to provide wind direction dependent mesh)dependent mesh)Easier to preserve boundary layer mesh in most of domain
28 & 29 juin 2011Forum TERATEC 2011
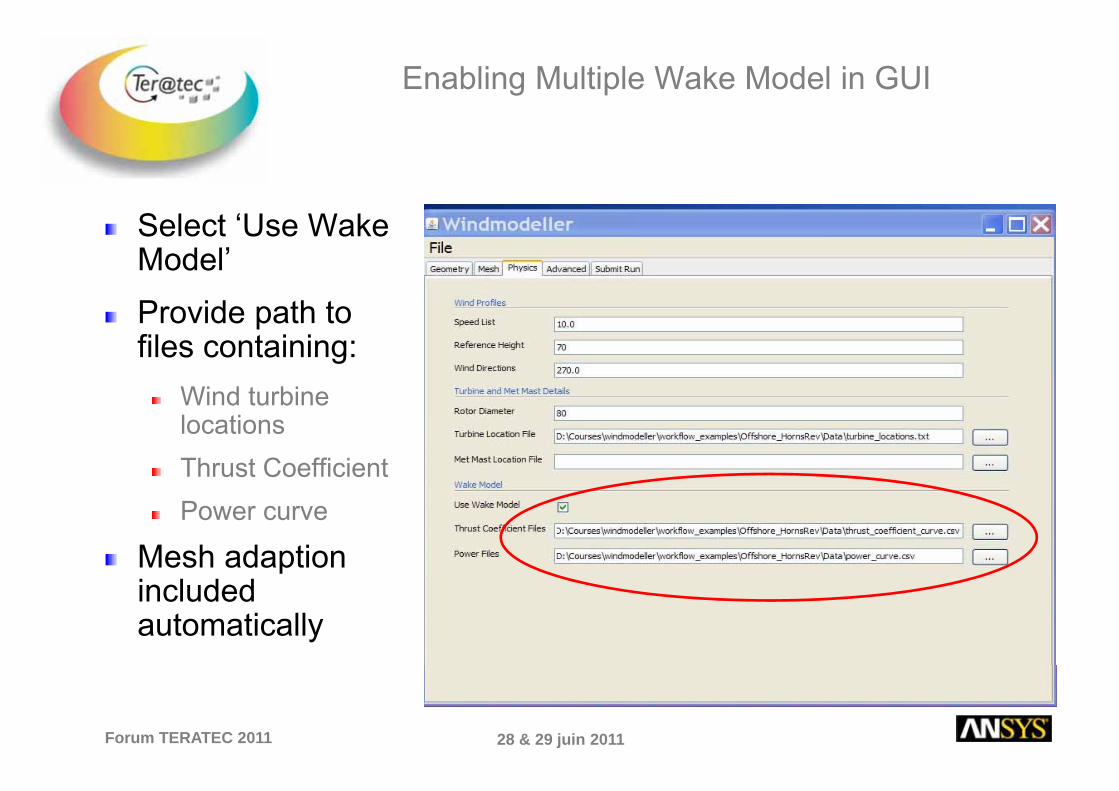
Enabling Multiple Wake Model in GUI
S l t ‘U W kSelect ‘Use Wake Model’P id th tProvide path to files containing:
Wind turbineWind turbine locationsThrust CoefficientPower curve
Mesh adaption included automatically
28 & 29 juin 2011Forum TERATEC 2011
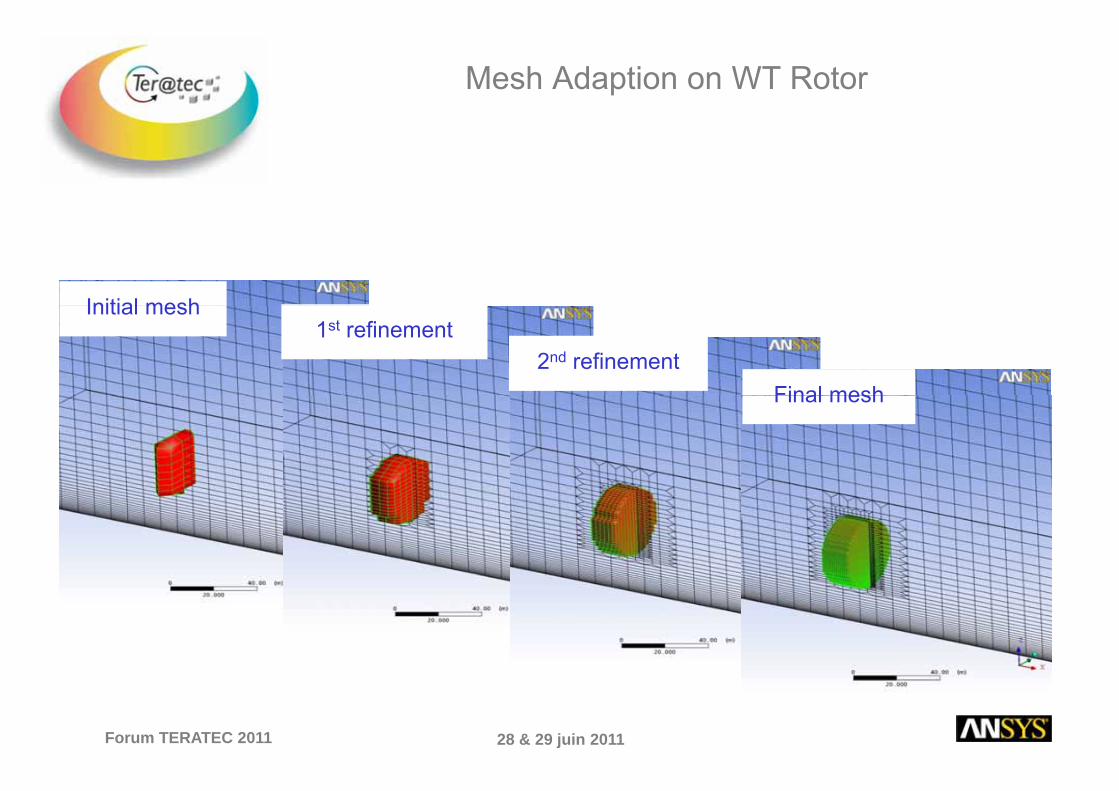
Mesh Adaption on WT Rotor
Initial meshInitial mesh1st refinement
2nd refinementFinal meshFinal mesh
28 & 29 juin 2011Forum TERATEC 2011
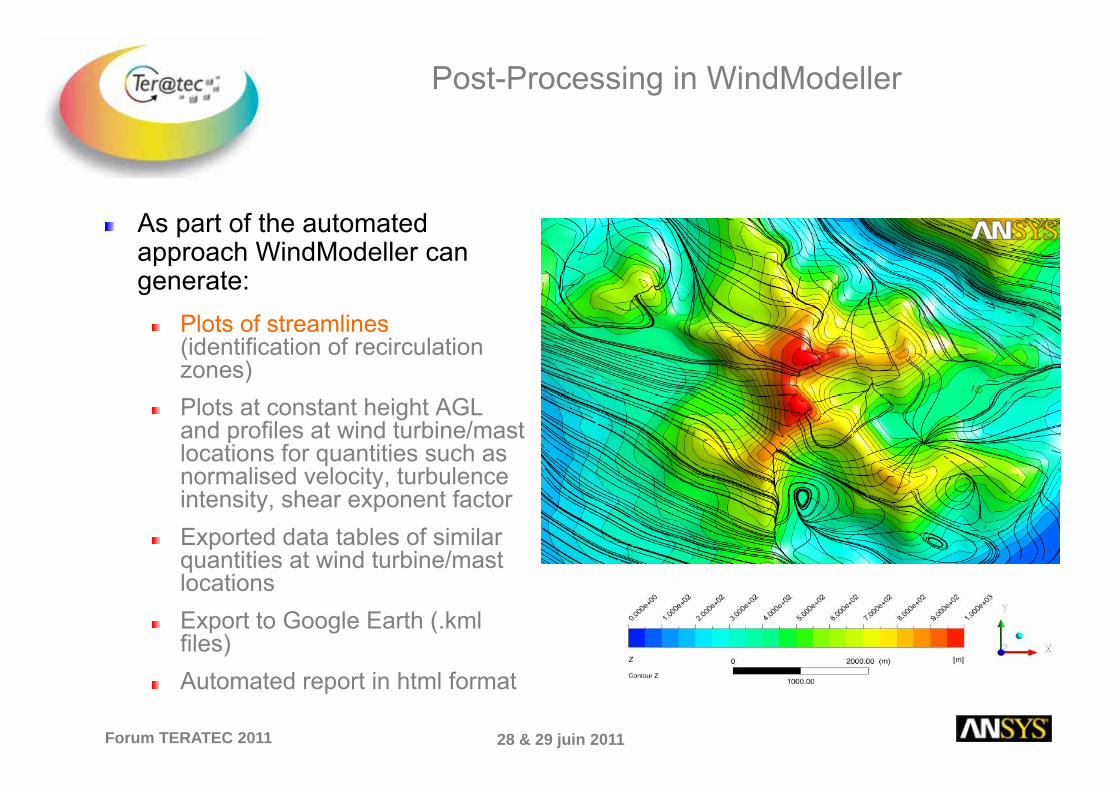
Post-Processing in WindModeller
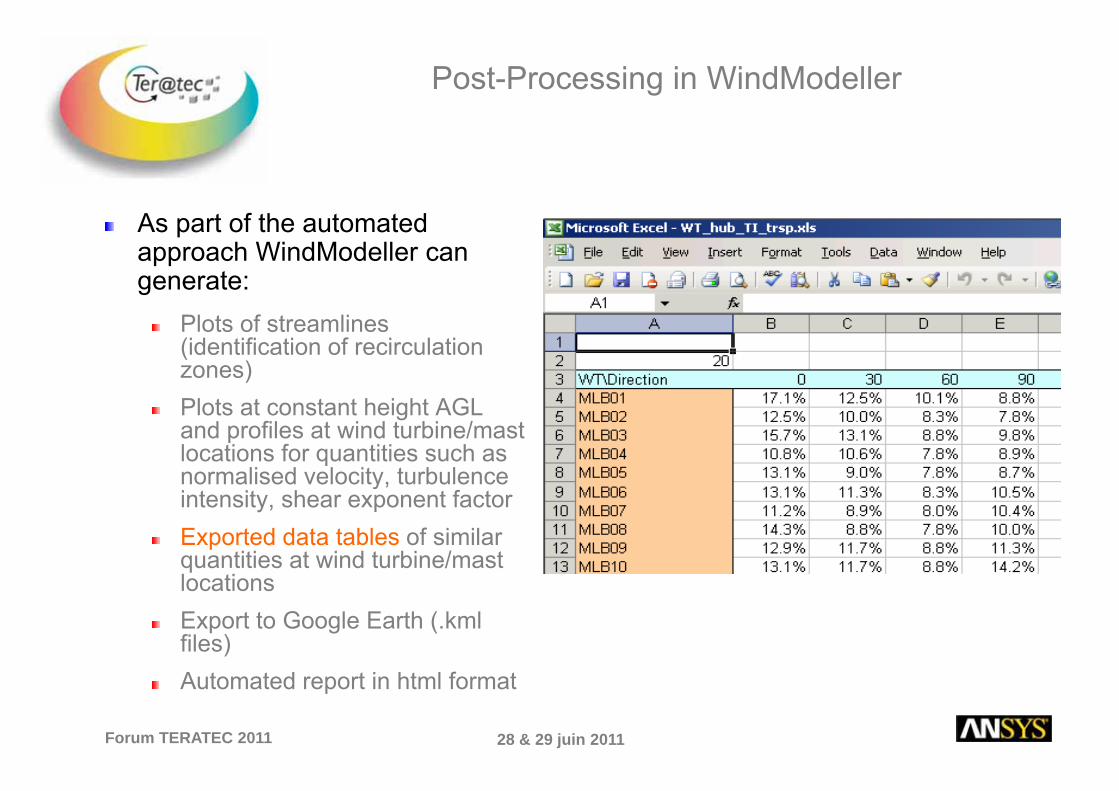
A t f th t t dAs part of the automated approach WindModeller can generate:
Plots of streamlines(identification of recirculation zones)Plots at constant height AGL and profiles at wind turbine/mast locations for quantities such as normalised velocity, turbulence y,intensity, shear exponent factorExported data tables of similar quantities at wind turbine/mast l tilocationsExport to Google Earth (.kml files)
28 & 29 juin 2011Forum TERATEC 2011
Automated report in html format

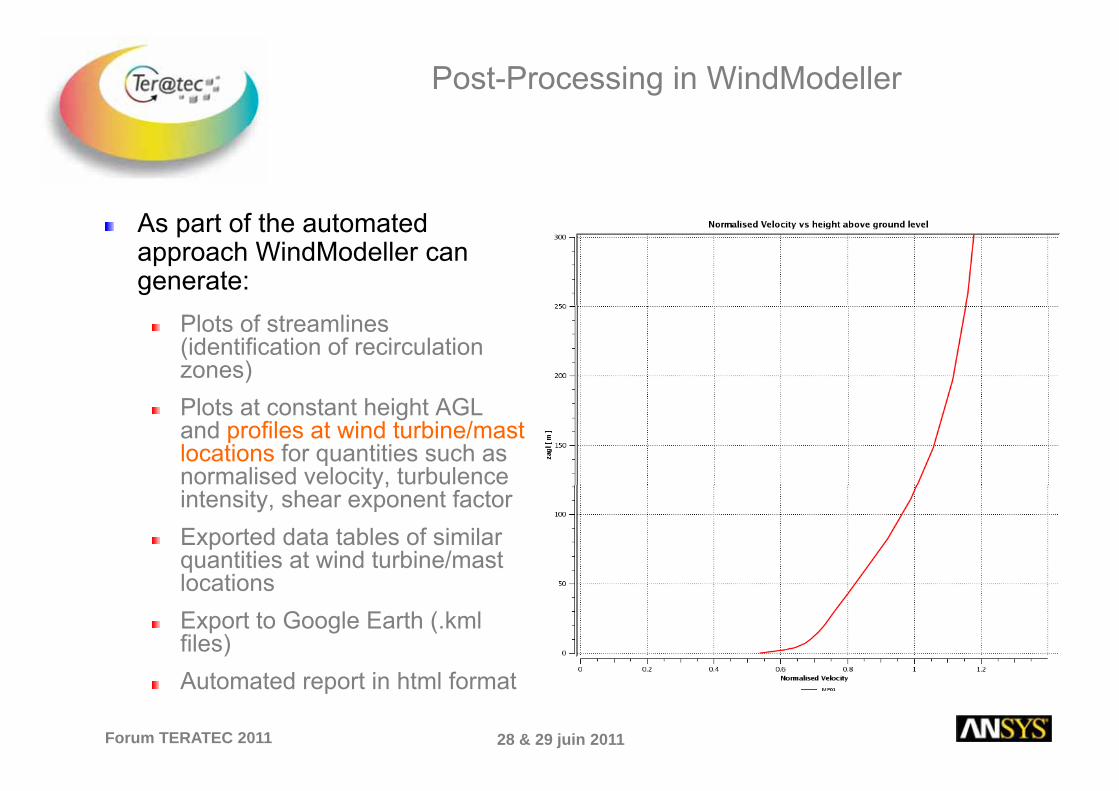
Post-Processing in WindModeller
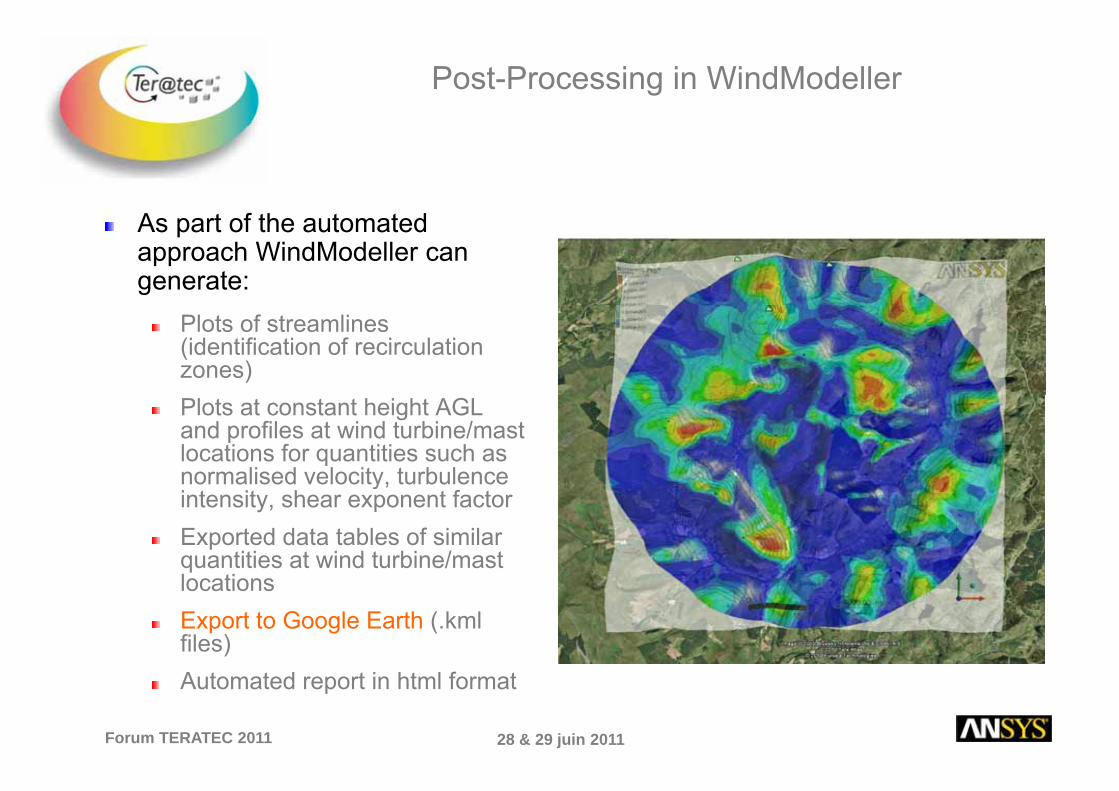
A t f th t t dAs part of the automated approach WindModeller can generate:
Plots of streamlines (identification of recirculation zones)Plots at constant height AGLand profiles at wind turbine/mast locations for quantities such as normalised velocity, turbulence y,intensity, shear exponent factorExported data tables of similar quantities at wind turbine/mast l tilocationsExport to Google Earth (.kml files)
28 & 29 juin 2011Forum TERATEC 2011
Automated report in html format
Post-Processing in WindModeller
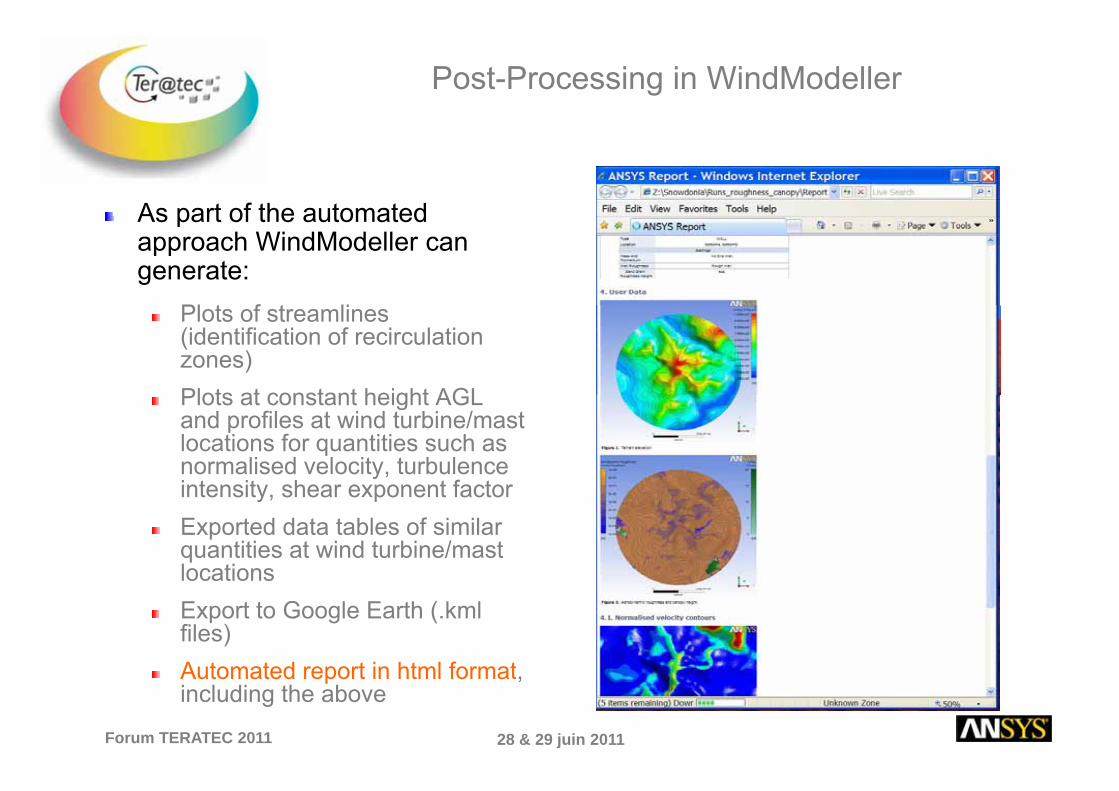
A t f th t t dAs part of the automated approach WindModeller can generate:
Plots of streamlines (identification of recirculation zones)Plots at constant height AGL and profiles at wind turbine/mast locations for quantities such as normalised velocity, turbulence y,intensity, shear exponent factorExported data tables of similar quantities at wind turbine/mast l tilocationsExport to Google Earth (.kml files)
28 & 29 juin 2011Forum TERATEC 2011
Automated report in html format
Post-Processing in WindModeller
As part of the automatedAs part of the automated approach WindModeller can generate:
Pl t f t liPlots of streamlines (identification of recirculation zones)Plots at constant height AGLPlots at constant height AGL and profiles at wind turbine/mast locations for quantities such as normalised velocity, turbulence intensity shear exponent factorintensity, shear exponent factorExported data tables of similar quantities at wind turbine/mast locationslocationsExport to Google Earth (.kml files)A t t d t i ht l f t
28 & 29 juin 2011Forum TERATEC 2011
Automated report in html format, including the above
Energy Assessment
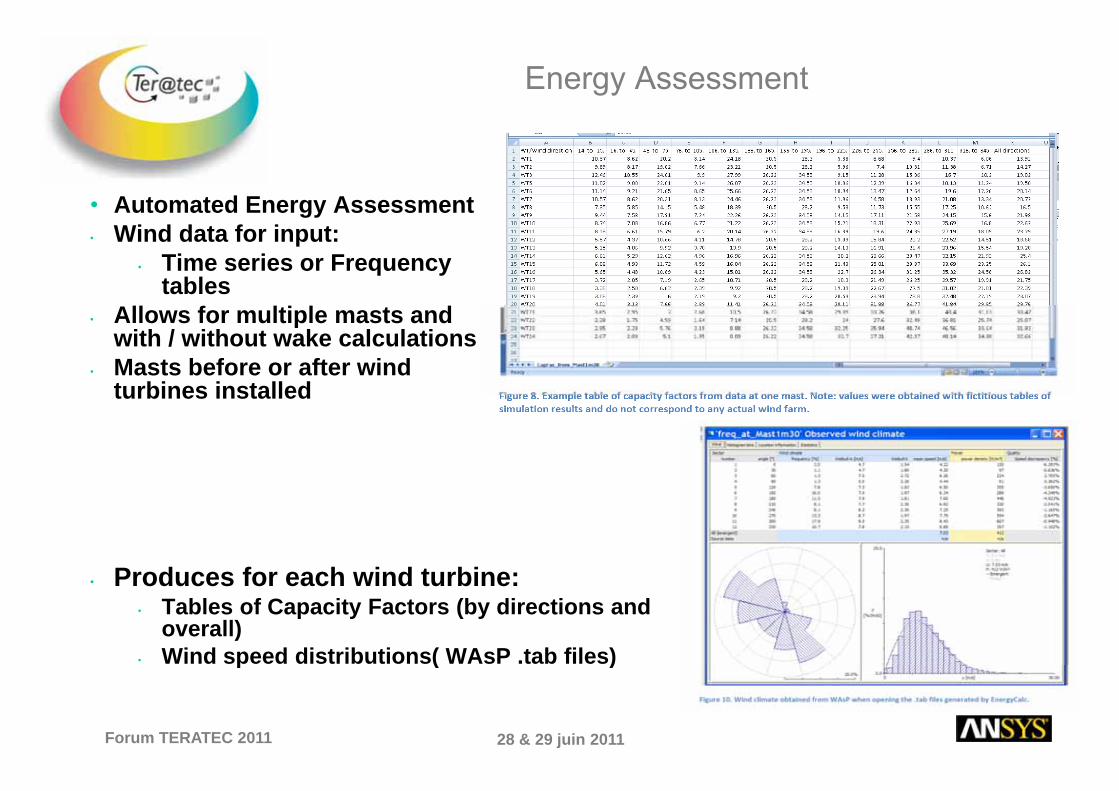
• Automated Energy Assessmentgy• Wind data for input:
• Time series or Frequency tables
f• Allows for multiple masts and with / without wake calculations
• Masts before or after wind turbines installedturbines installed
Produces for each wind turbine:• Produces for each wind turbine:• Tables of Capacity Factors (by directions and
overall)• Wind speed distributions( WAsP .tab files)
28 & 29 juin 2011Forum TERATEC 2011
p ( )
Validation and Case Studies
Many examples available, ANSYS and Customers.y p ,Single Turbine wake, offshore (Vindeby, Nibe)Blacklaw Wind Farm ScotlandBlacklaw Wind Farm, Scotland,
Wakes, forestry, power assessmentBolund Hill, Denmark
Complex terrainNant-y-Moch,
Complex terrain, forestryComplex terrain, forestryBest practice / sensitivity studies
Large Offshore –> Horns Rev + others
28 & 29 juin 2011Forum TERATEC 2011
Large Offshore –> Horns Rev + others
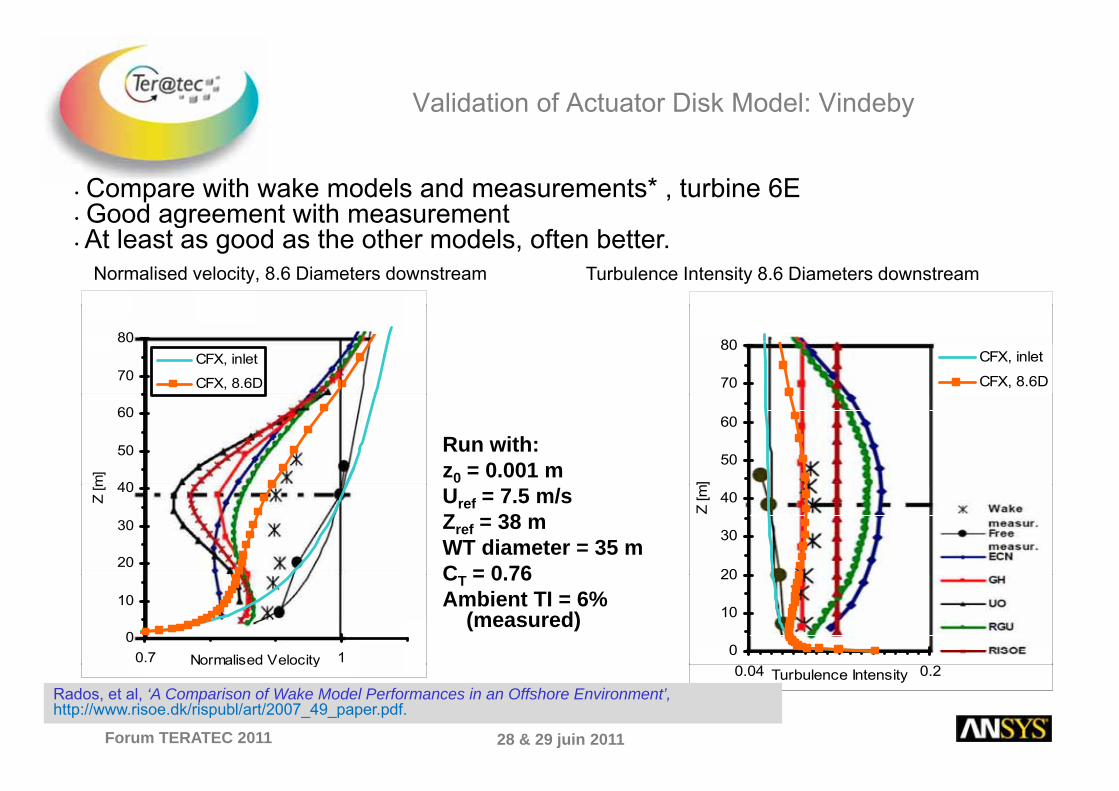
Validation of Actuator Disk Model: Vindeby
• Compare with wake models and measurements* , turbine 6EGood agreement with measurement
Normalised velocity, 8.6 Diameters downstream Turbulence Intensity 8.6 Diameters downstream
• Good agreement with measurement• At least as good as the other models, often better.
70
80CFX, inlet
CFX, 8.6D 70
80CFX, inlet
CFX, 8.6D
40
50
60
m]
50
60
m]
Run with:z0 = 0.001 m
20
30
40
Z [m
20
30
40
Z [mUref = 7.5 m/s
Zref = 38 mWT diameter = 35 mC = 0 76
0
10
0.7 1Normalised Velocity0
10
20CT = 0.76Ambient TI = 6%
(measured)
28 & 29 juin 2011Forum TERATEC 2011
y0.04 0.2Turbulence Intensity
Rados, et al, ‘A Comparison of Wake Model Performances in an Offshore Environment’, http://www.risoe.dk/rispubl/art/2007_49_paper.pdf.
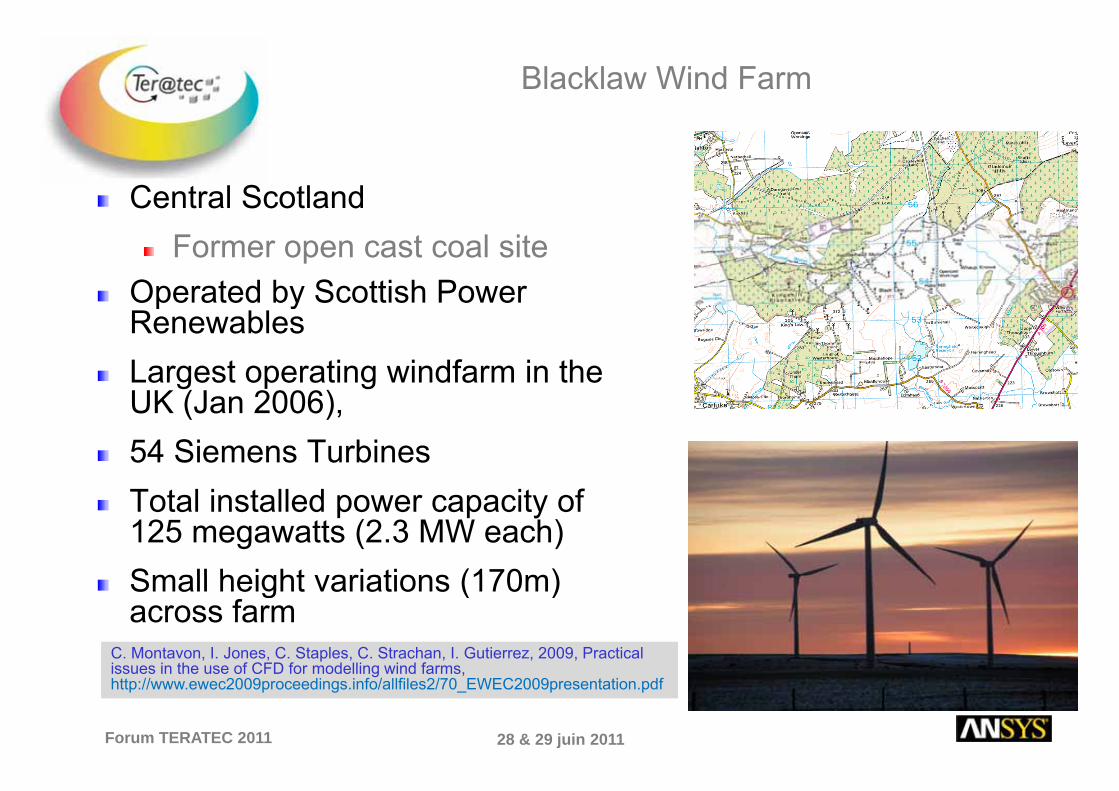
Blacklaw Wind Farm
Central ScotlandFormer open cast coal site
Operated by Scottish Power p yRenewablesLargest operating windfarm in the UK (J 2006)UK (Jan 2006), 54 Siemens Turbines Map Image: Ordnance Survey © Crown Copyright 2008, License number 100048580
Total installed power capacity of 125 megawatts (2.3 MW each)Small height variations (170m)Small height variations (170m) across farm
C. Montavon, I. Jones, C. Staples, C. Strachan, I. Gutierrez, 2009, Practical i i th f CFD f d lli i d f
28 & 29 juin 2011Forum TERATEC 2011
issues in the use of CFD for modelling wind farms, http://www.ewec2009proceedings.info/allfiles2/70_EWEC2009presentation.pdf
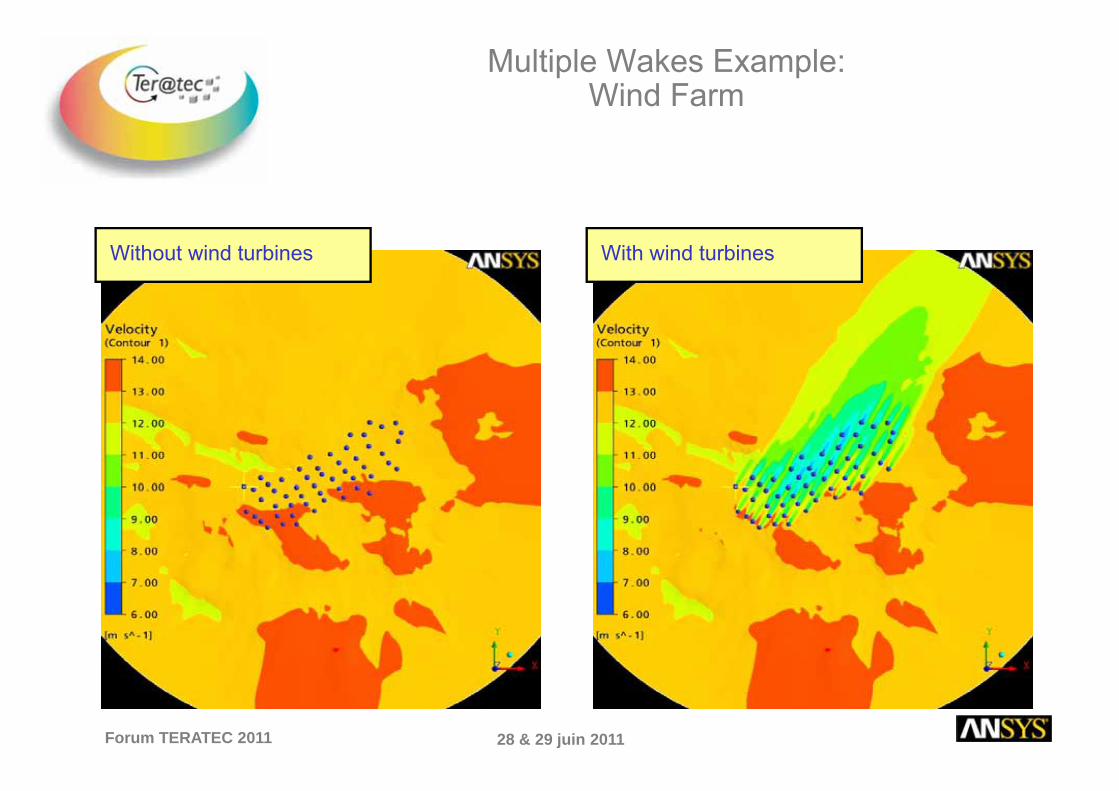
Multiple Wakes Example:Wind Farm
Wind speed at hub height, wind direction 210
Without wind turbines With wind turbines
28 & 29 juin 2011Forum TERATEC 2011
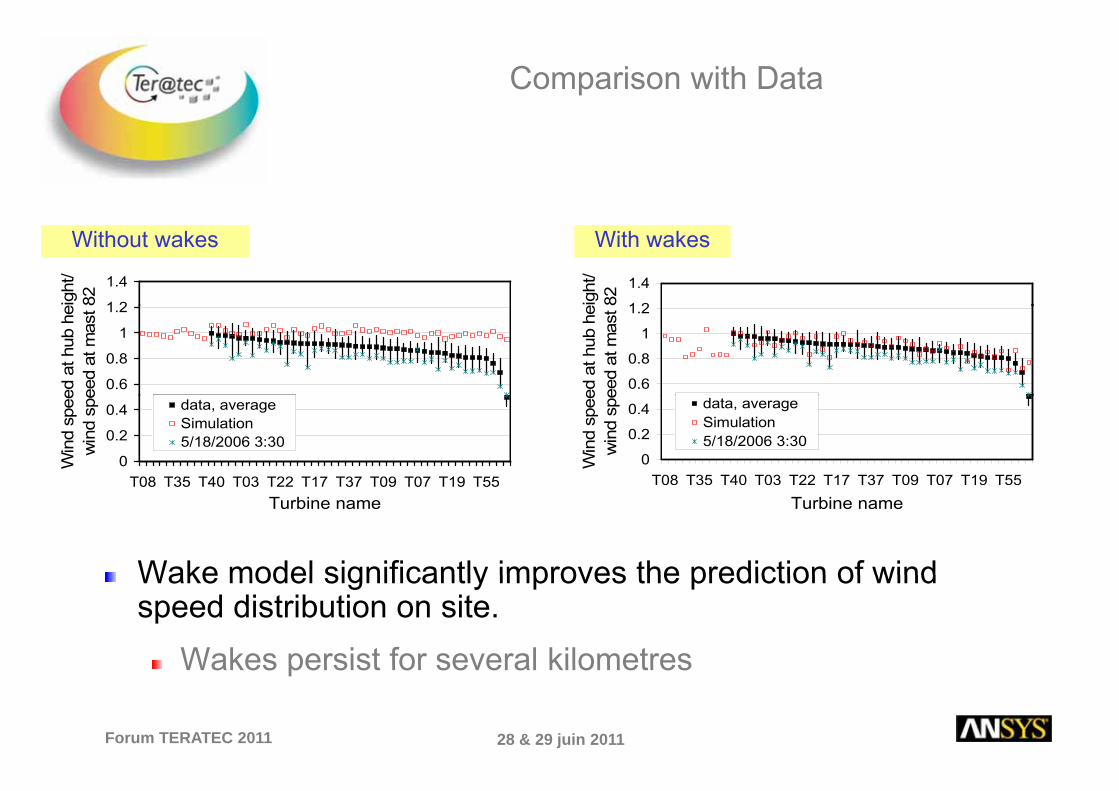
Comparison with Data
1 2
1.4
eigh
t/82
1 2
1.4
eigh
t/82
Without wakesWithout wakes
1 2
1.4
eigh
t/82 1 2
1.4
eigh
t/82
With wakesWith wakes
0.6
0.8
1
1.2
ed a
t hub
he
eed
at m
ast
0.6
0.8
1
1.2
ed a
t hub
he
eed
at m
ast
0.6
0.8
1
1.2
ed a
t hub
he
eed
at m
ast
0.6
0.8
1
1.2
ed a
t hub
he
eed
at m
ast
0
0.2
0.4
T08 T35 T40 T03 T22 T17 T37 T09 T07 T19 T55
Win
d sp
eew
ind
spe
data, averageSimulation5/18/2006 3:30
0
0.2
0.4
T08 T35 T40 T03 T22 T17 T37 T09 T07 T19 T55
Win
d sp
eew
ind
spe
data, averageSimulation5/18/2006 3:30
0
0.2
0.4
T08 T35 T40 T03 T22 T17 T37 T09 T07 T19 T55
Win
d sp
eew
ind
spe
data, averageSimulation5/18/2006 3:30
0
0.2
0.4
T08 T35 T40 T03 T22 T17 T37 T09 T07 T19 T55
Win
d sp
eew
ind
spe
data, averageSimulation5/18/2006 3:30
Wake model significantly improves the prediction of wind
T08 T35 T40 T03 T22 T17 T37 T09 T07 T19 T55Turbine name
T08 T35 T40 T03 T22 T17 T37 T09 T07 T19 T55Turbine name Turbine nameTurbine name
Wake model significantly improves the prediction of wind speed distribution on site.
Wakes persist for several kilometres
28 & 29 juin 2011Forum TERATEC 2011
Wakes persist for several kilometres

Effect of Forestry, Normalised Velocity
With wakes With k d f tWith wakes With wakes and forest canopy
28 & 29 juin 2011Forum TERATEC 2011
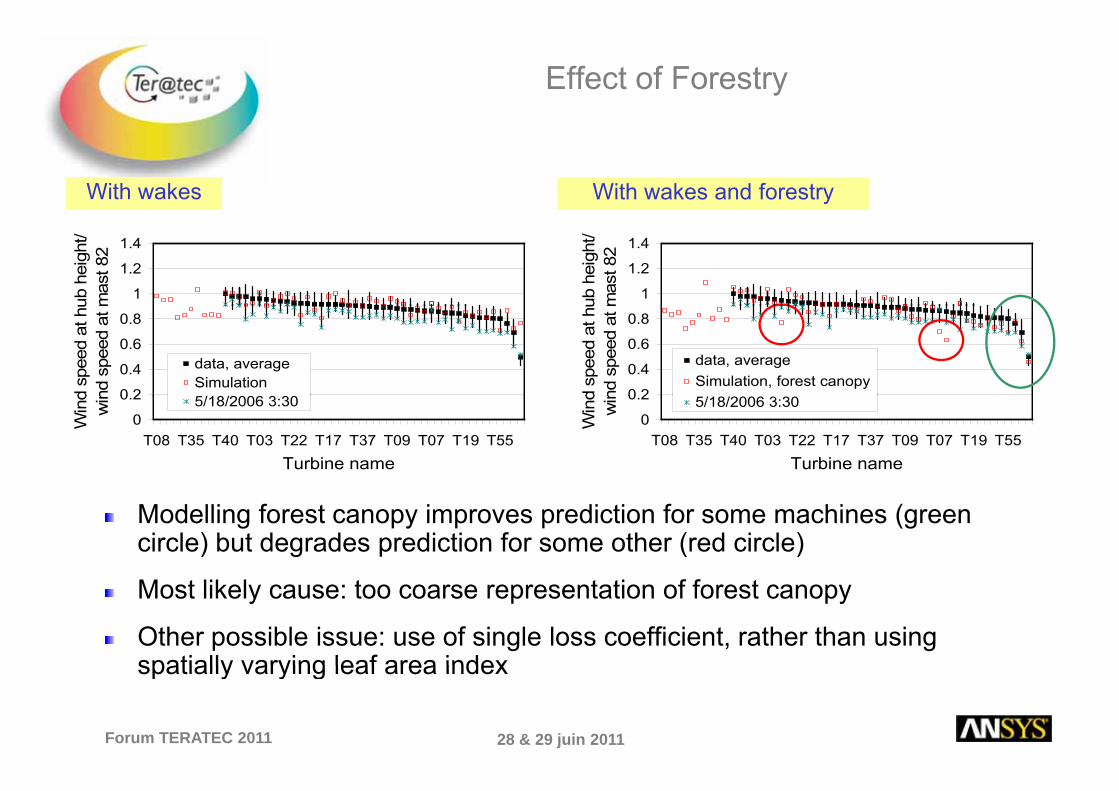
Effect of Forestry
With wakesWith wakes With wakes and forestryWith wakes and forestry
1
1.2
1.4
ub h
eigh
t/m
ast 8
2
1
1.2
1.4
ub h
eigh
t/m
ast 8
2
1
1.2
1.4
ub h
eigh
t/m
ast 8
2
1
1.2
1.4
ub h
eigh
t/m
ast 8
2
0 2
0.4
0.6
0.8
d sp
eed
at h
und
spe
ed a
t m
data, averageSimulation
0 2
0.4
0.6
0.8
d sp
eed
at h
und
spe
ed a
t m
data, averageSimulation
0 2
0.4
0.6
0.8
d sp
eed
at h
und
spe
ed a
t m
data, averageSimulation, forest canopy
0 2
0.4
0.6
0.8
d sp
eed
at h
und
spe
ed a
t m
data, averageSimulation, forest canopy
0
0.2
T08 T35 T40 T03 T22 T17 T37 T09 T07 T19 T55Turbine name
Win
dw
in 5/18/2006 3:300
0.2
T08 T35 T40 T03 T22 T17 T37 T09 T07 T19 T55Turbine name
Win
dw
in 5/18/2006 3:300
0.2
T08 T35 T40 T03 T22 T17 T37 T09 T07 T19 T55
Turbine name
Win
dw
in 5/18/2006 3:300
0.2
T08 T35 T40 T03 T22 T17 T37 T09 T07 T19 T55
Turbine name
Win
dw
in 5/18/2006 3:30
Modelling forest canopy improves prediction for some machines (green circle) but degrades prediction for some other (red circle)
Most likely cause: too coarse representation of forest canopy
Other possible issue: use of single loss coefficient, rather than using spatially varying leaf area index
28 & 29 juin 2011Forum TERATEC 2011
spatially varying leaf area index
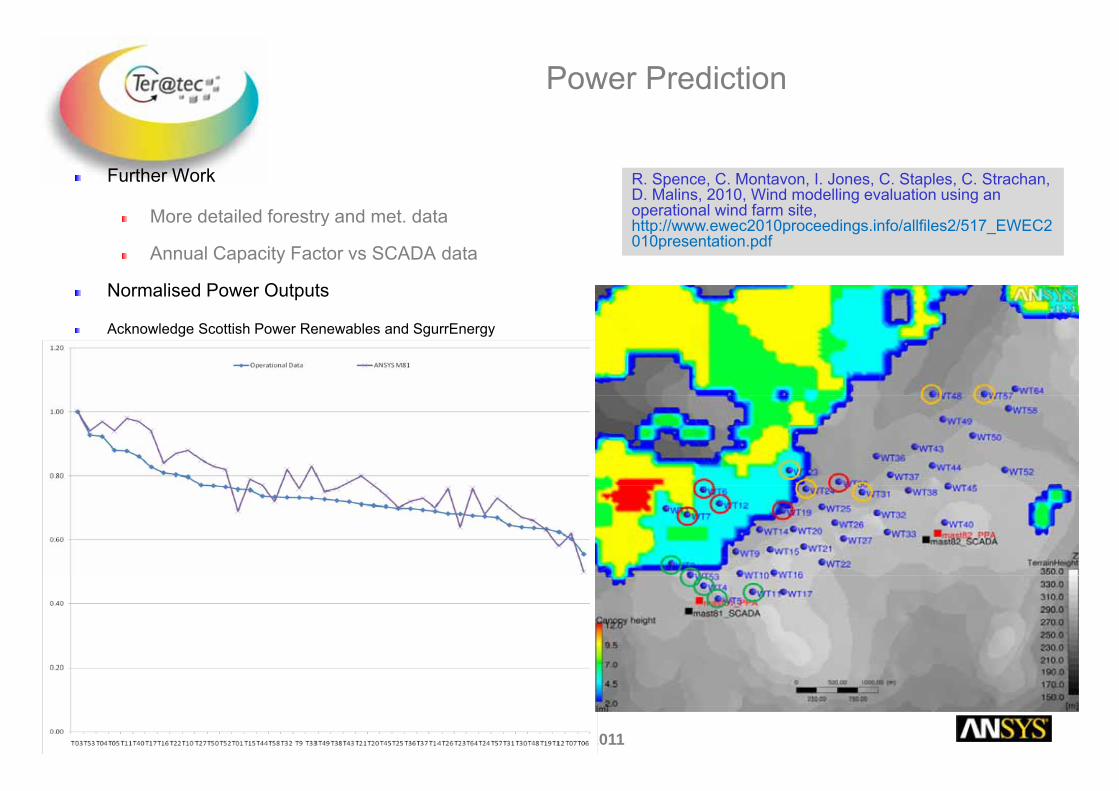
Power Prediction
Further Work
More detailed forestry and met data
R. Spence, C. Montavon, I. Jones, C. Staples, C. Strachan, D. Malins, 2010, Wind modelling evaluation using an operational wind farm site, More detailed forestry and met. data
Annual Capacity Factor vs SCADA data
Normalised Power Outputs
p ,http://www.ewec2010proceedings.info/allfiles2/517_EWEC2010presentation.pdf
Acknowledge Scottish Power Renewables and SgurrEnergy
28 & 29 juin 2011Forum TERATEC 2011
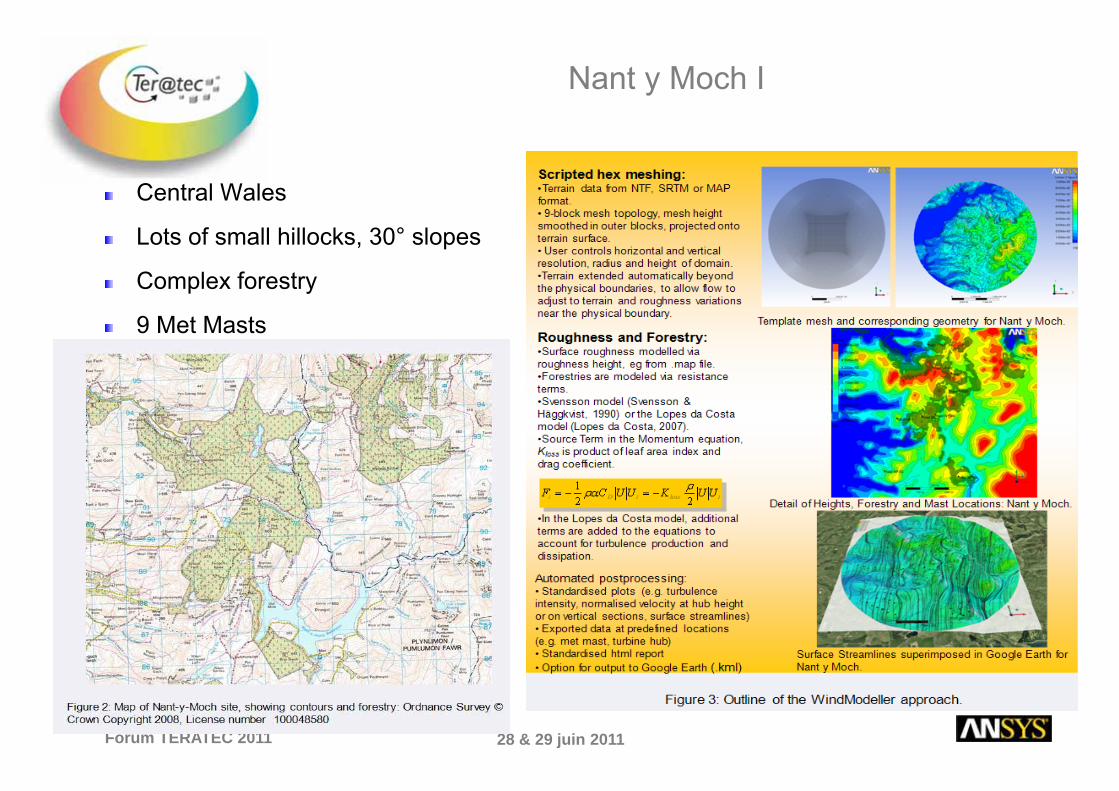
Nant y Moch I
Central Wales
Lots of small hillocks, 30° slopes
Complex forestry
9 Met Masts
28 & 29 juin 2011Forum TERATEC 2011
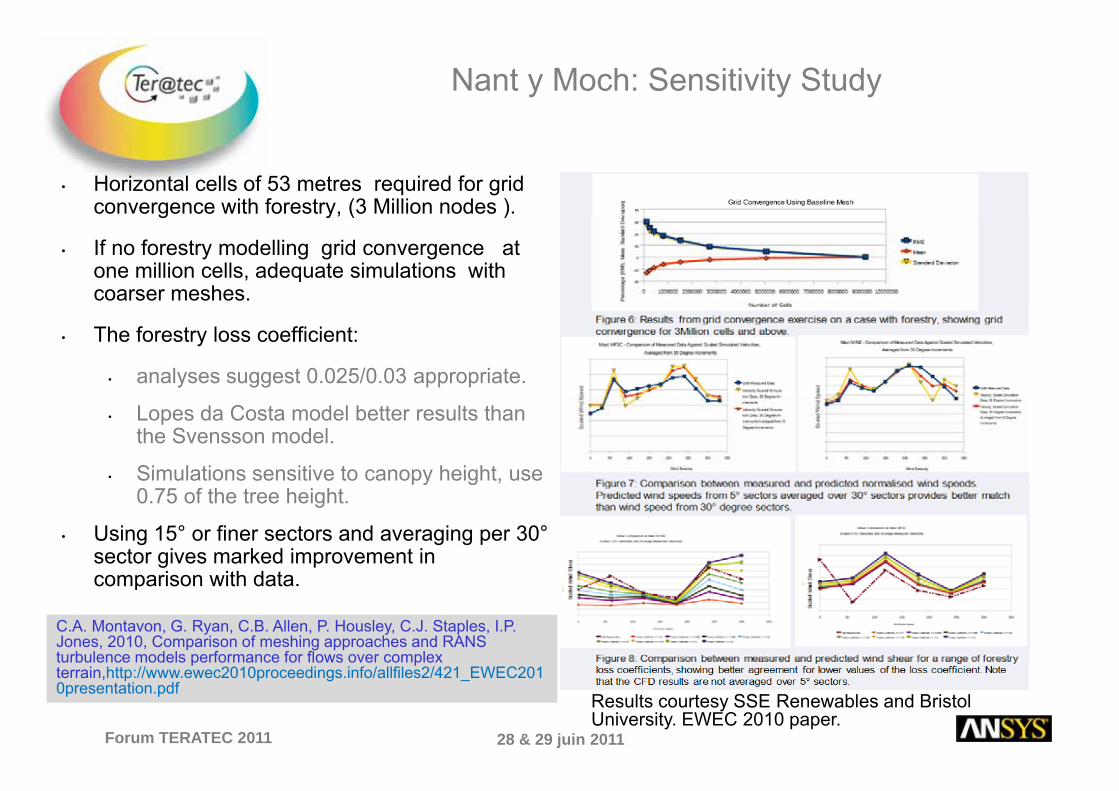
Nant y Moch: Sensitivity Study
• Horizontal cells of 53 metres required for grid convergence with forestry, (3 Million nodes ).g y, ( )
• If no forestry modelling grid convergence at one million cells, adequate simulations with coarser meshes.
• The forestry loss coefficient:
• analyses suggest 0.025/0.03 appropriate.
• Lopes da Costa model better results than the Svensson model.
• Simulations sensitive to canopy height, use 0.75 of the tree height.
• Using 15° or finer sectors and averaging per 30°sector gives marked improvement in comparison with datacomparison with data.
C.A. Montavon, G. Ryan, C.B. Allen, P. Housley, C.J. Staples, I.P. Jones, 2010, Comparison of meshing approaches and RANS turbulence models performance for flows over complex
28 & 29 juin 2011Forum TERATEC 2011
Results courtesy SSE Renewables and Bristol University. EWEC 2010 paper.
p pterrain,http://www.ewec2010proceedings.info/allfiles2/421_EWEC2010presentation.pdf
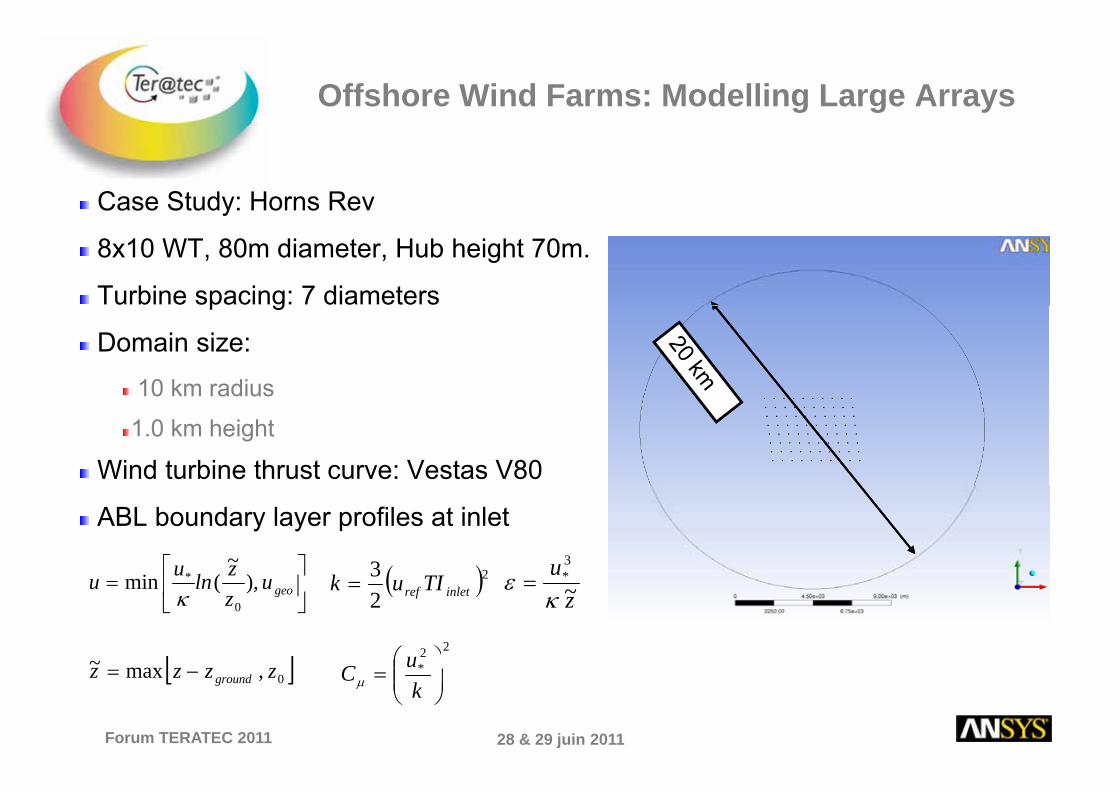
Offshore Wind Farms: Modelling Large Arrays
Case Study: Horns Rev
8x10 WT, 80m diameter, Hub height 70m.
Turbine spacing: 7 diametersp g
Domain size:
10 km radius10 km radius
1.0 km height
Wind turbine thrust curve: Vestas V80
ABL boundary layer profiles at inlet
⎥⎤
⎢⎡ zlu )
~(i * u 3
*( )23k⎥⎦
⎤⎢⎣
⎡= geou
zzlnuu ),(min0
*
κ z~*
κε =
[ ]~
( )223
inletref TIuk =
22* ⎟⎞
⎜⎛ u C A Montavon et al, Offshore Wind Accelerator: Wake
M d lli U i CFD EWEA C f 2011
28 & 29 juin 2011Forum TERATEC 2011
[ ]0,max~ zzzz ground−= *⎟⎟⎠
⎞⎜⎜⎝
⎛=
kuCμ
Modelling Using CFD, EWEA Conference 2011
Acknowledgement: Carbon Trust’s Offshore Wind Accelerator Project.

Mesh characteristics
Hexahedral mesh
Non-uniform in horizontal and vertical planes
Background mesh before adaption ~690 k nodesg p
28 & 29 juin 2011Forum TERATEC 2011
Mesh viewed from above Mesh viewed from upstream
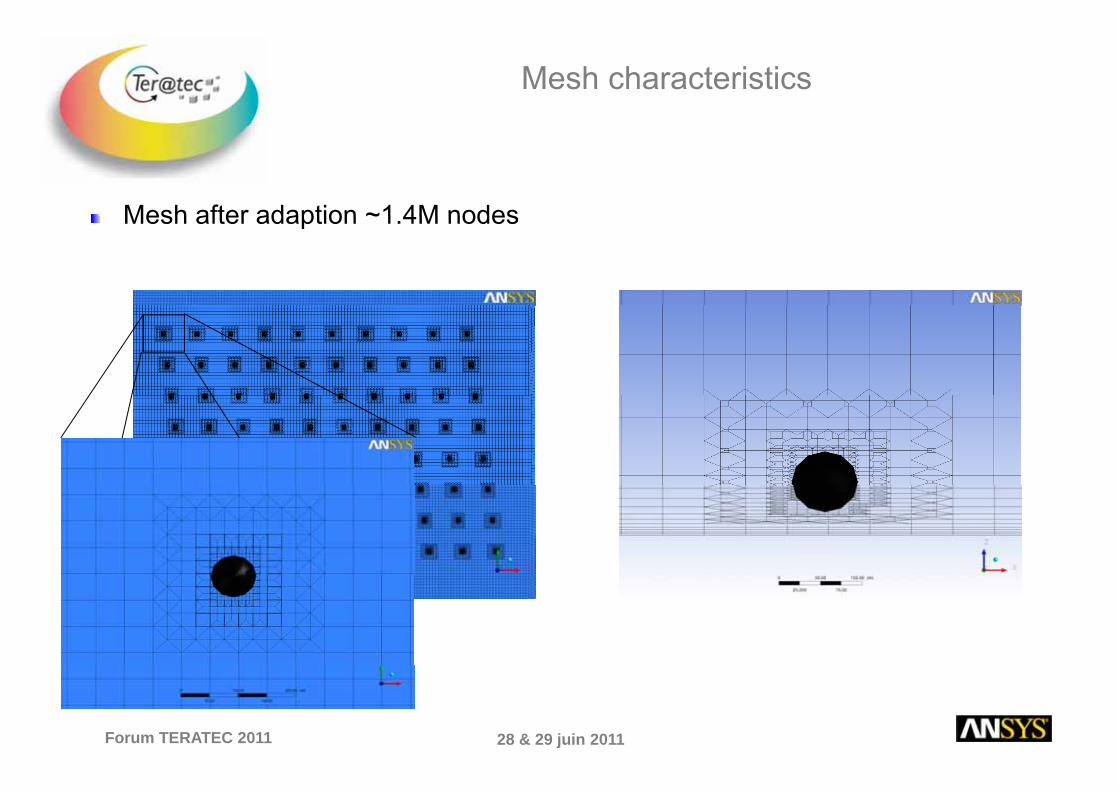
Mesh characteristics
Mesh after adaption ~1 4M nodesMesh after adaption ~1.4M nodes
28 & 29 juin 2011Forum TERATEC 2011

Typical convergence/resource requirements
• Based on Horns Rev • 1.4 M Nodes in final mesh• 42 mins / run, start to finish,
including I/O, partitioning and adaptionadaption.
• 16 Cores, Intel Xeon X5355 2.66GHz(2 dual processor quad core systems, 16 M Bytes / system)y , y y )
• Typically 60 iterations on final adaption step for convergence, 110 in total.Ver tight con ergence criterion rms• Very tight convergence criterion, rmsresiduals < 1E-6. (1E-5 would reduce iterations to 47)
• Total time less than 12 hrs start to finish for 15 simulations
28 & 29 juin 2011Forum TERATEC 2011

Speed-up with multiple cores
Speed-up good, but not optimal:
Mesh adaption requires more filerequires more file saving, thus hampering the speed-up
28 & 29 juin 2011Forum TERATEC 2011 44
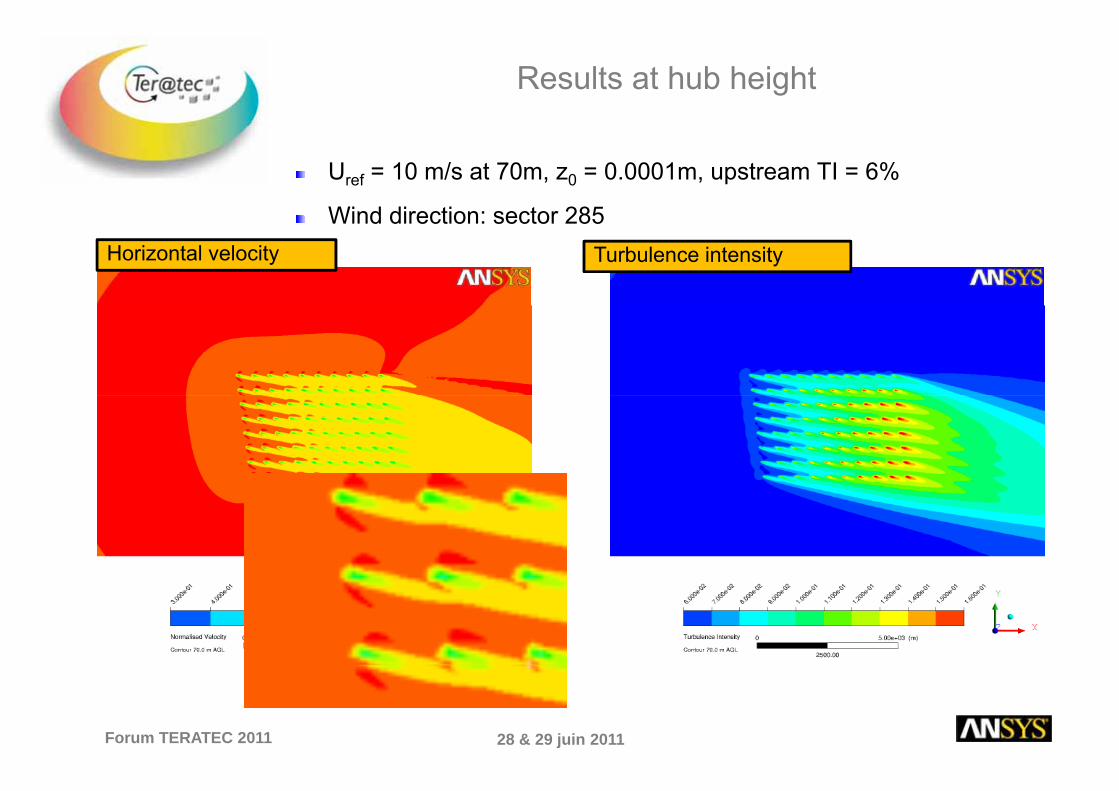
Results at hub height
Uref = 10 m/s at 70m, z0 = 0.0001m, upstream TI = 6%
Wind direction: sector 285Wind direction: sector 285Horizontal velocity Turbulence intensity
28 & 29 juin 2011Forum TERATEC 2011
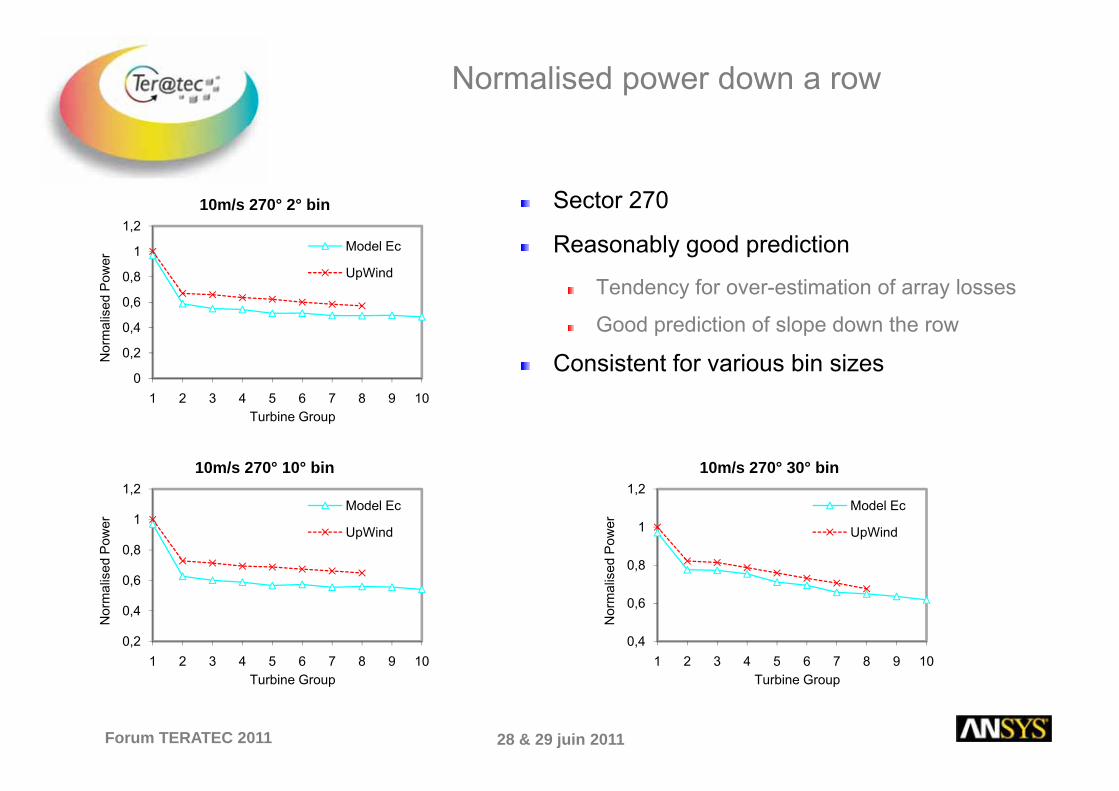
Normalised power down a row
10m/s 270° 2° bin Sector 270
0,6
0,8
1
1,2
ed P
ower
Model Ec
UpWind
Reasonably good prediction
Tendency for over-estimation of array losses
0
0,2
0,4
0,6
1 2 3 4 5 6 7 8 9 10
Nor
mal
ise
Good prediction of slope down the row
Consistent for various bin sizes1 2 3 4 5 6 7 8 9 10
Turbine Group
1 210m/s 270° 10° bin
1 210m/s 270° 30° bin
0,8
1
1,2
sed
Pow
er
Model Ec
UpWind
0,8
1
1,2
sed
Pow
er
Model Ec
UpWind
0,2
0,4
0,6
1 2 3 4 5 6 7 8 9 10
Nor
mal
is
0,4
0,6
1 2 3 4 5 6 7 8 9 10
Nor
mal
is
28 & 29 juin 2011Forum TERATEC 2011
1 2 3 4 5 6 7 8 9 10Turbine Group
1 2 3 4 5 6 7 8 9 10Turbine Group
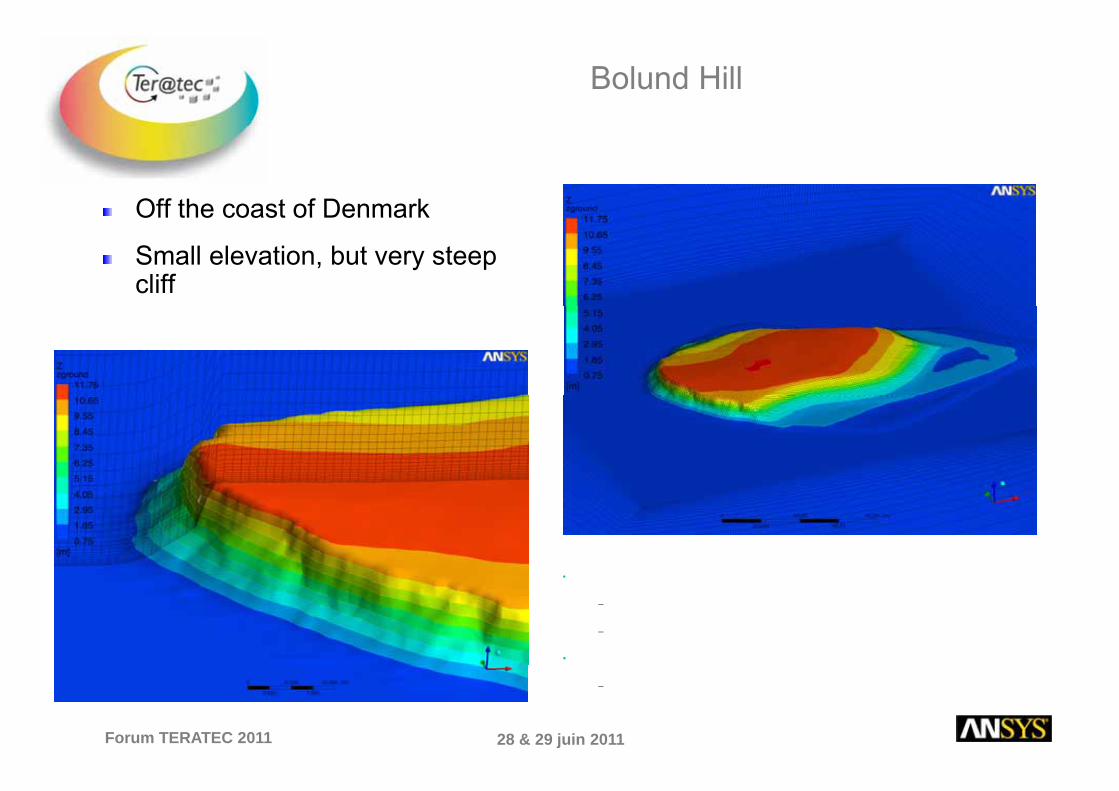
Bolund Hill
Off the coast of DenmarkOff the coast of Denmark
Small elevation, but very steep cliff
Horizontal mesh resolution• Horizontal mesh resolution– 1m in central part– Expansion factor of 1.15 further out
• Vertical resolution:
28 & 29 juin 2011Forum TERATEC 2011
– First cell height: 0.1m

Mast Locations
10 t l ti10 mast locations2 lines (each with two h i ht ) f CFD t theights) for CFD outputBlind test case definition from Risoefrom Risoe
4 wind directionsN t lNeutral cases
28 & 29 juin 2011Forum TERATEC 2011
Bechmann, A., Berg. J., Courtney, M.S., Jørgensen, H.E., Mann J., Sørensen N.N., 2009, The Bolund experiment: Overview and background, Technical Report Risø-R1658(EN), Risø DTU, National Lab., Roskilde, Denmark. http://bolund.risoe.dk.
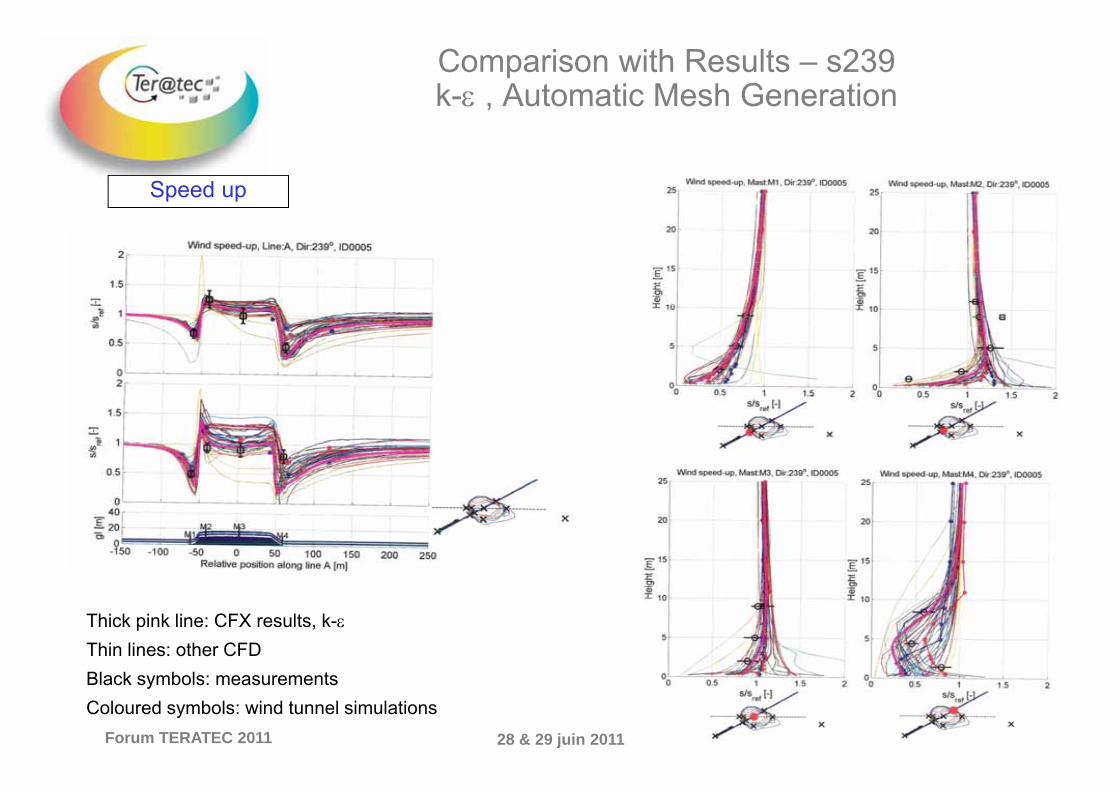
Comparison with Results – s239k-ε , Automatic Mesh Generation
Speed up
Thick pink line: CFX results, k-εThin lines: other CFD
28 & 29 juin 2011Forum TERATEC 2011
Black symbols: measurementsColoured symbols: wind tunnel simulations
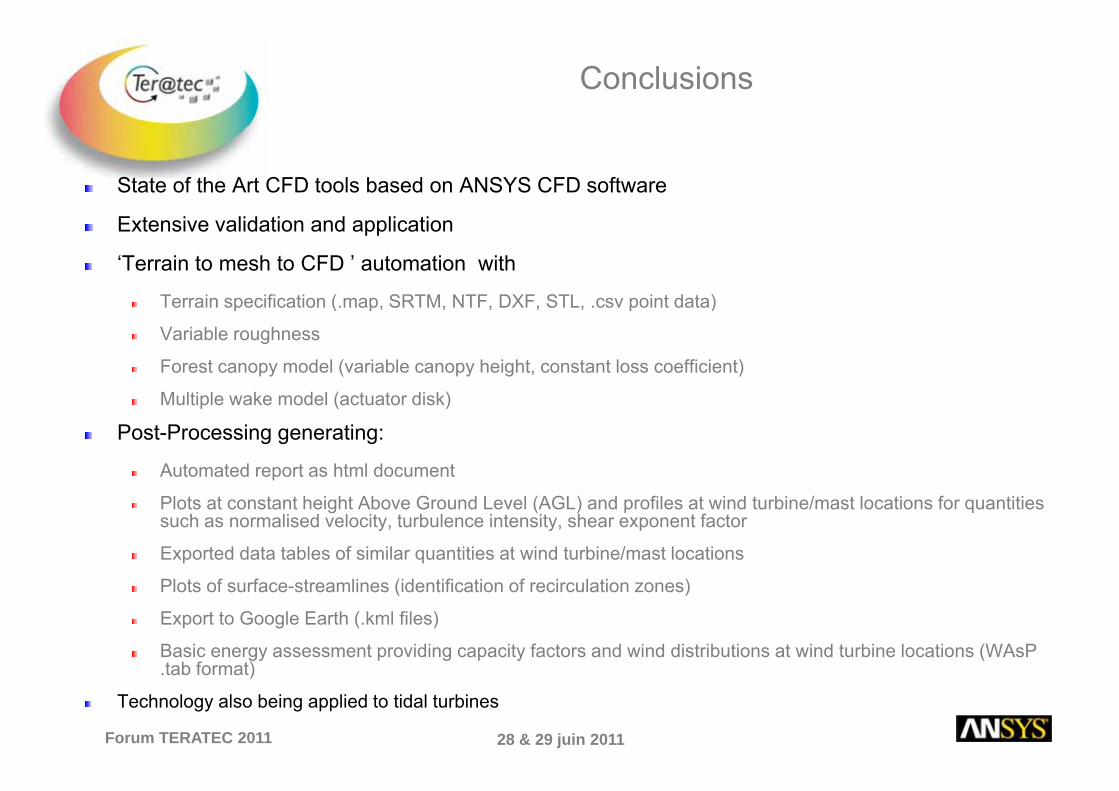
Conclusions
State of the Art CFD tools based on ANSYS CFD software
Extensive validation and application
‘Terrain to mesh to CFD ’ automation with
Terrain specification (.map, SRTM, NTF, DXF, STL, .csv point data)Terrain specification (.map, SRTM, NTF, DXF, STL, .csv point data)
Variable roughness
Forest canopy model (variable canopy height, constant loss coefficient)
Multiple wake model (actuator disk)Multiple wake model (actuator disk)
Post-Processing generating:
Automated report as html document
Plots at constant height Above Ground Level (AGL) and profiles at wind turbine/mast locations for quantities such as normalised velocity, turbulence intensity, shear exponent factor
Exported data tables of similar quantities at wind turbine/mast locations
Plots of surface-streamlines (identification of recirculation zones)
Export to Google Earth (.kml files)
Basic energy assessment providing capacity factors and wind distributions at wind turbine locations (WAsP t b f t)
28 & 29 juin 2011Forum TERATEC 2011
.tab format)
Technology also being applied to tidal turbines