win world survey (wws) ranks 40 countries on gender
TRANSCRIPT

WIN World Survey (WWS) ranks 40 countries on Gender
Equality, Sexual Harassment and Violence
WIN International, the world’s leading association in market research and polling, has today published Part 3 of the 2018 WIN World Survey (WWS) exploring the views and beliefs of 30,890 people from 40 countries across the globe. This survey reveals alarming attitudes and behaviors in many countries.
HEADLINES
Gender Equality
- Only 27% of people around the world believe that social attitudes and behaviours treat men and women equally.
- 48% believe that men are favoured whilst only 17% believe that women are favoured, 8% say that they don’t know.
- Countries with the lowest levels of gender equality include Japan 8%, Morocco 8%, India 14%, Chile 15%, Mexico 15%, Spain 15% and France 16%.
- Many of the APAC countries believe that high levels of gender equality exist (Philippines 61%, Thailand 59%, Indonesia 57%, Vietnam 48%).

Gender Equality at home, at work, in the media, in politics and in social settings:
- A high 38.2% net1 of the total sample believe that Gender equality has been achieved at home.
- Good progress has also been achieved in the media (22.3% net) and in social settings (20.1% net).
- However, there is more to be done at work (13.4% net). - Politics is ranked as last for Gender Equality (-0.7% net). - Females provide the same rank order with gender equality most progressed at
home (31.1% net) and least in politics (-9.4% net). - Younger females (18-34yrs) are reporting higher Gender Equality at work (9.6%
net) than older females (55+yrs) (-3.9%). - There is however a large discrepancy (in the order of 20%) in the perception of
Gender Equality between males and females at work. This difference of opinion does not exist to the same extent at home, in the media, in social settings or even in politics (in politics there is a difference of 18 points).
- Of concern is that females who report that they are Unhappy also report very negative Gender Equality at work (-23.1% net), in politics (-27.6% net), in social settings (-3.5% net), in the media (-1.1% net) and a low but positive score at home (6.2% net).
Sexual Harassment
- Sexual harassment is a problem around the world with 15.6% of females 18-34yrs reporting that they have experienced sexual harassment in the last year.
- Extremely high levels of sexual harassment are reported by women of 18-34yrs in Mexico (43%), Ireland (32%) and Australia (29%).
- 8.1% of females 35 to 54 years and 3.3% of females 55+ report sexual harassment in the last year whilst only 4.0% of all males report sexual harassment in the last year.
Violence (physical or psychological)
- Violence has been experienced by 14.5% of people across the world in the last year.
- The incidence of violence is highest amongst females 18 to 34 years (20.3%). 1 Net % = (% Definitely achieved + To some extend achieved) – (% Not really achieved + Not at all achieved)

- People who report that they are Unhappy also report high levels of violence (29.5%), particularly students 18 to 34 years (34.7%).
- The countries with highest reported violence levels include Paraguay (34.6%), Mexico (34.2%), Chile (31.4%), South Africa (30.3%) and India (29.2%).
- The African region reports the highest level of violence (27.7%), whilst APAC has the lowest (9.6%).
- The countries with the lowest violence levels include Italy (2.4%), Vietnam (3.1%), Indonesia (3.2%), Thailand (3.9%) and South Korea (4.3%).

6159
5748
4137 37
34 34 33 3331 30
28 28 28 27 27 26 2624 23 23 23
21 20 20 19 19 19 18 18 17 17 16 15 15 15 148 8
PHIL
IPIN
ASTH
AILA
ND
INDO
NES
IAVI
ETN
AMLA
TVIA
SOU
TH K
ORE
AIT
ALY
DEN
MAR
KM
ALAY
SIA
PERU
PARA
GUAY
HON
G KO
NG
GHAN
AFI
NLA
ND
SWED
ENGR
EECE
PALE
STIN
ETO
TAL
TURK
EYN
ETHE
RLAN
DSCH
INA
GERM
ANY
LEBA
NO
NCA
NAD
ASL
OVE
NIA
ARGE
NTI
NA UK
USA
AUST
RALI
APO
LAN
DSO
UTH
AFR
ICA
BRAZ
ILCR
OAT
IAIR
ELAN
DFR
ANCE
SPAI
NM
EXIC
OCH
ILE
INDI
AM
ORO
CCO
JAPA
N
% of people who believe that social attitudes and behaviours treat men and women equally
COMMENTARY
Gender Equality
International Women’s day is celebrated in 2019 on March the 8th. The message of the Day is that “Right now is a great and important time in history to do everything possible to help forge a more gender-balanced world. Women have come a long way, yet there's still more to be achieved”.
BUT how far have we actually come? The WIN World Survey shows that only 27% of people around the world believe that social attitudes and behaviors treat men and women equally. Whilst 48% believe that men are favored only 17% believe that women are favored.
There is a large difference in gender equality between countries. Whilst many APAC countries believe that high levels of gender equality exist (Philippines 61%, Thailand 59%, Indonesia 57%, Vietnam 48%), many countries report low levels of gender equality (Japan 8%, India 14%, Chile 15%, Mexico 15%, Spain 15% and France at 16%).

Gender Equality at home, at work, in the media, in politics and in social settings When we probe more deeply, we can see that gender equality is perceived to change between our social situations. Although all scores fall in the minority, a high 38.2% of people globally believe that gender equality has been achieved at home but a much lower 13.4% believe that gender equality has been achieved at work.
There is a dramatic difference (around 20%) of opinion between males and females in their perceptions of gender equality at work. It is however encouraging that younger females believe that gender equality has been achieved.
Politics is perceived to be the least progressed in gender equality, particularly by females (-9.4% net). However, there are some positive net scores for gender equality in social settings (20.1%) and in the media (22.3%).
9,6%
2,6%-3,9%
3,5%
28,3%
24,3%
16,2%
23,7%
18-34 35-54 55+ total
Net % of people who believe that gender equality has been achieved at work
(Net % = % definitely/to some extend - % not really/not at all achieved)
females males

0 0 0 0 0 1 3 3 35
7 8 9 10 1013 13 13 13 14
1618 18 18 18 19 20
22 2225 25 26 26 27 27 27
2932
43
ITAL
YLE
BAN
ON
VIET
NAM
THAI
LAN
DIN
DON
ESIA
HO
NG
KO
NG
LATV
IASL
OVE
NIA
PHIL
IPIN
ASSO
UTH
KO
REA
NET
HER
LAN
DSCR
OAT
IADE
NM
ARK
GRE
ECE
ARG
ENTI
NA
PERU
FRAN
CEG
ERM
ANY
MAL
AYSI
AJA
PAN
TOTA
LSP
AIN
CHIN
AIN
DIA UK
GH
ANA
BRAZ
ILU
SASO
UTH
AFR
ICA
MO
ROCC
OCA
NAD
ATU
RKEY
PARA
GU
AYSW
EDEN
FIN
LAN
DCH
ILE
AUST
RALI
AIR
ELAN
DM
EXIC
O
% women 18 to 34 years who have experienced sexual harassment in the last year
Net % of people who believe that gender equality has been achieved work politics home social settings media
female 18-34 9.6% -8.9% 31.9% 16.9% 16.6% 35-54 2.6% -9.0% 30.6% 14.1% 14.5% 55 + -3.9% -0.11 30.7% 8.3% 13.9% total 3.5% -9.4% 31.1% 13.6% 15.1%
male 18-34 28.3% 0.10 41.8% 30.4% 29.1% 35-54 24.3% 0.08 47.0% 25.9% 30.5% 55 + 16.2% -0.7% 48.6% 23.5% 29.4% total 23.7% 0.08 45.5% 26.9% 29.7%
total 18-34 18.7% 0.00 36.7% 23.4% 22.7% 35-54 13.3% 0.00 38.7% 19.9% 22.4% 55 + 6.1% -0.02 39.6% 15.8% 21.6% total 13.4% -0.01 38.2% 20.1% 22.3%
Sexual Harassment
Sexual harassment is prevalent in all countries surveyed. Younger females (18 to 34 years) are most subjected to sexual harassment (15.6%). Older females also report sexual harassment in the last year, 35 to 54 years (8.1%) and 55+ years 3.3%. Additionally, 4.0% of males report sexual harassment in the last year.
There are alarmingly high percentage of women 18 to 34 years reporting sexual harassment in the last year with the highest incidences reported in Mexico (43%), Ireland (32%) and Australia (29%).

The graph also shows that some countries (Italy, Lebanon, Vietnam, Thailand and Indonesia) registered 0% in women 18 to 34 years who have experienced sexual harassment in the last year, even if it is surprisingly.
Violence (physical or psychological)
The prevalence of violence around the world is also alarmingly high with 14.5% of the total sample experiencing violence in the last year. The incidence of violence is highest amongst females 18 to 34 years (20.3%) but is also high amongst males and females of all ages.
The region with the highest reported level of violence is Africa (27.7%) whilst APAC has the lowest (9.6%).
There is an extremely high level of violence in some countries with 1 person out of 3 people experiencing violence in the last year. The countries with highest reported violence levels include Paraguay (34.6%), Mexico (34.2%), Chile (31.4%), South Africa (30.3%) and India (29.2%).
In Mexico, the reported level of violence climbs to 43.8% for females in total and 50.9% for females 18 to 34 years.
The countries with the lowest violence levels include Italy (2.4%), Vietnam (3.1%), Indonesia (3.2%), Thailand (3.9%) and South Korea (4.3%).
15,513,7
8
12,9
20,3
16,1
9,7
1617,9
14,9
8,8
14,5
18-34 35-54 55+ total
% of people who have experienced violence (either physical of psychological) in the last year
male female total

2,4 3,1
3,2 3,9 4,3 5,
8 7,3
7,4
7,5 8,1 8,7 9,
7 11,3
11,7 12
,712
,912
,913
,3 14,5
14,6
14,9
15,2
15,3
15,3
15,4
15,6
15,6
16,3 18 19 19
,6 21,5 23
,424
,1 25,1
29,2 30
,3 31,4 34
,234
,6
ITAL
YVI
ETN
AMIN
DON
ESIA
THAI
LAN
DSO
UTH
KO
REA
PHIL
IPIN
ASDE
NM
ARK
LEBA
NO
NN
ETH
ERLA
NDS
GER
MAN
YU
KH
ON
G K
ON
GIR
ELAN
DFR
ANCE
SPAI
NJA
PAN
TURK
EYSW
EDEN
TOTA
LU
SACH
INA
SLO
VEN
IACA
NAD
AFI
NLA
ND
AUST
RALI
ALA
TVIA
MAL
AYSI
APE
RUM
ORO
CCO
GH
ANA
CRO
ATIA
PALE
STIN
EG
REEC
EBR
AZIL
ARG
ENTI
NA
INDI
ASO
UTH
AFR
ICA
CHIL
EM
EXIC
OPA
RAG
UAY
% of people who have experienced violence (either physical or psychological) in the last year
Vilma Scarpino, President of WIN International Association, said:
“It is important to celebrate the social progress that the world has made through affirmative action movements, but our global survey with data from 30,890 people across 40 countries shows that the world still has a long way to go. We have found that only a minority of people believe that men and women are treated equally. There are higher scores for gender equality at home but quite low scores at work and a negative score in politics. Encouragingly younger women (18 to 34 years) are reporting higher scores. The data shows that the males in this survey have an inflated perception of gender equality compared with the females.
The survey also reveals alarmingly high levels of sexual harassment and violence experienced in the last year. Although the levels of harassment and violence vary by country, it is the younger females who report the higher incidences.”
-ENDS-

Media enquiries:
Sara Vitrano, WIN Coordinator +39 335.62.07.347 E-mail: [email protected]
NOTES FOR EDITORS
Methodology:
The WWS (WIN Worldwide Survey) is a study conducted every year with the purpose to measure people´s
thoughts, expectations, worries and perceptions related to relevant topics for society and business.
Sample Size and Mode of Field Work:
A total of 30,890 persons were interviewed globally. See below for sample details. The fieldwork was
conducted during October 2018 – January 2019. The margin of error for the survey is between 2.4 and 4.4 at
95% confidence level.
The global average has been computed according to the share of the covered adult population of the
surveyed countries.
About the WIN survey:
The Worldwide Independent Network of Market Research (WIN) is a global network conducting market research and opinion polls in every continent. Our assets are: • Thought leadership: access to a group of the most prominent experts and business entrepreneurs in
Market Research, Polling and Consultancy • Flexibility: tailormade global and local solutions to meet clients’ needs • Innovation: access to the latest strategic consultancy, tool development and branded solutions • Local experts: access to a network of experts that truly understand the local culture, market and business
needs • Trust: highest quality of talented members in all countries covered
In the years, WIN has demonstrated wide competences and ability to conduct multi-country surveys following the highest standards requested by the market. The accumulated expertise of the Association is formidable: Third World issues, advertising and media research as well as retail, economics, and corporate research.

Table # 1: Gender Equality at work (By Country)
At work, would you say gender equality has been definitely/to some extend/not really/not at all achieved in our country?
COUNTRY TOP TWO bottom two DK/NA NET Total 53.7% 40.3% 6.0% 13.4% ARGENTINA 59.1% 33.1% 7.9% 26.0% AUSTRALIA 60.3% 35.5% 4.2% 24.8% BRAZIL 36.8% 53.5% 9.7% -16.7% CANADA 65.3% 30.9% 3.8% 34.4% CHILE 46.2% 49.0% 4.8% -2.8% CHINA 48.6% 49.9% 1.5% -1.3% CROATIA 42.9% 55.6% 1.5% -12.7% DENMARK 62.1% 31.2% 6.7% 30.8% FINLAND 78.7% 20.3% 1.0% 58.4% FRANCE 27.1% 68.5% 4.3% -41.4% GERMANY 43.2% 52.3% 4.5% -9.1% GHANA 52.8% 45.6% 1.6% 7.2% GREECE 63.3% 36.0% 0.8% 27.3% HONG KONG 69.1% 28.1% 2.8% 41.0% INDIA 75.8% 24.0% 0.2% 51.8% INDONESIA 65.6% 23.9% 10.5% 41.7% IRELAND 57.9% 34.2% 7.9% 23.8% ITALY 47.9% 49.3% 2.8% -1.5% JAPAN 20.8% 66.1% 13.2% -45.3% LATVIA 58.2% 29.0% 12.9% 29.2% LEBANON 65.0% 34.8% 0.2% 30.2% MALAYSIA 57.4% 36.7% 6.0% 20.7% MEXICO 45.1% 51.4% 3.5% -6.3% MOROCCO 50.3% 45.1% 4.6% 5.2% NETHERLANDS 45.7% 29.4% 24.9% 16.3% PALESTINE 56.0% 30.9% 13.1% 25.2% PARAGUAY 56.3% 38.8% 4.9% 17.5% PERU 41.1% 55.1% 3.8% -14.0% PHILIPPINES 78.9% 17.5% 3.6% 61.4% POLAND 56.0% 34.5% 9.5% 21.5% SLOVENIA 56.0% 42.5% 1.6% 13.5% SOUTH AFRICA 61.7% 34.4% 3.9% 27.4% SOUTH KOREA 57.8% 41.3% 0.9% 16.4% SPAIN 33.8% 64.8% 1.5% -31.0% SWEDEN 36.4% 58.0% 5.6% -21.6% THAILAND 70.4% 20.8% 8.8% 49.6% TURKEY 56.1% 39.4% 4.6% 16.7% UK 59.0% 29.7% 11.3% 29.3% USA 61.0% 32.5% 6.4% 28.5% VIETNAM 76.5% 12.6% 10.9% 63.9%

Table # 2: Gender Equality at work (By Region and demographics)
At Work, would you say gender equality has been definitely/to some extend/not really/not at all achieved in our country?
TOP TWO bottom two DK/NA NET REGIONS Total general 53.7% 40.3% 6.0% 13.4%
Africa 59.7% 36.9% 3.4% 22.8% Americas 49.8% 44.8% 5.3% 5.0% APAC 59.8% 34.6% 5.6% 25.2% Europe 49.8% 43.4% 6.9% 6.4% MENA 61.0% 33.0% 6.0% 28.0%
G20 G20 51.7% 42.9% 5.4% 8.7%
NO G20 55.4% 38.1% 6.4% 17.3% BRICS BRICS 52.3% 44.4% 3.3% 7.9%
NO BRICS 53.8% 40.0% 6.2% 13.8% G7 G7 43.6% 49.6% 6.8% -6.0%
NO G7 56.2% 38.1% 5.8% 18.1% GENDER FEMALE 48.7% 45.1% 6.2% 3.5%
MALE 58.9% 35.3% 5.8% 23.7% AGE 0-34 56.7% 38.0% 5.3% 18.7%
35-54 53.7% 40.4% 5.9% 13.3% 55-+ 49.5% 43.4% 7.1% 6.1% DK/NA 41.8% 35.4% 22.8% 6.4%
EDUCATION NO EDUCATION/ONLY BASIC
EDUCATION 51.4% 37.2% 11.3% 14.2% COMPLETED PRIMARY 52.5% 39.0% 8.5% 13.4% COMPLETED SECONDARY SCHOOL 53.1% 40.3% 6.6% 12.7% COMPLETED HIGH LEVEL EDUCATION 54.8% 41.4% 3.8% 13.4% COMPLETED HIGHER LEVEL OF EDUCATION 57.4% 38.5% 4.2% 18.9% REFUSED/DNK/DNA 33.2% 42.4% 24.3% -9.2%
WORK WORKING FULL (INCLUDE SELF-
EMPLOYED) 58.4% 37.6% 4.0% 20.8% WORKING PART-TIME 54.3% 41.0% 4.7% 13.3% UNEMPLOYED 49.1% 40.4% 10.5% 8.8% STUDENT 56.2% 38.5% 5.3% 17.7% HOUSEWIFE 45.7% 44.0% 10.3% 1.7% RETIRED/DISABLED 47.9% 43.7% 8.4% 4.2% REFUSED/DNK/DNA 48.7% 33.2% 18.1% 15.5%

Table # 3: GENDER EQUALITY IN POLITICS (By Country) In Politics, would you say gender equality has been definitely/to some extend/not really/not at all achieved in
our country? COUNTRY TOP TWO bottom two DK/NA NET
Total general 44.8% 45.5% 9.8% -0.7% ARGENTINA 53.8% 33.9% 12.3% 19.8% AUSTRALIA 38.8% 55.6% 5.6% -16.8% BRAZIL 27.8% 61.7% 10.5% -33.9% CANADA 56.7% 38.6% 4.6% 18.1% CHILE 40.3% 53.3% 6.4% -13.0% CHINA 0.0% 0.0% 100.0% 0.0% CROATIA 30.9% 67.0% 2.1% -36.1% DENMARK 66.7% 27.6% 5.7% 39.1% FINLAND 75.0% 21.0% 4.1% 54.0% FRANCE 27.3% 67.3% 5.4% -40.0% GERMANY 49.5% 46.4% 4.1% 3.1% GHANA 35.2% 64.0% 0.8% -28.8% GREECE 65.8% 33.0% 1.2% 32.8% HONG KONG 63.6% 32.6% 3.8% 31.0% INDIA 60.0% 39.0% 1.0% 21.0% INDONESIA 51.2% 35.3% 13.5% 15.8% IRELAND 44.1% 49.4% 6.4% -5.3% ITALY 41.3% 55.9% 2.9% -14.6% JAPAN 15.2% 74.7% 10.1% -59.5% LATVIA 58.2% 28.3% 13.5% 30.0% LEBANON 53.6% 45.8% 0.6% 7.8% MALAYSIA 45.6% 46.4% 8.0% -0.8% MEXICO 50.6% 45.2% 4.1% 5.4% MOROCCO 48.1% 47.3% 4.6% 0.8% NETHERLANDS 46.9% 34.1% 19.0% 12.9% PALESTINE 41.5% 45.2% 13.3% -3.7% PARAGUAY 44.1% 52.8% 3.1% -8.7% PERU 31.4% 64.4% 4.2% -33.0% PHILIPPINES 67.8% 26.4% 5.9% 41.4% POLAND 53.2% 36.3% 10.5% 16.9% SLOVENIA 39.9% 59.2% 1.0% -19.3% SOUTH AFRICA 49.1% 46.8% 4.1% 2.2% SOUTH KOREA 44.6% 54.6% 0.8% -10.0% SPAIN 44.7% 53.2% 2.1% -8.5% SWEDEN 38.0% 54.7% 7.3% -16.7% THAILAND 49.4% 41.6% 9.0% 7.7% TURKEY 40.8% 47.7% 11.5% -7.0% UK 50.7% 38.7% 10.6% 12.0% USA 49.3% 44.5% 6.2% 4.8% VIETNAM 53.4% 28.9% 17.7% 24.5%

Table # 4: GENDER EQUALITY IN POLITICS (By Regions and demographics)
In Politics, would you say gender equality has been definitely/to some extend/not really/not at all achieved in our country?
TOP TWO bottom two DK/NA NET REGION
Total general 44.8% 45.5% 9.8% -0.7% Africa 45.9% 50.7% 3.4% -4.8% Americas 42.6% 51.2% 6.2% -8.7% APAC 42.1% 40.3% 17.6% 1.8% Europe 46.9% 45.9% 7.2% 1.0% MENA 48.2% 45.5% 6.3% 2.7%
G20
G20 40.5% 46.8% 12.8% -6.3% NO G20 48.3% 44.4% 7.2% 3.9%
BRICS
BRICS 22.0% 25.4% 52.6% -3.4% NO BRICS 46.3% 46.9% 6.8% -0.6%
G7
G7 39.5% 54.1% 6.4% -14.6% NO G7 46.0% 43.4% 10.6% 2.6%
GENDER
FEMALE 40.4% 49.7% 9.9% -9.4% MALE 49.3% 41.1% 9.6% 8.3%
AGE
0-34 45.1% 45.0% 9.8% 0.1% 35-54 44.3% 44.8% 10.9% -0.5% 55-+ 44.9% 47.2% 7.9% -2.3% DK/NA 27.8% 72.2% 0.0% -44.4%
EDUCATION
NO EDUCATION/ONLY BASIC EDUCATION 43.2% 41.2% 15.6% 1.9% COMPLETED PRIMARY 44.8% 44.5% 10.7% 0.3% COMPLETED SECONDARY SCHOOL 45.4% 46.1% 8.4% -0.7% COMPLETED HIGH LEVEL EDUCATION 42.7% 46.0% 11.2% -3.3% COMPLETED HIGHER LEVEL OF EDUCATION 50.8% 42.6% 6.6% 8.3% REFUSED/DNK/DNA 28.8% 45.0% 26.2% -16.2%
WORK
WORKING FULL (INCLUDE SELF-EMPLOYED) 45.4% 43.4% 11.2% 2.0% WORKING PART-TIME 43.9% 49.0% 7.1% -5.0% UNEMPLOYED 45.4% 44.1% 10.5% 1.2% STUDENT 46.3% 47.4% 6.4% -1.1% HOUSEWIFE 39.5% 50.2% 10.3% -10.6% RETIRED/DISABLED 45.7% 46.4% 7.9% -0.6% REFUSED/DNK/DNA 40.6% 38.3% 21.1% 2.3%

Table # 5: GENDER EQUALITY AT HOME (By Country)
At home, would you say gender equality has been definitely/to some extend/not really/not at all achieved in our country?
COUNTRY TOP TWO bottom two DK/NA NET Total general 66.3% 28.2% 5.5% 38.2% ARGENTINA 66.3% 29.2% 4.5% 37.1% AUSTRALIA 73.7% 20.5% 5.8% 53.1% BRAZIL 48.8% 40.0% 11.2% 8.8% CANADA 78.0% 17.4% 4.6% 60.6% CHILE 64.7% 30.4% 4.9% 34.3% CHINA 72.7% 26.0% 1.3% 46.7% CROATIA 68.3% 29.3% 2.4% 39.0% DENMARK 78.1% 16.2% 5.8% 61.9% FINLAND 90.5% 7.4% 2.1% 83.1% FRANCE 55.8% 38.1% 6.0% 17.7% GERMANY 79.4% 15.7% 4.9% 63.7% GHANA 67.2% 32.4% 0.4% 34.8% GREECE 77.2% 21.8% 1.0% 55.4% HONG KONG 74.8% 22.0% 3.2% 52.8% INDIA 77.2% 22.6% 0.2% 54.6% INDONESIA 75.8% 17.5% 6.7% 58.3% IRELAND 72.8% 19.3% 7.9% 53.5% ITALY 68.1% 29.7% 2.2% 38.4% JAPAN 30.7% 57.1% 12.2% -26.4% LATVIA 67.0% 19.3% 13.7% 47.8% LEBANON 71.6% 28.0% 0.4% 43.6% MALAYSIA 57.5% 37.9% 4.7% 19.6% MEXICO 49.4% 39.4% 11.2% 10.0% MOROCCO 39.9% 55.3% 4.8% -15.4% NETHERLANDS 64.2% 15.6% 20.2% 48.6% PALESTINE 59.8% 26.9% 13.3% 32.8% PARAGUAY 67.2% 28.7% 4.1% 38.4% PERU 53.1% 43.2% 3.7% 9.9% PHILIPPINES 86.0% 12.0% 1.9% 74.0% POLAND 58.1% 31.0% 10.9% 27.2% SLOVENIA 80.7% 17.6% 1.7% 63.1% SOUTH AFRICA 67.9% 28.9% 3.2% 38.9% SOUTH KOREA 74.2% 25.7% 0.1% 48.6% SPAIN 44.7% 54.0% 1.3% -9.4% SWEDEN 46.0% 47.8% 6.2% -1.8% THAILAND 79.1% 17.8% 3.1% 61.3% TURKEY 59.6% 36.6% 3.8% 22.9% UK 70.4% 18.5% 11.1% 51.9% USA 74.6% 18.6% 6.8% 56.0% VIETNAM 81.3% 12.9% 5.9% 68.4%
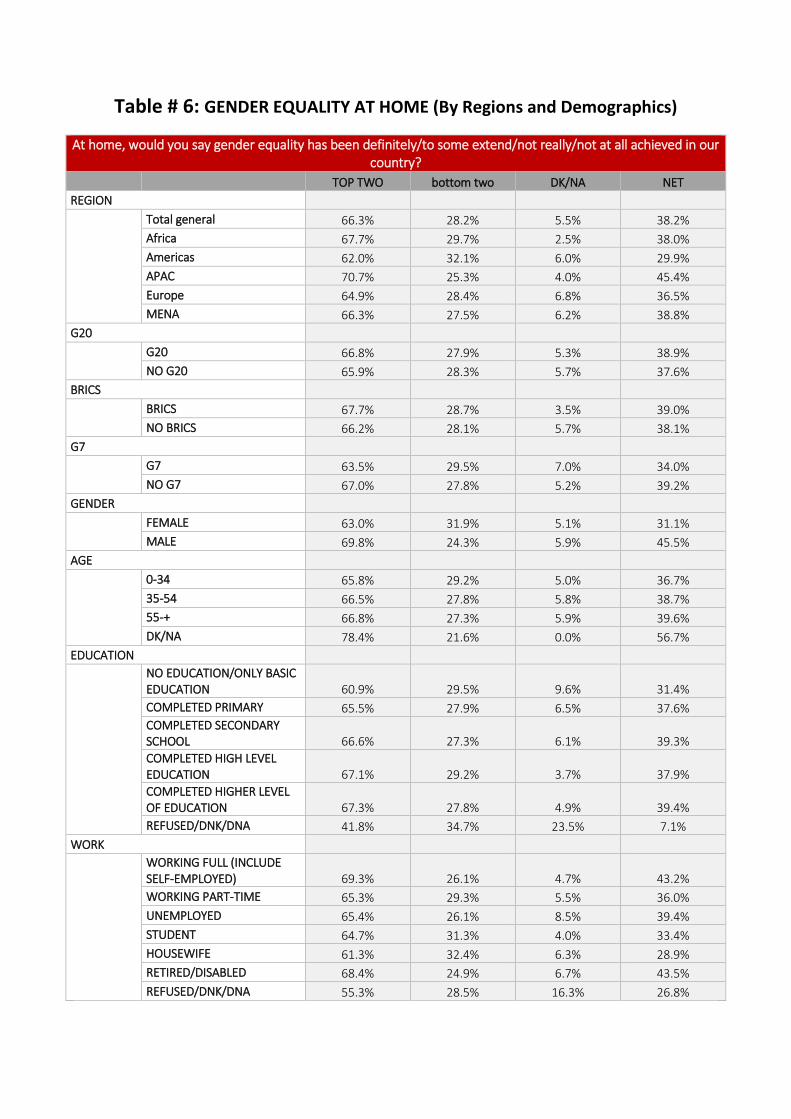
Table # 6: GENDER EQUALITY AT HOME (By Regions and Demographics)
At home, would you say gender equality has been definitely/to some extend/not really/not at all achieved in our country?
TOP TWO bottom two DK/NA NET REGION
Total general 66.3% 28.2% 5.5% 38.2% Africa 67.7% 29.7% 2.5% 38.0% Americas 62.0% 32.1% 6.0% 29.9% APAC 70.7% 25.3% 4.0% 45.4% Europe 64.9% 28.4% 6.8% 36.5% MENA 66.3% 27.5% 6.2% 38.8%
G20
G20 66.8% 27.9% 5.3% 38.9% NO G20 65.9% 28.3% 5.7% 37.6%
BRICS
BRICS 67.7% 28.7% 3.5% 39.0% NO BRICS 66.2% 28.1% 5.7% 38.1%
G7
G7 63.5% 29.5% 7.0% 34.0% NO G7 67.0% 27.8% 5.2% 39.2%
GENDER
FEMALE 63.0% 31.9% 5.1% 31.1% MALE 69.8% 24.3% 5.9% 45.5%
AGE
0-34 65.8% 29.2% 5.0% 36.7% 35-54 66.5% 27.8% 5.8% 38.7% 55-+ 66.8% 27.3% 5.9% 39.6% DK/NA 78.4% 21.6% 0.0% 56.7%
EDUCATION
NO EDUCATION/ONLY BASIC EDUCATION 60.9% 29.5% 9.6% 31.4% COMPLETED PRIMARY 65.5% 27.9% 6.5% 37.6% COMPLETED SECONDARY SCHOOL 66.6% 27.3% 6.1% 39.3% COMPLETED HIGH LEVEL EDUCATION 67.1% 29.2% 3.7% 37.9% COMPLETED HIGHER LEVEL OF EDUCATION 67.3% 27.8% 4.9% 39.4% REFUSED/DNK/DNA 41.8% 34.7% 23.5% 7.1%
WORK
WORKING FULL (INCLUDE SELF-EMPLOYED) 69.3% 26.1% 4.7% 43.2% WORKING PART-TIME 65.3% 29.3% 5.5% 36.0% UNEMPLOYED 65.4% 26.1% 8.5% 39.4% STUDENT 64.7% 31.3% 4.0% 33.4% HOUSEWIFE 61.3% 32.4% 6.3% 28.9% RETIRED/DISABLED 68.4% 24.9% 6.7% 43.5% REFUSED/DNK/DNA 55.3% 28.5% 16.3% 26.8%

Table # 7: GENDER EQUALITY IN SOCIAL SETTINGS (By Country)
In Social Settings, would you say gender equality has been definitely/to some extend/not really/not at all achieved in our country?
COUNTRY TOP TWO bottom two DK/NA NET Total general 57.0% 36.8% 6.2% 20.1% ARGENTINA 60.6% 30.1% 9.3% 30.5% AUSTRALIA 74.1% 21.9% 4.0% 52.2% BRAZIL 43.5% 46.7% 9.8% -3.2% CANADA 69.1% 26.1% 4.8% 42.9% CHILE 54.1% 40.1% 5.8% 14.0% CHINA 68.7% 30.1% 1.2% 38.6% CROATIA 48.6% 49.9% 1.5% -1.3% DENMARK 74.6% 16.9% 8.4% 57.7% FINLAND 85.4% 10.9% 3.7% 74.5% FRANCE 34.7% 59.2% 6.1% -24.5% GERMANY 63.5% 32.1% 4.4% 31.4% GHANA 57.0% 41.6% 1.4% 15.4% GREECE 70.5% 28.7% 0.8% 41.8% HONG KONG 70.1% 26.9% 3.0% 43.2% INDIA 50.8% 49.0% 0.2% 1.8% INDONESIA 61.4% 26.9% 11.7% 34.5% IRELAND 71.0% 20.8% 8.2% 50.2% ITALY 51.8% 45.3% 3.0% 6.5% JAPAN 15.3% 74.8% 9.9% -59.4% LATVIA 52.4% 32.2% 15.4% 20.1% LEBANON 58.6% 39.0% 2.4% 19.6% MALAYSIA 51.0% 43.1% 5.8% 7.9% MEXICO 46.3% 49.6% 4.1% -3.3% MOROCCO 50.5% 42.9% 6.6% 7.6% NETHERLANDS 54.1% 25.1% 20.8% 29.1% PALESTINE 58.5% 28.4% 13.1% 30.1% PARAGUAY 60.4% 35.9% 3.7% 24.5% PERU 35.7% 59.7% 4.7% -24.0% PHILIPPINES 79.2% 17.1% 3.7% 62.1% POLAND 50.0% 37.2% 12.8% 12.8% SLOVENIA 63.4% 35.9% 0.7% 27.5% SOUTH AFRICA 65.9% 30.0% 4.1% 35.9% SOUTH KOREA 53.6% 45.9% 0.5% 7.7% SPAIN 54.4% 44.3% 1.3% 10.1% SWEDEN 39.9% 52.6% 7.5% -12.7% THAILAND 58.9% 36.4% 4.7% 22.5% TURKEY 55.1% 37.3% 7.6% 17.8% UK 61.8% 25.8% 12.4% 36.0% USA 67.1% 27.1% 5.8% 40.1% VIETNAM 68.4% 23.4% 8.2% 44.9%

Table # 8: GENDER EQUALITY IN SOCIAL SETTINGS (By Region and Demographics)
In Social Settings, would you say gender equality has been definitely/to some extend/not really/not at all
achieved in our country? TOP TWO bottom two DK/NA NET
REGION Total general 57.0% 36.8% 6.2% 20.1%
Africa 63.9% 32.6% 3.5% 31.2% Americas 52.7% 41.5% 5.8% 11.2% APAC 58.4% 36.8% 4.8% 21.5% Europe 56.4% 35.9% 7.7% 20.5% MENA 58.6% 34.3% 7.2% 24.3%
G20 G20 55.4% 39.1% 5.5% 16.4%
NO G20 58.2% 34.9% 6.8% 23.3% BRICS BRICS 57.8% 39.0% 3.2% 18.8% NO BRICS 56.9% 36.7% 6.4% 20.2%
G7 G7 49.2% 44.0% 6.8% 5.3%
NO G7 58.8% 35.1% 6.1% 23.8% GENDER
FEMALE 53.7% 40.0% 6.3% 13.6% MALE 60.4% 33.5% 6.1% 26.9%
AGE 0-34 59.0% 35.6% 5.5% 23.4%
35-54 56.7% 36.8% 6.5% 19.9% 55-+ 54.5% 38.6% 6.9% 15.8% DK/NA 55.5% 21.6% 22.8% 33.9%
EDUCATION NO EDUCATION/ONLY
BASIC EDUCATION 50.0% 35.4% 14.6% 14.6% COMPLETED PRIMARY 53.9% 37.4% 8.8% 16.5% COMPLETED SECONDARY SCHOOL 56.9% 36.4% 6.7% 20.5% COMPLETED HIGH LEVEL EDUCATION 58.5% 37.7% 3.7% 20.8% COMPLETED HIGHER LEVEL OF EDUCATION 59.4% 35.1% 5.5% 24.3% REFUSED/DNK/DNA 34.8% 41.6% 23.5% -6.8%
WORK WORKING FULL (INCLUDE
SELF-EMPLOYED) 59.6% 35.4% 5.0% 24.3% WORKING PART-TIME 56.5% 37.5% 6.1% 19.0% UNEMPLOYED 55.4% 35.2% 9.4% 20.2% STUDENT 56.7% 38.8% 4.5% 17.9% HOUSEWIFE 48.3% 42.8% 8.8% 5.5% RETIRED/DISABLED 55.8% 36.6% 7.6% 19.2% REFUSED/DNK/DNA 49.6% 31.9% 18.5% 17.6%

Table # 9: GENDER EQUALITY IN MEDIA (By Country)
In Media, would you say gender equality has been definitely/to some extend/not really/not at all achieved in our country?
COUNTRY TOP TWO bottom two DK/NA NET Total general 57.4% 35.1% 7.5% 22.3% ARGENTINA 68.9% 23.6% 7.4% 45.3% AUSTRALIA 58.0% 37.3% 4.7% 20.7%
BRAZIL 51.6% 39.8% 8.6% 11.9% CANADA 69.4% 25.0% 5.5% 44.4%
CHILE 59.3% 35.4% 5.3% 23.9% CHINA 54.9% 42.9% 2.2% 12.0%
CROATIA 59.1% 39.3% 1.5% 19.8% DENMARK 66.0% 25.1% 8.9% 40.8% FINLAND 77.6% 18.1% 4.3% 59.5% FRANCE 43.0% 49.6% 7.4% -6.6%
GERMANY 56.7% 38.9% 4.4% 17.8% GHANA 50.2% 48.0% 1.8% 2.2% GREECE 77.4% 20.2% 2.4% 57.2%
HONG KONG 66.5% 29.3% 4.2% 37.2% INDIA 75.0% 24.8% 0.2% 50.2%
INDONESIA 57.3% 27.6% 15.1% 29.7% IRELAND 65.2% 27.2% 7.6% 37.9%
ITALY 57.1% 39.7% 3.3% 17.4% JAPAN 28.2% 58.4% 13.4% -30.2% LATVIA 64.8% 19.3% 15.9% 45.6%
LEBANON 71.0% 27.2% 1.8% 43.8% MALAYSIA 54.2% 37.3% 8.6% 16.9% MEXICO 48.5% 41.4% 10.1% 7.2%
MOROCCO 51.1% 44.1% 4.8% 7.0% NETHERLANDS 54.6% 27.6% 17.8% 27.0%
PALESTINE 56.5% 29.9% 13.6% 26.7% PARAGUAY 67.0% 28.9% 4.1% 38.1%
PERU 33.8% 61.6% 4.6% -27.8% PHILIPPINES 61.9% 31.7% 6.4% 30.3%
POLAND 64.3% 24.3% 11.4% 39.9% SLOVENIA 66.6% 31.8% 1.6% 34.8%
SOUTH AFRICA 68.7% 25.7% 5.6% 43.0% SOUTH KOREA 59.5% 39.8% 0.7% 19.6%
SPAIN 54.5% 44.1% 1.4% 10.4% SWEDEN 37.8% 52.1% 10.1% -14.3%
THAILAND 60.5% 19.0% 20.5% 41.4% TURKEY 45.4% 38.1% 16.5% 7.3%
UK 54.1% 34.6% 11.3% 19.5% USA 62.2% 30.7% 7.0% 31.5%
VIETNAM 69.3% 20.0% 10.7% 49.4%

Table # 10: GENDER EQUALITY IN MEDIA (By Regions and Demographics)
In Media, would you say gender equality has been definitely/to some extend/not really/not at all achieved in our country?
TOP TWO bottom two DK/NA NET REGION
Total general 57.4% 35.1% 7.5% 22.3% Africa 64.5% 30.8% 4.7% 33.7% Americas 55.5% 38.3% 6.2% 17.2% APAC 57.1% 35.4% 7.5% 21.7% Europe 56.7% 34.9% 8.4% 21.8% MENA 64.5% 28.4% 7.1% 36.1%
G20
G20 56.5% 36.9% 6.5% 19.6% NO G20 58.1% 33.6% 8.3% 24.5%
BRICS
BRICS 59.1% 37.6% 3.3% 21.4% NO BRICS 57.3% 34.9% 7.8% 22.3%
G7
G7 50.9% 41.5% 7.6% 9.4% NO G7 59.0% 33.6% 7.4% 25.4%
GENDER
FEMALE 53.7% 38.6% 7.7% 15.1% MALE 61.3% 31.5% 7.2% 29.7%
AGE
0-34 58.1% 35.4% 6.5% 22.7% 35-54 57.4% 35.0% 7.6% 22.4% 55-+ 56.4% 34.9% 8.7% 21.6% DK/NA 55.5% 21.6% 22.8% 33.9%
EDUCATION
NO EDUCATION/ONLY BASIC EDUCATION 48.2% 31.5% 20.4% 16.7% COMPLETED PRIMARY 53.5% 35.8% 10.7% 17.7% COMPLETED SECONDARY SCHOOL 57.1% 35.0% 7.9% 22.1% COMPLETED HIGH LEVEL EDUCATION 59.7% 35.7% 4.6% 24.1% COMPLETED HIGHER LEVEL OF EDUCATION 60.3% 33.9% 5.8% 26.4% REFUSED/DNK/DNA 35.1% 40.6% 24.2% -5.5%
WORK
WORKING FULL (INCLUDE SELF-EMPLOYED) 59.3% 34.5% 6.2% 24.7% WORKING PART-TIME 55.7% 37.6% 6.7% 18.1% UNEMPLOYED 55.1% 33.5% 11.4% 21.6% STUDENT 60.8% 34.4% 4.8% 26.4% HOUSEWIFE 52.8% 36.8% 10.4% 16.0% RETIRED/DISABLED 56.8% 33.9% 9.3% 22.9% REFUSED/DNK/DNA 46.9% 31.1% 22.0% 15.8%

Table # 11: Gender Equality Net Index in different environments (By Country)
In each of the following domains, would you say gender equality has been definitely/to some extend/not really/not at all achieved in our country?
COUNTRY AT WORK IN POLITICS AT HOME IN SOCIAL SETTINGS IN MEDIA Total 13.4% -0.7% 38.2% 20.1% 22.3% ARGENTINA 26.0% 19.8% 37.1% 30.5% 45.3% AUSTRALIA 24.8% -16.8% 53.1% 52.2% 20.7% BRAZIL -16.7% -33.9% 8.8% -3.2% 11.9% CANADA 34.4% 18.1% 60.6% 42.9% 44.4% CHILE -2.8% -13.0% 34.3% 14.0% 23.9% CHINA -1.3% 0.0% 46.7% 38.6% 12.0% CROATIA -12.7% -36.1% 39.0% -1.3% 19.8% DENMARK 30.8% 39.1% 61.9% 57.7% 40.8% FINLAND 58.4% 54.0% 83.1% 74.5% 59.5% FRANCE -41.4% -40.0% 17.7% -24.5% -6.6% GERMANY -9.1% 3.1% 63.7% 31.4% 17.8% GHANA 7.2% -28.8% 34.8% 15.4% 2.2% GREECE 27.3% 32.8% 55.4% 41.8% 57.2% HONG KONG 41.0% 31.0% 52.8% 43.2% 37.2% INDIA 51.8% 21.0% 54.6% 1.8% 50.2% INDONESIA 41.7% 15.8% 58.3% 34.5% 29.7% IRELAND 23.8% -5.3% 53.5% 50.2% 37.9% ITALY -1.5% -14.6% 38.4% 6.5% 17.4% JAPAN -45.3% -59.5% -26.4% -59.4% -30.2% LATVIA 29.2% 30.0% 47.8% 20.1% 45.6% LEBANON 30.2% 7.8% 43.6% 19.6% 43.8% MALAYSIA 20.7% -0.8% 19.6% 7.9% 16.9% MEXICO -6.3% 5.4% 10.0% -3.3% 7.2% MOROCCO 5.2% 0.8% -15.4% 7.6% 7.0% NETHERLANDS 16.3% 12.9% 48.6% 29.1% 27.0% PALESTINE 25.2% -3.7% 32.8% 30.1% 26.7% PARAGUAY 17.5% -8.7% 38.4% 24.5% 38.1% PERU -14.0% -33.0% 9.9% -24.0% -27.8% PHILIPPINES 61.4% 41.4% 74.0% 62.1% 30.3% POLAND 21.5% 16.9% 27.2% 12.8% 39.9% SLOVENIA 13.5% -19.3% 63.1% 27.5% 34.8% SOUTH AFRICA 27.4% 2.2% 38.9% 35.9% 43.0% SOUTH KOREA 16.4% -10.0% 48.6% 7.7% 19.6% SPAIN -31.0% -8.5% -9.4% 10.1% 10.4% SWEDEN -21.6% -16.7% -1.8% -12.7% -14.3% THAILAND 49.6% 7.7% 61.3% 22.5% 41.4% TURKEY 16.7% -7.0% 22.9% 17.8% 7.3% UK 29.3% 12.0% 51.9% 36.0% 19.5% USA 28.5% 4.8% 56.0% 40.1% 31.5% VIETNAM 63.9% 24.5% 68.4% 44.9% 49.4%

Table # 12: SOCIAL ATTITUDES AND BEHAVIORS FAVOURS MEN OR WOMEN (By Country)
In your country would you say that social attitudes and behaviors favors men, women or both equally?
COUNTRY MEN EQUALLY WOMEN DK/NA Total general 47.9% 27.2% 16.8% 8.0% ARGENTINA 45.7% 19.8% 23.7% 10.8% AUSTRALIA 57.8% 18.7% 18.5% 5.1% BRAZIL 59.8% 17.5% 11.8% 10.9% CANADA 55.4% 22.8% 16.6% 5.2% CHILE 53.8% 14.7% 23.6% 8.0% CHINA 56.3% 23.7% 18.9% 1.0% CROATIA 70.7% 16.9% 6.9% 5.5% DENMARK 40.4% 34.2% 13.0% 12.4% FINLAND 46.6% 27.8% 19.3% 6.2% FRANCE 68.5% 16.3% 5.7% 9.5% GERMANY 54.9% 23.3% 12.6% 9.2% GHANA 48.2% 30.4% 20.2% 1.2% GREECE 58.5% 27.5% 13.4% 0.6% HONG KONG 28.9% 31.1% 29.9% 10.1% INDIA 47.6% 14.0% 38.0% 0.4% INDONESIA 22.5% 57.2% 11.7% 8.6% IRELAND 55.5% 16.6% 18.7% 9.3% ITALY 49.0% 36.8% 11.4% 2.7% JAPAN 60.5% 7.6% 17.9% 14.0% LATVIA 24.1% 40.6% 12.6% 22.7% LEBANON 54.0% 23.0% 21.8% 1.2% MALAYSIA 43.6% 34.0% 12.6% 9.9% MEXICO 53.9% 15.2% 19.2% 11.7% MOROCCO 17.6% 8.4% 20.0% 54.1% NETHERLANDS 47.8% 26.3% 14.1% 11.8% PALESTINE 32.1% 27.4% 23.0% 17.5% PARAGUAY 42.9% 32.8% 18.6% 5.6% PERU 37.5% 32.9% 26.8% 2.9% PHILIPPINES 15.6% 61.0% 21.3% 2.1% POLAND 55.7% 18.6% 14.1% 11.6% SLOVENIA 64.4% 20.8% 11.8% 3.1% SOUTH AFRICA 50.5% 18.4% 22.8% 8.3% SOUTH KOREA 44.4% 37.1% 18.0% 0.6% SPAIN 66.2% 15.4% 15.5% 2.9% SWEDEN 52.6% 27.6% 9.7% 10.1% THAILAND 30.3% 58.8% 5.4% 5.5% TURKEY 45.5% 26.4% 21.4% 6.7% UK 60.6% 19.6% 11.7% 8.1% USA 60.3% 19.1% 12.1% 8.5% VIETNAM 33.7% 48.3% 13.4% 4.6%
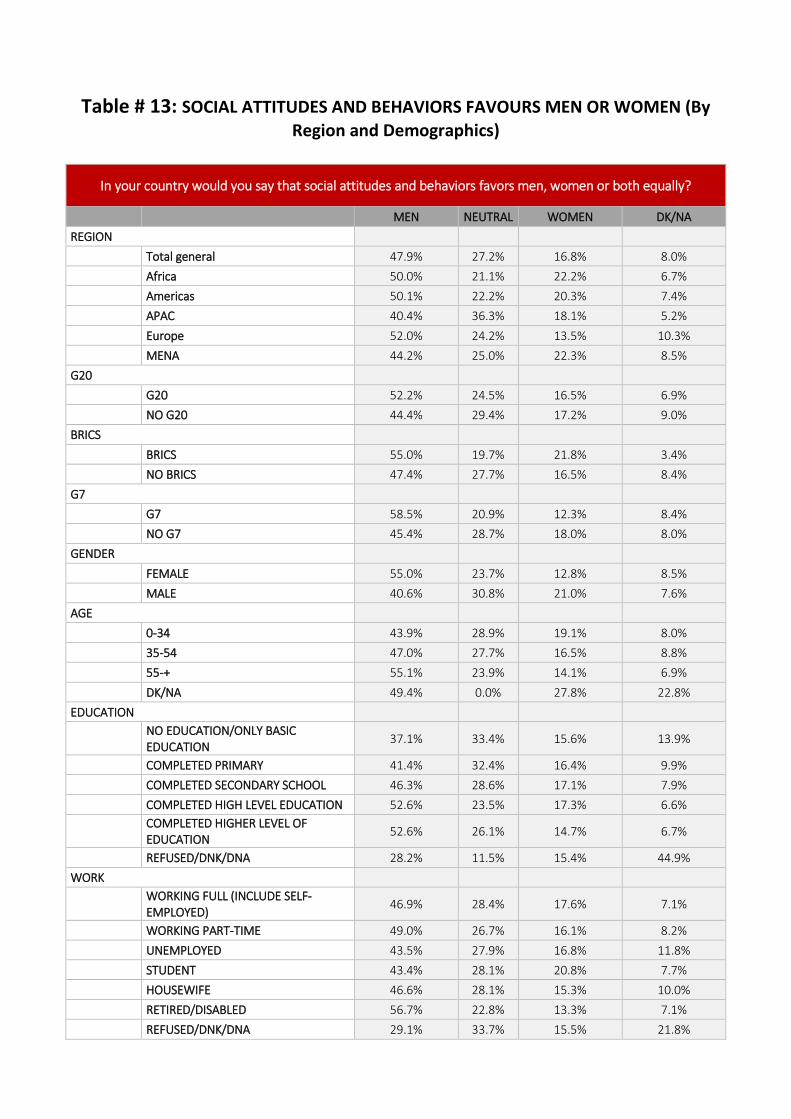
Table # 13: SOCIAL ATTITUDES AND BEHAVIORS FAVOURS MEN OR WOMEN (By Region and Demographics)
In your country would you say that social attitudes and behaviors favors men, women or both equally?
MEN NEUTRAL WOMEN DK/NA REGION Total general 47.9% 27.2% 16.8% 8.0% Africa 50.0% 21.1% 22.2% 6.7% Americas 50.1% 22.2% 20.3% 7.4% APAC 40.4% 36.3% 18.1% 5.2% Europe 52.0% 24.2% 13.5% 10.3% MENA 44.2% 25.0% 22.3% 8.5% G20
G20 52.2% 24.5% 16.5% 6.9% NO G20 44.4% 29.4% 17.2% 9.0% BRICS
BRICS 55.0% 19.7% 21.8% 3.4% NO BRICS 47.4% 27.7% 16.5% 8.4% G7
G7 58.5% 20.9% 12.3% 8.4% NO G7 45.4% 28.7% 18.0% 8.0% GENDER
FEMALE 55.0% 23.7% 12.8% 8.5% MALE 40.6% 30.8% 21.0% 7.6% AGE
0-34 43.9% 28.9% 19.1% 8.0% 35-54 47.0% 27.7% 16.5% 8.8% 55-+ 55.1% 23.9% 14.1% 6.9% DK/NA 49.4% 0.0% 27.8% 22.8% EDUCATION
NO EDUCATION/ONLY BASIC EDUCATION
37.1% 33.4% 15.6% 13.9%
COMPLETED PRIMARY 41.4% 32.4% 16.4% 9.9% COMPLETED SECONDARY SCHOOL 46.3% 28.6% 17.1% 7.9% COMPLETED HIGH LEVEL EDUCATION 52.6% 23.5% 17.3% 6.6%
COMPLETED HIGHER LEVEL OF EDUCATION
52.6% 26.1% 14.7% 6.7%
REFUSED/DNK/DNA 28.2% 11.5% 15.4% 44.9% WORK
WORKING FULL (INCLUDE SELF-EMPLOYED)
46.9% 28.4% 17.6% 7.1%
WORKING PART-TIME 49.0% 26.7% 16.1% 8.2% UNEMPLOYED 43.5% 27.9% 16.8% 11.8% STUDENT 43.4% 28.1% 20.8% 7.7% HOUSEWIFE 46.6% 28.1% 15.3% 10.0% RETIRED/DISABLED 56.7% 22.8% 13.3% 7.1% REFUSED/DNK/DNA 29.1% 33.7% 15.5% 21.8%

Table # 14: VIOLENCE (By Country)
Have you suffered from any kind of violence (either physical or psychological) in the past year?
COUNTRY YES NO DK/NA Total general 14.5% 82.5% 3.0% ARGENTINA 25.1% 72.1% 2.8% AUSTRALIA 15.4% 83.3% 1.3% BRAZIL 24.1% 73.6% 2.3% CANADA 15.3% 83.2% 1.5% CHILE 31.4% 62.3% 6.2% CHINA 14.9% 82.0% 3.1% CROATIA 19.6% 78.0% 2.4% DENMARK 7.3% 88.7% 4.1% FINLAND 15.3% 83.0% 1.7% FRANCE 11.7% 85.9% 2.4% GERMANY 8.1% 89.4% 2.5% GHANA 19.0% 75.6% 5.4% GREECE 23.4% 75.2% 1.4% HONG KONG 9.7% 87.3% 3.0% INDIA 29.2% 70.6% 0.2% INDONESIA 3.2% 93.8% 3.0% IRELAND 11.3% 85.0% 3.7% ITALY 2.4% 96.8% 0.8% JAPAN 12.9% 78.2% 8.9% LATVIA 15.6% 76.0% 8.4% LEBANON 7.4% 92.6% 0.0% MALAYSIA 15.6% 80.8% 3.6% MEXICO 34.2% 62.1% 3.7% MOROCCO 18.0% 78.0% 4.0% NETHERLANDS 7.5% 88.6% 3.9% PALESTINE 21.5% 69.4% 9.1% PARAGUAY 34.6% 64.3% 1.2% PERU 16.3% 81.5% 2.3% PHILIPPINES 5.8% 92.8% 1.4% POLAND -.- -.- -.- SLOVENIA 15.2% 81.8% 3.0% SOUTH AFRICA 30.3% 66.8% 2.9% SOUTH KOREA 4.3% 94.3% 1.4% SPAIN 12.7% 85.7% 1.6% SWEDEN 13.3% 83.6% 3.1% THAILAND 3.9% 91.1% 5.0% TURKEY 12.9% 86.6% 0.5% UK 8.7% 89.1% 2.3% USA 14.6% 82.5% 2.9% VIETNAM 3.1% 96.6% 0.2%

Table # 15: VIOLENCE (By Regions and Demographics)
Have you suffered from any kind of violence (either physical or psychological) in the past year?
YES NO DK/NA REGION Total general 14.5% 82.5% 3.0%
Africa 27.7% 68.8% 3.5% Americas 24.4% 72.5% 3.1% APAC 9.6% 87.5% 2.9% Europe 11.8% 85.3% 2.9% MENA 13.7% 82.2% 4.1%
G20 G20 14.5% 82.8% 2.7%
NO G20 14.5% 82.3% 3.3% BRICS BRICS 20.8% 77.0% 2.2%
NO BRICS 14.0% 82.9% 3.1% G7 G7 9.7% 87.1% 3.2%
NO G7 15.7% 81.4% 3.0% GENDER FEMALE 16.0% 81.0% 3.0%
MALE 12.9% 84.1% 3.0% AGE 0-34 17.9% 78.7% 3.4%
35-54 14.9% 81.9% 3.2% 55-+ 8.8% 89.1% 2.1% DK/NA 0.0% 77.2% 22.8%
EDUCATION NO EDUCATION/ONLY BASIC EDUCATION 13.5% 81.3% 5.2%
COMPLETED PRIMARY 12.6% 85.0% 2.5% COMPLETED SECONDARY SCHOOL 14.3% 82.8% 2.9% COMPLETED HIGH LEVEL EDUCATION 14.8% 82.6% 2.7% COMPLETED HIGHER LEVEL OF EDUCATION 15.9% 81.1% 3.0% REFUSED/DNK/DNA 23.0% 55.8% 21.2%
WORK WORKING FULL (INCLUDE SELF-EMPLOYED) 14.8% 82.4% 2.8%
WORKING PART-TIME 15.8% 80.8% 3.4% UNEMPLOYED 18.0% 78.4% 3.6% STUDENT 18.2% 78.0% 3.7% HOUSEWIFE 13.2% 83.9% 2.9% RETIRED/DISABLED 7.8% 90.7% 1.5% REFUSED/DNK/DNA 11.6% 75.0% 13.4%

Table # 16: SEXUAL HARRASMENT (By Country)
In the past year, would you say you’ve experienced sexual harassment?
COUNTRY YES NO DK/NA Total general 6.8% 91.1% 2.0% ARGENTINA 6.7% 92.2% 1.1% AUSTRALIA 10.8% 88.5% 0.7% BRAZIL 10.3% 86.2% 3.5% CANADA 9.5% 89.8% 0.8% CHILE 16.6% 80.8% 2.6% CHINA 8.8% 89.3% 1.9% CROATIA 4.6% 95.0% 0.4% DENMARK 4.3% 93.7% 2.0% FINLAND 6.8% 91.3% 1.8% FRANCE 4.4% 94.4% 1.2% GERMANY 4.5% 93.6% 1.9% GHANA 11.0% 83.6% 5.4% GREECE 6.3% 92.5% 1.2% HONG KONG 3.0% 92.3% 4.8% INDIA 13.2% 86.4% 0.4% INDONESIA 0.4% 97.6% 2.0% IRELAND 10.5% 86.1% 3.3% ITALY 0.2% 99.4% 0.4% JAPAN 5.4% 88.6% 6.0% LATVIA 3.5% 94.1% 2.4% LEBANON 0.8% 99.2% 0.0% MALAYSIA 10.1% 88.0% 2.0% MEXICO 19.9% 76.9% 3.1% MOROCCO 11.8% 82.0% 6.2% NETHERLANDS 3.4% 94.0% 2.6% PALESTINE -.- -.- -.- PARAGUAY 15.9% 83.1% 1.0% PERU 6.9% 90.2% 2.9% PHILIPPINES 2.1% 96.9% 1.1% POLAND -.- -.- -.- SLOVENIA 1.4% 97.9% 0.7% SOUTH AFRICA 11.7% 87.3% 1.0% SOUTH KOREA 1.9% 96.7% 1.4% SPAIN 7.1% 91.8% 1.1% SWEDEN 7.9% 89.5% 2.6% THAILAND 0.4% 94.8% 4.8% TURKEY 9.1% 90.1% 0.7% UK 6.9% 90.7% 2.4% USA 11.4% 86.5% 2.1% VIETNAM 0.8% 99.0% 0.2%

Table # 17: SEXUAL HARRASMENT (By Regions and Demographics)
In the past year, would you say you’ve experienced sexual harassment?
YES NO DK/NA REGION
Total general 6.8% 91.1% 2.0% Africa 11.5% 86.5% 2.0% Americas 12.1% 85.7% 2.2% APAC 4.6% 93.1% 2.3% Europe 5.8% 92.3% 1.9% MENA 0.8% 99.2% 0.0%
G20
G20 6.9% 91.3% 1.8% NO G20 6.8% 91.0% 2.2%
BRICS
BRICS 10.3% 87.8% 1.9% NO BRICS 6.6% 91.4% 2.1%
G7
G7 5.3% 92.5% 2.2% NO G7 7.2% 90.8% 2.0%
GENDER
FEMALE 9.6% 88.2% 2.2% MALE 4.0% 94.2% 1.8%
AGE
0-34 10.7% 86.9% 2.5% 35-54 6.3% 91.5% 2.2% 55-+ 2.3% 96.5% 1.2% DK/NA 0.0% 100.0% 0.0%
EDUCATION
NO EDUCATION/ONLY BASIC EDUCATION 7.3% 90.1% 2.5% COMPLETED PRIMARY 3.9% 94.2% 1.9% COMPLETED SECONDARY SCHOOL 6.5% 91.4% 2.0% COMPLETED HIGH LEVEL EDUCATION 7.8% 90.3% 1.9% COMPLETED HIGHER LEVEL OF EDUCATION 7.8% 90.5% 1.7% REFUSED/DNK/DNA 10.7% 74.4% 15.0%
WORK
WORKING FULL (INCLUDE SELF-EMPLOYED) 6.6% 91.6% 1.8% WORKING PART-TIME 7.9% 89.3% 2.8% UNEMPLOYED 8.0% 89.9% 2.0% STUDENT 13.6% 83.7% 2.7% HOUSEWIFE 5.8% 91.7% 2.5% RETIRED/DISABLED 2.3% 97.0% 0.6% REFUSED/DNK/DNA 5.9% 84.2% 10.0%

Methodology Sheet
Country Company Name Methodology Sample Coverage Field Dates
1 ARGENTINA Voices! Research & Consultancy CATI 520 National December 6th -
December 18th 2018
2 AUSTRALIA Bastion Latitude CAWI 715 National November 20th - 2nd
December 2018
3 BRAZIL Market Analysis CAWI 500 National November 30th - December 06th 2018
4 CANADA Leger 360 CAWI 500 National November 10th - November 19th 2018
5 CHILE Activa Research CAWI 1032 National November 7th – November 11th 2018
6 CHINA Wisdom Asia CAWI 1000 National/Urban November 14th - November 21st 2018
7 CROATIA Mediana CAWI 508 National November 6th –
November 8th 2018
8 DENMARK DMA Research A/S CAWI 500 National October 17th –
October 22nd 2018
9 FINLAND Taloustutkimus Oy CAWI 500 National October 16th –
October 22nd 2018
10 FRANCE BVA CAWI 1000 National November 23rd –November 29th 2018
11 GERMANY Produkt + Markt CAWI 1000 National October 23rd – November 6th 2018
12 GHANA Candino Global CAPI 500 Urban November 20th – December 3rd 2018
13 GREECE Alternative Research Solutions CAWI 500 National October 26th -
November 4th, 2018
14 HONG KONG CSG (Consumer Search Group) CAWI 505 National October 28th -
November 21st 2018
15 INDIA DataPrompt International CAWI 500 National November 19th –
November 25th 2018
16 INDONESIA PT Deka Citra International CAPI 1040 Urban November 14th –
November 25th 2018
17 IRELAND RED C Research and Marketing Ltd CAWI 1000 National November 22nd –
November 27th 2018
18 ITALY DOXA CAPI 1039 National October 15th – October 30th 2018
19 JAPAN NRC (Nippon Research Center) CAWI 1000 National November 15th –
November 20th 2018
20 LATVIA Research centre SKDS CAWI 1005 National October 24th – October 31st 2018
21 LEBANON REACH SAL CATI 500 National October 12th – November 10th 2018
22 MALAYSIA Compass Insights Sdn Bhd CAWI 517 Urban November 1st –
December 6th 2018
23 MEXICO Brand Investigation S.A de C.V (Brain) CAWI 500 Urban November 23rd -
December 3rd 2018
24 MOROCCO Top Level Mena 501 November - December 2018

25 NETHERLANDS Motivaction International CAWI 500 National December 2018
26 PALESTINE Palestinian Center for Public Opinion (PCPO) TAPI 417 Urban/Rural November 22nd -
December 2nd 2018
27 PARAGUAY ICA Consultoría Estratégica CAWI 500 National December 7th -
December 14th 2018
28 PERU DATUM Internacional CAPI 1009 National November 9th – November 14th 2018
29 PHILIPPINES PSRC (Philippines Survey & Research Center Inc.)
PAPI 1000 National November 6th – November 20th 2018
30 POLAND MARECO POLSKA CAWI 500 National October 11th – October 20th 2018
31 SLOVENIA Mediana CAWI 505 National November 6th – November 8th 2018
32 SOUTH AFRICA Freshly Ground Insights (FGI) CAWI 1700 Urban October 23rd –
November 29th 2018
33 SOUTH KOREA Gallup Korea PAPI 1500 National November 7th – November 30th 2018
34 SPAIN Instituto DYM CAWI 1010 National November 6th – November 14th 2018
35 SWEDEN Origo Group CAWI 1000 National November 15th – November 25th 2018
36 THAILAND Infosearch co.ltd Face to Face 600 National November 5th – November 30th 2018
37 TURKEY Barem CATI 1000 National November 1st – November 28th 2018
38 UK ORB International (Opinion Research Business)
CAWI 1001 National December 7th - December 10th 2018
39 USA Leger CAWI 500 National November 10th - November 19th 2018
40 VIETNAM Indochina Research Face to Face 600 Urban November 5th – November 23rd 2018