willingness to pay for public ecotourism services in malaysia · pdf filewillingness to pay...
TRANSCRIPT

32
WILLINGNESS TO PAY FOR PUBLIC ECOTOURISM SERVICES IN MALAYSIA
Hun Shuang Ding and Anuar Alias
Centre for Studies of Urban and Regional Real Estate (SURE)
Faculty of Built Environment University of Malaya
Corresponding E-mail : [email protected]; [email protected]
Abstract
The main focus of this study is to determine the attributes of willingness-to-pay (WTP) of the general public towards the entrance fee for using services in the Public Ecotourism Organization. Contingent Valuation Method is used to estimate the value of non-market good by adopting WTP approach. WTP is the maximum amount consumers are prepared to pay for a good or service and to enjoy recreational facilities. It measures whether an individual is willing to forego their income in order to obtain more goods and better services, and WTP is typically used for non-market goods. This study adopted questionnaires survey to examine the perception on the willingness to pay by visitors for the fees charged by the authorities for the services they provided. 100 local and international respondents among visitors involved in the study. The findings showed that National Park can give a new experience to visitors with beautiful natural landscape. However, the respondents perceived that road linkages of National Park are not proper and fee charged for boat services a bit too high. While, National Zoo is visited mostly to spend time and holiday with family due to attractive wildlife shows available daily. The authority however, needs to improve on hygienic aspect and perhaps to lower down the entrance fees. The attractiveness and shortcoming of the National Park and National Zoo are identified in order to suggest for improvements of services to public. As the economic growth, people will demand for better services and facilities or else willingness to pay will be affected. Thus, it is important for the government organizations to upgrade their services and facilities over time to fulfill the needs of the people. Keywords: Contingent Valuation, Willingness to Pay, Public Ecotourism Organization. 1.0 Introduction
With the emphasis on ecotourism vacation recently, more people started to involve on outdoor recreation activities. The increasing rate of public involvement in outdoor recreational activities is due to the realization that outdoor recreation can give us a real benefit to both, physically and psychologically. Based on this phenomenon, it is important for the public ecotourism organizations to improve themselves so that the services and facilities they provided fulfill the need of the visitors.
The main objective of public ecotourism organizations is to achieve a satisfactory level of visiting experiences and social welfare to public. When an organization is provided services and imposed an entrance fees, the satisfactory level of the user are very important. As for this research, the main issue investigates is to determine the level of satisfaction among visitors to the public ecotourism organization. Public ecotourism organization provided not only recreational services, but they also have to make sure that the tourism industry is sustainable and able to bring good image to the country.

33
2.0 Research Objectives and Methodology This study mainly focusing on the willingness to pay towards services and facilities provided
by public ecotourism organizations. The specific objectives of the research are; to understand the concept of Willingness to Pay (WTP) and its relevancy to the Public Ecotourism Organizations; to determine the motivation factors that affect WTP for services provided by the Public Ecotourism Organizations, and to identify the attractiveness and shortcoming of the Public Ecotourism Organizations in promoting tourism sector.
This research applies quantitative by questionnaire survey and qualitative methods by adopting case study approach to proof the above objectives. Two organizations have been chosen as a case study i.e National Zoo and National Park. Willingness-to-Pay (WTP) technique is used to quantify the level of charges that willing to be paid by users for facilities provided by the both organizations.
There are challenges to value non-market goods such as public amenities because they basically do not have market value. The existing methods, often applied to public amenities provided by government organization, include travel-cost models, hedonic regressions of property values and contingent valuation surveys in which people are asked directly their willingness to pay for public amenities (Amiran, 2002; Clark, 2003; Davis, 1998). Contingent valuation is a survey based approach, in which individuals are asked to give their opinion on the maximum amount that they willing to pay in order to utilize the public amenities (Amiran, 2002; Hanemann, 1994). Clark (2003) explains that the evaluation of willingness to pay among visitor is based on their experience and expectation of services that public ecotourism organization should render. 3.0 Brief Literature Review
According to The International Ecotourism Society (TIES) in 1990, Ecotourism is a kind of environmentally responsible travel to natural areas that conserves the environment and improves the well-being of local people. Which means while enjoying the travel, tourists may as well help the local people and play a role in preserve and conserve the natural resource and environment. In order to make ecotourism a success and useful concept; conservation, local people and economic well-being must be merged together. There are several principles that have been widely used in all around the world to manage ecotourism projects. The ecotourism is being embraces as a tool for sustainable development in developing countries. The principles of ecotourism include: • Minimizing impact of tourism on the local area; • Building environmental and cultural awareness and respect; • Provide positive experiences for both visitors and hosts; • Provide direct financial benefits for conservation; • To provide financial benefits and empowerment for local people;
In addition, there are various perspectives to explain the definition of ecotourism. Malaysia
has adopted the definition by the World Conservation Union (IUCN), which state that: “… Environmentally responsible travel to relatively undisturbed natural areas in order to enjoy and appreciate nature (and any other accompanying cultural features). One that promotes conservation, one that has low visitor impact and one that provides for beneficially active socioeconomic involvement of local population.. ”
Based on the definition above, ecotourism in Malaysia are simply includes: 1) Environmentally friendly 2) To relatively undisturbed the natural areas 3) In order to enjoy and appreciate nature 4) That promotes conservation

34
5) Has low visitors impact 6) Provides for beneficially active socio-economic involvement of local population
Malaysian Government is very much committed to the concept of sustainability, which highly
related to ecotourism. The National Ecotourism Plan which has been prepared by the Ministry of Culture, Arts and Tourism in 1997, consists of 25 guidelines which are monitoring by various ministries and departments. Figure 1 shows some important ministries and departments which are engaged in the planning, maintaining, and controlling ecotourism running in Malaysia. In this research, the ecotourism organization that studied is a public ecotourism organization.
Figure 1: The Departments Related to Ecotourism
Contingent Valuation is a method of estimating the value that a person places on a good. The approach asks people directly and report their willingness to pay (WTP) to obtain a specified good, or willingness to accept (WTA) to give up a good, rather than inferring them from observed behaviors in regular market places. Contingent valuation has been successfully used for commodities that are not exchanged in regular markets, or when it is difficult to observe market transactions under desired conditions. (Rahmation, 2005)
Per-Olov (1995) stated that although it is certainly possible to employ contingent valuation for commodities available for sale in regular marketplaces, many applications of the method deal with public goods such as improvements in water or air quality, amenities such as national parks, and private non-market commodities such as reductions in the risk of death, days of illness avoided or days spent hunting or fishing.
Resource economists and consumer advocates need reliable and valid information about the
amount of money people are willing to pay for goods and services that are produced by alternative investment opportunities in the public domain. This information is required to estimate the economic benefits and costs of the alternatives, to evaluate policies that affect the environment, and to determine economic compensation for environmental damage. (Edward, 1996) One procedure in particular, the contingent valuation method, has come into increased use as a tool for placing ringgit values on goods and services not exchanged in the marketplace. This method employs survey research techniques to ask a representative sample of people about the economic value they would pay for non-market goods

35
or services. This type of non-markets good and services often related to the natural resources and recreational services.
The logic of the contingent valuation method implies that respondents assess the value of a given leisure activity or services by examining its costs and benefits, their interest in the activity, and so forth, and that they then assign a ringgit amount that corresponds to the activity's estimated value. But that might be some difference between 2 individual that might be same in age group, gender and income level, but different in interest. And due to this difference, the perception on ringgit amount paid will be different (Amiran, 2002; Clark, 2003; Davis, 1998).
One of the major criticisms in CVM was measurement bias (Clark, 2003). Measurement bias results from poorly measuring the outcomes or mis-represent of something. It occurs when information collected for use as a study variable is inaccurate. Therefore, measurement bias has been classified into 3 types: i. Incentive to mis-represent - measurement bias in this category is actually a form of strategic
behavior bias or compliance bias. Compliance bias often occurs either by the interviewer or researcher.
ii. Implied Value Cue - a significant effort is often required of respondents in a contingent valuation survey because of the length and complexity of the scenario and the need to give a value for the good.
iii. Scenario Misspecification - the researcher conducting a contingent valuation survey faces the task of obtaining relevant preferences from the respondent. Misspecification occurs when the respondents incorrectly perceive one or more aspects of the contingent market and the good to be values from the standpoint of theory or policy. Misspecification may be theoretical or methodological, depending on the source from which it arises.
Figure 2: Criticisms of Contingent Valuation Method
A measure of WTP can be conceptualized as the intention to pay a certain amount of money for engaging in a leisure activity or for attaining any other public good (Ajzen & Peterson, 1988). Thus, it becomes possible to apply theories of behavioral intentions as a basis for explaining WTP responses. As in the original theory of reasoned action, a central element in the theory of planned behavior is the individual's intention to perform a given behavior. In this study, the intention of interest is the person's WTP for a public good (Green, 1998). In general, the more favorable the attitude and the subjective norm with respect to a behavior and the greater the perceived behavioral control, the stronger an individual's intention to perform the behavior under deliberation. A considerable body of literature exists on WTP for various types of outdoor recreation facilities. Most research on and experience of entrance fees comes from the United States, where federal recreation fees have been applied since the early 20th century (Sharpley & Sharpley, 1997). It should be noted that studies on WTP vary greatly in their context and the comparability is therefore limited in many

36
cases. Many studies on outdoor recreation mention ‘user fees’ in a general sense (i.e. they may include fees for facilities as well as services).
A natural attraction with free access is a non-market good. However, it is possible to assess its value to consumers in monetary terms. One way of doing this is to measure the consumers’ WTP for the good, should a market exist for that good. In the same context as in a market situation, WTP for a non-market good is based on the assumptions of rational choice and utility maximization. If a change occurs in a non-market good (for example environmental improvement) by which the person believes he or she is better off in some way, that person may wish to pay some money in order to secure this change, and so the WTP reflects a person’s economic valuation of the good in question (Hanley, Shogren, & White, 1997). Traditional economic theory predicts that the higher the price of a good, the fewer the numbers of people are willing to pay it. Although it might be wrong due to personal predilection, but it is so true that if fewer people visit an attraction after an entrance fee is introduced, this contravenes the purpose of most national parks and protected areas to promote public access and, ironically, may even reduce potential revenue as fewer people will pay the entrance fees. It is therefore of prime importance to consider the likely effect of an entrance fee on visitor numbers. Some studies have found that demand is relatively receptive to price (Richer & Christensen, 1999). Differences in people’s willingness to pay may be influenced by certain demographic and psychographic factors. Therefore, it is important to consider these factors when implementing a potential fee policy, as entrance fees may have significant equity consequences. In this study, factors that will take into consideration when determine the willingness to pay included income level, attitude (behavioral experience), nationalities, gender, distance, age and educational level. 4.0 Analysis and Findings
National Park or Taman Negara is suitable place for travelers who love wild life viewing, jungle trekking, hiking, rock climbing, fishing, camping and many more. It is well established as one of the most popular ecotourism in Malaysia. Every year Taman Negara attracts thousands of local and international travelers. It has various types of activities which suit every age group and lifestyle. The questionnaires for National Park are distributed by direct hand-over and email. The survey was conducted at the entrance of Kuala Tembeling Jetty in March, 2014. A total number of 60 questionnaires have been distributed and answered by the respondents.
Whereas, National Zoo Malaysia is a non-governmental organization fully owned, managed and operated by the Malaysian Zoological Society (MZS). Although the zoo was officially named ‘Zoo Negara’ (National Zoo), it was known as the ‘Zoo in the Jungle’ due to its forested surrounding. As the largest zoo in Malaysia, the national zoo houses some 5,000 animals from over 400 species including birds, fish, mammals and reptiles. The respondents for this section are focused on people who visit the National Zoo on surveying period in March and April, 2014. The survey produced 100 copies of answered questionnaires.
According to the survey, majority of the respondents who visit National Park are male, 80% of the visitors are Malaysian and only 20% of the visitors are international visitors. This phenomenon is understood due rough and challenges activities offers by the National Park. According to the manager, there are international visitors visiting the national park for a few time especially during winter break for overseas country. Most of the respondent are from middle age group and are high income group. As for National Zoo, the respondents are about the same category as National Park. The only difference between them was that majority of the visitors to National Zoo are middle income group. The Table 1 below shows the summary of respondents’ profile.

37
Table 1
Characteristics
Taman Negara National Park National Zoo Malaysia Number of Respondent
(N=60)
Percentage (%) Number of Respondent
(N=100)
Percentage (%)
Gender Male 41 68.3% 56 56% Female 19 31.7% 44 44% Nationality Malaysian 48 80% 84 84% International 12 20% 16 16% Marital Status Single 31 51.7% 51 51% Married/ Partner 21 35.0% 41 41% Prefer not to say 8 13.3% 8 8% Age <18 0 0% 0 0% 18 - 25 17 28.3% 39 39% 26 – 35 10 16.7% 33 33% 36 – 45 18 30.0% 19 19% 46 – 55 13 21.7% 8 8% > 55 2 3.3% 1 1% Monthly Gross Income <RM2,500 14 23.3% 35 35% RM2,501 – RM3,500 8 13.3% 6 6% RM3,501 – RM4,500 3 5.0% 6 6% RM4,501 – RM5,500 1 1.7% 7 7% RM5,501 – RM6,500 5 8.3% 18 18% RM6,501 – RM7,500 7 11.7% 11 11% >RM7,500 22 36.7% 17 17%
4.1 Characteristic of Participations and Evaluation of WTP
4.1.1 Taman Negara National Park
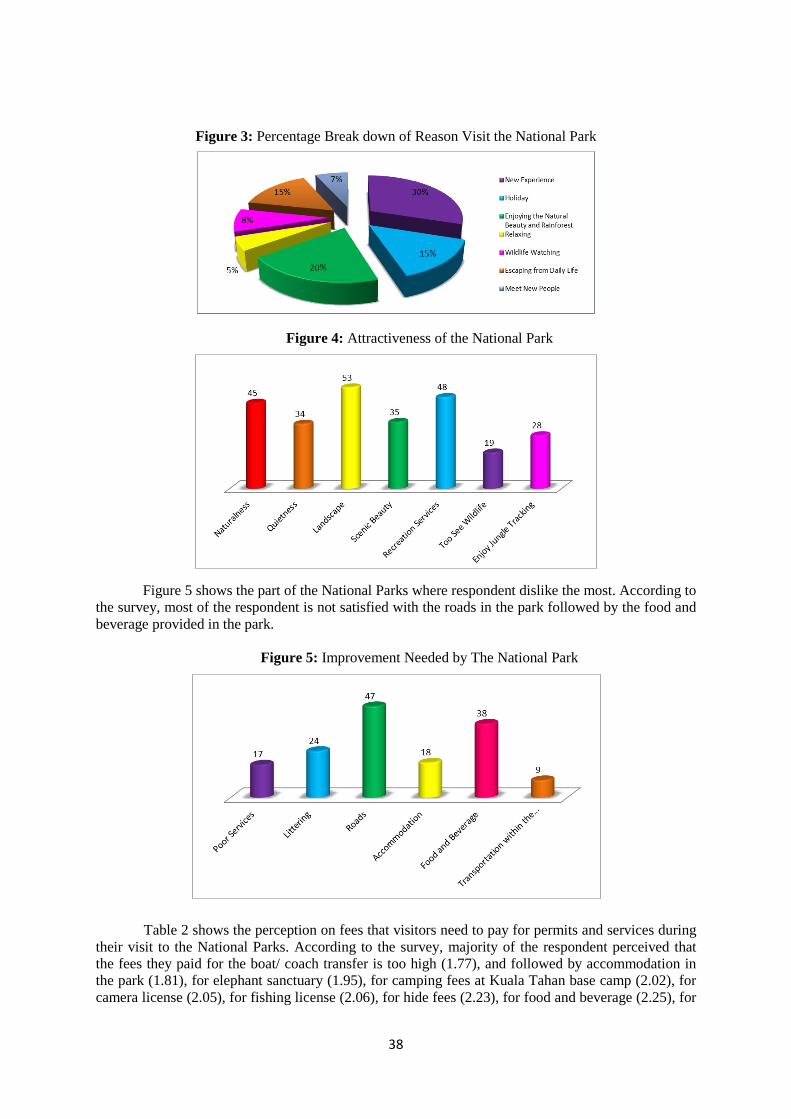
According to Figure 3, 30% of the respondents claim that the reason they visit the National Park is to experience a different way of lifestyle. By visiting to the National Park, they can escape from their daily busy life and enjoying the natural beauty and rainforest. Perception of respondent was one of the important factors in determining the willingness to pay. What the respondent likes and dislikes for the National Park are able to indicate what is the attractiveness of the park and also the improvement needed to be done by the park. Figure 4 explained that respondents love the landscape in the park and recreational services provided by the park.
38
Figure 3: Percentage Break down of Reason Visit the National Park
Figure 4: Attractiveness of the National Park
Figure 5 shows the part of the National Parks where respondent dislike the most. According to the survey, most of the respondent is not satisfied with the roads in the park followed by the food and beverage provided in the park.
Figure 5: Improvement Needed by The National Park
Table 2 shows the perception on fees that visitors need to pay for permits and services during their visit to the National Parks. According to the survey, majority of the respondent perceived that the fees they paid for the boat/ coach transfer is too high (1.77), and followed by accommodation in the park (1.81), for elephant sanctuary (1.95), for camping fees at Kuala Tahan base camp (2.02), for camera license (2.05), for fishing license (2.06), for hide fees (2.23), for food and beverage (2.25), for

39
camping fees inside the park (2.28), for canopy walk entrance (2.55) and last but not least, for the entry permit to the park (2.70).
Table 2: Perception on Fees Paid for Permits and Services N Min Max Mean Standard
Deviation Boat/ Coach transfer 60 1.00 3.00 1.7667 0.6979 Entry Permit 60 2.00 3.00 2.7000 0.5420 Fishing License 60 1.00 3.00 2.0667 0.7997 Camera License 60 1.00 3.00 2.0500 0.7686 Accommodation 60 1.00 3.00 1.8167 0.6762 Hide fees 60 1.00 3.00 2.2333 0.6731 Camping Fees (K.Tahan Base Camp) 60 1.00 3.00 2.0167 0.5365 Camping Fees (Inside Park) 60 1.00 3.00 2.2833 0.6661 Food and Beverage 60 1.00 3.00 2.2500 0.8949 Canopy Walk Entrance 60 1.00 3.00 2.5500 0.7231 Elephant Sanctuary 60 1.00 3.00 1.9500 0.5017
Notes: Legend: 1= Too High, 2= No opinion, 3= Too Low
For overall perception as revealed by the Table 3, the respondents are satisfied with the
recreational services, guide and porters (3.85), followed by accommodation (3.72), the services provided (3.53), the fees paid (3.51) and lastly is for food and beverage (3.28). According to this survey, majority of the respondents are satisfied with their overall experience in the National Parks. Even though some of the respondent thinks that the fees charge is too high and the food serve is not up to standard, but they still satisfy with the facilities and enjoy the recreational services and scenery very much.
Table 3: Overall Perception
N Min Max Mean Standard Deviation
Fees Paid 60 2.00 5.00 3.5167 0.8535 Services Provided 60 2.00 4.00 3.5333 0.7241 Recreational Services 60 2.00 5.00 3.8500 1.0222 Food and Beverage 60 1.00 5.00 3.2833 0.8847 Guide and Porters 60 2.00 5.00 3.8500 0.8601 Accommodation 60 2.00 5.00 3.7167 0.7612
Notes: Legend: 1= very unsatisfied, 2= unsatisfied, 3= No comment, 4= satisfied, 5= very satisfied
4.1.2 National Zoo Malaysia
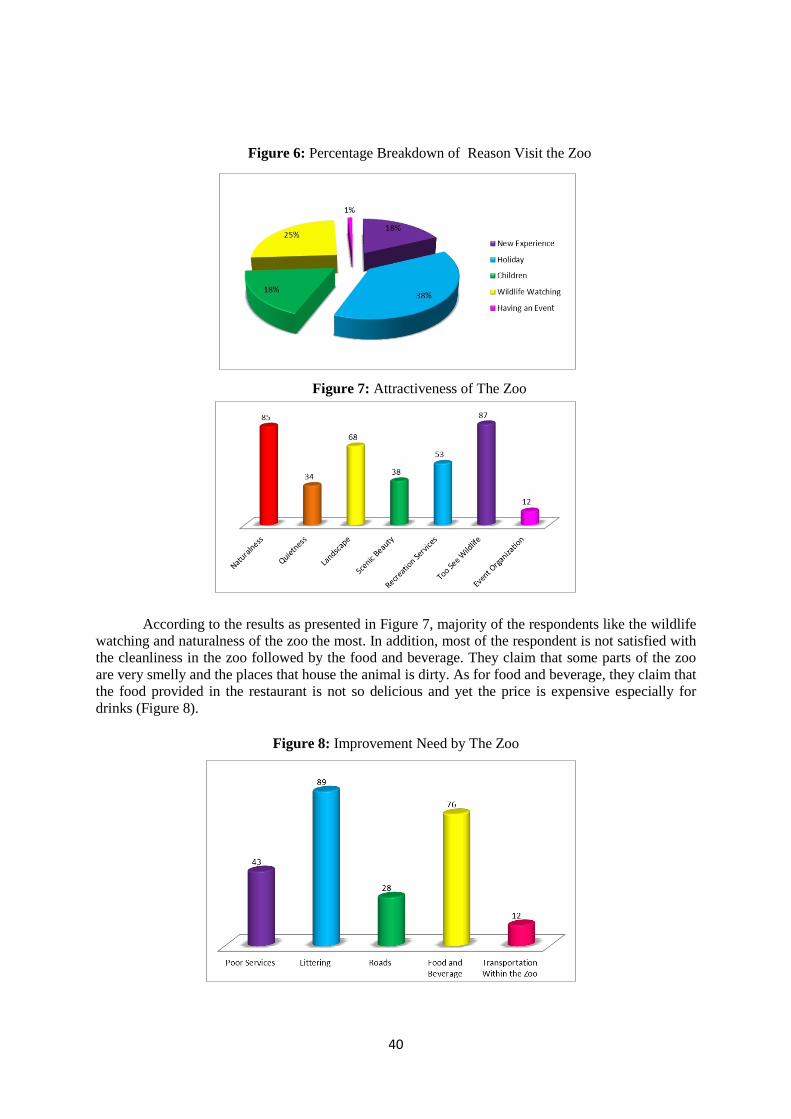
Figure 6 shows the reason that prompt the respondents to visit the National Zoo. Accordingly, 38% of the respondents claim that the reason they visit the zoo is because of holidays and about 25% of the respondents visit the zoo because of wildlife watching.
40
Figure 6: Percentage Breakdown of Reason Visit the Zoo
Figure 7: Attractiveness of The Zoo According to the results as presented in Figure 7, majority of the respondents like the wildlife
watching and naturalness of the zoo the most. In addition, most of the respondent is not satisfied with the cleanliness in the zoo followed by the food and beverage. They claim that some parts of the zoo are very smelly and the places that house the animal is dirty. As for food and beverage, they claim that the food provided in the restaurant is not so delicious and yet the price is expensive especially for drinks (Figure 8).
Figure 8: Improvement Need by The Zoo

41
Table 4: Perception on Fees Paid
N Min Max Mean Standard Deviation
For Entrance Fee with Insect Zoo and Butterfly Park
100 1.00 3.00 1.66 0.57243
For Entrance Fee without Insect Zoo and Butterfly Park
100 1.00 3.00 1.74 0.56174
For Tram Rides 100 1.00 3.00 2.02 0.55011 For Photo of Snap SHoot with Animals 100 1.00 3.00 1.57 0.57305
For Event and Party 100 1.00 3.00 1.81 0.50642 For Food and Beverage 100 1.00 3.00 1.47 0.52136 For Souvenir Kiosk 100 1.00 3.00 1.57 0.53664
Legend: 1= Too High, 2= No opinion, 3= Too Low Table 4 shows the perception on fees that visitors need to pay during their visit to the zoo.
According to the survey, majority of the respondent thinks that the fees they paid for the food and beverage is too high (1.47), and followed by photo of snap shoot with animals (1.57), for souvenir kiosk (1.57), for entrance fee with insect zoo and butterfly park (1.66), for entrance fee without insect zoo and butterfly park (1.74), for event and party (1.81) and lastly for tram rides (2.02).
Table 5 shows the overall perception of the respondents based on their experience when they
visit the zoo. Majority of the respondents are satisfied with their overall experience in the zoo. Even though some of the respondent thinks that the fees charge is too high, but they still satisfy with the facilities and wildlife watching very much.
Table 5: Overall Perception
N Min Max Mean Standard Deviation Overall Perception 100 1.00 5.00 3.46 0.90364
Notes: Legend: 1= very unsatisfied, 2= unsatisfied, 3= No comment, 4= satisfied, 5= very satisfied
Based on the analysis, a total number of 52 respondents said that they will visit the National
Park again. Their reasons are quite simple; they enjoy the beauty of the forest and can escape from daily busy lifestyle. The minority respondents who are not interested to visit the park again because they want to explore another place than can give similar experience. But they do say they will recommend friends and families to visit due to good experience the gained. As for National Zoo, a total number of 74 respondents said that they will visit the zoo again. However, they wanted to see some improvements will be made to the zoo and enjoy watching wildlife shows for again. The minority of respondents who claimed that they will not visiting the zoo again not because they are dissatisfied with the services and facilities, but they want to visit other places in other countries. Therefore, it is good to improve the services and facilities and this moves could attract more visitors in future.
Table 6: Visit the Place Again
Visit Again Taman Negara National Park National Zoo Malaysia Number of Respondent
Percentage (%) Number of Respondent
Percentage (%)
Yes 52 68.3% 74 74% No 8 31.7% 26 26%

42
5.0 Conclusion and Recommendation
The level of willingness to pay may difference as the respondents have different point of view and ability. According to the investigation done, the main motivation of willingness to pay toward National Park are rank as below: 1. To conserve and preserve this national park for future generations (46.7%) 2. Satisfaction in helping the National Park to progress (20.0%) 3. For better services and facilities (16.7%) 4. Pay entrance fee and to use the facilities (8.3%) 5. Responsibility for the local community (8.3%)
The main objective of National Park is to protect and conserve the flora and fauna in Taman Negara and to maintain the tropical rainforest ecosystem. This is an objective that prompts visitors to visit the National Park again and to view the scenery and recreational area in the park that cannot be found at any other places. Therefore, majority of the respondents are willing to pay more to help conserve and preserve the national park for future generations. As for National Zoo, the main motivations of willingness to pay are as below: 1. For better services and facilities (34%) 2. Satisfaction in helping the National Zoo to progress (27%) 3. Pay entrance fee and to use the facilities (26%) 4. Responsibility for the local community (13%)
Based on the survey conducted, many respondents wanted to see more improvements are proposed for the zoo. They witnessed that some of the places in the zoo are very smelly and dirty, the areas that housed the animals are not well maintained. Therefore, they strongly recommended that the zoo's authority should be proactive to overcome those problems. Table 7 below listed the attractiveness of National Park and National Zoo for the authorities to maintain and preserve. As the driving force of tourism in our country, the attractiveness of National Park and National Zoo in the visitors’ perception is very important. The attractiveness of a place assures its continuous viability, and the willingness to pay will be increased.
Table 7: Attractiveness of National Park and National Zoo Attractiveness
National Park National Zoo 1. Landscape 2. Recreation Services 3. Naturalness 4. Scenic Beauty 5. Quietness 6. Jungle Tracking 7. Wildlife
1. Wildlife shows 2. Naturalness 3. Landscape 4. Recreation Services 5. Scenic Beauty 6. Quietness 7. Event Organization
Attractiveness is important in attract people, but shortcoming is even important because, by
identify the shortcoming, the authority can improve their services to fulfill the satisfactory level of the visitors. In this study, the shortcoming of the National Park and National Zoo has been identified and presented in Table 8. There are many factors that may influence the willingness to pay among people such as gender, occupation, educational level, income level, nationality and etc. Thus, the findings of this research are more concerned about the visitors perception on fees paid, services provided, accommodation, food and beverage, recreational service and etc. By determine the visitors’ perception of willingness to pay, there is a clear indicator for the authority to react and what the visitors actually needed. Therefore, the first thing that they should do is to improve themselves based on the shortcoming rank by the visitors and at the same time maintain the attractiveness as well. Perception of visitors may change from time to time due to the changes of life style and standard of

43
living. As the economic growth, people will demand for better services and facilities or else their willingness to pay will getting lower and lower. Thus, it is important for the government organization to upgrade their services and facilities continuously.
Table 8 - Shorcoming of National Park and National Zoo Shortcoming
National Park National Zoo 1. Roads 2. Food and Beverage 3. Littering 4. Accommodation 5. Poor Services 6. Transportation within The Parks
1. Littering 2. Food and Beverage 3. Poor Services 4. Roads 5. Transportation within the Parks

44
References
Adams, R. M., Bergland, O., Musser, W. N., Johnson, S. L., & Musser, L. M. (1989). User fees and equity issues in public hunting expenditures: The case of ringnecked pheasant in Oregon. Land Economics, 65,(4), 376–385.
Amiran, G. (2002). Willingness to Pay (WTP). Paper presented at McMaster University, Hamilton, Ontario, Canada.
Carlsson, F., & Johansson-Stenman, O. (2000). Willingness to pay for improved air quality in Sweden. Applied Economics, 32, (6), 661–669.
Clark, T.N. (2003). Urban amenities: lakes, opera, and juice bars do they drive development? Research in Urban Policy. 9, 103-140.
Cindy, D., Hayden, G., and Goeldner, C. R. (1997). Ecotourism in Southeast Asia. Tourism Management, 18, (1), 51-57.
Cummings, R., S. Elliott, G. W. Harrison, and J. Murphy. (1997). “Are hypothetical referenda incentive compatible?” Journal of Political Economy 105, (3), 609–621.
Davis, D., & Tisdell, C. (1998). Tourist levies and willingness-to-pay for a whale shark experience. Tourism Economics, 5(2), 161–174.
Diamond, P. A., and J. A. Hausman. (1994). “Contingent valuation: is some number better than no number?” Journal of Economic Perspectives 8 (fall), 45–64.
Edward, E. (1996). The contingent valuation of environmental resources. Hartnolls Limited, Bodmin, Conrwall. Fedler, A. J., & Miles, A. F. (1989). Paying for backcountry recreation: Understanding the acceptability of use
fees. Journal of Park and Recreation Administration, 7, (2), 35–46. Feldman, A.M. (1980). Welfare economics and social choice theory. Kluwer Academic Publishers, Boston. Ferguson, M., Ali, K., Olfert, M.R., & Partridge, M. (2007). Voting with their feet: Jobs versus amenities.
Growth and Change, 38, 77-110. Florida, R. (2003). Cities and the creative class. Washington, DC: American Sociological Association Green D., Jacowitz K., McFadden D. and Kahneman D. (1998). Referendum contingent valuation, anchoring,
and willingness to pay for public goods. Resources and Energy Economics, 20 (2), 85-116. Hanemann, W. M. (1994). Willingness to Pay and Willingness to Accept: How much can they differ? The
economics of the environment. Cambridge University Press, pp. 471-483. Hausen, J. A. (1993). Contingent Valuation- A critical assessment. Elsevier Science Publisher, North Holland. John, B. (1986). Politics, economics & welfare. Times Roman by Paul Hicks Ltd., Middleton, Manchester. Kerr, G. N., & Manfredo, M. J. (1991). An attitudinal based model of pricing for recreational services. Journal
of Leisure Research, 23, (1), 37–50. Krannich, R. S., Eisenhauer, B. W., Field, D. R., Pratt, C., & Luloff, A. E. (1999). Implications of the National
Park Service recreation fee demonstration program for park operations and management: Perceptions of NPS managers. Journal of Park Recreation and Administration, 17, (3), 35–52.
Laarman, J. G., & Gregersen, H. M. (1996). Pricing policy in nature-based tourism. Tourism Management, 17, (4), 247–254.
Lindsey, G., Man, J., Payton, S., & Dickson, K. (2004). Property values, Recreation values, and urban greenways. Journal of Park and Recreation Administration Fall, 22 (3), 69-90.
Lindberg, K. (1991). Policies for maximising nature tourism’s ecological and economic benefits. World Resouces Institute, Washington.
Mitchell, R. C. and Carson, R. T. (1989). Using surveys to value public goods: the contingent valuation method. Resources for the Future, Washington.
O’ Doherty, R. K. (1996). Planning, People and Preference – A role for contingent valuation. Avebudy Ashgate Publishing Limited, England.
Palmer, C. (1999). Tourism and the Symbols of Identity. Tourism Management, 20, 313–321. Per-Olov, J. (1995). Valuation and Aggregation. Kluwer Academic Publisher, Netherlands. Rahmation, M. (2005). Contingent Valuation Method. California State University, Fullerton. Richer, J. R., & Christensen, N. A. (1999). Appropriate fees for wilderness day use: Pricing decisions for
recreation on public land. Journal of Leisure Research, 31, (3), 269–280. Roche, H. (1998.) The Willingness to Pay for a Mixed Public Good. Economic Department, Universidad de la
Republica, Uruguay. Schroeder, H. W., & Louviere, J. (1999). Stated choice models for predicting the impact of user fees at public
recreation sites. Journal of Leisure Research, 31, (3), 300–324. Throsby, C. D. and Withers, G. A. (1986). “Strategic Bias and Demand for Public Goods”, Journal of Public
Economics 31, 307–327.

45
Wittington, D. (1996). Administering contingent valuation surveys in developing countries. International Development Research Centre, Singapore. Environment Economics Program for Southern and Eastern Asia Special Paper.
Whittington, D. (1998). “Administering contingent valuation surveys in developing countries”. World Development, 26, 21–30.
Yeoman, J. (2001). Ecotourism and sustainable development. Who owns paradise? Tourism Management, 22, 203-212